Rubble Mound Breakwater: Run-Up, Reflection and Overtopping by Numerical 3D Simulation Fabio Dentale MEDUS (Maritime Engineering Division University of Salerno), Dept of Civil Engineering, University of Salerno, Salerno, Italy. CUGRI (University Consortium for Research on Major Hazards). Giovanna Donnarumma MEDUS (Maritime Engineering Division University of Salerno) , Dept of Civil Engineering, University of Salerno, Salerno, Italy. Eugenio Pugliese Carratelli MEDUS (Maritime Engineering Division University of Salerno), Dept of Civil Engineering, University of Salerno, Salerno, Italy. CUGRI (University Consortium for Research on Major Hazards. Summary From the numerical point of view, the complexity of the fluid dynamic processes involved has so far hindered the direct application of Navier-Stokes equations within the armour blocks, due to the complex geometry and the presence of strongly non stationary flows, free boundaries and turbulence. In the present work the most recent CFD technology is used to provide a new and more reliable approach to the design analysis of breakwaters, especially in connection with run-up and overtopping. The solid structure is simulated within the numerical domain by overlapping individual virtual elements to form the empty spaces delimited by the blocks. Thus, by defining a fine computational grid, an adequate number of nodes is located within the interstices and a complete solution of the full hydrodynamic equations is carried out. In the work presented here the numerical simulations are carried out by integrating the three-dimensional Reynolds Average Navier-Stokes Equations coupled with the RNG turbulence model and a Volume of Fluid Method used to handle the dynamics of the free surface. The aim is to investigate the reliability of this approach as a design tool. Therefore, for the results' validation, the numerical run-up and reflection effects on virtual breakwater (Armour in Accropode TM , toe protection and filter layer in stones) were compared with some empirical formulae and some similar laboratory tests. While for overtopping two different breakwaters are considered, real structures both located in Sicily: one a typical quarry stone breakwater, another a more complex design incorporating a spill basin and an armoured layer made up by CORE-LOC TM blocks. The results of this approach are good but, at present, this numerical approach can be used to support to the physical tests in a preliminary design phase in order to comparisons between several project solutions with significant minor cost. Introduction and Background Until recently physical tank models, and formulae derived from them, have been the only way to evaluate the effects of wave actions on breakwaters. In the last ten years, advances of Computational Fluid Dynamics (CFD) in free surface problems have lead to a decisive step forward, to the point that nowadays the design of any important coastal structure will necessarily include 2D or even 3D simulation of the flow around the structure, in place or in connection with laboratory experiments. The now standard practice involves the numerical integration of Reynolds Averaged Navier-Stokes (RANS/VOF) equations on a fixed grid, with one or more of the available turbulence models (K-ε, K-ω,
Transcript
Rubble Mound Breakwater: Run-Up, Reflection and Overtopping by Numerical 3D Simulation Fabio Dentale MEDUS (Maritime Engineering Division University of Salerno), Dept of Civil Engineering, University of Salerno, Salerno, Italy. CUGRI (University Consortium for Research on Major Hazards). Giovanna Donnarumma MEDUS (Maritime Engineering Division University of Salerno) , Dept of Civil Engineering, University of Salerno, Salerno, Italy.
Eugenio Pugliese Carratelli MEDUS (Maritime Engineering Division University of Salerno), Dept of Civil Engineering, University of Salerno, Salerno, Italy. CUGRI (University Consortium for Research on Major Hazards. Summary From the numerical point of view, the complexity of the fluid dynamic processes involved has so far hindered the direct application of Navier-Stokes equations within the armour blocks, due to the complex geometry and the presence of strongly non stationary flows, free boundaries and turbulence. In the present work the most recent CFD technology is used to provide a new and more reliable approach to the design analysis of breakwaters, especially in connection with run-up and overtopping. The solid structure is simulated within the numerical domain by overlapping individual virtual elements to form the empty spaces delimited by the blocks. Thus, by defining a fine computational grid, an adequate number of nodes is located within the interstices and a complete solution of the full hydrodynamic equations is carried out. In the work presented here the numerical simulations are carried out by integrating the three-dimensional Reynolds Average Navier-Stokes Equations coupled with the RNG turbulence model and a Volume of Fluid Method used to handle the dynamics of the free surface. The aim is to investigate the reliability of this approach as a design tool. Therefore, for the results' validation, the numerical run-up and reflection effects on virtual breakwater (Armour in AccropodeTM, toe protection and filter layer in stones) were compared with some empirical formulae and some similar laboratory tests. While for overtopping two different breakwaters are considered, real structures both located in Sicily: one a typical quarry stone breakwater, another a more complex design incorporating a spill basin and an armoured layer made up by CORE-LOCTM blocks. The results of this approach are good but, at present, this numerical approach can be used to support to the physical tests in a preliminary design phase in order to comparisons between several project solutions with significant minor cost.
Introduction and Background Until recently physical tank models, and formulae derived from them, have been the only way to evaluate the effects of wave actions on breakwaters. In the last ten years, advances of Computational Fluid Dynamics (CFD) in free surface problems have lead to a decisive step forward, to the point that nowadays the design of any important coastal structure will necessarily include 2D or even 3D simulation of the flow around the structure, in place or in connection with laboratory experiments. The now standard practice involves the numerical integration of Reynolds Averaged Navier-Stokes (RANS/VOF) equations on a fixed grid, with one or more of the available turbulence models (K-ε, K-ω,
RNG) and a free surface tracking procedure Method. These methods were developed most commonly used code is developed by Cornell University his coworkers e.g. (Losada et al., 2008)engineering importance. FLOW-3D® by Flow Science (Chopakatla et alMore recently FLUENT (Fang et al., 2010)used. Finally, in a few cases specially built codes have been appliedmethods are also being tested, Viccione at al The design of rock mound breakwaters opens an with the flow within the interstices of the rock mound: the complexity of the fluid dynamics involved, which features strongly non stationary flow, turbulence and air-water interaction, all the direct application of Navier-Stokes integrationby considering the rock mound as a porous body and takes iassuming that the flow within the rubble mound can be treated by the “porous media” approach, and therefore governed by the seepage flow equations (Darcy or Forcquadratic respectively). In practice, an additional term is added to the equations to reproduce the interactions between the fluid and the inner flow paths by using homogeneous coefficients for the entire filtration domain; in some instances, an acceleration term is alsoMorison-like behavior. Of course the relevant parameters have to be carefully calibrated with an ad hoc procedure on the basis of available experimental data. Hsu et al. (2002) later implemented in the COBRAS numerical code Only recently serious attempts have been made to model the detailed hydrodynamics of block mound structures on the basis of their real geometry by using ada fine computational grid, an adequate number of computational nodes is locatedso that a complete solution of the fulleffects and, possibly, resolving the turbulenceFlow Within the Armour Units (FWAU)Particle Hydrodynamics) was applied to approach, involving both CFD techniques themselves, is being attempted by The aim of the present work is to investigate the reliability of FWAUset of laboratory tests was specially carried out
Procedure As a first step to construct the digital models of the breakwaters, a virtual armour data base of various concrete blocks and stone shapes has been designed, from simple (Cube) to complex (AccropodeTM, CORE-LOCTM, Xblocdefault shapes.
Figure 1. Virtual 3D models of stones, Accropode
racking procedure - this latter generally based on the
developed by many authors. Analysis of the current method suggestmost commonly used code is COBRAS (COrnell BReaking waves And Structures)
(Liu & Al-Banaa, 2004). It was subsequently applied(Losada et al., 2008) who provided an extensive validation on many cases of
(Chopakatla et al., 2008; Li et al., 2004) has also (Fang et al., 2010), PHOENICS and OpenFOAM® have been also successfully
a few cases specially built codes have been applied. SPH and similar particleViccione at al. (2011) report some recent developments
The design of rock mound breakwaters opens an entirely new class of problems, as itwith the flow within the interstices of the rock mound: the complexity of the fluid dynamics involved,
s strongly non stationary flow, momentum advection, free boundary and possibly water interaction, all within a very complex geometry, has until recently hindered
Stokes integration. Current RANS/VOF practice deals with this problem by considering the rock mound as a porous body and takes into account the influence of porosity by assuming that the flow within the rubble mound can be treated by the “porous media” approach, and
epage flow equations (Darcy or Forchheimer, if the head loss is linear or ctively). In practice, an additional term is added to the equations to reproduce the
interactions between the fluid and the inner flow paths by using homogeneous coefficients for the some instances, an acceleration term is also introduced, leading to a
Of course the relevant parameters have to be carefully calibrated with an ad hoc procedure on the basis of available experimental data. Such an approach was first reported in
later implemented in the COBRAS numerical code, e.g. Losada et al.,
Only recently serious attempts have been made to model the detailed hydrodynamics of block mound structures on the basis of their real geometry by using advanced digital techniques
adequate number of computational nodes is locatedso that a complete solution of the full hydrodynamic equations is carried out including
nd, possibly, resolving the turbulence structure. Pioneering work with full simulation of the Flow Within the Armour Units (FWAU) work was carried out by using RANS-VOF
applied to this problem by Cuomo et al. (2007), while an entireltechniques in the interstices and numerical solid mechanics
is being attempted by Xiang et al.(2012).
he aim of the present work is to report a real life experience which has been used a benchof FWAU as a design tool and particularly in connection
set of laboratory tests was specially carried out to compare experimental with computed results.
As a first step to construct the digital models of the breakwaters, a virtual armour data base of various concrete blocks and stone shapes has been designed, from simple (Cube) to complex (
, Xbloc®) shapes. Only the natural stone blocks are taken from CAD
Virtual 3D models of stones, AccropodeTM and virtual model of breakwater
erally based on the Volume of Fluid
current method suggest that the BReaking waves And Structures), originally
applied by Losada and provided an extensive validation on many cases of
has also been widely tested. have been also successfully . SPH and similar particle
report some recent developments.
ly new class of problems, as it implies dealing with the flow within the interstices of the rock mound: the complexity of the fluid dynamics involved,
free boundary and possibly within a very complex geometry, has until recently hindered
practice deals with this problem nto account the influence of porosity by
assuming that the flow within the rubble mound can be treated by the “porous media” approach, and eimer, if the head loss is linear or
ctively). In practice, an additional term is added to the equations to reproduce the interactions between the fluid and the inner flow paths by using homogeneous coefficients for the
introduced, leading to a Of course the relevant parameters have to be carefully calibrated with an ad
approach was first reported in Losada et al., (2008).
Only recently serious attempts have been made to model the detailed hydrodynamics of block mound vanced digital techniques. Thus, by defining
adequate number of computational nodes is located within the interstices hydrodynamic equations is carried out including convective
work with full simulation of the VOF; SPH (Smoothed while an entirely new
solid mechanics in the block
which has been used a benchmark to in connection with overtopping. A
mental with computed results.
As a first step to construct the digital models of the breakwaters, a virtual armour data base of various concrete blocks and stone shapes has been designed, from simple (Cube) to complex (e.g.
) shapes. Only the natural stone blocks are taken from CAD
and virtual model of breakwater
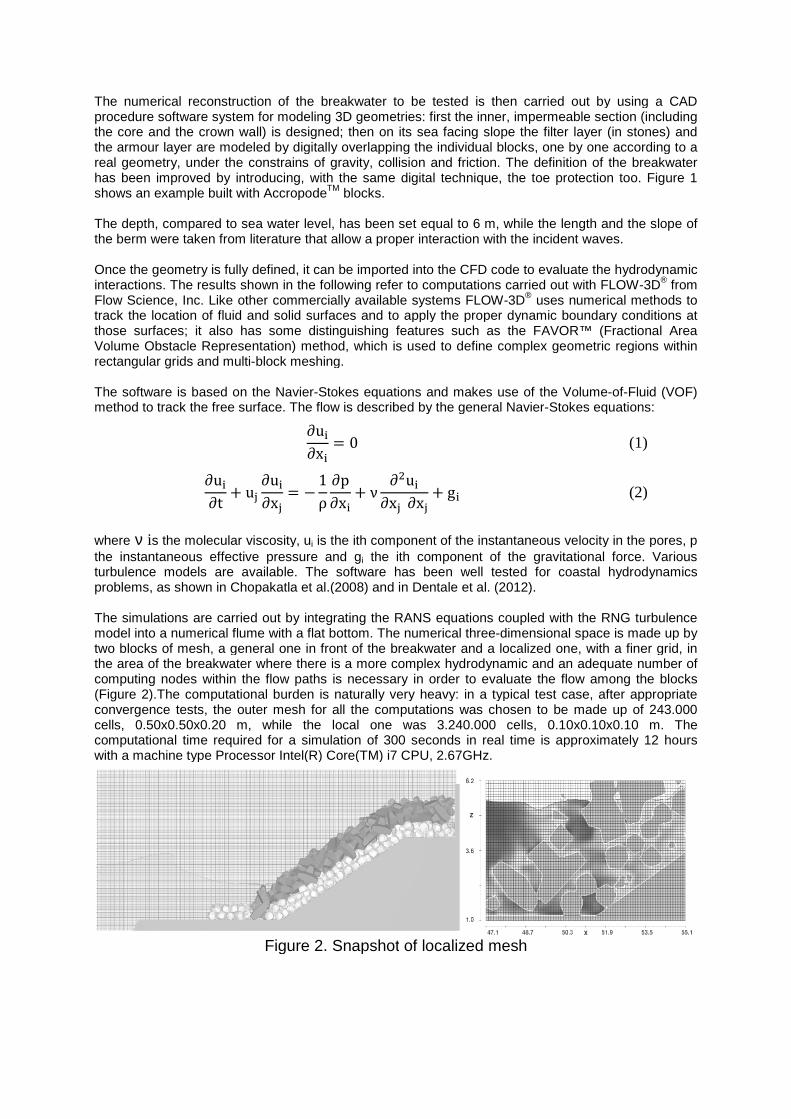
The numerical reconstruction of the breakwater to be tested is thenprocedure software system for modeling 3D geometries: first the inner, impermeable section (including the core and the crown wall) is designed; then on its sea facing slope the the armour layer are modeled by digitally overlapping the individual blocks, one by one according to a real geometry, under the constrains of gravity, collision and friction. The definition of the breakwater has been improved by introducing, with the same digital technique, theshows an example built with Accropode The depth, compared to sea water level, has been set equal to 6 mthe berm were taken from literature that allow a proper interaction with th Once the geometry is fully defined, it can be imported into the CFD code to evaluate the hydrodynamic interactions. The results shown in the following refer to computations carried out with FLOWFlow Science, Inc. Like other comtrack the location of fluid and solid surfaces and to apply the proper dynamic boundary conditions at those surfaces; it also has some distinguishing features suchVolume Obstacle Representation) method, which is used to define complex geometric regions within rectangular grids and multi-block meshing. The software is based on the Naviermethod to track the free surface. The flow is described by the general Navier
∂u�∂t � u�
∂u�∂x�
where ν is the molecular viscosity, uthe instantaneous effective pressure and gturbulence models are available.problems, as shown in Chopakatla et al.( The simulations are carried out by integrating the RANS equations coupled with the RNG turbulence model into a numerical flume with a flat bottom. The numerical threetwo blocks of mesh, a general one in front of the breakwater and a localized one, with a finer grid, in the area of the breakwater where there is a more complex hydrodynamic and an adequate number of computing nodes within the flow paths is necessary in orde(Figure 2).The computational burden is naturally very heavy: in a typical test case, after appropriate convergence tests, the outer mesh for all the computations was chosen to be macells, 0.50x0.50x0.20 m, while the local one was computational time required for with a machine type Processor Intel(R) Core(TM) i7 CPU, 2.67GHz.
Figure 2. Snapshot
The numerical reconstruction of the breakwater to be tested is then carried out by using a CAD procedure software system for modeling 3D geometries: first the inner, impermeable section (including the core and the crown wall) is designed; then on its sea facing slope the filter layer (in stones) and
odeled by digitally overlapping the individual blocks, one by one according to a real geometry, under the constrains of gravity, collision and friction. The definition of the breakwater
improved by introducing, with the same digital technique, the toe protectionshows an example built with AccropodeTM blocks.
The depth, compared to sea water level, has been set equal to 6 m, while the length and the slope of the berm were taken from literature that allow a proper interaction with the incident waves.
Once the geometry is fully defined, it can be imported into the CFD code to evaluate the hydrodynamic interactions. The results shown in the following refer to computations carried out with FLOWFlow Science, Inc. Like other commercially available systems FLOW-3D® uses numerical methods to track the location of fluid and solid surfaces and to apply the proper dynamic boundary conditions at those surfaces; it also has some distinguishing features such as the FAVOR™ (Fractional AreVolume Obstacle Representation) method, which is used to define complex geometric regions within
block meshing.
The software is based on the Navier-Stokes equations and makes use of the Volumehe free surface. The flow is described by the general Navier-Stokes equations:
∂u�∂x�
� 0
� 1ρ
∂p∂x�
� ν ∂�u�∂x� ∂x�
� g�
s the molecular viscosity, ui is the ith component of the instantaneous velocity in the pores, the instantaneous effective pressure and gi the ith component of the gravitational force. turbulence models are available. The software has been well tested for coastal hydrodynamics
Chopakatla et al.(2008) and in Dentale et al. (2012).
The simulations are carried out by integrating the RANS equations coupled with the RNG turbulence model into a numerical flume with a flat bottom. The numerical three-dimensional space is made up by
o blocks of mesh, a general one in front of the breakwater and a localized one, with a finer grid, in the area of the breakwater where there is a more complex hydrodynamic and an adequate number of computing nodes within the flow paths is necessary in order to evaluate the flow
The computational burden is naturally very heavy: in a typical test case, after appropriate convergence tests, the outer mesh for all the computations was chosen to be ma
m, while the local one was 3.240.000 cells, 0.10 a simulation of 300 seconds in real time is approximately 12 hours
with a machine type Processor Intel(R) Core(TM) i7 CPU, 2.67GHz.
Figure 2. Snapshot of localized mesh
carried out by using a CAD procedure software system for modeling 3D geometries: first the inner, impermeable section (including
filter layer (in stones) and odeled by digitally overlapping the individual blocks, one by one according to a
real geometry, under the constrains of gravity, collision and friction. The definition of the breakwater toe protection too. Figure 1
, while the length and the slope of e incident waves.
Once the geometry is fully defined, it can be imported into the CFD code to evaluate the hydrodynamic interactions. The results shown in the following refer to computations carried out with FLOW-3D® from
uses numerical methods to track the location of fluid and solid surfaces and to apply the proper dynamic boundary conditions at
as the FAVOR™ (Fractional Area Volume Obstacle Representation) method, which is used to define complex geometric regions within
Stokes equations and makes use of the Volume-of-Fluid (VOF) Stokes equations:
(1)
(2)
the instantaneous velocity in the pores, p the ith component of the gravitational force. Various
The software has been well tested for coastal hydrodynamics
The simulations are carried out by integrating the RANS equations coupled with the RNG turbulence dimensional space is made up by
o blocks of mesh, a general one in front of the breakwater and a localized one, with a finer grid, in the area of the breakwater where there is a more complex hydrodynamic and an adequate number of
flow among the blocks The computational burden is naturally very heavy: in a typical test case, after appropriate
convergence tests, the outer mesh for all the computations was chosen to be made up of 243.000 0x0.10x0.10 m. The
is approximately 12 hours
Tests and Validation The characteristics of the wave motion are shown in table 1. These characteristics are determined through the two probes method of separation of incident and reflected waves (Goda and Suzuki, 1976).
Table 1. Wave characteristics for the Kr validation
ID SIMULATION Regular waves ID SIMULATION Irregular waves
Reflection Analysis Wave reflection near a maritime structure has been studied for many years in order to define the parameters that most affect the phenomenon. Based on experimental tests, several equations have been defined, according to the geometrical characteristics of the structure and the waves, to quantify the reflection coefficient Kr defined as the ratio Kr = Hr/Hi between reflected (Hr) and incident (Hi) wave. A vertical impermeable structure will have a Kr of about 1, while a porous one will have a Kr<<1 . In order to validate the FWAU procedure described above comparisons were made between the values of Kr obtained through the application of some empirical formulae, e.g. Van der Meer (1992) and Zanuttigh & Van der Meer (2006), and the numerical ones obtained from the processing of simulation results. Four examples of correlations between equation and numerical Kr is shown in Figure 3, while all results is summarized in Table 2:
0.000
0.100
0.200
0.300
0.400
0.500
0.600
0.000 0.100 0.200 0.300 0.400 0.500 0.600
Nu
me
rica
l K
r
Formula Kr
Kr Hughes and Fowler Formula (1995) vs. Numerical Kr
(Regular waves)
0.000
0.100
0.200
0.300
0.400
0.500
0.600
0.000 0.100 0.200 0.300 0.400 0.500 0.600
Nu
me
rica
l K
r
Formula Kr
Kr Hughes and Fowler Formula (1995) vs. Numerical Kr
(Irregular waves)
Figure 3. Example of correlation between equation and numerical Kr
Table 2. Kr validation regular and irregular waves - AccropodeTM
AUTHOR FORMULA Mean Error Regular waves Irregular waves
Ahrens Seeling (1981) �� � 0.6��
6.6 + �� 1.08 1.19
Buerger et al. (1988)
�� = 0.6��
12 + �� 0.86 0.95
Postma (1989)
�� = 0.125�� 0.88 0.96
Van Der Meer (1992)
�� = 0.07����.�� + �� 0.91 1.00
Hughes & Fowler (1995)
�� = 11 + 7.1��.� 0.99 1.11
Zanuttigh & Van Der Meer
(2006) �� = !ℎ�0.12��.�#� 0.97 1.06
In the following, for extra confirmation of good results, a comparison is made between the numerical data and the experimental work proposed by Zanuttigh & Van der Meer (2006), where a substantial number of experimental tests carried out in a scale model or prototype. In particular, the results obtained through the FWAU model have been included in a diagram representing the results of about 6000 physical tests, to check whether the numerical tests were within the area relating to AccropodeTM. From Figure 4 it is clear that this condition is verified (Figure 4).
Figure 4. Example of Numerical Kr vs. physical data (Zanuttigh &Van der Meer,
2006)
0.000
0.100
0.200
0.300
0.400
0.500
0.600
0.000 0.100 0.200 0.300 0.400 0.500 0.600
Nu
me
rica
l K
r
Formula Kr
Kr Zanutthig and Van der Meer Formula (2006) vs.
Numerical Kr (Regular waves)
0.000
0.100
0.200
0.300
0.400
0.500
0.600
0.000 0.100 0.200 0.300 0.400 0.500 0.600
Nu
me
rica
l K
r
Formula Kr
Kr Zanuttigh and Van der Meer Formula (2006) vs.
Numerical Kr (Irregular waves)
Run-Up Analysis The evaluation of the wave motion's slope along the external face of the breakwater (run-up) has great importance in the design of marine works. This phenomenon heavily influences the choice of the design height, especially in order to limit overtopping events. In the following, a comparison is made between the run up value obtained by some equations in the literature (Aces, 1975), (Losada & Curto, 1981), and those obtained by the numerical tests carried out. The values of run up were measured according to the scheme shown in Figure 5b, through the snapshot of the central section of breakwater, with a frequency of 0.5 seconds (Figure 5a), and the value of the corresponding run up was measured. Particularly the runup measured is the distance between SWL and the highest point of contact with the breakwater (Dentale et al., 2013). For each simulation, then, 601 run up values have been measured. From the latter have been extracted the so called run-up statistics:
• Run up 2%: Average of the highest 2% of the numerical measured Run up values; • Run up 10%: Average of the highest 10% of the numerical measured Run up values; • Run up 1/3: Average of the highest third of the numerical measured Run up values; • Run up medium: Average of all numerical measured Run up values;
Figure 5a. Run up time series
evolution Figure 5b. Example of wave motion's frame
An example of correlation between equation and numerical run up is shown in Figure 6, while the results for all simulations were summarized in Table 3:
Figure 6. Correlations between empirical formulae of Table 3 and numerical run up
Table 3. Run up validation AUTHOR FORMULA Mean Error
Aces (1975)
$ � %& ' (�1 + )�* 1.01
Losada & Curto (1981)
$+% = ,-1 − ./0�−1��2 0.94
-1
-0.5
0
0.5
1
1.5
25 50 75 100 125 150 175 200 225 250 275 300
Ru
n u
p (
m)
Time (s)
Time series Run up
S.W.L.
Run up
x (m)
z (m
)
0.00
1.00
2.00
3.00
4.00
5.00
0.00 1.00 2.00 3.00 4.00 5.00
Nu
me
rica
l ru
n u
p (
m)
Formula run up (m)
Run up Aces Formula (1975) vs. Numerical Run up
0.00
1.00
2.00
3.00
4.00
5.00
0.00 1.00 2.00 3.00 4.00 5.00
Nu
me
rica
l ru
n u
p (
m)
Formula run up (m)
Run up Losada & Curto Formula (1981) vs. Numerical
Run up
As can be seen from the analysis of the parameter introduced, the numerical data yield a good fit with the formulae of Aces (1975) and Losada & Curto (1981).The above analysis indicates that the numerical model implemented quite correctly interprets the phenomenon studied.
Overtopping Analysis For a preliminary validation of the proposed methodology to analyze the overtopping phenomenon, two real breakwaters has been investigated. The first one is a composite breakwater, with a complex geometry including a spill basin and an armoured layer made up by CORE-LOCTM, is being designed for the protection of the industrial port in Gela (Sicily), as shown in Fig.7a (in the following this section will be referred to as "Gela”). As it can easily be seen, the presence of a spill basin makes the cross section entirely different from the standard shape taken as a reference for various empirical formulae (Cavani et al., 1999), (Cuomo et al., 2005). No experimental data is available on the overtopping, except for a single value deriving from model tests carried many years ago. The second one (in the following "Sant'Erasmo") is a more conventional large quarry stone breakwater designed for the new port of Sant’Erasmo (Sicily) and illustrated in Fig.7b, has been the object of extensive laboratory tests.
Figure 7a. Port of Gela: Cross section of rubble mound breakwater
Figure 7b. Port of Sant'Erasmo: Cross section of rubble mound breakwater
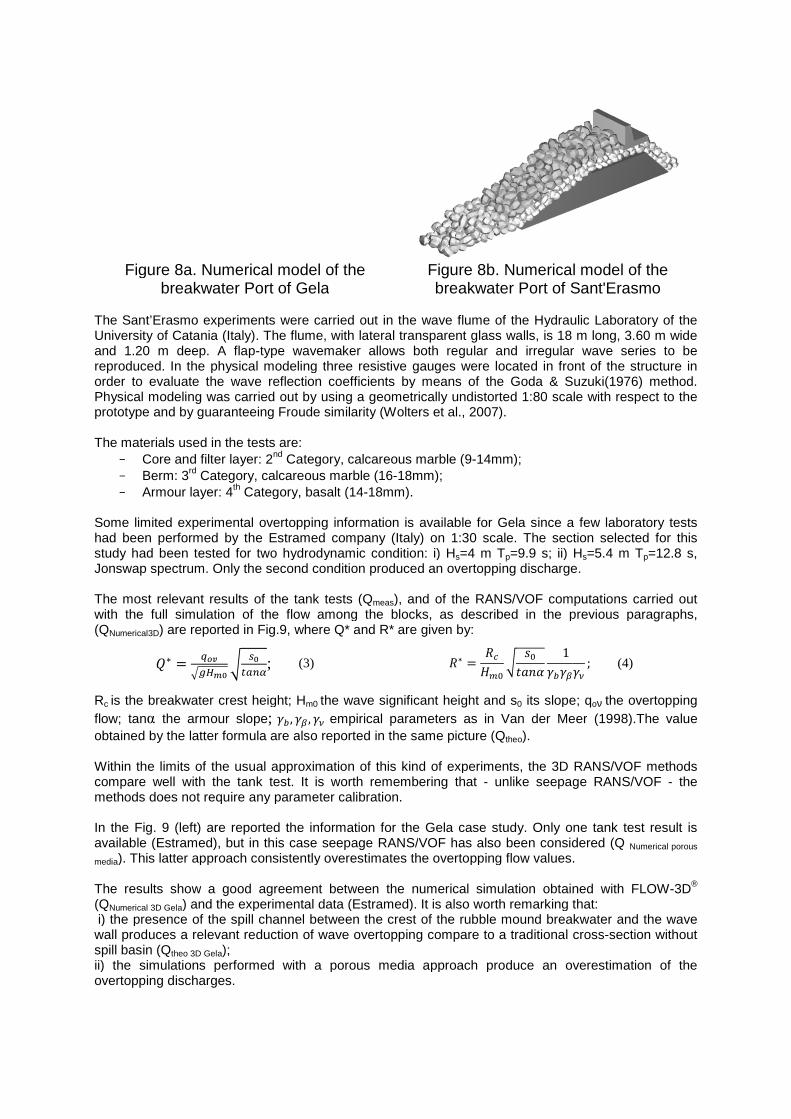
As for the run up and reflection coefficient, the simulations were carried out by integrating the Navier-Stokes equations in the complete form (3D), with a RNG turbulence model, and by using a computational grid with two “nested” meshes, the finer one being located in the breakwater area, where the flow has to be computed within the interstices and therefore the hydrodynamics is more complex. Fig. 8a and Fig. 8b show the numerical model of breakwater for Gela and Sant'Erasmo.
Figure 8a. Numerical model of the breakwater Port of Gela
The Sant’Erasmo experiments were carried out in the wave flume of the Hydraulic Laboratory of the University of Catania (Italy). The flume,and 1.20 m deep. A flap-type reproduced. In the physical modeling torder to evaluate the wave reflection coefficients by means of the Physical modeling was carried out by using a geometrically undistorted 1:80 scale with respect to the prototype and by guaranteeing Froude similarity The materials used in the tests are:
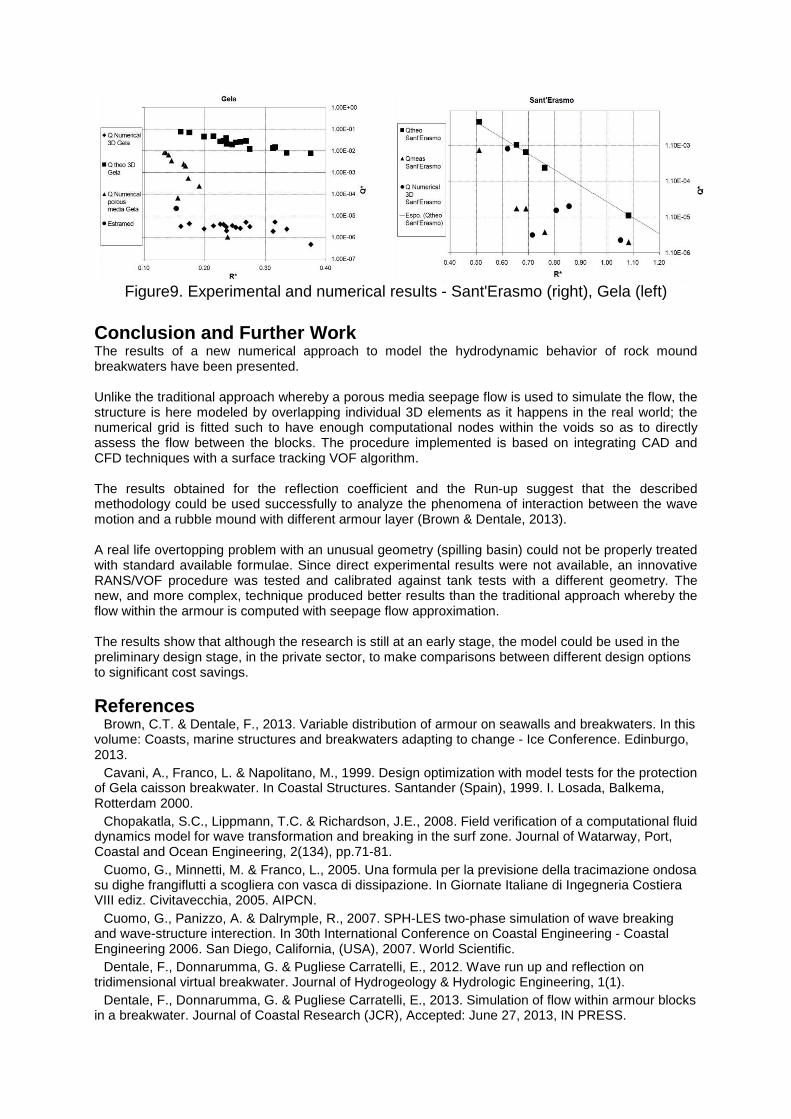
Some limited experimental overtohad been performed by the Estramedstudy had been tested for two hydrodynamic condition: i) HJonswap spectrum. Only the seco The most relevant results of the tank tests (Qwith the full simulation of the flow among the blocks, as described (QNumerical3D) are reported in Fig.9
3∗ � 56789:;< = ><
?@AB;
Rc is the breakwater crest heightflow; tanα the armour slope; CDobtained by the latter formula are a Within the limits of the usual approximation of this kind of experiments, the 3D RANS/VOF methods compare well with the tank test. It is worth remembering that methods does not require any parameter calibration In the Fig. 9 (left) are reported the information for the Gela case study. Only one tank test result is available (Estramed), but in this case seepage RANS/media). This latter approach consistently overes The results show a good agreement between the numerical simulation obtained with FLOW(QNumerical 3D Gela) and the experimental data (Estramed). It is also worth remarking that: i) the presence of the spill channwall produces a relevant reduction of wave overtopping compare to a traditional crossspill basin (Qtheo 3D Gela); ii) the simulations performed with a porous media approach overtopping discharges.
Figure 8a. Numerical model of the
breakwater Port of Gela Figure 8b. Numericabreakwater Port of Sant'Erasmo
The Sant’Erasmo experiments were carried out in the wave flume of the Hydraulic Laboratory of the The flume, with lateral transparent glass walls, is 18 m
wavemaker allows both regular and irregular wave series to be In the physical modeling three resistive gauges were located in front of the structure in
wave reflection coefficients by means of the Goda & Suzukicarried out by using a geometrically undistorted 1:80 scale with respect to the
prototype and by guaranteeing Froude similarity (Wolters et al., 2007).
used in the tests are: Category, calcareous marble (9-14mm);
overtopping information is available for Gela since a few tramed company (Italy) on 1:30 scale. The section selected for this
two hydrodynamic condition: i) Hs=4 m Tp=9.9 s; ii) H. Only the second condition produced an overtopping discharge.
The most relevant results of the tank tests (Qmeas), and of the RANS/VOF computations carried out with the full simulation of the flow among the blocks, as described in the previous par
9, where Q* and R* are given by:
(3) $∗ � $E%F�
= G� (HI
1CDCJ
crest height; Hm0 the wave significant height and s0 its slope
D , CJ , CL empirical parameters as in Van der Meerobtained by the latter formula are also reported in the same picture (Qtheo).
Within the limits of the usual approximation of this kind of experiments, the 3D RANS/VOF methods compare well with the tank test. It is worth remembering that - unlike seepage RANS/VOF methods does not require any parameter calibration.
In the Fig. 9 (left) are reported the information for the Gela case study. Only one tank test result is available (Estramed), but in this case seepage RANS/VOF has also been considered (Q
). This latter approach consistently overestimates the overtopping flow values.
The results show a good agreement between the numerical simulation obtained with FLOW) and the experimental data (Estramed). It is also worth remarking that:
i) the presence of the spill channel between the crest of the rubble mound breakwater and the wave wall produces a relevant reduction of wave overtopping compare to a traditional cross
ii) the simulations performed with a porous media approach produce an overestimation of the
l model of the
breakwater Port of Sant'Erasmo
The Sant’Erasmo experiments were carried out in the wave flume of the Hydraulic Laboratory of the is 18 m long, 3.60 m wide
allows both regular and irregular wave series to be in front of the structure in
Suzuki(1976) method. carried out by using a geometrically undistorted 1:80 scale with respect to the
a few laboratory tests . The section selected for this =9.9 s; ii) Hs=5.4 m Tp=12.8 s,
discharge.
), and of the RANS/VOF computations carried out in the previous paragraphs,
CL; (4)
slope; qoν the overtopping Van der Meer (1998).The value
Within the limits of the usual approximation of this kind of experiments, the 3D RANS/VOF methods unlike seepage RANS/VOF - the
In the Fig. 9 (left) are reported the information for the Gela case study. Only one tank test result is VOF has also been considered (Q Numerical porous
timates the overtopping flow values.
The results show a good agreement between the numerical simulation obtained with FLOW-3D® ) and the experimental data (Estramed). It is also worth remarking that:
el between the crest of the rubble mound breakwater and the wave wall produces a relevant reduction of wave overtopping compare to a traditional cross-section without
produce an overestimation of the
Figure9. Experimental and numerical results - Sant'Erasmo (right), Gela (left)
Conclusion and Further Work The results of a new numerical approach to model the hydrodynamic behavior of rock mound breakwaters have been presented. Unlike the traditional approach whereby a porous media seepage flow is used to simulate the flow, the structure is here modeled by overlapping individual 3D elements as it happens in the real world; the numerical grid is fitted such to have enough computational nodes within the voids so as to directly assess the flow between the blocks. The procedure implemented is based on integrating CAD and CFD techniques with a surface tracking VOF algorithm. The results obtained for the reflection coefficient and the Run-up suggest that the described methodology could be used successfully to analyze the phenomena of interaction between the wave motion and a rubble mound with different armour layer (Brown & Dentale, 2013). A real life overtopping problem with an unusual geometry (spilling basin) could not be properly treated with standard available formulae. Since direct experimental results were not available, an innovative RANS/VOF procedure was tested and calibrated against tank tests with a different geometry. The new, and more complex, technique produced better results than the traditional approach whereby the flow within the armour is computed with seepage flow approximation. The results show that although the research is still at an early stage, the model could be used in the preliminary design stage, in the private sector, to make comparisons between different design options to significant cost savings.
References Brown, C.T. & Dentale, F., 2013. Variable distribution of armour on seawalls and breakwaters. In this
volume: Coasts, marine structures and breakwaters adapting to change - Ice Conference. Edinburgo, 2013.
Cavani, A., Franco, L. & Napolitano, M., 1999. Design optimization with model tests for the protection of Gela caisson breakwater. In Coastal Structures. Santander (Spain), 1999. I. Losada, Balkema, Rotterdam 2000.
Chopakatla, S.C., Lippmann, T.C. & Richardson, J.E., 2008. Field verification of a computational fluid dynamics model for wave transformation and breaking in the surf zone. Journal of Watarway, Port, Coastal and Ocean Engineering, 2(134), pp.71-81.
Cuomo, G., Minnetti, M. & Franco, L., 2005. Una formula per la previsione della tracimazione ondosa su dighe frangiflutti a scogliera con vasca di dissipazione. In Giornate Italiane di Ingegneria Costiera VIII ediz. Civitavecchia, 2005. AIPCN.
Cuomo, G., Panizzo, A. & Dalrymple, R., 2007. SPH-LES two-phase simulation of wave breaking and wave-structure interection. In 30th International Conference on Coastal Engineering - Coastal Engineering 2006. San Diego, California, (USA), 2007. World Scientific.
Dentale, F., Donnarumma, G. & Pugliese Carratelli, E., 2012. Wave run up and reflection on tridimensional virtual breakwater. Journal of Hydrogeology & Hydrologic Engineering, 1(1).
Dentale, F., Donnarumma, G. & Pugliese Carratelli, E., 2013. Simulation of flow within armour blocks in a breakwater. Journal of Coastal Research (JCR), Accepted: June 27, 2013, IN PRESS.
Fang, Z., Cheng, L. & Zhang, N., 2010. Development of 3-D Numerical Wave Tank and Applications on Comb-Type Breakwater. In 29th International Conference on Ocean, Offshore and Artic Engineering (OMAE2010). Shangai, China, 2010.
Goda, Y. & Suzuki, Y., 1976. Estimation of incident and reflected waves in random wave experiments. In 15th International Conference on Coastal Engineering (ASCE). Honolulu, Hawaii, 1976.
Hsu, T.J., Sakakiyama, T. & Liu, P.L.F., 2002. A numerical model for wave motions and turbulence flows in front of a composite breakwater. Coastal Engineering, (46), pp.25-50.
Li, T., Troch, P. & De Rouck, J., 2004. Wave overtopping over a sea dike. Journal of Computational Physics, (198), pp.686-726.
Liu, P.L.F. & Al-Banaa, K., 2004. Solitary wave run up and force on vertical barrier. Journal of Fluid Mechanics, (505), pp.225-33.
Losada, I.J., Lara, J.L., Guanche, R. & Gonzalez Ondina, J.M., 2008. Numerical analysis of wave overtopping of rubble mound breakwaters. Coastal engineering, (55), pp.47-62.
Van der Meer, J.W., Tònjes, P. & de Waal, H., 1998. A code for dike height design and examination. In International Conference on Coastlines, Structures and Breakwater. Instituion of Civil Engineers, Thomas Telford, London, 1998.
Viccione, G., Bovolin, V. & Pugliese Carratelli, E., 2011. Short term variability of pressure distribution on vertical breakwaters using WCSPH. In 3rd ECCOMAS Thematic Conference on Computational Methods in Structural Dynamics and Earthquake Engineering (COMPDYN). Corfù, Greece, 2011.
Wolters G., van Gent, M., Allsop, W., Hamm, L. & Mühlestein, D., 2007. Guidelines for physical model testing of breakwaters: rubble mound breakwaters. HYDRALAB III EC contract no. 022441 (RII3),Deliverable NA3.1, 2007.
Xiang, J. et al., 2012. Simulation tools for numerical breakwater models including coupled fluidity/Y3d waves. In 33rd International Conference on Coastal Engineering (ICCE). Santander, Spain, 2012.
Zanuttigh, B. & Van der Meer, J.W., 2006. Wave reflection from coastal structures. In XXX International Conference on Coastal Engineering. San Diego (USA), 2006.