49
Rugged Fuel Cells: Clean power from dirty fuels Point Source Power

Rugged Fuel Cells:Clean power from dirty fuels
PointSourcePower

Team
2Copyright © 2013
Jon BachmanPhD Chemical Engineering2018
Ben BayatMBA 2014
Mike Lebow (Team Lead)MBA2014
James TinkerMDP2014
Ari van SchilfgaardeJD2015
Sibel LeblebiciPhD Materials Science2015
Cleantech to Market Team
Point Source Power Team
Craig JacobsonInventor, Co-Founder, CEO
Michael TuckerElectrochemical Technologies GroupLawrence Berkeley National Laboratory

The off-grid natural gas market is growing
3

The off-grid natural gas market is growing
4

The off-grid natural gas market is growing
5

The off-grid natural gas market is growing
6

The off-grid natural gas market is growing
7

The off-grid natural gas market is growing
8

The off-grid natural gas market is growing
9

The off-grid natural gas market is growing
10
Venting = $6B worldwide
Off-grid natural gas wells require venting

198
116
Switch to Natural Gas Renewables
Pneumatic venting results in harmful emissions
11Note: 1 car picture = 1M carsCopyright © 2013
Switch to Natural Gas Renewables
Cumulative Emissions Saved US, MMTCO2e, 2007-2011

Pneumatic venting results in harmful emissions
12Note: 1 car picture = 1M carsCopyright © 2013
Cumulative Emissions Saved US, MMTCO2e, 2007-2011
48
116
150
Switch to Natural Gas Renewables
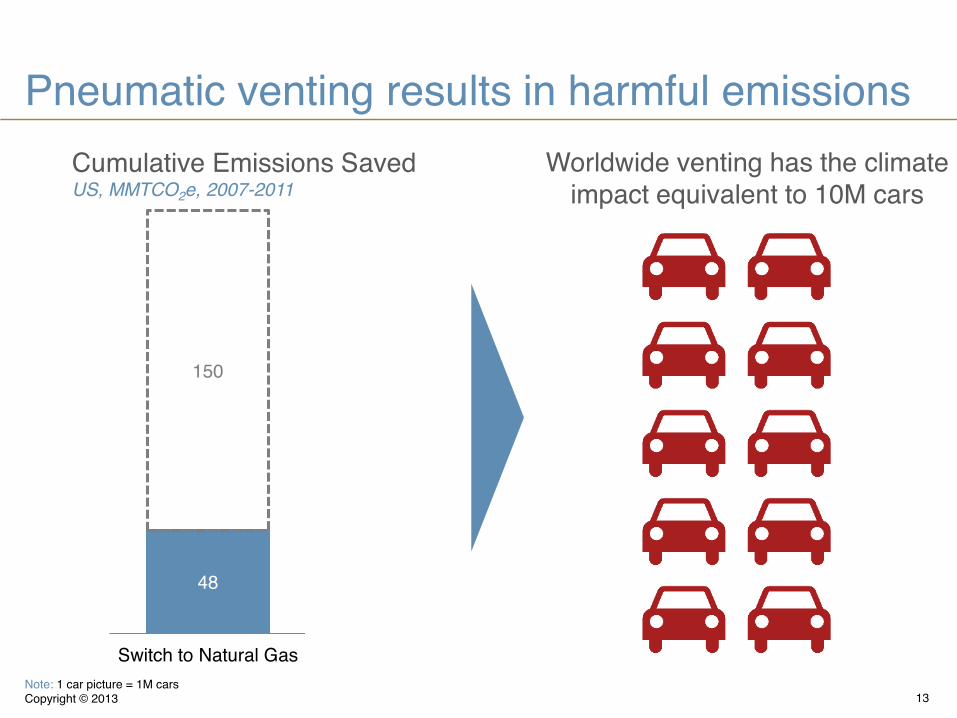
Pneumatic venting results in harmful emissions
13Note: 1 car picture = 1M carsCopyright © 2013
Cumulative Emissions Saved US, MMTCO2e, 2007-2011
Worldwide venting has the climate impact equivalent to 10M cars
48
116
150
Switch to Natural Gas Renewables

14Source:Copyright © 2013
Double Bottom Line:
PointSourcePower
10M cars off the road per year
$6B annual savings

15Source:Copyright © 2013
PointSourcePower
Clean power from dirty fuels

PSP fuel cells use heat and fuel to generate electricity
16Source: Point Source Power, C2M Team analysisCopyright © 2013
O2 (air)
H2, CO, or CH4
Electricity H2O + CO2
Anode
CathodeElectrolyte650 to 900°C
Metal Support
Metal Support

Anode
CathodeElectrolyte
PSP fuel cells are ideal for conditions at the well pad
17Source: Point Source Power, C2M Team analysisCopyright © 2013
Traditional Fuel Cell PSP Fuel Cell

Anode
CathodeElectrolyte
PSP fuel cells are ideal for conditions at the well pad
18Source: Point Source Power, C2M Team analysisCopyright © 2013
Flexible FuelLow MaintenanceDurableRapid Start-upInexpensiveSmall Scale20 Year Lifetime

PSP helps off-grid natural gas wells save money
19Copyright © 2013
Electronic valve control & data acquisition
Natural gas wells Oil wells
Limited applications
Co-producing wells
On-grid wells
Electronic valve control & data acquisition
Off-grid wells

PSP helps off-grid natural gas wells save money
20Copyright © 2013
Electronic valve control & data acquisition
Natural gas wells Oil wells
Limited applications
Co-producing wells
On-grid wells
Electronic valve control & data acquisition
Off-grid wells

21
PSP fuel cells are applicable at off-grid wells

PSP fuel cells are applicable at off-grid wells
22Source:Copyright © 2013

Valves are a major source of methane emissions at the well pad
$ CH4
Pneumatic Valves
Source: EPA, Inventory of U.S. greenhouse gas emissions and sinks: 1990-2011; EPA 430-R-001Copyright © 2013
($2,200)per well
Venting from pneumatic valves accounts for 52,560 scf/yr per device
11

Source: EPA, Inventory of U.S. greenhouse gas emissions and sinks: 1990-2011; EPA 430-R-001Copyright © 2013
Fuel cell power and electric controls provide significant advantages
Fuel Cell
Electric Valves
$1,700per well
Electric valves eliminates venting and only use 20% of previously lost gas
12

Source: EPA, Inventory of U.S. greenhouse gas emissions and sinks: 1990-2011; EPA 430-R-001Copyright © 2013
Fuel cell power and electric controls provide significant advantages
Fuel Cell
Electric Valves
$1,700per well
Electric valves eliminates venting and only use 20% of previously lost gas
12
Benefits of electric controls:• Eliminate natural gas venting• 27 month payback period• Remote visibility and control• Increased safety• Regulatory compliance

Current strategies to electrify wells are problematic
Natural Gas Generators Solar
Diesel GeneratorsDiesel Generators
Source: C2M team interviews and analysisCopyright © 2013 13

Current strategies to electrify wells are problematic
Natural Gas Generators Solar
Fuel too dirty Unreliable
power
Diesel GeneratorsDiesel Generators
Require fuel
delivery
Source: C2M team interviews and analysisCopyright © 2013 13

TechnologyCost Total Cost of
Ownership(20 years)
Payback Period (months)
Capital Operational
PSP Fuel Cell $2,250 $750 $17,250 27
Diesel Generator $950 $2,200 $44,950 Never
Natural Gas Generator and
Membrane$2,900 $1,000 $22,900 47
Solar Panels and Batteries $12,800 $2,160 $56,000 Never
PSP fuel cells have a cost advantage over competitors
28Copyright © 2013

PSP has a market opportunity of $880 million
29Copyright © 2013
AggressiveConservative
PSP
Mar
gin
Natural Gas Well Electrification Market RangeWorldwide, 2015, USD Millions
25% 50% 75% 100%
50% $147M $293M $440M $587M
75% $171M $343M $514M $685M
100% $196M $392M $587M $783M
125% $220M $440M $660M $880M
Amount of Market Captured
U.S. Gas WellsThousands, 2001-2020(e)
The US is responsible for 20% of world production
0
100
200
300
400
500
600
700
800
2001 2010 2020
Projection

EPA is tightening regulations to greenhouse gas emissions
30
Note: A gas well is defined by how much gas is produced compared to oil, and varies state by state. Source: EPA New Source Performance Standards (40 CFR Part 60 Subpart OOOO) (Oct. 15, 2012), President’s Climate Action PlanCopyright © 2013
20152013 2014
EPA publishes new emissions regulations for fracked gas wells
Ventingprohibited
Green completions required –flaring prohibited
Low bleed pneumatic controllers required upstream from processing plant.
Pneumatics banned?Extensive electronic leak monitoring required?
Confirmed regulations
Potential actions

PSP has three possible go-to-market channels
31Copyright © 2013
Benefits Strong influence& need
A few big players
Compelling value proposition
Drawbacks Fragmented market Limited motivation Limited influence
Exploration & Production
1 Contract Drilling
2Electric Valve Manufacturing
3
Maintain strategic flexibility while establishing a beachhead

PSP needs $5M to deploy a product in 3 years
32Copyright © 2013
201620152014
KeyActivities
Design 500 Wprototype
Test and refine in the field
Deploy full-scale products to beachhead
Funding Needed $1.5M $1.5M $2M
Time Required 12 months 9 months Determined by market
adoption rates
Phase 1 Phase 3Phase 2
Milestone to Achieve
Deploy 500 Wprototype in field
Start pilot manufacturing
Start manufacturingat scale

Deploying PSP fuel cells at off-grid well sites delivers a double bottom line
33:Copyright © 2013
10 million cars
$880 M
Market opportunity
Need Alignment Timing

Questions
34Source:Copyright © 2013
PointSourcePower
Clean power from dirty fuels

35Source:Copyright © 2013

Appendices
36Source:Copyright © 2013
PointSourcePower
Clean power from dirty fuels

Vented Gas Calculations
Source:Copyright © 2013
• 210.3 Bcf vented in US production sector annually1
• 20% of this is from pneumatic valves1
• The US accounts for 19.2% of world production2
• Price of NG at wellhead is $2.66 /1000 scf3
210,000,000,000 𝑠𝑐𝑓 ∗0.2 𝑓𝑟𝑜𝑚 𝑝𝑛𝑒𝑢𝑚𝑎𝑡𝑖𝑐𝑠
0.192 𝑓𝑟𝑜𝑚 𝑈𝑆 ∗$0.00266
𝑠𝑐𝑓 = $5.83𝐵
1US Environmental Protection Agency (EPA), Inventory of U.S. Greenhouse GasEmissions and Sinks: 1990-2011 (Environ Protec Agency, Washington, DC), 2013
2Central Intelligence Agency (CIA). The World Factbook. Natural Gas – production, 20133U.S. Energy Information Administration - EIA - Independent Statistics and Analysis. U.S.
Energy Information Administration (EIA), 2013

Market Size Calculations• $1,500 to produce fuel cell and all other components• 33,411 new pneumatics in the US per year1
• 19.2% of natural gas is produced in the US2
• 1 fuel cell per new pneumatic
𝑆𝑒𝑟𝑣𝑖𝑐𝑒𝑎𝑏𝑙𝑒 𝐴𝑐𝑐𝑒𝑠𝑠𝑖𝑏𝑙𝑒 𝑀𝑎𝑟𝑘𝑒𝑡 = 33,411 𝑛𝑒𝑤 𝑤𝑒𝑙𝑙𝑠 𝑖𝑛 𝑈𝑆 ∗
.∗ $1,500 ∗ 𝐹𝑟𝑎𝑐𝑡𝑖𝑜𝑛 𝑜𝑓 𝑀𝑎𝑟𝑘𝑒𝑡 ∗ (1 + 𝑚𝑎𝑟𝑔𝑖𝑛)
1US Environmental Protection Agency (EPA), Inventory of U.S. Greenhouse GasEmissions and Sinks: 1990-2011 (Environ Protec Agency, Washington, DC),
20132Central Inteligence Agency (CIA). The World Factbook. Natural Gas – production, 2013

Cost Competitor CalculationsCapital Costs:• At 50% margin, fuel sell cost to consumer = $2,250• 1 kW Diesel Generator = $9501
• 1 kW Gas Generator = $1,0002
• Membrane for CO2/CH4 separation = $1,9003
• 1 kW Solar Panels = $2,0004
• 72 kWh of batteries = $10,8005
Operational Costs:• Fuel cell replacements = 1/3 capital cost = $750/year• 0.28 L fuel burned per kWh in diesel generator6 * $1.05/L * 8760 h/yr =
$2,575/yr in fuel cost• $1,000/yr in membrane maintainance3
• Battery lifetime is 5 years5
Payback Period:• $2,168/well vented, 20% consumed in FC
1Honda Generators: Portable Generator Power for Home, Work, and Play. Honda.com2Inverter Generator with CMD Triple-Fuel System. Honda.com3Hybrid Membranes with Metal-Organic Frameworks for Carbon Dioxide Removal from Natural Gas, 2013 NSF SBIR 0074Amazon.com5Tesla.com6Cummins Power Generation : Model DGDB. Cumminspower.com

Car equivalent to pneumatic venting• Annual CO2 emissions from one vehicle: 5.1 metric tons CO2
– Source: “Greenhouse Gas Emissions from a Typical Passenger Vehicle” EPA “http://www.epa.gov/OTAQ/climate/documents/420f11041.pdf
• Table
– Source: EPA Report: “Inventory of U.S. Greenhouse Gas Emissions and Sinks: 1990–2011”
. . . . . Tg CO2eyrs × tons
Tg × car∙yr. tons = 1.7 million cars ~ 2 million cars in US
40Source:Copyright © 2013
Reduced carbon intensity“The carbon intensity of the electricity produced fell by 13 percent from 2007to 2012. Emissions would have been about 314 MMTCO2 higher if the carbon intensity of the electricity supply had not declined and this accounts for most of the reduction in the carbon intensity of the total energy supply.
– Of this reduction about 198 MMTCO2 is due mainly to the shift from coal to natural gas.
– The remainder (116 MMTCO2) is largely the result of a 9-percent increase in non-carbon generation (renewable and nuclear).”
• Source: http://www.eia.gov/environment/emissions/carbon/
41Source:Copyright © 2013

Natural gas can reduce US climate forcing emissions if venting can be reduced.
42Source: Climactic Change, EIACopyright © 2013
US Energy Mix and Corresponding Carbon Emissions 2005-2012, Tons and percentage
0%
10%
20%
30%
40%
50%
60%
70%
80%
90%
100%
4800
5000
5200
5400
5600
5800
6000
6200
2005 2006 2007 2008 2009 2010 2011 2012
Coal Emissions Natural Gas Other Carbon Emissions

Source: Allen, et. al “Measurements of methane emissions at natural gas production sites in the United States”, Proceedings of the National Academies of Science, (Sep 2013)Copyright © 2013
But leaks and accidental emissions are far larger than originally expected.
43
Unless leakage rates for new methane can be kept below 2%, substituting gas for coal is not an effective means for reducing the magnitude of future climate change.Wigley, T., “Coal to gas: the influence of methane leakage” Climactic Change, August 2011. Available at http://link.springer.com/content/pdf/10.1007%2Fs10584-011-0217-3.pdf
NOAA aerial monitoring of Denver-Julesberg and Uintah Basins indicates fugitive emissions equivalent to 4-9% of production. Pétron, G., et al. (2012), Hydrocarbon emissions characterization in the Colorado Front Range: A pilot study, J. Geophys. Res., 117.
Estimated Emissions Reductions from Pneumatics Controllers by Sector Tons per Year
310,678
165,333
44,284
520,507
639,341
Methane SavingsTotal Emissions
“Studies Find Methane Emissions in California and U.S. 1.5 Times Greater Than Expected”

½ in ID electronic valve, $1261 ½ in ID pneumatic valve, $1122
1Solenoid Valve, ½ in. NC, 120V, Brass. Granger.com2Honeywell ½ in. NPT Two-Way Unitary Valve ( 1.6 Cv ) Item# 32544
Model# VP531C1000. Honeywell.com
Electric and pneumatic controllers
44

45Source:Copyright © 2013
Market Assessment

46Source:Copyright © 2013
Market Assessment

There are a variety of possible applications for rugged fuel cells
47Source:Copyright © 2013
Camping
Emergency preparedness
Wood Stoves
Research stations
Communication towers
Landfills
Size (W)
Oil Wells
Agriculture Waste

Rugged fuel cells are ideal for co-producing oil wells
48Source:Copyright © 2013
Camping
Emergency preparedness
Wood Stoves
Research stations
Oil WellsCommunication towers
Agriculture Waste Landfills
Size (W)1
2

PSP’s customers are well services engineers
49Copyright © 2013


