25
Educational Mismatch and Mobility RUHR ECONOMIC PAPERS Christiane Roller Christian Rulff Michael M. Tamminga #798

Educational Mismatch and Mobility
RUHRECONOMIC PAPERS
Christiane Roller
Christian Rulff Michael M. Tamminga
#798

Imprint
Ruhr Economic Papers
Published by
RWI – Leibniz-Institut für Wirtschaftsforschung Hohenzollernstr. 1-3, 45128 Essen, Germany
Ruhr-Universität Bochum (RUB), Department of Economics Universitätsstr. 150, 44801 Bochum, Germany
Technische Universität Dortmund, Department of Economic and Social Sciences Vogelpothsweg 87, 44227 Dortmund, Germany
Universität Duisburg-Essen, Department of Economics Universitätsstr. 12, 45117 Essen, Germany
Editors
Prof. Dr. Thomas K. Bauer RUB, Department of Economics, Empirical Economics Phone: +49 (0) 234/3 22 83 41, e-mail: [email protected]
Prof. Dr. Wolfgang Leininger Technische Universität Dortmund, Department of Economic and Social Sciences Economics – Microeconomics Phone: +49 (0) 231/7 55-3297, e-mail: [email protected]
Prof. Dr. Volker Clausen University of Duisburg-Essen, Department of Economics International Economics Phone: +49 (0) 201/1 83-3655, e-mail: [email protected]
Prof. Dr. Roland Döhrn, Prof. Dr. Manuel Frondel, Prof. Dr. Jochen Kluve RWI, Phone: +49 (0) 201/81 49-213, e-mail: [email protected]
Editorial Office
Sabine Weiler RWI, Phone: +49 (0) 201/81 49-213, e-mail: [email protected]
Ruhr Economic Papers #798
Responsible Editor: Thomas Bauer
All rights reserved. Essen, Germany, 2019
ISSN 1864-4872 (online) – ISBN 978-3-86788-926-1
The working papers published in the series constitute work in progress circulated to stimulate discussion and critical comments. Views expressed represent exclusively the authors’ own opinions and do not necessarily reflect those of the editors.

Ruhr Economic Papers #798
Christiane Roller, Christian Rulff, and Michael M. Tamminga
Educational Mismatch and Mobility

Bibliografische Informationen der Deutschen Nationalbibliothek
The Deutsche Nationalbibliothek lists this publication in the Deutsche National bibliografie; detailed bibliographic data are available on the Internet at http://dnb.dnb.de
RWI is funded by the Federal Government and the federal state of North Rhine-Westphalia.
http://dx.doi.org/10.4419/86788926ISSN 1864-4872 (online)ISBN 978-3-86788-926-1
Christiane Roller, Christian Rulff, and Michael M. Tamminga1
Educational Mismatch and Mobility
AbstractWith increasing educational attainment in Germany, the issue of inefficient human capital allocation gains importance. Especially overeducation seems to be a problem, since more and more highly educated individuals are required to take jobs that do not match their educational level, settling for lower wages than their peers. This raises the question, how these individuals perform in these jobs and whether they have an advantage compared to their adequately educated colleagues performing the same job. The career mobility model suggests that this is indeed the case, with overeducated workers being more prone to take up on-the-job training, to climb up the career ladder, or to eventually leave to professions more suitable to their educational level. Our empirical analysis, using the German SOEP, confirms this theory for Germany. We find that overeducated workers have a significantly higher probability to take up on-the-job training than adequately educated workers and, at least in certain jobs, have a higher probability to move to jobs that better match their educational level. Furthermore, we find that overeducated workers experience higher wage growth than their colleagues in all job types.
JEL Classification: I26, J24, J31
Keywords: Education; educational mismatch; wages; job mobility; training
March 2019
1 Christiane Roller, RUB; Christian Rulff, RUB and RWI; Michael M. Tamminga, RUB and RWI. – The authors are grateful to Thomas Bauer, Julia Bredtmann, Sebastian Otten, and Stella Martin for helpful comments and suggestions. All remaining errors are our own. – All correspondence to: Christian Rulff, Ruhr University Bochum, Chair of Empirical Economics, Universitätsstr. 150, 44801 Bochum, Germany, e-mail: [email protected]
1 Introduction
Overeducation, the situation in which an employee works in a position with educationalrequirements below his or her formal qualification, is a common phenomenon in indus-trialized countries. Especially in Germany, with increasing educational attainment andsimultaneous high labor demand, the issue of overeducation is prevalent in the publicdiscussion as well as in the scientific community. Most frequently, the debate is focused onindividuals’ adverse labor market outcomes despite their high levels of education. Thefamous proverbial fate of graduates in the humanities being destined for a career as ataxi driver further highlights the awareness of the public when it comes to educationalmismatch. Meanwhile, its origins remain not yet finally explained.
The most common explanation on why overeducation occurs is provided by the careermobility theory first expressed by Sicherman and Galor (1990). According to this model,overeducation is the result of an individual decision to sacrifice higher wages in the shortterm for wage growth and upward job mobility through the acquisition of human capital onthe job. Given this hypothesis, overeducation should be transitory on the individual leveland result in overeducated employees exhibiting superior performance compared to theiradequately educated colleagues in the same job. Specifically, there should be observabledifferences in wage growth over time as well as upward labor market mobility. Empiricalanalyses have yielded mixed results for both effects.1
This paper aims to provide an empirical analysis of the career mobility model forGermany which avoids the two most prevalent problems in previous studies. First, weuse the most reliable measure for educational mismatch based on scientific consensus,namely the Job Analysis (JA) approach, avoiding the subjectivity issues of the Worker SelfAssessment (WA) approach, as well as the endogeneity issues accompanying the RealizedMatches (RM) approach. By using a recent classification scheme, we are able to rule outvariations in educational requirements within occupations over time, which might not bereflected in older job classifications. Second, by comparing overeducated individuals totheir adequately educated colleagues in the same job, rather than their educational peers,we avoid neglecting occupation-specific differences in upward mobility and wage growth.
Our analysis provides conclusive evidence for the career mobility theory in Germany.Overeducated individuals achieve significantly higher wage growth in all job types. Also,upward labor market mobility compared to their adequately educated colleagues is higher inthe category of skilled jobs. Additionally, our results confirm that overeducated individualschoose on-the-job training as a way to acquire human capital in order to move up thejob ladder. This is especially the case for employees in jobs at the lower end of the jobdistribution.
1See for example: Büchel and Mertens (2004), Rubb (2006), Korpi and Tahlin (2009), Grunau andPecoraro (2017), and Wen and Maani (2018).
1
The rest of the paper is organized as follows. After an overview of the underlyingtheories and a review of the relevant literature, we describe our empirical strategy and thedata we use in Section 3. Section 4 presents and interprets the estimation results. Weconclude the paper in Section 5.
2 Theory and Literature
Human capital theory is frequently consulted when wages of mismatched workers areanalyzed. Based on this theory, more (less) education than required for a particularjob should yield a return (penalty) which is equal to the return of the actual years ofschooling (Mincer (1974); Hartog and Oosterbeek (1988); Bauer (2002)). However, variousempirical studies contradict this implication and support the human capital compensationhypothesis, which is based on the premise that overeducated individuals compensate a lackof other human capital endowments by attaining more schooling than required for a givenjob, whereas underqualified employees feature strengths in other fields of human capital,substituting for lacking years of education (Rubb (2006); Korpi and Tahlin (2009)). Hence,when measuring the extent of mismatch solely on the basis of educational attainment, thewage effects found in various studies can be legitimized by the aforementioned compensatingmechanism. Consequently, according to the compensation hypothesis, observed educationalmismatches do not reflect actual mismatches but rather individual heterogeneity acrossworkers (Korpi and Tahlin (2009)).
Sicherman and Galor (1990) extend the human capital theory by assuming that anindividual’s stock of human capital is accumulated by educational attainment, whichincreases lifetime income in two different ways: on the one hand, there are the well-knownreturns to schooling itself. On the other hand, it is hypothesized that education raisesthe likelihood of occupational upward mobility. The intuition behind the career mobilitytheory is that temporary mismatches in the form of overeducation occur if an individualconsiders a job below his qualification as an investment opportunity to acquire skillsthrough, e.g., on-the-job training in order to promote future upward mobility and thusthe probability to receive higher wages in the future (Sicherman and Galor (1990); Rosen(1972)). Consequently, this theory allows inferring predictions for overeducated personsonly (Sicherman (1991)). Following the reasoning of the career mobility model, it can beassumed that overeducated persons predominantly work in jobs in which they expect a highprobability of being promoted and in which they have the possibility of receiving extensiveon-the-job training (Korpi and Tahlin (2009)). Hence, overqualified workers should exhibita higher likelihood of receiving on-the-job training than adequately qualified employees.In addition, the probability of observing upward occupational mobility – either in form ofoccupational upgrading or in form of wage growth – should be higher for overeducatedcompared to adequately educated workers.
2
In line with Robst (1995), we argue that the applicability of the career mobility theoryshould be tested by comparing mismatched with adequately educated individuals workingin jobs requiring the same level of formal qualification. Comparing a mismatched workerwith an adequately educated person with the same educational attainment may yieldresults reflecting differences in mobility across job requirement levels as in this constellation,the overqualified employee must work in a job that requires less schooling than that of theadequately qualified. Thus, comparing employees with different educational attainmentsworking within the same job requirement level eliminates the possibility that findingsreflect differences in mobility across occupations.
In studies in which overqualified workers are compared with their educational peers,the results of analyzing upward mobility are largely consistent with the predictions of thecareer mobility model, i.e., overeducated employees are more likely to experience upwardmobility either in form of job requirement increases or promotions (e.g., Hersch (1995);McMillen et al. (2007); Grunau and Pecoraro (2017)). However, the study by Büchel andMertens (2004) indicates the opposite; overeducated employees feature an occupationaldisadvantage in terms of a decreased probability to move upward compared to adequatelyeducated workers with the same level of qualification. Studies in which upward mobilitypatterns of overeducated are compared with those of adequately educated persons workingin the same job requirement level yield supportive evidence for an increased probability ofupward mobility for overqualified employees (e.g., Robst (1995); Groeneveld and Hartog(2004); Rubb (2006)). Though, in the study by Wen and Maani (2018), results indicate thatwithin occupations overeducation is associated with occupational disadvantages concerningupward mobility.
Regarding the alternative measure for upward mobility, literature reveals mixed evidenceregardless of whether it is controlled for the required or the actual level of education.While Grunau and Pecoraro (2017) reveal that wages of overeducated workers grow morethan that of their educational peers, at least if they engage in internal or external mobility,Büchel and Mertens (2004) show that wages of overeducated workers are less likely toincrease above the average wage compared to adequately educated workers with the sameeducational attainment. The study of McMillen et al. (2007) suggests that wage growth ofovereducated employees does not significantly deviate from that of adequately educatedpersons with the same amount of schooling. Likewise, Korpi and Tahlin (2009) find nosignificant difference between the returns to required and surplus education in terms ofwage growth, even though the reference group consists of adequately educated workerswithin the same job requirement. However, there are several other studies yielding supportfor an increased wage growth for overqualified employees when controlling for the requiredlevel of qualification (e.g., Groeneveld and Hartog (2004); Rubb (2006); Wen and Maani(2018)).
Concerning training measures, the economic literature does not provide conclusiveevidence as well. In line with the underlying theoretical model, the study of McMillen et al.
3
(2007) reveals that overeducated workers feature a higher probability to receive trainingthat is considered useful for future jobs compared to their educational peers. In otherstudies, it is shown that overeducated workers receive less on-the-job training and are lesslikely to acquire useful knowledge for promotion compared to adequately educated workerswith the same formal qualification (Büchel and Mertens (2004)) or within the same jobrequirement (Robst (1995)).
3 Empirical Strategy and Data
To test the career mobility hypothesis, we estimate two Probit and one OLS model. Themodels are of the form
yit = αOVit +X ′itθ +
∑γtTt +
∑δfBf +
∑λjKj + εit, (1)
which describes an individual i’s outcome in year t. The models differ with respect totheir dependent variable. One of the binary dependent variable measures skill acquisitionin the form of on-the-job training. A further outcome is job mobility which is defined as abinary dependent variable equal to unity, if an increase in the job requirement level asmeasured by the German Classification of Occupations (KldB 2010) can be observed. Wefurther analyze the effect educational mismatch has on wage growth by estimating themodel by OLS using real hourly wage growth (in %) from t− 1 to t as outcome of interest.
As outlined before, it is necessary to compare employees working in occupations withthe same required level of formal educational in order to eliminate the possibility thatthe obtained estimates reflect differences in average mobility or training in the differentjob requirement levels. Instead of controlling for the required level of qualification, weapply subsample regressions for each job requirement level. These categories are definedas follows.
In the category Unskilled/semi-skilled tasks, occupations which require no or onlylittle subject-specific knowledge are included. Thus, jobs are classified into this categoryif no vocational qualification, or just one year of vocational training is required. Thecategory Skilled tasks describes activities for which two or three years of vocationaltraining or a comparable qualification such as graduation from a vocational school isnecessary. The category Complex tasks contains activities for which specialized knowledgeis a prerequisite. Hence, occupations are assigned to this category if a bachelor’s degree,a completed master craftsmanship or technician’s training, an equivalent technical orgraduate degree is required. Highly complex tasks include jobs for which more than fouryears of tertiary education (i.e., a master’s degree, diploma, state examination, doctoraldegree, or postdoctoral qualification) are demanded.
By estimating subsample regressions for each of these four requirement levels, we areable to compare overeducated with adequately educated workers with less educational
4
attainment working in an occupation that requires the same level of formal qualification.2
The advantage of the applied approach over controlling for required qualification is thatit enables to identify labor market mobility of mismatched workers in more detail, i.e.,for each job requirement level separately. In some job requirement levels – by definition– individuals cannot be over- or underqualified. In the highest job requirement levelthere are no overqualified individuals, whereas in the lowest category of requirements, nounderqualified employees can be observed.
The binary explanatory variable of main interest is OVit. It is equal to one when anindividual is overqualified and zero otherwise. The respective coefficient is included in α.
The choice of covariates, which are equal in both the OLS and the Probit models,is based on comparable studies and their availability in the data. Besides individualcharacteristics, job-specific features are included as control variables in the vector Xit.The respective coefficients are incorporated in the vector θ. To account for a possiblenonlinear influence of age, the variable is incorporated in linear and quadratic form intothe models. The marital status is controlled for by including a binary variable that isequal to unity if the respondent is married and equal to zero otherwise. A dummy variablewhich is intended to control for the effect of children on mobility takes the value one ifthere are children younger than 16 years in the same household as the respondent, andzero otherwise. Gender-specific differences in labor market mobility, and migration statusare also captured by a dummy variable. Job-specific control variables refer to respondent’stime within the firm (linear and quadratic), his type of contract (permanent or temporary),whether he or she works full- or part-time, the number of employees in the firm, andhis or her earnings. As wage is assumed to be negatively correlated with labor marketmobility, we control for potential wage effects on labor market mobility by includingthe logarithmized gross hourly real wage. Furthermore, a binary variable being equal toone when an individual is underqualified and zero otherwise is controlled for in order tocompare the coefficient of the variable of interest with respect only to adequately educatedindividuals.
To control for time-specific differences in mobility, the vector Tt includes a full set ofbinary year indicators. The vector Bf contains a full set of federal state dummy variables.Differences in mobility within occupational areas, which are constant across time, federalstates, and individuals, are controlled for by including a full set of occupational maingroup indicators in the vector Km (defined by the ISCO standard).3
The data used in this study stems from the German Socio-Economic Panel (GSOEP)covering the period 2013 to 2016.4 In our analysis, we restrict the sample to full- andpart-time employed individuals aged between 18 and 65 years. Self-employed respondents,members of the armed forces, and individuals in education or with foreign vocational2This approach was applied by Bauer et al. (2018) to analyze the effect of underqualification on earnings.3In Table A1, all variables are listed.4Information on the KldB 2010 is included in the data starting in 2013. The wave from 2016 is the mostrecent wave available.
5
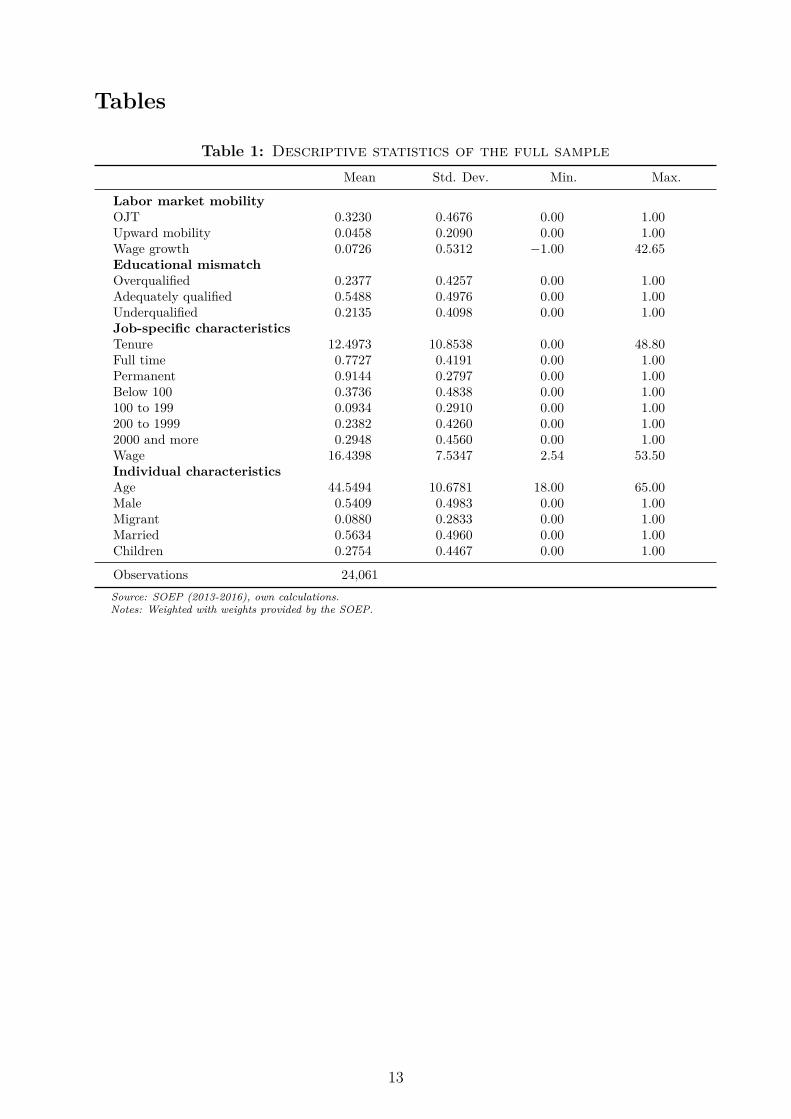
degrees are dropped from the sample.5 After applying these restrictions to the GSOEPdata, the remaining sample contains 24,061 person-year observations. To get a generalimpression of the sample used for the econometric analysis, descriptive statistics of allvariables in the full sample are provided in Table 1.
To construct an objective measure for defining mismatches, we make use of the KldB2010 issued by the Federal Employment Agency. Against the background of the dynamicdevelopment of job requirements due to the technological progress, it is indispensable thatthe JA definition of job requirements has to be updated frequently in order to remainreliable (Verhaest and Omey (2006)). By utilizing the latest classification scheme, i.e., theKldB 2010 – which has been adjusted to the developments in the German labor market,the potential unreliability of the JA measure which occurs when employing outdatedschemes is eliminated. The KldB 2010 contains four task-based vertical dimensions ofoccupations. The evaluation of the required qualification is closely aligned with formaldegrees due to the strict formal requirements in form of certificates as prerequisite formany occupations in Germany (Paulus et al. (2010)).
In order to classify a person as over-, under-, or adequately educated according to theJA method, the formal qualifications of the respondents are matched with the classificationof the KldB 2010.6 In Unskilled/semi-skilled tasks, employees are adequately educatedif they do not have a vocational degree independent of their school-leaving degree. Thisimplies that in this category the attained years of schooling can vary substantially since itcomprises persons with no school degree up to those who attained an upper secondarydegree. In consequence, individuals without a vocational degree cannot be classifiedas being overqualified. Those who have completed vocational training are adequatelyeducated if they work in an occupation in which Skilled tasks are performed. Unfortunately,the SOEP does not provide the possibility to distinguish between one, two, or three yearsof vocational training. Thus, it is not feasible to classify persons with only one year ofvocational training as adequately educated if they work in Unskilled/semi-skilled tasksas it should be done consistently with the classification of the Kldb 2010. Due to thisrestriction imposed by the data, it might be the case that persons with only one year ofvocational training working in occupations in which Skilled tasks are required are identifiedas adequately educated even though they have less education than actually requiredaccording to the KldB 2010 classification. This implies a potential underestimation ofthe incidence of undereducation. In the Complex tasks category, individuals’ educationalattainment corresponds to the required qualification if they have a bachelor’s degree or aqualification as master craftsman, technician or an equivalent college or technical schooldegree. The qualification of employees who have completed at least four years of tertiaryeducation complies with the requirements in the category Highly complex tasks.5To anticipate potential measurement issues, the top and bottom 0.5% of wage distribution are excludedfrom the analysis.6In Table A2, a detailed overview of the classification of degrees into the different levels of formalqualifications is provided.
6
Table 2 displays the shares of the formal qualification levels among the job requirementlevels. The entries on the main diagonal describe the share of adequately qualifiedindividuals. Entries below the main diagonal describe the shares of the underqualified,and the entries above those of the overqualified. As can be seen, especially for thosehaving no vocational training, the likelihood of working in an overqualified job is very high.Only 26% work in adequately qualified jobs, while 55% work in skilled tasks, thereforebeing overqualified. A different picture can be observed for the workers having completedvocational training. Almost 73% work in adequately qualified jobs and only 9% workin unskilled tasks. The rest is working in jobs above their formal qualification, i.e. incomplex and highly complex tasks. For people having a formal qualification as a mastercraftsman/technician/bachelor more than half work in jobs that have a job requirementlevel below their qualification. 49% are working in skilled and 3% in unskilled tasks. 24%are working in jobs with complex tasks, and another 24% work in jobs with highly complextasks. People having a graduate degree are likely to work in jobs that match their formalqualification. Around 71% of them are adequately qualified.
The applicability of the career mobility theory is tested by utilizing information ontraining, increases in job requirement level, and wage growth. In the data, on-the-jobtraining is specified as training that is based on previous professional training or which isintended to support a subsequent change of profession (TNS Infratest Sozialforschung, 2016,p.45). Hence, we construct a dummy variable for on-the-job training, which is equal to oneif the respondent states in the subsequent year (t+ 1) that he received further vocationaltraining in the previous year (t), and zero otherwise (m = 1). As the career mobilitymodel predicts that overqualified workers consider a job as an investment opportunityto acquire further skills, we expect them to be more likely to receive on-the-job trainingthan their adequately educated co-workers, i.e., α > 0 (for m = 1). In order to measureupward mobility, information on job requirement levels and wages are employed. Upwardmobility measured by an increase in job requirement level from t to t+ 1 is captured by abinary indicator (m = 2). Upward mobility in form of wage growth, is captured by thegross hourly real wage growth.7 Based on the underlying theoretical model, it is expectedthat overeducated individuals are more mobile than adequately educated employees in thesame job requirement level, i.e., α > 0.
Table 3 provides some preliminary support for the career mobility model; overqualifiedworkers exhibit a higher percentage share of persons who receive on-the-job trainingcompared to their adequately educated colleagues. Another general finding revealed bythese statistics is that with increasing job complexity the probability of receiving on-the-jobtraining rises as well. Furthermore, in each job requirement level, the shares of overqualified
7The SOEP contains information on both agreed and actually worked hours per week, so a variable whichtakes on the maximum value of both answers is created. If one of these answers is missing, the variabletakes on the value of the non-missing response. As the SOEP provides data on the gross wage in monthlyterms, the generated information on working hours is used to calculate the number of hours worked permonth. The CPI is provided by German Federal Statistical Office (2018).
7
workers who move upward are larger than that of the adequately educated employees.Since upward mobility is defined as an increase in job requirement, no upward movementis possible in the highest job requirement level and thus no results can be reported forthe highly complex jobs. Considering wage growth, consistent with the predictions ofthe career mobility model, in each job requirement level the average earnings growth ofoverqualified workers is larger than that of the adequately educated co-workers.
4 Results
In the subsequent tables, the results of the Probit and OLS regressions are presented.Table A5 contains the coefficients from the wage growth regressions. In the Probit model,the marginal effects depend on the value of the explanatory variables. All estimation results,coefficients or marginal effects respectively, can be found in Tables A3 to A5. To obtainresults for mismatched workers’ labor market mobility, which are comparable in magnitudeacross the different job requirement levels, the relative percentage difference between labormarket mobility of mismatched and adequately educated workers are calculated if there isa significant difference in mobility.8
The job career mobility model should be tested by comparing persons within the samejob requirement level in order to eliminate the possibility that findings reflect differencesin average mobility in the different job requirement levels. Thus, in the subsequent tables,the results of estimating regressions for each job requirement level separately are depicted.Even though the career mobility theory allows to infer predictions for overqualified workersonly, for the sake of completeness, the AMEs for underqualified employees are depicted aswell.
The starting point of the career mobility analysis refers to the acquisition of skills,which are intended to promote future upward mobility. Since on-the-job training shouldimprove promotion prospects, overqualified are supposed to feature a higher probability ofreceiving on-the-job training compared to their adequately educated colleagues. Table A3underlines that the likelihood of receiving on-the-job training of overqualified workers inunskilled/semi-skilled jobs is 4.51 percentage points higher than that of their adequatelyeducated co-workers, for skilled jobs, the corresponding values are 6.9 percentage points.In occupations characterized by complex tasks, there is no significant difference in theprobability of receiving on-the-job training between overqualified and adequately qualifiedworkers.
Further evidence supporting the implications of the career mobility theory is illustratedin Table A4 in which upward mobility is defined by an increase in job requirement. Results
8For deriving the relative percentage differences the predicted values of the respective dependent variableat both states of over- and underqualification (i.e., YOV =0 and YOV =1; YUN=0 and YUN=1) are calculated.The relative percentage difference is derived by: ∆OV % = (YOV =1 − YOV =0)/YOV =0 and ∆UN % =(YUN=1 − YUN=0)/YUN=0.
8
for the highest job requirement levels cannot be reported as in these categories no upwardmovement is possible.9 Only in jobs with a skilled requirement level, overqualified workersexhibit a significantly increased likelihood of moving upward the career ladder comparedto their adequately qualified colleagues. Overqualified employees are 2.7 percentage pointsmore likely to experience upward mobility.
Defining upward mobility by wage growth yields the most conclusive results whichsupport the previous findings on upward transitions (cf. Table A5); in all job requirementlevels, the gross hourly real wages of overqualified workers grow significantly more thanthat of their adequately educated co-workers. In unskilled/semi-skilled jobs the spreadbetween overqualified and adequately educated workers’ wage growth rates is 9.78%, inskilled jobs, wages of overqualified persons increase 3.86% more than that of adequatelyqualified individuals, and in complex jobs the difference in earnings increase amounts 6%.
Econometric problems, which have rather been noticed in the earnings literature, mighthave an impact on the obtained findings. Certainly, it should be taken into account thatthe results might be influenced by individual heterogeneity such as ability. According tothe human capital compensation hypothesis, overeducated persons compensate lackingendowments in human capital other than educational attainment by surplus schooling.Provided that this assumption is valid, and that ability is correlated with mismatchand influences upward mobility and training through other channels than mismatch,ability represents an omitted variable. As it is presumably the case that ability andupward movements/acquisition of further skills are positively linked, and if it is assumedconsistently with the human capital compensation hypothesis that overqualification andability are negatively correlated, the estimates obtained for overqualified workers are biaseddownward implying an underestimation of the effects in all estimated models. Under theaforementioned premises, the obtained estimates can be considered as lower bound (inabsolute terms) for the true effects.
Besides individual heterogeneity, potential job heterogeneity might bias the results aswell. If this unobserved job heterogeneity is correlated with the respective mismatch statesand influences upward mobility and training through other channels than overqualification,it biases the observed effects. The direction of the bias depends, on the one hand, on thecorrelation between the mismatch state and the omitted job heterogeneity and, on the otherhand, on the correlation between upward mobility or training and the omitted variable.For instance, it is conceivable that due to skills shortage in some jobs in which the supplyof potential workers is relatively high, it is more likely that employers feature a tendency tohire persons whose formal qualification is above the actual job requirements. Consequently,under this premise, overqualification and skills shortage are negatively related. As it couldbe presumed that upward mobility and training are positively related with skills shortage,this would imply that the estimates for overqualification are biased downward. Obviously,
9Certainly, they are dispensable anyway since in the highest job requirement level, overqualification is notobservable.
9
this scenario yields equivalent bias directions as in the above described case of omittedindividual heterogeneity and thus the obtained estimates for overqualification should beregarded as lower bounds (in absolute terms) for the true effects.
As overeducation are probably measured with an error, coefficients could be biasedtoward zero, which corresponds to the bias direction outlined in both previous scenarios.Consequently, the obtained estimates should be regarded as lower bounds (in absoluteterms) for the true effects as well in this case.
5 Conclusion
In this article, we test the validity of the career mobility model for the German labormarket. The career mobility model predicts that overeducated workers perform betterthan their adequately educated colleagues in terms of job mobility and wages. Accordingto the model, this is partly explained due to higher participation rates of overeducatedworkers in on-the-job training.
In order to test this theory empirically, we build on the work of Robst (1995), whoargues to compare overeducated workers with their adequately educated colleagues in thesame job. To measure skill requirements in different jobs, we use the JA approach basedon the KldB 2010 classification scheme, which has been established by previous literatureas the most reliable method. On this basis, the job categories unskilled, skilled, complex,and highly complex are constructed. We estimate Probit and OLS models with upwardjob changes, wage growth, and participation in on-the-job training as dependent variables.We use the SOEP covering the period 2013 to 2016, and restrict the sample to 18 to 65year olds with completed education. Our restricted sample contains 24,061 person-yearobservations.
Our results show that the implications of the career mobility model concerning therelationship between overeducation and job mobility seem to be valid for the Germanlabor market. Overqualified workers’ wages do indeed grow systematically at a higher rate,and overqualified workers have a higher probability of upward job mobility compared totheir adequately educated counterparts, at least partially. Whereas the results concerningwage growth hold true for all analyzed job types, higher upward mobility can only beobserved for skilled jobs. Additionally, we could confirm that on-the-job training isan important channel to increased wage-growth and upward job mobility, at least forunskilled/semi-skilled jobs and skilled jobs.
The results suggest that overeducated individuals perform better than adequatelyeducated persons in the same jobs. This seems to contradict the notion that overeducatedworkers are stuck in inadequate professions is wrong, at least for certain job types.Furthermore, overeducated workers out-earn their colleagues, suggesting that the over-investment in human capital is lower than expected.
10
References
Bauer, T. K. (2002). Educational mismatch and wages: a panel analysis. Economics ofEducation Review, 21 (3), 221–229.
—, Rulff, C. and Tamminga, M. (2018). Formale Unterqualifikation in Deutschland –Empirie und wirtschaftswissenschaftliche Perspektive. In M. Bürmann (ed.), FormaleUnterqualifikation auf dem deutschen Arbeitsmarkt, Bertelsmann Stiftung, pp. 4–35.
Büchel, F. and Mertens, A. (2004). Overeducation, undereducation, and the theory ofcareer mobility. Applied Economics, 36 (8), 803–816.
German Federal Statistical Office (2018). Consumer prices. https://www.destatis.de/EN/FactsFigures/NationalEconomyEnvironment/Prices/ConsumerPriceIndices/Tables_/ConsumerPricesCategories.html?cms_gtp=151226_slot%253D2, date ofaccess: June 20, 2018.
Groeneveld, S. and Hartog, J. (2004). Overeducation, wages and promotions withinthe firm. Labour Economics, 11 (6), 701–714.
Grunau, P. and Pecoraro, M. (2017). Educational mismatch and promotions tomanagerial positions: a test of the career mobility theory. Applied Economics, 49 (12),1226–1240.
Hartog, J. and Oosterbeek, H. (1988). Education, allocation and earnings in theNetherlands: overschooling? Economics of Education Review, 7 (2), 185–194.
Hersch, J. (1995). Optimal "mismatch" and promotions. Economic Inquiry, 33 (4),611–624.
Korpi, T. and Tahlin, M. (2009). Educational mismatch, wages, and wage growth:overeducation in Sweden, 1974–2000. Labour Economics, 16 (2), 183–193.
McMillen, D. P., Seaman, P. T. and Singell Jr., L. D. (2007). A mismatch madein heaven: a hedonic analysis of overeducation and undereducation. Southern EconomicJournal, 73 (4), 901–930.
Mincer, J. (1974). The human capital earnings function. In J. Mincer (ed.), Schooling,Experience, and Earnings, Columbia University Press, pp. 83–96.
Paulus, W., Schweitzer, R. and Wiemer, S. (2010). Klassifikation der Berufe 2010 –Entwicklung und Ergebnis. Nürnberg: Bundesagentur für Arbeit.
Robst, J. (1995). Career mobility, job match, and overeducation. Eastern EconomicJournal, 21 (4), 539–550.
11
Rosen, S. (1972). Learning and experience in the labor market. Journal of HumanResources, 7 (3), 326–342.
Rubb, S. (2006). Educational mismatches and earnings: extensions of occupationalmobility theory and evidence of human capital depreciation. Education Economics,14 (2), 135–154.
Sicherman, N. (1991). "Overeducation" in the labor market. Journal of Labor Economics,9 (2), 101–122.
— and Galor, O. (1990). A theory of career mobility. Journal of Political Economy,98 (1), 169–192.
TNS Infratest Sozialforschung (2016). SOEP 2016 – Erhebungsinstrumente 2016(Welle 33) des Sozio-oekonomischen Panels: Personenfragebogen, Stichproben A-L3.SOEP Survey Papers, 345 (Series A), 1–74.
Verhaest, D. and Omey, E. (2006). Discriminating between alternative measures ofover-education. Applied Economics, 38 (18), 2113–2120.
Wen, L. and Maani, S. A. (2018). Job mismatches and career mobility. AppliedEconomics, pp. 1–15.
12
Tables
Table 1: Descriptive statistics of the full sampleMean Std. Dev. Min. Max.
Labor market mobilityOJT 0.3230 0.4676 0.00 1.00Upward mobility 0.0458 0.2090 0.00 1.00Wage growth 0.0726 0.5312 −1.00 42.65Educational mismatchOverqualified 0.2377 0.4257 0.00 1.00Adequately qualified 0.5488 0.4976 0.00 1.00Underqualified 0.2135 0.4098 0.00 1.00Job-specific characteristicsTenure 12.4973 10.8538 0.00 48.80Full time 0.7727 0.4191 0.00 1.00Permanent 0.9144 0.2797 0.00 1.00Below 100 0.3736 0.4838 0.00 1.00100 to 199 0.0934 0.2910 0.00 1.00200 to 1999 0.2382 0.4260 0.00 1.002000 and more 0.2948 0.4560 0.00 1.00Wage 16.4398 7.5347 2.54 53.50Individual characteristicsAge 44.5494 10.6781 18.00 65.00Male 0.5409 0.4983 0.00 1.00Migrant 0.0880 0.2833 0.00 1.00Married 0.5634 0.4960 0.00 1.00Children 0.2754 0.4467 0.00 1.00
Observations 24,061Source: SOEP (2013-2016), own calculations.Notes: Weighted with weights provided by the SOEP.
13
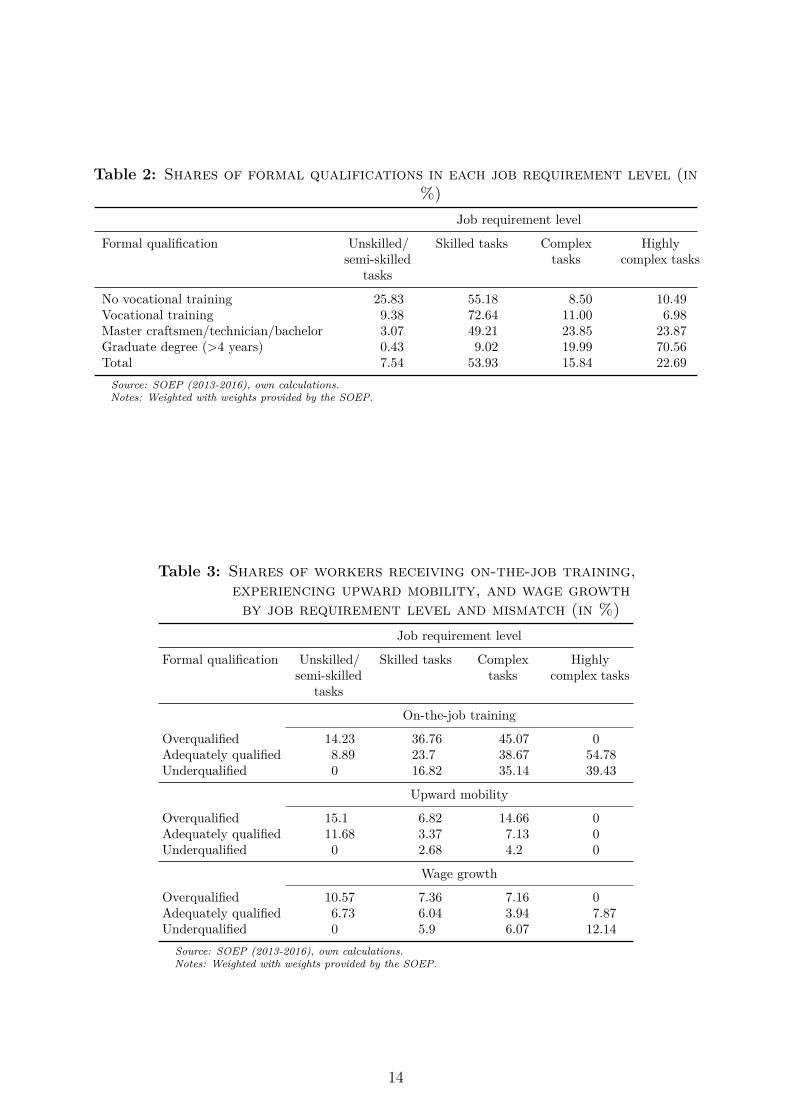
Table 2: Shares of formal qualifications in each job requirement level (in%)
Job requirement level
Formal qualification Unskilled/semi-skilled
tasks
Skilled tasks Complextasks
Highlycomplex tasks
No vocational training 25.83 55.18 8.50 10.49Vocational training 9.38 72.64 11.00 6.98Master craftsmen/technician/bachelor 3.07 49.21 23.85 23.87Graduate degree (>4 years) 0.43 9.02 19.99 70.56Total 7.54 53.93 15.84 22.69Source: SOEP (2013-2016), own calculations.Notes: Weighted with weights provided by the SOEP.
Table 3: Shares of workers receiving on-the-job training,experiencing upward mobility, and wage growthby job requirement level and mismatch (in %)
Job requirement level
Formal qualification Unskilled/semi-skilled
tasks
Skilled tasks Complextasks
Highlycomplex tasks
On-the-job training
Overqualified 14.23 36.76 45.07 0Adequately qualified 8.89 23.7 38.67 54.78Underqualified 0 16.82 35.14 39.43
Upward mobility
Overqualified 15.1 6.82 14.66 0Adequately qualified 11.68 3.37 7.13 0Underqualified 0 2.68 4.2 0
Wage growth
Overqualified 10.57 7.36 7.16 0Adequately qualified 6.73 6.04 3.94 7.87Underqualified 0 5.9 6.07 12.14
Source: SOEP (2013-2016), own calculations.Notes: Weighted with weights provided by the SOEP.
14
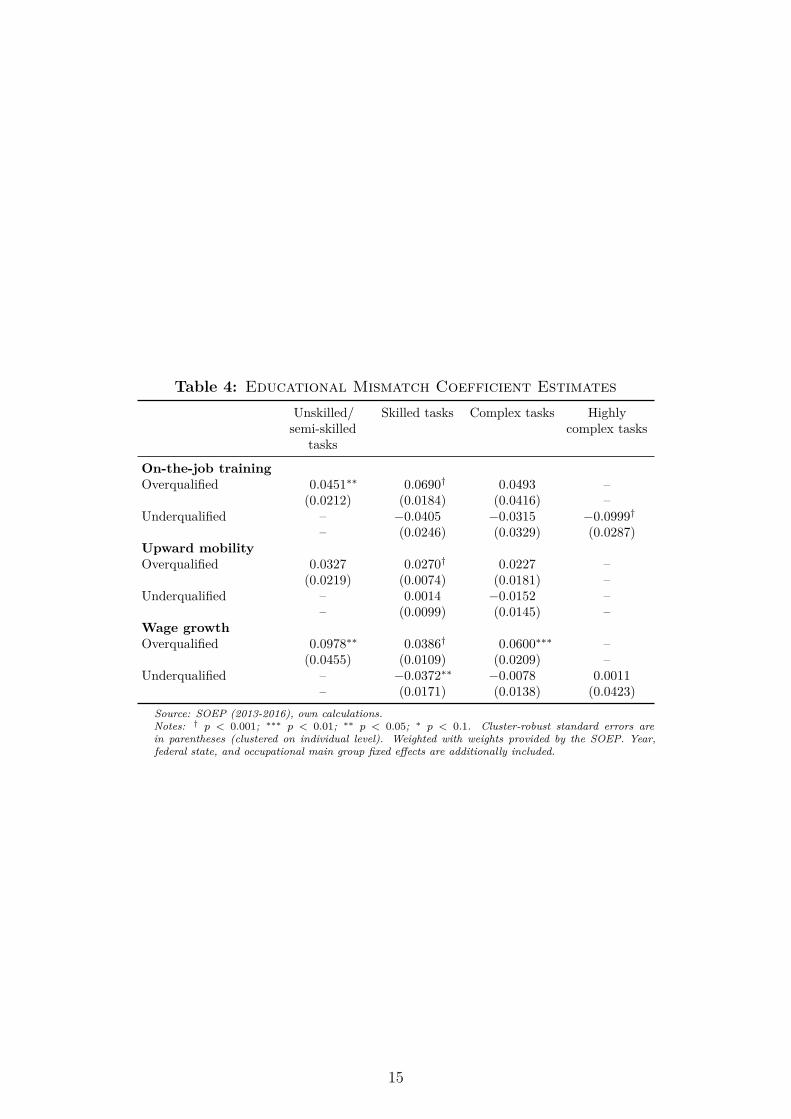
Table 4: Educational Mismatch Coefficient EstimatesUnskilled/semi-skilled
tasks
Skilled tasks Complex tasks Highlycomplex tasks
On-the-job trainingOverqualified 0.0451∗∗ 0.0690† 0.0493 –
(0.0212) (0.0184) (0.0416) –Underqualified – −0.0405 −0.0315 −0.0999†
– (0.0246) (0.0329) (0.0287)Upward mobilityOverqualified 0.0327 0.0270† 0.0227 –
(0.0219) (0.0074) (0.0181) –Underqualified – 0.0014 −0.0152 –
– (0.0099) (0.0145) –Wage growthOverqualified 0.0978∗∗ 0.0386† 0.0600∗∗∗ –
(0.0455) (0.0109) (0.0209) –Underqualified – −0.0372∗∗ −0.0078 0.0011
– (0.0171) (0.0138) (0.0423)Source: SOEP (2013-2016), own calculations.Notes: † p < 0.001; ∗∗∗ p < 0.01; ∗∗ p < 0.05; ∗ p < 0.1. Cluster-robust standard errors arein parentheses (clustered on individual level). Weighted with weights provided by the SOEP. Year,federal state, and occupational main group fixed effects are additionally included.
15

A Appendix
Table A1: Description of variablesVariable DescriptionDependent variablesOJT = 1 if on-the-job training in current year, 0 owUpward mobility = 1 if increase in job requirement (JA) from t to t + 1, 0 owWage growth Wage growth in percent in current year
Explanatory variablesOverqualified = 1 if overqualified (JA method), 0 owAdequately qualified = 1 if adequately qualified (JA method), 0 owUnderqualified = 1 if underqualified (JA method), 0 ow
Tenure Length of time with firm in yearsTenure2 Length of time with firm in years (squared)Full time = 1 if full-time employed, 0 owPermanent = 1 if permanent contract, 0 owBelow 100 = 1 if less than 100 employees, 0 ow100 to 199 = 1 if 100 to 199 employees, 0 ow200 to 1999 = 1 if 200 to 1999 employees, 0 ow2000 and more = 1 if more than 2000 employees, 0 owLn(wage) Logarithm of gross hourly real wage
Age Age in yearsAge2 Age in years (squared)Male = 1 if male, 0 owMigrant = 1 if migrant, 0 owMarried = 1 if married, 0 owChildren = 1 if child(ren) below 16 years in household, 0 owSource: SOEP (2013-2016), own definitions.
16
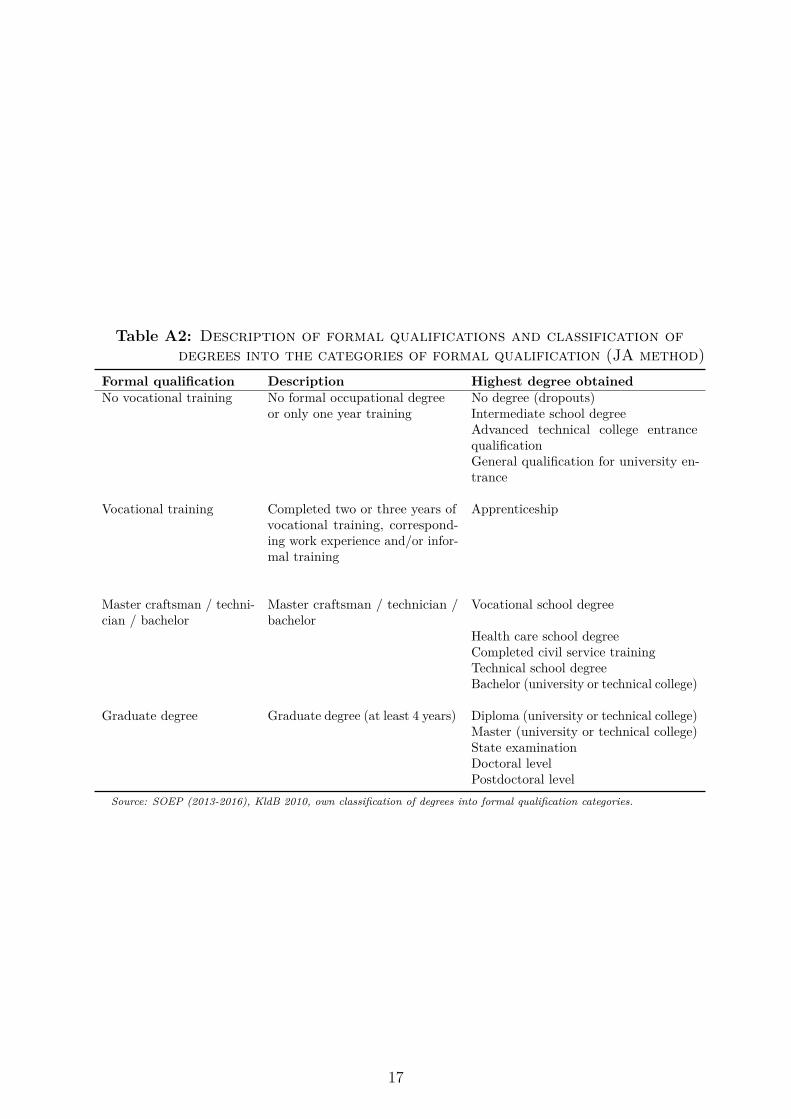
Table A2: Description of formal qualifications and classification ofdegrees into the categories of formal qualification (JA method)
Formal qualification Description Highest degree obtainedNo vocational training No formal occupational degree No degree (dropouts)
or only one year training Intermediate school degreeAdvanced technical college entrancequalificationGeneral qualification for university en-trance
Vocational training Completed two or three years ofvocational training, correspond-ing work experience and/or infor-mal training
Apprenticeship
Master craftsman / techni-cian / bachelor
Master craftsman / technician /bachelor
Vocational school degree
Health care school degreeCompleted civil service trainingTechnical school degreeBachelor (university or technical college)
Graduate degree Graduate degree (at least 4 years) Diploma (university or technical college)Master (university or technical college)State examinationDoctoral levelPostdoctoral level
Source: SOEP (2013-2016), KldB 2010, own classification of degrees into formal qualification categories.
17
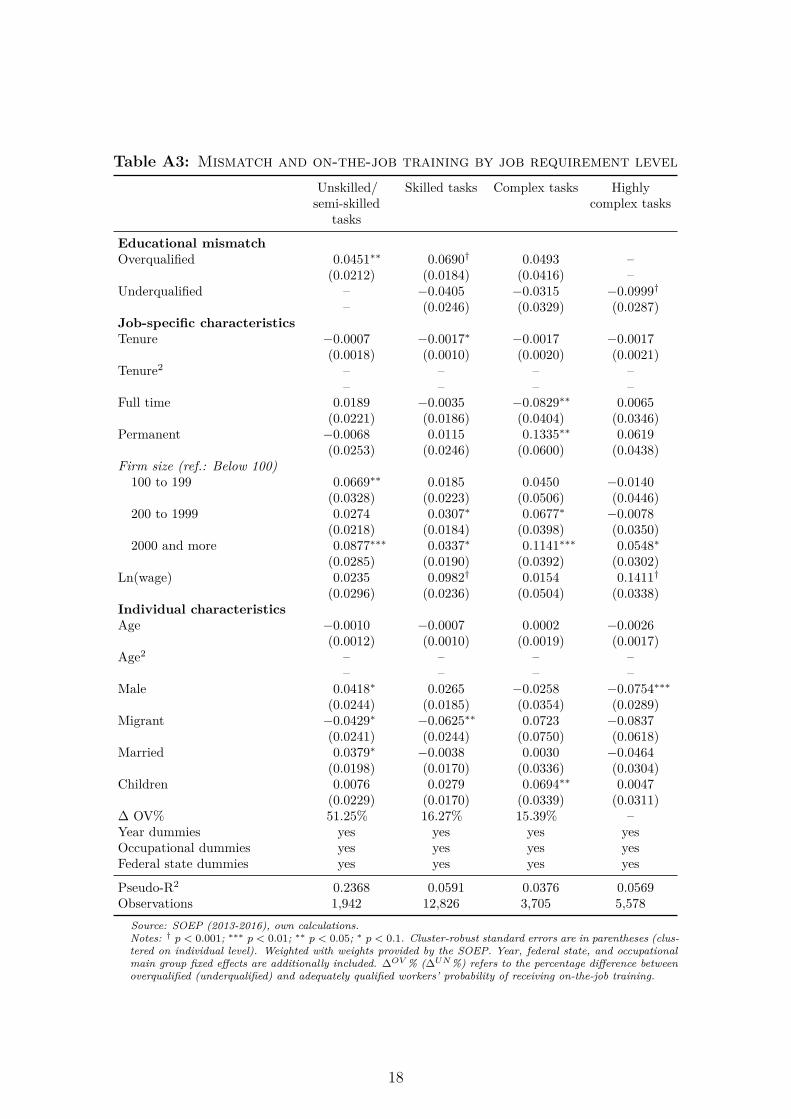
Table A3: Mismatch and on-the-job training by job requirement levelUnskilled/semi-skilled
tasks
Skilled tasks Complex tasks Highlycomplex tasks
Educational mismatchOverqualified 0.0451∗∗ 0.0690† 0.0493 –
(0.0212) (0.0184) (0.0416) –Underqualified – −0.0405 −0.0315 −0.0999†
– (0.0246) (0.0329) (0.0287)Job-specific characteristicsTenure −0.0007 −0.0017∗ −0.0017 −0.0017
(0.0018) (0.0010) (0.0020) (0.0021)Tenure2 – – – –
– – – –Full time 0.0189 −0.0035 −0.0829∗∗ 0.0065
(0.0221) (0.0186) (0.0404) (0.0346)Permanent −0.0068 0.0115 0.1335∗∗ 0.0619
(0.0253) (0.0246) (0.0600) (0.0438)Firm size (ref.: Below 100)100 to 199 0.0669∗∗ 0.0185 0.0450 −0.0140
(0.0328) (0.0223) (0.0506) (0.0446)200 to 1999 0.0274 0.0307∗ 0.0677∗ −0.0078
(0.0218) (0.0184) (0.0398) (0.0350)2000 and more 0.0877∗∗∗ 0.0337∗ 0.1141∗∗∗ 0.0548∗
(0.0285) (0.0190) (0.0392) (0.0302)Ln(wage) 0.0235 0.0982† 0.0154 0.1411†
(0.0296) (0.0236) (0.0504) (0.0338)Individual characteristicsAge −0.0010 −0.0007 0.0002 −0.0026
(0.0012) (0.0010) (0.0019) (0.0017)Age2 – – – –
– – – –Male 0.0418∗ 0.0265 −0.0258 −0.0754∗∗∗
(0.0244) (0.0185) (0.0354) (0.0289)Migrant −0.0429∗ −0.0625∗∗ 0.0723 −0.0837
(0.0241) (0.0244) (0.0750) (0.0618)Married 0.0379∗ −0.0038 0.0030 −0.0464
(0.0198) (0.0170) (0.0336) (0.0304)Children 0.0076 0.0279 0.0694∗∗ 0.0047
(0.0229) (0.0170) (0.0339) (0.0311)∆ OV% 51.25% 16.27% 15.39% –Year dummies yes yes yes yesOccupational dummies yes yes yes yesFederal state dummies yes yes yes yes
Pseudo-R2 0.2368 0.0591 0.0376 0.0569Observations 1,942 12,826 3,705 5,578
Source: SOEP (2013-2016), own calculations.Notes: † p < 0.001; ∗∗∗ p < 0.01; ∗∗ p < 0.05; ∗ p < 0.1. Cluster-robust standard errors are in parentheses (clus-tered on individual level). Weighted with weights provided by the SOEP. Year, federal state, and occupationalmain group fixed effects are additionally included. ∆OV % (∆UN%) refers to the percentage difference betweenoverqualified (underqualified) and adequately qualified workers’ probability of receiving on-the-job training.
18
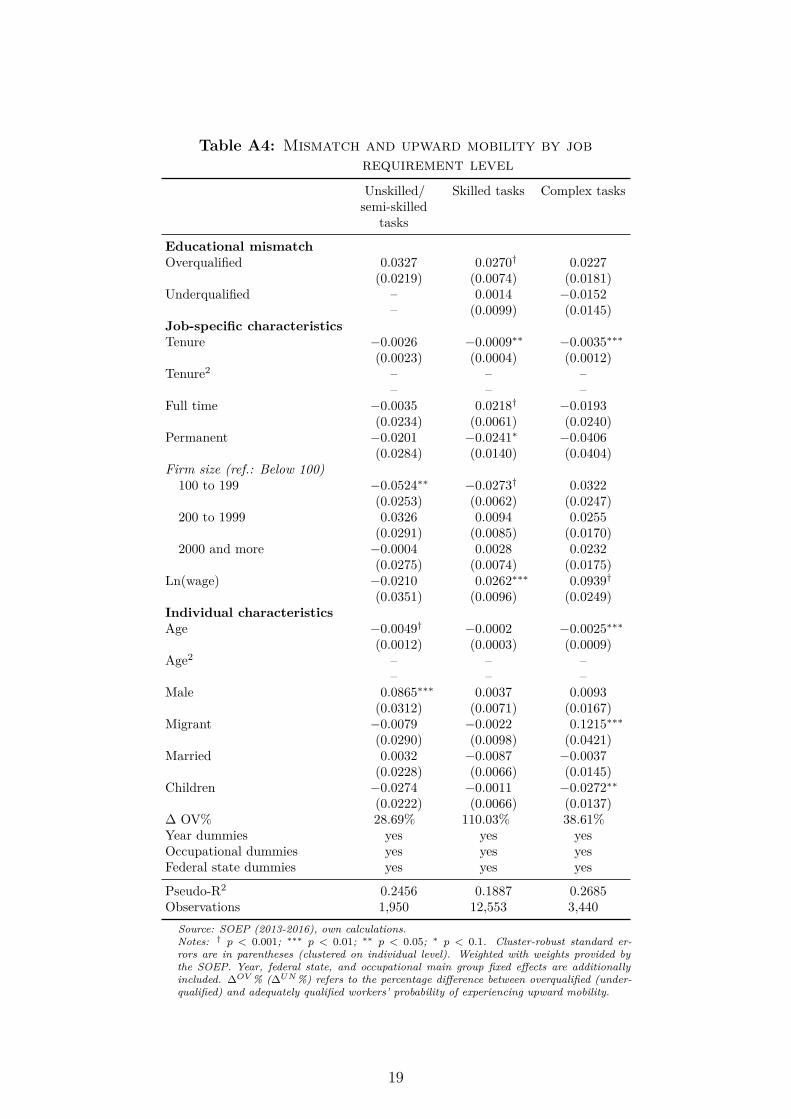
Table A4: Mismatch and upward mobility by jobrequirement levelUnskilled/semi-skilled
tasks
Skilled tasks Complex tasks
Educational mismatchOverqualified 0.0327 0.0270† 0.0227
(0.0219) (0.0074) (0.0181)Underqualified – 0.0014 −0.0152
– (0.0099) (0.0145)Job-specific characteristicsTenure −0.0026 −0.0009∗∗ −0.0035∗∗∗
(0.0023) (0.0004) (0.0012)Tenure2 – – –
– – –Full time −0.0035 0.0218† −0.0193
(0.0234) (0.0061) (0.0240)Permanent −0.0201 −0.0241∗ −0.0406
(0.0284) (0.0140) (0.0404)Firm size (ref.: Below 100)100 to 199 −0.0524∗∗ −0.0273† 0.0322
(0.0253) (0.0062) (0.0247)200 to 1999 0.0326 0.0094 0.0255
(0.0291) (0.0085) (0.0170)2000 and more −0.0004 0.0028 0.0232
(0.0275) (0.0074) (0.0175)Ln(wage) −0.0210 0.0262∗∗∗ 0.0939†
(0.0351) (0.0096) (0.0249)Individual characteristicsAge −0.0049† −0.0002 −0.0025∗∗∗
(0.0012) (0.0003) (0.0009)Age2 – – –
– – –Male 0.0865∗∗∗ 0.0037 0.0093
(0.0312) (0.0071) (0.0167)Migrant −0.0079 −0.0022 0.1215∗∗∗
(0.0290) (0.0098) (0.0421)Married 0.0032 −0.0087 −0.0037
(0.0228) (0.0066) (0.0145)Children −0.0274 −0.0011 −0.0272∗∗
(0.0222) (0.0066) (0.0137)∆ OV% 28.69% 110.03% 38.61%Year dummies yes yes yesOccupational dummies yes yes yesFederal state dummies yes yes yes
Pseudo-R2 0.2456 0.1887 0.2685Observations 1,950 12,553 3,440
Source: SOEP (2013-2016), own calculations.Notes: † p < 0.001; ∗∗∗ p < 0.01; ∗∗ p < 0.05; ∗ p < 0.1. Cluster-robust standard er-rors are in parentheses (clustered on individual level). Weighted with weights provided bythe SOEP. Year, federal state, and occupational main group fixed effects are additionallyincluded. ∆OV % (∆UN%) refers to the percentage difference between overqualified (under-qualified) and adequately qualified workers’ probability of experiencing upward mobility.
19
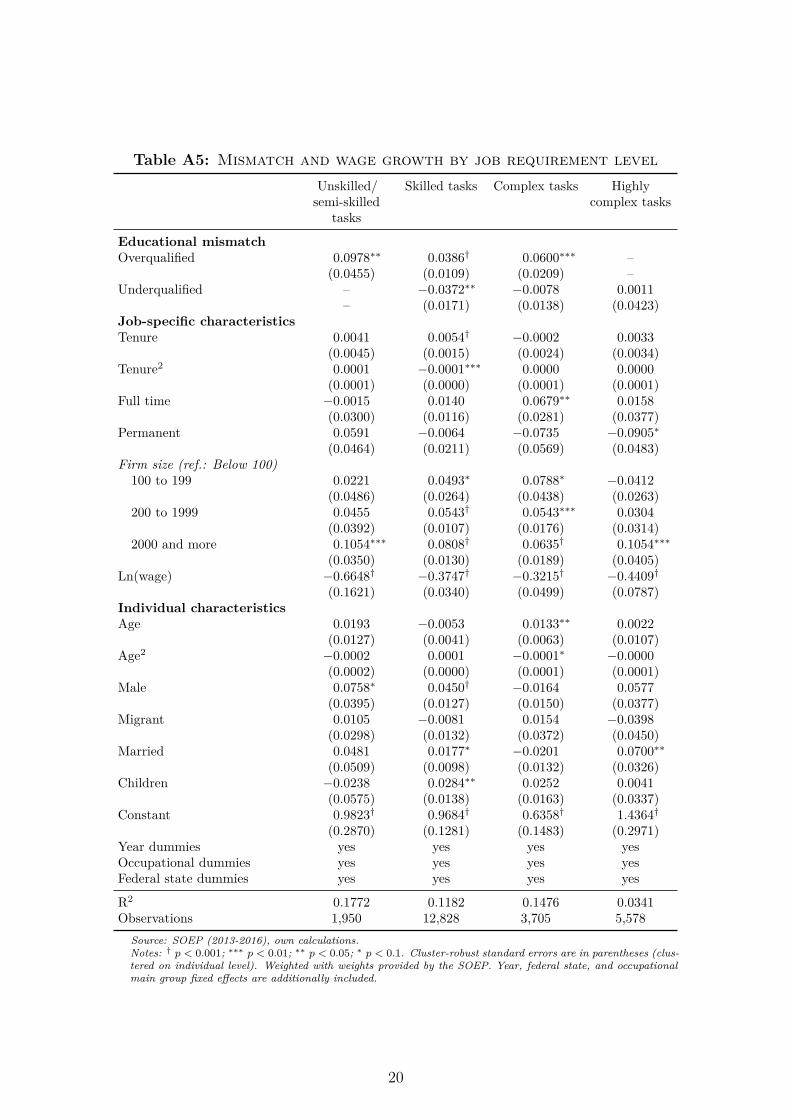
Table A5: Mismatch and wage growth by job requirement levelUnskilled/semi-skilled
tasks
Skilled tasks Complex tasks Highlycomplex tasks
Educational mismatchOverqualified 0.0978∗∗ 0.0386† 0.0600∗∗∗ –
(0.0455) (0.0109) (0.0209) –Underqualified – −0.0372∗∗ −0.0078 0.0011
– (0.0171) (0.0138) (0.0423)Job-specific characteristicsTenure 0.0041 0.0054† −0.0002 0.0033
(0.0045) (0.0015) (0.0024) (0.0034)Tenure2 0.0001 −0.0001∗∗∗ 0.0000 0.0000
(0.0001) (0.0000) (0.0001) (0.0001)Full time −0.0015 0.0140 0.0679∗∗ 0.0158
(0.0300) (0.0116) (0.0281) (0.0377)Permanent 0.0591 −0.0064 −0.0735 −0.0905∗
(0.0464) (0.0211) (0.0569) (0.0483)Firm size (ref.: Below 100)100 to 199 0.0221 0.0493∗ 0.0788∗ −0.0412
(0.0486) (0.0264) (0.0438) (0.0263)200 to 1999 0.0455 0.0543† 0.0543∗∗∗ 0.0304
(0.0392) (0.0107) (0.0176) (0.0314)2000 and more 0.1054∗∗∗ 0.0808† 0.0635† 0.1054∗∗∗
(0.0350) (0.0130) (0.0189) (0.0405)Ln(wage) −0.6648† −0.3747† −0.3215† −0.4409†
(0.1621) (0.0340) (0.0499) (0.0787)Individual characteristicsAge 0.0193 −0.0053 0.0133∗∗ 0.0022
(0.0127) (0.0041) (0.0063) (0.0107)Age2 −0.0002 0.0001 −0.0001∗ −0.0000
(0.0002) (0.0000) (0.0001) (0.0001)Male 0.0758∗ 0.0450† −0.0164 0.0577
(0.0395) (0.0127) (0.0150) (0.0377)Migrant 0.0105 −0.0081 0.0154 −0.0398
(0.0298) (0.0132) (0.0372) (0.0450)Married 0.0481 0.0177∗ −0.0201 0.0700∗∗
(0.0509) (0.0098) (0.0132) (0.0326)Children −0.0238 0.0284∗∗ 0.0252 0.0041
(0.0575) (0.0138) (0.0163) (0.0337)Constant 0.9823† 0.9684† 0.6358† 1.4364†
(0.2870) (0.1281) (0.1483) (0.2971)Year dummies yes yes yes yesOccupational dummies yes yes yes yesFederal state dummies yes yes yes yes
R2 0.1772 0.1182 0.1476 0.0341Observations 1,950 12,828 3,705 5,578
Source: SOEP (2013-2016), own calculations.Notes: † p < 0.001; ∗∗∗ p < 0.01; ∗∗ p < 0.05; ∗ p < 0.1. Cluster-robust standard errors are in parentheses (clus-tered on individual level). Weighted with weights provided by the SOEP. Year, federal state, and occupationalmain group fixed effects are additionally included.
20


