100


Praise for Rule Based Investing
“This excellent book presents very clear and understandable rules for miti-gating the risks on investments designed to earn the risk premiums on vola-tility and ‘carry’ portfolios. As well known in academia and industry, a naïve strategy of mechanically entering these investments offers a steady stream of small positive returns with occasional disastrously large negative returns. The book presents clear-cut, understandable, and sound sets of rules for attenuating the disasters but still earning nice average returns over time per unit risk. The book is quite suitable for undergraduate and master’s level courses. It should also be a convenient reference and practical guide for academics and practitioners. The tables and figures are up to date, easy to read, and accompanied by a nice plain language narrative. Ms. Hsu’s exten-sive academic and industry experience makes her a superb choice to write a book like this one.”
—George Tauchen, Glasson Professor of Economics, Duke University
“In this challenging environment of low rates and fears of over-allocating to equities, investing professionals will be extremely interested in the strategies that Ms. Hsu has developed and refined over many years of working with sophisticated institutional clients. Her guiding principle, of earning risk pre-miums while protecting against large drawdowns, is simple, powerful, and persuasive. I expect that the strategies in this book, while not for the faint of heart, will improve the risk-adjusted performance of many professionally-managed portfolios.”
—Bruce Tuckman, Clinical Professor of Finance, NYU Stern School of Business, and author of Fixed Income Securities.
“In Rule Based Investing, Chiente Hsu seamlessly blends rigorous academic theory and practical market knowledge. This is a uniquely informative and highly readable book on systematic trading strategies for modern markets.”
—Vineer Bhansali, Managing Director and Portfolio Manager, PIMCO
9780133354348_Book 1.indb i9780133354348_Book 1.indb i 11/21/13 3:05 PM11/21/13 3:05 PM

“We finally have a compendium to unveil the arcane ways of systematic, rule based investment. In this book, Dr. Chiente Hsu walks the reader through a model portfolio with three independent rules based strategies. In doing so, she touches upon financial concepts, such as diversification, insurance premium, volatility, tail risk, transaction costs, liquidity, carry, and momen-tum, with a pragmatism that testifies to years of market practice distilled by academic knowledge. This is achieved with simplicity and transparency. Sophisticated investors willing to learn about rule based investment will par-ticularly enjoy it.”
—Marcelo F. L. Castro, Partner and Portfolio Manager, Pharo Management
“During the financial collapse of 2008, many systematic/quantitative invest-ment approaches collapsed as volatility and correlations rose against them. Dr. Hsu demonstrates a variety of systematic strategies across different asset classes that have proved their resilience since the beginning of the millen-nium through different market conditions, in an easy to understand and pragmatic way. This book is invaluable to students and financial practitioners who want to investigate the quantitative side of investing.”
—Andy Warwick, Managing Director and Portfolio Manager, BlackRock
“Rule Based Investing endeavors to be a practical manual for serious inves-tors seeking to tap essential systematic investment strategies to diversify and enhance portfolio results. Not only does the book exceed all expectations in this regard, but it places itself at the vanguard of the practical revolution sweeping the alternative investment space right now: systematic diversifica-tion across non-correlated, rule based trading strategies can be far superior, more transparent, and cheaper than elliptically described and mysterious alpha strategies hawked by hedge fund gurus. With precision, clarity and accessibility to ‘non-quants,’ Hsu lays out how rule based strategies achieve excess returns, why there is a role for such strategies in the market, and why rule-based investing’s excess returns will be sustainable in the future. Hsu masterfully combines intuitive illustrations, fundamental investment reason-ing, and empirical analysis to explain key concepts and strategies. She con-vincingly makes the case that this exciting approach to investing provides an important edge for portfolio managers seeking excess returns.”
—Jim Conklin, Co-CIO and Director of Research, QFS Asset Management
9780133354348_Book 1.indb ii9780133354348_Book 1.indb ii 11/21/13 3:05 PM11/21/13 3:05 PM
“In this enjoyable and readable text, Chiente Hsu explores the idea of let-ting a set of rules dictate exit of various strategies collecting risk premia in various corners of the market. This exit discipline already can go a long way, even before applying judgment, because it helps in the most important deci-sion of investment: when to not be involved. If you are successful at avoiding crisis (when diversification fails), she goes on to show how you are left with the periods where it works very well indeed.”
—Jean-Marc Bottazzi, Partner, Capula
“Chiente Hsu has a unique perspective that blends quantitative discipline with practical reasoning. She lays out the simple rules for investing in a clini-cal approach that avoids the emotional entrapment of the market. Dr. Hsu not only explains fear in the market—she demonstrates how to profit from it. A must read for any investor.”
—Molly Duffy, Managing Director, Credit Suisse
“Chiente does an excellent job distilling complex quant strategies into simple rules. From idea formation to risk management to trade implementation, the book provides a valuable framework for developing investment strategies that should benefit both discretionary investors and quants.”
—Jia Ye, Partner, First Quadrant
“Rule Based Investing is a remarkable book that allows non-experts to under-stand key market topics such as volatility, carry or momentum strategy. All these issues are covered in a simple and readable fashion without using com-plicated models and equations.”
—Stefano Natella, Co-Head Global Secuturities Research and Analytics, Credit Suisse
“Chiente Hsu’s Rule Based Investing will be of great help to many investors, portfolio managers, and traders. I worked closely with Chiente. She always impressed some of the world’s largest asset managers and their decision makers about her quantitative approach. It was a great pleasure and honor to have worked with Chiente, a true professional in a very complex world of creating true alpha and performance.”
—Martin Wiedmann, Global Head of FX Sales & Distribution Credit Suisse (2008-2012)
9780133354348_Book 1.indb iii9780133354348_Book 1.indb iii 11/21/13 3:05 PM11/21/13 3:05 PM

This page intentionally left blank

Rule Based Investing
9780133354348_Book 1.indb v9780133354348_Book 1.indb v 11/21/13 3:05 PM11/21/13 3:05 PM

This page intentionally left blank

Rule Based InvestingDesigning Effective Quantitative Strategies for Foreign Exchange,
Interest Rates, Emerging Markets, Equity Indices, and Volatility
Chiente Hsu
9780133354348_Book 1.indb vii9780133354348_Book 1.indb vii 11/21/13 3:05 PM11/21/13 3:05 PM

Vice President, Publisher: Tim Moore Associate Publisher and Director of Marketing: Amy Neidlinger Executive Editor/Acquisitions Editor: Jeanne Glasser Levine Development Editor: Natasha Torres Operations Specialist: Jodi Kemper Marketing Managers: Megan Graue, Lisa Loftus Cover Designer: Chuti Prasertsith Managing Editor: Kristy Hart Project Editor: Katie Matejka Copy Editor: Language Logistics, Chrissy White; Barbara Hacha Proofreader: Jess DeGabriele Indexer: Tim Wright Compositor: Nonie Ratcliff Manufacturing Buyer: Dan Uhrig
© 2014 by Pearson Education, Inc.
Publishing as FT Press
Upper Saddle River, New Jersey 07458
This book is sold with the understanding that neither the author nor the publisher is engaged in rendering legal, accounting, or other professional services or advice by publishing this book. Each individual situation is unique. Thus, if legal or financial advice or other expert assistance is required in a specific situation, the services of a competent professional should be sought to ensure that the situation has been evalu-ated carefully and appropriately. The author and the publisher disclaim any liability, loss, or risk resulting directly or indirectly, from the use or application of any of the contents of this book.
FT Press offers excellent discounts on this book when ordered in quantity for bulk purchases or special sales. For more information, please contact U.S. Corporate and Government Sales, 1-800-382-3419, [email protected] . For sales outside the U.S., please contact International Sales at [email protected] .
Company and product names mentioned herein are the trademarks or registered trade-marks of their respective owners.
All rights reserved. No part of this book may be reproduced, in any form or by any means, without permission in writing from the publisher.
Printed in the United States of America
First Printing December 2014
ISBN-10: 0-13-335434-2 ISBN-13: 978-0-13-335434-8
Pearson Education LTD. Pearson Education Australia PTY, Limited. Pearson Education Singapore, Pte. Ltd. Pearson Education Asia, Ltd. Pearson Education Canada, Ltd. Pearson Educación de Mexico, S.A. de C.V. Pearson Education—Japan Pearson Education Malaysia, Pte. Ltd.
Library of Congress Control Number: 2013951005
9780133354348_Book 1.indb viii9780133354348_Book 1.indb viii 11/21/13 3:05 PM11/21/13 3:05 PM

This book is dedicated to Maeya, Nalla, and Nicolas.
9780133354348_Book 1.indb ix9780133354348_Book 1.indb ix 11/21/13 3:05 PM11/21/13 3:05 PM

Contents
Introduction . . . . . . . . . . . . . . . . . . . . . . . . . . . . . . . . . . . 1
Chapter 1 Rule Based Volatility Investment . . . . . . . . . . . . . . . . . . . 9
Learning to Love Volatility . . . . . . . . . . . . . . . . . . . . . . . . . 9
Volatility in Capital Markets . . . . . . . . . . . . . . . . . . 13
Investing in Volatility Through Rules . . . . . . . . . . . 17
Profiting from Volatility and Awareness of the Danger . . . . . . . . . . . . . . . . . . . . . . . . . . . . . . 19
The Examples of Rule Based Vol Investments . . . . . . . . . . . . . . . . . . . . . . . . . . . . . . . 26
Building a Volatility Portfolio . . . . . . . . . . . . . . . . . 68
Some Remarks . . . . . . . . . . . . . . . . . . . . . . . . . . . . . 76
Chapter 2 Rule Based Carry and Momentum Investment . . . . . . . 79
Rule Based Carry Investment . . . . . . . . . . . . . . . . . . . . . . 79
“Benchmark” Returns in the FX Carry Trade . . . . . . . . . . . . . . . . . . . . . . . . . . . . . . . 83
The Risks of the FX Carry Trade . . . . . . . . . . . . . . 89
The Steam Roller . . . . . . . . . . . . . . . . . . . . . . . . . . . 89
Simple yet Effective Rules for Carry Investment . . . . . . . . . . . . . . . . . . . . . . . . . . . 94
Some Remarks . . . . . . . . . . . . . . . . . . . . . . . . . . . . 107
Chapter 3 Rule Based Value Investment . . . . . . . . . . . . . . . . . . . 109
Value in Emerging Markets . . . . . . . . . . . . . . . . . . . . . . . 109Value Investing in Emerging Market FX . . . . . . . . . . . . 115
Rule Based Investment in Emerging Market FX . . . . . . . . . . . . . . . . . . . . . . . . . . . . . . . 118
Fundamental Rules . . . . . . . . . . . . . . . . . . . . . . . . . . . . . 121
Technical Rules: Overlaying Credit Default Swap Spread as Market Indicator . . . . . . 126
Combining Fundamental Rules and Risk Indicators . . . . . . . . . . . . . . . . . . . . . . . . 130
9780133354348_Book 1.indb x9780133354348_Book 1.indb x 11/21/13 3:05 PM11/21/13 3:05 PM

CONTENTS xi
Value Investing in Emerging Market Sovereign Bonds . . . . . . . . . . . . . . . . . . . . . . . . . . . . . . . 134
Fundamental Rules . . . . . . . . . . . . . . . . . . . . . . . . 135
Technical Rules . . . . . . . . . . . . . . . . . . . . . . . . . . . 139
Combination of Macro Fundamentals and Market Indicator . . . . . . . . . . . . . . . . . . . . . . . . . . 141
Some Remarks . . . . . . . . . . . . . . . . . . . . . . . . . . . . . . . . . 147
Chapter 4 Rule Based Portfolio . . . . . . . . . . . . . . . . . . . . . . . . . . . 149
The Next Crisis and Beyond . . . . . . . . . . . . . . . . . . . . . . 157
Bibliography . . . . . . . . . . . . . . . . . . . . . . . . . . . . . . . . . 161
Index . . . . . . . . . . . . . . . . . . . . . . . . . . . . . . . . . . . . . . . 165
9780133354348_Book 1.indb xi9780133354348_Book 1.indb xi 11/21/13 3:05 PM11/21/13 3:05 PM

Acknowledgments
I wish to thank Bruce Tuckman, without whom this book would not be possible. Bruce has been my mentor since day one of my invest-ment banking career. From Bruce I learned not to sacrifice intellect or morals in the fast moving world of finance.
I wish to thank George Tauchen from whom I’ve learned finan-cial econometrics, and I continue learning from him. All mistakes in the book of course are my responsibility alone.
I wish to thank my colleagues and teammates at Credit Suisse. I was fortunate to be given the support and vote of confidence to run a quant team full of hard working talent.
I wish to thanks Adam Esperidiao, a brilliant inventor and entre-preneur. Adam has been key in making technical subjects acces-sible to a broad public audience. I look forward to our continued collaboration.
Finally, I wish to thank my husband Nicolas Sagna, whose uncon-ditional love makes me the luckiest person and blesses my life.
9780133354348_Book 1.indb xii9780133354348_Book 1.indb xii 11/21/13 3:05 PM11/21/13 3:05 PM

About the Author
Chiente Hsu (New York, NY) is the founder of Alpha System Advisors, LLC. She was Managing Director and global head of Alpha Strategies at Credit Suisse. From 1998 to 2012, she led a team of Ph.Ds implementing quantitative investment strategies for investors, which included asset management, pension funds, corporates and hedge funds. Dr. Hsu was previously a professor at the University of Vienna, Austria, and a visiting professor at Duke University in North Carolina, teaching and conducting research in financial econometrics. She has published widely in major finance and economics journals, such as The Review of Economics and Statistics . Dr. Hsu holds an MA in Computer Science and Business Management from the Technical University Vienna and a Ph.D in Economics from the University of Vienna, Austria.
9780133354348_Book 1.indb xiii9780133354348_Book 1.indb xiii 11/21/13 3:05 PM11/21/13 3:05 PM

This page intentionally left blank

1
Introduction
“Before a person studies Zen, mountains are mountains and waters are waters; after a first glimpse into the truth of Zen, mountains are no longer mountains and waters are not wa-ters; after enlightenment, mountains are once again moun-tains and waters once again waters.”—Ch’ing-yüan Wei-hsin
The purpose of this book is to rediscover simple, scientifically sound investing. It has taken me the better part of my adult life spent designing and implementing complex trading strategies, both in aca-demia and on Wall Street, to recognize simplicity. Years spent study-ing trades that consistently make money reveal simple truths behind their success, essential rules that winning strategies follow. More important than the intricacies of the models or parameters used, are certain fundamental principles we reduce to essential questions: Do we understand the source of the persistent returns? How do we decide when to take risk? Does the model take into account price his-tory? Are forward-looking indicators filtering the trading decisions? Are we maximizing diversification?
Experience teaches that market expertise only goes so far, and a simple strategy broadly applied across diverse uncorrelated mar-kets provides better protection against crisis events. Having analyzed reams of market data as only fellow “quants” can understand, we avoid the perils of “data mining” with simple “risk on/risk off” rules, sparing use of historical data and real-time indicators of market sentiment. Investors have long been told to simply “buy and hold” stock indices,
9780133354348_Book 1.indb 19780133354348_Book 1.indb 1 11/21/13 3:05 PM11/21/13 3:05 PM

2 RULE BASED INVESTING
that it’s impossible to time the market, and that the trading fees alone would bleed you dry.
The truth is in the middle. “Buy-and-hold” is a simple yet risky strategy that experiences losses during crisis events. A trading strat-egy that is revisited monthly does not incur the excessive costs that doom “day trading” and is much more reactive to market realities and changes than a completely passive strategy of buy and forget. It is impossible to time market highs and lows, but it is possible as well as extremely prudent to gauge market anxieties and turn risk off when trouble threatens. The profound improvement produced by applying these rules might seem like voodoo or a glitch unique to the historical data (“fool’s gold” from data mining), but it comes from extending to the financial market the same intuition we practice in everyday life. If the weather is overcast and cloudy, it does not guarantee a storm is coming, yet all the same, why take the risk of sailing on that day?
Arriving at this perspective required the accumulation of enor-mous human capital in the form of collaboration with many Ph.D.s over the years. In these think tanks of professionals with strong aca-demic backgrounds, we sought always a firm grounding for why a trade makes money as well as the question of how much money it can make. Throughout my career I’ve continued to follow academic research to provide a better understanding of the science behind investing, drawing from theory before putting a strategy into prac-tice in managing assets. Science moves forward from a combination of theory and practice: It is the work of theoretical physicists that informs experimental physicists “where to look” for interesting results in the natural world. We can view finance in the same light, drawing from academia the fresh ideas that inform better models and strate-gies. The final product of this knowledge and experience is a rule based framework of principles easily translated across asset classes for maximum diversification.
From simple rules profound changes arise. The improving safety record of the aviation industry arose after the application of rules and
9780133354348_Book 1.indb 29780133354348_Book 1.indb 2 11/21/13 3:05 PM11/21/13 3:05 PM

INTRODUCTION 3
checklists for inspections and safety procedures before takeoff and landing. Improved metrological science keeps planes grounded when the threat of severe weather arises. Equally in medicine, implement-ing rules and checklists for sanitization and sterilization of hands and tools prior to surgery profoundly reduced incidents of infection once considered a natural part of healing. Through basic boilerplater invest-ment advice, investors are taught that the “buy-and-hold” strategy is best, that the S&P 500 is the ultimate benchmark, and that there is no alternative but to accept heavy losses during crisis events—all of which are insufficient in light of rule based strategies.
You might be skeptical that if something so simple is so effec-tive, why isn’t this already widely known? Just as consumer goods are designed with a limited useful life, a “planned obsolescence” where products fail or become unfashionable after a few years, the financial industry benefits from obfuscation. In the financial world seldom is anything described as “simple”; from the industry jargon to the infor-mation overload of stock tickers, the financial industry is a cloistered world. Behind the groomed esotericism is the suggestion that those within the industry are privy to secrets others are not.
Fortunately this book is accessible not only to financial profes-sionals, but anyone with an interest in objective rule based invest-ing styles. Throughout the text, technical discussions of equations are avoided as much as possible (they are available, however, in the bib-liography for those interested), and the focus instead is on building the intuition that informs a rule based system. The purpose of this book is to demonstrate to investors that simple rules, when built on sound scientific principles and divorced from emotions, are capable of notable results.
In the financial world it is difficult to differentiate good advice from mediocre advice from utterly incorrect advice. The bar for “decent returns” is typically considered to be the S&P 500. This intui-tive faith that equity indices progressively reach ever new highs is an example of the phenomenon of persistent returns . It is true that in
9780133354348_Book 1.indb 39780133354348_Book 1.indb 3 11/21/13 3:05 PM11/21/13 3:05 PM

4 RULE BASED INVESTING
the long term indices grow because the population is growing, busi-nesses are becoming more efficient and more innovative everyday, and opportunities continue to multiply. Civilization is generally a cycle of positive reinforcement and improvement.
The issue is then how to best capture that persistent return. The buy-and-hold strategy can work in the long run, but it is a risky strategy with volatile returns and significant exposure to extreme market events. In looking to move beyond buy-and-hold, there have been many suggestions and theories, often complicated and with-out grounding, of finding patterns in historical data to predict future movement. That would be an example of data mining, as it is easy to find patterns in existing data that are irrelevant to predicting future price movements.
There are other examples of markets exhibiting persistent returns that we explore together in assembling a globally diverse rule based portfolio. In volatility markets we take a look at how receiving volatil-ity premium is a consistently profitable position analogous to the long-term success of insurance companies. Emerging market economies exhibit strong growth as revealed by GDP growth and other economic measure, which are better captured through currencies and bonds rather than equity markets. Rules are discussed for improving the carry trade among G10 currencies.
Moving beyond passive investment and the perils of data min-ing, you learn that you must take historical data into account only to a limited first-order degree. In the case of volatility investing, an intelligent measure of the moving average, GARCH, is used as a rule for filtering risk. In the currency carry investing, diversification is the key to persistent returns, and in value investing a ranking of macro-economic fundamentals is used to determine the “value” of emerging market countries.
Investment decisions are further filtered by forward-looking mar-ket indicators. For the carry trade and volatility investing, you learn to use the VIX, the “fear barometer” of the market, to gauge the anxiety
9780133354348_Book 1.indb 49780133354348_Book 1.indb 4 11/21/13 3:05 PM11/21/13 3:05 PM
INTRODUCTION 5
level over future months. In interest rates you can use the shape of the volatility curve to establish forward-looking rules. In emerging mar-kets you can use real-time information from the credit default swap (CDS) markets to determine the market’s current view of a country’s credit worthiness.
The philosophy of the rules is the same: History, in the form of statistics, provides relevant background information that is further refined by the forward-looking information of market prices (such as the VIX, slope of the volatility curve, and CDS spreads). Techni-cal rules derived from price action only are vital, but fundamental economics are not dead, as you discover in this book’s discussion of value investing rules. The most powerful rules, as is demonstrated throughout, are produced by combining both historical and forward-looking filters. The strength of the complete portfolio assembled here is scientifically founded in the diversification provided by widely dif-ferent asset classes. Risk is spread out among markets as unique from each other as G10 currencies, emerging market bonds, and volatil-ity markets. Risk is spread out via distinct investment styles such as volatility, carry, and value investment. Not only do the returns of the sample portfolio provided in this book dwarf those of equity markets, the volatility is remarkably low, making for intelligent and profitable investments.
Throughout the book you are given examples based on similar investment guidelines, such as low frequency trading, where you revisit your investment decisions on a monthly basis, minimizing the concern of transaction costs. The investments to take on are long-term profitable and well understood in exhibiting a persistent pre-mium, such as volatility premium, carry premium, and emerging market growth. There’s no getting away from the fact there is poten-tial danger in these investments, such as severe losses during a market crisis event, and you learn how to use forward-looking market prices in the forms of VIX, credit default swap spreads, or the shape of the volatility curve to filter out the worst of these events and reduce their
9780133354348_Book 1.indb 59780133354348_Book 1.indb 5 11/21/13 3:05 PM11/21/13 3:05 PM

6 RULE BASED INVESTING
impact. The market indicators alert you to heightened fears of poten-tial turmoil, and during those months you should reduce risk rather than gamble on the outcome of extreme events.
After years spent in academia researching Financial Economet-rics, followed by 15 years in investment banking developing quantita-tive investment strategies, the end result of having designed countless financial models and trading programs has been to revisit the basics of investment with a new set of eyes that recognize the salience of simple truths expressed in simple rules. To quote T.S. Eliot, “We shall not cease from exploration / And the end of all our exploring / Will be to arrive where we started / And know the place for the first time.” These insights into a new rule based system of investing are the crystalliza-tion of my professional experience, derived from the certainty that avoiding emotion-driven decisions through informed and scientific rules produces the best and most intelligent long-term investments.
This book only scratches the surface of rule based strategies through a few examples. There are many other investment possibili-ties, and every day the number grows as academic research helps us to understand market interactions and causalities that lead to the design of better and more robust rules. Exciting examples mentioned here use model free volatility/variance premium to predict future returns as well as research that aims to explain and price the carry risk pre-mium. The strategies introduced in this text can be refined for greater effectiveness as well as expanded to cover additional asset classes and markets. Furthermore, in the future publications I hope to explore to a greater depth the ability of rule based systems to signal and hedge against rare and dreaded “black swan” events.
The simplicity of these rules is also a humble acknowledgement of the unknowable chaos that churns the tides of the financial mar-kets. How we choose to “ride the chaos” so to speak, is a challenge we must approach from the perspective of a surfer. Surfing is, after all, an apt representation of individual grace and control while balanced on the edge of the unfathomable turbulence that fathers big waves.
9780133354348_Book 1.indb 69780133354348_Book 1.indb 6 11/21/13 3:05 PM11/21/13 3:05 PM

INTRODUCTION 7
Inexperienced surfers are liable to exhaust themselves in a futile chase after every minor ripple that comes along, not unlike day trad-ers, while still others, afraid of engaging the water might drift about passively behind the breakers to no avail. A seasoned surfer, however, is informed by both his ingrained experience of the beach as well as by keeping sharp eye always on the horizon, filtering out dozens if not hundreds of potential swells before the ideal wave is chosen. With the right wave selected, disciplined muscles engage, and from a sea of unpredictability there arises a graceful figure sailing the crest of foaming waters. A wise surfer is one who has learned that when bad weather threatens out in the distance, whether there will actually be a storm or not, he watches the ocean from the shore that day. Basic and intuitive truths reveal themselves in the simplest rules.
9780133354348_Book 1.indb 79780133354348_Book 1.indb 7 11/21/13 3:05 PM11/21/13 3:05 PM

This page intentionally left blank

9
1 Rule Based Volatility Investment
Learning to Love Volatility
“Investing in volatility” might seem a contradictory phrase. Semantically we tend to equate volatility with unpredictability and chaos, precisely the abstract forces that foil most investment strat-egies. It is not intuitive to think of volatility as something innately valuable, nor to recognize volatility as a rich and unique asset class. Even many experienced financial professionals comfortable reading an earnings report think of volatility markets as an esoteric techni-cal subject better left to options traders. Underlying complex math-ematical pricing models, however, are intuitive market principles that explain why a “volatility premium” exists and how it can greatly ben-efit most portfolios.
Stocks are commonly understood as owning a share of a company, treasuries as a loan to the government, and commodities as durable physical goods, but what is the underlying value of volatility? Before investing in volatility, it’s crucial to understand on a fundamental level where the potential profit comes from and why. Volatility and options are already subjects that are unfamiliar and intimidating to many, and there’s no shortage of options traders and fund managers who will default to explanations involving the Black Scholes model and Greek variables of options trading. The result is the impression that making money through volatility is on par with theoretical physics
9780133354348_Book 1.indb 99780133354348_Book 1.indb 9 11/21/13 3:05 PM11/21/13 3:05 PM

10 RULE BASED INVESTING
rather than the application of basic market principles. Understanding that heat will spread through a spoon from one end to the other does not require solving the heat diffusion equations. Visualizing space-time as a stretched blanket in which masses such as planets cause a sag doesn’t demand a doctoral degree. Equally understanding that, on average, selling volatility is a profitable strategy requires only the recognition that investors will always be willing to pay for protection against uncertainty.
The “volatility premium” exists because of investor fear. The ori-gins of futures exchanges began with farmers seeking protection from commodity price swings through future contracts. The farmer is guar-anteed a fixed price for his harvest months in advance. The specula-tor receives the unknown “floating” price of the harvest at a future date. The speculator stands to profit if on the contract date the market price is above the strike price and stands to lose if otherwise. This simple arrangement is no different in essence than a volatility swap where the “fixed price” is the implied volatility (market expectation) on the date of the swap, and the “floating price” is the actual volatility at a future date.
The contract between the farmer and speculator, however, is biased in favor of the speculator. On average, the speculators neces-sarily must profit more often than they lose; otherwise, they would drive themselves out of business quickly. The speculator must be paid to hold the risk and bear the uncertainty; accordingly, the farmer naturally enters the contract at a loss compared to what he would typically receive on average. In exchange for paying the speculator a premium over the long term, the farmer can sleep well at night, unafraid of possible ruin due to freak market prices. The speculator may suffer heavy losses during a bad year, but the cumulative effect of receiving the premium will in the long term more than cover such losses so that, on average, speculation remains a profitable business. “Speculator,” however, is a loaded term that suggests recklessness and greed, but after speculators mature, grow, diversify, and hone
9780133354348_Book 1.indb 109780133354348_Book 1.indb 10 11/21/13 3:05 PM11/21/13 3:05 PM

CHAPTER 1 • RULE BASED VOLATILITY INVESTMENT 11
their craft to a science, we call it something that sounds much more respectable: insurance.
Insurance is a familiar point of reference from which to draw infor-mative parallels. All insurance premiums are biased toward insurance companies. Even a healthy eighteen-year-old, quoted what seems like a pittance for a generous life insurance policy, is overpaying from a risk-return perspective. Policy holders recognize that imbued in the price of a policy is not only the statistically expected rate of payout, but also all the overhead, salaries, advertising, and profit that an insur-ance company is required to generate. The insurance premium means that the “implied risk” of fire, accident, or death, usually exceeds the actual risk of these catastrophes occurring to policy holders. If this weren’t the case, there would be no profit in insurance, and insurers would cease to exist.
Financial markets are merely an extension of these familiar prin-ciples, and with the example of overpaying for insurance premiums in mind, it shouldn’t come as a surprise that market expected “implied volatility” is a biased estimate of future realized volatility. Imbued in the implied volatility price, which is a snapshot of what the market expects future volatility will be, is the volatility risk premium, which is the compensation given in exchange for bearing the risks of an uncer-tain future.
The risk premium exists throughout asset classes and different markets. In bond markets, long-dated bonds typically yield more than shorter-dated bonds due to the uncertainty of the future. Inves-tors willing to take on the risk of long-dated debt are compensated by this premium because default is always possible. Credit defaults and downgrades do occur in credit markets; however, they occur less frequently than the implied default rate reflects. The implied risk of default overshoots the actual risk because the market demands a “risk premium” to be priced in for the additional uncertainty.
Furthermore, the persistence of the volatility risk premium also may be rooted in a natural imbalance in supply and demand. To return
9780133354348_Book 1.indb 119780133354348_Book 1.indb 11 11/21/13 3:05 PM11/21/13 3:05 PM

12 RULE BASED INVESTING
to our crutch of insurance, whereas much of the population desires insurance coverage, few are in a position to issue policies. The down-side of issuing insurance policies is vast. Without deep capitalization and a broad diversified customer base, it is a recipe for disaster. In the financial markets, most participants involved in options are natural buyers, analogous to policy holders. They are using options to hedge their risks, or if they are speculating, they are doing so with the lim-ited downside buying an option provides. On the other hand, selling options is regarded as much more dangerous because the downside is unlimited. A stock’s value can drop only as low as zero, but it can increase without limit, which means an option seller can potentially experience uncapped losses. With the increased capital requirements and lower tolerance of leverage that exists after the 2008 crisis, fewer players are willing to sell options.
This imbalance is particularly sharp immediately after a market crisis, which is precisely why the aftermath of a market event is an excellent opportunity for volatility investors. Suppose we are in the business of issuing flood insurance policies in the northeast. Typically, it is a profitable business with occasional payouts that are eclipsed by the premiums we receive. Suddenly, a hundred-year storm occurs, flooding tens of thousands of houses. As insurers we suffer heavily and immediately raise premiums to account for the new realities. Fol-lowing the hurricane, there will be a surge of demand for more flood insurance policies by the residents now afraid of the next storm, yet the supply of insurers willing to issue policies will shrink because they’ve seen what can happen and don’t want to expose themselves to such drastic potential losses. High demand and low supply will produce skyrocketing flood-insurance rates in the immediate aftermath. Has the likelihood of freak weather occurrences actually increased? No. A hundred-year storm is still a hundred-year storm, as evidenced by the geological record. Logically speaking, flood insurance rates should remain unchanged, yet structural imbalances in market psychology
9780133354348_Book 1.indb 129780133354348_Book 1.indb 12 11/21/13 3:05 PM11/21/13 3:05 PM

CHAPTER 1 • RULE BASED VOLATILITY INVESTMENT 13
drive pricing more than reason. The trauma of the last storm is still visceral both to homeowners who demand protection and insurers who are afraid to provide it. Contrary to our natural intuition and emotions, the best time to issue flood insurance is immediately after a crisis because that is when the risk premium is highest. In fact, after a major market crisis, volatility tends to be the best-performing asset class.
Volatility in Capital Markets
Having discussed the general principles behind volatility and risk premiums, let’s now focus on how volatility is treated and utilized in capital markets. Technically speaking, volatility measures the magni-tude of how a price changes over a specific period of time. It is widely agreed by academics and practitioners that volatility should be mea-sured in rates of returns; that is, percentage changes in prices. The most commonly used measure of return volatility is the standard devi-ation measuring the dispersion of returns. Standard deviation sum-marizes the probability of extreme values occurring. For example, if X Corp stock moves up 10% one year and down 10% the next year for a decade, it has an annualized volatility of 10%. If Y Corp moves 20% up and 20% down on alternating years for a decade, it has a vola-tility of 20%. Even though both stock prices might end the decade unchanged from where they began, Y Corp is twice as volatile. If both X Corp and Y Corp have an average rate of return, say 10% per year, X Corp is more desirable than Y Corp because of greater price stability. X Corp stock is considered a superior investment because less risk is involved in generating the same return as Y Corp stock.
When volatility is high, the chance of large positive or negative returns is high. Mathematically speaking, the volatility of X Corp stock means that there is a 95% probability (two standard deviations) that the stock price moves between -10% and 30%. For Y Corp there
9780133354348_Book 1.indb 139780133354348_Book 1.indb 13 11/21/13 3:05 PM11/21/13 3:05 PM

14 RULE BASED INVESTING
is a 95% probability of the stock price moving between -30% and 40%. Granted, this assumes a normal distribution, but in reality the neat statistical principles of standard deviation are insufficient as a measure of risk, particularly for strategies with embedded tail risks (meaning when extreme events occur, it causes a disproportionately large effect in returns).
With this basic understanding, let’s assume the market implies that X Corp is going to be moving an average of 10% over the next year, so implied volatility is 10%. Your research and forecast is that actual volatility will be much lower than 10%. You go “short” volatil-ity, meaning you receive the implied volatility of 10% and will pay the realized volatility, whatever it may be. In effect, you have sold an insurance policy to people afraid of volatility over 10% occurring. If indeed it turns out that X Corp moves less than 10%, you profit. Just as the value of a stock can be researched and an investment made on whether it should increase or decrease, you can form a market view on volatility alone, separate from the direction of the price, either through qualitative assessments or quantitative models.
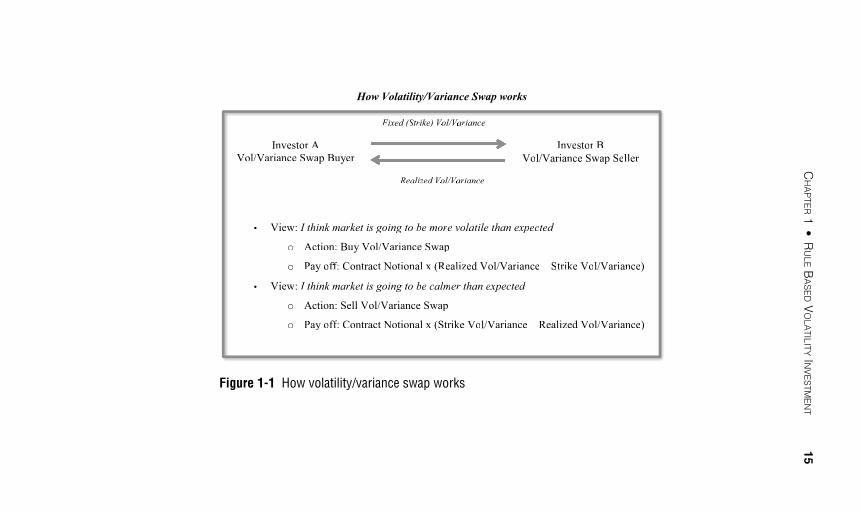
To use an example from the currency markets, suppose that the market is pricing that over the next year, the exchange rate of U.S. Dollar against Japanese Yen, USDJPY, has a volatility of 30% (its his-torical average being 15%). In contrast, your view is that the market is going to be calmer. You therefore enter a contract in which, at the end of the year, you will pay a notional value of $1,000 multiplied by the upcoming actual volatility. In return you will receive a notional value of $1,000 times the fixed volatility of 30%. At the end of the year, if actual volatility was 20%, your profit is calculated by multi-plying your net 10 volatility points by $1000 each, which is $10,000 (minus transaction costs)!
Figure 1-1 illustrates how a volatility swap contract works. The same mechanism applies to a variance swap, variance being the square of volatility.
9780133354348_Book 1.indb 149780133354348_Book 1.indb 14 11/21/13 3:05 PM11/21/13 3:05 PM
C
HA
PTE
R 1
• R
ULE B
AS
ED V
OLA
TIL
ITY IN
VE
STM
EN
T 15
How Volatility/Variance Swap works
• View: I think market is going to be more volatile than expected
o Action: Buy Vol/Variance Swap
o Pay off: Contract Notional x (Realized Vol/Variance – Strike Vol/Variance)
• View: I think market is going to be calmer than expected
o Action: Sell Vol/Variance Swap
o Pay off: Contract Notional x (Strike Vol/Variance – Realized Vol/Variance)
Fixed (Strike) Vol/Variance
Realized Vol/Variance
Investor B
Vol/Variance Swap Seller
Investor A
Vol/Variance Swap Buyer
• View: I think markrr ekk t is goii ing to be more volall tile than expx ected
o Action: Buy Vol/Variance Swapaa
o Pay oy ffff :ff Contract Notional x (Realized Vol/Variance – Strike Vol/Variance)
• View: I think markrr ekk t is goii ing to be calmll er than exee px ected
o Action: Sell Vol/Variance Swapaa
o Pay oy ffff :ff Contract Notional x (Strike Vol/Variance – Realized Vol/Variance)
FiFF xeii d (S(( trtt ike)e VoVV l/VaVV riance
Realizii ed VoVV l/VaVV riance
Investor Br
Vol/Variance Swapaa Seller
Investor Ar
Vol/Variance Swapaa Buyer
Figure 1-1 How volatility/variance swap works
9780133354348_Book 1.indb 15
9780133354348_Book 1.indb 15
11/21/13 3:05 PM
11/21/13 3:05 PM

16 RULE BASED INVESTING
It is also important to clarify what people in finance mean when they discuss volatility. If an investment strategy involves the term vol , the first thing to clarify is whether it is one of the following:
• Historical volatility: This is the standard deviation of past rate of returns, taken from price history and which often serves as an “estimate” of the unobserved actual volatility.
• Actual volatility: This is the volatility you want to forecast at a future time.
• Implied volatility: Simply speaking, this is the volatility implied by the options market. The price of an option depends on strike, tenor, vol, and others. If strike and tenor and oth-ers are fixed, you can derive the vol number directly from the option price.
From this point forward in this book, the term volatility in the various contexts will be abbreviated vol.
To explain a bit further, you can take the stock price history of Apple over the past decade to the present day and run a statistical analysis that will reveal its historical volatility. Past performance is no guarantee of future returns, so trading on historical volatility alone is like driving a car looking only through the rearview mirror. At the same time, however, historical volatility is valid information and use-ful as a basic guideline against which you can compare a forecast. If a forecast of actual vol is radically different from historical vol, it’s important to pause and consider why that is and how it is justified.
Implied volatility, in contrast, is merely a price, a snapshot of mar-ket expectation of actual volatility at a particular moment. The day before an earnings report for a major corporation, the implied volatil-ity reflects market expectation of volatility for the coming month. Low
9780133354348_Book 1.indb 169780133354348_Book 1.indb 16 11/21/13 3:05 PM11/21/13 3:05 PM

CHAPTER 1 • RULE BASED VOLATILITY INVESTMENT 17
implied volatility may reflect market confidence that results will be in line with expectations. After the results are public, the implied vola-tility may be completely different. If results were much worse than expected, implied volatility will likely increase because of the “shock” of the results and the readjustment of expectations. Also if results were better than expected, implied volatility will again likely increase because of the surprise.
Actual volatility is what we are truly trying to determine, and forecasting models, although far from perfect, have become increas-ingly indispensible tools in trying to make sense from chaos. Just as investors forecast foreign exchange rates to capture superior carry, statistical methods have been developed over the past three decades to forecast actual volatility. Institutional investors have become more and more comfortable with the vol/variance investments partly because of the academic contribution in vol/variance research. Robert Engle won the Nobel prize in 2003 for his seminal work in volatility modeling and forecasting. It has educated a generation of “quants,” myself included, who use the body of research to improve and apply forecasts of volatility to risk management and active investment.
Investing in Volatility Through Rules
Prior to the 2008 financial crisis, investment advice came down to building a diversified portfolio of stocks, bonds, currencies, notes, and other instruments. By spreading out the risk, even if one asset underperformed, the rest would compensate for the loss and produce a modest long-term gain. In the wake of the 2008 turmoil, achieving diversification has been challenging because “safe” assets, such as sov-ereign bonds, yield historically low returns. At the same time, “risky” assets, such as currencies, commodities, and credit, have become
9780133354348_Book 1.indb 179780133354348_Book 1.indb 17 11/21/13 3:05 PM11/21/13 3:05 PM

18 RULE BASED INVESTING
increasingly correlated, which has reduced the diversification. So you can either safely house funds in treasuries at near-zero returns, or if you invest in riskier assets, you risk another market crisis that could cause everything to crash together and at once.
Volatility is its own asset class, and just as in credit or equity markets, investors can expect to profit from taking risks in volatility premium, the difference between implied and realized volatility. An appealing characteristic of adding volatility investing to the portfo-lio is that it has low correlation with traditional asset classes, such as equity or bonds. Volatility, after all, exists independently of the mar-ket going up or down; it only matters that it’s moving. After a major market crisis, volatility tends to be the best performing asset class. The recent history of the Lehman bankruptcy in 2008 and the Greek/European debt crises in 2010 has shown that immediately after the crises, while the economy is growing slowly, volatility outperforms. As discussed earlier in the case of flood insurance, it is right after the storm when insurance premiums are at their highest and the oppor-tunity is greatest.
During market turmoil, however, all risky assets are highly cor-related to the extreme. Strategies of receiving volatility premiums are no exception. That is why investing in the volatility premium through a disciplined rule based system is particularly important. The rules guide you whether to enter the trade or stay out, removing the temp-tation of investing on emotion and avoiding greed as well as fear. Without rules, the investor can be swept into the panic when the cri-sis event hits and likely will exit at a deep loss. Stung by the emotional and psychological toll of heavy losses, the typical reaction is to stand on the sidelines and lick your wounds, afraid of re-entering a turbu-lent market, when this is precisely the time you should be increasing your investment in the volatility premium.
9780133354348_Book 1.indb 189780133354348_Book 1.indb 18 11/21/13 3:05 PM11/21/13 3:05 PM

CHAPTER 1 • RULE BASED VOLATILITY INVESTMENT 19
The systematic rules introduced in this chapter employ simple sta-tistics and market indicators. Statistics are by nature backward- looking because they are derived from historical data. Market indicators are derived from current market prices, which typically incorporate forward-looking components. The best results are achieved by com-bining both forward- and backward-looking approaches. Examples 1, 2, and 3 in this chapter provide a walk-through on how to construct simple yet effective rules in three markets: foreign exchange, equity indices, and rates.
After successfully constructing these three volatility strategies for three different markets, the next step is to build a volatility invest-ment portfolio. This portfolio has an attractive risk-reward profile and low correlations with other risky asset classes, which is vital to diversification. What you actively work to establish is a benchmark of performance that fund managers or financial instruments involving volatility premium must outperform in order to justify fees imposed on investors.
Profiting from Volatility and Awareness of the Danger
For an investor, the first question to ask before investing in any strategy should always be, “Why will this strategy make money?” fol-lowed by, “And why hasn’t the profit been traded away yet?” In the case of investing in the volatility premium, the strategy is profitable because the persistent return is a justified reward for bearing risk.
Playing the lottery, for example, exhibits a negative return in the long run. Even if you were to win $100 million, if the winnings were reinvested, you would eventually go broke. A dollar invested in the lottery is taxed by the government and pays the overhead of the lottery board, so despite the infrequent jackpot, returns are always
9780133354348_Book 1.indb 199780133354348_Book 1.indb 19 11/21/13 3:05 PM11/21/13 3:05 PM

20 RULE BASED INVESTING
negative. That is why the lottery is a horrible investment. If insurance were nationalized by the government and an exchange created in such a way that payouts precisely match premiums received, this would be an example of a return of zero. In the long run you neither make nor lose money. In the case of the volatility premium, just as is the case of a privatized insurance company, return is greater than zero because in the long term, you profit despite occasional market shocks.
You don’t need to search very hard to see evidence of the persis-tent return of the volatility premium in the market. The risk premium is very real, and you need only look at the difference between the actual versus options market implied volatility of USDJPY one-month contracts. From January 2001 to July 2013, on the average, the market was paying 0.8% (or 0.8 volatility points) per day over what was actu-ally realized. Out of more than 3,000 days, implied volatility was 67% of the time higher than realized volatility.
Realistically, it is hard to enter a volatility swap contract on a daily basis because, during market turmoil, volatility investments incur sharp losses. There would be liquidity constraints, higher bid/offer spread, and capital requirements. Over the long run, however, implied volatility is significantly higher than realized volatility for most markets, including stock and rates. Figures 1-2 , 1-3, and 1-4 illustrate implied volatility versus actual volatility and the difference for FX, stock, and rates markets, to which we have applied investment rules. The discussion that follows demonstrates how rule based vola-tility strategies for these three markets are viable investments.
9780133354348_Book 1.indb 209780133354348_Book 1.indb 20 11/21/13 3:05 PM11/21/13 3:05 PM

C
HA
PTE
R 1
• R
ULE B
AS
ED V
OLA
TIL
ITY IN
VE
STM
EN
T 21
-20
-15
-10
-5
0
5
10
15
20
0
5
10
15
20
25
30
35
40Vol Premium Realized Vol Implied Vol
Figure 1-2 One-month USDJPY volatilities in % (volatility premium on the right axis)
9780133354348_Book 1.indb 21
9780133354348_Book 1.indb 21
11/21/13 3:05 PM
11/21/13 3:05 PM

22
RU
LE B
AS
ED IN
VE
STIN
G
0
10
20
30
40
50
60
70
80
90
100
-50
-40
-30
-20
-10
0
10
20
30
40
50Vol Premium Realized Vol Implied Vol
Figure 1-3 One-month S&P 500 volatilities in % (volatility premium on the right axis)
9780133354348_Book 1.indb 22
9780133354348_Book 1.indb 22
11/21/13 3:05 PM
11/21/13 3:05 PM

C
HA
PTE
R 1
• R
ULE B
AS
ED V
OLA
TIL
ITY IN
VE
STM
EN
T 23
0
10
20
30
40
50
60
70
80
90
100
-50
-40
-30
-20
-10
0
10
20
30
40
50Vol Premium Realized Vol 1M Implied Vol
Figure 1-4 One-month log normal volatilities for U.S. 10-year swap rate, in % (volatility premium on the right axis)
9780133354348_Book 1.indb 23
9780133354348_Book 1.indb 23
11/21/13 3:05 PM
11/21/13 3:05 PM

24 RULE BASED INVESTING
In viewing these charts, realize that all the shaded area above the x- axis at the center of the graph represents profiting from the volatil-ity premium. Only when there are the occasional dips below the x-axis is the volatility premium a losing investment. The overwhelming positive bias is a visual representation of what is meant by persistent return . The study by PIMCO’s Rennison and Pedersen, covering 28 years of history for 14 volatility markets, including equities, commodi-ties, currencies, and interest rates, showed strong evidence of vola-tility premium with magnitude ranging from 0.9% in currencies to 4.4% in commodity futures.1 In particular, the study tested a monthly selling straddle strategy for these 14 markets and achieved annual-ized returns varying from 1.2% for currencies to 6.1% for commodity futures, with the Sharpe ratio ranging from 0.7 for currencies to 1.2 for U.S. rates and commodity futures. 2 The Sharpe ratio is a measure of the risk premium of an asset, meaning that between two assets with equal return, the one with a greater Sharpe required less risk to gen-erate the same results and hence is the smarter investment.
The next question to ask is that if the volatility premium is real and exists, why hasn’t the premium been traded away? After all, if we could buy apples for a dollar in France and sell them for ten dollars in Spain (assuming no tariffs and other restrictions), we would expect arbitrageurs to quickly exploit this price difference until it was erased. Why hasn’t this occurred with the volatility premium? The reason is that the persistence of positive vol premiums, where the implied vol is consistently higher on average than actual realized vol, is not
1 Rennison, Graham and Niels Pedersen, “The Volatility Risk Premium,” PIMCO Viewpoint (September 2012) .
2 More precisely, according to Pimco’s study, the average risk premium is 0.9%, 2.2%, 2.9%, and 4.4% for currencies, equity indices, 10-year interest rate swap-tions, and commodity futures, respectively. Sharpe ratios are 0.7, 1.0, 1.2, and 1.2 for currencies, equity indices, 10-year interest rate swaptions, and commodity futures, respectively.
9780133354348_Book 1.indb 249780133354348_Book 1.indb 24 11/21/13 3:05 PM11/21/13 3:05 PM

CHAPTER 1 • RULE BASED VOLATILITY INVESTMENT 25
a market failure of mispricing; therefore, it cannot be argued that it should be traded away over time. The volatility premium will always exist because it is a natural by-product of a fundamental market force, which is an aversion to uncertainty.
The fear of uncertainty is as fundamental an economic princi-ple as the time value of money. Economics undergraduates across the world are familiar with the question of whether a dollar today is worth as much as a dollar tomorrow. For multiple economic reasons, a dollar today is worth more. A dollar received today can be invested and generate interest overnight so that investment grows beyond a dollar. Also, there is the concern of inflation; a dollar tomorrow may have less buying power than a dollar today. What isn’t discussed as often is the credit risk: Even if the dollar you received tomorrow was inflation-hedged and accrued the same interest as a dollar invested, despite these assurances, a dollar today is still worth more. The reason is uncertainty. All things being equal, a dollar today is guaranteed. A dollar tomorrow may seem likely and highly probable, but there could be a natural disaster, an accident, deceit, or some other catastrophe that foils our best-laid plans. The shrewd investor knows to expect the unexpected.
Volatility investors are compensated for providing protection against market turmoil in the same way that in fixed income there is a “term premium” for longer dated bonds to compensate for the uncertainty of future inflation and economic growth. What the volatil-ity premium comes down to is receiving the “insurance premium” and paying back the actual realization, which in the long term is certain to be as naturally profitable a venture as selling insurance. If a disaster occurs, however, volatility spikes up, and the investment incurs losses.
The insurance company has a great business model in which it receives regular premiums that exceed the actual risk of losses. Never-theless, losses will occur, and it will be painful when they do. Receiving
9780133354348_Book 1.indb 259780133354348_Book 1.indb 25 11/21/13 3:05 PM11/21/13 3:05 PM

26 RULE BASED INVESTING
implied volatility while paying actual volatility is like writing an option in which big losses are suffered when a crisis event occurs. In Octo-ber of 2008, the simple strategy of receiving S&P 500 volatility pre-mium lost more than 48% of the investment. Every investment that promises attractive returns carries a risk of significant losses, whether it is stock, bonds, currencies, or commodities. Or to put it another way, when rare events happen, long volatility premium suffers losses that are disproportionately large. Fortunately, however, the volatility premium strategies tend to recover quickly, more so than other asset classes, because it is precisely in the immediate aftermath of a crisis event when the volatility premium is richest. Insurance companies lose heavily when there are wildfires in the western United States that destroy hundreds of homes. However, they immediately started to recover those losses by the influx of new policy holders willing to pay the high premiums to protect them should they suffer the same fate as their neighbors. What it comes down to is that you want to invest in good risk and avoid the bad. Rule based investment strategies are how you will invest intelligently and avoid the bad risk brought on by emotion and greed.
The Examples of Rule Based Vol Investments
This section demonstrates simple rules to improve the perfor-mance of the naïve strategy of receiving volatility premium (“naïve” here means a simple “buy-and-hold” strategy) by using three examples from three markets: USDJPY from foreign exchange, S&P 500 from equity, and the U.S. 10-year swap rate from the interest rates market. Of the strategies developed, a common aspect of those rules applied to all volatility investment is to employ both statistical and market price implied indicators to dictate when not to invest in volatility pre-mium. Statistical indicators involve information drawn from historical price data and hence are necessarily backward-looking. The universal disclaimer common to investment materials that “past performance is
9780133354348_Book 1.indb 269780133354348_Book 1.indb 26 11/21/13 3:05 PM11/21/13 3:05 PM

CHAPTER 1 • RULE BASED VOLATILITY INVESTMENT 27
no guarantee of future return” is not entirely true because past per-formance does have inherent value. To completely ignore it discards relevant information. In contrast, market indicators are taken from real-time prices and are a snapshot of the market’s expectation—and thus by nature are forward-looking indicators. By using these prin-ciples in conjunction, the final result is greater than the sum of its parts, as is shown in the following sections. Best of all is that by doing so you avoid the greed and reduce the sharp drawdown from major losses the occasional market crisis causes. When the rules indicate you should invest, especially immediately after a crisis, you follow the rules and not emotions, which might be to run and hide.
Example 1: Rule Based USDJPY Volatility Strategy
The task is to employ simple rules using common sense to out-perform the naïve strategy that passively receives volatility premium. The naïve volatility strategy is defined as follows 3 : Every month, you invest the same amount of capital in USDJPY one-month volatility swap. The volatility swap obligates you at the end of the month to pay the realized volatility and receive a predetermined strike whose level is closely associated with one month at-the-money implied volatility. (An option is at-the-money if the strike price is the same as the cur-rent spot price.) In other words, the naïve strategy is to just “buy-and-hold” vol premium month after month, no matter what happens, like an automaton.
USDJPY is the first example for volatility investing because USD-JPY is among the most liquid in Foreign Exchange (FX) markets, as are its derivatives. According to the Bank of International Settle-ment’s survey, 4 the FX market has deep liquidity with a daily turnover
4 Bank for International Settlements, Triennial Central Bank Survey of Foreign Exchange and Derivatives Market Activity: 2001, 2004, 2007, and 2010.
3 You can also sell a one-month at-the-month straddle and delta hedge it every day to receive volatility premium.
9780133354348_Book 1.indb 279780133354348_Book 1.indb 27 11/21/13 3:05 PM11/21/13 3:05 PM
28 RULE BASED INVESTING
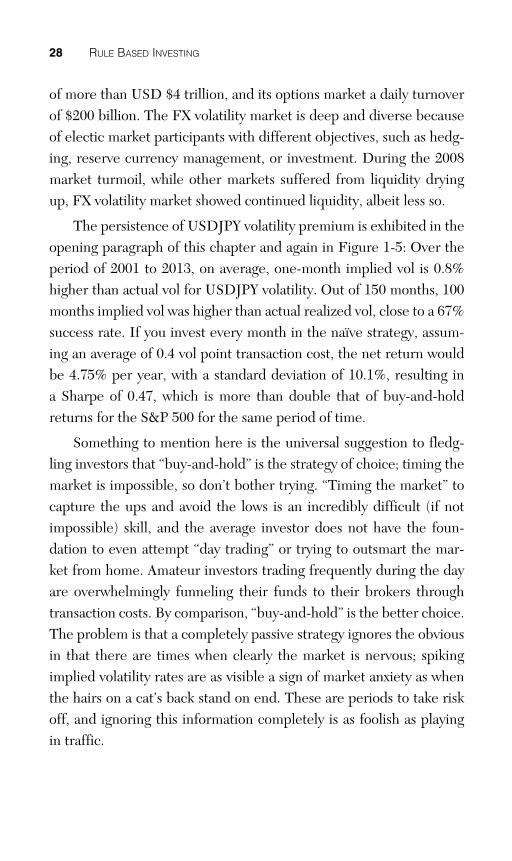
of more than USD $4 trillion, and its options market a daily turnover of $200 billion. The FX volatility market is deep and diverse because of electic market participants with different objectives, such as hedg-ing, reserve currency management, or investment. During the 2008 market turmoil, while other markets suffered from liquidity drying up, FX volatility market showed continued liquidity, albeit less so.
The persistence of USDJPY volatility premium is exhibited in the opening paragraph of this chapter and again in Figure 1-5 : Over the period of 2001 to 2013, on average, one-month implied vol is 0.8% higher than actual vol for USDJPY volatility. Out of 150 months, 100 months implied vol was higher than actual realized vol, close to a 67% success rate. If you invest every month in the naïve strategy, assum-ing an average of 0.4 vol point transaction cost, the net return would be 4.75% per year, with a standard deviation of 10.1%, resulting in a Sharpe of 0.47, which is more than double that of buy-and-hold returns for the S&P 500 for the same period of time.
Something to mention here is the universal suggestion to fledg-ling investors that “buy-and-hold” is the strategy of choice; timing the market is impossible, so don’t bother trying. “Timing the market” to capture the ups and avoid the lows is an incredibly difficult (if not impossible) skill, and the average investor does not have the foun-dation to even attempt “day trading” or trying to outsmart the mar-ket from home. Amateur investors trading frequently during the day are overwhelmingly funneling their funds to their brokers through transaction costs. By comparison, “buy-and-hold” is the better choice. The problem is that a completely passive strategy ignores the obvious in that there are times when clearly the market is nervous; spiking implied volatility rates are as visible a sign of market anxiety as when the hairs on a cat’s back stand on end. These are periods to take risk off, and ignoring this information completely is as foolish as playing in traffic.
9780133354348_Book 1.indb 289780133354348_Book 1.indb 28 11/21/13 3:05 PM11/21/13 3:05 PM

C
HA
PTE
R 1
• R
ULE B
AS
ED V
OLA
TIL
ITY IN
VE
STM
EN
T 29
-
10
5
-
15
20
25
30
35
40
-15
-10
-5
0
5
10
15
Vol Premium Realized Vol Implied Vol
Figure 1-5 One-month USDJPY volatilities in %, monthly data (volatility premium on the right axis, after transaction cost)
9780133354348_Book 1.indb 29
9780133354348_Book 1.indb 29
11/21/13 3:05 PM
11/21/13 3:05 PM

30 RULE BASED INVESTING
As described previously, however, the naïve, long vol premium buy-and-hold strategy suffers large losses occasionally. For example, at the height of the financial crises in 2008, the naïve strategy would have suffered a loss of more than 14% in September. The key is to introduce simple indicators to alert yourself when turbulence threat-ens and avoid taking bad risk. There are endless ways of improving the naïve strategy. Especially when using the historical data available, it is tempting to impose rules that seem to maximize the historical performance. The danger here is getting lost in the alchemy of “data mining.” Data mining involves pouring over historical prices to dis-cover “gold” in the sense of a strategy that perfectly maximizes his-torical returns and hence should maximize future returns, however flawed this thinking. By imposing sufficient arbitrary rules and tweak-ing enough parameters, extraordinary returns are produced from his-torical data (granted these are theoretical profits). The flaw in this practice is that rules that produce magic returns from historical data seldom repeat their success with future price data. It is an easy trap to fall into. There is important information to be gained from historical prices, and simple rules based on broad patterns such as price volatil-ity are helpful in creating a broad strategy, but as the rules become increasingly byzantine and specific in an effort to wring a perfect return from the historical data, the result is a “fool’s gold” theory that fails in practice as new prices quickly display their own unique charac-teristics. Data mining exhibits diminishing returns the more elaborate the rules and patterns applied, and yet practitioners of these methods often blame their failing on their models not being complex enough. What we need are rules that make sense and are without too many parameters, so we avoid the temptation of data mining.
Two simple filters can be applied: The first filter is statistical and backward-looking, which uses USDJPY’s own history to draw an intel-ligent inference about its future. The second is forward-looking and derived from the most recent, traded market prices that contain vital information about financial market sentiment.
9780133354348_Book 1.indb 309780133354348_Book 1.indb 30 11/21/13 3:05 PM11/21/13 3:05 PM

CHAPTER 1 • RULE BASED VOLATILITY INVESTMENT 31
Learning from History: GARCH Filter
A perfect forecast of upcoming actual volatility does not exist; otherwise this would be a very short book. A good statistical model can, however, help you build a sound forecast. By default many would use a rolling window standard deviation of daily returns as the fore-cast. Also popular is an exponential moving average of squared daily returns. These two proxies are easy to implement and are widely used by traders, analysts, and the like to get the first proxy of actual volatil-ity. With the availability of intra-day data however, it is possible to just sum up high frequency return squares, which is itself a valid proxy for actual volatility (see, for example, Bollerslev and Andersen in the Bib-liography). Figure 1-6 shows one-month historical volatility of USD-JPY from July 29 to August 13, 2013, computed using tick-by-tick data compared with using only one data point a day. The difference can often be substantial.
If high frequency data is not easy to obtain though, the next best thing you can do is use GARCH to measure and forecast actual vola-tility. GARCH 5 stands for Generalized Autoregressive Conditional Heteroskedasticity. As the name suggests, it is rather technical, and a detailed description can be found on various websites such as NYU’s V-Lab. 6 Simply speaking, it says: Volatility is time varying, meaning it changes over time from times of calm to times of anxiety, and peri-ods of different volatility tend to cluster together, which any good forecasting model should incorporate. GARCH is a simple, elegant statistical model that incorporates all these observed properties.
5 Robert Engle first introduced models with time-varying volatility (ARCH) in his 1982 seminal paper “Autoregressive Heteroscedasticity with Estimate of the Variance of United Kingdom Inflation,” Econometrica 50 (4), page 987-1008. Tim Bollerslev generalized it to GARCH in his 1986 paper, “Generalized Autoregressive Conditional Heteroskedasticity,” Journal of Econometrics, pages 307-327.
6 http://vlab.stern.nyu.edu .
9780133354348_Book 1.indb 319780133354348_Book 1.indb 31 11/21/13 3:05 PM11/21/13 3:05 PM

32
RU
LE B
AS
ED IN
VE
STIN
G
11.5
12.0
12.5
13.0
13.5
14.0
Daily Close to Close Tick Data
Figure 1-6 USDJPY one-month historical volatilities in % (daily close data versus tick-by-tick data)
Data Source: Bloomberg
9780133354348_Book 1.indb 32
9780133354348_Book 1.indb 32
11/21/13 3:05 PM
11/21/13 3:05 PM

CHAPTER 1 • RULE BASED VOLATILITY INVESTMENT 33
Financial markets tend to behave anxiously in response to disrup-tive events such as wars, natural disasters, or market crises. During these crisis periods, volatility tends to be much higher than it typi-cally is as prices sharply fluctuate. This means that the volatility of the financial markets is not constant over time. Times of calm are gener-ally followed by calm; volatile days are followed by volatile days in a cluster. The term heteroskedasticity means a non-constant variance, such as that displayed by the markets, whereas homoscedasticity is a constant variance.
The assumption of constant variance is not valid to the behavior of financial markets.
As has been mentioned, the variance of stock prices during crisis times is very different than the variance of stock prices during times of calm. A more sophisticated model would have to reflect that behavior. Also, dependencies in the data would have to be taken into account. Clustering is observed because if today’s stock price is extreme, it is likely tomorrow’s price will be extreme as well. Also, these events display mean reversion, meaning that in weeks or months, an anxious market will eventually calm back down and return to its typical long-term behavior.
So GARCH in the end can be thought of as a simple yet sophisti-cated way to describe the volatility process. It is seen as sophisticated because, rather than weigh events from yesterday and events from last month equally, recent events are given greater weight through an exponentially weighted moving average. And the model also rec-ognizes that financial markets display mean reversion. There are
9780133354348_Book 1.indb 339780133354348_Book 1.indb 33 11/21/13 3:05 PM11/21/13 3:05 PM

34 RULE BASED INVESTING
countless varieties of GARCH models, and for our purposes the sim-plest case of GARCH (1,1) will suffice. In GARCH (1,1), today’s vari-ance depends on yesterday’s variance, the first “1”, and yesterday’s shock (in squares), the second “1”.
Figure 1-7 shows GARCH (1,1) 7 predicted volatility against observed realized (measured using close-to-close returns), both with one-month tenor. As you can see, GARCH mimics the up and downs of realized vol well, with some lags due to its backward-looking char-acteristic. The model relies on historical data only, so necessarily mar-ket events must occur (and be read as data) before the model can respond.
Armed with a decent measure of actual volatility, the “sophisti-cated average” GARCH provides, you can now apply the first filter to the naïve vol premium strategy. Every month, you enter a volatility swap contract with one-month tenor in fixed amount of capital. The contract obligates you to receive a pre-determined strike level closely associated to the one-month at-the-money implied USDJPY volatil-ity and pay upcoming realized volatility. If GARCH predicts upcom-ing high volatility, it indicates that recent market has experienced an unexpected large move. Something is happening behind the scenes that’s raising anxiety. If GARCH predicts a higher move, 8 you don’t take the risk of paying upcoming actual vol in the coming month. You stay on the sideline.
7 GARCH(1,1) is the simplest model among the GARCH families. It uses only four parameters to describe the dynamics of return and its volatility.
8 More specifically, if the difference between implied volatility and GARCH pre-dicted actual volatility does not exceed a threshold, you will not take the risk of shorting volatility.
9780133354348_Book 1.indb 349780133354348_Book 1.indb 34 11/21/13 3:05 PM11/21/13 3:05 PM

C
HA
PTE
R 1
• R
ULE B
AS
ED V
OLA
TIL
ITY IN
VE
STM
EN
T 35
0
5
10
15
20
25
30
35Realized Vol GARCH
Figure 1-7 GARCH predicted one-month volatilities for USDJPY, in %, annualized
9780133354348_Book 1.indb 35
9780133354348_Book 1.indb 35
11/21/13 3:05 PM
11/21/13 3:05 PM
36 RULE BASED INVESTING
Table 1-1 compares the result of vol investing with and without the GARCH filter. From January 2001 to June 2013, imposing the GARCH filter would achieve a similar level of return as the naïve strategy, which is annualized 4.74%. Standard deviation, however, is reduced from 10.1% to 8%, hence the Sharpe ratio increases from 0.47 to 0.59. In particular, the largest one-month loss of 14.7%, which occurred in September 2008, is avoided by the GARCH filter. Out of 150 months from January 2001 to June 2013, the GARCH filter switched off a total of 40 months to avoid taking risk in USDJPY vol premium. All these results assume a 0.4% transaction cost (that is, you pay 0.4% per month), which is a conservative assumption.
Learning from the Market: VIX Filter
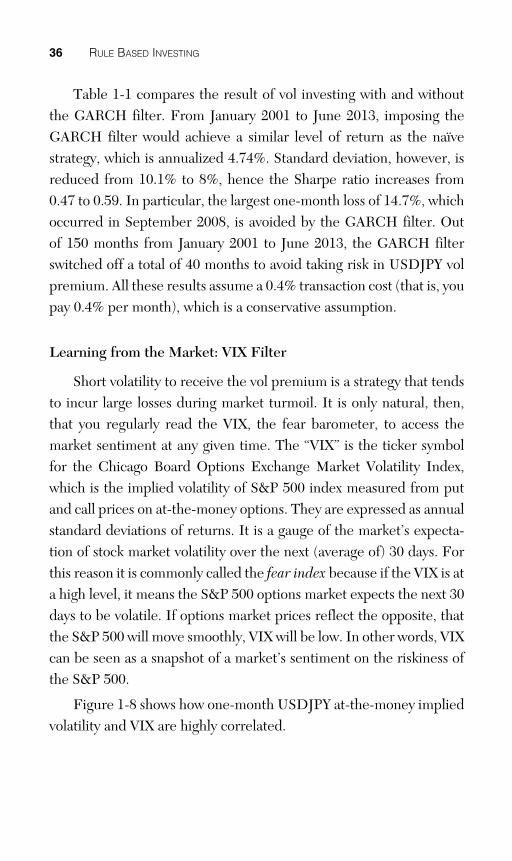
Short volatility to receive the vol premium is a strategy that tends to incur large losses during market turmoil. It is only natural, then, that you regularly read the VIX, the fear barometer, to access the market sentiment at any given time. The “VIX” is the ticker symbol for the Chicago Board Options Exchange Market Volatility Index, which is the implied volatility of S&P 500 index measured from put and call prices on at-the-money options. They are expressed as annual standard deviations of returns. It is a gauge of the market’s expecta-tion of stock market volatility over the next (average of) 30 days. For this reason it is commonly called the fear index because if the VIX is at a high level, it means the S&P 500 options market expects the next 30 days to be volatile. If options market prices reflect the opposite, that the S&P 500 will move smoothly, VIX will be low. In other words, VIX can be seen as a snapshot of a market’s sentiment on the riskiness of the S&P 500.
Figure 1-8 shows how one-month USDJPY at-the-money implied volatility and VIX are highly correlated.
9780133354348_Book 1.indb 369780133354348_Book 1.indb 36 11/21/13 3:05 PM11/21/13 3:05 PM

C
HA
PTE
R 1
• R
ULE B
AS
ED V
OLA
TIL
ITY IN
VE
STM
EN
T 37
Table 1-1 Performance Statistics of USDJPY One-Month Volatility Premium Investment (Naïve Strategy vs. GARCH Filter, January 2001–June 2013)
Average Annualized Return in %
Annualized Standard Deviation of Return in %
Maximal One Month Loss In % Sharpe Ratio
Naïve GARCH Filter
Naïve GARCH Filter
Naïve GARCH Filter
Naïve GARCH Filter
2001 9.87 9.00 6.35 2.62 -1.67 0.18 1.55 3.43
2002 -4.52 -5.70 8.32 7.90 -4.48 -4.48 -0.54 -0.72
2003 10.97 8.39 5.00 3.87 -1.35 -1.35 2.20 2.17
2004 -1.00 2.99 5.73 5.12 -3.53 -3.53 -0.17 0.58
2005 -5.90 -1.26 6.62 5.68 -4.31 -4.31 -0.89 -0.22
2006 5.70 7.47 4.47 2.63 -1.41 -0.96 1.27 2.84
2007 -9.83 -8.07 11.45 10.63 -6.57 -6.57 -0.86 -0.76
2008 -2.61 6.06 21.63 10.49 -14.70 -7.63 -0.12 0.58
2009 33.04 30.84 7.47 8.01 -0.45 -0.03 4.42 3.85
2010 11.54 4.65 12.09 11.08 -8.28 -8.28 0.95 0.42
2011 18.84 13.84 9.52 9.57 -3.30 -3.30 1.98 1.45
2012–2013 -15.88 -18.10 9.24 9.17 -6.93 -6.93 -1.72 -1.97
Total 4.75 4.74 10.14 8.04 -14.70 -8.28 0.47 0.59
Source: Bloomberg
9780133354348_Book 1.indb 37
9780133354348_Book 1.indb 37
11/21/13 3:05 PM
11/21/13 3:05 PM
38
RU
LE B
AS
ED IN
VE
STIN
G
0
10
20
30
40
50
60
70
80
90
0
5
10
15
20
25
30
35
40
45VIX USDJPY 1M Implied Vol
Figure 1-8 USDJPY one-month implied volatility (left axis) versus VIX (right axis)
9780133354348_Book 1.indb 38
9780133354348_Book 1.indb 38
11/21/13 3:05 PM
11/21/13 3:05 PM

CHAPTER 1 • RULE BASED VOLATILITY INVESTMENT 39
The VIX filter, the second rule, is constructed in the following simple fashion: If yesterday’s VIX closed higher than its own one-month average, you want to stay away from taking on risk in receiving vol premium. When the water is choppy, don’t go out swimming. This simple yet intuitive filter helps us to boost average annual returns up from 4.75% to 5.64%; standard deviation is reduced from 10.1% to 6.9%. Although 2008 would have been one of the worst years for the naïve strategy with a 14.7% loss, the simple VIX filter would have nearly cut the loss in half down to 7.6%. Furthermore, Sharpe is increased from 0.47 to 0.82, indicating a superior return for the risk taken. Year to year performance breakdown is recorded in Table 1-2 .
Are there other ways to construct a global risk indicator other than the VIX filter? The answer is yes. For example, the bid-ask spread is a good proxy for the liquidity of a market. Often market liquidity is directly linked to the magnitude of the bid-offer spread. If the bid-ask spread is larger than usual, this indicates market makers are nervous; willingness to provide liquidity has fallen. In this case, a simple rule based strategy should avoid any short vol (selling insurance) strategy from taking on risk. Another market barometer closely watched by professional investors is the TED Spread. The TED Spread is the dif-ference between three-month LIBOR and T-bill rate. To elaborate, LIBOR is the overnight lending rate banks offer one another, and the T-bill rate is U.S. Treasury bill rate. Typically LIBOR rates and U.S. Treasuries should track closely together, with Treasuries seen as more secure at a lower rate. When LIBOR rates are just slightly above U.S. Treasuries, the spread is “tight,” which means banks see loaning to each other as being almost as safe as U.S. Treasuries. When the spread widens, it indicates banks view lending to each other as less secure and more risky. High LIBOR rates and a high TED Spread often indicate problems in the banking system and global liquidity.
9780133354348_Book 1.indb 399780133354348_Book 1.indb 39 11/21/13 3:05 PM11/21/13 3:05 PM

40
RU
LE B
AS
ED IN
VE
STIN
G Table 1-2 Performance Statistics of USDJPY One-Month Volatility Premium Investment (Naïve Strategy vs. VIX Filter, January 2001–June 2013)
Average Annualized Return in %
Annualized Standard Deviation of Return in %
Maximal One Month Loss In % Sharpe Ratio
Naïve VIX Filter Naïve VIX Filter Naïve VIX Filter Naïve VIX Filter
2001 9.87 8.08 6.35 3.67 -1.67 -0.79 1.55 2.20
2002 -4.52 0.32 8.32 7.39 -4.48 -4.48 -0.54 0.04
2003 10.97 6.00 5.00 3.98 -1.35 -1.35 2.20 1.51
2004 -1.00 0.82 5.73 3.36 -3.53 -1.72 -0.17 0.24
2005 -5.90 -4.56 6.62 6.41 -4.31 -4.31 -0.89 -0.71
2006 5.70 2.53 4.47 3.82 -1.41 -1.41 1.27 0.66
2007 -9.83 8.60 11.45 6.81 -6.57 -4.29 -0.86 1.26
2008 -2.61 7.20 21.63 14.47 -14.70 -7.63 -0.12 0.50
2009 33.04 19.54 7.47 7.07 -0.45 -0.45 4.42 2.76
2010 11.54 4.49 12.09 2.65 -8.28 0.02 0.95 1.69
2011 18.84 16.08 9.52 7.24 -3.30 -2.04 1.98 2.22
2012–2013 -15.88 -2.09 9.24 7.86 -6.93 -6.93 -1.72 -0.27
Total 4.75 5.64 10.14 6.86 -14.70 -7.63 0.47 0.82
Source: Bloomberg
9780133354348_Book 1.indb 40
9780133354348_Book 1.indb 40
11/21/13 3:05 PM
11/21/13 3:05 PM

CHAPTER 1 • RULE BASED VOLATILITY INVESTMENT 41
Together and Stronger: Applying Both Filters
You can now apply both the GARCH and VIX filters to the naïve vol premium strategy for one-month USDJPY volatility. GARCH serves as a backward-looking filter, which utilizes the past information and tells you about the future average path of actual volatility. VIX is the most basic and widely available fear barometer, which reveals the anxiety level of the market. As recorded in Table 1-3 , by apply-ing both filters, the annualized return is 5.2% compared to the naïve strategy return of 4.8%; standard deviation is reduced closed to half from 10.1% to 5.9%, and a Sharpe ratio increases from 0.47 to 0.88. The rule based USDJPY vol strategy outperforms S&P 500 for the same period from 2001 to 2013, which accumulates an annualized return of 2.8% with a Sharpe ratio of 0.18. Using these simple rules, the results are nearly double the “buy-and-hold” return on the S&P during the same time period, with a better Sharpe (.9 rather than .18).
From January 2001 to June 2013, on a risk/reward basis, the rule based USDJPY volatility strategy outperformed benchmarks of holding passive risky assets such as MSCI world equity index (with a Sharpe of 0.16), and the results are on par with high-yield credit indices such as Barclays Capital’s U.S. Corporate High Yield Index (Sharpe 0.85) and Global High Yield Index 9 (Sharpe 0.9). The perfor-mance comparison is summarized in Figure 1-9 , illustrating cumula-tive returns with normalized volatility to an annualized 10% for all investments. The most desirable property of a rule based USDJPY volatility strategy is that it is not correlated with these risky assets. The correlations of monthly returns between USDJPY volatility strategy and S&P 500, MSCI World Equity, U.S. High Yield, and Global High Yield index are -0.10, 0.08, 0.01 and 0.01, respectively.
9 Barclays Capital Global High Yield Index in USD, return unhedged. For a list of Barclay’s indices, see https://indices.barcap.com/index.dxml .
9780133354348_Book 1.indb 419780133354348_Book 1.indb 41 11/21/13 3:05 PM11/21/13 3:05 PM

42
RU
LE B
AS
ED IN
VE
STIN
G
Table 1-3 Performance Statistics of USDJPY One-Month Volatility Premium Investment (Naïve Strategy vs. Joint Filter, January 2001–June 2013)
Average Annualized Return in %
Annualized Standard Deviation of Return in %
Maximal One Month Loss In % Sharpe Ratio
Naïve Joint Filter Naïve Joint Filter Naïve Joint Filter Naïve Joint Filter
2001 9.87 7.46 6.35 2.36 -1.67 0.18 1.55 3.17
2002 -4.52 0.32 8.32 7.39 -4.48 -4.48 -0.54 0.04
2003 10.97 6.90 5.00 3.75 -1.35 -1.35 2.20 1.84
2004 -1.00 3.08 5.73 2.67 -3.53 -0.79 -0.17 1.15
2005 -5.90 -0.52 6.62 5.32 -4.31 -4.31 -0.89 -0.10
2006 5.70 4.30 4.47 1.59 -1.41 -0.96 1.27 2.71
2007 -9.83 6.62 11.45 6.31 -6.57 -4.29 -0.86 1.05
2008 -2.61 4.24 21.63 10.36 -14.70 -7.63 -0.12 0.41
2009 33.04 17.34 7.47 7.27 -0.45 0.02 4.42 2.38
2010 11.54 2.77 12.09 2.50 -8.28 0.02 0.95 1.11
2011 18.84 13.43 9.52 7.20 -3.30 -2.04 1.98 1.87
2012–2013 -15.88 -3.19 9.24 7.84 -6.93 -6.93 -1.72 -0.41
Total 4.75 5.21 10.14 5.91 -14.70 -7.63 0.47 0.88
Source: Bloomberg
9780133354348_Book 1.indb 42
9780133354348_Book 1.indb 42
11/21/13 3:05 PM
11/21/13 3:05 PM

C
HA
PTE
R 1
• R
ULE B
AS
ED V
OLA
TIL
ITY IN
VE
STM
EN
T 43
Rule Based USDJPYVol, 282
High Yield US, 271
High Yield Global, 287
MSCI World, 115
S&P 500, 119
50
150
250
350
Figure 1-9 Risk-adjusted cumulative returns (volatility = 10%), January 2001–June 2013
9780133354348_Book 1.indb 43
9780133354348_Book 1.indb 43
11/21/13 3:05 PM
11/21/13 3:05 PM

44 RULE BASED INVESTING
Example 2: S&P 500 Volatility
The next example is investing in S&P 500 volatility. To invest in foreign exchange volatility, a volatility swap is the simplest instrument; in the equity markets volatility premium is best captured through a variance swap. Investing in volatility is also possible through selling a one-month at-the-money options straddle and delta hedge until the maturity (short straddle is an option strategy that pays out if prices remain within a certain range, meaning low volatility is expected). Futures on the VIX have become more liquid, and recently ETFs have been created and traded that enable individual investors to access the equity index volatility market. There are more selections and acces-sibility to the volatility market now than there have ever been.
There exists a natural excess of market participants interested in buying protection, such as pensions and 401ks. Pension funds and 401ks are market behemoths that desire safe and steady returns and will pay for market “insurance” to protect from volatility. As men-tioned before, there is a greater number of natural insurance buyers than insurance sellers. This imbalance of high demand and low supply is the driving force behind the persistence of S&P 500 vol premium: Over the period of January 2001–June 2013, on the average, implied vol was 3.7 vol points (about 21%) higher than actual vol for one-month at-the-money volatility. Out of 150 months, for 122 months implied vol was higher than actual realized vol, a success rate of 81%. If you invest every month in a naïve strategy of just receiving and holding volatility premium, assuming you pay an average of 1.5% to do so, the net return would be an annualized 25.7%, with a standard deviation of 26%, a resulting Sharpe close to 1, compared with 0.18 for S&P 500 index itself for the same period of time. Yes that is cor-rect, playing the role of the insurance company and collecting the vol premium for the S&P 500, with a naïve buy-and-hold strategy produced returns of 25.7%. Figure 1-10 illustrates the persistence of positive vol returns:
9780133354348_Book 1.indb 449780133354348_Book 1.indb 44 11/21/13 3:05 PM11/21/13 3:05 PM

C
HA
PTE
R 1
• R
ULE B
AS
ED V
OLA
TIL
ITY IN
VE
STM
EN
T 45
-
10
20
30
40
50
60
70
80
90
100
(50)
(40)
(30)
(20)
(10)
-
10
20
30
40
50Vol Premium VIX Realized Vol
Figure 1-10 One-month S&P 500 volatilities in %, monthly data (vol premium is right axis—after transaction cost)
9780133354348_Book 1.indb 45
9780133354348_Book 1.indb 45
11/21/13 3:05 PM
11/21/13 3:05 PM

46 RULE BASED INVESTING
With this astonishing performance, why improve the simple strat-egy? The angst of all investors is the large negative skewed tail risk, meaning when extreme events occur, the effect is catastrophic. In 2008, the naïve vol strategy of just receiving vol premium and hold-ing blindly, would have lost the investor close to 85%, nearly all of the capital. No institutional investors would have survived this kind of loss without asset under management fleeing away. In 2009 however, the naïve strategy swung back into profitability and returned 82%. So for those investors who suffered the loss in 2008 and subsequently were scared out of the market and stood by the sidelines of vol invest-ing, they would not have had a chance to recover and profit from the rebound of the 2009 market environment. That is why rules are essential, particularly with volatility, which is an emotionally charged market capable of producing great gains and great losses.
Using the two simple filters, the next rules introduced in this chapter aim to “smooth out” the big swings of volatility investing and reduce the impact of crisis events. Again, these filters won’t magically eliminate losses but will soften the blow. By reducing the negative skew, the rule based volatility strategy is likely to survive in the long run and thus produce profit from long-term gains.
Learning from History: GARCH Filter
Again, using the simplest statistical model, GARCH (1,1), you can forecast the actual volatility. Figure 1-11 shows the GARCH pre-dicted realized volatility versus the actual realized volatility. It mimics the up and downs of the actual realized vol rather well, however with some lag due to its backward-looking reliance on statistical data.
9780133354348_Book 1.indb 469780133354348_Book 1.indb 46 11/21/13 3:05 PM11/21/13 3:05 PM

C
HA
PTE
R 1
• R
ULE B
AS
ED V
OLA
TIL
ITY IN
VE
STM
EN
T 47
0
10
20
30
40
50
60
70
80
90
100Realized Vol GARCH
Figure 1-11 GARCH predicted one-month volatilities for S&P 500 Index, in %, annualized
9780133354348_Book 1.indb 47
9780133354348_Book 1.indb 47
11/21/13 3:05 PM
11/21/13 3:05 PM

48 RULE BASED INVESTING
The GARCH strategy works as it did before: Every month you invest the same amount of capital to receive volatility premium, 10 by entering a trade to receive a predetermined strike closely related to at-the-money implied volatility or variance and to pay upcoming real-ized volatility or variance. The GARCH filter is applied in the follow-ing way: If GARCH’s forecast of conditional variance is high because the most recent market data shows an exceptional movement (trem-ors of volatility if you will), you do not take the risk of going short vol in the coming month. The rule would tell us that this is a “risk off” month. Table 1-4 records the effect of applying the GARCH filter. From January 2001 to June 2013, the GARCH filter improved per-formance from an annualized return of 25.7% to 28.6%, and annual-ized standard deviation reduced dramatically from 25.9% to 14.3%. Sharpe ratio is increased from 0.99 to 2.6. The dramatic improved Sharpe indicates you are taking much more intelligent risk. It is, after all, intelligent to stay indoors if the weather forecast threatens a com-ing storm. All results are net of a transaction cost of 1.5% per trade.
Most significantly, in 2008, the GARCH filter helped to turn the large loss that resulted from the naïve strategy into profit. Figure 1-12 displays the GARCH signal in 2008 together with the S&P 500’s vola-tility premium. For the months of August through December 2008, GARCH signaled risk-off from the volatility market, hence avoiding a loss of more than 90%.
10 Although in equity market variance swap is much more commonly traded than volatility swap, the term volatility is used for the purpose of consistency.
9780133354348_Book 1.indb 489780133354348_Book 1.indb 48 11/21/13 3:05 PM11/21/13 3:05 PM

C
HA
PTE
R 1
• R
ULE B
AS
ED V
OLA
TIL
ITY IN
VE
STM
EN
T 49
Table 1-4 Performance Statistics of S&P 500 One-Month Volatility Premium Investment (Naïve Strategy vs. GARCH Filter, January 2001–June 2013)
Average Annualized Return in %
Annualized Standard Deviation of Return in %
Maximal One Month Loss In % Sharpe Ratio
Naïve GARCH
Filter Naïve GARCH
Filter Naïve GARCH
Filter Naïve GARCH
Filter
2001 52.13 3.70 23.82 0.36 -7.57 0.16 2.19 10.22
2002 -5.25 3.85 24.26 2.05 -19.35 0.12 -0.22 1.87
2003 58.07 47.25 10.63 9.30 1.12 0.11 5.46 5.08
2004 32.53 28.38 8.01 8.19 -1.79 -1.79 4.06 3.47
2005 16.53 12.74 9.62 4.29 -4.39 -0.54 1.72 2.97
2006 20.62 15.34 7.27 4.49 -1.96 -1.21 2.84 3.41
2007 -1.81 3.93 15.95 15.64 -9.66 -9.66 -0.11 0.25
2008 -84.31 7.26 58.00 10.32 -48.45 -4.72 -1.45 0.70
2009 81.61 52.60 16.15 16.78 -4.27 -4.27 5.05 3.14
2010 74.00 57.26 22.10 15.81 -11.05 0.02 3.35 3.62
2011 18.85 13.97 32.58 32.39 -23.93 -23.93 0.58 0.43
2012-2013 35.18 23.92 13.66 12.91 -3.14 -3.14 2.57 1.85
Total 25.75 23.15 25.94 14.30 -48.45 -23.93 0.99 1.62
Source: Bloomberg
9780133354348_Book 1.indb 49
9780133354348_Book 1.indb 49
11/21/13 3:05 PM
11/21/13 3:05 PM

50 RULE BASED INVESTING
Jan-
08
Jan-
10
Feb-
08
Mar
-08
Apr
-08
Jul-0
8
May
-08
Jun-
08
Oct
-08
Nov
-08
Dec
-08
Aug
-08
Sep
t-08
Jan-
09
Feb-
09
Mar
-09
Apr
-09
Jul-0
9
May
-09
Jun-
09
Oct
-09
Nov
-09
Dec
-09
Aug
-09
Sep
t-09
0GARCH Filter
Vol Premium
-50
-40
-30
-20
-10
10
20GARCH Risk On
GARCH Risk Off
Figure 1-12 GARCH Risk On/Off for S&P 500 Volatility Investing
Learning from the Market: VIX Filter
For S&P 500 volatility, VIX itself is the obvious choice for con-structing a market implied, forward-looking risk on/off filter. In the same fashion as for USDJPY volatility premium, each month, we only invest in S&P 500 volatility premium if yesterday’s VIX closes below its own historical average.
The resulting benefits of applying a VIX filter are demonstrated in Table 1-5 and Figure 1-13 . Overall returns increase from 25.7% to 28.0%, standard deviation reduced from 25.9% to 16.7%. What to look at in the filter is that in 2008 it helped to reduce maximal monthly loss from 48% to zero so that 2008 overall performance transformed from a large loss of -84% to -27%. By applying this simple VIX filter, investing in vol premium has reached a Sharpe ratio as high as 1.6, net of transaction cost of 1.5% per month.
9780133354348_Book 1.indb 509780133354348_Book 1.indb 50 11/21/13 3:05 PM11/21/13 3:05 PM

C
HA
PTE
R 1
• R
ULE B
AS
ED V
OLA
TIL
ITY IN
VE
STM
EN
T 51
Table 1-5 Performance Statistics of S&P 500 One-Month Volatility Premium Investment (Naïve Strategy vs. VIX Filter, January 2001–June 2013)
Average Annualized Return in %
Annualized Standard Deviation of Return in %
Maximal One Month Loss In % Sharpe Ratio
Naïve VIX Filter Naïve VIX Filter Naïve VIX Filter Naïve VIX Filter
2001 52.13 3.70 23.82 0.36 -7.57 0.16 2.19 10.22
2002 -5.25 18.24 24.26 9.75 -19.35 0.15 -0.22 1.87
2003 58.07 58.07 10.63 10.63 1.12 1.12 5.46 5.46
2004 32.53 32.53 8.01 8.01 -1.79 -1.79 4.06 4.06
2005 16.53 16.53 9.62 9.62 -4.39 -4.39 1.72 1.72
2006 20.62 20.71 7.27 7.25 -1.96 -1.96 2.84 2.86
2007 -1.81 -1.51 15.95 14.35 -9.66 -9.66 -0.11 -0.11
2008 -84.31 -23.04 58.00 33.40 -48.45 -30.97 -1.45 -0.69
2009 81.61 81.61 16.15 16.15 -4.27 -4.27 5.05 5.05
2010 74.00 61.35 22.10 21.65 -11.05 -11.05 3.35 2.83
2011 18.85 28.72 32.58 15.23 -23.93 -2.72 0.58 1.89
2012-2013 35.18 32.43 13.66 13.87 -3.14 -3.14 2.57 2.34
Total 25.75 28.03 25.94 16.76 -48.45 -30.97 0.99 1.67
Source: Bloomberg
9780133354348_Book 1.indb 51
9780133354348_Book 1.indb 51
11/21/13 3:05 PM
11/21/13 3:05 PM

52 RULE BASED INVESTING
Together and Stronger: Applying Both Filters
What happens when you combine both GARCH and VIX filters to the naïve strategy? The results are illustrated in Table 1-6 . Applying both filters, an annualized return of 23.4% is realized, with a standard deviation of 11.9% and a doubled Sharpe ratio from 1 to 2.
Although the USDJPY volatility strategy from the previous example exhibits little correlation with the risky benchmarks, the rule based S&P 500 volatility strategy has a higher correlation with the index as well as other risky benchmarks. For the period January 2001–June 2013, the correlations with S&P 500, MSCI World Equity Index, U.S. High Yield, and Global High Yield Index are 0.32, 0.29, 0.25, and 0.24, respectively.
With GARCH outperforming in 2008 the VIX filter in the example of S&P 500 volatility investing, it is tempting to apply the backward-looking filter GARCH alone and discard VIX filter rule or any forward-looking type indicator. An important thing to remember is that the VIX filter rule shown here is the simplest form of moving average, comparing the current level of the VIX to its mean over a window of time, and as a result there is great room for improvement. To understand why the joint filter produced a slightly lower return, understand that the joint filter switched risk “off” for some borderline volatile months. Had risk stayed on, it would have turned out those months were actually profitable and hence the higher return achieved by applying GARCH filter alone. What is important to note, however, is that keeping risk on during those months, although profitable, was not a smart risk to take. The joint filter has the highest Sharpe, indicating more intelligent risk. Further, there are other indicators than the VIX alone; some suggested by academic research are to use the variance swap term structure or the shape of the variance curve. 11 The next example explicitly applies the shape of the vol curve to volatilities of U.S. swap rates market.
11 Examples are Egloff, Daniel, Markus Leippold, and Liuren Wu, “The Term Struc-ture of Variance Swap Rates and Optimal Variance Swap Investments,” Journal of Financial and Quantitative Analysis, 45(5) (October 2010): 1279–1310, and Bernales, Alejandro and Guidolin Massimo, “Can We Forecast the Implied Vol-atility Surface Dynamics of Equity Options? Predictability and Economic Value Tests,” Working Papers 456, IGIER (Innocenzo Gasparini Institute for Economic Research), Bocconi University, 2012.
9780133354348_Book 1.indb 529780133354348_Book 1.indb 52 11/21/13 3:05 PM11/21/13 3:05 PM

C
HA
PTE
R 1
• R
ULE B
AS
ED V
OLA
TIL
ITY IN
VE
STM
EN
T 53
Table 1-6 Performance Statistics of S&P 500 One-Month Volatility Premium Investment (Naïve Strategy vs. Joint Filter, January 2001–June 2013)
Average Annualized Return in %
Annualized Standard Deviation of Return in %
Maximal One Month Loss In % Sharpe Ratio
Naïve Joint Filter Naïve Joint Filter Naïve Joint Filter Naïve Joint Filter
2001 52.13 3.70 23.82 0.36 -7.57 0.16 2.19 10.22
2002 -5.25 3.85 24.26 2.05 -19.35 0.12 -0.22 1.87
2003 58.07 47.25 10.63 9.30 1.12 0.11 5.46 5.08
2004 32.53 28.38 8.01 8.19 -1.79 -1.79 4.06 3.47
2005 16.53 12.74 9.62 4.29 -4.39 -0.54 1.72 2.97
2006 20.62 15.34 7.27 4.49 -1.96 -1.21 2.84 3.41
2007 -1.81 0.94 15.95 14.21 -9.66 -9.66 -0.11 0.07
2008 -84.31 3.80 58.00 9.74 -48.45 -4.72 -1.45 0.39
2009 81.61 52.60 16.15 16.78 -4.27 -4.27 5.05 3.14
2010 74.00 57.26 22.10 15.81 -11.05 0.02 3.35 3.62
2011 18.85 23.85 32.58 15.10 -23.93 -2.72 0.58 1.58
2012-2013 35.18 23.92 13.66 12.91 -3.14 -3.14 2.57 1.85
Total 25.75 23.42 25.94 11.87 -48.45 -9.66 0.99 1.97
Source: Bloomberg
9780133354348_Book 1.indb 53
9780133354348_Book 1.indb 53
11/21/13 3:05 PM
11/21/13 3:05 PM

54
RU
LE B
AS
ED IN
VE
STIN
G
S&P Vol Strategy, 1,088
High Yield US, 271
High Yield Global, 287
MSCI World, 115
S&P 500, 119
0
100
200
300
400
500
600
700
800
900
1,000
1,100
1,200
Figure 1-13 Risk adjusted cumulative returns (volatility = 10%), January 2001–June 2013
9780133354348_Book 1.indb 54
9780133354348_Book 1.indb 54
11/21/13 3:05 PM
11/21/13 3:05 PM

CHAPTER 1 • RULE BASED VOLATILITY INVESTMENT 55
Example 3: Swap Rates Volatility
This third and final example demonstrates how to create and apply simple rules to aid you in avoiding major losses in volatility pre-mium investments in interest rate markets, with a focus on study-ing the volatility premium for 10-year U.S. swap rates. The persistent alpha of the volatility premium is particularly pronounced in the U.S. swap rates market where mortgage hedging against prepayment risk creates a natural demand for shorter dated volatility. Consider that from January 2001 to June 2013, the implied volatility for one-month at-the-money swaption exceeded the realized volatility 67% of the time. The average difference was 1.8%. As Figure 1-14 shows, how-ever, during periods of market turmoil, volatility investments experi-ence sudden heavy losses. This is the problem that plagues the “naïve” strategy of simply buying and holding vol premium. When a market crisis occurs, receiving the volatility premium (short vol) has a major downside. In the business of earthquake insurance, it is an expecta-tion that suddenly massive payouts will occur when an earthquake occurs because it affects a wide area.
The rules introduced here, though simple, are designed to help you escape or at least dodge the full impact of a market crisis event. The aim of the rule based investment strategy introduced in the fol-lowing section is to use both backward-looking statistical models as well as forward-looking market indicators to avoid shorting volatilities when turbulence threatens. Whether you stay in the trade or exit the position, it is no longer determined by emotion or personal market views, but by rules that act as on/off switches for whether we do or do not receive the volatility premium for a particular month.
9780133354348_Book 1.indb 559780133354348_Book 1.indb 55 11/21/13 3:05 PM11/21/13 3:05 PM

56
RU
LE B
AS
ED IN
VE
STIN
G
-
10
20
30
40
50
60
70
80
90
100
(50)
(40)
(30)
(20)
(10)
-
10
20
30
40
50Vol Premium Implied Actual Vol
Figure 1-14 One-month U.S. 10-year swap rate volatilities in %, monthly data (vol premium is right axis—after transaction cost)
9780133354348_Book 1.indb 56
9780133354348_Book 1.indb 56
11/21/13 3:05 PM
11/21/13 3:05 PM

CHAPTER 1 • RULE BASED VOLATILITY INVESTMENT 57
Interest rate vol or variance swap is much less liquid than Foreign Exchange or equity markets. The simplest way to capture vol pre-mium in swap rates is to sell an at-the-money swaption straddle and delta hedge it until expiration. 12 One-month at-the-money straddle is very liquid, which is ideal. Liquidity itself is a function of the risk pre-mium a market is charging. When a market maker trades with a client, the market maker is temporarily exposed to the risk of the other side of the client’s trade. To clear that position and cancel out the risk, they must trade away the risk to someone else. The compensation the market maker asks for shouldering the inherent risk of this service is the bid/ask spread. The bid/ask spread guarantees the transaction is biased in favor of the market maker. When a market has many partici-pants, it is easy to get in and out of trades, the risk of market making is minimal, and the supply/demand of participants quickly establishes a narrow range of prices, which all together means liquidity is good. When liquidity is bad there is uncertainty on what the correct price is, the bid/ask spread reflects this risk meaning expensive transactions, and even if you want to exit your position, you might be stuck because there’s no counterparty. You typically want to invest in liquid markets because the transaction cost will be minimal (meaning a tight bid/ask spread), and you are able to quickly exit a position if you need to—at minimal expense.
Along the same lines as the two previous volatility strategies, you can now apply two filters: the first one is statistical and looks back-ward, that is, learning from the historical movement of the swap rate itself to draw some inference about its future. The second is a for-ward-looking indicator derived from traded market prices.
12 For details of interest rates swaption please see, for example, Tuckman, Bruce and Angle Serrat. Fixed Income Securities Tools for Today’s Markets 3rd ed. Wiley Finance, 2011.
9780133354348_Book 1.indb 579780133354348_Book 1.indb 57 11/21/13 3:05 PM11/21/13 3:05 PM

58 RULE BASED INVESTING
Learning from History: GARCH Filter
Again, using the simplest statistical model, GARCH (1,1), you can forecast actual volatility. As previously noted, GARCH (1,1) has the advantage of being easy to estimate, and it models volatility with many desirable properties such as time varying volatility and persis-tence. Figure 1-15 shows the GARCH predicted volatility compared to the realized volatility. As you can see, GARCH mimics the ups and downs of realized vol rather well; however, there is some lag due to its backward-looking characteristics. A statistical model necessarily implies market events must first occur and be entered as data before the model can react, hence a persistent lag.
This GARCH strategy works as it has before: To receive the vol premium, every month you sell the same amount of one-month strad-dle and delta hedge. If GARCH predicts a high volatility in the near future, so that vol premium does not exceed an economic threshold, you do not want to take the risk of short volatility in the coming month. If yesterday’s return has an above average amount of movement (that is, the return square is high), this information will reveal in a higher GARCH reading. Then you don’t want to go short volatility because it is likely to be high in the coming months. Again GARCH here serves as a “sophisticated average” of return movement.
9780133354348_Book 1.indb 589780133354348_Book 1.indb 58 11/21/13 3:05 PM11/21/13 3:05 PM

C
HA
PTE
R 1
• R
ULE B
AS
ED V
OLA
TIL
ITY IN
VE
STM
EN
T 59
0
10
20
30
40
50
60
70
80
90Realized Vol GARCH
Figure 1-15 GARCH predicted one-month log normal volatilities for U.S. 10-year swap rate, in %, annualized
9780133354348_Book 1.indb 59
9780133354348_Book 1.indb 59
11/21/13 3:05 PM
11/21/13 3:05 PM

60 RULE BASED INVESTING
Table 1-7 records the effect of applying the GARCH filter. From January 2001 to June 2013, compared with simple short straddle strat-egy, the GARCH filter achieved a slightly lower annualized return from 18.1% to 17.4%. The standard deviation of the returns however, was improved from 28% to 21%. The GARCH filter worked very well in 2011’s second European debt crises by reducing the maxi-mum one-month loss of 37% to 4% and improved the year’s return by almost three-fold. GARCH, however, is not the “Holy Grail.” It has its limitations in the U.S. swaptions market. The reason for the slightly lower return is when the trade is “risk off,” you avoid both ends of your return distribution both on the negative end of losses as well as the positive end of profits. The overall risk profile is superior, and the return just slightly less, making for a smarter investment, but still the slight loss in returns shows the limitation of a very simple model–there is enormous potential for improvement. Figure 1-16 illustrates that the GARCH strategy failed to filter out the large loss experienced in October 2008 and missed out the market rebound immediately after the crises.
9780133354348_Book 1.indb 609780133354348_Book 1.indb 60 11/21/13 3:05 PM11/21/13 3:05 PM

C
HA
PTE
R 1
• R
ULE B
AS
ED V
OLA
TIL
ITY IN
VE
STM
EN
T 61
Table 1-7 Performance Statistics of U.S. 10-Year Swap Rate One-Month Volatility Premium Investment (Naïve Strategy vs. GARCH Filter, January 2001–June 2013)
Average Annualized Return in %
Annualized Standard Deviation of Return in %
Maximal One Month Loss In % Sharpe Ratio
Naïve GARCH
Filter Naïve GARCH
Filter Naïve GARCH
Filter Naïve GARCH
Filter
2001 11.01 9.61 17.96 10.84 -11.47 -5.33 0.61 0.89
2002 47.41 53.40 17.69 15.49 -3.37 0.14 2.68 3.45
2003 16.19 11.63 21.11 15.53 -7.10 -4.73 0.77 0.75
2004 31.94 26.94 12.13 12.52 -1.78 -1.78 2.63 2.15
2005 5.65 9.50 8.53 3.41 -4.19 0.07 0.66 2.79
2006 3.68 5.89 8.24 7.81 -4.05 -4.05 0.45 0.75
2007 -27.08 -15.28 18.64 14.28 -10.35 -10.35 -1.45 -1.07
2008 -5.03 -37.73 57.39 41.91 -34.65 -34.65 -0.09 -0.90
2009 73.71 68.29 29.92 26.24 -8.19 -7.80 2.46 2.60
2010 -8.94 9.54 28.90 22.81 -13.63 -12.66 -0.31 0.42
2011 14.29 41.82 45.04 18.01 -36.59 -4.01 0.32 2.32
2012-2013 26.38 11.41 24.65 25.45 -17.55 -17.55 1.07 0.45
Total 18.13 17.40 27.88 21.12 -36.59 -34.65 0.65 0.82
Source: Bloomberg
9780133354348_Book 1.indb 61
9780133354348_Book 1.indb 61
11/21/13 3:05 PM
11/21/13 3:05 PM
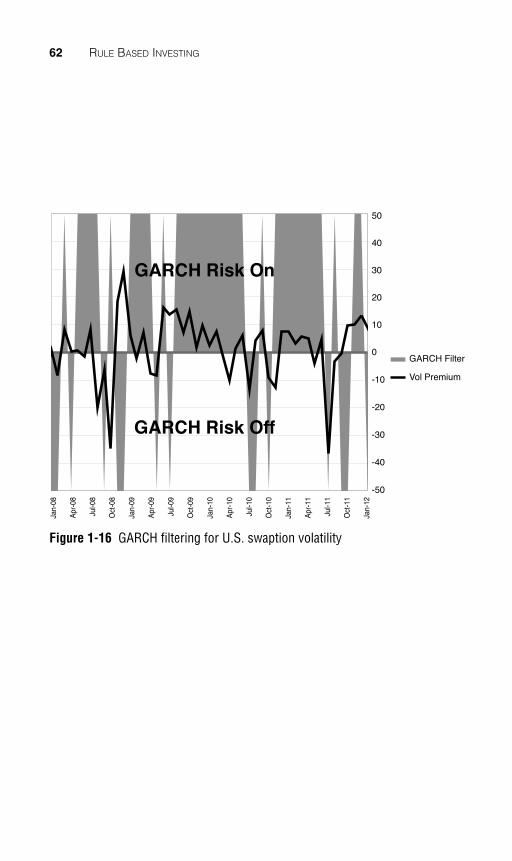
62 RULE BASED INVESTING
GARCH Filter
Vol Premium
Jan-
08
Apr
-08
Jul-0
8
Oct
-08
Jan-
09
Apr
-09
Jul-0
9
Oct
-09
Jan-
10
Apr
-10
Jul-1
0
Oct
-10
Jan-
11
Jan-
12
Apr
-11
Jul-1
1
Oct
-11
0
-50
-40
-30
-20
-10
10
20
30
40
50
GARCH Risk On
GARCH Risk Off
Figure 1-16 GARCH filtering for U.S. swaption volatility
9780133354348_Book 1.indb 629780133354348_Book 1.indb 62 11/21/13 3:05 PM11/21/13 3:05 PM

CHAPTER 1 • RULE BASED VOLATILITY INVESTMENT 63
Learning from the Market: (Slope of) Vol Curve Filter
The next filter is constructed by using the implied volatility curve as an on/off switch for the naïve strategy of selling one-month strad-dles. You will see how the volatility curve itself has the filtering power to root out potential market crises. Under normal market conditions, the volatility curve should be upward slopping, that is, the price of longer dated options should be higher than shorter dated options because more uncertainty is priced in. When the options market expects an eminent crisis, the prices for short maturity options spike up even more than the prices for longer dated options. This is strange as the market is saying that tomorrow is much more uncertain than a year from now. This leads to an inverted vol curve. Figure 1-17 shows the different shapes of log normal vol curve corresponding to differ-ent market sentiments: During normal market conditions, vol curve is upward sloping or flat. However, for example, during 2008 Global Financial Crisis, the vol curve was particularly inverted; that is, one-month at-the-money vol was much higher that the longer dated vol. The inverted vol curves could be observed in almost all option mar-kets during that time.
9780133354348_Book 1.indb 639780133354348_Book 1.indb 63 11/21/13 3:05 PM11/21/13 3:05 PM

64
RU
LE B
AS
ED IN
VE
STIN
G
Option Tenore1M 2M 3M 6M 9M 1Y 2Y
Vo
lati
lity
Distressed
Normal
Figure 1-17 Upward versus downward slopping log normal volatility curve , in %
9780133354348_Book 1.indb 64
9780133354348_Book 1.indb 64
11/21/13 3:05 PM
11/21/13 3:05 PM

CHAPTER 1 • RULE BASED VOLATILITY INVESTMENT 65
You can apply the vol curve filter in the following manner: Focus on only two points along the vol curve, the one-month versus the one-year option maturities. These are simple basic rules and parameters derived from experience rather than data mining–you can capture the bulk of the market information without fooling yourself with an excess of conditions. Define the slope as the difference (in ratio) between at-the-money volatilities of one-month and one-year options for U.S. 10-year swap rates and only invest in the volatility premium (that is, selling straddle to receive the vol premium if yesterday’s vol curve slope is not higher than its own historical average. In other words, if the short end of the vol curve is high compared with the long end of the vol curve (meaning the near future is uncertain), you do not want to take the risk of investing in vol premium because it implic-itly implies that the options market is pricing an imminent crisis. The options market can be right or wrong. We won’t know until the month is over. As a cautious investor, however, you do not want to take the uneducated risk of betting against the option markets under such extraordinary circumstances.
The resulting benefit of applying a volatility curve filter is demon-strated in the Table 1-8 and Figure 1-18 . Overall return is lower than that of naïve and GARCH strategy, but risk profile is better. Stan-dard deviation is reduced from 18% to 15%. In October 2008, this filter helped to avoid the single largest loss of a naïve strategy’s -35%. Similarly, during the second European credit crisis in July 2011, it helped to filter out a large loss of 37% in a single month so that the largest monthly loss is reduced to merely 4%. Overall Sharpe ratio is increased from 0.65 for a naïve strategy to 0.88. Again, all results here are net of transaction cost assumed to be 0.6% per month.
9780133354348_Book 1.indb 659780133354348_Book 1.indb 65 11/21/13 3:05 PM11/21/13 3:05 PM

66
RU
LE B
AS
ED IN
VE
STIN
G Table 1-8 Performance Statistics of U.S. 10-Year Swap Rate One-Month Volatility Premium Investment (Naïve Strategy vs. Vol Curve Filter, January 2001–June 2013)
Average Annualized Return in %
Annualized Standard Deviation of Return in %
Maximal One Month Loss In % Sharpe Ratio
Naïve Vol Curve
Filter Naïve Vol Curve
Filter Naïve Vol Curve
Filter Naïve Vol Curve
Filter
2001 11.01 -3.73 17.96 12.46 -11.47 -11.47 0.61 -0.30
2002 47.41 38.30 17.69 16.58 -3.37 -2.32 2.68 2.31
2003 16.19 12.67 21.11 15.76 -7.10 -7.10 0.77 0.80
2004 31.94 10.32 12.13 6.71 -1.78 -1.78 2.63 1.54
2005 5.65 8.06 8.53 7.28 -4.19 -4.19 0.66 1.11
2006 3.68 2.23 8.24 5.15 -4.05 -4.05 0.45 0.43
2007 -27.08 1.43 18.64 8.64 -10.35 -7.39 -1.45 0.17
2008 -5.03 -10.86 57.39 22.12 -34.65 -19.75 -0.09 -0.49
2009 73.71 56.12 29.92 25.31 -8.19 -7.80 2.46 2.22
2010 -8.94 -13.07 28.90 19.34 -13.63 -13.63 -0.31 -0.68
2011 14.29 50.06 45.04 17.94 -36.59 -4.01 0.32 2.79
2012-2013 26.38 14.15 24.65 22.87 -17.55 -17.55 1.07 0.62
Total 18.13 15.21 27.88 17.22 -36.59 -19.75 0.65 0.88
Source: Bloomberg
9780133354348_Book 1.indb 66
9780133354348_Book 1.indb 66
11/21/13 3:05 PM
11/21/13 3:05 PM

CHAPTER 1 • RULE BASED VOLATILITY INVESTMENT 67
Vol Curve Signal
Vol Premium
Jan-
08
Apr
-08
Jul-0
8
Oct
-08
Jan-
09
Apr
-09
Jul-0
9
Oct
-09
Jan-
10
Apr
-10
Jul-1
0
Oct
-10
Jan-
11
Jan-
12
Apr
-11
Jul-1
1
Oct
-11
Vol Curve Risk On
0
-50
-40
-30
-20
-10
10
20
30
40
50
Vol Curve Risk Off
Figure 1-18 Vol curve filtering for U.S. one-month, 10-year swaptions
9780133354348_Book 1.indb 679780133354348_Book 1.indb 67 11/21/13 3:05 PM11/21/13 3:05 PM

68 RULE BASED INVESTING
Together and Stronger: Applying Both Filters
Combining the two rules into a hybridized strategy again leads to a strategy greater than the sum of its parts. What happens when you combine both GARCH and vol curve filters to the naïve strategy? Table 1-9 and Figure 1-19 reveal the results. GARCH utilizes the past information and provides a scientific indication for the future actual volatility, and the vol curve tells us how options market prices the future uncertainty. By applying both filters, you reduced the large losses typically experienced in volatility premium investing such as in 2008 and 2011, and Sharpe ratio is increased from 0.65 to 0.94.
Compared with other risky benchmarks for the same period from 2001 to 2013, this rule based rates vol strategy outperforms, in risk adjusted basis, U.S. and global equity and high yield bonds. The correlations between rule based U.S. rates vol and the benchmark indices are close to zero (ranging from 0.03 to 0.07), making for an excellent addition to any portfolio. This is a winning performance from which many fund managers would expect to receive significant fees and compensation, yet here it was achieved by simply revisiting trades once a month, quickly assessing two filters, and following the rules on whether to keep risk on or get out—and that is all the active management it required.
Building a Volatility Portfolio
After applying simple filters to three liquid volatility markets, let’s next discuss a volatility portfolio that is equally weighted with the three strategies that combine GARCH and market implied data already presented. You can compare the performance of the vol bas-ket with relevant benchmarks: U.S. equity, Global equity, and U.S. and Global high yield credit. In addition, you can measure this rule based strategy performance against the Barclay Systematic Trader index, which averages 466 professional managers, with a systematic trading style as opposed to a discretionary one.
9780133354348_Book 1.indb 689780133354348_Book 1.indb 68 11/21/13 3:05 PM11/21/13 3:05 PM

C
HA
PTE
R 1
• R
ULE B
AS
ED V
OLA
TIL
ITY IN
VE
STM
EN
T 69
Table 1-9 Performance Statistics of U.S. 10-Year Swap Rate One-Month Volatility Premium Investment (Naïve Strategy vs. Joint Filter, January 2001–June 2013)
Average Annualized Return in %
Annualized Standard Deviation of Return in %
Maximal One Month Loss in % Sharpe Ratio
Naïve Joint Filter Naïve Joint Filter Naïve Joint Filter Naïve Joint Filter
2001 11.01 4.72 17.96 1.09 -11.47 0.16 0.61 4.35
2002 47.41 40.76 17.69 15.85 -3.37 0.14 2.68 2.57
2003 16.19 16.80 21.11 13.10 -7.10 -3.42 0.77 1.28
2004 31.94 10.32 12.13 6.71 -1.78 -1.78 2.63 1.54
2005 5.65 9.77 8.53 3.36 -4.19 0.23 0.66 2.91
2006 3.68 2.90 8.24 5.16 -4.05 -4.05 0.45 0.56
2007 -27.08 -0.55 18.64 8.29 -10.35 -7.39 -1.45 -0.07
2008 -5.03 -11.02 57.39 22.11 -34.65 -19.75 -0.09 -0.50
2009 73.71 42.47 29.92 23.65 -8.19 -7.80 2.46 1.80
2010 -8.94 0.58 28.90 13.67 -13.63 -10.09 -0.31 0.04
2011 14.29 40.34 45.04 17.28 -36.59 -4.01 0.32 2.34
2012-2013 26.38 5.41 24.65 22.91 -17.55 -17.55 1.07 0.24
Total 18.13 14.26 27.88 15.23 -36.59 -19.75 0.65 0.94
Source: Bloomberg
9780133354348_Book 1.indb 69
9780133354348_Book 1.indb 69
11/21/13 3:05 PM
11/21/13 3:05 PM

70
RU
LE B
AS
ED IN
VE
STIN
G
Rule Based Rates Vol, 302
High Yield US, 271
High Yield Global, 287
115
119
Rule Based Rates Vol, 302
High Yield US, 271
High Yield Global, 287
S&P 500, 119
100
200
300
400
MSCI World, 115
Figure 1-19 Risk adjusted cumulative returns (volatility = 10%), January 2001–June 2013
9780133354348_Book 1.indb 70
9780133354348_Book 1.indb 70
11/21/13 3:05 PM
11/21/13 3:05 PM

CHAPTER 1 • RULE BASED VOLATILITY INVESTMENT 71
The way you invest in a volatility portfolio is by each month equally weighting the three volatility strategies. If any vol strategy is risk off, meaning the rules tell you not to invest, you underinvest; that is, you do not reallocate the risk to the remaining strategies. If all three vol strategies are risk off, (which itself is a powerful risk indicator to other risky investments), you do not invest at all. Like before, the transac-tion cost is assumed to be 0.4% for USDJPY vol, 1.5% for S&P 500 vol, and 0.6% for U.S. 10-year rates vol.
This volatility portfolio outperformed all five benchmarks. Tables 1-10, 1-11, and 1-12 report detailed performance statistics, and Fig-ure 1-20 illustrates risk-adjusted cumulative returns. In particular, the correlations with the benchmarks are very low: 0.15 with S&P 500, 0.16 with MSCI world equity index, 0.18 with U.S. High Yield index, and 0.17 with Global High Yield index. It also has a low correlation with Systematic Trader Index which is -0.06. With these low correla-tions, volatility deserves its recognition as a separate asset class. You are encouraged to use this performance as a benchmark when evalu-ating any volatility related financial products.
9780133354348_Book 1.indb 719780133354348_Book 1.indb 71 11/21/13 3:05 PM11/21/13 3:05 PM

72
RU
LE B
AS
ED IN
VE
STIN
G Table 1-10 Average Annualized Returns of Volatility Premium Investment vs. Benchmarks, in %, January 2001–June 2013
Naïve Volatility Basket
Rule based Volatility Basket S&P 500
MSCI World Equity Index
High Yield U.S.
High Yield Global
Systematic Trader Index
2001 24.33 5.30 -12.07 -17.94 5.86 2.77 3.54
2002 12.55 14.98 -24.35 -21.67 -0.73 4.75 12.16
2003 28.41 23.65 24.22 27.83 25.86 28.60 8.98
2004 21.16 13.93 8.88 12.44 10.67 12.55 0.88
2005 5.43 7.33 3.24 7.62 2.82 3.63 1.14
2006 10.00 7.51 12.99 16.88 11.27 12.94 2.27
2007 -12.91 2.33 3.90 7.27 2.03 3.28 8.61
2008 -30.65 -0.99 -45.45 -50.61 -27.66 -28.31 17.18
2009 62.78 37.47 23.58 26.63 47.51 48.22 -3.29
2010 25.53 20.21 13.80 11.10 14.40 14.32 7.75
2011 17.33 25.87 1.15 -6.47 5.28 3.64 -3.65
2012-2013 17.87 8.71 18.71 13.71 8.90 9.12 -1.84
Total 16.21 14.30 2.81 2.67 9.09 9.97 4.18
Source: Bloomberg
9780133354348_Book 1.indb 72
9780133354348_Book 1.indb 72
11/21/13 3:05 PM
11/21/13 3:05 PM

C
HA
PTE
R 1
• R
ULE B
AS
ED V
OLA
TIL
ITY IN
VE
STM
EN
T 73
Table 1-11 Annualized Return Standard Deviations of Volatility Premium Investment vs. Benchmarks, in %, January 2001–June 2013
Naïve Volatility Basket
Rule based Volatility Basket S&P 500
MSCI World Equity Index
High Yield U.S.
High Yield Global
Systematic Trader Index
2001 11.65 0.79 19.85 18.20 12.43 10.72 11.32
2002 11.09 5.81 20.61 19.30 12.15 12.23 12.35
2003 10.08 4.44 11.39 12.26 5.83 6.43 11.48
2004 6.41 3.99 7.25 8.19 4.02 4.96 8.63
2005 3.81 2.22 7.81 8.19 5.06 4.64 6.47
2006 5.03 1.87 5.70 7.45 2.28 2.97 6.46
2007 11.38 6.49 9.69 9.33 6.16 5.91 6.95
2008 37.73 11.94 20.99 23.63 21.68 22.82 9.08
2009 13.64 10.04 22.31 23.27 13.03 12.43 5.58
2010 16.80 8.44 19.31 20.60 7.17 9.57 6.69
2011 25.99 10.59 15.97 17.67 9.55 11.06 7.35
2012-2013 10.62 8.81 9.25 11.38 4.88 6.39 5.64
Total 16.89 7.69 15.67 16.53 10.67 11.12 8.28
Source: Bloomberg
9780133354348_Book 1.indb 73
9780133354348_Book 1.indb 73
11/21/13 3:05 PM
11/21/13 3:05 PM

74
RU
LE B
AS
ED IN
VE
STIN
G Table 1-12 Annualized Sharpe Ratios of Volatility Premium Investment vs. Benchmarks, January 2001–June 2013
Naïve Volatility
Basket
Rule based Volatility
Basket S&P 500 MSCI World Equity Index
High Yield U.S.
High Yield Global
Systematic Trader Index
2001 2.09 6.73 -0.61 -0.99 0.47 0.26 0.31
2002 1.13 2.58 -1.18 -1.12 -0.06 0.39 0.98
2003 2.82 5.33 2.13 2.27 4.44 4.45 0.78
2004 3.30 3.49 1.23 1.52 2.66 2.53 0.10
2005 1.42 3.30 0.41 0.93 0.56 0.78 0.18
2006 1.99 4.02 2.28 2.27 4.95 4.36 0.35
2007 -1.13 0.36 0.40 0.78 0.33 0.55 1.24
2008 -0.81 -0.08 -2.17 -2.14 -1.28 -1.24 1.89
2009 4.60 3.73 1.06 1.14 3.65 3.88 -0.59
2010 1.52 2.39 0.71 0.54 2.01 1.50 1.16
2011 0.67 2.44 0.07 -0.37 0.55 0.33 -0.50
2012-2013 1.68 0.99 2.02 1.20 1.82 1.43 -0.33
Total 0.96 1.86 0.18 0.16 0.85 0.90 0.50
Source: Bloomberg
9780133354348_Book 1.indb 74
9780133354348_Book 1.indb 74
11/21/13 3:05 PM
11/21/13 3:05 PM

C
HA
PTE
R 1
• R
ULE B
AS
ED V
OLA
TIL
ITY IN
VE
STM
EN
T 75
Rule Based Vol Portfolio, 946Rule Based Vol Portfolio, 946
High Yield US, 271High Yield US, 271
High Yield Global, 287
MSCI World, 115
S&P 500, 119100
200
300
400
500
600
700
800
900
1,000
1,100
Figure 1-20 Cumulative Returns (volatility = 10%), January 2001–June 2013
9780133354348_Book 1.indb 75
9780133354348_Book 1.indb 75
11/21/13 3:05 PM
11/21/13 3:05 PM
76 RULE BASED INVESTING
Some Remarks
Between late 2008 and 2011 I visited countless institutional inves-tors around the world and discussed with them their challenges and needs. Obviously volatility was the hot topic right after the financial crises. I always reminded the investors that those vol funds that focus only on long vol or only on short vol had a hard time surviving 2008 and 2009. The short vol funds had a tough time in 2008, immedi-ately after a crisis is when volatility is the best performing strategy. Although the market bounces back, the psychology of the participants is still calibrated to the crisis. Recently scarred by market turmoil they are willing to pay high premiums for protection from further downside.
To survive in the long term, investing in only a single asset class won’t work. With risky assets increasingly correlated, diversification is the key, and yet it is increasingly challenging. Still the natural ten-dency of investors and market participants is to focus in on the par-ticular market they feel that they “know,” often to the exclusion of others, because it is hard to be an expert in every market and asset class—hence the promotion here of rule based investment strategies for investors. The ease of use and implementation results in a broad, flexible ability to diversify, which is the foundation of a profitable, long-term investment strategy.
Although using VIX as a global risk indicator has long been adopted by the financial industry, recent academic research in the direction of “model-free” variance risk premium has produced excit-ing results. The difference between implied variance and realized vari-ance is the variance risk premium. Traditionally we depended on the Black-Scholes formula to model this relationship, which is flawed as it assumes asset prices follow an idealized model. Beginning with the research of Carr and Madan,13 as well as others, model free implied
13 Carr, Peter and Dilip Madan. “Towards a Theory of Volatility Trading.” Chapter 29 in Volatility: New Estimation Techniques for Pricing Derivatives. London: Risk Books, 1998.
9780133354348_Book 1.indb 769780133354348_Book 1.indb 76 11/21/13 3:05 PM11/21/13 3:05 PM

CHAPTER 1 • RULE BASED VOLATILITY INVESTMENT 77
vol/variance is computed from option prices without the use of a spe-cific pricing model. If we use this model-free variance as our implied variance and high frequency data to compute the realized variance, as Bollersleve, Tauchen, and Zhou demonstrated,14 the resulting differ-ence is the variance/vol risk premium, which can be used to predict stock returns better than popular variables currently used such as the Profit/Earning ratio and the Profit/Debt ratio. This is an area of study with enormous potential that is ripe for exploration in the near future.
14 Bollerslev, Tim, George Tauchen, and Hao Zhou. “Expected Stock Returns and Variance Risk Premia.” Review of Financial Studies 22 (11) (November 2009): 4463–4492.
9780133354348_Book 1.indb 779780133354348_Book 1.indb 77 11/21/13 3:05 PM11/21/13 3:05 PM

This page intentionally left blank

Index
A actual volatility, 16 - 17
versus implied volatility, 20
allocation, rule based strategy, 150 - 154
applying filters
GARCH filter
applying to S&P 500 volatility strategy, 46 - 48
applying to swap rates volatility, 58 - 60
applying to USDJPY volatility strategy, 31 - 36
joint GARCH/VIX filter
applying to S&P 500 volatility strategy, 52
applying to USDJPY volatility strategy, 41
joint GARCH/vol curve filter, applying to swap rates volatility, 68 - 70
VIX filter
applying to carry investments, 96 - 103
applying to S&P 500 volatility strategy, 48 -52
applying to USDJPY volatility strategy, 36 - 41
165
volatility curve filter, applying to swap rates volatility, 63 - 66
AUDJPY versus risky assets, 89 - 92
avoiding risk in carry investments, market indicators, 96 - 103
B Barclay Systematic Trader index, 69
benchmarks
carry trade, 79
performance of versus carry investments, 95 - 97
returns in FX carry trades, 83 - 85
volatility portfolio, building, 69 - 74
Big Mac index, 121
Black Scholes model, 9
bonds, 115
value investing in sovereign bonds
fundamental rules, 135 - 138
technical rules, 139
Buffet, Warren, 89
building
momentum strategy, 103 - 104
volatility portfolio, 68 - 74
buy-and-hold strategy, 2 , 26
9780133354348_Book 1.indb 1659780133354348_Book 1.indb 165 11/21/13 3:05 PM11/21/13 3:05 PM
166 INDEX
C capital markets, volatility, 13 - 17
actual volatility, 16 - 17
historical volatility, 16 - 17
implied volatility, 16 - 17
measuring, 13
standard deviation, 13
swap contracts, 14
capturing persistent returns, 4 - 5
carry trade, 79
benchmark returns in FX carry trade, 83 - 85
equally weighted carry basket, 99
G10 carry basket, 92
performance of versus benchmarks, 95 - 97
risk of, 89 - 90
risk-adjusted performance of currencies, 85-86
rules for
diversification, 94 - 97
market indicators, reading, 96 - 103
momentum strategy, 103 - 104
Yen carry trade, 89 - 90
CDS (credit default swaps), 113 - 114
combining with fundamental macro-economic based ranking, 141 - 144
SCDS, 126 - 130
combining fundamental rules and risk indicators, 130 - 131
commodities, 9
credit worthiness of countries, measuring, 126 - 130
crisis events, effect on currencies, 122
currencies . See also currency markets
effect of crisis events on, 122
inflation, 122
intrinsic value of, determining, 121
currency markets
appreciation, 116 - 118
buy-and-hold strategy, 83
carry trade, 80
benchmark returns in FX carry trade, 83 - 85
equally weighted carry basket, 99
G10 carry basket, 92
momentum strategy, 103 - 104
performance of versus benchmarks, 95 - 97
risk-adjusted performance, 85-86
rules for, 94 - 97
Yen carry trade, 89 - 90
debts, 134
emerging market FX, rule based investment in, 118 - 119
fundamental rule based strategy, ranking, 123 - 126
D data mining strategies, 157
debts, 134
diversification
for carry investments, 94 - 97
general investment rules versus market expertise, 149
inverse volatility weighting, 150 - 154
9780133354348_Book 1.indb 1669780133354348_Book 1.indb 166 11/21/13 3:05 PM11/21/13 3:05 PM

INDEX 167
E economic growth, effect on stock
returns, 116
EM (emerging markets)
CDS, 113- 114
debts, 134
fundamental rules, combining with risk indicators, 130 - 131
FX, rule based investment in, 118 - 119
GDP, correlation to currency appreciation, 116 - 118
macro fundamentals, combining with market indicators, 141 - 144
SCDS, 126 - 130
value investing, 109 - 114
goals of, 112
risks, 111
in sovereign bonds,134 - 145
Engle, Robert, 17
equally weighted carry basket, 99
equity fund manager, selecting, 85
equity markets, S&P 500 volatility strategy, 44 -52
GARCH filter, applying, 46 - 48
examples of rule based volatility investments, 26 - 70
S&P 500 volatility strategy, 44 -52
GARCH filter, applying, 46 - 48
VIX filter, applying, 48 - 52
swap rates volatilty, 55 - 70
GARCH filter, applying, 58 - 60
joint GARCH/vol curve filter, applying, 68 - 70
volatility curve filter, applying, 63 - 66
USDJPY rule based volatility strategy, 27 - 41
GARCH filter, applying, 31 - 36
VIX filter, applying, 36 - 39
expertise, investing in what you know, 149
F fear of uncertainty, 25
Fed Funds Rates, 80
filters
CDS filter, 126 - 130
combining with fundamental macro-economic based ranking, 141 - 144
GARCH filter
applying to S&P 500 volatility strategy, 46 - 48
applying to swap rates volatility, 58 - 60
applying to USDJPY volatility strategy, 31 - 36
joint GARCH/VIX filter
applying to S&P 500 volatility strategy, 52
applying to USDJPY volatility strategy, 41
joint GARCH/vol curve filter
applying to swap rates volatility, 68 - 70
VIX filter
applying to carry investments, 96 - 103
applying to S&P 500 volatility strategy, 48 - 52
applying to USDJPY volatility strategy, 36 - 41
9780133354348_Book 1.indb 1679780133354348_Book 1.indb 167 11/21/13 3:05 PM11/21/13 3:05 PM

168 INDEX
volatility curve filter, applying to swap rates volatility, 63 - 66
forecasting, applying GARCH filter to rule based USDJPY volatility strategy, 31 - 36
fundamental rule based strategy
combining with risk indicators, 130 - 131
ranking, 123 - 126
value investing in sovereign bonds, 135 - 138
FX markets
carry trade
equally weighted carry basket, 99
momentum strategy, 103 - 104
performance of versus benchmarks, 95 - 97
risks of, 89 - 90
rules for, 94 - 97
Yen carry trade, 89 - 90
EM, rule based investment in, 118 - 119
equity fund manager, selecting, 85
fundamental rule based strategy, ranking, 123 - 126
rule based USDJPY volatility strategy, 27 - 41
GARCH filter, applying, 31 - 36
G G10 carry basket, 92
GARCH filter
applying to S&P 500 volatility strategy, 46 - 48
applying to swap rates volatility, 58 - 60
applying to USDJPY volatility strategy, 31 - 36
GDP, correlation to currency appreciation, 116 - 118
Global Macro strategy, 158
goals of EM value investing, 112
H-I hard currency denominated
debt, 134
Hedge Fund Index, 152
historical volatility, 16 - 17
implied volatility, 10 , 11 , 16 - 17
versus actual volatility, 20
inflation, 122
insurance, 11
CDS, 113- 114
interest rates
benchmark returns in FX carry trade, 83 - 85
Fed Funds Rates, 80
volatility, 57
inverse volatility weighting, 150 - 154
investing
quantitative investing, 159
uncorrelated investments, 149
value investing, 109 - 114
CDS, 113 - 114
EM, 109 - 114
in volatility portfolios, 71
J joint GARCH/VIX filter
applying to S&P 500 volatility strategy, 52
applying to USDJPY volatility strategy, 41
9780133354348_Book 1.indb 1689780133354348_Book 1.indb 168 11/21/13 3:05 PM11/21/13 3:05 PM
INDEX 169
joint GARCH/vol curve filter, applying to swap rates volatility, 68 - 70
K-L kurtosis profiles of currencies, 85
local currency denominated debt, 134
M macro/fundamental ranking,
126 - 131
market indicators, 19
avoiding risk in carry investments, 96 - 103
combining with macro fundamentals, 141 - 144
SCDS, 126 - 130
TED spread, 103
measuring
credit worthiness of countries, 126 - 130
volatility, 13
momentum strategy, building, 103 - 104
N-O naïve volatility strategy, 27
negative carry, 79
offshore trading, 116
P performance of benchmarks versus
carry investments, 95 - 97
persistent returns, capturing, 4 - 5
portfolio, building, 69 - 74
inverse volatility weighting, 150 - 154
positive carry, 79
PPP (purchasing power parity) rate, 115
profiting from volatility, 19 - 26
fear of uncertainty, 25
Sharpe ratio, 24
Q-R quantitative investing, 159
ranking
fundamental rule based strategy, 123 - 126
macro/fundamental ranking, 126 - 130
risk premium, 11 - 13
risk-adjusted performance of currencies, 85-86
risks
avoiding in carry investments, 96 - 103
combining with fundamental rules, 130 - 131
in EM value investing, 111
of FX carry trade, 89 - 90
macro/fundamental ranking, 126 - 130
rule based volatility investments
examples, 26 - 70
rule based USDJPY volatility strategy, 27 - 41
9780133354348_Book 1.indb 1699780133354348_Book 1.indb 169 11/21/13 3:05 PM11/21/13 3:05 PM

170 INDEX
rule based USDJPY volatility strategy
GARCH filter, applying, 31 - 36
VIX filter, applying, 36 - 41
S&P 500 volatility strategy, 44 - 52
GARCH filter, applying, 46 - 48
VIX filter, applying, 48 - 52
swap rates volatilty, 55 - 70
GARCH filter, applying, 58 - 60
joint GARCH/vol curve filter, applying, 68 - 70
volatility curve filter, applying, 63 - 66
S S&P 500 volatility strategy, 44 -52
GARCH filter, applying, 46 - 48
VIX filter, applying, 48 -52
SCDS (Sovereign Credit Default Swap), 126 - 130
selecting an equity fund manager, 85
Sharpe ratio, 24
skew profiles of currencies, 85
sovereign bonds, value investing, 134- 145
fundamental rules, 135 - 138
technical rules, 139
speculators, 10 - 11
standard deviation, 13
statistics, 19
stocks, 9
economic growth, effect on returns, 116
EM
goals, 112
risks, 111
value investing, 109 - 114
value investing, 109 - 114
variance of prices, 33
straddle, 44
swap contracts, 14
CDS, 113 - 114
swap rates volatilty, 55 - 70
GARCH filter, applying, 58 - 60
joint GARCH/vol curve filter, 68 - 70
volatility curve filter, applying, 63 - 66
Systematic Trader Index, 152
T technical rules, value investing in
sovereign bonds, 139
TED spread, 103
treasuries, 9
U uncertainty
fear of, 25
VIX filter
applying to carry investments, 96 - 103
applying to S&P 500 volatility strategy, 48 - 52
applying to USDJPY volatility strategy, 36 - 41
uncorrelated investments, 149
U.S. Federal Reserve, Fed Funds Rates, 80
9780133354348_Book 1.indb 1709780133354348_Book 1.indb 170 11/21/13 3:05 PM11/21/13 3:05 PM

INDEX 171
USDJPY rule based volatility strategy, 27 - 41
GARCH filter, applying, 31 - 36
VIX filter, applying, 36 - 39
V value investing, 109 - 114
CDS, 113 - 114
in emerging markets, 109 - 114
GDP, correlation to currency appreciation, 116 - 118
goals of, 112
risks, 111
sovereign bonds, 134- 145
variance
of stock prices, 33
swap contracts, 14
VIX filter
applying to carry investments, 96 - 103
applying to S&P 500 volatility strategy, 48 -52
applying to USDJPY volatility strategy, 36 - 41
volatility, 9
actual volatility, 16 - 17
in capital markets, 13 - 17
examples of rule based volatility investments, 26 - 70
rule based USDJPY volatility strategy, 27 - 41
Hedge Fund Index, 152
historical volatility, 16 - 17
implied volatility, 10 , 11 , 16 - 17
interest rates, 57
inverse weighting, 150 - 154
investing in through rules, 17 - 19
market indicators, 19
statistics, 19
measuring, 13
naïve volatility strategy, 27
profiting from, 19 - 26
fear of uncertainty, 25
Sharpe ratio, 24
risk premium, 11 - 13
swap contracts, 14
swap rates volatility, applying GARCH filter, 58 - 60
volatility curve filter, applying to swap rates volatility, 63 - 66
volatility portfolio, building, 69 - 74
W-X-Y-Z Yen carry trade, 89 - 90
9780133354348_Book 1.indb 1719780133354348_Book 1.indb 171 11/21/13 3:05 PM11/21/13 3:05 PM


