RUMINAL DEGRADABILITY OF SUBFRACTIONS OF PROTEIN SOURCES AS DETERMINED BY GEL ELECTROPHORESIS by Donato Romagnolo Thesis submitted to the Faculty of the Virginia Polytechnic Institute and State University in partial fulfillment of the requirements for the degree of Master of Science in Dairy Science APPROVED: J. H. Herbein February, 1988 Blacksburg, Virginia
Transcript
RUMINAL DEGRADABILITY OF SUBFRACTIONS OF PROTEIN SOURCES AS
DETERMINED BY GEL ELECTROPHORESIS
by
Donato Romagnolo
Thesis submitted to the Faculty of the
Virginia Polytechnic Institute and State University
in partial fulfillment of the requirements for the degree of
Master of Science
in
Dairy Science
APPROVED:
J. H. Herbein
February, 1988
Blacksburg, Virginia
LD 5~55 \jesS' ,/;93' R~~'!;
c" ~
RUMINAL DEGRADABILITY OF SUBFRACTIONS OF PROTEIN SOURCES AS DETERMINED BY GEL ELECTROPHORESIS
by
Donato Romagnolo
Committee Chairman: C. E. Polan Dairy Science
(ABSTRACT)
Degradability in the rumen of several protein sources
was determined by suspending from 12 to 13 g of feedstuff
in dacron bags into the rumen for 0, 2, 6, 12, 24, 36, 48,
and 72 h. Rumen cannulated lactating Holstein cows
consuming a diet of corn silage, alfalfa, soybean, and
high moisture corn were used. Degradability of protein
varied from 18.6% for corn gluten meal to 72.3% for
soybean meal. Gel electrophoresis was used to monitor
rates of degradation in the rumen of fractions of corn
gluten (CGM), CORN, cottonseed (CSM) , peanut (PM), and
soybean meal (SBM) protein fractions. Fractional
degradation rates in the rumen were determined from
densitometric analysis of stained polypeptides bands on
SDS-PAGE gels. Acidic subunits of soybean glycinin were
degraded at a faster rate than basic subunits(.144 vs .104
h- 1). Rates of degradation of zein in corn and corn
gluten meal were .026 and .015 h- 1, respectively. Protein
degradability estimated by using B subfractional
components did not differ from degradability measured
using total B fractions. Lag phase associated with dacron
bags suspension technique did not change effective
degradability. Protein solubility in SDS-PAGE sample
buffer was highly correlated ( R2 =.958) with in situ
protein degradability of CORN, CSM, DBG, FM, PM, and SBM.
Different rates of degradation of each fraction may
. directly influence protein and amino acid contribution to
the animal.
ACKNOWLEDGEMENTS
I wish to express my gratitude to Dr. C. E. Polan who gave
me the possibility of entering the Graduate School as
student in the Dairy Nutrition Laboratory. Since then I
had the opportunity to improve my scientific background
and to appreciate living with faculties and students at
Virginia Tech. This has been for me a wonderful
experience and I would like to acknowledge several people
who made this experience possible.
I am especially grateful to Dr W. E. Barbeau for his
guidance and advices throughout all my research project.To
Dr. J. H. Herbein for his help and suggestions and to Dr.
W. E. Vinson for serving in my graduate committee.
I am indebted to Ercole Zerbini for his friendship and
encouragements.
I would like to acknowledge Dr. R. E. Pearson and Dr. M.
L. Mc Gilliard, and Alan Pasquino for their assistance
during statistical analysis of the data.
I am also grateful to Wendy Wark for her technical
assistance and friendship and to W. Seymour, J. Spain, J.
Acosta, L. Novaes and my fellow graduate students for
their help and companionship.
I am grateful to my parents, Rosy and Giulio, who have
iv
shared with enthusiasm the difficulties of this experience
and always supported me.
Finally, but not less important, I wish to acknowledge
my wife, Ornella, whose love and support have been truly
indispensable. To her I would like to dedicate this
thesis.
.V
TABLE OF CONTENTS
ABSTRACT page
ii
ACKNOWLEDGEMENTS ................................... i v
LI ST OF TABLES ..................................... ix
LIST OF FIGURES.................................... x
LI ST OF ABBREVIATIONS .............................. xi i
VITA ................................................ 108
viii
LIST OF TABLES
table page
1 Diet composition 36
2 Fractional protein degradability of feedstuffs by dacron bag suspension technique ............... 52
3 Fractional dry matter degradability of feedstuffs by dacron bag suspension technique 54
4 Analysis of variance of protein fractions, rate of disappearance, and overall degradability ...... 55
5 In situ dry matter and protein degradability of feedstuffs by dacron bag suspension technique. 56
6 Relationship between in situ protein and dry matter degradability of several feedstuffs ....... 59
7 Comparison of protein degradability of feedstuffs to that reported in NRC(1985) .......... 61
8 Effect of rate of passage on protein degradability of feedstuffs estimated by dacron bag suspension technique ......................... 62
9 Protein degradability of B subfractions .......... 79
10 Comparison of protein degradability as measured by summation of subfractional components vs total B fracti on ....................................... 83
11 In situ degradability and solubility of protein in sample buffer ................................. 86
12 Correlation between in situ degradability and protein solubility in sample buffer ............. 88
13 Correlation between degradability in the rumen and in vitro techniques .......................... 89
14 Protein solubility of feedstuffs in different solvents ........................................... 91
15 Effect of lag phase on protein degradability of feedstuffs by dacron bag suspension technique .. 93
ix
LIST OF FIGURES
figure page
1 Schematic representation of corn protein separation procedure ............................. 33
2 In si tu bag technique ............. : ............. ~ 38
3 Effect of lag phase on protein degradability of feedstuffs by dacron bag suspension technique .. 43
4 Solubility in SDS-sample buffer .................. 45
5 5-15% SDS-PAGE linear gradient slab gel analysis of corn protein ......................... '. . . . . . . . 49
6 Densitometric analysis of corn prolamins ......... 50
7 pH and NH3-N concentration in rumen fluid of lactating dairy cows over 24h .................... 64
8 5-15% SDS-PAGE linear gradient slab gel analysis of protein supplements ........................... 67
9 10%SDS-PAGE slab gel analysis of soybean protein ......................................... 68
10 10% SDS-PAGE slab gel analysis of soybean seed protein after rumen incubation ............. 69
11 Densitometric analysis of soybean meal protein following ruminal incubation and electrophoretic separation on 10% 50S-PAGE ........................ 71
12 Densitometric analysis of rumen microbial protein following electrophoretic separation on 10% SDS-PAGE ............................................. 72
13 Densitometric analysis of corn protein following ruminal incubation and electrophoretic separation on 5-15% SDS-PAGE ..................... 74
14 Densitometric analysis of corn gluten meal protein following ruminal incubation and electrophoretic separation on 5-15% SDS-PAGE
x
75
15 Densitometric analysis of peanut meal protein following ruminal incubation and electrophoretic separation on 5-15% SDS-PAGE ...................... 77
16 Relationship between insolubility in SDS-sample buffer and in situ undegradability ............... 85
Protein sources were subjected to ruminal degradation,
washed and dried as described earlier. After
solubilization, solutes were used for gel electrophoresis.
By densitometric scanning an estimate of the relative
percentage of each fraction from 0 to 72 h was obtained.
This value was multiplied by the total residual nitrogen
(N x 6.25 ) after washing at a time and after "incubation
in the rumen from 2 to 72 h. The C component, not
degradable at 72 h, for each individual fraction was also
estimated, except for soybean which C fraction was
estimated at 48 h. Correction for insoluble protein in
SDS-sample buffer was performed. )
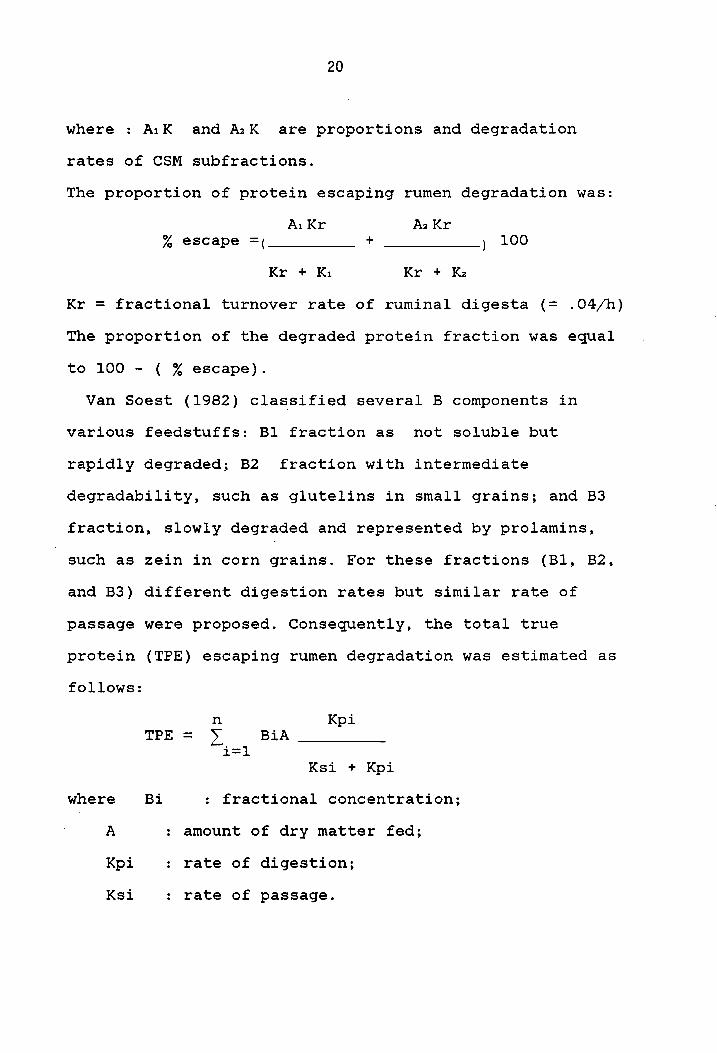
The following mathematical model for the B fraction was
applied:
KdB B Bij Kdij
KdB + KpB Kdij + KpB
where Bij = % of a single fraction at 0 time
KdBij = rate of degradation of the Bij fraction
KpB = rate of passage (.05/h)
B = total B fraction
KdB = rate of degradation of B fraction.
Values of each B subfraction at 0 h and its rate of
degradation were calculated by linear regression as
previously described (Figure 2).
42
Lag phase and in situ protein degradability
Effect of lag phase (to) on protein degradability of
feedstuffs by dacron bag suspension technique was
evaluated by using the model of McDonald (1981).
Percentage of protein disappeared (P) was related to time
of incubation by using the equation:
p = a + b ( 1 - e- kt)
The intercept at 0 time (a')was considered as the true
estimate of A fraction previously calculated by linear
regression.
Two equations were considered:
PI = a up to time to
P2 = a' + b' (l-e- kt) from time to onwards and
to = 11c In ( bl a' + b~ - a)
The equation describing the effective degradability
(P')was:
P'= a + (b' KdB)/(KdB+KpB) exp[-(KdB+KpB)to]
Two models (Figure 3) were used in this experiment to
describe the relationship between lag phase and percentage
of disappearance:
1) a=a', no lag phase was involved and
2) a'<a, where a lag time(to)was necessary before
disappearance of protein took place.
p
at. a
0
a = at
t = 0 o
43
a)
t
a
a'
Q
p
t.
at < a
t > 0 o
b)
Figure 3 - Effect of lag phase on protein degradabi I ity of feedstuffs by dacron bag suspension technique. P = percentage disappeared, t = lag phase a = soluble fraction, a' = trBe soluble fraction.
t
44
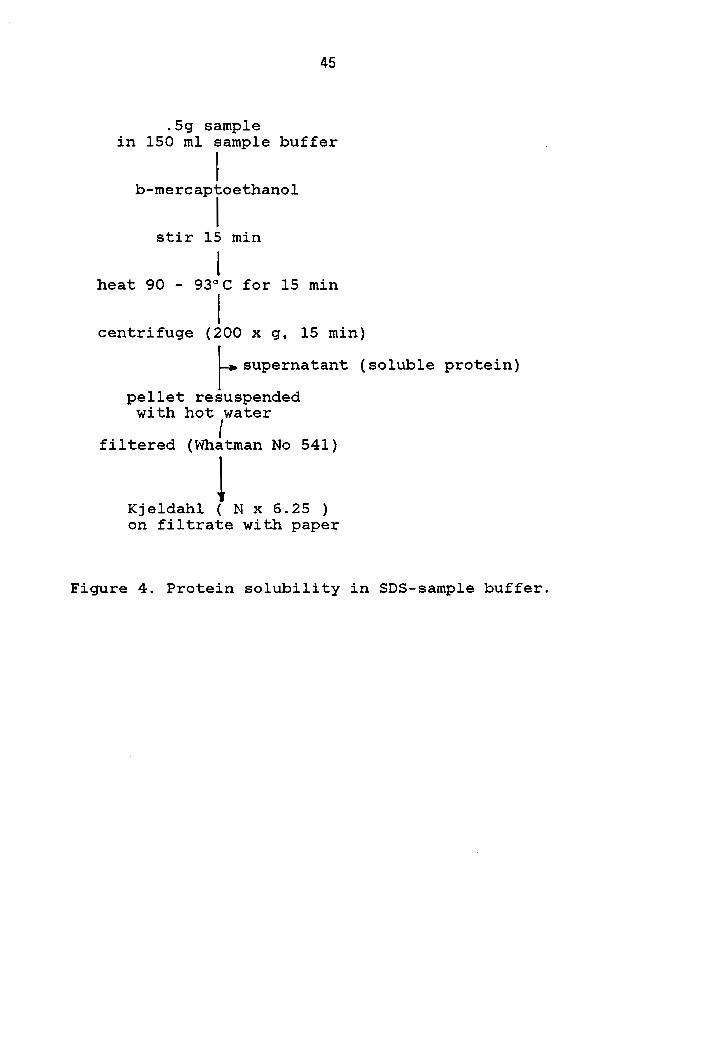
Solubility in Sample Buffer
An experiment was conducted in order to estimate the
potential solubility of protein in the electrophoretic
sample buffer. After source was ground through a .5 mm
screen, .5 g were added to 150 ml of SDS- sample buffer.
After mixing for 15 min by magnetic stirring, the
suspension was heated at 90-93°C for 15 min. The
suspension was then cooled at room temperature and
centrifuged at 200 x g for 15 min. The supernatant
containing soluble protein was discarded and the pellet
rinsed with hot distilled water through a 541 Whatman
hardened ashless filter paper. The insoluble residue and
the filter paper were used for determination of total
nitrogen (Nx6.25) by the Kjeldahl procedure. A scheme of
the solubility procedure is in Figure 4.
45
.59 sample in 150 ml sample buffer
I b-mercaptoethanol
I stir 15 min
1 heat 90 - 93°C for 15 min
I centrifuge (200 x 9. 15 min)
~supernatant (soluble protein)
pellet resuspended with hot water
I filtered (Whatman No 541)
1 Kjeldahl ( N x 6.25 ) on filtrate with paper
Figure 4. Protein solubility in SDS-sample buffer.
46
Statistical analysis
1) The following models were used to analyze the natural
logarithm of the percentage of degradable protein and dry
matter for each feedstuff separately:
Modell:
where; y ~ = percent degradable protein or dry matter
x~ = hours of incubation
e~ = residual error
Model 2: y~jk1 = U + C~ + Rj + Tk + CT~k + C~j + e~gk1
where: Y1jk1 = percent of degradable protein or dry
matter
Rj = jth replicate
i = 1-2
j = 1-2
k = 1-8
Differences between cows and replicates were tested
against C*R interaction. Time was tested against T*C
interaction.
2) Total degradability was estimated from the procedure
previously described using the intercept and slope
obtained from applying Model 1. These degradability
estimates were then tested using the following model:
where: Y1jk = total degradable protein or dry matter
47
= ith cow
= jth feedstuff
eijk = residual error.
i = 1-2
j = 1-8
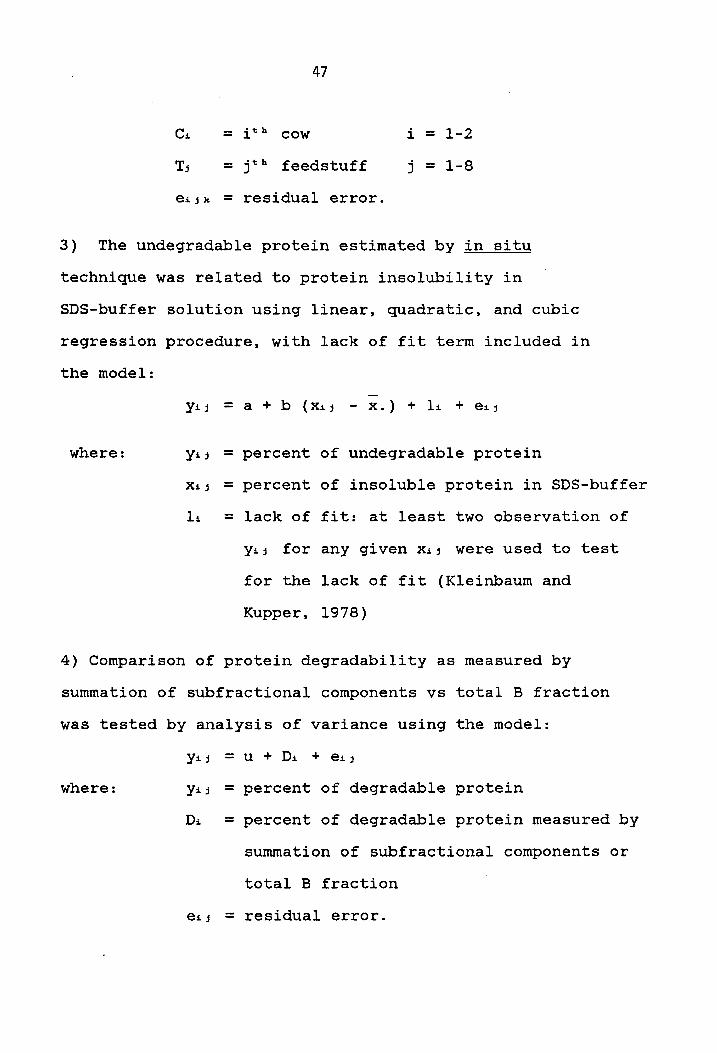
3) The undegradable protein estimated by in situ
technique was related to protein insolubility in
SDS-buffer solution using linear, quadratic, and cubic
regression procedure, with lack of fit term included in
the model:
where:
Yi j = a + b (Xi j
Yij = percent of undegradable protein
Xij = percent of insoluble protein in SDS-buffer
Ii = lack of fit: at least two observation of
Yij for any given Xij were used to test
for the lack of fit (Kleinbaum and
Kupper, 1978)
4) Comparison of protein degradability as measured by
summation of subfractional components vs total B fraction
was tested by analysis of variance using the model:
where:
Yij = u + Di + eij
Yij = percent of degradable protein
Di = percent of degradable protein measured by
summation of subfractional components or
total B fraction
eij = residual error.
RESULTS AND DISCUSSION
Separation of corn protein
Corn proteins separated by differential solubility are
in Figure 5. Samples b to e represent albumins and
globulins respectively. Several proteins over a large
range of MW were separated by SDS-PAGE. Even though some
polypeptide bands appeared to coincide. a different
SDS-PAGE pattern was obtained for albumins and globulins.
Corn prolamins were easily identified after SDS-PAGE
and appeared to be made of two major components of 24 and
22 kd. Densitometric analysis of corn prolamins extracted
in 50% v/v I-propanol were very similar with standard zein
visualized by SDS-PAGE (Figure 6). The bi-fractional
pattern of zein agrees with previous reports (Wilson.
1981).
Corn glutelins soluble in SDS-sample buffer also
appeared quite heterogenuous following 5DS-PAGE analysis
as previously reported (Wilson, 1981). Landry and Moureaux
(1981) have found that separation of three glutelin
components may be carried out in alcohol solution in
presence of reducing agents (mercaptoethanol) at alkaline
pH. In our experiment the pH of the 50S-sample buffer used
was 6.8 so that a limited extraction of glutelin proteins
may have occurred. However, Wilson et ale (1981) reported
that a similar profile was obtained between extraction of
48
a
49
b c d e f 9 h a
Figure 5 - 5-15% SOS-PAGE I inear gradient slab gel analysis of corn proteins; a)standard proteins: 97.4 kd phosphorylase b, 66 .2 bovine serum albumin, 42.7 ovalbumin, 31.0 carbonic anhydrase, 21.5 soybean trypsin inhibitor, 14.4 lysozyme; b) albumins(water), c)globulins(.5M NaCI), d)albumins, e)globulins, f)corn prolamins (50~ v/v 1-propanol), g)zein, and h) SDSsample buffer glutei ins. kd is kilodaltons.
kd
97.4
66.2
42.7
31.0
21.5
14.4
50
a b
Figure 6 - Densitometric analysis of corn prolamins: a)zein, b)corn prolamins extracted in 50% v/v t-propanol. Protein samples were analyzed on a 5-15% I inear gradient SOS-PAGE.
51
glutelins in SOS-sample buffer, termed SOS-glutelin (non
alkalated) and glutelins separated by alkalation in urea.
The sample buffer used by Wilson et ale (1981) consisted
of .05 M Tris buffer pH 7.0, 2 roM EDTA, 1% SDS, and 10%
glycerol. Either ME or OTT was used as reducing agent
without different effect on protein separation.
In situ degradability
Fractional protein degradability of several protein
sources as monitored by dacron bag suspension is
summarized in Table 2. As expected, there were
considerable differences among protein supplements
regarding fractional protein content and rates of
degradation of B fraction.
Fraction A ranged from 5.2% for CGM to 45.4% for DEHY.
Low values were obtained for CORN (11.4%), and SBM
(13.5%), whereas intermediate figures were seen for PM,
FM, OBG, and CSM.
B fraction was 85.9, 83.9, 75.7, and 70.2% for SBM, PM,
DBG, and CSM, respectively. CGM had a B fraction of 55.5%,
whereas low values were estimated for OEHY (34.4%) and EM
(31.0%). Corn had a fairly large B component and its rate
of degradation was .047 h- 1• Faster rates of B fraction
degradation for PM (.073 h- 1) and SBM (.108 h- 1
) are in
agreement with the well known susceptibility of oil seeds
proteins to ruminal degradation. OBG had a quite high B
52
Table 2. Fractional protein degradability of feedstuffs by dacron bag suspension technique 1
N fractions2 ( %) KdB (h- 1
)
Feed A B ~C ________ _
x SE
SBM 13.5 1.8
PM 22.4 2.0
DEHY 45.4 2.6
CSM 32.9 .7
CORN 11.4 1.6
DBG 19.9 3.4
FM 17.5 1.6
.CGM 5.2 1.1
x SE
85.9 1.8 .5 .01
75.7 2.0 1.9 .20
34.4 2.2 20.2 .70
59.5 .1 7.6 .80
83.9 1.3 4.7 .27
70.2 3.0 9.8 .48
31.0 1.5 51.5 .80
55.5 .6 39.3 1.20
x SE
.108- .004
.073 d .002
.043- .004
.041- c .002
.047- .002
.033 C .003
.022b .003
.016b .001
lValues are least square means. Means in the same column with different superscripts differ P<.05. Kp = rate of passage was assumed to be .Osjh.
2% of total protein.
3 Standard error of means.
53
fraction (70.2%) degraded at a rate of .033 h- 1•
A large C component (51.5%) similar to that reported by
Zerbini and Polan (1985) was estimated for FM as compared
to .5% observed for SBM.
Fractional composition of dry matter resembled protein
fractions content in feedstuffs (Table 3). Except for DEHY
and CGM. dry matter degradation rates of B fractions were
of the same magnitude of rates observed for protein B
fractions and they ranged from .019 to .112 for DEHY and
SBM t respectively.
Overall protein degradability was similar within each
feedstuff regardless of which of two cannulated cows were
used. No cow*feed interaction was observed (Table 4).
Comparison between least square-means was performed after
significant differences were obtained among feedstuffs.
In situ dry matter and protein degradability of
feedstuffs are given in Table 5. Protein degradability
of CGM was only 18.6% as compared to 55% reported by the
NRC (1985). Protein degradability of 14% for CGM has
previously been reported (Stern et ala 1980). Stern and
Satter (1982) suggested that CGM may form a viscous mass
inside the bag. so that attack by microorganisms is
severely delayed. Also. the washing technique performed
after removal of the bag from the rumen. may not be as
effective. Protein ruminal degradation of DBG was 47.9%.
54
Table 3. Fractional DM degradability of feedstuffs by dacron bag suspension technique1
Feed DM Fractions.3 % KdB
A SE B SE C SE SE'
SBM 35.7 3.1 62.5 3.1 1.8 .10 .112£ .003
PM 39.7 1.7 54.1 1.7 6.2 .15 .718- .002
DEHY 28 .. 3 2.3 31.4 2.0 40.3 .85 .019a .010
CSM 36.3 1.3 47.3 .6 16.4 .88 .044<: .004
CORN 14.6 3.0 79.5 2.7 5.9 .30 .053b .003
DBG 29.4 1.6 48.0 1.4 22.6 .30 .349d .003
FM 23.4 1.8 22.0 1.2 54.6 .62 .022- .002
CGM 14.9 1.2 56.8 .4 28.3 .83 .026a .001
lVa1ues are least square means. Means in the same column with different superscripts differ (P<. 05) .. Rate of passage was assumed to be .05/h.
2% of total protein 'Standard error of means
55
Table 4. Analysis of variance10f protein fractions, rate of disappearance, and overall protein degradability2 ..
N fractions % KdB Variable
A B C (h- 1 )
Cow .33 .55 .10 .64
Feed .0001 .0001 .0001 .0001
Cow*Feed .92 .92 .25 .59
IValues are levels of significance (PR>F) 2 n = 32
Degradability
%
.18
.. 0001
.98
56
Table 5. In situ dry matter and protein degradability of feedstuffs by dacron bag suspension technique1
Degradabi Ii ty2 (%) Feed
dry matter protein
X SE X SE3
SBM 78.89 1.3 72.3£ .9
PM 71.6£ .8 67.2- 1.3
DEHY 35.9- 4.1 61.2- 1.2
CSM 58.3° .8 59.7- 1.0
CORN 55.Sb 1.8 52.2e 1.3
DBG 49.14 .9 47.9° 2.1
EM 30.0- 1.4 27.14 1.3
CGM 34.4- 1.6 18.6b 1.8
1 Values are least square means. Means in the same column with different superscripts differ P<.05. Kp = rate of passage was assumed to be .05jh.
2 % of total dry matter or total protein.
3 Standard error of means.
57
Identical numerical values were previously reported by
Stern et ale (1980). Armentano et ale found an in situ
degradation for DBG of 45%.
DEHY has shown a higher degradability value (61.2% vs
38%) as compared to that reported by Ruminant Nitrogen
usage (NRC,1985). This ·was probably due to its high A
fraction (45.4).
An overall protein degradability of 27% was calculated
for FM. This value is lower than reported in the
literature probably due to the smaller A fraction (17.5%)
of FM used in this experiment. Recently, Chapin et
al.(1986) have shown that a ration 2:1 FM:SBM fed to
lactating cows receiving a corn silage-based diet,
resulted in increased microbial nitrogen flow to the
duodenum. In addition, Zerbini and Polan (1985) had
previously found that FM enhanced greater rates of gain
for ruminating calves than CGM or CSM. This indicates that
FM may be a useful source of by-pass protein.
Underestimation of FM degradability by the in situ
technique has been suggested by Meyer et ale (1986). These
authors pointed out that the number of proteolytic
bacteria inside bags containing FM was lower than that
inside bags containing corn. They concluded that the low
level of carbohydrates in FM may be a limiting factor for
activity of proteolytic microorganisms.
58
Overall in situ protein and dry matter degradability
estimates should be expected to be related to some extent.
This is summarized in Table. Most feedstuffs had similar
degradability for dry matter and protein. Exception were
DEHY and CGM.
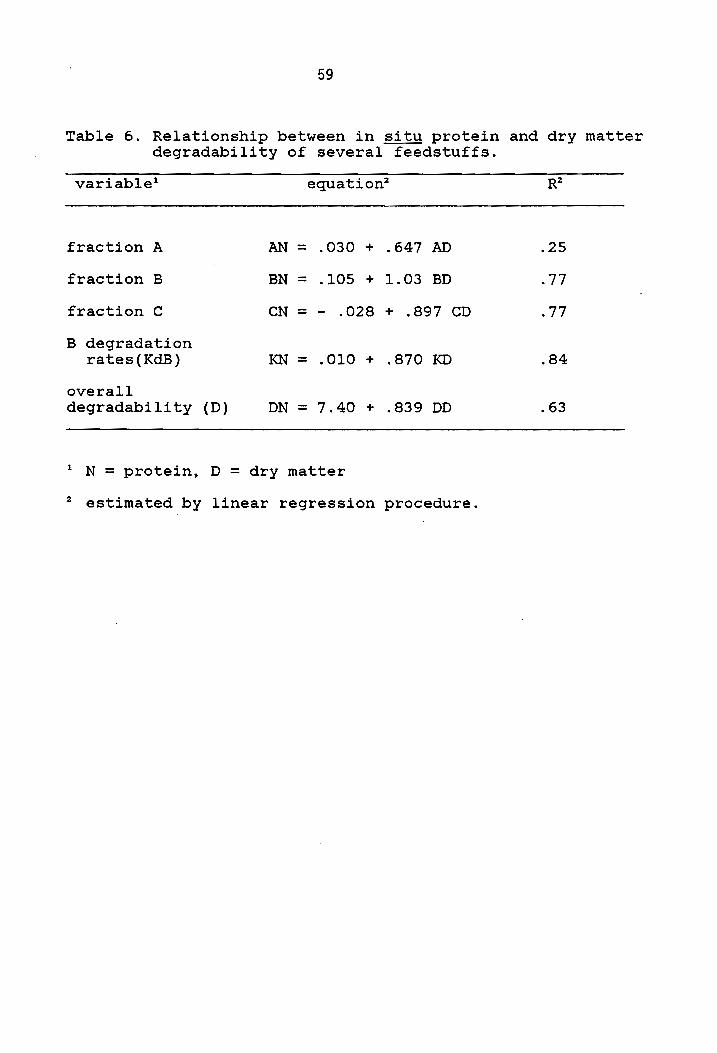
Relationship between in situ protein and dry matter
degradab11ity of feedstuffs are summarized in Table 6. A
R2 of .84 was calculated for protein and dry matter
degradability rates (KdB) by linear regression analysis.
Lower associations were obtained for Band C fractions,
and overall degradability (.77, .77. and .63,
respectively). Protein and dry matter fractions were least
correlated (R2 =.25).
It appears that two major factors affected protein and
dry matter degradability of different feedstuffs: 1)
extent of A and B fractions and 2) rates of degradation
KdB. Large B values associated with high ruminal
digestion rates lead to extensive degradability in the
rumen.
The ratio between A and B components must be taken into
consideration when assessing degradability of several
feedstuffs. This will have a great impact on efficiency of
protein and dry matter utilization by microorganisms. A
large quantity of readily degradable protein (A fraction)
would be, in fact, of limited usefulness if not associated
59
Table 6. Relationship between in situ protein and dry matter degradability of several feedstuffs.
variable1 equation2
fraction A AN = .030 + .647 AD .25
fraction B BN = .105 + 1.03 BD .77
fraction C CN = - .028 + .897 CD .77
B degradation rates(KdB) KN = .010 + .870 KD .84
overall degradability (D) DN = 7.40 + .839 DD .63
1 N = protein, D = dry matter
2 estimated by linear regression procedure.
60
with readly available fermentable carbohydrates. Overflow
of ammonia would result in losses of dietary nitrogen. On
the other hand, slowly degradable protein (B fraction)
must be supplied to sustain microorganism activity.
Consequently, in addition to formulating diets based on
overall protein degradability, fractional components
should also be considered.
Comparison of protein degradability values obtained in
this experiment with those published by the NRC (1985) are
in Table 7. Results of this study were in good agreement
with NRC (1985) values except for CGM and DEHY.
A ruminal rate of passage of .05 h- 1 was assumed in this
experiment. Recently Erdman et al. (1987) reported no
difference for rate of passage in cows during early
lactation for supplemental feedstuffs. The average rate
was .047/h-l. Cows were fed a corn silage-based diet with
a 50% forage:concentrate ratio. Similarly, Stern et ale
(1980) had previously found that rate of passages for SBM,
DBG, and CGM were .05, .045, and .053/h.
In Table 8, protein degradation is calculated by using
either a value of .05 or .08 h- 1• Rates of degradation as
well as fractions A and B were held constant. Increasing
the rate of passage from .05 to .08 h- 1 caused predicted
rumen degradability of corn to decline 10% . It has
previously been found (Orskov, 1982) that for feedstuffs
61
Table 7. Comparison of protein degradability of feedstuffs used in this study to that reported in NRC (1985) .
Figure 7 - pH and ammonia nitro en concentration in rUInGfI fluid of lactating dairy COYIS over- /411. **** pH, -- Ammonia nitro(lon o cow # 1 7 9 3 , 1 co vi II 1 6 ':] 5 ObOO and 1400 food i n~J t i rne
pH
m .a::::.
65
ration twice a day and received 35% of their ration at
0600 hand 65% at 1400 h. It can be seen that within two
h post feeding both pH and NH3-N levels increased
dramatically. A decrease was instead observed from h 2000
to 0600. Consequently, depending on time chosen for their
suspension, rumen bags may be affected by different rumen
environment. Increase of NH3-N concentration in rumen
fluid up to 2 h post feeding has been previously reported
(Grummer and Clark,1982).
It is difficult to assess whether levels of NH3-N at the
2 h interval negatively affected microbial proteolytic
activity as suggested by Grummer and Clark (1982). These
authors observed a lag phase in rate of protein
degradation during 1 to 4 h of incubation. However, no
soaking of the bags prior to inCUbation was performed in
that experiment. It is possible that the rapid degradation
of soluble protein (17.8 to 50.1% of total protein) inside
the bags may have caused a sharp increase in NH3-N
followed by a period of reduced microbial activity.
Electrophoretic analysis
Gel electrophoresis was used to monitor subfractional
components and rates of degradation in the rumen of CGM,
CORN, CSM, PM, and SBM protein fractions.
66
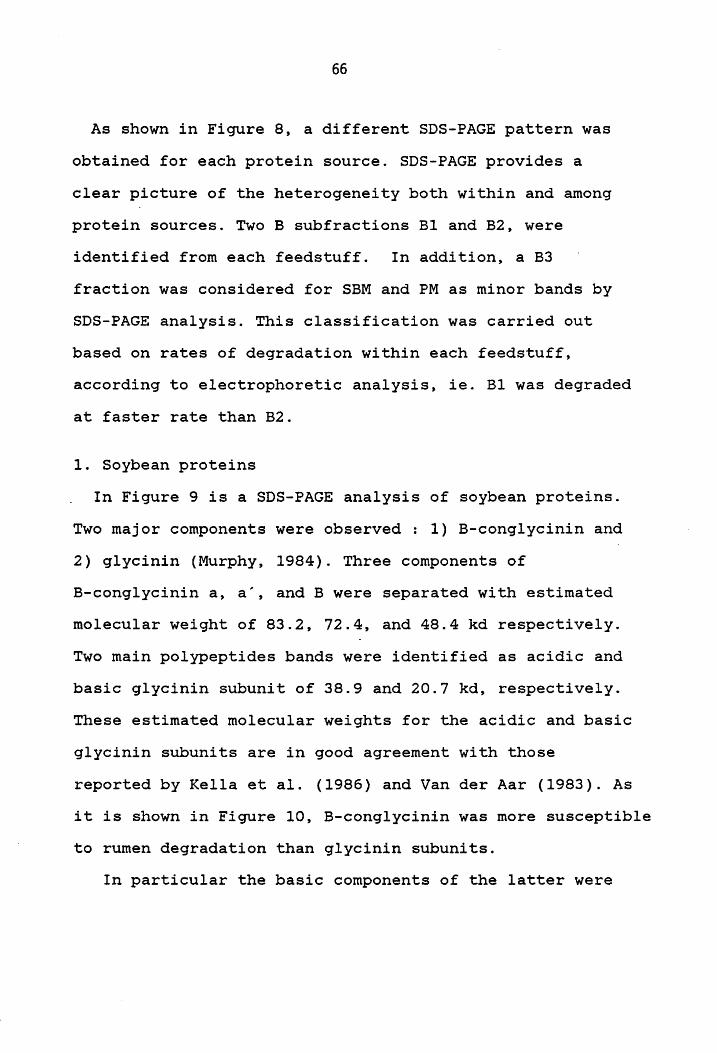
As shown in Figure 8, a different SDS-PAGE pattern was
obtained for each protein source. SDS-PAGE provides a
clear picture of the heterogeneity both within and among
protein sources. Two B subfractions B1 and B2, were
identified from each feedstuff. In addition, a B3
fraction was considered for SBM and PM as minor bands by
SDS-PAGE analysis. This classification was carried out
based on rates of degradation within each feedstuff,
according to electrophoretic analysis, ie. B1 was degraded
at faster rate than B2.
1. Soybean proteins
In Figure 9 is a SDS-PAGE analysis of soybean proteins.
Two major components were observed : 1) B-conglycinin and
2) glycinin (Murphy, 1984). Three components of
B-conglycinin a, a', and B were separated with estimated
molecular weight of 83.2, 72.4, and 48.4 kd respectively.
Two main polypeptides bands were identified as acidic and
basic glycinin subunit of 38.9 and 20.7 kd, respectively.
These estimated molecular weights for the acidic and basic
glycinin subunits are in good agreement with those
reported by Kella et ale (1986) and Van der Aar (1983). As
it is shown in Figure 10, B-conglycinin was more susceptible
to rumen degradation than glycinin subunits.
In particular the basic components of the latter were
67
kd
97.4
66.2
42.7
31.0
21.5
14.4
a b c d e f
Figure 8 - 5-15% SDS-PAGE I inear gradient slab gel
analysis of alcorn gluten meal, blsoybean
meal, clpeanut meal, dlcottonseed meal,
e)corn, and flstandard proteins.
kd is kilodaltons.
68
0(-
f3 - Conglycinin Q(~
(3-
A-
Glyc inin
8-
a b
Figure 9 - 10% 5 0S-PAGE slab gel anal y sis of soybean seed proteins: a)soybean, b)standard proteins. kd is kilodaltons.
kd
97.4
66.2
42.7
31.0
21 . 5
14.4
kd
97.4
66.2
42.7
31.0
21.5
14.4
69
2
d b c d e f 9 h
Figure 10 - 10% SOS-PAGE slab gel analysis of seed proteins. Hours are specific times .after rumen incubation with dacron bags. a)standard proteins, b) not incubated soybean, c-h) i ncubated soybean, i )rumen bacterial proteins, 1)lysozyme. kd is kilodaltons.
70
degraded at a slower rate as monitored by densitometric
analysis (Figure 11). Subfractional changes were not
detected until 12 h incubation, however, from 24 h onward,
SBM subractions degradation became evident.
Previous reports have indicated that basic subunits of
glycinin are more resistant to in vitro enzymatic
hydrolysis than acidic polypeptides (Kella et al.,
1986). In that study reduction of intramolecular S-S
bridges decreased the rate of pepsin hydrolysis of basic
glycinin subunits. The authors suggested that reduction of
disulfide bonds caused a change in conformational
structure of basic polypeptides favoring hydrophobic
interactions. If we consider that reducing conditions are
also present in the rumen environment, perhaps the
existence of disulfide bridges is less meaningful in
describing sensitivity to ruminal degradation than
previously reported by in vitro studies (Nugent and
Mangan, 1978).
In vitro ammonia production in rumen fluid solution was
used to monitor ruminal protein degradation of SSM (Van
der Aar et al., 1983). More rapid deamination of
conglycinin as compared to basic subunits of glycinin was
observed. These authors suggested that a lower ratio of
conglycinin + acid glycinin to basic subunits may improve
utilization of SSM in ruminants. Alcohol treatment (40 to
71
B2
o h 12 h
B
I
I )1
1 I
JJj~~
2 h 24 h
6 h 36 h
48 h
Figure 11 - Densitometric analysis of soybean meal proteins following ruminal incubation and electrophoretic separation on 10% 50S-PAGE. Hours are specific times of rumen incubation. o 1 = 38. 9 k i 10 d a I to n s 82 = 20.7 k i I ada I tons
72
60% v/v) in that experiment reduced the proportion of
conglycinin polypeptides as monitored by SDS-PAGE.
Consequently, processing of SBM was suggested to promote
changes of the protein profile. On the other hand, these
authors did not relate their finding to any in vivo
measurement and no rates of degradation of individual
subfraction were reported.
In order to assess for microbial protein contamination
of the residues following washing of the bags, rumen
bacteria were obtained from rumen fluid as previously
described (Chapin, 1986). Lyophylized rumen bacterial
proteins were analyzed by SDS-PAGE (Figure 10). Column i
shows that microbial contamination was not affecting the
SDS-PAGE profile of SBM protein. Even though minor bands
were detected at 35, 41, and 50 kd, there was not
overlapping with major protein fractions. It was concluded
that microbial protein contamination of feedstuffs
analyzed by SDS-PAGE did not probably affect the estimated
fractional degradation rates. A densitometric reading of
ruminal microbial protein is given in Figure 12.
2. Corn proteins
Densitometric analysis of corn and corn gluten meal
proteins after rumen incubation is shown in Figure 13 and
14. It appears that for both feedstuffs the zein
component (B2) of prolamin fraction was relatively
...... migration
73
Figure 12 - Densitometric analysis of rumen microbial protein following electrophoretic separation on 10~ 50S-PAGE.
74
:82
o h 24 h
2 h 36 h
6 h 48 h
12 h 72 h
Figure 13 - Densitometric analysis of corn proteins following ruminal incubation and electrophoretic separation on 5-15%SDS-PAGE. Hours are specific times of rumen incubat ion.
B2 = 22 and 24.0 ki lodaltons
75
B2
o h 24 h
2 h 36 h
6 h 48 h
12 h 72 h
Figure 14 - Densitometric analysis of corn gluten meal proteins following ruminal incubation and electrophoretic separation on 5-15% 50S-PAGE. Hours are specific times of rumen incubation. t:32 = 22 and 24 .. 0 ki lodaltons
76
resistant to ruminal degradation. Zein hydrophobic nature
was probably responsible for its low utilization by
microorganisms (Ely et al., 1967).
Broderick (1982) reported that ammonia released during
in vitro incubation of zein with rumen inoculum was .79
umole/h/ml of ruminal liquor as compared to 5.26 and 4.26
for CSM and casein. Even though in vitro release rates of
ammonia may have been confounded by microbial uptake of
ammonia and amount of energy available to them it did
appear that zein was minimally degraded.
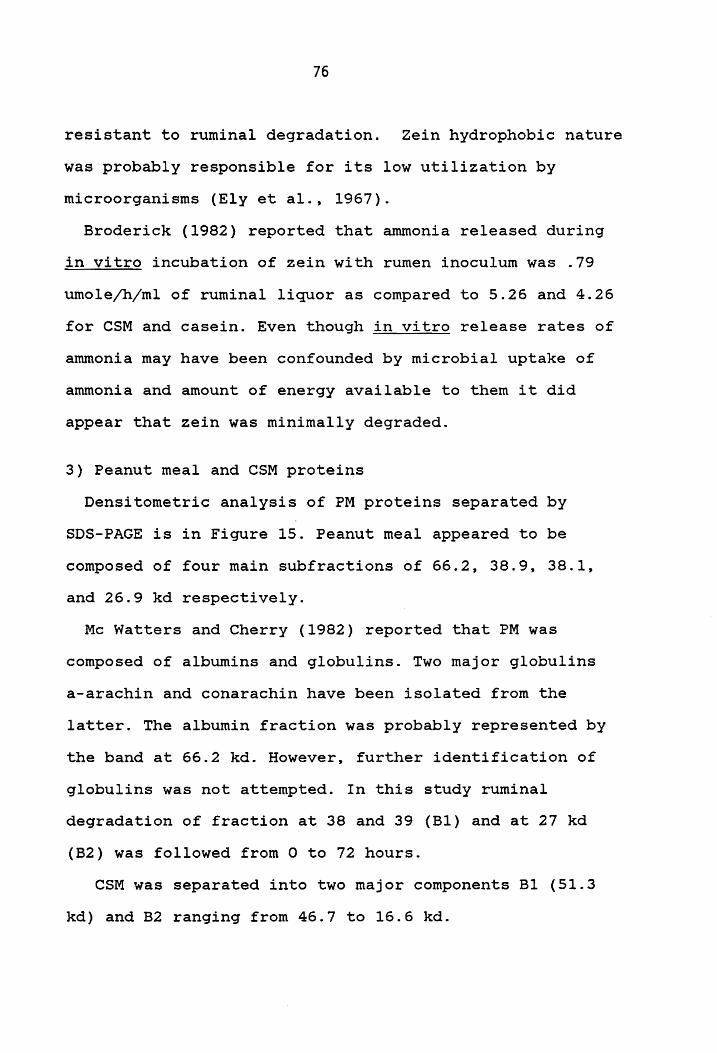
3) Peanut meal and CSM proteins
Densitometric analysis of PM proteins separated by
SDS-PAGE is in Figure 15. Peanut meal appeared to be
composed of four main subfractions of 66.2, 38.9, 38.1,
and 26.9 kd respectively.
Mc Watters and Cherry (1982) reported that PM was
composed of albumins and globulins. Two major globulins
a-arachin and conarachin have been isolated from the
latter. The albumin fraction was probably represented by
the band at 66.2 kd. However, further identification of
globulins was not attempted. In this study ruminal
degradation of fraction at 38 and 39 (Bl) and at 27 kd
(B2) was followed from 0 to 72 hours.
CSM was separated into two major components Bl (51.3
kd) and B2 ranging from 46.7 to 16.6 kd.
77
B1 B2
o h 12 h
2 h 24 h
6 h 48 h
72 h
Figure 15 - Densitometric analysis o~ Jean~t meal proteins following rU!"'linal incubation and electrophoretic separation on 5-15% SDS-PAGE. Hours are specific times of rumen i ncubat ion.
81 = 38 and 39.0 ki lodaitons 32 = 27.0 kilodaltons
78
Digestion rates of subfractions
Following identification of major peaks by 50S-PAGE
separation and densitometric analysis, estimation of rates
of degradation was performed by linear regression. This is
summarized in Table 9.
For CGM, CORN, and CSM two B subfractions were
considered whereas for PM and SBM a third component (B3)
was obtained. CGM subfractions B1 and B2 (zein) were
degraded at a rate of .018 and .015 h- 1• B1 and B2
represented 30 and 25.4 % of total protein. The zein
fraction in CGM was estimated 44.1% of total protein (as
the sum of 25.4% degradable plus 18.7 not degradable at
72 h). Similarly, corn zein was degraded quite slowly:
.026h- 1 as compared to B1 (.06h- 1), indicating that in
both feedstuffs this component was relatively resistant to
ruminal degradation.
Attempts to identify B subfractional components of corn
proteins are reported in the literature. Van Soest (1982)
suggested that corn prolamins were relatively resistant
to ruminal degradation as compared to glutelins, however,
no measurement of their rate of degradation was reported.
From this study it appears that zein is the corn protein
most resistant to ruminal breakdown as previously
suggested. It is important to consider that zein labeled
79
Table 9. Protein degradability of B subfractions 1 .
B Fractions2 % KdB3
Feed
B1 B2 B34 B1 B2 B3
CGM 30. O· 25.4- .018- .015a
CORN 68.7b 16.1b .060b .026& b
CSM 15.0c 46.0c .069b .035b
PM 25.6- 17.9b 32.1 & .103c .066c .060-
SBM 21.5& c 21.3c 44.1b . 144d .104d .107b
lValues in the same column with different superscripts differ (P<.05)
2Values are % of total protein 3Degradation rates (h- 1
)
4B3 represents minor bands obtained by SDS-PAGE separation and was calculated by difference
80
as B2, is the~major component of corn prolamins but not
the only one. In this study other small components were
present, therefore it is likely that the fraction refered
to here as B2 is in reality only a portion of corn
prolamins.
CSM had two B components of 15 (B1) and 46% (B2)
degraded at a rate of .069 and .035h- 1 , respectively.
Higher rates of degradation for this feedstuff as compared
to CORN or CGM agrees with known higher degradability
value for CSM. Little is known about characteristics of
subfractional components of CSM. Broderick and Craig,
using in vitro incubations pointed out that CSM contained
two protein'fractions degraded at two different rates.
Comparison of results obtained in this study with those
of Broderick and Craig (1980) appears difficult. However,
the two rates obtained represent a faster (.069) and
slower (.035) degradable fraction which would contribute
to the overall rate of degradation of B fraction (.041)
found in this experiment.
For PM three B components were considered. B1 (25.6%)
was degraded at a rapid rate (.103 h- 1). Even though
identified as different polypeptides by SDS-PAGE, B1 and
B2 differed little in their digestion rates (.066 and
.060, respectively).
Subfractional digestion rates of SBM were also
81
estimated. Acidic and basic subunits of glycinin were
degraded at rates of .144 and .104 h- 1• Both represented
about 21% of total protein.
Previous findings (Van der Aar, 1983) have shown that
fractions rich in conglycinin were deqraded faster than
basic subunits of glycinin in an in vitro system. In
addition, recently Kella et ale (1986) have demonstrated
that basic polypeptides were more resistant to pepsin
digestion. The use of a reducing agent apparently
increased hydrophobic interactions among basic
polypeptides. Similarly, reducing 'conditions in the rumen
environment may mimic what happened in the in vitro
experiment. It may be similar to zein proteins, where the
extent·of ruminal degradation could be, in fact, partially
determined by the relative hydrophobicity of protein
components.
Even though three B components were considered for SBM
following separation by SDS-PAGE, B2 and B3 did not differ
in their rate of degradation. So, from a quantitative
point of view, two main components could be considered.
This is in agreement with previous findings (Van
Soest,1982). Using in vitro proteases these workers
'calculated a rapidly (B1) and slowly (B2) degradable
component. In our work B2 and B3 SBM fractions were
pooled together: B1 and B2 + B3 accounted for 24.7 and
82
86.9% of B proteins, respectively. However, the amino
acid composition of B2 and B3 is probably different.
Degradability of subfractions
Estimates of B subfractional compone~ts and rates of
degradation were used to predict degradability of protein
using the model previously described. Table 10 compares
degradability values as calculated by summation of
degradability of B subfractional components vs
degradability as measured by loss of entire B fraction.
The discrepancy was only 1 to 2% and was not statistically
significant. This agrees with the theoretical assumption
.that the overall degradability is the result of
degradation of fractional components for which a certain
rate of degradation exists.
Little is published on B subfractional components. Zinn
et ale (1981) considered B fractional degradation rates
from 4 to 12 h (B1) and from 12 to 24 h (B2). In other
words, it was assumed that the B1 and B2 fractions were
completely degraded at 12 and 24 h respectively. Even
though this approach may be quantitatively correct, these
authors did not consider that each individual subfraction
has a certain pattern of degradation. In our study, it was
shown that each B component is potentially degraded from
o hour of incubation onward. Different rates of
degradation for various fractions is probably associated
83
Table 10. Comparison of protein degradability as measured by summation of subfractional components vs total B fraction.
Nitrogen Degradability l % feed
B subfractions Total B fraction
CGM 18.86
CORN 54.44
CSM 60.14
PM 67.24
SBM 73.84
n 8
lValues are % of total protein 2Values are significance levels 3 n=number of observations
18.56
52.19
59.78
66.93
72.30
8
.91
.25
.84
.87
.72
84
with differential rates of amino acid degradation, as
earlier mentioned. Consequently, if we consider there is
a remarkable variation in amino acid composition among
fractions and the amino acid profile of microbial protein
is relatively constant, the contribution given by each
individual polypeptide to the amino acid pool reaching the
lower tract may be better understood.
Solubility in sample buffer and ruminal degradation
Estimation of solubility in sample buffer was originally
carried out in order to correct for the portion not
accounted for by gel electrophoresis analysis.
Furthermore, prote~n solubility in SDS-PAGE system was
compared to protein deqradability in the rumen to
determine if any desirable relationship exists. Table 11
reports on % of insoluble protein vs % of non degradable.
All feedstuffs used in the bag experiment were included.
Results showed that an increase in % of insoluble protein
was associated with increased undegradable protein.
However, CGM did not fit this trend. In fact a value of
3.2% of insoluble crude protein was associated with an
extreme undegradability (81.4%). Departure from the
general trend was also observed for DEHY (Figure 16).
Correlations between in situ degradability and in vitro
solubility were investigated by lack of fit test and
regression procedure for corn, CSM, DBG, PM, FM, and SBM.
85
100
80 I (CGM)
I (FM)
...... 60 ~ '-'
E-t 0 ~ ~
C.!) Q Z ::::I 40 I
(DEHY)
20
UNDG PROT = 6.77 + 3.51 INSOL - .05 I~SOL2 o
10 20 30 40
INSOL (%)
Figure 16 - Relationship between insolubi I ity in 50S-sample buffer and in situ undegradabi I ity of several feedstuffs. UNOG PROT = undegradable protein IN10L = insoluble protein (R = .958, when CGM and DEHY were excluded).
86
Table 11. In situ protein degradability and solubility of protein in sample buffer
Feed n % Insoluble % Undegradable
mean + SD
CGM 4 3.19 .45 81.4
SBM 4 7.09 .94 27.7
PM 4 10.60 1.79 32.8
CSM 2 10.75 1.12 40.3
DBG 2 14.22 .99 52.1
CORN 2 16.25 .69 47.8
.DEHY 2 34.83 .52 38.8
FM 2 36.12 .79 72.9
n = number of observations
87
Lack of fit test was significant for all models
considered. However. a R2 of .904 for the linear equation
was estimated. The R2 improved to .96 when a quadratic
model was used (Table 12). It was concluded that probably
the quadratic model was better relating the two variables
of interest. Since the R2 obtained with the quadratic
model was quite satisfactory no cubic components were
included. Also visual examination of the data suggested
that the quadratic model best fits the data and inclusion
of a third power component was not justified.
Even though the results obtained by this experiment were
not successful for all feedstuffs it appeared that a good
correlation between solubility and in situ degradability
was described for most of the important protein sources.
If loss of feed particles from the bag occurred for DEHY,
this would explain the higher degradability obtained for
this feedstuff in this experiment.
Numerous studies have been conducted in the last few
years trying to develop an in vitro assay to predict
ruminal degradation of dietary protein (Table 13). A large
experiment conducted by Stern and Satter (1984) with 34
diets studied a correlation of .79 between in situ
degradation at 1 h in the rumen and protein solubility in
10% mineral buffer. However. a correlation coefficient of
.26 was estimated between in vivo protein degradation and
88
Table 12. Correlation between in situ protein degradability and protein solubility in sample buffer-
Model
Linear
Quadratic
Cubic
** **
**
UNDG PROT= 23.2+1.44 INSOL .904
UNDG PROT = 6.8 + 3.5 INSOL .958 -.05 INSOL2
• CORN, CSM, DBG, FM, PM, SBM were used for this analysis bLOF = Lack of Fit test ** P < .01 Cby Regression Procedure
89
Table 13. Correlation between protein degradability in the rumen and in vitro techniques
t Reference
Stern and Satter,
(1982) 1
Poos et al (1985 )2
lab technique
10% mineral buffer
.15M NaCl
10% Burroughs solution
.02N NaOH
Hot water
bicarbonate phosphate buffer"
Crawford et ale (1978) 3
Streptomyces griseus (1 h)
Ficin (4 h)
10% Wise Burroughs
.. 15M NaCI
Autoclaved rumen fluid
1 From 34 diets ..
ruminal degradation
in situ in vito
.79 .26
.65
.69
.56
.86
.. 87
.86
.94
.94
.77
.77
2Eight protein supplements, meat meal was excluded. 30n l y concentrates, wheat and oats were excluded.
growth trials
.28
.66
.53
.81
.86
.78
.90
90
protein solubility. It was concluded that t even though the
in situ technique is better related to protein solubility
than to in vitro estimates t testing of a large set of
diets is not practical.
Several solubility assays were studied by Waldo and
Goering (1979) and have been previously discussed. None of
them was related to in situ nor in vivo estimation of
ruminal protein degradation.
Poos-Floyd et al. (1985) found a correlation coefficient
of .87 between solubility in bicarbonate phosphate buffer
and in vivo degradability. The correlation was .94 when
ficin was used in vitro. However, specificity of the
enzyme for certain types of protein may reduce the number
of protein sources that can be tested.
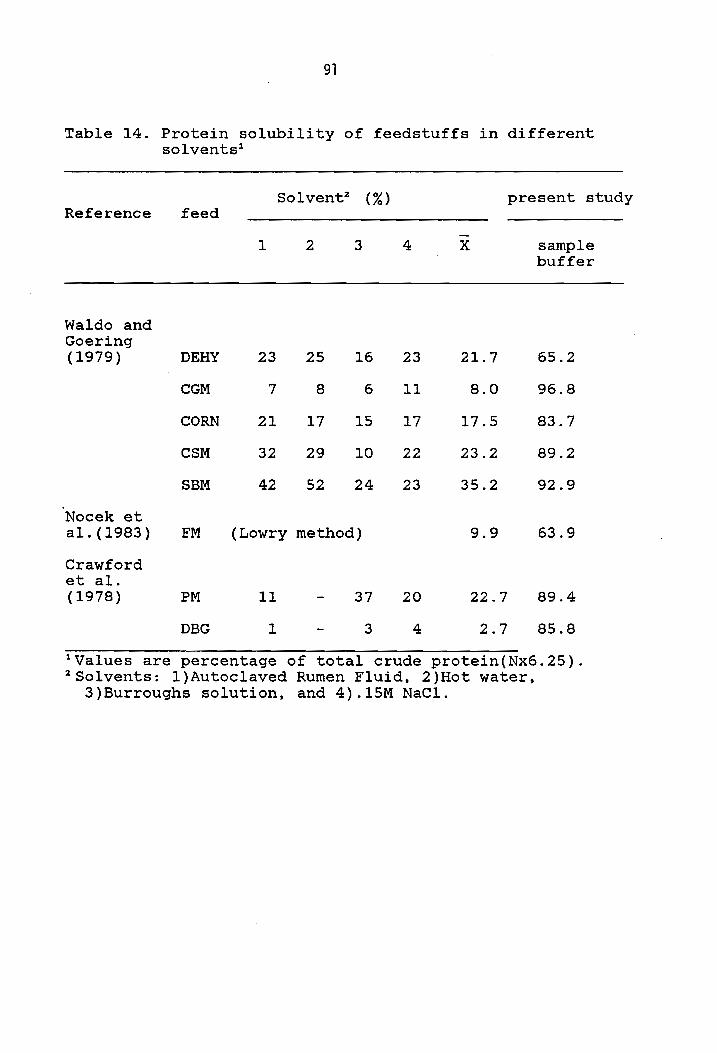
One of the main constraints of solubility methods
previously described (Table 14), is that most of them
account for small portions of soluble crude protein
assumed readily available. For this reason Crawford et ale
(1978) concluded that the 10% Wise Burrough's solution,
for which a correlation coefficient of .94 was reported,
should not be used to test for degradability of total
protein in the rumen.
It is possible that the detergent system given by SDS in
presence of reducing agents (mercaptoethanol) may be of
some advantage in predicting protein ruminal degradation.
91
Table 14. Protein solubility of feedstuffs in different solvents1
Solvent2 (%) Reference feed
1 2 3 4
Waldo and Goering (1979) DEHY 23 25 16 23
CGM 7 8 6 11
CORN 21 17 15 17
CSM 32 29 10 22
SBM 42 52 24 23
Nocek et al.(1983) FM (Lowry method)
Crawford et ale (1978) PM 11 37 20
DBG 1 3 4
lValues are percentage of total crude 2 Solvents: I)Autoclaved Rumen Fluid,
x
21.7
8.0
17.5
23.2
35.2
9.9
22.7
2.7
present study
sample buffer
65.2
96.8
83.7
89.2
92.9
63.9
89.4
85.8
protein(Nx6.25). 2)Hot water,
3)Burroughs solution, and 4) .15M NaCI.
92
Effect of lag phase on protein degradability
The mathematical approach of McDonald (1981) was used to
estimate the effect of lag phase on protein
degradability of feedstuff as measured by the dacron bag
suspension technique.
Percentage of protein disappeared (P) from sample
incubated in the rumen was correlated with time of
suspension. A lag phase to was estimated for all
feedstuffs and ranged from .05 to 2.27 h for PM and CGM
(Table 15). Protein sources with a relatively high
degradability had also a short lag phase. The effective
degradability was lower for all feedstuffs. Differences of
2.2 and 1.7% were found for DBG and DEHY, respectively,
suggesting that feedstuffs with a relatively higher
content in fiber may require a longer time for the
microorganisms activity to take place. However, analysis
of variance shows there were no statistical differences
between the two methods.
Similarly, McDonald (1981) reported that the simpler
formula P = a + bc/c +k could be used safely when to is
approximately 2 h. A variation not exceeding 3% was
observed by accounting for the lag phase. McDonald (1981)
reported that lag phase may be relevant for certain
protein supplements, such as linseed meal or feedstuffs
93
Table 15. Effect of lag phase10n protein degradability of feedstuffs by dacron bag suspension technique.
Feed Lag phase Degradability2% %Diff PR> ( to) with without h lag phase lag phase
DEHY 1.87 59.59 61.25 1.66
CGM 2.27 17.12 18.57 1.45
CORN .24 51.74 52.19 .45
CSM .50 59.03 59.68 .65
DBG 1.90 45.66 47.86 2.20
FM 1.57 26.51 27.12 .61
PM .05 67.14 67.24 .10
SBM .20 71.74 72.30 .56
lLag phase (to) was estimated according to Mc Donald (1981).Rate of passage KpB = .05
2Values are % of total protein 3Values are significance levels
F3
.30
.56
.82
.65
.47
.73
.95
.65
94
with a low A fraction. Importance of correcting for lag
phase was also of concern in the recent NRC(1985) report.
Grummer and Clark (1982) offered two explanations for the
lag phase phenomenon. In the first one these authors
suggested that a lag phase is in fact necessary to allow
microbial growth inside the bag. A second hyphothesis was
that ammonia regulation of bacterial proteolytic activity
may be involved. They pointed out that lag phase occured
because of increased levels of ammonia postfeeding. This
in turn may have depressed the activity of bacterial
proteases by a feedback inhibition mechanism. If this
hyphothesis is true it appears that moment of bags
incubation into the rumen should be carefully examined.
SUMMARY AND CONCLUSIONS
In situ degradability
The in situ bag technique was a useful tool to study
protein degradation of several protein supplements in the
rumen. Relative amounts of A and B fractions as well as
rates of degradation of B dictated ruminal degradability.
However t the in situ technique may have questionable
value for certain feedstuffs, such as corn gluten meal.
This may be due to its gelatinous nature. Lag phase(delay
in rate of degradation of B fraction) associated with the
dacron bag technique changed very little the effective
degradability of protein sources.
Separation of corn proteins
Fractionation associated with gel electrophoresis after
rumen incubation demonstrated that the alcohol soluble
corn prolamins were resistant to ruminal degradation. This
led to the concept that increased hydrophobicity of
protein may reduce degradability of proteins in the rumen.
SDS-PAGE and densitometric analysis
SDS-PAGE was a powerful technique for studying
fractional protein degradation in the rumen. Several
protein sources were tested by gel electrophoresis after
ruminal incubation.
95
96
Densitometric reading following gel electrophoresis
provided a measurement of subfractional digestion.
Degradability estimated by summation of subfractional
components did not differ from that predicted by loss of
total B fraction indicating total accountibility of the
protein.
Since it is important to assure a continuous protein
input to satisfy microbial and animal needs, this approach
can be used to measure subfractional protein degradation
in the rumen in protein supplements suitable for gel
electrophoresis analysis.
With knowledge of fractional amino acid composition, it
is then possible to estimate the amino acid composition of
by-pass protein.
Solubility in sample buffer and ruminal degradation
By eliminating obvious outliers, a correlation (R2
=.96) between protein solubility in sample buffer and in
situ protein degradability was found. The SDS-sample
buffer may prove a suitable solvent system for predicting
ruminal degradation of protein sources, especially of
non-forage nature. Presence of mercaptoethanol in the
sample buffer may closely mimic the reducing environment
of the rumen.
EPILOGUE
Gel electrophoresis is a powerful technique for
studying fractional protein degradation in the rumen. This
could be used in testing how processing (heating, chemical
treatments, etc.) affects susceptibility of various
protein fractions to ruminal degradation. In addition, the
possibility of predicting the amino acid contribution of
feedstuffs is enhanced by knowing the amino acid
composition of fractions resistant to microbial activity
as monitored by SDS-PAGE separation. This would provide
information concerning the contribution of each
individual fraction to the amino acid pool reaching the
small intestine. Information is available on amino acid
content of subfractions of corn and soy protein. Little is
known concerning subfractional composition of other
protein sources, therefore, further protein
characterization of these feedstuffs would be of interest
in ruminant nutrition. This is escpecially true for peanut
meal, cottonseed meal, and other important sources.
Protein solubility in 5DS-sample buffer may have the
potential for predicting rumen degradability of several
protein supplements. Further research is necessary.
Application of this solubility system to protein in
forages may be considered for further investigation.
97
98
By measuring pH and NH3-N concentration over 24 h in the
rumen, it has been shown that these values change
diurnally. Consequently, particular time of bag suspension
may alter the estimated degradability of feedstuffs
because of these differences. Therefore, further study is
needed.
REFERENCES
Akin, D. E. and H. E. Amos. 1975. Rumen bacterial degradation of forage cell wall investigated by electron microscopy. Appl. Microbio"l. 5: 692 .
Armentano, L. E., T. A. Herrington, and C. E. Polan. 1983. Ruminal degradation of dried brewers grains, wet brewers grains, and soybean meal in situ and in vitro. J. Dairy Sci. 66:171. (Supl. 1, Abstr.).
Association of Official Agricultural Chemist. 1970 Official Methods of Analysis. 11th Ed. AOAC, Washington, D. C.
Barbeau, W. E. 1987. Personal comunication.
Beever, D. E., D. J. Thomson, S. B. Cammell, and D. G. Harrison. 1977. The digestion by sheep of silages made with and without the addition of formaldehyde. J. Agr. Sci. (Carob.) 88:61.
Blair, L. and K. A. Cummins. 1983. Microbial nitrogen contamination contained in polyester bags. J. Dairy SCi.66(Suppl.1):189.
Boonvisut, S. and J. R. Whitaker. 1976. Effect of heat, amylase, and disulfide bond cleavage on the in vitro digestibility of soybean proteins. J. Agr. Food Chern. 24:1130.
Broderick, G. A., T. Kowalczyk, and L. D. Satter. 1970. Milk production respense to supplementation with encapsulated methionine per Os or casein per abomasum. J. Dairy Sci. 53:1714.
Broderick, G. A. 1978. In vitro procedures for estimating rates of ruminal protein degradation and proportions of protein escaping the rumen undegraded. J. Nutr.108:18l.
Broderick, G. A. 1982. Estimation of protein degradation in situ and in vitro methods. In:Protein requirement for cattle: Symposium. Stillwater, Oklahoma.
Broderick, G. A. and W. M. Craig. 1980. Effect of heat treatment on ruminal degradation and escape, and intestinal digestibility of cottonseed meal protein. J. Nutr. 110:2381.
99
100
Chalupa, w. 1975. Rumen bypass and protection of proteins and amino acids. J. Dairy Sci. 58:1198.
Chalupa, w. 1975. Rumen bypass and protection of proteins and amino acids. J. Dairy Sci. 58:1198.
Chaney A. L. and E. P. Marbach. 1962. Modified reagents for determination of urea and ammonia. Clinic. Chem. 8:130.
Chapin, C. A. 1986. Protein partition and digesta flow in lactating Holstein fed 2:1 and 1:2 soybean meal:fish meal. M.S. Thesis. Virginia Polytechnic and state University, Blacksburg.
Chapin, C. A., E. Zerbini, J. H. Herbein, and C. E. Polan. 1986. Protein partition and digesta flow in lactating Holsteins fed 2:1 and 1:2 soybean:fish meal. Suppl.1, 142.
Coleman, G. S. 1975. The interelationship between rumen ciliate protozoa and bacteria. In:Digestion and metabolism in the ruminant. I. W. McDonald and A. I. C. Warner. Eds. Armidale, NSW, Australia:The University of New England Publishing Unit, 149.
Cotta, M. A. and R. B. Hespell. 1986. Protein and aminoacid metabolism of rumen bacteria. In: Control of digestion and metabolism in ruminants. L. P. Milligan, W. L. Grovum, and A. Dobson, 122.
Craig, W. M. and G. A. Broderick. 1984. Amino acid released during protein degradation by rumen microbes. J. Anim. Sci. 58:436.
Crawford, Jr.R. J., W. H. Hoover, C. J. Sniffen, and B. A. Crooker. 1978. Degradation of feedstuffs nitrogen in the rumen vs nitrogen solubility in three solvents. J. Anim. Sci. 46:1768.
Crooker, B. A., C. J. Sniffen, W. H. Hoover, and L. L. Johnson. 1978. Solvents for soluble nitrogen measurements in feedstuffs. J. Dairy Sci. 61:437.
Draper, M. and N. Catsimpoolas. 1978. Disulfide and sulfhydryl groups in glycinin. Cereal Chern. 55:16.
Emery, R. S. 1971. Disappearance of methionine from the rumen. J. Dairy Sci. 54:1090.
101
Eggumt B. o. and R. M. Beames. 1983. the nutritive value of seed proteins. In:Seed proteins t biochemestrYt genetics, nutritive value. Advances in agricultural biotechnology. 499.
Ely. D. G., C. o. Little t P. G. Woolfolk, and G. E. Mitchell, Jr. 1967. Estimation of the extent of conversion of dietary zein to microbial protein in the rumen of lambs. J. Nutr. 91:314.
Erdman, R. A., J. H. Vandersall, E. Russek-Cohen, and J. Switalski. 1987. Simultaneous measures of rates of ruminal digestion and passage of feeds for prediction of ruminal nitrogen and dry matter digestion in lactating dairy cows. J. Anim. Sci. 64:565.
Glimp, H. A., M. R. Karr, C. o. Little, P. G. Woolfolk, G. E. Mitchell, Jr., and L. W. Hudson. 1967. Effect of reducing soybean protein solubility by dry heat on the protein utilization of young lambs. J. Anim. Sci. 26:858.
Goering, H. K. and P. J. Van Soest. 1972. Forage fiber analyses. USDA Agric. Handb. No. 379.
Grass, G. M., and R. R. Unangst. 1972. Glycerol tristearate and higher fatty acid mixture for improving 'digestive absorption. U. S. Patent 3,655,650. Cited by Chalupa, W. (1975) in : Rumen bypass and protection of proteins and amino acids. J. Dairy Sci. 58:1198.
Grummer, R. R. and J. P. Clark. 1982 . Effect of dietary nitrogen solubility on lactation performance and protein and dry matter degradation in situ. J. Dairy Sci. 65:1432.
Hames, B. D. and D. Rickwood. 1981. Gel electrophoresis of protein. A pratical approach. IRL Press. Oxford -Washington D.C.
Harrison, D. G. and A. B. McAllan. 1980. Factors affecting microbial growth yields in the reticulo-rumen. In:Digestive Physiology and Metabolism in ruminants. Y. Ruckebush and P. Thivend, Eds. Lancaster, England: MTP Press, 205 .
. Hemsley, J. A. 1975. Effect of high intake of sodium chloride on the utilization of a protein concentrate by sheep. Aust. J. Agric. Res. 26:709.
102
Hatfield, E. E. 1975. Soy protein as a source of amino acids for ruminants. World soybean research, 957.
Hoseney, R. C. 1986. Cereal proteins. In:Principles of cereal science and technology, 69.
Iyengar, R. B. and P. Ravenstein. 1981. New aspects of subunits structure of soybean glycinin. Cereal Chern. 58:325.
Laemmli, U. K. 1970. Most commonly used discontinuous buffer system for SDS electrophoresis. U. K., Nature, 227:680.
Landry, J. and T. Moureaux. 1981. Physicochemical properties of maize glutelins as influenced by their isolation conditions. J. Agric. Food Chern. 29:1205.
Little, C. o. and G. E., Mitchell Jr. 1967. Abomasal vs oral administration of proteins to wethers. J. Anim. Sci.26:411.
Lyman, C. 00., W. Y. Chang, and J. R. Couch. 1953. Evaluation of protein quality in cottonseed meals by chick "growth and by chemical index method. J. Nutr. 49:679.
Kakade, L. M. 1974. Biochemical basis for the differences in plant protein utilization. J. Agr. Food Chern. 22:550.
Kella, N. K. D., W. E. Barbeau, and J. E. Kinsella. 1986a. Effect of oxidative sulfitolysis of disulfide bonds of glycinin on solubility, surface hydrophobicity, and in vitro digestibility.J. Agr. Food Chemistry, 34:251.
Kella, N. K. D., W. E. Barbeau, and J. E. Kinsella. 1986b. Effect of disulfide bond cleavage on the structure and conformation of glucinin. Int. J. Peptide Protein Res. 27:421.
Kleinbaum, D. G. and L. L. Kupper. 1978. In:Applied regression analysis and other multivariable methods. Duxbury Press, Boston, 83.
Kennedy, P.M., R. J. Christopherson, and L. P. Milligan. 1982. Effects of cold exposure on feed protein degradation, microbial protein synthesis ~nd transfer of plasma urea to the rumen of sheep. Br. J. Nutr. 47:521.
103
Klopfenstein, T. 1984. Improving soybean protein utilization by ruminants. In:World soybean research conference, III. Proceeding. Shibles, 209.
Koshiyama, I. 1983. Storage proteins of soybean. In:Seed proteins, Biochemestry, Genetics, Nutritive value. Ed. W. Gottscholk and H. P. Muller, 427.
Mahadevan, S., J. D. Erfle, and F. D. Sauer. 1980. Degradation of soluble and insoluble proteins by bacteroides amylophilus protease and by rumen microorganisms. J. Anim. Sci.50:723.
Mangan, J. L. 1972. Quantitative studies on nitrogen metabolism in the bovine rumen. Br. J. Nutr. 27:261.
McDonald, I. W.1954. The extent of conversion of food protein to miceobial protein in the rumen of sheep. Biochem J.56:120.
McDonald, I. 1981. A revised model for the estimation of protein degradability in the rumen. J. Agric. Sci. Camb. 96:251.
McWatters, K. H. and J. P. Cherry. 1982. Potential foof uses of peanut seed proteins. In:Peanut science and technology. Ed. H. E. Pattee and C. -T. Young, 689.
Mehrez, A. Z. and E. R. Orskov. 1977. A study of the artificial fibre bag technique for determining the digestibility of feeds in the rumen. J. Agric. Sci. Carob. 88:645.
Meyer, J. H. F., S. I. van der Walt and H. M. Schwartz. 1986. The influence of diet and protozoal numbers on the breakdown and synthesis of protein in the rumen of sheep. J. Anim. Sci. 62:509.
Mertens, D. R. 1977. Dietary fiber components:relationship to the rate and extent of ruminal digestion. Fed. Proc.36:187.
Miller, E. L. 1982. Methods of assessing proteins for ruminants, including laboratory methods. In:Protein contribution of feedstuffs for ruminants. E. L. Miller, I. H. Pike, and A. J. H. Van Es. Butterworths, 18.
1~
Murphy, P. A. 1984. Structural characteristics of soybean glycinin and b-conglycinin. World soybean research conference, III. Proceeding. Shibles, 143.
Nielsen, N. C. 1985. Structure of soy proteins. In:New protein foods. Vol. 5. Seed storage proteins. A. M. Altschul and H. L. Wilcke. Academic Press, Inc. , 27.
Nocek, J. E. 1985. Evaluation of specific variables affecting in situ estimates of ruminal dry matter and protein digestion. J. Anim. Sci. 60:1347.
Nocek, J. E. 1987. Evaluation of variables and recommended guidelines associated with the ruminal in situ digestion technique. 82nd Annual Meeting of the American Dairy Science Association.
Nocek, J. E. and A. L. Grant. 1987. Characterization of in situ nitrogen and fiber digestion and bacterial nitrogen contamination of hay crop forages preserved at different dry matter percentages. J. Anim. Sci. 64:552.
NRC, 1978. Nutrient requirements of dairy cattle. 5th rev. ed. Washington, D. C.:National Academy of Sciences.
NRC, 1985. Ruminant Nitrogen Usage. Subcommittee on nitrogen usage in ruminants. National Academy Press. Washington D. C.
Nugent, J. H. A. and J. L. Mangan. 1978. Rumen proteolysis of fraction I leaf protein, casein and bovine serum albumin. Nutr. Soc. Proc. 37:48A.
Nugent, J. H. A. and J. L. Mangan. 1981. Characteristics of the rumen proteolysis of fraction 1(18S) leaf protein from lucerne (Medicago Sativa L). Br. J. Nutr. 46:39.
Orskov, E. R. 1982. Protein nutrition in ruminants. Academic Press.
Orskov E. R. and N. A. Mac Leod. 1982. Validation and application of new principles of protein evaluation for ruminants. In:Protein contribution of feedstuffs for ruminants. E. L. Miller, I. H. Pike, and A. J. H. Van Es. Butterworths, 76.
Orskov, E. R. and McDonald. 1979. The estimation of protein degradability in the rumen from incubation measurements weighted according to rate of passage. J. Agric. Sci., Camb. 92:499.
Pichard, G. and P. J. Van Soest. 1977. Protein solubility of ruminant feeds. Cornell Nutr. Conf.91.
Polan, C. E., P. T. Chandler, and C. N. Miller. 1970. Methionine hydroxy analog:varying levels for lactating cows. J. Dairy Sci. 53:607.
Poos-Floyd, M., T. Klopfenstein, and R. A. Britton. 1985. Evaluation of laboratory technique for predicting ruminal protein degradation. J. Dairy Sci. 68:829.
Regenstein, J~ M. and C. E. Regenstein. 1984. Description of major protein systems. In:Food protein chemistry: An introduction for food scientist, 43.
Russell, J. B., C. J. Sniffen, and P. J. Van Soest. 1983. Effect of carbohydrate limitation on degradation and utilization of casein by mixed rumen bacteria. J. Dairy Sci. 66:763.
Satter, L. D. and E. R. Roffler.1975. Nitrogen requirement and utilization in dairy cattle. J. Dairy Sci. 58:1219.
Segel, I. H. 1976. Biochemical calculations. 2nd Edition. University of California, Davis.
Shewry, P. R. and B. J. Miflin. 1985 .. Seed storage proteins of economically important cereals. In:Advances in cereal science and technology. Ed: Y. Pomeranz, 1.
Sniffen, C. J. 1986. Dynamic aspects of protein utilization in ruminants (Review of NRC report). Cornell Nutr. Conf.1.
Sniffen, C. J. 1974. Nitrogen utilization as related to solubility of NPN and protein in feeds. Cornell Nutr. Conf.12.
Stegemann, H. and J. Pietsch. 1983. Methods for characterization of the seed prtoeins in cereals and legumes. In:Seed proteins. W. Gottschalk and H. P. Muller.
106
Stern, M. D., M.E. Ortega, and L. D. Satter. 1980. Use of the dacron bag technique with rate of passage information to estimate protein degradation in the rumen. J. Anim. Sci. Suppl. 72:398(Abstr.).
Stern, M. D. and L. D. Satter. 1982. In vivo estimation of protein degradability in the rumen. In:Protein requirement for cattle :Symposium Stillwater, Oklahoma, 57.
Stern, M. D. and L. D. Satter. 1984. Evaluation of nitrogen solubility abd the dacron bag technique as methods for estimating protein degradation in the rumen. J. Anim. Sci. 58:714.
Tamminga, S. 1979. Protein degradation in the forestomachs of ruminants. J. Anim. Sci. 49:1615.
Tagari, H., I. Ascarelli, and A. Bondi. 1962. The influence of heating on the nutritive value of soybean meal for ruminants. Br. J. Nutr. 16:237.
Truswell, A. S. and J. F. Brock. 1962. Nutritive value of maize protein for man. Amer. J. Clin. Nutr. 10:142.
Van der Aar, P. J., L. L. Berger, K. M. Wujek, E. Mastenbroek, and J. C. Fahey, Jr. 1983. Relationship between electrophoretic band patterns and in vitro ammonia release of soluble soybean meal protein. J. Dairy Sci. 66:1272.
Van der Aar, P. J., L.L. Berger, and G. C. Fahey, Jr. 1982. The effect of 'alcohol treatment on solubility and in vitro and in situ digestibilitie of soybean meal protein. J. Anim. Sci. 55:1179.
Van Soest, P. J., C. J. Sniffen, D. R. Mertens, D. G. Fox., P. H. Robinson, and U. Krishnamorthy. 1982. A net protein system fro cattle:The rumen submodel for nitrogen. In:Protein requirements for cattle: Proceeding of an International Symposium, F. N. Owens, Ed. MP-109, Stillwater, Oklahoma State University, 265.
Varvikko, T. 1986. Microbially corrected amino acid composition of rumen-undegraded feed protein and amino acid degradability in the rumen of feeds enclosed in nylon bags. Brit. J. Nutr. 56:131.
107
Waldo, D. R. and H. K. Goering. 1979. Insolubility of proteins in ruminant feeds by four methods. J. Anim. Sci. 49:1560.
Wall, J. S. and J. W. Paulis. 1978. Corn and sorghum grain proteins. In: Advances in cereal science and technology. Vol. II. Ed.Y. Pomeranz, 135.
Weakley', D. M. D. Stern, and L. D. Satter. 1983. Factors affectinq disappearance of feedstuffs from baqs suspended in the rumen. J. Anim. Sci. 56:493.
Whistler, R. L. and J. R. Daniel. 1985. Carbohydrates. In: Food Chemistry. Ed. o. R. Fennema, 99.
Wilson, C. M., P. R. Shewry, and B. J. Miflin. 1981. Maize endosperm proteins compared by sodium dodecyl sulfate qel electrophoresis and isoelectric focusinq. Cereal Chern. 58:275.
Wolf, W. J. 1970. Soybean proteins: Their functional, chemical, and physical properties. J. Agr. Food Chern. 18:969.
Wolf, J. and J. C. Cowan. 1971. Soybeans as a food source. CRe Press.
Wohlt, J. E., C. J. Sniffen, and W. H. Hoover. 1973. Measurements of protein solubility in common feedstuffs. J. Dairy Sci. 56:1052.
Zerbini, E. 1984. Protein sources avaluated for ruminatinq Holstein bull calves. M. S. Thesis. Virginia Polytechnic Institute and State University, Blacksburg.
Zerbini, E. and C. E. Polan. 1985. Protein sources evaluated for ruminating holstein calves. J. Dairy Sci. 68:1416.
Zinn, R. A., L. S. Bull, and R. W. Hemken. 1981. Degradation of supplemental proteins in the rumen. J. Anim. Sci. 52.857.
VITA
Name: Donato Romagnolo
Birthplace: Solesino (PO), Italy, October 26, 1957
Education : Laurea in Scienze Agrarie, 1983 Universita' degli Studi di Padova Facolta' di Agraria Padova, Italy
Professional Organizations:
Member, Ordine dei Dottori Agronomi di Padova Member, American Dairy Science Association.