‘Running in the Family’ The Evolution of Ownership, Control, and Performance in German Family-owned Firms 1903-2003 by Olaf EHRHARDT a , Eric NOWAK b * , Felix-Michael WEBER c a Humboldt University of Berlin and University of Witten/Herdecke,Germany b University of Lugano, Lugano, Switzerland c University of Witten/Herdecke, Germany Paper prepared for the Review of Finance/CEPR Conference on Early Securities Markets First Version: October 16, 2004 This Version: December 31, 2004 In this study we analyze the evolution of ownership, control, and performance of German founding-family-owned firms over the last century. We begin by identify- ing German family-owned stock companies that were founded before 1913 and still in existence in 2003 with sales turnover of more than 50 million Euro. Then we con- struct a matching sample of non-family-owned German stock companies in 2003. The resulting full sample consists of 62 Family and 62 Non-Family Firms in 2003. We go back a century and identify all firms, for which we are able to collect data for the whole period. Then we compare family-owned vs. non-family-owned firms over the 100-year time-span, analyzing a variety of variables like ownership, control, indus- tries, bank relationship s and performance, as well as the impact of intergenerational control transfers. We find that families give up ownership slowly and control of fam- ily businesses remains strong even after several generations. Family bus inesses seem to outperform non-family firms in terms of operating (but not stock) performance, but grow more slowly, and performance decreases through time. * Corresponding author: Eric Nowak, University of Lugano, Institute of Finance, Via Guiseppe Buffi 13, CH-6904 Lugano, Switzerland, [email protected]. This article has benefited from numerous interviews, which Felix conducted with managers of family firms in Germany. We are particularly grateful to Gunter Ernst of Gütermann A G, Albrecht Woeste of Henkel KGaA, Jon Baumhauer of E. Merck KGaA, Joachim von Schlenk of Carl Schlenk AG, Dr. Ulrich Wacker of Wacker Construction Equipment AG. The article has been presented at the CEPR/Review of Finance conference on Early Securities Markets in Berlin. We wish to thank all par- ticipants and particularly Caroline Fohlin (Conference Organizer) and Ernst Maug (Discussant) for very helpful comments and suggestions. Richard Stehle deserves a special acknowledgment for giving us access to his database of historical stock returns and his collection of Hoppenstedt volumes. We thank the Swiss National Science Foundation for financial support within NCCR-FINRISK Project Four: Corporate Finance. 1 Classification as a large company as defined by the European Union in 2004.
Transcript
‘Running in the Family’
The Evolution of Ownership, Control, and Performance in
German Family-owned Firms 1903-2003
by
Olaf EHRHARDTa, Eric NOWAKb∗ , Felix-Michael WEBERc a Humboldt University of Berlin and University of Witten/Herdecke,Germany
b University of Lugano, Lugano, Switzerland c University of Witten/Herdecke, Germany
Paper prepared for the Review of Finance/CEPR Conference on Early Securities Markets
First Version: October 16, 2004
This Version: December 31, 2004
In this study we analyze the evolution of ownership, control, and performance of German founding-family-owned firms over the last century. We begin by identify-ing German family-owned stock companies that were founded before 1913 and still in existence in 2003 with sales turnover of more than 50 million Euro. Then we con-struct a matching sample of non-family-owned German stock companies in 2003. The resulting full sample consists of 62 Family and 62 Non-Family Firms in 2003. We go back a century and identify all firms, for which we are able to collect data for the whole period. Then we compare family-owned vs. non-family-owned firms over the 100-year time-span, analyzing a variety of variables like ownership, control, indus-tries, bank relationships and performance, as well as the impact of intergenerational control transfers. We find that families give up ownership slowly and control of fam-ily businesses remains strong even after several generations. Family bus inesses seem to outperform non-family firms in terms of operating (but not stock) performance, but grow more slowly, and performance decreases through time.
∗ Corresponding author: Eric No wak, University of Lugano, Institute of Finance, Via Guiseppe Buffi 13, CH-6904 Lugano, Switzerland, [email protected]. This article has benefited from numerous interviews, which Felix conducted with managers of family firms in Germany. We are particularly grateful to Gunter Ernst of Gütermann AG, Albrecht Woeste of Henkel KGaA, Jon Baumhauer of E. Merck KGaA, Joachim von Schlenk of Carl Schlenk AG, Dr. Ulrich Wacker of Wacker Construction Equipment AG. The article has been presented at the CEPR/Review of Finance conference on Early Securities Markets in Berlin. We wish to thank all par-ticipants and particularly Caroline Fohlin (Conference Organizer) and Ernst Maug (Discussant) for very helpful comments and suggestions. Richard Stehle deserves a special acknowledgment for giving us access to his database of historical stock returns and his collection of Hoppenstedt volumes. We thank the Swiss National Science Foundation for financial support within NCCR-FINRISK Project Four: Corporate Finance. 1 Classification as a large company as defined by the European Union in 2004.
- 1 -
‘Running in the Family’
The Evolution of Ownership, Control, and Performance in
German Family-owned Firms 1903-2003
In this study we analyze the evolution of ownership, control, and performance of German founding-family-owned firms over the last century. We begin by identify-ing German family-owned stock companies that were founded before 1913 and still in existence in 2003 with sales turnover of more than 50 million Euro. Then we con-struct a matching sample of non-family-owned German stock companies in 2003. The resulting full sample consists of 62 Family and 62 Non-Family Firms in 2003. We go back a century and identify all firms, for which we are able to collect data for the whole period. Then we compare family-owned vs. non-family-owned firms over the 100-year time-span, analyzing a variety of variables like ownership, control, indus-tries, bank relationships and performance, as well as the impact of intergenerational control transfers. We find that families give up ownership slowly and control of fam-ily businesses remains strong even after several generations. Family bus inesses seem to outperform non-family firms in terms of operating (but not stock) performance, but grow more slowly, and performance decreases through time.
- 2 -
A INTRODUCTION
In the years leading up to World War I, German equity markets were among the most
highly developed in the world. Although today there are only about 750 companies
listed on German stock exchanges, in 1914 there were almost 1,200 (as compared to
only about 600 stocks listed on the New York Stock Exchange), and there was an
active underwriting market with 300 IPOs from 1905 to 1914 (Eube 1998; Goetz-
mann et al. 2001). But after World War II, the role of the equity markets in funding
corporate growth was largely taken over by the German “universal banks.” Measured
in terms of total market capitalization, the German stock market is now only number
five in the world, which seems unimpressive when the size of the German economy is
taken into account. However, another characteristic pattern has been more stable
through both World Wars, namely the prevalence of family-owned firms in the Ger-
man economy.
In 2003, nearly 700 large German companies that were founded in or before
1913 existed with a sales turnover of more than 50 million Euro.1 Of these compa-
nies 159 can be classified as stock companies (Aktiengesellschaften), of which 62 still
continue to be owned and operated by descendents of the founding family.2 Further-
more, there is concentrated family ownership in a large share of the century-old large
non-stock firms owned by families. The descendants of the founders still own the
controlling stake in 60 percent of these firms and control the board in 84 percent of
the cases. Thus even today, Germany still has powerful families.
In comparison to Anglo-Saxon countries, family-ownership seems to be more
widespread, persistent, and successful in Germany. It seems that German families
had a better chance to inherit and transfer controlling stakes to successive generations
while staying on an expansion path and sustaining firm performance. Bjuggren and
Sund (2002) show that inheritance tax laws act as crucial constraints that foster inter-
generational transition of ownership in family firms. Thus, one possible explanation
for strong family ownership may be that inheritance taxation of corporate estates in
Germany has always been low in comparison to international standards. A compara-
tive study of the Japanese Ministry of Finance (2004) shows that Germany has both
the lowest inheritance tax rates as well as the highest tax-exempt thresholds among
1 Classification as a large company as defined by the European Union in 2004. 2 See Table 1 - Selection of the Sample.
- 3 -
the five biggest economies in the world (Appendix I).3 Contrasting this with the
scarce empirical evidence and mixed evidence for other countries, we want to shed
some light on the evolution of ownership, control, and performance of German fam-
ily-owned firms over the last century.
In our paper we want to find empirical answers to the question: What does the
evolution of some of the largest and oldest companies in Germany look like? Our
central research topic is the relationship between family ownership, family control,
and firm performance. Related questions arising are: By whom and in which indus-
tries were they established and where and when did families sell their companies?
What is the evolution of family control (CEOs, board membership) in the post-
founder generations? Furthermore, we want to know how founding-family ownership
and generational succession correspond to corporate performance (operating, stock
returns, growth).
The remainder of the paper is organized as follows: Section B reviews the re-
lated literature and predictions of analytical studies, shows comparable results of
similar performance studies, and derives testable hypotheses. In section C1 we ex-
plain how we construct our sample, and discuss limitations of our study with respect
to data availability. Section C2 clarifies how we define performance and other vari-
ables. The tables discussed in section D document our results. In particular, section
D1 is on the evolution of ownership and control; section D2 covers industry distribu-
tion and control transfers; and section D3 deals with the impact of family ownership
on performance and growth. In Section E we draw conclusions of our study.
B RELATED LITERATURE
B1 Evolution of Family Business
Recent research documents a strikingly high concentration of ownership around the
world, primarily held by families. Based on ownership structures of companies from
the richest 27 countries, La Porta et al. (1999) show that families control 30 percent
of the top 20 firms. For medium-sized firms, family control is more common in
countries with poor shareholder protection (50 vs. 39 percent) and with a civil- law
3 The study comparing Japan, U.S.A., U.K., Germany, and France can be found at
- 4 -
tradition. According to Faccio and Lang (2002), 44 percent of Western European
firms are family controlled. They also report that firms are more likely to be family
controlled in continental European countries (e.g., France 64.8 percent, Germany 64.6
percent, Italy 59.6 percent) compared to the U.K. (23.7 percent) and Ireland (24.6
percent). The last-mentioned evidence is consistent with Franks et al.’s (2004ab)
finding that family ownership in Britain was rapidly diluted in the twentieth century.
In contrast to the U.K. and the U.S., it is less likely that control transfers in
German family firms are the result of (hostile) takeovers. However, Franks and
Mayer (2001) and Jenkinson and Ljungqvist (2001) argue that an active market in
share blocks and accumulation of ‘hostile stakes’ also enables control changes and
acts as a substitute for an Anglo-Saxon style market for corporate control. Our re-
search shows that 66 percent of German large-scale enterprises, which were founded
in or before 1913 and are still in existence in 2003, are family-owned firms. As these
results indicate, inherited control is more common in Germany than in countries like
the U.K. or the U.S.
In line with the theoretical predictions of Zingales (1995) and Bebchuk
(1999), Ehrhardt and Nowak (2003) show that German family owners tend to either
manifest controlling shareholder structures or sell their controlling stakes completely
and exit. Other theoretical models, such as Bhattacharya and Ravikumar (2001,
2002) and Burkart et al. (2003), also predict cross-country differences in the evolution
of family ownership. The salient finding in Bhattacharya and Ravikumar (2001) is
that market imperfections influence the decision of the incumbent family owners ei-
ther to bequeath the controlling stake (and the business skills), or to sell the business
and to bequeath the proceeds. Therefore, family businesses should be bigger, last
longer, and have lower investment rates in countries with less developed capital mar-
kets. Bhattacharya and Ravikumar (2002) focus on the succession in family firms by
analyzing the trade-off between hiring a family member (with aligned incentives) and
hiring a more qualified outside professional (with non-aligned incentives). In that
principal-agent framework, family firms can professionalize their management only
after reaching a critical firm size. Burkart et al. (2003) report that the quality of mi-
nority shareholder protection in a given country affects the evolution of family firms.
They predict firms with diffuse stock ownership and professional managers to be
www.mof.go.jp/english/zei/report2/zc001f06.htm .
- 5 -
prevalent only in countries that have established a high quality corporate governance
environment. In an intermediate shareholder protection environment, the manage-
ment is delegated to a professional and the family acts as a controlling shareholder to
monitor the management. In legal regimes with weak protection there is no separa-
tion of ownership and control because of the high level of agency costs. These theo-
retical models of the evolution of family businesses are consistent with the existence
of a variety of corporate governance designs that change through time and differ be-
tween firms and legal systems.
In the following section, we discuss empirical evidence on the performance of
family firms in North America, and on corporate governance structures that several
generations of family members in different countries have adopted through time.
B2 Family ownership and performance in North-America and Asia
Although family ownership is essential in most countries, so far there are only a few
studies that look at the performance of family firms empirically. In analyzing the
long-run impact of family ownership on firm performance the question that jumps to
the forefront is what motivates families to concentrate much of their wealth in one
(single undiversified) firm? Do they have superior management or monitoring abili-
ties as compared to other types of shareholders? This can be considered by looking at
whether family-owed firm actually achieve superior long-run performance through
successive generations. If this is the case, then from the perspective of minority
shareholders it is important to know, if management and control mechanisms poten-
tially wipe out the family’s incentives to enjoy private benefits of control.
Some studies examine the impact of some forms of family management and
control on firm value, the most recent ones being related to management successions
within family firms and possible inefficient control transfers through inheritance.
McConaughy, Matthews, and Fialko (2001) find some evidence that founding family
firms have greater value, are operated more efficiently, and carry less debt than non-
family firms in the US. They suggest that “it is the family control of the firm rather
than management ownership that is the key to the diffe rences”. McConaughy and
Phillips (1999) look at 147 public family firms in the U.S. and find that founder-
- 6 -
controlled firms grow faster and invest more than descendent-controlled firms, but are
less profitable than firms in the second and later generations.
Amoaku-Adu and Smith (1999) and Pérez-Gonzalez (2002) report that family
firms experience declines in performance when family successions are appointed. For
Canada, Amoaku-Adu and Smith (1999) find that “the negative stock market reaction
to family successors is related to their relatively young age than their family connec-
tion per se.” They further show some evidence that poor performance influences the
family’s decision of management succession. In the case of poor corporate perform-
ance it is more likely that the family hires a non-family insider or outsider than a fam-
ily member. Pérez-Gonzalez (2002) looks at successions in family firms in the U.S.
and observes a negative impact on performance, which, however, is not evident in
firms where the promoted CEO is unrelated to the controlling family. He interprets
his findings as evidence that “nepotism hurts firms’ performance by limiting the
scope of labour market competition.”
On the contrary, Anderson and Reeb (2003) argue that family firms perform
better than non-family firms in the US. Based on operating performance, family
ownership creates value when the founder or founder-descendants are active as CEO.
However, both the presence of the founder CEO and a hired outside CEO have a posi-
tive effect on market performance. Contrary to the operating performance results,
however, founder descendants seem not to affect the stock market performance.
Villalonga and Amit (2004) find that family management creates value as long
as the founder serves as the CEO, or as its chairman with a hired non-family CEO.
Contrarily to Anderson and Reeb (2003), they find that firm value as measured by
Tobin’s q is destroyed in descendant-CEO firms in the US. This negative effect is -
as the authors point out - entirely attributable to second-generation family firms. In
addition, control mechanisms such as dual-class structures, pyramids, cross-holdings,
or voting agreements also have a negative impact on firm value. The authors point
out that differing results in the literature concerning a positive or negative impact of
family control could be due to varying definitions of family ownership, family con-
trol, and family management.
Lehn et al. (2004) investigate U.S. corporate boards from 1935-2000 and find
that board structure (size, insider ownership) is strongly related to growth opportuni-
ties. However, they find no robust relation between firm performance and either
- 7 -
board size or structure when the board characteristics are treated as endogenous vari-
ables. The authors argue that board size and structure are endogenously determined in
ways consistent with value maximization.
For the case of Thai business families, Bertrand at al. (2004) show that large
families perform worse than small families and that the presence of the founder is
important for performance. They also find a positive relationship between family size
and involvement of family members in the business group, especially when the ult i-
mate control has passed from the founder to one of his descendants. The authors con-
clude that part of the decay in family-run groups over time may be due to infighting
for group resources as control becomes more diluted among different family mem-
bers.
Summarizing, so far the international evidence on the relation between family
control and firm performance is mixed and inconclusive, but transferring control to a
successive generation seems to have an important impact. Let us now take a look at
Germany where management succession by family members is quite common.
B3 Hypothesis Development
In a standard corporate finance set-up the founding family maximizes the combined
value of the firm as a source of security benefits (cash flows, income) and as a source
of private benefits (amenities, reputation). Since growth of the company requires
access to outside capital, the family faces a trade off between an increase in income
(maximization of the value of cash flow rights) and the cost of giving up control (and
losing utility from expropriation of private benefits). Therefore, it can be assumed
that family firms try to maintain control while growing the firm at the same time.
Suppose that families trade in income from marginal projects financed with
external capital for private benefits from retaining control by reducing investment.
Then this would lead to the following testable implications:
Hypothesis 1: Ownership stakes of families (1a) do not decrease through generations
over time; and (1b) are concentrated at critical stakes (50 percent, 75 percent).
- 8 -
Hypothesis 2: Families give up ownership only if capital intensity is too large to grow
internally (as in high-technology industries).
Hypothesis 3: Family firms are more profitable than non-family firms.
Hypothesis 4: Performance of family firms decreases over generations.
Hypothesis 5: Family firms sacrifice growth in order to retain control, i.e., non-
family firms grow faster than family firms.
C SAMPLE SELECTION AND METHODOLOGY
C1 Data
In our study we apply a backward approach of sample selection, not only accepting,
but also indeed imposing a high survivorship requirement. We start by identifying all
German family-owned stock companies founded before 1913 and still in existence in
2003 with sales turnover of more than 50 million Euro. Companies are categorized as
a large company (Großunternehmen) when they employ more than 250 people and
generate turnover of more than 50 Mio Euro.4 We are well aware that the design of
our sample selection considerably reduces cross-sectional variation in the data, which
biases against finding statistical significance in our tests. However, empirical evi-
dence shows that family firms on average have a higher probability of survival
through time than non-family firms.5 Consequently, since our sample design assumes
the survival probabilities of both types of firms to be equal, our results will even un-
derestimate the true performance of family-firms relative to non-family-firms.
The data are assembled manually from the following sources found in ar-
chives and different libraries in Frankfurt and Berlin: Our main data source are the
Hoppenstedt yearbooks, which include the annual reports, and list the name of the
directors, supervisory board, voting rights, connection with banks, industry, nominal
equity capital, earnings, total book assets, turnover, etc. Particularly in earlier vo l-
umes, sometimes the data of the year is incomplete and several variables are missing.
Reasons for this are changes in the critical size of companies and/or the companies’
4 Classification as a large company as defined by the European Union in 2004. 5 See Handler (1994) or Stoy Hayward (1989) for survival rates of family firms.
- 9 -
names, or non-existing requirements for stock companies to disclose information (like
ownership structure) in the early years of the last century. Because of limited data
availability in earlier volumes of the Hoppenstedt Databases6 the number of available
firms differs depending on the investigation period and the type of analysis.
Further details of the firms and their founding families could be found in the
annual reports of the companies or in reports on the corporate history. Furthermore,
individual research with newspaper and/or corporate archives has been done to
document if a company is a family or non-family-owned firm. Finally, in order to
verify and interpret our findings, we have conducted interviews with numerous ind i-
viduals who are members of the founding family and active or former board represen-
tatives.
Our definition of family firm is restrictive in comparison to others in the lit-
erature. For example, Franks et al. (2004), Anderson and Reeb (2003) as well as
Villalonga and Amit (2004) define as family-owned any firm where family ownership
is greater than zero.7 We define a firm as family-owned only when there is a domi-
nant influence of the founding family documented by a voting rights concentration of
more than 50 percent.8 Under this definition, participation of family members in
management is not essential for being classified as family-owned. More relevant is
the family’s potential to lead all strategic decisions through voting rights. In Ger-
many, corporate power culminates in the supervisory board (Aufsichtsrat), whose
members are elected by the shareholders. We trace founding family ownership from
incorporation up until the family looses controlling influence, i.e., when their voting
rights are less than 50 percent.
From the approximately 700 German companies that were founded before
1913, and were still in existence in 2003, we have compiled a family firm sample of
62 listed stock companies. We then constructed a matching sample of German stock
companies that were not family-owned in 2003 and which were also founded before
1913 (see Table 1a). From the existing 97 non-family firms we had to eliminate 22
because of missing data, and we further delete 13 companies by matching industry
membership to the distribution in the family sample. The resulting full sample con-
6 Großunternehmen Deutschland, 1952-2003; Hoppenstedt-Saling Aktienführer, 1903-2003. 7 Villalonga/Amit (2004) apply several definitions of which this is definition one.
- 10 -
sists of 62 family- and 62 non-family firms in 2003 and represents various industries,
and sizes, operating throughout former West Germany. Furthermore, we go back a
century and identify a balanced sub-sample of 14 firms, for which we are able to col-
lect data for the 100-year period. In 1903, eight family firms and six non-family
firms were already in existence (Appendix II). Throughout the 20th century, six of
these family firms became non-family firms. Among these are companies like Stoll-
werck, Buderus, Dürkopp-Adler or VGT who are now owned by a new controlling
shareholder, or companies like Siemens or Daimler-Benz, who are now owned by
institutional investors and small shareholders. Because of differing data availability
and time-varying sample sizes, for each analysis we always report results for the
sample with the most complete data in a given period.
[Insert Table 1a about here]
C2 Descriptive Analysis
At the beginning of the last century, 85 percent of the stock companies in the full
sample were family-owned firms. Just one third of today's stock companies were
already stock companies back then. Tables 1a and 1b show how some family-owned
firms have become non-family-owned firms over time. After World War II the num-
ber of stock companies increased rapidly.
[Insert Table 1b about here]
We investigate the samples over a time-span of 100 years, analysing a variety
of variables like ownership, board control, industries, control transfers, performance,
and bank relationships. Descriptive statistics for the year 2003 show that the family
firms in our sample are similar in terms of age to the non-family firms, number of
employees, and profitability. The non-family firms are significantly larger in terms of
generated turnover and the number of bank relationships. Family ownership is not
declining and remains very strong even for later generations: In 2003, the family still
owns 83 percent of the voting capital on average, it holds a management board posi-
8 Under this definition, firms which were sold to other families are no longer classified as a family firm. This definition comes closest to Villalonga and Amit’s (2004) Definition 7 , but is more restrictive with respect to voting control.
- 11 -
tion in 84 percent of the cases, and it is represented in 59 percent of the supervisory
boards; the median sample family firm is running in the 4th generation.
[Insert Table 2 about here]
We also analyze control transfers that happened through the sale of family
stakes to new owners. To define family control we considered the participation of the
founding family on the supervisory board and/or the board of directors. Because of
limited data availability, our operating performance variable is the return on assets.
We further look at stock market performance for several sub-samples. To find out
more about size effects in family firms we look at the evolution of sales turnover and
nominal capital. Also, to investigate information about financing constraints of fam-
ily vs. non-family firms, we calculate the number and regional distribution of bank
relationships.
Finally, in order to support our results and get meaningful interpretations of
the data, we conduct interviews with members of some of the family firms in our
sample. This survey is used to widen evidence and shed further light on the real issues
of control and performance. The interviews are not statistically analyzed and most
interviewees prefer to stay anonymous, but among them are members of prominent
industrial families like, for example, Gütermann, Henkel, Merck, Schlenk, Wacker.
D RESULTS
D1 Evolution of Family Ownership and Family Control
Table 3a shows the evolution of voting rights of the founding family (declining) over
time. The tables show a heavy concentration of voting rights in German family firms.
Because voting rights were not disclosed in the Hoppenstedt database in Period I, we
take the minimum number of voting rights from 1953 as the basis. When the found-
ing family owns 100 percent of the firm in 1953 we can reasonably assume that they
owned 100 percent in 1913 and 1903 as well (Period I).
We separate family ownership into (i) majority control with more than 50 per-
cent, and (ii) supermajority control with more than 75 percent of voting rights. Table
3b shows family ownership and board participation for the three time periods, as well
- 12 -
as the cohort of the post- founder generation that effectively controls the firm. Still,
even 100 years following our first investigation period, there is supermajority control
of the founding family in many firms. Table 3b shows that 72 percent of the German
family-owned firms are still controlled by a supermajority of the founding family in
2003 (Period III). In 1963 (Period II) the founding families owned in 87 percent of
the cases a supermajority (more than 75 percent of the voting rights) of the company.
In the time of strong economic growth in Germany, only 14 percent gave up 25 per-
cent and 7 percent gave up to 50 percent of their voting rights. When families sell
their companies, they typically sell their shares en bloc and no longer hold a signifi-
cant number of shares. When the family has become a minority shareholder its own-
ership stake is diluted to less than 20 percent on average in 2003. The voting rights
proportions of family firms suggest that it seems to be important to keep control by
the post- founder generations.
[Insert Tables 3a and 3b about here]
We now look at family control through a proxy of management and supervi-
sory board representation in the firms that remained family owned until 2003. With
respect to control, family directors and family representation on the board are still
quite prevalent: in 59 percent of the cases we still find family participation in the su-
pervisory board and in 84 percent a family member serves as director on the execu-
tive board in 2003 (see Table 2). For example, in one of the still existing firms, Carl
Schlenk, only family members control both the CEO and the supervisory board over a
hundred years.
In German family-owned stock companies we see during all time periods a
very low separation of ownership and control. In 1913 there is no family firm with-
out a family member as an executive and/or member of the supervisory board.9 One
reason is probably the intense family involvement during the founding stage of most
firms of the sample. In the second period after World War II, there is an increased
number of family firms with a separation of ownership and control. However, we
interpret this as a result of soldiers dying in combat, taken as prisoners of war and the
denazification process of family firms. Still, in 1963, we find that in 87 percent of the
9 On the other hand, we can hardly say that families with minority stakes are overrepresented on the board. There are only three companies with minority stakes of less than 25 percent which have a seat in the supervisory board: Rosenthal (voting stake: 21 percent), KarstadtQuelle (20 percent), and Sie-
- 13 -
cases the supermajority of voting rights is in the hand of the founding family. In
2003 the number of family firms with no family control in the management is again
small with only seven percent.
Overall, German founding families keep a tight grip on the control of their
firms over the whole century, which corresponds to their large ownerships stakes.
They even rebound in the last period in terms of board representation, following the
short decline after WWII. We can therefore support verification of Hypothesis 1a but
not necessarily Hypothesis 1b, since most ownership stakes lie above the critical
thresholds. Thus, founding families hold more voting rights than they would need at
any given level of control.
D2 Industry distribution and control transfers
We sort the firms in the sample by industry categories using Fama-French’s 12-
industry definitions, and further partition the sample based on the BE/ME ratio into
technology intensive (bottom quartile) vs. less technology intensive firms.10
Table 4 gives some indication that many family-owned firms sold their firms
after the sixties. Both the foundation of family businesses and subsequent transfers of
control seem to be concentrated in certain industries. Throughout the whole century,
family firms are less prevalent in technology- intensive industries. Family firms
mostly operate in less technology- intensive industries (see Table 4). The industries
where the founding families are most likely to sell control are business equipment (67
percent), chemical products (63 percent), and healthcare (60 percent ). These indus-
tries can be assumed to be more capital- intensive than the others, which is possibly a
reason for the exit of the founding family. Thus, in industries, where outside capital
is needed to further expand the business, exit can be seen as an alternative to keeping
family control. Over all industries, 38 percent of the family firms changed owners
during the century.
[Insert Table 4 about here]
mens (4 percent). Except fort he latter case this does not s eem violate to representativeness of owners-hip. 10 The 12-Industry classification using Fama-French definitions: http://mba.tuck.dartmouth.edu/pages/faculty/ken.french. We exclude industries eight (utilities) and eleven (finance).
- 14 -
We can therefore confirm the validity of Hypothesis 2 that family firms only
give up ownership in capital- intense industries, which are for the most part high-
technology industries. Since ownership and control remains so concentrated in Ger-
many, let us look at possible implications for the performance of firms.
D3 The impact of family ownership on performance and growth
D3.1 Family vs. non-family firms performance
The evidence in other countries suggests that strong family control can be (poten-
tially) detrimental to firm performance (Pérez-Gonzales 2004, Franks et al. 2004ab).
In conducting our empirical analysis, we investigate firm performance by looking at
both operating and stock performance. We begin our analysis by using the return on
assets for the years 1903 until 2003 to document the operating performance of family
firms vs. non-family firms. However, we have to take into account that we can only
compare surviving family firms vs. surviving non-family firms, a problem which
similar studies face as well. If the decision to stay or give up the status as a family
firm has an impact on the likelihood of survival (or default) the results would be bi-
ased accordingly (most likely in the direction of underestimating the true performance
of family firms who supposedly have a higher survival probability).
Table 6a shows the operating performance results for our German sample.
Calculations are based on financial reports compiled by the Hoppenstedt Aktienführer
which contain detailed accounting information. The most striking feature of the table
is that family firms seem to perform significant ly better than non-family firms with
statistical significance at the one percent level. In all periods – except for 1903 - it
looks like the operating family firms performance is better than that of non-family
firms. That is, the all period average (median) return on assets is 16.9 percent (3.8
percent) versus 7.5 percent (2.3 percent), respectively. Age seems to have a negative
impact on performance, whereas other proxies like technology intensity, bank rela-
tionships, or location in a small town turn out to be irrelevant. This is evidence in
support of Hypothesis 3 that family firms are more profitable.
[Insert Table 5a about here]
- 15 -
To validate our operating performance results, we also compare the long-term
stock performance of family vs. non-family firms. Unfortunately, such a long-term
analysis is somewhat limited because historical stock data are rarely provided for the
German capital market. One exception is the Stehle database at Humboldt University
of Berlin that supplies monthly stock data from January 1947 until December 1995
for firms listed in the official market (Amtlicher Handel) at the Frankfurt stock ex-
change. Because stock returns from other exchanges and other market segments are
not available for such time periods, our dataset comprises only 35 companies. The
dataset includes 15 family and 15 non-family firms. In five companies the family
shareholder sold its entire stake as a block. We classify these five companies as fam-
ily (non-family) firms before (after) the control transfer.
For both the family and non-family firms (for all firms) we compute 587
equally-weighted monthly portfolio returns by using 13,377 monthly firm’s stock
returns. As shown in table 6b, family firms as compared to non-family firms have a
slightly worse monthly average performance of -0.0013 percent. But this difference
is too tiny to be statistically significant by using a paired t-test. Thus, our stock per-
formance analysis does not indicate any significant differences in the performance of
family vs. non-family firms.
[Insert Table 5b about here]
In sum, we use a variety of different measures for corporate performance. We
are aware that results have to be taken with caution, but at least they do not show any
support for an underperformance of long-term survival family firms. Although fam-
ily firms seem to have a better operating performance, minority shareholders cannot
take advantage of this in terms of abnormal stock returns by buying and holding a
portfolio consisting of these family firms. This pattern of superior operating per-
formance without a corresponding abnormal stock performance of family firms is
also found in the study by Anderson and Reeb (2003). In sum, our analysis fails to
find a significant relationship that ownership matters for the performance in long-
term listed survival firms.
D3.2 Intergenerational control transfers and firm performance
- 16 -
The empirical evidence of Pérez-Gonzalez (2002) and Amit and Villalonga (2004)
points to underperformance due to inefficient allocation of human resources because
of family control and within-family succession of management positions. In line with
this spirit we want to identify generational effects that may have an influence on firm
performance. In this investigation we define the beginning of the second generation
as the point in time when the founder transfers the operational control of the firm to
members of his immediate family – usually the children or siblings. The second gen-
eration keeps control until it transfers it to the founders’ grandchildren and so on. A
generation is thus counted each time a part of the founding family transfers the right
to exercise control to the next family member. We receive information about the
number of generations from the firms’ history reports and individual research in the
Hoppenstedt Database or newspapers as well as through corporate archives.
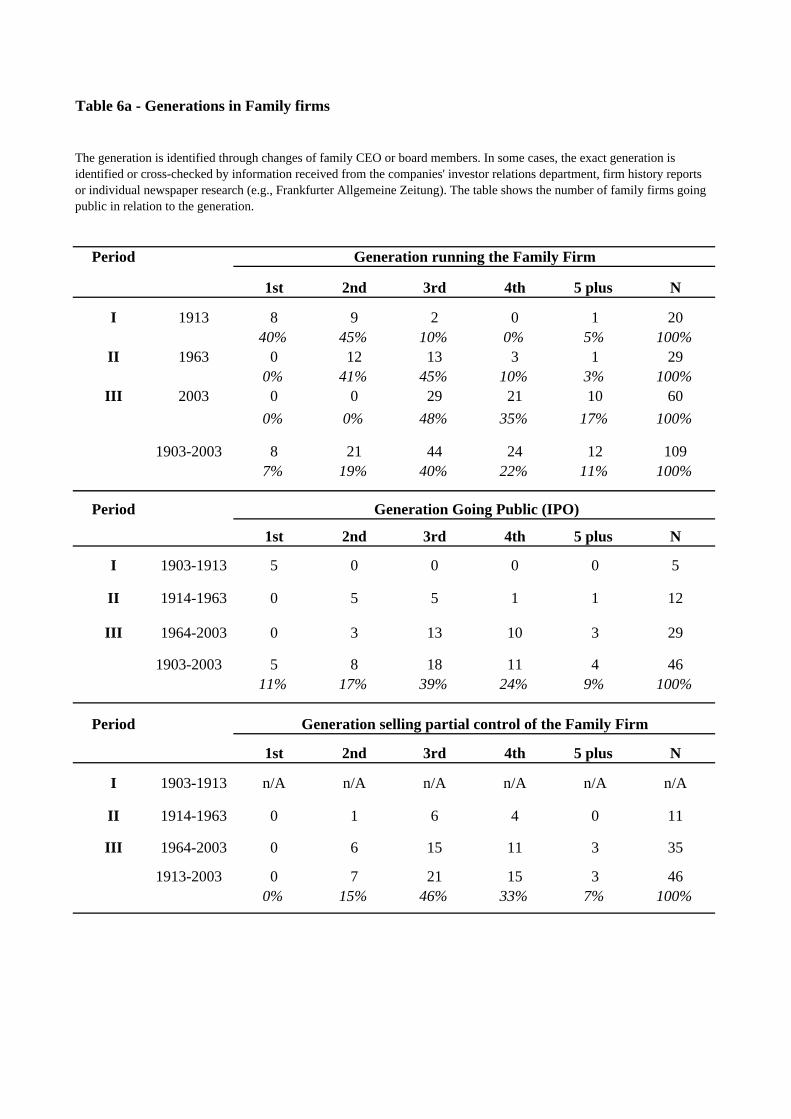
Table 6a shows the number of generations running the family firm. Except for
1913, the firms are running in the post- founder generations. In our sample we ana-
lyse the impact of inherited control, and differentiate whether the firm is owned by
the second, third, fourth, or fifth (and above) generation. To understand the evolution
of ownership and control in German firms, it seems to be an interesting fact that
mostly the post-founder generations, and particularly the third generation, are selling
parts of the firms or exit completely (see Table 6a). But as wee can see in Table 6a,
even some owners within the founder generation were going public (11 percent of the
cases).
[Insert Table 6a about here]
To investiga te the generational impact we define performance as follows:
First we measure the abnormal operating performance as the difference between the
operating performance of the family firm and the operating performance of a match-
ing portfolio of non-family firms. The matching portfolio contains all sample non-
family firms in the same year. Finally, we aggregate the calculated abnormal operat-
ing performance for each generation. Therefore we construct this equation:
∑=
−=S
j
NFFtj
FFtiG
FFtiG OP
SOPAR
1,,,,,
1
∑ ∑=
=
=
=N
i
T
t
FFtiG
FFG AF
NAR
1
2003
1903,,
1
- 17 -
FFtiGOP ,, = Operating performance of family firm i in the year t which is man-
aged by generation G.
NFFtjOP , = Operating performance of non-family firm j in the year t.
=FFtiGAR ,, Abnormal operating performance of family firm i in the year t
which is managed by generation G.
Our performance measure is therefore a measure of normalized over-
performance of non-family firms. When we separate the different post-founder gen-
erations from each other and access the performance delivered by each generation, we
find a performance gap in the third generation. In the founder generation there is a
strong performance, and in the second generation a particularly stronger performance
– which the third and fourth generations do not maintain. After the founder passes
control to the second generation, they increase the performance by 8.6 percent. After
the second generation, the third generation reduces the performance by 11.5 percent.
The fourth and following generations perform slightly better than the third. However,
we are not sure at the moment if this investigation shows a clear trend. In the entre-
preneurship literature the second and third generations are often assumed to be con-
fronted with conflicts about leading the company (Davis and Harveston, 1999, 2001;
Sonfield and Lussier, 2004). In line with this, many exits of family members take
place especially in this generation (see Table 6a). A family exit might reduce the
firms’ performance due to the high number of exit-expenses.
[Insert Table 6b about here]
However, we are unable to control for other individual determinants of firm
performance in each family firm and industry. Therefore, from this simple analysis
we cannot claim to make a clear statement about the causes of these performance dif-
ferences and their relation to possible ‘inefficient inheritance of control’ effects. In a
further step to expand the above analysis we regress operating performance on gen-
erations and a set of various control variables. Among all of the typical factors used
to explain variation in firm performance, generations are the only variable that has a
significantly (negative) impact, which for the most part supports the result from the
former analysis. However, when we also control for age in the regression model, the
generation effect seems to be absorbed by the (almost significant at the 10 percent
- 18 -
level) age variable. Thus, the decreasing impact of successive generations on per-
formance appears to be nothing more then an age effect reflecting changing perform-
ance patterns in the life-cycle of the firm. Therefore we have to reject Hypothesis 4
that performance of family firms is a decreasing function of the generation running
the firm.
[Insert Table 6c about here]
D3.3 Growth Patterns in Family vs. Non-Family Firms
As Fohlin (2004) points out: “German corporations generally performed well, but
perhaps not as remarkably in terms of growth rates and profitability as one might
imagine given the growth of the overall economy at the time”. In particular, family
firms experienced remarkably slow growth - measured by sales or nominal capital –
as compared to non-family firms during the 20th Century. Consequently, in Table 7
we see higher sales turnover for non-family firms. The all period average of family
firm sales amount to 1,374 million Deutsche Mark (702 million Euro) versus a non-
family firm turnover of 11,064 million Deutsche Mark (5,656 million Euro). Re-
markable is the stronger increase of non-family firms’ turnover after 1965.
For the fourteen sample firms with complete panel data, we see that former
family firms like Daimler-Benz, Siemens and Buderus have strong turnover growth.
In these firms, non-family members contributed to the nominal equity capital through
outside financing. Therefore, a possible reason for the smaller growth in size of the
family firms could be the limited opportunity to finance through nominal equity capi-
tal. A confirming indicator for this ‘financial constraints hypothesis’ is the small size
of nominal equity capital that family firms have compared to non-family-owned
firms. Table 7 reports an average nominal capital of 56 million Deutsche Mark (29
million Euro) in family firms versus 187 million Deutsche Mark (96 million Euro).
[Insert Table 7 about here]
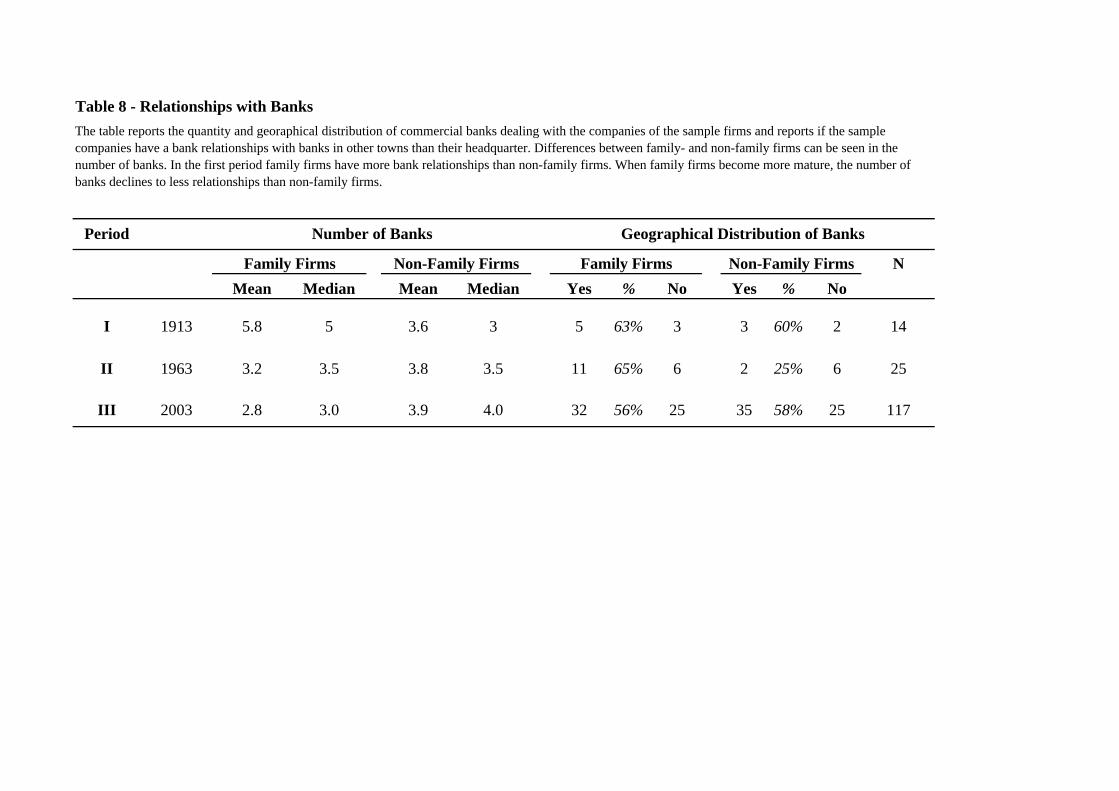
The average or median number of relationships with banks could give some
further explanations for the lower growth in sales and equity capital for family-owned
firms. As can be seen in Table 8, family-owned firms have, on average, 2.9 (median
3.0) connections with banks, as compared to the 4.0 (mean and median) connections
- 19 -
with banks for non-family-owned firms. Over time, family-owned firms decrease the
average number of bank relationships. The geographical dispersion of banks gives
further information on the importance of banks for the financing of the firm.
[Insert Table 8 about here]
Table 8 also investigates whether the sample firms have nationwide (vs. only
regional) connections to banks. The idea here is that nationwide connections to banks
are an indicator of the quality of financing relationships (main German banks are
situated in Berlin, Düsseldorf, Frankfurt, Hamburg, Stuttgart and Munich) and of the
financial independence from the Hausbank in town. However, Table 8 reports no
evident differences between family- and non-family firms in this respect. So while
bank relationships may be an important factor of corporate growth, we fail to verify
this in a statistically significant way.
In sum, we cannot therefore reject but also cannot verify without doubt Hy-
pothesis 5 saying that family firms sacrifice growth in order to retain control and
grow less than non-family firms.
E CONCLUSION
In Germany, families have been exerting power in family-owned corporations with
more persistence compared to other countries. Today's founding successors still own
and control their firms. Thereby they seem to prefer family ownership to stronger
corporate growth, but in terms of operating performance they have not been perform-
ing worse (but rather better) than those firms that left the family path. Compared to
Anglo-Saxon countries, the still small number of stock companies (and high number
of private family firms), together with the high concentration of family ownership,
constitutes an unchanged fact about the German capital markets.
In a nutshell, our research shows that German families give up ownership
slowly and sometimes not at all, and control of family businesses remains strong even
after several generations. Family businesses outperform non-family firms in terms of
operating performance not in terms of stock market performance, but they also grow
more slowly. The succession of ownership and control to subsequent generations
seems not to have an adverse impact on performance, except for a general decline in
profitability along the life-cycle of the firm.
- 20 -
The performance results of our study confirm validity of the families’ strategic
decisions. At the start of the last century, families could exercise control over ex-
tended periods as directors of their firms. The same firms keep the same control to-
day and perform reasonably well according to the numbers. There are also private
benefits for entrepreneurial families, such as a good reputation resulting not only
from good management performance but also from philanthropic activities of their
companies, when the families think of themselves as having a social responsibility.
Therefore, we come to the conclusion that firms running in the family, almost one
hundred years after their foundation, still look very much like the firms they used to
be and fare quite well in Germany.
- 21 -
F LITERATURE
Amlmeida, Heitor, and Daniel Wolfenzon (2004): A Theory of Pyramidal owner-
ship and Family Business Groups, Working Paper, New York University.
Amoako-Adu, B. and B. F. Smith (2001): Dual class firms: Capitalization, owner-
ship structure and recapitalization back into single class. Journal of Banking &
Finance, 25, 1083-1111.
Anderson, Ronald C., and Reeb, David M. (2003): Founding-Family Ownership
and Firm Performance: Evidence from the S&P 500, Journal of Finance, 58,
1301-1327.
Anderson, R., S. Mansi, and D. Reeb (2003): Founding family ownership and
agency costs of debt, Journal of Financial Economics, 68, 263-285.
Bebchuk, Lucian A. (1999): A Rent-Protection Theory of Corporate Ownership and
Control. NBER Working Paper, No. 7203.
Bertrand, Marianne, Simon Johnson, Krislert Samphantharak, and Antoinette
Schoar (2004): Mixing Family with Business – A Study of Thai Business
Groups and the Families Behind them, Working Paper.
Bhattacharya, Utpal and B. Ravikumar (2001): Capital Markets and the Evolution
of Family Businesses, Journal of Business, 74 (2001), 187-220.
Bhattacharya, Utpal and B. Ravikumar (2002): From Cronies to Professionals:
The Evolution of Family Firms, Working Paper, Indiana University.
Bjuggren, Per-Olof, and Lars-Göran Sund (2002): A Transaction Cost Rationale
for Transition of the Firm within the Family, Small Business Economics, 19,
123-133.
Burkart, Mike, Panunzi, Faustro, and Shleifer Andrei (2003): Family Firms, Jour-
nal of Finance, 58, 2167-2202.
Chua, Jess H., Chrisman, James J., and Sharma, Pramodita (2003): Succession
and Nonsuccession Concerns of Family Firms and Agency Relationship with
Nonfamily Managers, Family Business Review, 16, 89-108.
Davis, Peter S, and Paula D Harveston (1999): In the Founder’s Shadow: Conflict
in the Family Firm. Family Business Review, 12, 311-323.
Davis, Peter S, and Paula D Harveston (2001): The Phenomenon of Substantive
Conflict in the Family Firm: A Cross-Generational Study. Journal of Small
Business Management, 39, 14-30.
- 22 -
Ehrhardt, Olaf and Nowak, Eric (2003): Private Benefits and Minority Shareholder
Expropriation (or what exactly are private benefits of control?), European Fi-
nance Association Conference Paper.
Eube, Steffen (1998): Der Aktienmarkt in Deutschland vor dem Ersten Weltkrieg.
Frankfurt am Main: Knapp.
Faccio, Mara L. and H.P. Lang. (2002): The Ultimate Ownership of Western Euro-
pean Corporations. Journal of Financial Economics, 65, 365-395.
Fohlin, Caroline (2004), The Rise and Fall of the Mixed Financial System in Ger-
many, in: Fohlin, C.: Corporate Finance and Governance in the German Indus-
trializiation, Cambridge University Press, forthcoming.
Franks, Julian and Mayer, Colin (2001): Ownership and Control of German Corpo-
rations. Review of Financial Studies, 14, 943-977.
Franks, Julian, Mayer, Colin, and Stefano Rossi (2004a): The Origination and
Evolution of Ownership and Control of the Corporation, LBS Working Paper.
Franks, Julian, Mayer, Colin, and Stefano Rossi (2004b): Spending Less Time
with the Family: The decline of Family Ownership in the UK, LBS Working
Paper.
Franks, Julian, Colin Mayer, and Hannes Wagner (2004): The Origins of the
German Corporation – Finance, Ownership and Control, LBS Working Paper.
Gallo, Miguel A. and Vilaseca A. A. (1998): Financial Perspectives on Structure,
Conduct, and Performance in the Family Firm - An Empirical Study, Family
Business Review, 11, 35-48.
Goetzmann, William N., Roger G. Iibbotson, and L. Peng. (2001): A New Histori-
cal Database for the NYSE 1815 to 1925: Performance and Predictability.
Journal of Financial Markets, 4, 1-32.
Hahn, Hans-Werner (1984): Geschichte des Deutschen Zollvereins, Göttingen:
Vandenhoeck & Ruprecht.
Handler, Wendy C. (1994): Succession in Family Business – A Review of the
Research, Family Business Review, 7, 133-157.
Henderson, William O. (1939): The Zollverein. Cambridge University Press.
James, Harvey (1999): Owner as Manager, Extended Horizons and the Family Firm,
International Journal of the Economics of Business, 6.
Jenkinson, Tim and Alexander Ljungqvist (2001): The Role of Hostile Stakes in
German Corporate Governance. Journal of Corporate Finance, 7, 397-446.
- 23 -
La Porta, Rafael, Florencio Lopez-de-Silanes, Andrei Schleifer, and Robert
Vishny (1999): Corporate ownership around the world. Journal of Finance,
54, 471-517.
Lehn, Kenneth, Sukesh Patro, Mengxin Zhao (2004): Derminants of the Size and
Structure of Corporate Boards: 1935-2000, Working Paper, University of
Pittsburgh.
McConaughy, Daniel L., and G. Michael Phillips (1999): Founders versus Descen-
dants: The Profitability, Efficiency, Growth Characteristics and Financing in
Large, Public, Founding-Family-Controlled Firms. Family Business Review,
12.
McConaughy, Daniel L., Charles H. Matthews, and Anne S. Fialko (2001):
Founding Family Controlled Firms: Efficiency, Risk, and Value, Journal of
Small Business Management, 39, 31-49.
Pérez-González, Francisco (2002): Inherited Control and Firm Performance, Work-
ing Paper, Columbia University.
Sonfield, Matthew C., and Robert N. Lussier (2004): First-, Second-, and Third-
Generation Family Firms : A Comparison. Family Business Review 17, 189-
202.
Stoy Hayward Consulting, and London Business School (1989): Staying the
Course – Survival Characteristics of the Family Owned Business, London:
Stoy Hayward.
Villalonga, Belen, and Amit, Raphael (2004): How Do Family Ownership, Man-
agement and Control Affect Firm Value? Working Paper, Harvard Business
School and Wharton School.
Zingales, Luigi (1995): Insider ownership and the Decision to Go Public, Review of
Economic Studies, 62, 425-448.
Table 1a - Selection of family firms and matched sample
Panel A: Description of full Sample 2003 Companies
German Stock Companies (Aktiengesellschaften ) founded in or before 1913, with turnover = 50 Mio Euro in 2003 159of which Family Firms in 2003 where founding family owns more than 50% of voting rights 62of which Non-Family Firms in 2003 (founding family owns less than 50%, new family owner, other Company, freefloat) 97Deletion of Non-Family Firms (in 2003) by criteria: -35
data availability ( - 22 firms), elimination of non representative industries ( - 1 Firm in the utility sector)elimination of one firm in each representative industry ( - 10 firms in 10 industries)elimination of overrepresented industries( consumer durables and manufacturing) to get representative distribution (2 of 12 firms).
Matched Sample of Non-Family Firms (in 2003) 62Full Sample in 2003 124
Panel B: Description of full Sample 1903
Full Sample in 2003 124German Stock Companies (Aktiengesellschaften ) founded between 1903 and 1913, with turnover = 50 Mio Euro in 2003 17
Full Sample in 1903 106
of which Family Firms (FF) in 1903 90of which Non-Family Firms (NFF) in 1903 16
of which already Stock Companies in 1903 34of which Non-Stock Companies in 1903 73
no data because non quoted stock companies are not published in Saling Aktienführer 1903-2003 20
Full Sample of Stock Companies 1903-2003 (Final 14) 14
Sources: Hoppenstedt and Saling Aktienführer (1903-2003), Handbuch der Deutschen Großunternehmen (1953-2003), annual reports, corporate history reports, factiva Database and Frankfurter Allgemeine Zeitung archives.
This table reports all stock companies existing in 2003 who where founded before 1913 in Germany (All Firms). 62 companies still existing today are family firms (FF), a matched sample of 62 are non-family firms (NFF). The table reports when FF change to NFF. The table also reports the year when the companies incorporated as a stock company (Aktiengesellschaft). Furthermore, it reports the number of stock companies listed at Frankfurt Amtlicher Handel. Particularly in periods I and II, values are missing. This is due to the fact that only quoted stock companies or huge companies are published or the fact that some relevant figures of non-stock companies are not reported in the Hoppenstedt database.
Table 1b - Evolution of Sample Firms over time
Family Firms Non-Family Firms All Firms
Mean Median Mean Median Mean Median t-value z-value
Age 135.9 126 130.7 123 141.2 127 1.015 0.625[0,312] [0,532]
Percentages of firms in/with: All Firms Family Firms Non-Family Firms z-value
Small town headquartered 61.3% 48.4% 29.0% 2.212[0,027]
Technology intensive industry 57.7% 38.7% 45.0% -0.807[0,4195]
Non-regional bank relationship 57.3% 57.1% 57.4% -0.026[0,980]
Mean Median
Family Ownership 83.0% 95.0%
Family in Supervisory Board 58.9% -
Family in Executive Board 83.9% -
Generation 3.7 4.0
Difference FF/NFF
The table shows the descriptive data of 62 family and 62 non-family firms founded before 1913 and still in existance. Age is measured in years, and size of the turnover of 2003 in hundred thousand Deutsch Mark. Small town is when the corporate headquarter is located in a small town as defined by the German Federal Office (Bundesamt) for Statistics as not being 'Großstädte or 'Millionenstädte' (large towns with more than 100,000 inhabitants). Technology intensive industries are defined according to Fama and French (1985) as Business Equipment, Healthcare and Chemical Products (details see Table 4). Statistical significance is reported at usual levels (*10%, **5%, ***1%) levels. The z-value is measured by the two-sample Wilcoxon rank-sum (Mann-Withney) test or two sample test of proportion. P-values are in brackets.
Table 2 - Descriptive Statistics for 2003
Panel A: Descriptional Statistics of Family Firms vs. Non-Family Firms in 2003
Panel B: Descriptive Statistics of ownership structures in Family Firms 2003
All Firms Family Firms (FF) Non-Family Firms (NFF)
Period I Period II Period III1913 1963 2003
N Mean Median N Mean Median N Mean Median
Voting rights of founding family 28 100% 100% 33 89% 100% 60 83% 95%
Minority voting stake of founding family
0 - - 0 - - 4 17% 20%
Voting rights of family firms which exist in 2003 and were family firms in: 1913 9 100% 100% 9 84% 100% 9 77% 75% 1963 24 93% 100% 24 77% 75%
Table 3a - Evolution of ownership
Because the Hoppenstedt Aktienführer in 1913 does not contain ownership data, we assume that the voting rights in 1953 are also the minimum voting rights in 1913. All 9 in 1913 existing family firms are completely controlled in 1953 with 100% by the founding families. For comparison, numbers from the largest available sample in each period are also reported, respectively.
Table 3b - Family ownership and Family control through Generations
Separation of ownership/control in strong or very strong family-controlled firms
2 11%
n/A 52All Family Firms 83 9 7 2 1 19 12
Period I1913 N % 1 2 3 4plus N n/A
very strong family control 9 100% 5 100% 2 100% 1 100% 1 100% 9 0
> 75% of voting rights 9 100% 5 100% 2 100% 1 100% 1 100% 9Founder in Executive Board 4 80% 5 100% 5Founder in Supervisory Board 3 60% 3 60% 3Postfounder in Executive Board 3 75% 1 50% 1 100% 1 100% 3Postfounder in Supervisory Board 4 100% 2 100% 1 100% 1 100% 4
strong family control 0 0% 0 0% 0 0% 0 0% 0 0% 0 0
Separation of ownership/control in strong or very strong family-controlled firms
0 0%
n/A 91All Family Firms 100 5 2 1 1 9 0
The table separates two types of family-ownerhsip: Supermajority ownership is defined when the family ownes more than 75% of the voting rights. If the family ownes more than 50 % of the voting rights the family has majority ownership. In 2003 for 58 of 62 family firms we have exact information on voting rights and generation. In two cases we have no information about the generation that owns the company in 2003. In 1963 for 31 of 83 family firms we have exact information on voting rights. In 12 cases we have no information about the generation that owns the company in 1963. In 1913 for 28 of 100 family firms we have exact information on voting rights. In 15 cases we have no information about the generation that owns the company in 1913. The table also shows whether the generation using ownership and control rights take active influence over the firm. Apart from the low in 1963 and 1913 it shows very strong family control. In Period II there seems to be increased separation of ownership and control. A possible explanation is the fact that after WW2 some family members did not return from the war.
Post-Founder Generation
Post-Founder Generation
Founder and Post-Founder Generation
Table 4 - Industries and Control Transfers
Full Sample
BE/ME Ratio Family Firms Non-Family Firms1926-2003 N % 1913 1963 2003 1913 1963 2003 N %
The table reports the distribution of the industries in which family firms operate over time. The industries are divided on the one hand in technology intensive industries like: Business Equipment and Healthcare and Chemical.On the other hand in less technology intensive industry like Consumer Durables and Non-Durables, Manufactoring, Telephone/Television/Electro, Wholesale, Oil/Gas and Other. According to Pérez-Gonzáles (2002) we classify in technology intensive and less technology intensive industries. The classification is based by the Fama/French (1985) BE/ME Ratio where they define the three lowest quartiles of the BE/ME Ratio as growth intensive industries. Fama/French Industries are: 1. Non Durables as Food, Tobaco, Textiles, Apparel, Leather, Toys 2. Consumer Durables as Cars, TV, Furniture, Houshold Applicances 3. Manufactoring as Machinery, Trucks, Planes, Off Furn, Paper, Print 4. Energy as Oil, Gas, Coal Extraction and Products 5. Chemicals and Allied Products 6. Business Equipment as Computers, Softtware and Electronic 7. Telephone and Television Transmission 8. Utilities 9. Shops as Wholesale, Retail and some Services 10 Healthcare as Medical Equipment and Drugs 11. Finance 12. Other like Mines, Construction, Transport, Entertainment. The two industries Utilities and Finance are not used in our study.
OLS Regression Random-effectsVariables with robust standard errors GLS regression
Coefficients Coefficients
Dummy family firm 12,0064** 12,0064**[4,646] [5,5326]
Non-technology intensive industry -4.8196 -4.8196[5,5984] [5,4664]
Nationwide bank relationships 3.1480 3.1480[4,8035] [5,3893]
Age -0,2182*** -0,2182***[0,0629] [0,0578]
Constant 30,9662*** 30,9666***[7,9356] [11,241]
R-square 0.1141 0.1193
Table 5a - Operating performance of family vs. non-family firms
The dependent variable is the operating performance of family and non-family firms measured by return on assets. As a dummy variable we apply our definition of family firm (see Table 1a) and non-technology intensive industries, firms in non urban aglomerations, nationwide bank relationships. *,**,*** Asteriks indicate significance at the 10% , 5%, and 1% confidence level. Standard errors of coefficients are in parentheses. Number of observations (firm-years): 165
Table 5b - Stock Performance of Family vs. Non-Family Firms
The table compares monthly returns of 35 companies, listed on Amtlicher Handel Frankfurt from February 1947 until December 1995 (587 equally-weighted monthly portfolio returns using 13,377 firm-month observations). The all period average shows that family fims perform not significantly different from non-family firms. Further analysis shows that there is a slightly better performance of 0,0013 percent of non-family firms (not statistically significant at usual *10%, **5%, ***1% levels).
The generation is identified through changes of family CEO or board members. In some cases, the exact generation is identified or cross-checked by information received from the companies' investor relations department, firm history reports or individual newspaper research (e.g., Frankfurter Allgemeine Zeitung). The table shows the number of family firms going public in relation to the generation.
Generation selling partial control of the Family Firm
Generation Going Public (IPO)
Generation running the Family Firm
Table 6b - Abnormal operating performance by generation
Generation N Mean difference % t-value Gen before
1 9 9.402 27 18.03 8.62% -0.4135
3 53 8.17 -11.49% 0.96744 33 8.63 0.46% -0.0713
The table reports that in family firms the average annual return of non-family firms is outperformed in each generation. Firm-specific nformation on the generation is based on the time the family CEO changes from one family member to a family successor.
OLS Regression Random-effectswith robust standard errors GLS regression
The dependent variable is the operating performance of family firms measured by return on assets. Voting rights are the voting rights of the founding family. The family CEO dummy takes the value of one if a family member is in a management position. Founder CEO, descendant CEO, and hired CEO are dummy variables that are one if the CEO is the founder, a descendant or an external manager. The generation effect variable measures the alternation of generations. As further dummy variables we took nontechnology intensive industries, firms headquartered in small towns, nationwide bank relationships, and publicly listed firms. *,**,*** Asteriks indicate significance at the 10% , 5%, and 1% confidence level. Standard errors of coefficients are in parentheses. Number of observations (firm-years): 97.
Period
N NMean Median Mean Median Mean Median Mean Median Mean Median
All Period Average 99'189 20'187 60'055 19'922 173'244 27'720 28'422 10'823 1'689'649 568'898
Table 7 - Growth of Sales and Capital in Family vs. Non-Family Firms
The table shows that non-family firms grow faster as measured by sales and nominal capital in period III than family firms. (Period I: in hundred thousand Reichsmark, period II and III: in hundred thousand Deutsche Mark). In period I and II it was unusual to find sales figures in the Hoppenstedt database.
All Firms Family Firms Family Firm Non-Family FirmNon-Family Firms
Sales Turnover (Size 1)
Nominal Capital (Size 2)
"Final 14"
"Final 14"
All Firms Family Firms Non-Family FirmsFamily FirmsNon-Family Firms
Table 8 - Relationships with Banks
Period
N
Mean Median Mean Median Yes % No Yes % No
I 1913 5.8 5 3.6 3 5 63% 3 3 60% 2 14
II 1963 3.2 3.5 3.8 3.5 11 65% 6 2 25% 6 25
III 2003 2.8 3.0 3.9 4.0 32 56% 25 35 58% 25 117
The table reports the quantity and georaphical distribution of commercial banks dealing with the companies of the sample firms and reports if the sample companies have a bank relationships with banks in other towns than their headquarter. Differences between family- and non-family firms can be seen in the number of banks. In the first period family firms have more bank relationships than non-family firms. When family firms become more mature, the number of banks declines to less relationships than non-family firms.
Family Firms Non-Family Firms Family Firms Non-Family Firms
Number of Banks Geographical Distribution of Banks
Appendix I: Inheritance taxation around the world Source: Japanese Ministry of Finance (MoF), 2004 International Comparison of Inheritance Tax
Japan U.S.A. U.K. Germany FranceTaxation method Tax on legatee Tax on bequest Tax on bequest Tax on legatee Tax on legateeTax threshold(Spouse and 2 children)(2 children)
80 million yen70 million yen
163 million yen81 million yen
92 million yen47 million yen
115 million yen58 million yen
25 million yen13 million yen
Minimum tax rate 10 % 18 % 7 % 5 %
Maximum tax rate 70 % 55 %40 %
30 % 40 %Number of brackets 9 18 1 7 7
(Notes) 1 . If the inheritors are a spouse and her/his three children, taxable amount would be minimized if the spouse obtains half of the bequest and the childrenequally share the balance of the bequest. If three children inherit the bequest, this tax threshold is applied when the children share an equal amount of thebequest.
2 . The tax rates for Germany and France in the table above are those applied when inheritors are the spouse or the children. The tax rate differs according tothe relationship between the deceased and the inheritors. In case of the most distant relatives, the tax rate is 17 - 50 % in Germany and 60 % in France.
3 . The figures in tax thresholds of foreign countries are converted into yen by the following exchange rates. U.S.A.: 1 dollar = 130 yen, U.K.: 1 pound = 215yen, Germany: 1 mark = 72 yen, France: 1 franc = 21 yen.
Appendix II: Balanced sample with complete data from 1903-2003
Founder StakeCompany Name Town Founded Stock Comp Industry 1903 2003 Founding Owner Today's OwnerCarl Schlenk Roth 1879 1897 Manufactoring 100% 75% Carl Schlenk Family von Schlenk-BarnsdorfDeutsche Gelantine Fabriken StoessEberbach 1875 1902 Consumer Non-Durables 100% 92% Heinrich & Emil Mayer Family Koepff-MayerVSM Hannover 1864 1898 Manufactoring 100% 0% Family Oppenheim Family Starcke, Dresdner BankMechanische Baumwoll Spinnerei Bayreuth 1853 1853 Textile 0% 0% Mutual of Fibre Traders Family Claas DaunDürkopp Adler Bielefeld 1860 1889 Consumer Durables 100% 0% Family Dürrkopp FAG KugelfischerDillinger Hüttenwerke Dillingen 1685 1802 Oil, Gas and Cole Extraction 0% 0% Mutual of Mining Companies SaarstahlStollwerck Köln 1839 1902 Consumer Non-Durables 100% 0% Family Stollwerck Family ImhoffLöwenbräu München 1383 1872 Consumer Non-Durables 0% 0% Family Brey (until 1872) InterbrewSiemens München 1847 1900 Electronical 100% 6% Family von Siemens Family Siemens, HVB, Munich ReDaimler Benz Stuttgart 1890 1904 Manufactoring 100% 0% Family Benz Deutsche Bank, Kingdom KuweitZüblin Stuttgart 1898 1919 Construction 100% 0% Family Züblin Züblin ManagementBuderus Wetzlar 1731 1904 Manufactoring 100% 0% Family Buderus BoschBLG Logistic Group Bremen 1877 1925 Wholesale, Retail, Service 0% 0% Bremer Kaufmannschaft Bremen Town, Sparkasse BremenVGT Industrie Großalmerode 1887 1888 Manufactoring 0% 0% Hessische Grubenbesitzer Family Klingspor, Family Heller


![[Www.devoir.tn] Circuit Rc Rl Rlc Libre 2012 2013(Fethi Affi)](https://static.documents.pub/doc/80x56/577c7f061a28abe054a2e9a3/wwwdevoirtn-circuit-rc-rl-rlc-libre-2012-2013fethi-affi.jpg)


