Rural Indiana A Demographic and Economic Overview August 2014 While Indiana’s rural economy has become increasingly diverse over the last 50 years, it faces a number of unique challenges that threaten the long range prosperity of rural Hoosiers. Recognizing the need for action, Indiana State University’s Rural Urban Entrepreneurship Development Institute looks at demographic and economic trends of the 21 st Century to first inform stakeholders and policy makers and then to assist with the development of strategies to guide future action.
Transcript
Rural Indiana A Demographic and Economic Overview
August 2014
While Indiana’s rural economy has become increasingly diverse over the last 50 years, it faces a number of unique
challenges that threaten the long range prosperity of rural Hoosiers. Recognizing the need for action, Indiana State
University’s Rural Urban Entrepreneurship Development Institute looks at demographic and economic trends of the
21st Century to first inform stakeholders and policy makers and then to assist with the development of strategies to
guide future action.
1
Rural Indiana A Demographic and Economic Overview
Christine Prior, Senior Project Consultant Rural-Urban Entrepreneurship Development Institute August 2014
2
Table of Contents Introduction 2 Map of all counties in Indiana 3 Collective Perspective on Indiana’s Rural Counties
Demographic Perspective 4 Table 1: Indiana Rural Counties Population, Change Over Time 4 Figure 1: Indiana Rural Population Change 2001-2022 4 Table 2: Indiana Rural Counties Population, Change in Race and Ethnicity 5 Table 3: Indiana Rural Counties Population, Change in Age Cohorts 6 Figure 2: Indiana’s Rural Population by Age 6 Figure3: Indiana’s Rural and State Labor Force 7 Table 4: Indiana’s Rural Counties Population, Educational Attainment 7 Economic Perspective 8 Figure 4: Total Job History 2001-2022 8 Figure 5: Indiana’s Unemployment Rate 8 Table 5: Jobs by 2-Digit NAICS Codes 9 Figure 6: Indiana’s Rural Counties Top 10 Manufacturing Sectors 10 Figure 7: Indiana’s Rural Counties Top 15 Traded Clusters 11 Table 6: Occupations by 2-Digit SOC Codes 13 Economic Growth Region Perspective 14 Map of Regions 14 Table 7: Economic Growth Regions Change in Population 14 EGR-1 Top 10 Traded Clusters 15 EGR-2 Top 10 Traded Clusters 16 EGR-3 Top 10 Traded Clusters 16 EGR-4 Top 10 Traded Clusters 17 EGR-5 Top 10 Traded Clusters 18 EGR-6 Top 10 Traded Clusters 18 EGR-7 Top 10 Traded Clusters 19 EGR-8 Top 10 Traded Clusters 20 EGR-9 Top 10 Traded Clusters 21 EGR-10 Top 10 Traded Clusters 21 EGR-11 Top 10 Traded Clusters 22
Conclusions 23
3
Introduction Approximately 15-percent of the U.S. population resides in rural communities, which spread across
72-percent of the nation’s land area. In Indiana, a larger proportion of the state is rural with 72 of the State’s 92 counties predominantly rural in nature and approximately 34-percent of the State’s population residing in these rural counties. Over the past decade, studies have revealed that much of Rural America suffers disproportionately in comparison to its urban counterparts in relation to labor participation, out migration, aging of its population, educational attainment, poverty rates and access to health care. Here Indiana State University Rural Urban Entrepreneurship Development Institute examines these issues for Rural Indiana.
Leadership for initiatives launched by Indiana State University to enhance rural life within the State lies with its Rural-Urban Entrepreneurship Development Institute (RUEDI). RUEDI emerged from the University’s Strategic Plan, The Pathway to Success and its initiative Unbounded Possibilities, which envisions a culture where ISU graduates are engaged, productive citizens within the world that they live. Recognizing that many of its alumni reside in rural communities, the University has a strong desire to address the growing needs of Rural Indiana and to support activities of the Institute and its partners.
RUEDI provides engagement and research as well as a learning platform to improve the economic
health and stability of rural counties and small towns throughout Indiana. Collaboration with external businesses, industry, civic organizations, government and academic stakeholders plays a critical role in implementing projects to reach the overarching goals of the Institute and University. RUEDI’s activities and strategic partnerships will focus on: supporting existing commercial activity, increasing new business starts, expanding job creation, creating, growing and attracting entrepreneurs, raising per capita incomes, and enhancing regional rural educational attainment by encouraging completion of high school and post-secondary education within the State’s rural communities.
An integral part of beginning any project is to ensure that reliable data is collected to first inform
stakeholders of important issues that exist and for which decisions need to be made and then to provide a reliable and consistent resource to measure the effect of activities taken. Therefore, the Rural-Urban Entrepreneurship Development Institute has collected data from a number of sources including the U.S. Census Bureau, U.S. Bureau of Labor Statistics, Indiana Department of Workforce Development and other state and federal agencies and associations to assist the Institute and its many partners to first understand the current situation and then plan future action.
Because of the complex number of data resources available, RUEDI has enlisted the assistance of
Economic Modeling Specialists, Inc. (EMSI) to collect and integrate much of the data within this report on industries, occupations, and demographics. EMSI is a web-based tool that has assisted community colleges, universities, workforce boards, economic development groups, and private industries throughout the United States to better understand all facets of employment and economic trends—industries, occupations, demographics, economic impacts, and even skills, job compatibility, educational attainment, and more—at various levels (zip code, county, state, nation) of geographic detail. Most of the tables contained within this report have been created with data from EMSI’s web-tools. Data for this report is taken from Dataset Version 2014.2 Class of Worker.
In July of 2012, the Rural-Urban Entrepreneurship Development Institute completed an economic overview of Indiana’s rural counties using data from 2011. Here in 2014, RUEDI once again examines the Hoosier Rural Counties but now looks at change over time using historical data beginning in 2001 and projections into the next decade. One must remember that the predictions included in these charts
4
and graphs are based on existing trends. Changes in policy or other direct actions that may be taken by citizens can alter these predictions slightly or even drastically. However, examinations of these predictions can identify where action or policy change may be needed to revitalize Indiana’s rural communities and to sustain them overtime.
RUEDI uses OMB’s definition that classifies counties whose largest urban center is less than 50,000
as rural. That includes 46 counties in Indiana. RUEDI like the Office of Community and Rural Affairs (OCRA) also includes counties that are part of MSAs, but whose largest community has less than 50,000 as rural. Overall the 72 predominantly rural Indiana counties included in this report are: Adams, Benton, Blackford, Boone, Brown, Carroll, Cass, Clay, Clinton, Crawford, Daviess, Dearborn, Decatur, De Kalb, Dubois, Fayette, Floyd, Fountain, Franklin, Fulton, Gibson, Grant, Greene, Hancock, Harrison, Henry, Huntington, Jackson, Jasper , Jay, Jefferson, Jennings, Knox, Kosciusko, Lagrange, Lawrence, Marshall, Martin, Miami, Montgomery, Newton, Noble, Ohio, Orange, Owen, Parke, Perry, Pike, Posey, Pulaski, Putnam, Randolph, Ripley, Rush, Scott, Shelby, Spencer, Starke, Steuben, Sullivan, Switzerland, Tipton, Union, Vermillion, Wabash, Warren, Warrick, Washington, Wayne, Wells, White, and Whitley.
State of Indiana 6,127,754 6,332,673 6,516,929 6,677,512 6,759,643 3.34% 2.91% 2.46% 1.23%
United States 284,968,955 298,379,912 311,591,917 323,383,957 329,523,763 4.71% 4.43% 3.78% 1.90%
Indiana’s rural population is and will continue to be approximately one-third of the State’s
population for the immediate future. However, that amount is gradually shrinking. The rate of growth for the rural counties as well as the State and Nation are all expected to slow through the end of this decade. Between 2001 and 2011, Indiana’s rural population grew by more than 66,000 people but is only expected to grow by 17,000 from 2011 through 2021 or 25-percent of the previous decade’s growth rate. When spread across all of Indiana’s 72 rural counties, it is realistic to conclude that many of these rural counties will lose population while others, most likely those adjacent to urban areas, will add just a few hundred to their ranks.
During the 1990s, population gain for Rural America was driven by the migration of people to these rural areas versus natural increase (more births than deaths). This national trend created a more ethnically diverse rural population that is also true for the rural Indiana counties. While White, Non-Hispanics will continue to be the majority population, its share of total population is declining.
The Hispanic or Latino population is the nation’s largest minority group and fastest growing ethnic
population according to the U.S. Census Bureau. Resettlement patterns of young Hispanics to rural areas in the 1990s and the Hispanic’s natural increase between 2000 and 2010 have accounted for 25-percent of the nation’s rural population gain. In rural Indiana, White, Hispanic make up the second largest racial group and their number is expected to double from 2001 to 2021. It should be noted that Hispanic figures refer to an ethnic group and, therefore, can be part of any race. Collectively, Hispanics
6
of all races provided for slightly more than 50-percent of the growth in rural Indiana between 2001 and 2011 and is expected to account for nearly two-thirds of the growth between 2011 and 2021.
Table 2: Indiana Rural Counties Population, Change in Race and Ethnicity
Total 2,186,340 2,223,593 2,243,188 2,262,192 2,271,175 100.00% 100.00% 100.00%
Hoosiers of Two or More Races will demonstrate the second largest growth in real numbers for the
rural counties. Racial and ethnic projections assume that cohort definitions will remain fixed and that self-identification does not change over time. However, the growing number of births to parents of different racial and ethnic groups as well as changing social norms will continue to blur the lines between traditional ethnic cohorts increasing those of Two or More Races or possibly even changing the definitions in the near future. If trends continue, researchers predict that by 2050 the nation’s racial and ethnic mix will look quite different with White, Non-Hispanic accounting for less than 50-percent of the population.
The Two or More Races population is very young with a reported median age of 19.7 in 2009. The
Black and Hispanic populations also reported younger median ages in that year with 31.3 and 27.4 respectively compared to the dominant race of White, Non-Hispanic at 41.21. However, the relatively low percentage of the total population of these minority groups is not sufficient to reverse the aging of rural Indiana primarily caused by White, Non-Hispanic baby boomers. The last of the baby boomer generation will reach 60 years of age by 2021. U.S. life expectancy continues to increase and is expected to reach 79.5 by 2020. With an increasing number of retirees electing to return to their rural roots or to “age in place”, age groups between 60 and 75 in Rural Indiana are expected to increase by more than 70-percent from 2001 to 2021 with all of the age cohorts over age 60 increasing by more than 50-percent during this time.
The dependency ratio is the relationship between the working-age population and the young and
elderly population. The aging of the rural population along with the out-migration of younger age cohorts in the rural areas is creating changes in the dependency ratio. While both the youth and elderly dependency reduce per-capita resources in the economy, the longer life expectancy after retirement is increasing the need for and consumption of these resources. Overall, the U.S. Census Bureau estimates that 61 (40 children and 21 adult) Hoosiers are dependent on 100 residents of working age and that in rural areas this number is higher.
1 U.S. Census Bureau, Statistical Abstract of the United States 2012, Population
7
Table 3: Indiana's Rural Counties Population, Change in Age Cohorts
Demographic
Population
Change Percent of Total Population 2001-11 2011-21 2001-21
2001 2011 2021 Number % Number % Number % 2001 2011 2021
Under 5 years 145,890 139,121 141,023 (6,769) -4.6% 1,902 1.3% (4,867) -3.3% 6.7% 6.2% 6.2%
5 to 9 years 157,346 149,082 143,960 (8,264) -5.3% (5,122) -3.6% (13,386) -8.5% 7.2% 6.6% 6.3%
10 to 14 years 167,118 159,013 151,324 (8,105) -4.8% (7,689) -5.1% (15,794) -9.5% 7.6% 7.1% 6.7%
15 to 19 years 160,127 158,051 151,194 (2,076) -1.3% (6,857) -4.5% (8,933) -5.6% 7.3% 7.0% 6.7%
20 to 24 years 129,792 130,870 125,824 1,078 0.8% (5,046) -4.0% (3,968) -3.1% 5.9% 5.8% 5.5%
25 to 29 years 126,407 123,236 122,475 (3,171) -2.5% (761) -0.6% (3,932) -3.1% 5.8% 5.5% 5.4%
30 to 34 years 143,150 130,211 131,569 (12,939) -9.0% 1,358 1.0% (11,581) -8.1% 6.5% 5.8% 5.8%
35 to 39 years 165,495 134,097 132,256 (31,398) -19.0% (1,841) -1.4% (33,239) -20.1% 7.6% 6.0% 5.8%
40 to 44 years 175,880 147,728 132,264 (28,152) -16.0% (15,464) -11.7% (43,616) -24.8% 8.0% 6.6% 5.8%
45 to 49 years 161,494 165,298 132,915 3,804 2.4% (32,383) -24.4% (28,579) -17.7% 7.4% 7.4% 5.9%
50 to 54 years 148,056 173,400 146,212 25,344 17.1% (27,188) -18.6% (1,844) -1.2% 6.8% 7.7% 6.4%
55 to 59 years 115,152 157,373 160,175 42,221 36.7% 2,802 1.7% 45,023 39.1% 5.3% 7.0% 7.1%
60 to 64 years 96,151 140,184 165,924 44,033 45.8% 25,740 15.5% 69,773 72.6% 4.4% 6.2% 7.3%
65 to 69 years 80,524 104,109 143,755 23,585 29.3% 39,646 27.6% 63,231 78.5% 3.7% 4.6% 6.3%
70 to 74 years 73,420 80,467 116,856 7,047 9.6% 36,389 31.1% 43,436 59.2% 3.4% 3.6% 5.1%
75 to 79 years 60,893 60,031 77,881 (862) -1.4% 17,850 22.9% 16,988 27.9% 2.8% 2.7% 3.4%
80 to 84 years 42,290 46,081 50,417 3,791 9.0% 4,336 8.6% 8,127 19.2% 1.9% 2.1% 2.2%
Source: QCEW Employees - EMSI 2014.2 Class of Worker
For the American workforce, full retirement age or “normal retirement age” as declared by the
Social Security Administration had been 65 for many years. However, beginning with people born in 1938 or later, that age gradually increases until it reaches 67 for people born after 1959, generally considered the last year of birth for those Baby Boomers. Using the traditional retirement age of 65, it is estimated that by 2021, nearly 20-percent of Rural Indiana’s population will have reached retirement age up from 13-percent just 20 years before. The growing numbers of persons reaching retirement and the decreasing number of persons from the lower age cohorts to replenish the talent pipeline will have an adverse effect on the pool from which a talented and experienced labor force can be drawn.
According to the Indiana
Department of Workforce Development, the Labor Force (persons between ages 18-64) for Indiana will grow by approximately 8-percent between 2000 and 2020 from 3,120,900 to 3,370,330. During this time the rural labor force will remain relatively steady at 1.1 million, but will begin to decline after 2015. During the next decade the steady continued decline of the rural workforce will begin to slow the overall statewide labor force growth rate.
8
In 2020 researchers predict that the total rural working labor force will be approximately 1.25 million and that the total number of jobs will be around 860,000 requiring 69-percent of the working age population to participate in the workforce. Yet in May 2014, the Bureau of Labor Statistics announced that the Labor Participation Rate had hit a 35-year low of 62.8-percent. In that same time frame the highest Labor Participation Rate was between 1997 and 2000 when the rate was 67-percent.
Labor Force or Human Capital is increasingly being recognized by Hoosier employers as an essential
component of a vibrant economic environment. Education and experience of a region’s labor force make a significant difference in the rate of return on business investment and on a community’s quality of life. Historically, Rural Indiana has done well with graduating its young people from high school, but at the collegiate level the state consistently ranks poorly in comparison among the nation’s 50 states (44th in 1970, 48th in 1997 and 43rd in 2009) in the number of residents with a Bachelor Degree or Higher.
Total 1,426,066 1,470,356 1,507,052 1,538,672 1,557,849 100.00% 100.00%
Source: QCEW Employees - EMSI 2014.2 Class of Worker
Throughout the 20th Century, the predominant agriculture and manufacturing industries of Indiana’s
rural counties provided comfortable wages and family stability without advanced skills or training. In 2000, the Indiana Fiscal Policy Institute’s Indiana’s Human Capital Retention Project found that Indiana employers were starved for higher skilled workers with 63-percent needing more employees with 2-year degrees and 71-percent needing employees with 4-year degrees. Employers find that institutions of higher learning within the state graduate students with the required technical skills for the positions available; however, soft skills such as communication, leadership and critical thinking are sometimes lacking with these graduates. In 2013, the Indiana General Assembly passed legislation to create the Indiana Career Council with the mandate to better align employer needs with the interests, skills and personal employment goals of citizens. In June 2014, the Council approved its strategic plan to better align needs, to engage partners across the state and to advance the educational attainment, skills and wages of all Hoosiers.
9
Indiana’s Rural Counties an Economic Perspective Total number of jobs in rural Indiana during the first quarter of the 21st Century saw ebbs, flows, a
sudden dip, a slow crawl upward until eventually hitting a steady climb. Between 2001 and 2008, the total number of jobs in rural Indiana remained relatively steady between 785,000 and 800,000. With the onset of the Great Recession, rural counties lost more than 60,000 jobs or 8-percent over the next two years. By 2011, rural Indiana had begun to rebound and is expected to regain total jobs lost from the recent economic crisis by the end of 2015. Jobs are then expected to begin a steady increase of approximately 10,000 jobs per year over the next decade.
As Indiana entered the 21st Century it maintained an unemployment rate around 3-percent for the
first year after which the rate began to expand and would fluctuate between 4- and 6-percent until August 2008, when the State’s unemployment rate quickly increased to more than 10-percent by March 2009 and remained in double digits for more than a year. By March 2014, the State as a whole was once again looking at unemployment rates below 6-percent. The non-seasonally adjusted unemployment rates by county ranged from a low of 4.3-percent in urban Hamilton County to a high of 9.8 in rural Vermillion County. However, this should not indicate that rural counties fared worse or better than the urban counties as approximately half of all counties, both rural and urban, were either above or below the State’s general unemployment rate.
Escalating the high unemployment
rate for both urban and rural counties and impeding a return to the “normal” unemployment rate of around 5-percent are the mismatches in the skills of workers and available jobs. Many of the low-skilled jobs that had sustained Indiana for years have disappeared and are not expected to return as the United States gravitates towards a knowledge based economy. Additionally, skills in sectors adversely
10
affected by the bursting of the housing bubble, construction, finance and real estate, may not be easily transferable to other industries and persons may need to adjust career aspirations before they can return to a sustainable career path.
To study industry sectors, the United States Government classifies industries by type using the North
American Industry Classification System (NAICS). NAICS uses a six-digit hierarchical coding system to classify all economic activity into twenty industry sectors with the greater number of digits giving a more detailed definition of the industry’s subsectors. Five sectors are mainly goods-producing sectors and fifteen are entirely services-providing sectors. Aggregating these NAICS Codes at the 2-digit level, the top five industries by employment in both 2001 and 2011 for Rural Indiana were Manufacturing (NAICS 31-33), Government (NAICS 90), Retail Trade (NAICS 44-45), Health Care and Social Assistance (NAICS 62), and Accommodations and Food Services (NAICS 72).
Table 5: Indiana Rural Counties Jobs by 2-Digit NAICS Codes
90 Government 127,214 130,888 127,362 126,474 130,873 3,659 2.9%
99 Unclassified Industry 35 99 10 <10 0 (35) -100.0%
Total 794,316 797,582 751,378 813,093 870,423 76,107 9.6%
Source: QCEW Employees - EMSI 2014.2 Class of Worker
During the first quarter of this century, the Health Care and Social Assistance sector reports the
greatest gain in actual numbers with an additional 40,000 jobs. This sector’s gains are followed by the Administrative and Support and Waste Management and Remediation Services sector (NAICS 56) which comprises establishments performing routine support activities for the day-to-day operations of other organizations usually on a contract or fee basis. These contractual services will more than double in employment by 2021 adding 27,000 jobs. By 2021, all but a few of the industries will have surpassed their 2001 employment numbers.
11
Manufacturing will be one of those exceptions. In both Rural Indiana and across the Nation,
manufacturing experienced the most significant decrease in employment during the most recent economic crisis. Rural Indiana lost more than 60,000 jobs or 25-percent with the Nation losing more than 4.5 million jobs or 27-percent from 2001-2011. Indiana is the most manufacturing intense state of the 50 United States. In 2001, the Location Quotient or LQ (measure of relative concentration of an industry’s presence in a given geographical region compared to the United States) for manufacturing in Rural Indiana was 2.5. This LQ is expected to increase to 2.9 by 2021. While it is not expected to recover as quickly as some of the other industry sectors, manufacturing will add 20,000 jobs between 2011 and 2021 and continues to evolve and remain as the backbone of the Indiana economy.
While NAICS Codes organize industry by types, industries and employers are not independent of
each other. The underlying strength of a region’s or county’s economic vitality often relies on the clustering of interdependent companies. Harvard Busines School profesor Michael Porter, who is widely credited with popularizing the term “cluster” defines clusters as a “geographic concentration of interconnected companies and institutions in a particular field.” Clusters analysis demonstrates the importance of linkages and dependencies between different firms and sectors in technology, skills and information and how through coordinated efforts opportunities can be leveraged for mutual benefit to all.
The U.S. Cluster Mapping Project2 explains that regional economies are made up of two types of
clusters: local and traded. Local Clusters consist of industries that serve the local market and are usually proportional to the population of that region and are not directly influenced by competition from other
2014 President and Fellows of Harvard College. All rights reserved. Research funded in part by the U.S. Department of Commerce, Economic Development Administration
12
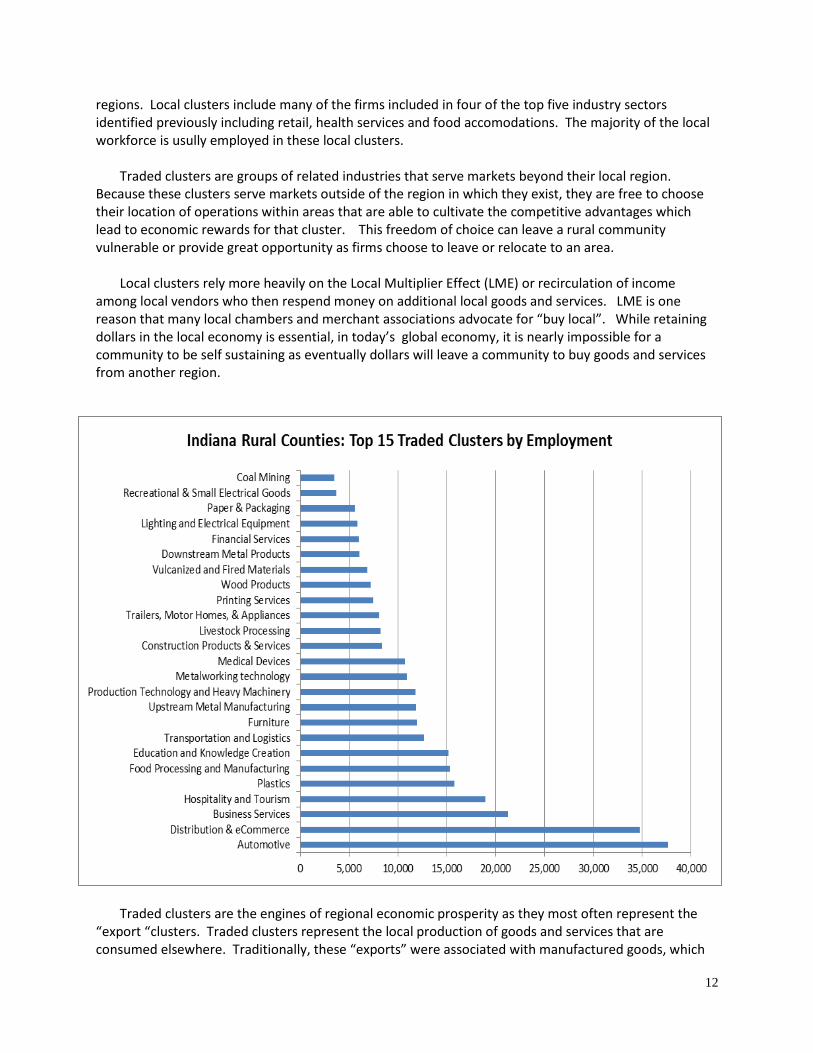
regions. Local clusters include many of the firms included in four of the top five industry sectors identified previously including retail, health services and food accomodations. The majority of the local workforce is usully employed in these local clusters.
Traded clusters are groups of related industries that serve markets beyond their local region. Because these clusters serve markets outside of the region in which they exist, they are free to choose their location of operations within areas that are able to cultivate the competitive advantages which lead to economic rewards for that cluster. This freedom of choice can leave a rural community vulnerable or provide great opportunity as firms choose to leave or relocate to an area.
Local clusters rely more heavily on the Local Multiplier Effect (LME) or recirculation of income
among local vendors who then respend money on additional local goods and services. LME is one reason that many local chambers and merchant associations advocate for “buy local”. While retaining dollars in the local economy is essential, in today’s global economy, it is nearly impossible for a community to be self sustaining as eventually dollars will leave a community to buy goods and services from another region.
Traded clusters are the engines of regional economic prosperity as they most often represent the
“export “clusters. Traded clusters represent the local production of goods and services that are consumed elsewhere. Traditionally, these “exports” were associated with manufactured goods, which
13
Indiana has excelled at, but it can also include local industry sectors like retail and food accommodations that leverage local assets to create a Hospitality and Tourism cluster attracting non-local dollars to the economy. Without the presence of a strong traded cluster, it is nearly impossible for a region to provide for long-term stability for its residents.
The cluster approach has gained popularity in describing segments of a regional economy and for launching initiatives that support an overall economic development strategy. Each of the industry sectors has a presence in Indiana, but industry clusters identified by the Indiana Economic Development Corporation as having the greatest potential for economic growth for Indiana state-wide include: Advanced Manufacturing, Biomedical/Biotechnical (Life Sciences), Information Technology and Logistics. While Advanced Manufacturing is identified as a cluster by Indiana, it more accurately represents establishments operating within the 51 traded clusters identified by the U.S. Cluster Mapping Project.
The high concentration of jobs in the Transportation Equipment Manufacturing sector (NAICS 336)
are associated with the Automotive Cluster which has made a strong come back since the economic recession and bail out of the auto industry in 2008. New investments by the Big Three – Chrysler, Ford and General Motors along with foreign manufacturers like Toyota, Honda and Subaru have created new jobs in more than half of all the counties. Today, Indiana’s gross domestic product in the auto industry is only second to that of Michigan where headquarters and a higher concentration of management, design and research (and their higher-wage jobs) are located.
While the Automotive Cluster is widespread throughout the state, other clusters are concentrated in
sub-regions of the State. Coal Mining is most prominent among the counties of Southwest Indiana where the Illinois Coal Basin crosses over into Indiana. The Trailers, Motor Homes and Appliance Cluster is strong in Northeast Indiana where Elkhart is known as the “RV Capital of the World”. Clusters emerge naturally from interrelated business activities and while they should not be artificially induced they can be nurtured to increase their economic benefit to a region and attractiveness to new business ventures within the cluster.
The transition to Advanced Manufacturing among the emerging clusters is creating resurgence
in manufacturing overall and providing opportunity for more highly-skilled workers, designers, engineers and technicians in rural Indiana. Just as NAICS codes provide information on the different industry sectors, Standard Occupation Codes (SOC) are used by the Federal government to classify workers into occupations to collect, calculate and disseminate data. Workers are classified into 840 detailed occupations and into 23 major groups.
Within these major groups, Production Occupations (SOC 51) required for the manufacturing
industry remains the strongest occupation sector in Rural Indiana. Closely associated with manufacturing is the movement of those goods to market and the Transportation and Material Moving Occupations (SOC 53) is projected to become the third largest occupation in the State by 2016. However, the declining number of Architecture and Engineering Occupations (SOC 17) are of some concern as these will be the professionals needed for the innovation of new processes and products to meet the shifting demands of a global marketplace.
Occupations within the health care and human service sectors including Healthcare Practitioners and Technical Occupations (SOC 29), Healthcare Support Occupations (SOC 31) and Personal Care and Service Occupations will experience some of the largest gains. Yet, the 2011 Indiana State Rural Health Plan reports that Indiana ranks 35th in overall primary care provider access and that access is even more limited in its rural communities. Efforts are underway to create connections between needed specialists
14
and rural communities by including rural rotation experience in clinical and matching professionals with certain cultural backgrounds with those of identified underserved areas.
Aligning skilled workers with the high growth industry sector jobs in Rural Indiana will need to occur
at the regional level. Certain high growth sectors have been identified by the State, but the concentration of these sectors differs from region to region. Collaboration between government, education, industry and labor should be encouraged at the regional level to identify high-growth sectors for that region to increase employment opportunities in these sectors and then to provide access to education and training that build the talent pipeline to these jobs.
Table 6: Indiana Rural Counties' Standard Occupational Codes
Total 794,316 797,582 751,378 813,093 870,423 76,107 10% $17.67
15
Indiana’s Economic Growth Region Perspective
In 2005, Indiana realigned counties into regions to
better formulate strategies for economic growth. Each of these Economic Growth Regions has a mix of urban and rural counties but they are not equal in geographical or population size or even their proportion of rural to urban. To gain perspective on the different regions, this section will compare Indiana’s 11 Economic Growth Regions with Indianapolis and Marion County included in Region 5.
Table 7 summarizes each region’s change in
population over time as a whole and for those counties currently defined as rural. Region 1 which is the northwestern counties of Jasper, Lake, La Porte, Newton, Porter, Pulaski and Starke as well as Region 5, Marion and the “donut” counties of Boone, Hamilton, Hancock, Hendricks, Johnson, Madison, and Morgan, have less than 10-percent of their total population in identified rural counties. Region 5’s rural counties will experience continued growth over the next decade and by 2021 all but Shelby County will be considered urban reducing the percentage of rural population within the Region to 2-percent. Region 1’s rural counties are smaller in population size and slower growth should maintain their rural nature for the foreseeable future. Other Economic Growth Regions will experience gradual declines in their total percentage of rural population due to stagnant population growth or declines within the rural counties and larger population gains among their urban areas.
Table 7 : Indiana Economic Growth Regions Change in Population
The following charts utilize the new Cluster Mapping Tool to identify the top 10 Traded Clusters for each of the State’s Economic Growth Regions (EGR) along with the estimated number of persons employed within those clusters for each of the regions. The Cluster Mapping Tool uses the 2007 6-digit NAICS codes to define the industries operating within those clusters3 . Developments in information services, new forms of health care provision, expansion of services, and high-tech manufacturing are just a few examples of industrial transformations that continue to amend the NAICS codes included within these clusters.
For EGR-1, the iron and steel mills of northwest Indiana provide the basis for the region’s top cluster
of Upstream Metal Manufacturing. Establishments in this cluster manufacture metal products such as pipes, tubes, metal closures, wires, springs and related products. While it is the region’s top traded cluster, Primary Metal Manufacturing (NAICS 331) has experienced a decline in most of its individual industry sectors during recent years.
Distribution and Electronic Commerce consists primarily of traditional wholesalers along with mail order houses and electronic merchants. The companies in this cluster will buy, hold and distribute a wide range of products including apparel, food, chemicals, minerals, machinery and other merchandise usually classified as Merchant Wholesalers of Durable and Non-Durable Goods (NAICS 423 and 424). The cluster also contains firms among the Commercial and Industrial Machinery and Equipment Rental and Leasing (NAICS 5324) that support distribution and electronic commerce operations such as packaging, labeling and equipment rental and leasing.
In the rural counties of EGR-1, the Transportation and Logistics Cluster, specifically General Freight
Trucking (NAICS 4841) is one of the highest growth industry sectors for the region. Also in these rural counties the Automotive Cluster, the manufacturing of parts, equipment and completed automobiles and trucks has a stronger presence than in the region as a whole.
3 Delgado, M., M.E. Porter, and S. Stern (2014), "Defining Clusters of Related Industries."
17
Economic Growth Region-2 includes 5 counties along the State’s northern border with Michigan including the urban counties of Elkhart and St. Joseph and the rural counties of Fulton, Kosciusko, and Marshall. Less than 25-percent of the Region’s population resides in the rural counties.
Known as the “RV Capital of the World”, Elkhart County’s high density of manufacturers in Travel
Trailer and Camper (NAICS 336214) and Motor Homes (NAICS 336213) raises the Trailers, Motor Homes, and Appliances Cluster to the top of the Traded Clusters for EGR-2. Warsaw in rural Kosciusko County has the distinction of being the “World’s Orthopedic Capital” with the manufacturing of Surgical Appliances and Supplies (NAICS 339113) as the top industry sector among the rural counties and the foundation for the prominence of the Medical Devices Cluster.
Led by the University of Notre Dame in South Bend (St. Joseph County), the many Colleges,
Universities, and Professional Schools (Private) (NAICS 611310) located within EGR-2 provide for a strong Education and Knowledge Creation Cluster. Colleges, Universities, and Professional Schools (State Government) (NAICS 903612) are also found within the area, but only private institutions are included in the Cluster’s definition.
18
Economic Growth Region-3 is one of the largest geographical regions including the 11 counties of Adams, Allen, De Kalb, Grant, Huntington, Lagrange, Noble, Steuben, Wabash, Wells and Whitley. Allen County is the lone urban county, but accounts for nearly 50-percent of the population within the northeastern region that borders both Michigan and Ohio.
The Business Services Cluster is made up of firms that provide services to support other aspects of a
business or to assist unrelated companies. This includes EGR-3’s growing industry sector of Corporate, Subsidiary, and Regional Managing Offices (NAICS 551114). Professional services found within the aggregated NAICS codes 53-56 such as consulting, legal services, facilities support services, computer services, engineering and architectural services, and placement services are also included within the cluster.
The Production Technology and Heavy Machinery Cluster primarily manufactures machines (NAICS
333) designed to produce parts and devices used in the production of downstream products. This cluster also includes end use heavy machinery such as air and material handling equipment. Machines manufactured are used for industrial, agricultural, construction, commercial industries and other related purposes.
Economic Growth Region-4 in the northwest quadrant of the State is another large geographical
region with 10 rural counties including Benton, Carroll, Cass, Clinton, Fountain, Miami, Montgomery, Tipton, Warren and White and 2 urban counties of Clark and Tippecanoe. EGR-4’s economy includes two top clusters stereotypically associated with rural commerce, Livestock Processing and Food Processing and Manufacturing. Livestock Processing is the processing of meat from livestock and the wholesaling of those meats. For EGR-4 processing is concentrated in Animal (except Poultry) Slaughtering (NAICS 311611) and Meat Processed from Carcasses (NAICS 311612).
The Food Processing and Manufacturing Cluster handles raw food materials and the manufacturing
of downstream food products for end users. This includes millers and refineries of rice, flour, corn, sugar, and oilseeds. These upstream products contribute in part to producing specialty foods, animal foods, baked goods, candies, teas, coffees, beers, wines, other beverages, meats, packaged fruits and vegetables and processed dairy products. For EGR-4 industries like Wet Corn Milling (NAICS 311221)
19
and Other Snack Food Manufacturing (NAICS 311919) have Location Quotients more than 20 times that of the National LQ.
Most of the traded clusters defined by the Cluster Mapping Tool have a manufacturing component.
However, eight of the top ten traded clusters for the predominantly urban area of EGR-5 are service oriented industries. At the start of the 21st Century, Manufacturing (NAICS 31) made up approximately 14-percent of the jobs in the area surrounding the state capitol of Indianapolis. Since then, Manufacturing has lost nearly 30-percent of its jobs to now represent less than 10-percent of all jobs. Employers in the Administrative and Support and Waste Management and Remediation (NAICS 56), Transportation and Warehousing (NAICS 48), Professional, Scientific and Technical Services (NAICS 54) and Private Educational Services (NAICS 61) have replaced manufacturing jobs with service industry jobs which now drive the Region’s economy.
20
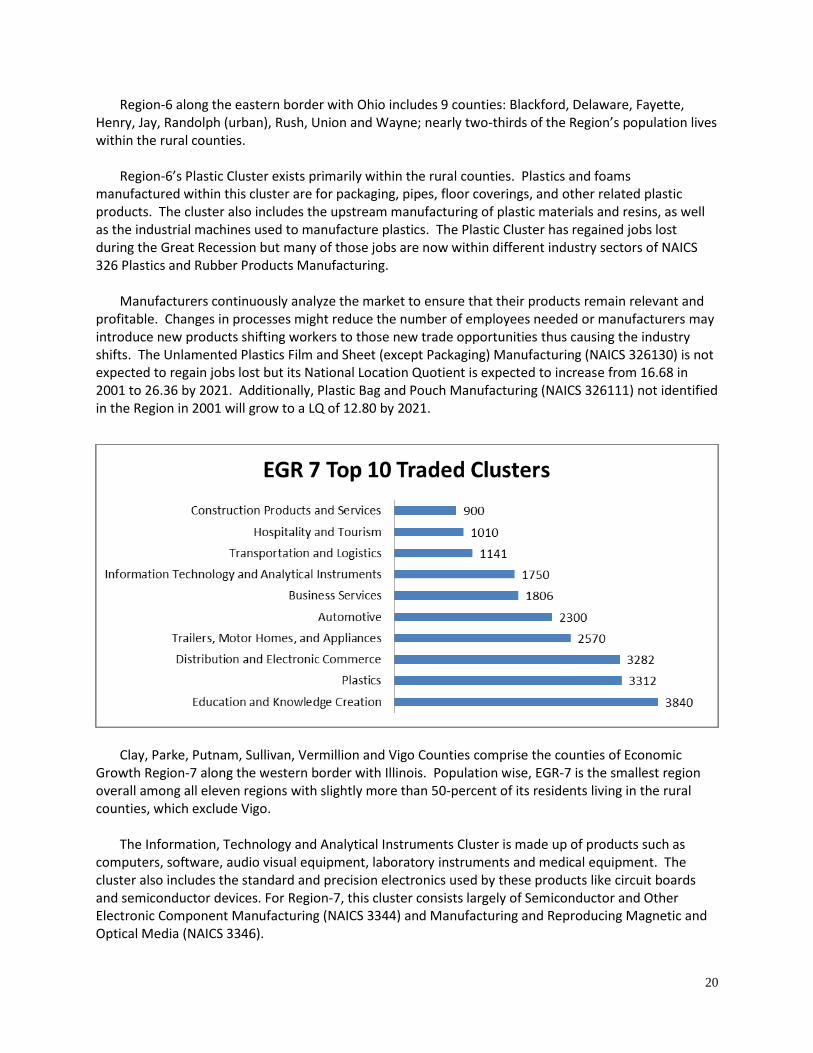
Region-6 along the eastern border with Ohio includes 9 counties: Blackford, Delaware, Fayette, Henry, Jay, Randolph (urban), Rush, Union and Wayne; nearly two-thirds of the Region’s population lives within the rural counties.
Region-6’s Plastic Cluster exists primarily within the rural counties. Plastics and foams
manufactured within this cluster are for packaging, pipes, floor coverings, and other related plastic products. The cluster also includes the upstream manufacturing of plastic materials and resins, as well as the industrial machines used to manufacture plastics. The Plastic Cluster has regained jobs lost during the Great Recession but many of those jobs are now within different industry sectors of NAICS 326 Plastics and Rubber Products Manufacturing.
Manufacturers continuously analyze the market to ensure that their products remain relevant and
profitable. Changes in processes might reduce the number of employees needed or manufacturers may introduce new products shifting workers to those new trade opportunities thus causing the industry shifts. The Unlamented Plastics Film and Sheet (except Packaging) Manufacturing (NAICS 326130) is not expected to regain jobs lost but its National Location Quotient is expected to increase from 16.68 in 2001 to 26.36 by 2021. Additionally, Plastic Bag and Pouch Manufacturing (NAICS 326111) not identified in the Region in 2001 will grow to a LQ of 12.80 by 2021.
Clay, Parke, Putnam, Sullivan, Vermillion and Vigo Counties comprise the counties of Economic
Growth Region-7 along the western border with Illinois. Population wise, EGR-7 is the smallest region overall among all eleven regions with slightly more than 50-percent of its residents living in the rural counties, which exclude Vigo.
The Information, Technology and Analytical Instruments Cluster is made up of products such as
computers, software, audio visual equipment, laboratory instruments and medical equipment. The cluster also includes the standard and precision electronics used by these products like circuit boards and semiconductor devices. For Region-7, this cluster consists largely of Semiconductor and Other Electronic Component Manufacturing (NAICS 3344) and Manufacturing and Reproducing Magnetic and Optical Media (NAICS 3346).
21
The Construction Products and Services Cluster supplies construction materials, components, products and services. Construction materials and components include those made of sand, stone, gravel, asphalt, cement, concrete, and other earthen substances. Products include pipes and heat exchangers with services including the construction of pipelines for water, sewers, oil and gas, power, and communication. For EGR-7 Power and Communication Line and Related Structures Construction (NAICS 237130), Cement Manufacturing (NAICS 327310) and Metal Tank (Heavy Gauge) Manufacturing (NAICS 332420) are growing industries within the cluster.
Economic Growth Region-8 just south of the State’s Capital includes Brown, Daviess, Greene,
Lawrence, Martin, Monroe, Orange and Owen Counties. Monroe County is considered urban with the other 7 counties recognized as rural. Next to EGR-5, which will lose rural population to become urban, EGR-7 will see the largest drop proportionately in rural residents from 2001 to 2021 as people migrate away from the rural communities.
Firms included in the Biopharmaceuticals Cluster for EGR-8 produce complex chemical and biological
substances used in medications, vaccines, diagnostic tests, and similar medical applications. There are only four industry sectors within this highly specialized cluster with Pharmaceutical Preparation Manufacturing (NAICS 325412) creating the basis for this cluster within the Region.
Region-8 is also the home of the Naval Surface Warfare Center Crane Division4, the third largest
naval installation in the world employing more than 3,300 people. The focus of NSWC Crane is harnessing the power of technology for the Warfighter. It specializes in total lifecycle support in three focus areas: Special Missions; Strategic Missions and Electronic Warfare. In its mission of providing acquisition engineering, in-service engineering and technical support for sensors, electronics, electronic warfare and special warfare weapons, Crane and the surrounding rural area have attracted several private military defense companies and the Engineering Services (NAICS 541330) that support the defense industry.
Economic Growth Region-9 has the largest percentage of persons living in rural counties with more than 75-percent of its population in Dearborn, Decatur, Franklin, Jackson, Jefferson, Jennings, Ohio, Ripley and Switzerland counties and less than 25-percent in urban Bartholomew County.
Although identified as four separate clusters, Automotive, Metalworking Technology, Production Technology and Heavy Machinery and Upstream Metal Manufacturing are primarily defined by industries within the aggregated NAICS codes of 331 Primary Metal Manufacturing, 332 Fabricated Metal Product Manufacturing, and 336 Transportation Equipment Manufacturing. These four clusters demonstrate that clusters themselves do not operate independently from each other. The completed automobile depends on the upstream production of metals and the technology needed to produce that metal as well as the Transportation and Logistics Cluster to safely and efficiently transport the products to the next user of the material before it reaches the final consumer.
Located along the Ohio River and bordering Kentucky near Louisville, Economic Growth Region-10
consists of urban Clark County and rural Crawford, Floyd, Harrison, Scott and Washington Counties.
23
The Water Transportation Cluster, the transporting of people and goods over water along with the
support services to that activity, is in large part due to the Port of Indiana – Jeffersonville. Indiana has the only statewide port system in the nation and provides for international connections for the America’s Heartland via the Great Lakes and Ohio-Mississippi river systems via the Ports of Indiana5 and its three harbors at Burns Harbor, Mount Vernon and Jeffersonville. In 2001, EGR-10’s Location Quotient for Inland Water Freight Transportation (NAICS 483211)was 154.30 while it is expected to drop considerably by 2021 it will remain high at 53.41.
The Hospitality and Tourism Cluster contains many of the establishments within the Arts,
Entertainment, and Recreation (NAICS 71) industry sectors including sport venues, casinos, museums, and other attractions along with hotels and other accommodations and professional services related to recreational travel such as reservation services and tour operators.
Region-10 also has a strong Wood Products Cluster which makes upstream wood materials including
establishments such as sawmills, plywood and hardwood manufacturers, cut stock manufacturers, and wood preservation services. Downstream establishments in the Wood Products Cluster include manufacturers of windows, doors, flooring, wood containers, prefabricated wood buildings and related products identified under NAICS 321 Wood Product Manufacturing.
The nine counties of south west Indiana that comprise Economic Growth Region-11 include Dubois,
Gibson, Knox, Perry, Pike, Posey, Spencer, Vanderburgh and Warrick. Development along its eastern border and overflow from the urban county of Vanderburgh has created a population boom in recent years for adjacent and predominantly rural Warrick County changing its definition to an urban county.
Within EGR-11, the Furniture Cluster, the manufacturing of furniture, cabinets, and shelving of
wood, metal, plastic and textiles for residential homes and offices, has lost a number of jobs in its Furniture and Related Product Manufacturing (NAICS 337) industry sectors since entering this 21st Century, but the location quotients for most of these industries are expected to remain strong and increase to double digits into 2021.
5Ports of Indiana website - http://www.portsofindiana.com
The review of Traded Clusters for each of the Economic Growth Regions is cursory and each region should more closely examine how each of the identified clusters within their region are growing and changing to meet global market needs and also to determine if the physical infrastructure and human capital within the region are sufficiently evolving to sustain cluster growth.
It should be noted that declining population growth especially in the rural areas is not expected to
provide an adequate labor force to support projected industry growth in many of the regions. This leaves rural counties vulnerable as anchor establishments within these Traded Clusters may decide to relocate to another region that can provide the competitive advantage necessary to sustain profitability. Statewide efforts are underway to better engage partners in matching employer needs with a workforce that has both the technical and soft skills required in a knowledge-based economy. It will be up to regional workforce boards, community leaders, businesses and educational institutions to tailor solutions for the attraction and development of human capital in each of the individual Economic Growth Regions.