1 Rural Infrastructure and Agricultural Development Per Pinstrup-Andersen The H.E. Babcock Professor of Food, Nutrition and Public Policy Cornell University And Satoru Shimokawa Ph.D. Candidate, Applied Economics and Management Cornell University Paper prepared for presentation at the Annual Bank Conference on Development Economics, Tokyo, Japan, May 29-30, 2006
Transcript
1
Rural Infrastructure and Agricultural Development
Per Pinstrup-Andersen The H.E. Babcock Professor of Food, Nutrition and Public Policy
Cornell University
And
Satoru Shimokawa Ph.D. Candidate, Applied Economics and Management
Cornell University
Paper prepared for presentation at the Annual Bank Conference on Development Economics,
Tokyo, Japan, May 29-30, 2006
2
Abstract Agricultural development is essential for economic growth, rural development, and poverty
alleviation in low-income developing countries. Productivity increase in agriculture is an effective
driver of economic growth and poverty reduction both within and outside agricultural sectors. Such
productivity increase depends on good rural infrastructure, well functioning domestic markets,
appropriate institutions, and access to appropriate technology. While the state of rural infrastructure
varies widely among developing countries, most lower-income developing countries suffer severe
rural infrastructure deficiencies. Deficiencies in transportation, energy, telecommunication, and
related infrastructure translate into poorly functioning domestic markets with little spatial and
temporal integration, low price transmission, and weak international competitiveness.
In spite of the well documented importance of rural infrastructure to promote growth and
poverty alleviation, high economic rates of return to investments in rural infrastructure, and
significant deficiencies of rural infrastructure in most developing countries, neither national
governments nor international aid agencies seem to prioritize investments in the construction of new
infrastructure and maintenance of existing infrastructure. Much of the required investment is of a
public goods nature and thus most of the infrastructure investments must come from public sources,
while public-private partnership should be pursued when appropriate. Failure to accelerate
investments in rural infrastructure will make a mockery of efforts to achieve the Millennium
Development Goals in poor developing countries while at the same time severely limit opportunities
for these countries to benefit from trade liberalization, international capital markets, and other
potential benefits offered by globalization.
3
Agricultural Development is Essential for Economic Growth, Rural Development, and
Poverty Alleviation
Agriculture constitutes the core of the economy of most low-income developing countries. In
heavily indebted poor countries, the agricultural sector generated 33 percent of the Gross Domestic
Product (GDP) and 52 percent of total merchandise exports in 2002. The agricultural sector
accounted for about 60 percent of employment in low-income countries in 1995. Even in East Asia
and the Pacific—which have experienced rapid economic growth—the agricultural sector accounted
for 46 percent of employment, generated 16 percent of GDP, and was responsible for 10 percent of
total merchandise exports in 2000.1 Such economic dominance of agriculture demonstrates the
importance of agricultural development for economic growth and poverty alleviation in developing
countries. Moreover, although the relative contribution of agriculture to the overall economic
growth decreases as an economy develops, agricultural development provides a crucial foundation
for economic growth in both agricultural and non-agricultural sectors. Virtually every high- and
middle-income country, with the exception of city nations such as Singapore and Dubai, has gone
through a period of development when agricultural growth was essential to foster general economic
growth and poverty alleviation. On the other hand, low-income countries with a stagnant agriculture
usually have a stagnant economy. Moreover, endeavors to jump directly to modern industrialization
without paying enough attention to agricultural development in the early stages of development
have tended to result in a failure in economic growth and poverty alleviation (Gulati, Fan and Dalafi
2005; Rottso and Torvik 2003).
Agriculture as the Driver of Economic Growth
Although early development literature considered the role of agriculture in economic
development to be a supportive one for industrial sectors such as ensuring a supply of cheap food
for workers in industrial sectors (see, for example, Lewis 1954), a more active role of agriculture as 1 Data from World Development Indicators (World Bank 2005) for several years.
4
the driving force of overall economic growth has been recognized and emphasized since the 1960s
(see, for example, Mellor 1966; Schultz 1964; Johnston and Mellor 1961). A large share of
subsistence and semi-subsistence agriculture has been transformed through the adoption of new
technology, investments in rural infrastructure and markets, and the design and implementation of
appropriate policies. This transformation leads to an increase in productivity of land and labor and
results in increasing incomes for farmers and farm workers and enhanced purchasing power for
consumers. Low food prices achieved by reduced unit-costs of production contribute to lower
wages in non-agricultural sectors and thus facilitate industrial growth. Furthermore, agricultural
growth contributes to economic activity in input, processing, distribution, and storage industries,
a rise in demand for goods and services produced in other sectors (Hazell and Röell 1983).
A number of empirical studies (e.g., Hazell and Röell 1983; Haggblade, Hammer and Hazell
1991; Delgado and others 1998; Fan, Hazell and Thorat 2000; and Fan, Zhang and Zhang 2002)
conclude that the multiplier effects of agricultural growth is usually greater than two. The size of the
multiplier effects varies spatially and over time, reflecting differences in consumption, investment,
and saving patterns. In general, “the multiplier effects tend to be high when agricultural growth is
driven by broad-based productivity increases in a rural economy dominated by small farms, as in
much of Asia (Mellor 1976). Small- to medium-sized farm households typically have more favorable
expenditure patterns for promoting growth of the local nonfarm economy, including rural towns,
since they spend higher shares of income on rural nontraded goods and services, which are also
generally more labor intensive” (Hazell and Röell 1983).
In a study of four African countries, Delgado and others (1998) estimated the income
multipliers to be around 2.5, meaning that each additional dollar of income from agriculture
generates about $2.50 of economic growth in the economy as a whole. In the more open economies
of Asia, where rice was more tradable than most African staple foods and local prices more easily
5
reflected border prices, the multiplier effects were close to 2 in the early stages of agricultural
modernization when productivity gains were the fastest. In addition, Gollin, Parente, and Rogerson
(2002), using data for 62 developing countries during 1960-1990, find that agricultural growth, non-
agricultural growth, and sectoral labor shifts explain 54 %, 17 %, and 29 % of the growth of GDP
per worker, respectively.
Agricultural Development and Pro-poor Growth
Agricultural development has a significant potential to contribute to nation-wide poverty
reduction through direct effects on farm incomes and employment and indirect effects on overall
economic growth, as well as its impact on food prices. A number of studies have found a positive
correlation between agricultural growth and poverty alleviation (see Byerlee, Diao, and Jackson
2005 for a more detailed review). It is empirically shown that poor people tend to benefit more from
economic growth originating in agricultural sectors than from that originating in industrial or
service sectors (Ravallion and Datt 1996; Ravallion and Chen 2004; and Timmer 2002, 2005). In
addition, Ravallion and Datt (1996), using data for India over 1951-1990, show that rural growth
through agricultural development reduces poverty not only in rural areas but also in urban areas and
hence has a significant and positive effect on national poverty reduction.
Several studies have found that the elasticity of poverty reduction with respect to agricultural
productivity is significant, positive and higher than the elasticity with respect to other sectors’
productivity, especially in the early stages of development. For example, Thirtle, Lin, and Piesse
(2003) estimate the elasticity of the reduction in the number of people living on less than $1 per day
with respect to agricultural productivity growth using data from 59 countries over 1985-1995.
According to their estimates, the elasticity was 0.72 and 0.48 (73% and 67% of the total impact of
increases in per capita GDP) in Africa and Asia, respectively. Datt and Ravallion (1998) estimated
the elasticity of the reduction in three FGT-type poverty indicators (Headcount (HC), Poverty Gap
(PG), and Squared Poverty Gap (SPG)) with respect to agricultural value added per hectare using
6
state-level data in India during 1957-91. The elasticity for HC, PG and SPG was 0.38, 0.55, and
0.70, respectively.
On the other hand, an increasing number of studies has questioned the effect of agricultural
growth on poverty reduction following several failures of earlier investments in agriculture-led
development, increased recognition of the importance of non-farm activities in rural livelihoods,
and increased difficulties in the global environment for sustaining pro-poor agricultural growth (e.g.,
decreasing agricultural prices, trade liberalization, and the spread of HIV/AIDS) (Dorward and
others 2004a). Despite the significant potential contribution of agricultural growth to overall
economic development through its direct and multiplier effects, a combination of market failures
and poor policy environments in many developing countries has lead to failures of agriculture-led
development. Moreover, a failure to liberalize agricultural trade and the continuation of domestic
agricultural subsidies in the OECD countries results in low world market prices of agricultural
commodities and thus makes agriculture less profitable for developing countries, causing reduced
private and public investments in agriculture. Thus, the question is not whether agricultural growth
is essential to generate rapid economic growth and poverty alleviation in poor countries, but
whether these countries and the international policy and trade environment surrounding them create
the enabling environment, including trade liberalization, appropriate economic policies, investments
in research and technology, and the building of the necessary rural infrastructure and well-
functioning domestic markets.
In fact, there are few, if any, other candidates with the same potential for supporting broad-
based pro-poor growth, and thus agriculture remains a critical element in efforts to promote broad-
based economic growth and poverty alleviation despite the policy failures mentioned above. For a
successful agricultural development and transition, some recent studies (Diao and others 2006;
Dorward and others 2004a, b; and Kydd and others 2004) emphasize the importance of institutional
7
development (both the institutional environment and arrangement2) to overcome these difficulties.
Thus, key functions of governments and of other actors promoting development (e.g. the World
Bank) are then to support institutional development and rural infrastructure that will reduce
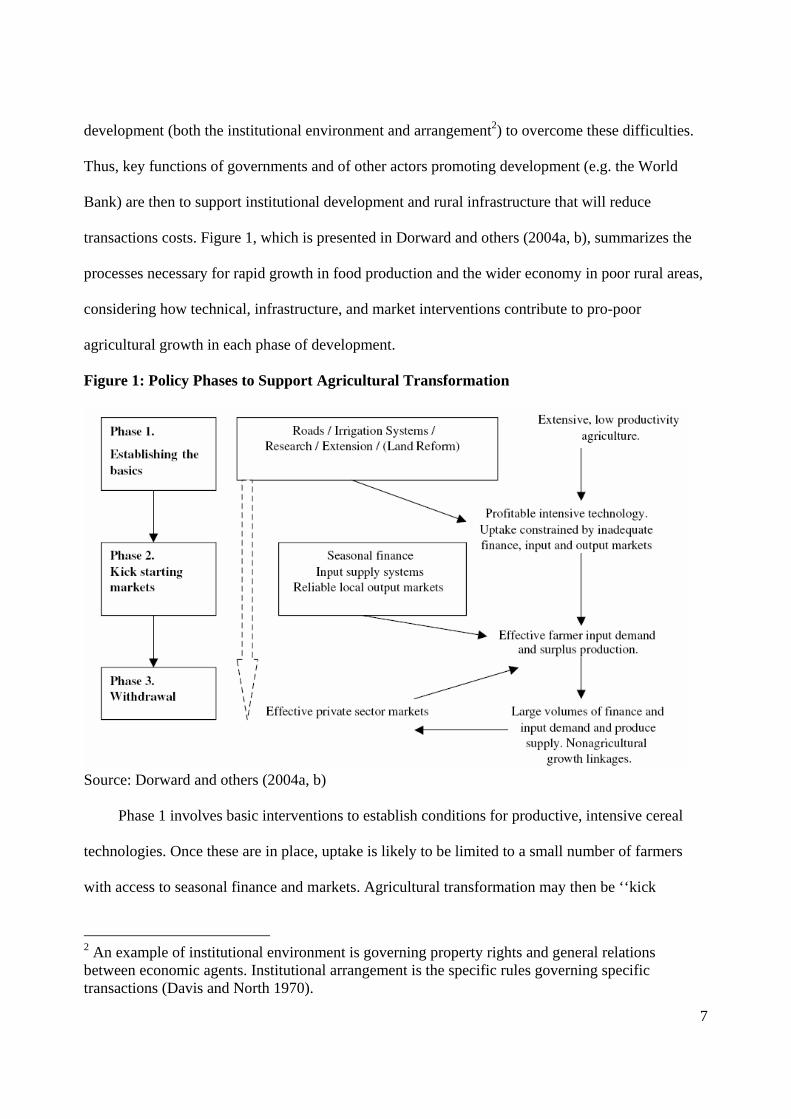
transactions costs. Figure 1, which is presented in Dorward and others (2004a, b), summarizes the
processes necessary for rapid growth in food production and the wider economy in poor rural areas,
considering how technical, infrastructure, and market interventions contribute to pro-poor
agricultural growth in each phase of development.
Figure 1: Policy Phases to Support Agricultural Transformation
Source: Dorward and others (2004a, b)
Phase 1 involves basic interventions to establish conditions for productive, intensive cereal
technologies. Once these are in place, uptake is likely to be limited to a small number of farmers
with access to seasonal finance and markets. Agricultural transformation may then be ‘‘kick
2 An example of institutional environment is governing property rights and general relations between economic agents. Institutional arrangement is the specific rules governing specific transactions (Davis and North 1970).
8
started’’ by government interventions (in phase 2) to enable farmers to access seasonal finance and
seasonal input and output markets at low cost and low risk. Subsidies are required primarily to
cover transactions costs, not to adjust basic prices. Once farmers become familiar with the new
technologies, their demand for credit and input and their supply of output will build up and
transactions costs per unit will fall. At the same time, such farm activity positively influences
volumes of non-farm activity through its linkages, which contributes to a further reduction in
transactions costs. Governments can then withdraw from these market activities and let private
sectors take over (phase 3), transferring attention to supporting conditions that will promote
development of the non-farm rural economy (Dorward and others 2004a, b).
In the following sections, we present more details about the effects of infrastructure on growth
in agricultural output and productivity and the supportive effects for institutional development
which significantly contribute to successful agricultural development and poverty alleviation in
low-income developing countries. Moreover, we argue that improving rural infrastructure in these
countries is essential to more fully integrate the poor into globalization.
Infrastructure is Essential for Agricultural Development
The importance of good infrastructure for agricultural development is widely recognized. In
this section, we examine how physical infrastructure contributes to agricultural development in
developing countries. In one of the technical background documents for the World Food Summit,
held 10 years ago, it is concluded that “Roads, electricity supplies, telecommunications, and other
infrastructure services are limited in all rural areas, although they are of key importance to
stimulate agricultural investment and growth” (Food and Agriculture Organization of the United
Nations (FAO) 1996, chapter 10, p.15). The document further argues that “Better communications
are a key requirement. They reduce transportation cost, increase competition, reduce marketing
margins, and in this way can directly improve farm incomes and private investment opportunities”
(ibid). These conclusions are supported by several studies of infrastructure in developing countries
9
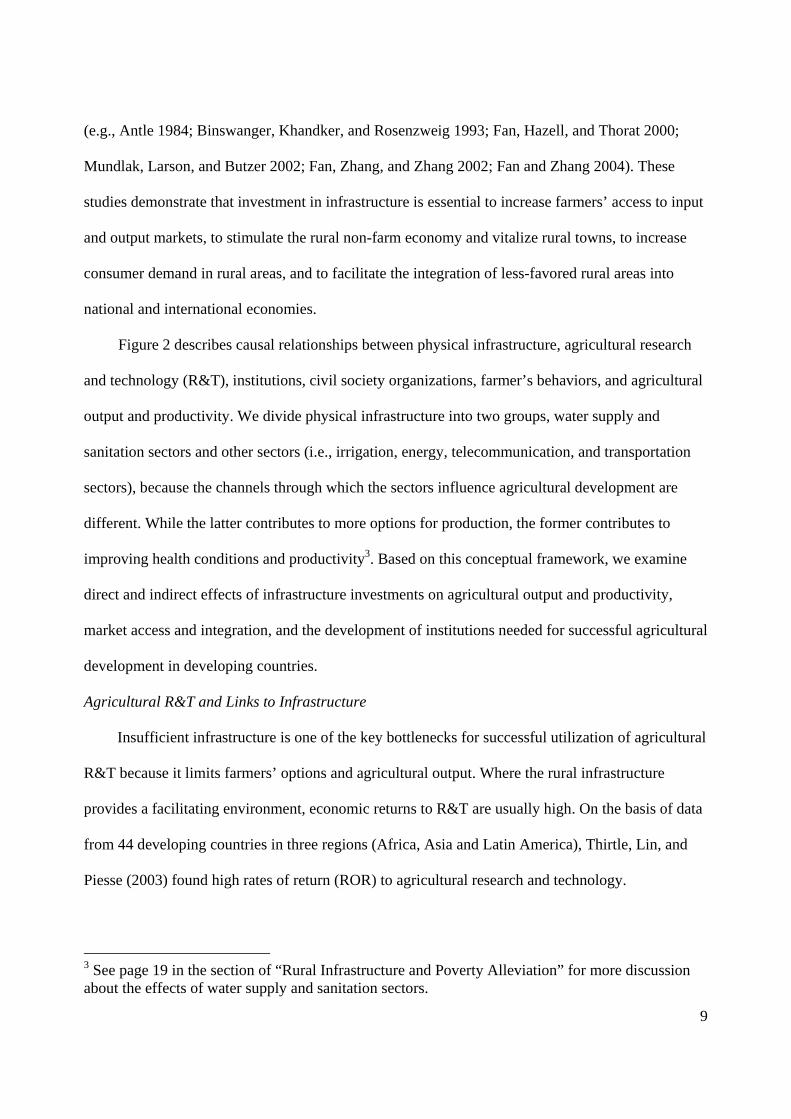
(e.g., Antle 1984; Binswanger, Khandker, and Rosenzweig 1993; Fan, Hazell, and Thorat 2000;
Mundlak, Larson, and Butzer 2002; Fan, Zhang, and Zhang 2002; Fan and Zhang 2004). These
studies demonstrate that investment in infrastructure is essential to increase farmers’ access to input
and output markets, to stimulate the rural non-farm economy and vitalize rural towns, to increase
consumer demand in rural areas, and to facilitate the integration of less-favored rural areas into
national and international economies.
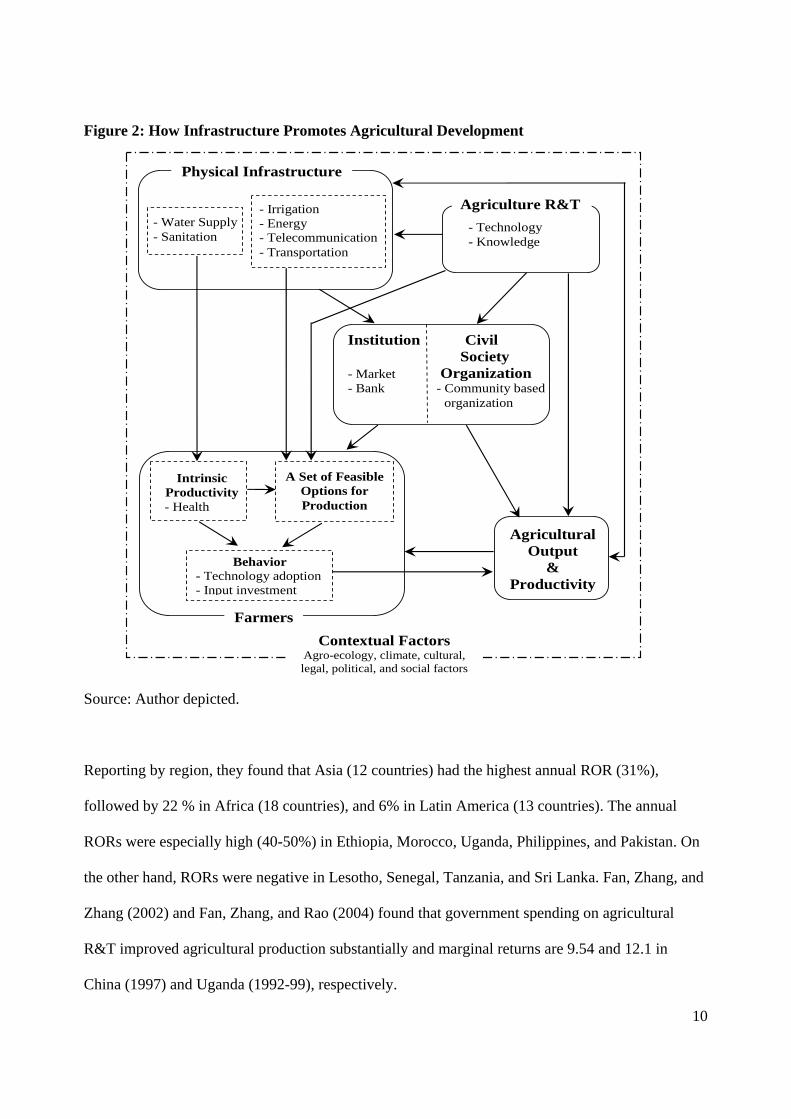
Figure 2 describes causal relationships between physical infrastructure, agricultural research
and technology (R&T), institutions, civil society organizations, farmer’s behaviors, and agricultural
output and productivity. We divide physical infrastructure into two groups, water supply and
sanitation sectors and other sectors (i.e., irrigation, energy, telecommunication, and transportation
sectors), because the channels through which the sectors influence agricultural development are
different. While the latter contributes to more options for production, the former contributes to
improving health conditions and productivity3. Based on this conceptual framework, we examine
direct and indirect effects of infrastructure investments on agricultural output and productivity,
market access and integration, and the development of institutions needed for successful agricultural
development in developing countries.
Agricultural R&T and Links to Infrastructure
Insufficient infrastructure is one of the key bottlenecks for successful utilization of agricultural
R&T because it limits farmers’ options and agricultural output. Where the rural infrastructure
provides a facilitating environment, economic returns to R&T are usually high. On the basis of data
from 44 developing countries in three regions (Africa, Asia and Latin America), Thirtle, Lin, and
Piesse (2003) found high rates of return (ROR) to agricultural research and technology.
3 See page 19 in the section of “Rural Infrastructure and Poverty Alleviation” for more discussion about the effects of water supply and sanitation sectors.
10
Figure 2: How Infrastructure Promotes Agricultural Development
A Set of Feasible Options for Production
Intrinsic Productivity
- Health
- Irrigation - Energy - Telecommunication - Transportation
- Water Supply - Sanitation
Behavior - Technology adoption - Input investment
Agricultural Output
& Productivity
Institution Civil Society - Market Organization - Bank - Community based organization
- Technology - Knowledge
Agriculture R&T
Farmers Contextual Factors
Agro-ecology, climate, cultural, legal, political, and social factors
Physical Infrastructure
Source: Author depicted.
Reporting by region, they found that Asia (12 countries) had the highest annual ROR (31%),
followed by 22 % in Africa (18 countries), and 6% in Latin America (13 countries). The annual
RORs were especially high (40-50%) in Ethiopia, Morocco, Uganda, Philippines, and Pakistan. On
the other hand, RORs were negative in Lesotho, Senegal, Tanzania, and Sri Lanka. Fan, Zhang, and
Zhang (2002) and Fan, Zhang, and Rao (2004) found that government spending on agricultural
R&T improved agricultural production substantially and marginal returns are 9.54 and 12.1 in
China (1997) and Uganda (1992-99), respectively.
11
Several econometrics studies have estimated the effects of infrastructure investment on
agricultural output and productivity. Most of these studies find a positive and significant effect (see,
for example, Antle 1984; Binswanger, Khandker, and Rosenzweig 1993; Mundlak, Larson, and
Butzer 2002; and Fan and Zhang 2004). A key concern in these studies is how to control reverse
causality from agricultural growth to infrastructure investments to obtain a consistent estimate of
the causal effect of infrastructure on agricultural growth. 4 One of the most used methods to control
the reverse causality is to take the difference between two time periods similar to the fixed effects
model. However, the use of such a method can destroy any long-term relationship in the data,
leaving only short-term impacts to be captured in the model. This causes underestimation of the
effects of infrastructure (Fan and Zhang 2004 and Munnel 1992).
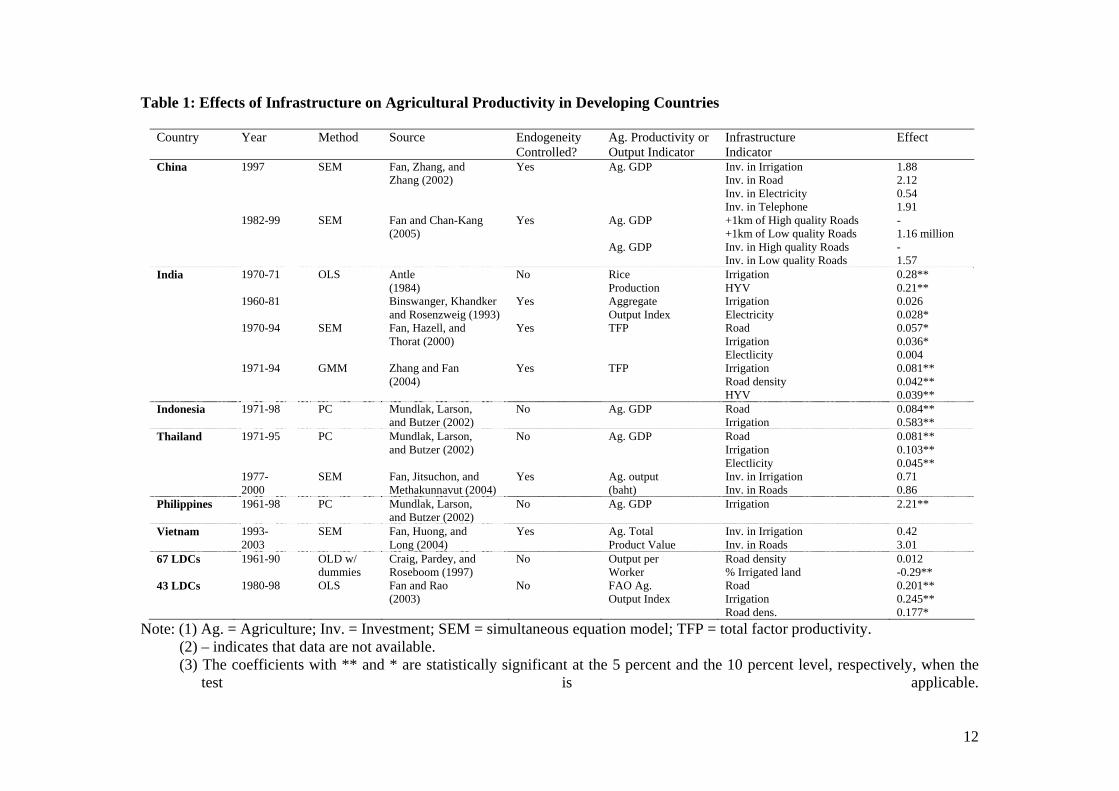
Table 1 summarizes the estimation methods and results from selected studies. Although some
results in Table 1 are not directly comparable because measurements of output and infrastructure
investments are different, the results from Mundlak, Larson, and Butzer (2002) show that the
magnitude of the effects of infrastructure varies across countries (i.e., between Thailand, Indonesia,
and Philippines). Also, when the endogeneity of infrastructure investment is controlled, the effects
of infrastructure tend to be smaller than when it is not controlled.
4 Tatom (1993) and Fan and Zhang (2004) find a two-way impact productivity and infrastructure capital. Holts-Eakin and Schwartz (1994) find a one way impact of infrastructure on productivity growth.
12
Table 1: Effects of Infrastructure on Agricultural Productivity in Developing Countries
Country Year Method Source Endogeneity Controlled?
Ag. Productivity or Output Indicator
Infrastructure Indicator
Effect
China 1997 SEM Fan, Zhang, and Yes Ag. GDP Inv. in Irrigation 1.88 Zhang (2002) Inv. in Road 2.12 Inv. in Electricity 0.54 Inv. in Telephone 1.91 1982-99 SEM Fan and Chan-Kang Yes Ag. GDP +1km of High quality Roads - (2005) +1km of Low quality Roads 1.16 million Ag. GDP Inv. in High quality Roads - Inv. in Low quality Roads 1.57 India 1970-71 OLS Antle No Rice Irrigation 0.28** (1984) Production HYV 0.21** 1960-81 Binswanger, Khandker Yes Aggregate Irrigation 0.026 and Rosenzweig (1993) Output Index Electricity 0.028* 1970-94 SEM Fan, Hazell, and Yes TFP Road 0.057* Thorat (2000) Irrigation 0.036* Electlicity 0.004 1971-94 GMM Zhang and Fan Yes TFP Irrigation 0.081** (2004) Road density 0.042** HYV 0.039** Indonesia 1971-98 PC Mundlak, Larson, No Ag. GDP Road 0.084** and Butzer (2002) Irrigation 0.583** Thailand 1971-95 PC Mundlak, Larson, No Ag. GDP Road 0.081** and Butzer (2002) Irrigation 0.103** Electlicity 0.045** 1977- SEM Fan, Jitsuchon, and Yes Ag. output Inv. in Irrigation 0.71 2000 Methakunnavut (2004) (baht) Inv. in Roads 0.86 Philippines 1961-98 PC Mundlak, Larson, No Ag. GDP Irrigation 2.21** and Butzer (2002) Vietnam 1993- SEM Fan, Huong, and Yes Ag. Total Inv. in Irrigation 0.42 2003 Long (2004) Product Value Inv. in Roads 3.01 67 LDCs 1961-90 OLD w/ Craig, Pardey, and No Output per Road density 0.012 dummies Roseboom (1997) Worker % Irrigated land -0.29** 43 LDCs 1980-98 OLS Fan and Rao No FAO Ag. Road 0.201** (2003) Output Index Irrigation 0.245** Road dens. 0.177*
Note: (1) Ag. = Agriculture; Inv. = Investment; SEM = simultaneous equation model; TFP = total factor productivity. (2) – indicates that data are not available. (3) The coefficients with ** and * are statistically significant at the 5 percent and the 10 percent level, respectively, when the
test is applicable.
13
Fan and Zhang (2004) present one of the most careful econometric analyses done on the
subject. They control for the reverse causality problem employing a dynamic GMM method.
According to their estimates, investments in roads and irrigation significantly contribute to
agricultural growth. At the same time, agricultural growth induces a much larger demand effect
on irrigation than on roads. This may be because irrigation is sector-specific infrastructure and
thus, its demand is more directly influenced by agricultural growth while the demand on roads
depends on several other factors besides agricultural growth (Fan and Zhang 2004). Fan, Hazell,
and Thorat (2000) also find that public investment in rural roads has a large positive impact on
agricultural productivity growth in India. In addition, road investments significantly contribute to
agricultural growth as well as growth in the non-farm sector and the national economy (Fan,
Zhang, and Zhang 2002 and Fan and Chan-Kang 2005).
The quality of infrastructure is an important determinant of the effects of infrastructure on
agricultural growth and poverty reduction (Fan and Chan-Kang 2005). Because Fan and Chan-
Kang (2005) do not present the returns to agricultural GDP of investment in low-quality roads
(Table 1), we examine the returns to total GDP to compare the effects of the quality of roads (see
Table 4 for the returns in total GDP). When measured by kilometer of new road, they found that
investment in high-quality roads in China have close to 50% higher returns to total GDP than
investments in low-quality roads. However, investments in low-quality roads have the largest
returns in total GDP (41.5% higher) in rural areas, while the effects of high-quality roads were
almost twice as high as those of low-quality roads in urban areas. In addition, once we examine
the effects in money metric (i.e., taking the cost of construction into account), high-quality roads
have lower returns per yuan than low-quality roads in all areas and regions. In other words, the
14
economic rate of return per yuan was estimated to be higher for low-quality roads than for high-
quality ones.
Agricultural Input and Output Markets and Links to Infrastructure
Market integration over space and time requires good infrastructure and effective market
institutions. Where spatial market integration is poor, favorable local growing conditions,
improved production practices, or adoption of modern technologies that result in increasing
marketable surpluses may result in drastic drops in local prices, while other areas may suffer
from deficits and rapidly increasing prices. Such large spatial price differences and abrupt inter-
temporal price changes are common in low-income countries with poor infrastructure and/or
poorly functioning markets. For example, maize prices in Ethiopia tripled from 1997-98 to 1999-
00 followed by an 80 % drop from 1999-2000 to 2000-2001. In Malawi, the price of maize
quadrupled between April 2001 and April 2002 (Pinstrup-Andersen 2002).
The supply response by small farmers is also seriously affected by the state of
infrastructure and market. Chhibber (1988) found that a one percent increase in output prices
would result in a supply response of 0.3-0.5 percent in areas with poor infrastructure and 0.7-0.9
in areas with good infrastructure. The farmers’ willingness to adopt productivity-enhancing
technology depends very significantly on the infrastructure and market situation with which they
are faced.
In most low-income developing countries, market integration is limited by poor transport,
storage and communication infrastructure, lack of effective competition among market agents,
limited rule of law, and restricted access to commercial finance. The price transmission may be
low and price changes in urban or world market are not fully transmitted to producers and traders.
Worse still, without effective competition, economic agents with larger market power may
15
exercise control over pricing strategies that result in a slow and incomplete pass-through of price
increases and a fast and complete transmission of price decreases.
While privatizing agricultural marketing has benefited farmers and/or consumers in many
countries, it is important to recognize the role of the state in facilitating private transactions. A
number of public interventions such as standardization, grading, enforcement of contracts and
regulations to pursue effective competition are needed to make the private markets work.
Other Institutions Needed and Links to Infrastructure
Besides the facilitation of access to output and input markets, financial institutions are also
needed to provide access to credit and savings for farmers. Microcredit schemes have been
successful in providing access to small amounts of credit for the rural poor mostly in Asia.
However, the credit market for smallholders—notably in Sub-Saharan Africa—is functioning
very poorly and credit constraints are a major reason why smallholders fail to increase
productivity and choose more profitable production strategies. For example, credit constrains
negatively influence plot size (Hazarika and Alwang 2003), fertilizer use (Croppenstedt, Demeke,
and Meschi 2003), and total productivity (Freeman, Ehui, and Jabbar 1998).
To create the enabling environment for a well-functioning capital market in rural areas,
public investment in infrastructure is needed. However, publicly-financed or managed financial
institutions have a very poor track record. Fortunately, infrastructure improvements tend to
attract private financial institutions to rural areas. For example, Binswanger, Khandker and
Rosenzweig (1993) show that private banks are more likely to locate in areas with better road
infrastructure and marketing systems. Improved rural infrastructure also encourages marketing
agents to extend credit to farmers at reasonable interest rates, because of lower risks.
16
Moreover, it is reasonable to expect that the more profitable and better equipped
environment makes it easier to form civil society organizations (CSO) such as community-based
organizations, NGOs, and foundations. Pretty (2003) argues that CSO activity could contribute
to improving local knowledge and social capital, which are effective in better
management, integrated pest management, wildlife management, and farmers’ research groups.
An important contribution of CSOs in developing countries has been the development of credit
and savings systems for poor families, which helps poor people find a way out of the credit trap.
Rural Infrastructure and Poverty Alleviation
While the previous sections discuss how infrastructure benefits agricultural development,
this section pays more attention to the distribution of the benefit and examines how rural
infrastructure affects the environment for the poor and their ability to connect to national and
international economy.
First of all, the positive effects of infrastructure investments on real incomes in both
agriculture and non-agriculture sectors contribute to poverty reduction. Infrastructure also
directly contributes to poverty alleviation by providing and supporting the delivery of key
services such as access to safe water and basic sanitation, especially in the very early stage of
development. The examination of such effects of infrastructure is especially important in the
context of achieving the Millennium Development Goals (MDGs). In addition, human
development (e.g., education and health) rely on services that require supportive infrastructure—
water and sanitation to prevent disease, electricity to serve schools and health clinics, and roads
to access the facilities (e.g., Deininger and Okidi 2003; and Datt and Ravallion 1998). Thus, a
17
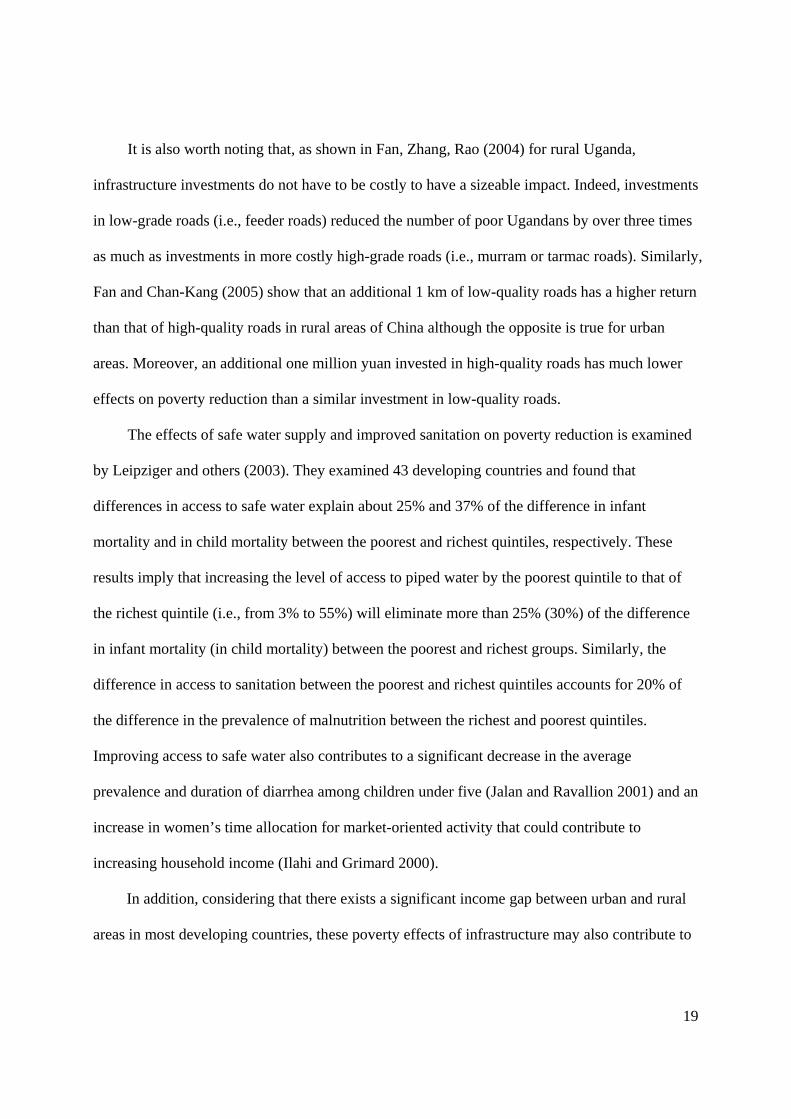
lack of appropriate infrastructure is a major bottleneck in efforts to achieve the MDGs and
accelerate poverty alleviation in developing countries.
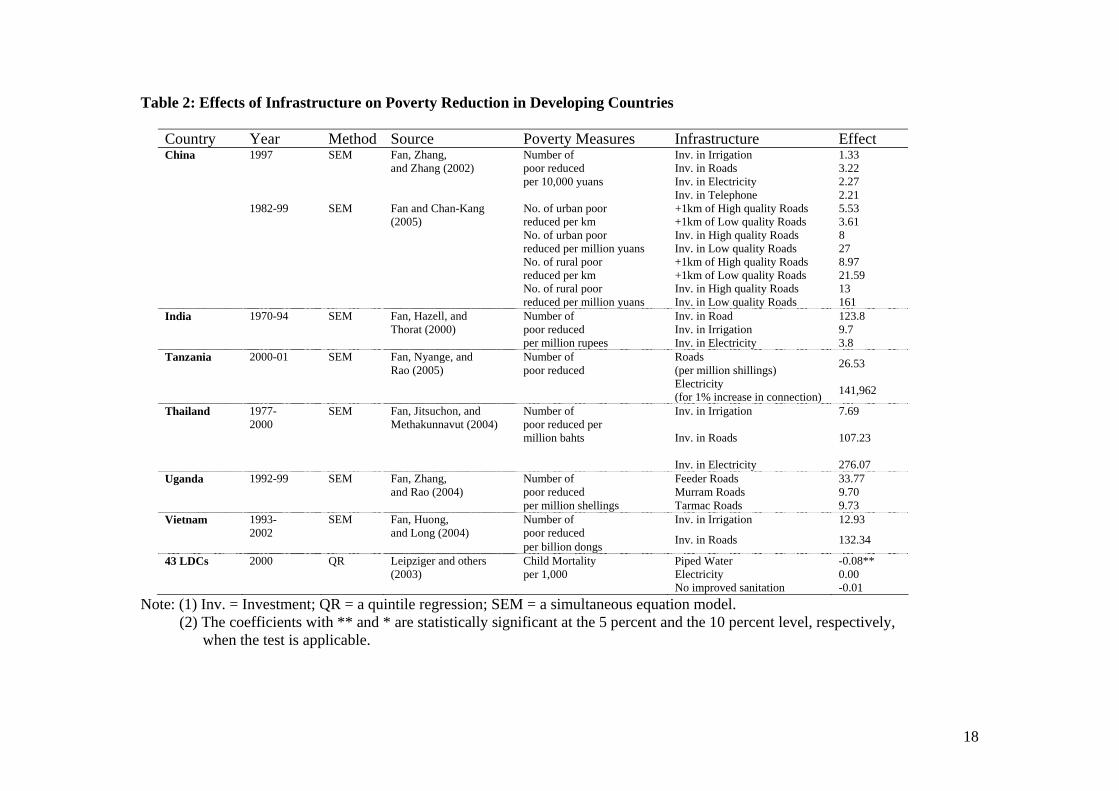
Table 2 presents the results from selected studies that estimate the effects of infrastructure
investments on poverty measurements. These studies in six developing countries simultaneously
estimate the effects of infrastructure investments on some endogenous economic factors (e.g.,
wages and labor productivity) and poverty reduction using a simultaneous equation model
(SEM). This is another way to control for endogeneity without losing information about the
long-run effects of infrastructure by differencing. These studies consistently show the importance
of infrastructure in promoting poverty alleviation. For example, Fan, Zhang, and Zhang (2002)
document the critical role of infrastructure development—particularly roads and
telecommunications—in reducing rural poverty in China between 1978 and 1997. The authors
also show that poverty fell because of the growth in rural non-farm employment that followed
the expansion of infrastructure. Infrastructure investments along with appropriate institutions can
reduce rural poverty in a variety of ways. Micro credit schemes have been successful in
generating incomes in both small-scale agriculture and, in particular, in small-scale non-
agricultural rural enterprises. Similarly, the introduction of fixed and mobile phones to the rural
poor has provided new opportunities for income generation and poverty reduction (see, for
example, Torero and van Braun 2005). Innovative uses of the internet offer new opportunities
that are yet to be fully exploited.
18
Table 2: Effects of Infrastructure on Poverty Reduction in Developing Countries
Country Year Method Source Poverty Measures Infrastructure Effect China 1997 SEM Fan, Zhang, Number of Inv. in Irrigation 1.33 and Zhang (2002) poor reduced Inv. in Roads 3.22 per 10,000 yuans Inv. in Electricity 2.27 Inv. in Telephone 2.21 1982-99 SEM Fan and Chan-Kang No. of urban poor +1km of High quality Roads 5.53 (2005) reduced per km +1km of Low quality Roads 3.61 No. of urban poor Inv. in High quality Roads 8 reduced per million yuans Inv. in Low quality Roads 27 No. of rural poor +1km of High quality Roads 8.97 reduced per km +1km of Low quality Roads 21.59 No. of rural poor Inv. in High quality Roads 13 reduced per million yuans Inv. in Low quality Roads 161 India 1970-94 SEM Fan, Hazell, and Number of Inv. in Road 123.8 Thorat (2000) poor reduced Inv. in Irrigation 9.7 per million rupees Inv. in Electricity 3.8 Tanzania 2000-01 SEM Fan, Nyange, and
Rao (2005) Number of poor reduced
Roads (per million shillings) 26.53
Electricity (for 1% increase in connection) 141,962
Thailand 1977- SEM Fan, Jitsuchon, and Number of Inv. in Irrigation 7.69 2000 Methakunnavut (2004) poor reduced per
million bahts
Inv. in Roads 107.23
Inv. in Electricity 276.07 Uganda 1992-99 SEM Fan, Zhang, Number of Feeder Roads 33.77 and Rao (2004) poor reduced Murram Roads 9.70 per million shellings Tarmac Roads 9.73 Vietnam 1993- SEM Fan, Huong, Number of Inv. in Irrigation 12.93 2002 and Long (2004) poor reduced per billion dongs Inv. in Roads 132.34
43 LDCs 2000 QR Leipziger and others Child Mortality Piped Water -0.08** (2003) per 1,000 Electricity 0.00 No improved sanitation -0.01
Note: (1) Inv. = Investment; QR = a quintile regression; SEM = a simultaneous equation model. (2) The coefficients with ** and * are statistically significant at the 5 percent and the 10 percent level, respectively, when the test is applicable.
19
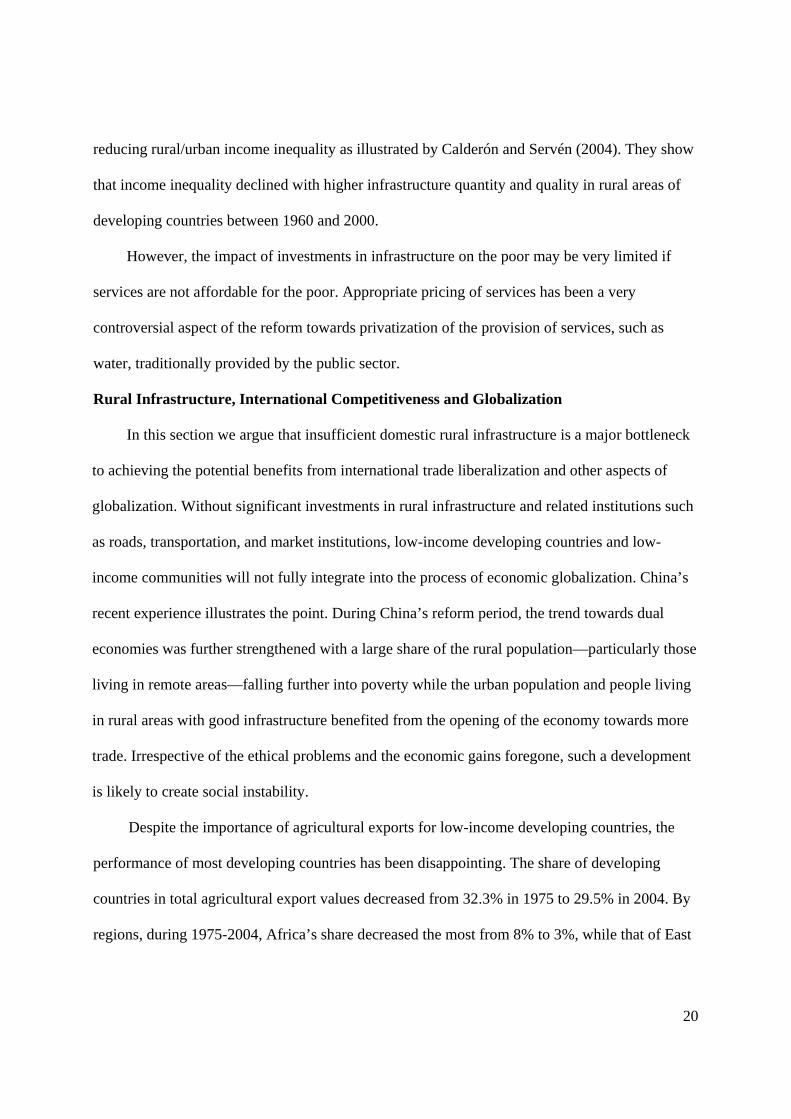
It is also worth noting that, as shown in Fan, Zhang, Rao (2004) for rural Uganda,
infrastructure investments do not have to be costly to have a sizeable impact. Indeed, investments
in low-grade roads (i.e., feeder roads) reduced the number of poor Ugandans by over three times
as much as investments in more costly high-grade roads (i.e., murram or tarmac roads). Similarly,
Fan and Chan-Kang (2005) show that an additional 1 km of low-quality roads has a higher return
than that of high-quality roads in rural areas of China although the opposite is true for urban
areas. Moreover, an additional one million yuan invested in high-quality roads has much lower
effects on poverty reduction than a similar investment in low-quality roads.
The effects of safe water supply and improved sanitation on poverty reduction is examined
by Leipziger and others (2003). They examined 43 developing countries and found that
differences in access to safe water explain about 25% and 37% of the difference in infant
mortality and in child mortality between the poorest and richest quintiles, respectively. These
results imply that increasing the level of access to piped water by the poorest quintile to that of
the richest quintile (i.e., from 3% to 55%) will eliminate more than 25% (30%) of the difference
in infant mortality (in child mortality) between the poorest and richest groups. Similarly, the
difference in access to sanitation between the poorest and richest quintiles accounts for 20% of
the difference in the prevalence of malnutrition between the richest and poorest quintiles.
Improving access to safe water also contributes to a significant decrease in the average
prevalence and duration of diarrhea among children under five (Jalan and Ravallion 2001) and an
increase in women’s time allocation for market-oriented activity that could contribute to
increasing household income (Ilahi and Grimard 2000).
In addition, considering that there exists a significant income gap between urban and rural
areas in most developing countries, these poverty effects of infrastructure may also contribute to
20
reducing rural/urban income inequality as illustrated by Calderón and Servén (2004). They show
that income inequality declined with higher infrastructure quantity and quality in rural areas of
developing countries between 1960 and 2000.
However, the impact of investments in infrastructure on the poor may be very limited if
services are not affordable for the poor. Appropriate pricing of services has been a very
controversial aspect of the reform towards privatization of the provision of services, such as
water, traditionally provided by the public sector.
Rural Infrastructure, International Competitiveness and Globalization
In this section we argue that insufficient domestic rural infrastructure is a major bottleneck
to achieving the potential benefits from international trade liberalization and other aspects of
globalization. Without significant investments in rural infrastructure and related institutions such
as roads, transportation, and market institutions, low-income developing countries and low-
income communities will not fully integrate into the process of economic globalization. China’s
recent experience illustrates the point. During China’s reform period, the trend towards dual
economies was further strengthened with a large share of the rural population—particularly those
living in remote areas—falling further into poverty while the urban population and people living
in rural areas with good infrastructure benefited from the opening of the economy towards more
trade. Irrespective of the ethical problems and the economic gains foregone, such a development
is likely to create social instability.
Despite the importance of agricultural exports for low-income developing countries, the
performance of most developing countries has been disappointing. The share of developing
countries in total agricultural export values decreased from 32.3% in 1975 to 29.5% in 2004. By
regions, during 1975-2004, Africa’s share decreased the most from 8% to 3%, while that of East
21
and South Asia slightly increased from 5% to 7%. At the country level, Brazil and Thailand
performed relatively better, and the share of Brazil and Thailand increased from 3.9% and 1.2%
in 1975 to 4.5% and 2.0% in 2004, respectively. On the other hand, the share of Uganda
decreased from 0.21% to 0.06% during the same period (FAO 2005).
One of key determinants of international competitiveness would be the availability of
adequate and efficient domestic infrastructure. Better domestic infrastructure could contribute to
international competitiveness through at least three channels: (1) improving price
competitiveness; (2) improving non-price competitiveness; and (3) attracting foreign direct
investments (FDI) (Oshikoya and Hussain 2002).
Price Competitiveness: Key determinants of a country’s price competitiveness in
international agricultural markets are wages, labor and land productivity, transportation costs,
input costs, and exchange rates.5 In most low-income developing countries, we observe high
transportation costs, low productivity and unstable supply of basic inputs such as electricity,
which causes reduced price competitiveness of those countries. For example, in Burundi in the
early 1990s, the average road transport costs for exports were 17.4% of cif prices with break-
bulk and 13.6% of cif prices with containerized shipment (see Oshikoya and Hussain 2002 for
more detailed discussion). It is also empirically shown that investments in export sectors are less
productive in poorer countries (Dawson 2005). To improve the situations, further investments in
domestic infrastructure as well as institutional and policy reforms are essential. For example,
transport costs for paved roads are cheaper and more stable over a year compared to those for
unpaved roads which are costly and vary sharply by season.
5 We discuss the problem of market distortions (e.g., export subsidies and damping) in international agricultural markets in a subsequent section.
22
Non-price competitiveness: There are two major aspects of non-price competitiveness: (1)
marketing-related aspects and (2) the quality of products. Key factors for marketing are market
information, negotiation, packaging, delivering, and after-sale services. The quality of the
product is influenced by the production environment and the delivery technology, especially for
agricultural commodities. Improving the poor status of information and communication services
in rural areas in developing countries, especially in South Asia and Africa6, would contribute
significantly to obtaining more precise and timelier information about international markets for
farmers. Also, improving communication between exporters and importers allows timely and
safe delivery of goods. Better quality transport services (i.e., faster and safer) are also crucial for
improving non-price competitiveness. In addition, improvement in the supply of basic utilities
(e.g., gas, water, and electricity) is essential for improving the quality of products.
FDI: Private capital inflows have been increasingly recognized as one of the most
important factors for successful development of export sectors. Some studies demonstrate that
the status of domestic infrastructure is an important determinant of the magnitude of private
capital inflow such as FDI (see, for example, Wheeler and Ashoka 1992; Asiedu and Donald
2004). Efficient transportation, reliable energy supply, access to safe water, and modern
telecommunication systems are critical to attracting investments from outside a country.
6 For example, telephone faults per 100 mainlines was 156 and 75 in South Asia and Africa in 2002, respectively, while 6 in OECD countries.
23
The Current Status of Rural Infrastructure in Selected Developing Countries
Having made the case for improved rural infrastructure to facilitate agricultural
development, poverty alleviation and international competitiveness, we now turn to the existing
evidence about the current status of rural infrastructure.
In general, the status of infrastructure stocks and services in most developing countries are
far from sufficient and much poorer than in developed countries. The problem of poor
infrastructure is particularly severe in the least developed countries. For example, while 73% of
the roads were paved in OECD countries in 1990, only 16% were paved in the least developed
countries. Worse still, the percentage of paved roads decreased to 13% in the least developed
countries during the 1990s and increased to 88% in OECD countries (World Bank 2005). A
comparison between the road density in Africa in the early 1990s and the road density in India in
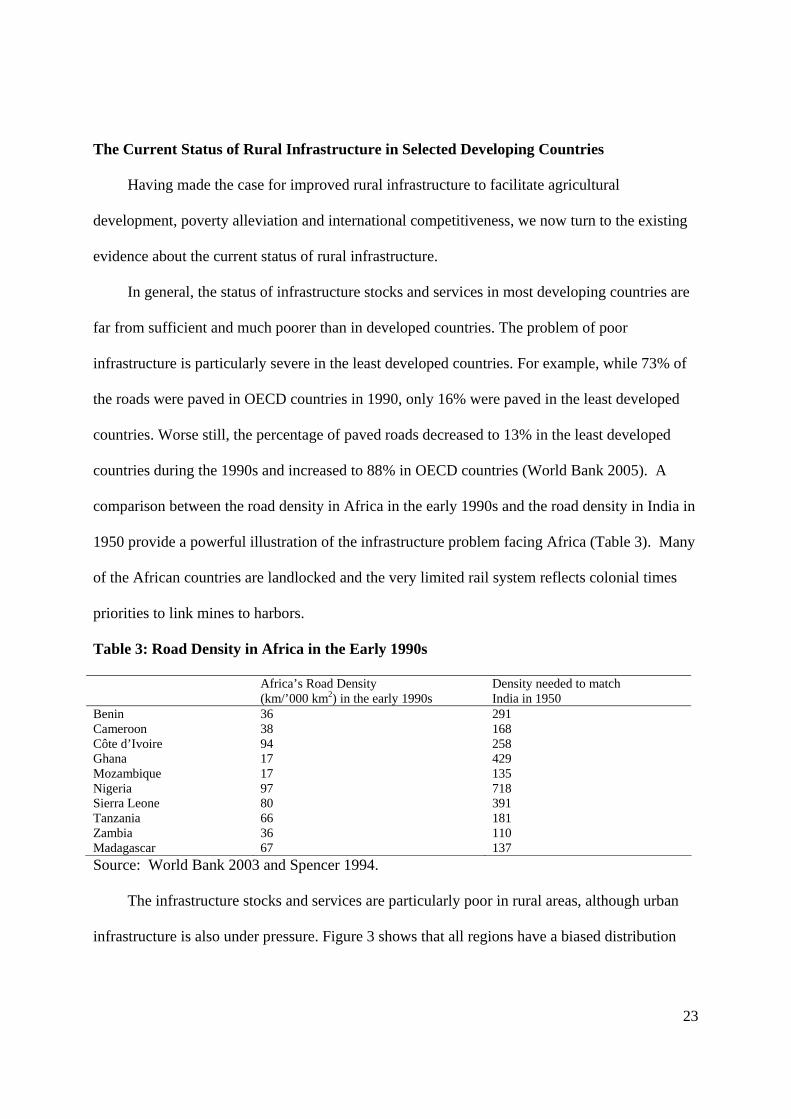
1950 provide a powerful illustration of the infrastructure problem facing Africa (Table 3). Many
of the African countries are landlocked and the very limited rail system reflects colonial times
priorities to link mines to harbors.
Table 3: Road Density in Africa in the Early 1990s Africa’s Road Density
(km/’000 km2) in the early 1990s Density needed to match India in 1950
Benin 36 291 Cameroon 38 168 Côte d’Ivoire 94 258 Ghana 17 429 Mozambique 17 135 Nigeria 97 718 Sierra Leone 80 391 Tanzania 66 181 Zambia 36 110 Madagascar 67 137 Source: World Bank 2003 and Spencer 1994.
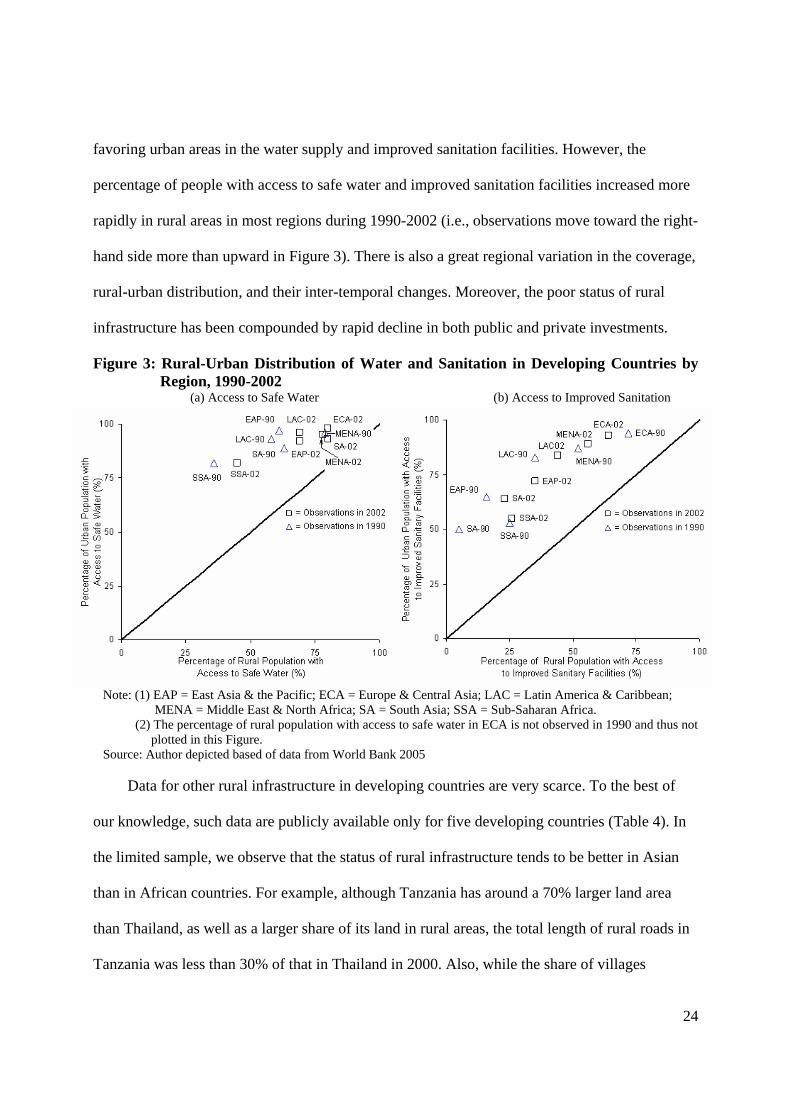
The infrastructure stocks and services are particularly poor in rural areas, although urban
infrastructure is also under pressure. Figure 3 shows that all regions have a biased distribution
24
favoring urban areas in the water supply and improved sanitation facilities. However, the
percentage of people with access to safe water and improved sanitation facilities increased more
rapidly in rural areas in most regions during 1990-2002 (i.e., observations move toward the right-
hand side more than upward in Figure 3). There is also a great regional variation in the coverage,
rural-urban distribution, and their inter-temporal changes. Moreover, the poor status of rural
infrastructure has been compounded by rapid decline in both public and private investments.
Figure 3: Rural-Urban Distribution of Water and Sanitation in Developing Countries by Region, 1990-2002
(a) Access to Safe Water (b) Access to Improved Sanitation
Note: (1) EAP = East Asia & the Pacific; ECA = Europe & Central Asia; LAC = Latin America & Caribbean; MENA = Middle East & North Africa; SA = South Asia; SSA = Sub-Saharan Africa. (2) The percentage of rural population with access to safe water in ECA is not observed in 1990 and thus not
plotted in this Figure. Source: Author depicted based of data from World Bank 2005
Data for other rural infrastructure in developing countries are very scarce. To the best of
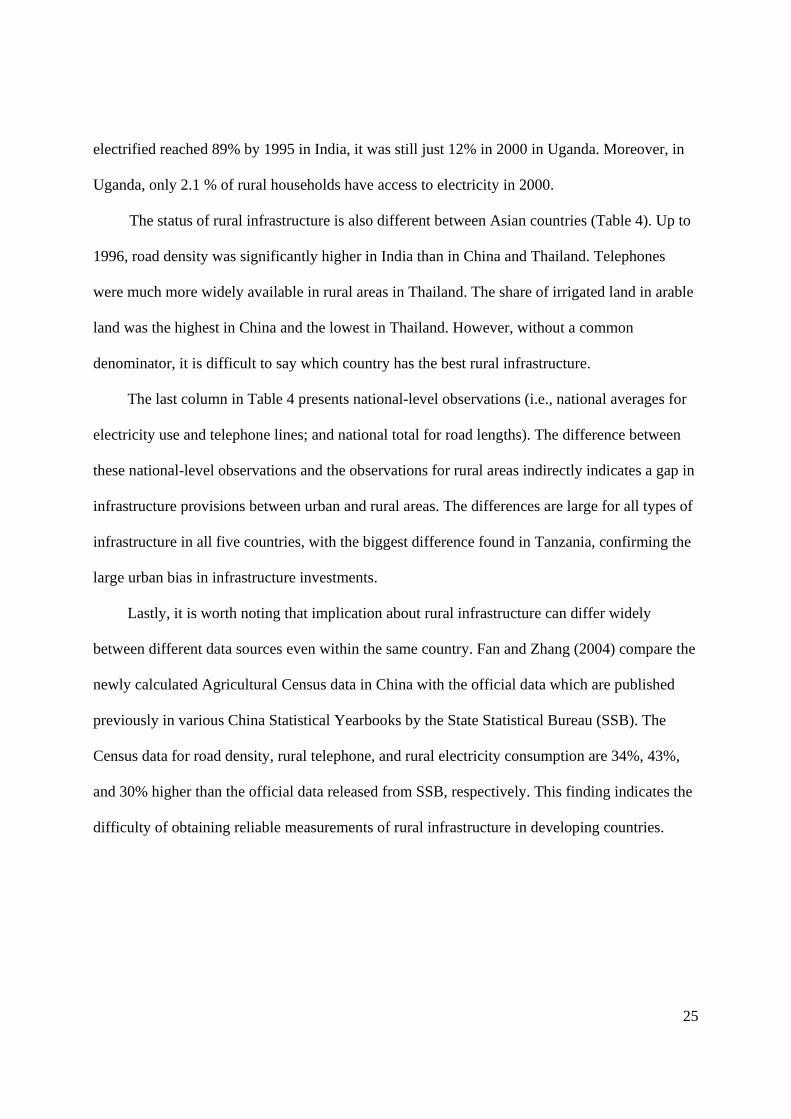
our knowledge, such data are publicly available only for five developing countries (Table 4). In
the limited sample, we observe that the status of rural infrastructure tends to be better in Asian
than in African countries. For example, although Tanzania has around a 70% larger land area
than Thailand, as well as a larger share of its land in rural areas, the total length of rural roads in
Tanzania was less than 30% of that in Thailand in 2000. Also, while the share of villages
25
electrified reached 89% by 1995 in India, it was still just 12% in 2000 in Uganda. Moreover, in
Uganda, only 2.1 % of rural households have access to electricity in 2000.
The status of rural infrastructure is also different between Asian countries (Table 4). Up to
1996, road density was significantly higher in India than in China and Thailand. Telephones
were much more widely available in rural areas in Thailand. The share of irrigated land in arable
land was the highest in China and the lowest in Thailand. However, without a common
denominator, it is difficult to say which country has the best rural infrastructure.
The last column in Table 4 presents national-level observations (i.e., national averages for
electricity use and telephone lines; and national total for road lengths). The difference between
these national-level observations and the observations for rural areas indirectly indicates a gap in
infrastructure provisions between urban and rural areas. The differences are large for all types of
infrastructure in all five countries, with the biggest difference found in Tanzania, confirming the
large urban bias in infrastructure investments.
Lastly, it is worth noting that implication about rural infrastructure can differ widely
between different data sources even within the same country. Fan and Zhang (2004) compare the
newly calculated Agricultural Census data in China with the official data which are published
previously in various China Statistical Yearbooks by the State Statistical Bureau (SSB). The
Census data for road density, rural telephone, and rural electricity consumption are 34%, 43%,
and 30% higher than the official data released from SSB, respectively. This finding indicates the
difficulty of obtaining reliable measurements of rural infrastructure in developing countries.
26
Table 4: Rural Infrastructure Indicators in Selected Developing Countries
Country Source Original Data Source Rural Infrastructure Indicator Unit Year
Observation for Rural
Nation al level Data ^
China Fan and Zhang Authors calculated from Road density Km / 10,000km^2 1996 1,679 - (2004) Agricultural Census Electricity use kW / person 1996 260 686 Telephone lines Set / 10,000 people 1996 283 440 Fan and others China Rural Statistical Yearbook Irrigated land in total % 1990 54.9 - (2002) arable land 1996 58.1 - China Rural Statistical Yearbook * Electricity use kW / person 1990 102 424 1996 200 686 China Statistical Yearbook * Telephone lines Set / 10,000 people 1990 21 60 1996 197 440 India Fan and others various state statistical abstracts and Irrigated land in total % 1970 23 - (1999) published government data. cropped area 1995 34 - various state statistical abstracts and Villages electrified % 1970 34 - published government data. 1995 89 - various state statistical abstracts and Road density Km / 1,000km^2 1970 2,614 - published government data. 1995 5,704 - Tanzania Fan and others Ministry of Works, Paved roads Km 1996 91 3,528 (2005) The United Republic of Tanzania 2000 159 - Unpaved roads Km 1996 17,450 84,672 2000 18,650 - Thailand Fan and others Agricultural statistics of Thailand *Irrigated land in total % 1970 13.7 - (2004b) (various years) and TDRI. arable land 1996 28.9 - 2000 31.6 - National Energy Policy Office * Electricity use kW / person 1977 29 227 (NEPO) 1996 627 1,312 2000 788 1,448 Telephone Organization of * Telephone lines Set / 10,000 people 1977 10 60 Thailand and SES. 1996 299 720 2000 690 920 Public Works Department, Road density Km / 1,000km^2 1977 12 - Ministry of Interior 1996 83 - 2000 124 - Uganda Fan and others
(2004) Ministry of Works, Transport and Communication Road length Km 2000 - 25,632
Calculated by authors from UMHS 1999/2000
Households with access to electricity % 2000 2.1 -
Villages electrified % 2000 12 - Note: (1) data with * are presented at the province or nation level in original studies. To make data comparable between countries, we transform the presented
data into per person, per 10,000 person and % in arable land using data for population and arable land area from World Bank 2005. (2) ^ data for country average come from World Bank 2005 except for the road length for Uganda; and – indicates that data are not available.
27
Investment in Rural Infrastructure
Rate of Return to Investments in Rural Infrastructure
How profitable are investments in rural infrastructure in developing countries? The answer
depends on whether profitability is measured in terms of private or public benefits and whether
externalities are considered. For example, return to investments in transportation infrastructure is
more than a decrease in transport costs. Investments in transportation infrastructure also benefit
society through a widening of the market, increasing competition in the market, and
dissemination of knowledge and technology. Because of such characteristics of infrastructure
investments, relying on the private sector is very likely to result in underinvestment. Even the
public sector may not adequately invest in infrastructure if it fails to consider external effects of
infrastructure.
While there is some evidence of high rates of return to infrastructure investments in general
(see, for example, The Operations Evaluation Department (2003) and The World Bank (1994))7,
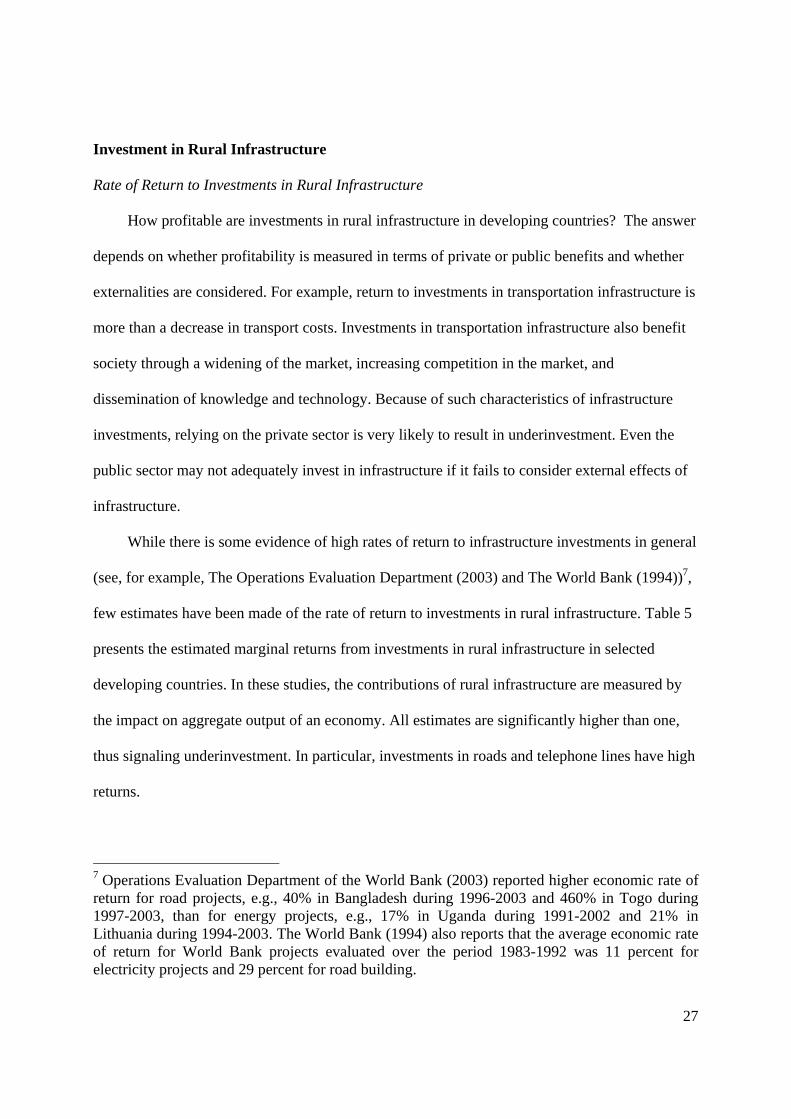
few estimates have been made of the rate of return to investments in rural infrastructure. Table 5
presents the estimated marginal returns from investments in rural infrastructure in selected
developing countries. In these studies, the contributions of rural infrastructure are measured by
the impact on aggregate output of an economy. All estimates are significantly higher than one,
thus signaling underinvestment. In particular, investments in roads and telephone lines have high
returns.
7 Operations Evaluation Department of the World Bank (2003) reported higher economic rate of return for road projects, e.g., 40% in Bangladesh during 1996-2003 and 460% in Togo during 1997-2003, than for energy projects, e.g., 17% in Uganda during 1991-2002 and 21% in Lithuania during 1994-2003. The World Bank (1994) also reports that the average economic rate of return for World Bank projects evaluated over the period 1983-1992 was 11 percent for electricity projects and 29 percent for road building.
28
Table 5: Marginal Returns of Rural Infrastructure in Developing Countries
Country Year Method Source Measures of Returns Infrastructure Effect China 1997 SEM Fan, Zhang, and Rural GDP Inv. in Irrigation 1.88 Zhang (2002) (yuan) Inv. in Roads 8.83 Inv. in Electricity 1.26 Inv. in Telephone 6.98 Uganda 1992-99 SEM Fan, Zhang,
and Rao(2004) Total GDP (Shelling) Feeder Roads 7.16
Tanzania 2000-01 SEM Fan, Nyange, and Rao (2005)
Total Output (Shelling) Roads 9.13
China 1982-99 SEM Fan and Chan-Kang (2005)
Total GDP +1km of High quality Roads 1.73 million
+1km of Low quality Roads 1.16 million
Total GDP Inv. in High quality Roads 1.45
Inv. in Low quality Roads 6.37
Note: Inv. = investment; SEM = a simultaneous equation model.
The question now becomes whether investments in rural infrastructure are more profitable
than other investments. To the best of our knowledge, no existing studies provide a direct answer
to this question. However, the findings in Canning and Bennathan (2000) provide some
indications of relative profitability of investments in rural infrastructure. They estimated the rate
of return to electricity generating capacity and to paved roads at the national level for 51 and 41
countries over the past four decades, respectively. They find that investments in electricity
generating capacity and paved roads are more profitable than other public investments in 20 out
of 51 countries and in 22 out of 41 countries, respectively. While the rate of returns to electricity
generating capacity tends to be high in low-income countries, that to paved roads tends to be
high in middle-income countries. Unfortunately, these findings are not specifically for
investments in rural infrastructure.
Based on the direct and indirect evidence presented above, it appears that investments in
rural infrastructure in low- and middle-income developing countries are lower than the optimal
levels and that expanded investment can be justified on economic grounds. Taken together with
earlier presented evidence of the impact on agricultural development and poverty alleviation, the
29
evidence presented here provides strong arguments for expanding investment in rural
infrastructure. Failure to do so will continue to hamper economic growth and poverty alleviation
in developing countries.
Why is Investment so Low?
Despite high economic returns to infrastructure investments, annual infrastructure
investments in developing countries appear to have decreased during the 1990s. This sub-section
examines potential reasons why.
Developing countries’ infrastructure, including rural infrastructure, is financed by three
main sources: the public sector, the private sector, and official development assistance (ODA).
During the 1990s, around 70% of investment in infrastructure came from the public sector;
around 22% from the private sector; and around 8% from ODA (World Bank 2004). Thus, the
domestic public sector is clearly the key player for financing infrastructure in developing
countries. This should be no surprise since most of the infrastructure has public goods
characteristics.
Although the data about public investment in infrastructure in developing countries are
scarce and scattered, the amount of the investment appears to be 2-4 percent of GDP on average
in most developing countries (Briceno-Garmendia, Estache, and Shafik 2004). The level and
inter-temporal changes of public investment in infrastructure varies across countries. Calderón
and Servén (2004) estimate the levels of public investment in infrastructure in nine Latin
American countries and show that, in 1997, the levels range from around 4.5 percent of GDP in
Colombia to about 0.2 percent in Argentina. In most developing countries, however, public
investment expenditures, particularly in infrastructure, have been reduced disproportionately due
to fiscal retrenchment during the 1990s. For example, during 1992-98, public investment in
30
infrastructure decreased from about 1.0 to 0.2 percent and from about 4.0 to 2.0 percent in
Argentina and Bolivia, respectively. Among sectors, the decline was sharpest in the power sector
in Argentina, and in the transport sector in Bolivia (Calderón and Servén 2004).
The decline in public investment in infrastructure has been compounded by a sharp fall in
ODA for infrastructure investment. For example, the commitment level for infrastructure of
multilateral development banks declined from $18 billion in 1996 and $13.5 billion in 1999.
These commitments recovered to about $16 billion in 2002. Similarly, bilateral development aid
for infrastructure investment declined from $15 billion in 1996 to about $8 billion in 2002,
representing a decline in the relative share of infrastructure in their total commitments from 27 to
14 percent.
Private investment in developing countries’ infrastructure also decreased during the 1990s.
A main source of private finance is commercial banks—often in connection with officially
backed export credit agencies and multilateral organizations. During the 1990s, the private
investment was about $67 billion per year. It peaked at around $120 in 1997 and decreased to
around $50 billion by 2001 (World Bank 2004).
The reduction in the public infrastructure investment could be attributable to the following
reasons: (i) In earlier investments in infrastructure, failed cases outnumbered successful cases,
especially in rural areas; (ii) disappointingly low participation in infrastructure investments by
the private sector; (iii) fiscal adjustment programs; and (iv) decentralization resulting in
mismatches between resources and needs. In this context, obtaining higher revenues required for
financing infrastructure investments through higher taxes may be perceived to negatively affect
overall economic growth. Thus, even where the importance and profitability of infrastructure is
recognized, it is often difficult for donors and governments to design and gain approval for
31
specific investment programs. Moreover, postponing large and costly infrastructure investments
is far easier for a Ministry of Finance than cutting current expenditures such as public sector
wages and debt services (Briceno-Garmendia, Estache, and Shafik 2004).
Another indirect but important cause is that subsidies in OECD countries result in low
international prices for agricultural commodities such as sugar, cotton, groundnuts, maize, rice,
meat, and dairy products. The use of these artificially low prices in ex ante estimates of expected
economic returns from investments in rural areas will reduce the economic justification for
making such investments.
The Consequences of Continued Low Investments
What are the consequences of these low investments in rural infrastructure in developing
countries? In previous parts of this paper, we have shown that increasing investments in rural
infrastructure is essential for agricultural growth, overall economic growth, and poverty
alleviation. Therefore, we conclude that failure to make such investments would be a critical
bottleneck for future growth in agricultural and economic output and poverty alleviation in
developing countries. Moreover, low levels of domestic infrastructure reduce competitiveness in
international markets and make it very difficult for low-income countries to capture benefits
from trade liberalization and international capital markets.
How Much Investment is Needed?
It is very difficult to estimate how much additional investment in infrastructure is needed in
developing countries. Estimates of the investments needed to bring rural infrastructure up to an
appropriate level vary widely among countries and institutions, as do the judgments about what
is appropriate.
32
To the best of our knowledge, there are only three studies that attempt to estimate the
aggregate amount of infrastructure investments needed for developing countries. The estimates
in these studies are not directly comparable because they examine different sectors based on
different judgment of an appropriate infrastructure level. Thus, we present the estimates simply
for reference. Because these estimates are evaluated at different points in time, we deflate the
estimates using IMF’s world consumer price index (2000 = 100) in order to estimate present
values.
In a background technical document for the World Food Summit 5 years later, FAO
estimates that the investment needed for support services and infrastructure—most of which
would be public funding—to achieve the World Food Summit goal was $53.7 billion for the
period 2002-2015 (FAO 2002). In a subsequent publication completed in 2003, FAO (2003)
estimates that $7.3 billion would be needed annually for investment in rural infrastructure and
improved market access in developing countries ($6.3 billion for new construction and
maintenance of roads). On the other hand, Fay and Yepes (2003) demonstrate that a much larger
amount of infrastructure investments will be needed in order to meet the demand for roads,
railroads, telecommunications, electricity, water, and sanitation in developing countries during
2005-2010. According to their estimates, about $465 billion per annum is needed for all
developing countries during 2005-2010, half of which would be for new infrastructure and the
other half for maintenance. About $75.7 billion is needed only for the new construction and
maintenance of roads, which is more than ten times as large as the estimate in FAO (2003).8
Recommended Action
8 Note that these values are not directly comparable. While the estimates in Fay and Yepes (2003) are for a whole country, the estimates in FAO (2003) are only for rural areas. The way to define an appropriate level of infrastructure investments is also different.
33
The evidence presented in this paper shows that a massive investment campaign for the
construction of new rural infrastructure and maintenance of existing infrastructure in low-income
developing countries is long overdue. Without such a campaign, the many plans, goals, and
targets—including the Poverty Reduction Strategy Papers, the Millennium Development Goals,
and many other declarations—will not be achieved. Furthermore, the potential benefits
embodied in globalization are not likely to be captured by low-income developing countries and
their poor people. High transactions costs, imperfect competition, large marketing margins, and
low price transmission will together promote continued poverty and low levels of
competitiveness.
In addition to investment in physical infrastructure such as roads, electricity generation,
irrigation facilities and telecommunications, the campaign must include efforts to design and
implement new rural institutions, improve domestic rural markets for inputs, outputs and capital,
generate appropriate technology for small-scale farmers, facilitate non-agricultural enterprises in
rural areas, and remove trade distorting agricultural policies by OECD countries.
The economic pay-off to society from investments in rural infrastructure is likely to be
high. Because of the public goods nature of most of the investments needed, most of the money
needed must come from the public sector, including governments of poor countries and
international development institutions including the World Bank, regional development banks,
and bilateral donor agencies.
Although public-private partnership should be pursued when appropriate, its feasibility
varies among sectors and countries, and thus its possibility should be examined on a case-by-
case basis. In general, the partnership seems to be more feasible in telecommunication, electricity
generation and high quality road sectors than in sanitation and water supply sectors (see, for
34
example, Warlters, Irwin and Juan 2005). In addition, to assure that infrastructure services
become affordable and accessible for the poor in rural areas, government may need to set a
service price (e.g., water price) below cost. In this case, the government should provide subsidies
for low-income households to cover the gap between the lower price and the cost and motivate
private firms to invest in the infrastructure sectors and extend their services to poor rural areas.
For example, Wellenius, Foster, and Malmberg-Calvo (2004) suggest the use of competition
among firms for rural service subsidies.
Lastly, investment in rural infrastructure is capital intensive and current low agricultural
prices may make ex ante assessment of infrastructure projects look questionable. However,
without these investments, a large area of the world will continue to be unable to contribute
significantly to economic growth, a large portion of the world’s current and future population
will be relegated to poverty, hunger, and human misery, and deteriorations in equity and stability
will affect us all.
35
Reference
Antle, J.M. 1984. “Human Capital, Infrastructure, and the Productivity of Indian Rice Farmers.” Journal of Development Economics 14:163–181. Asiedu, E. and Lien, D. 2004. “Capital Controls and Foreign Direct Investment.” World Development 32(3):479–90. Binswanger, H. P., S.R. Khandker, M.R. Rosenzweig. 1993. “How Infrastructure and Financial Institutions Affect Agricultural Output and Investment in India.” Journal of Development Economics 41:337–366. Briceno-Garmendia, C., A. Estache, N. Shafik. 2004. “Infrastructure Services in Developing Countries: Access, Quality, Costs and Policy Reform.” World Bank Policy Research Working Paper 3468. Byerlee, D., X. Diao, C. Jackson. 2005. “Agriculture, Rural Development, and Pro-poor Growth: Country Experiences in the Post-Reform Era.” Agriculture and Rural Development Discussion Paper 21. World Bank. Calderón, C. and Servén, L. 2004. “The Effects of Infrastructure Development on Growth and Income Distribution.” World Bank Policy Research Working Paper 3400. Canning, D. and E. Bennathan. 2000. “The Social Rate of Return on Infrastructure Investments.” World Bank Policy Research Working Paper 2390. Chhibber, A. 1988. “Raising Agricultural Output: Price and Nonprice Factors.” Finance and Development 25 (2):44–47. Craig, B. J., P.G. Pardey, J. Roseboom. 1997. “International Productivity Patterns: Accounting for Input Quality, Infrastructure, and Research.” American Journal of Agricultural Economics 79 (4):1064–1076. Croppenstedt, A., M. Demeke, M. M. Meschi. 2003. “Technology Adoption in the Presence of Constraints: the Case of Fertilizer Demand in Ethiopia.” Review of Development Economics 7 (1):58–70. Datt, G. and M. Ravallion. 1998. “Why Have Some Indian States Done Better Than Others at Reducing Rural Poverty?” Economica 65 (257):17–38. Davis, L. E. and D.C. North. 1970. “Institutional Change and American Economic Growth: A First Step Towards a Theory of Institutional Innovation.” Journal of Economic History 30 (1):131–149. Deininger, K. and J. Okidi. 2003. “Growth and Poverty Reduction in Uganda, 1999-2000: Panel Data Evidence.” Development Policy Review 21 (4):481–509.
36
Delgado, C.L., J. Hopkins, V.A. Kelly, P.B.R. Hazell, A.A. McKenna, P. Gruhn, B. Hojjati, J. Sil, C. Courbois. 1998. Agricultural Growth Linkages in Sub-Saharan Africa. International Food Policy Research Institute Research Report 107. Washington, D.C. Diao, X., P. Hazell, D. Resnick, J. Thurlow. 2006. “The Role of Agriculture in Development: Implication for Sub-Saharan Africa.” International Food Policy Research Institute DSGD Discussion Paper 29. Washington, D.C. Dorward, A., J. Kydd, J. Morrison, I. Urey. 2004a. “A Policy Agenda for Pro-Poor Agricultural Growth.” World Development 32 (1):73–89. Dorward, A., S. Fan, J. Kydd, H. Lofgren, J. Morrison, C. Poulton, N. Rao, L. Smith, H. Tchale, S. Thorat, I. Urey, P. Wobst. 2004b. “Institutions and Policies for Pro-poor Agricultural Growth.” Development Policy Review 22 (6):611–622. Fan, S. and C. Chan-Kang. 2005. Road Development, Economic Growth, and Poverty Reduction in China. International Food Policy Research Institute Research Report 138. Fan, S., P. Hazell, S. Thorat. 2000. “Government Spending, Growth, and Poverty in Rural India.” American Journal of Agricultural Economics 82 (4):1038–1051. Fan, S., P.L. Huong, T.Q. Long. 2004. “Government Spending and Poverty Reduction in Vietnam.” Prepared for the World Bank funded project “Pro-poor Spending in Vietnam. International Food Policy Research Institute, Washington, D.C. Fan, S., S. Jitsuchon, N. Methakunnavut. 2004. “The Importance of Public Investment for Reducing Rural Poverty in Middle-Income Countries: The Case of Thailand.” International Food Policy Research Institute DSGD Discussion Paper 7. Fan, S., D. Nyange, N. Rao. 2005. “Public Investment and Poverty Reduction in Tanzania: Evidence from Household Survey Data.” International Food Policy Research Institute DSGD Discussion Paper 18. Fan, S. and N. Rao. 2003. “Public Spending in Developing Countries: Trends, Determination, and Impact”. International Food Policy Research Institute EPTD Discussion Paper 99. Fan, S., L. Zhang, X. Zhang. 2002. Growth, Inequality, and Poverty in Rural China: The Role of Public Investments. International Food Policy Research Institute Research Report 125. Fan, S. and X. Zhang. 2004. “Infrastructure and Regional Economic Development in Rural China.” China Economic Review 15:203–214. Fan, S., X. Zhang, N. Rao. 2004. “Public Expenditure, Growth, and Poverty Reduction in Rural Uganda.” International Food Policy Research Institute DSGD Discussion Paper 4.
37
Fay, M. and T. Yepes. 2003. “Investing in Infrastructure: What is Needed from 2000 to 2010?” World Bank Policy Research Working Paper 3102. Washington, D.C. Food and Agriculture Organization of the United Nations. 2005. FAOSTAT. Rome. Food and Agriculture Organization of the United Nations. 2003. Anti Hunger Programme: A Twin-track Approach to Hunger Reduction: Priorities for National and International Action. FAO. Food and Agriculture Organization of the United Nations. 2002. Mobilizing the Political Will and Resources to Banish World Hunger. The World Food Summit: Five Years Later. FAO. Food and Agriculture Organization of the United Nations. 1996. “Technical Background Documents 6-11, Volume 2”. World Food Summit. FAO: Rome. Freeman, H. A., S. K. Ehui, M. A. Jabbar. 1998. “Credit Constraints and Smallholder Daily Production in the East African Highlands: Application of a Switching Regression Model.” Agricultural Economics 19: 33-44. Gollin, D., S. Parente, R. Rogerson. 2002. “The Role of Agricultural in Development.” American Economic Review 92 (2):160–164. Gulati, A., S. Fan, S. Dalafi. 2005. The Dragon and the Elephant: Agricultural and Rural Reforms in China and India MTID Discussion Paper 87. Haggblade, S., J. Hammer, P. Hazell. 1991. “Modeling Agricultural Growth Multipliers.” American Journal of Agricultural Economics 73 (2): 361-374. Hazarika, G., J. Alwang. 2003. “Access to Credit, Plot Size and Cost Efficiency among Smallholder Tobacco Cultivators in Malawi.” Agricultural Economics 29: 99-109. Hazell, P. and A. Röell. 1983. Rural Growth Linkages: Household Expenditure Patterns in Malaysia and Nigeria. International Food Policy Research Institute Research Report 41. Ilahi, N. and F. Grimard. 2000. “Public Infrastructure and Private Costs: Water Supply and Time Allocation of Women in Rural Pakistan.” Economic Development and Cultural Change 49 (1): 45-76. Jalan, J. and M. Ravallion. 2001. “Does Piped Water Reduce Diarrhea for Children in Rural India?” World Bank Policy Research Working Paper 2664. Johnston, B. F. and J.W. Mellor. 1961. “The Role of Agriculture in Economic Development.” American Economic Review 51 (4):566–593. Kydd, J., A. Dorward, J. Morrison, G. Cadisch. 2004. “Agricultural Development and Pro-poor Economic Growth in Sub-Saharan Africa: Potential and Policy.” Oxford Development Studies 32 (1):37–57.
38
Leipziger, D., M. Fay, Q. Wodon, T. Yepes. 2003. “Achieving the Millennium Development Goals: The Role of Infrastructure.” World Bank Policy Research Working Paper 3163. Lewis, W.A. 1954. “Economic Development with Unlimited Supplies of Labour.” The Manchester School of Economics and Social Studies, 22 (2): 139-191. Mellor, J.W. 1966. The Economics of Agricultural Development. New York: Cornell University Press. Mellor, J.W. 1976. The New Economics of Growth. New York: Cornell University Press. Mundlak, Y., D. Larson, R. Butzer. 2002. “Determinants of Agricultural Growth in Indonesia, the Philippines, and Thailand.” World Bank Policy Research Working Paper 2803. Munnell, A. H. 1992. “Policy Watch: Infrastructure Investment and Economic Growth.” Journal of Economic Perspectives 6(4):189–198. Ilahi, N. and F. Grimard. 2000. “Public Infrastructure and Private Costs: Water Supply and Time Allocation of Women in Rural Pakistan.” Economic Development and Cultural Change 49 (1):45–76. Operations Evaluation Department of the World Bank. 2003. “Annual Report of Development Evaluation.” Washington, D.C.: World Bank. Oshikoya, W. T. and M.N. Hussain. 2002. “Infrastructure for Economic Development in Africa.” In J.B. de Macedo and O. Kabbaj, eds., Regional Integration in Africa. OECD. Pinstrup-Andersen, P. 2002. “Food and Agricultural Policy for a Globalizing World: Preparing for the Future.” American Journal of Agricultural Economics 84 (5):1201-1214. Pretty, J. 2003. “Social Capital and Connectedness: Issues and Implications for Agriculture, Rural Development and Natural Resource Management in ACP Countries.” CTA Working Document 8032. Technical Centre for Agricultural and Rural Cooperation (CTA). Ravallion, M. and G. Datt. 2004. “China’s (Uneven) Progress Against Poverty.” World Bank Policy Research Working Paper 3408. Ravallion, M. and Datt, G. 1996. “How Important to India’s Poor is the Sectoral Composition of Economic Growth?” World Bank Economic Review 10 (1):1-26. Rottso, J. and Torvik, R. 2003. “Interactions between Agriculture and Industry: Theoretical Analysis of the Consequences of Discriminating Agriculture in Sub-Saharan Africa” Review of Development Economics 7 (1):138-51. Spencer, D.S.C. 1994. “Infrastructure and Technology Constraints to Agricultural Development in the Humid and Subhumid Tropics of Africa.” International Food Policy Research Institute EPTD Discussion Paper 3.
39
Thirtle, C., L. Lin, J. Piesse. 2003. “The Impact of Research-Led Agricultural Productivity Growth on Poverty Reduction in Africa, Asia and Latin America.” World Development 31 (12):1959–1975. Timmer, P.C. 2005. “Agriculture and Pro-Poor Growth: An Asian Perspective.” Center for Global Development Working Paper 63. Timmer, P.C. 2002. “Agriculture and Economic Development.” In Bruce Gardner and Gordon Rausser, eds., Handbook of Agricultural Economics 2(1):1487-1546. Torero, M. and von Braun, J. 2005. Information and Communication Technologies for the Poor. International Food Policy Research Institute. Warlters, M., T. Irwin, E. J. Juan. 2005. Infrastructure Development: The Role of the Public and Private Sector. World Bank Group’s Approach to Supporting Investments in Infrastructure Wheeler, D. and Ashoka, M. 1992. “International Investment Location Decisions: The Case of US Firms.” Journal of International Economics 33: 57-76 Wellenius, B., V. Foster, and C. Malmberg-Calvo. 2004. Private Provision of Rural Infrastructure Services: Competing for Subsidies. World Bank Policy Research Working Paper 3365 World Bank (The). 2005. “2005 World Development Indicators.” Washington, D.C.: The World Bank World Bank (The). 2004. “The Challenge of Financing Infrastructure in Developing Countries.” Chapter 6 in Global Development Finance 2004: Harnessing Cyclical Gains for Development. Washington, D.C.: The World Bank. World Bank (The). 2003. “World Development Report 2003: Sustainable Development in a Dynamic World: Transforming Institutions, Growth, and Quality of Life.” New York: copublication of The World Bank and Oxford University Press. World Bank (The). 1994. “World Development Report 1994: Infrastructure for Development: World Development Indicators.” Washington, D.C.: The World Bank