RURAL NON-FARM EMPLOYMENT IN INDIA: MACRO-TRENDS, MICRO-EVIDENCES AND POLICY OPTIONS
Brajesh Jha* ABSTRACT Towards the end of the 1990s, the incidence of unemployment on the basis of CDS (current daily status) has exceeded seven per cent. There are also evidences of deterioration in the quality of rural employment; casualization of rural workers for instance, has increased many-fold. Real wages of rural workers however, increased and the disparity in rural and urban wages also reduced during the 90s. In this context, the present study investigates the nature and pattern of rural diversification in India. The study uses the NSS quinquennial survey on employment to present macro-trends in rural employment; it also utilizes selected information collected by Agro-Economic Research Centres (AERCs) to arrive at certain inferences about the process of rural diversification. Disaggregate level figures shows that both push-and-pull factors have contributed to rural non-farm employment growth; the process of rural diversification in such situations is however, different. The study finally discusses broad strategies to increase rural non-farm employment in the country. I. INTRODUCTION The Indian economy grew at an impressive rate in the last decade and demographic pressure
also slowed.1 Yet, the incidence of unemployment (CDS) towards the end of the 1990s was
more than seven percent. The situation is especially disconcerting in the rural sector.
Employment in rural sector, which is associated mostly with agriculture, has stagnated
during the 90s (Jha 2006). Considering the increased pressure on land there exists limited
scope for increasing employment in agriculture so that employment in the non-farm sector
becomes an important option
* The author is grateful to Prof. B. N. Goldar and Prof. Arup Mitra for their comments on an earlier draft of the paper. Author is also grateful to Dr Sakthivel for parting with some data on employment.
1 Though the rate of growth of the economy varies depending on the choice of base year and other factors, most of the study finds growth in the economy during the decades of 1990s at around 6 per cent.
1
Studies also suggest that with the process of development, the share of non-farm
income and employment in the total income and employment of the rural households
increases in the developing countries.2 A combination of farm and non-farm income at the
household level provides resilience against adverse situations in either of the sectors, though
agriculture is known for more frequent adversity. There are also evidences to show that
productivity and profitability in the non-farm sector is generally higher than in the farm
sector; as are the average wages and working conditions that obtain in the non-farm sector
(Fisher et al. 1998). A greater reliance on the non-farm sector would therefore provide a
demand-pull to rural economy and also ensure welfare for rural workers.
In India, economic opportunities in the non-farm sectorhave also increased.3 A
comparative account of the non-farm sector in the rural vis-à-vis the urban sector however,
shows significant disparity in terms of its size and growth.4 The lopsided nature of growth of
the non-farm sector is causing a problem of rural - urban migration. The small base of the
rural non-farm sector located within a large rural population is in fact indicative of the
employment potential in the rural non-farm sector (RNFS). Achievement
of employment growth as per its potential may require a more favourable policy
environment; and the present study attempts to search for these policy options. The study of
rural diversification with the objective of ensuring a proper policy match requires first an
understanding of the pattern of farm and non-farm employment in the rural sector; Section II
of this paper discusses macro-trends in rural employment.
The rural non-farm sector (RNFS) encompasses all non-agricultural activities:
mining and quarrying, household and non-household manufacturing, processing, repair,
construction, trade and commerce, transport and other services in villages and rural towns
undertaken by enterprises varying in size from household own-account enterprises to
2 Though proportion of household income separately available from the agriculture and non-agriculture sector varies across regions, the studies have generally found that non-farm activities on an average contribute between 25 and 35 percent of the total household income in rural India. 3 The non-farm sector is loosely referred to as the unorganized sector; and the Ninth Five-Year Plan document says that more than 90 per cent of employment growth during the 1990s was from the unorganized sector. 4 In rural India, non-agriculture industries under the unorganized sector employ only one-half of the work force that it employs in the urban sector; the corresponding figures for rural and urban sector are roughly 11 per cent and 22 per cent respectively of the total workforce in the country. The rate of growth of employment in the rural unorganized sector is significantly lower as compared to the urban unorganized sector.
2
factories.5 The RNFS thus comprises diverse activities while sustained growth in the RNFS
depends on a varied set of factors, depending on the kind of impetus, positive or negative,
that these factors provides to the rural economy RNFS will experience development- and
distress- related rural diversification. Section III of this paper discusses rural diversification,
its determinants and implications for the rural people. For a better understanding of rural
diversification it is necessary to study the participation of rural households in particular non-
farm activities; the motivation behind the decisions as well as the ability of the households
to participate in these. Section IV attempts to illustrate these points, from the evidence of the
survey of Agro-Economic Research Centres (AERCs) spread across the country.
The state plays an important role in encouraging positive rural diversification. The
rural economy includes several heterogeneous rural activities having different demand and
supply conditions in their input and output markets. Government policies therefore, in most
of the cases are industry specific. In a labour surplus country like India, the government also
has a role to play in regulating and mediating in the rural labour market. The present study
in Section V reviews some of the government policies that have a direct bearing on the
intensity and quality of employment in the rural sector.
II. RURAL EMPLOYMENT: SOME MACRO TRENDS In this section, an effort has been made to understand the pattern of rural non-farm
employment at aggregate and disaggregate levels using the National Sample Survey (NSS)
quinquennial data on employment. The study also utilizes Economic Census data from the
Central Statistical Organization (CSO). Previous studies related to the rural non-farm
employment suggest that construction, trade, and transport have emerged as the engine of
rural employment growth; these industries together account for only 11 per cent of the rural
workforce. Can these industries with such a small base sustain the growth of the rural non-
farm employment in a country such as India? How have women benefited in terms of
employment growth in the rural non-farm sector is another question that this section
attempts to answer.
5 Often, towns with population less than 50,000 are referred as rural towns.
3
Table 1 presents a comparative account of employment trends for nine major
industrial categories. This table shows the annual compound growth rate (ACGR) of
employment (on the basis of CDS) in the rural and urban sectors during the reference
periods (1983-94 and 1994-2000). Though the share of agriculture in the economy has
declined during the planned development of the country, it still assumes a pivotal role in the
rural economy since three-fourths of the rural work force is dependent on it. The bulk of
employment in agriculture is rural-based (97 per cent) and it is astonishing that rural
employment growth in agriculture is abysmally low (0.06 per cent) 6 and insignificant during
the 90s (see Table 1). The corresponding growth was moderate and significant (1.1 per cent)
during the 80s. It is however interesting that the growth of agricultural income during the
90s is higher (0.02 per cent) than in the 80s. These trends suggest job-less growth in
agriculture during the 90s. An enquiry into the pattern of growth in agricultural income
suggests that growth in agricultural income during the 90s is largely because of value
addition in agriculture (Jha 2006). Whereas, intensity of employment in agriculture depends
more on cropped area and crop area indices have decreased during the 90s.7 Further,
livestock which has emerged as an important source of rural employment during the 80s has
undergone structural changes, as the livestock population in fact declined. The recent
livestock census shows that population of cattle and goat has declined after the mid-90s. As
a matter of fact, rearing of cattle and goat is highly labour intensive; a decline in absolute
number of population suggests decline of employment in the livestock sector.
The annual compound growth rate (ACGR) of employment in the non-agricultural
sector, unlike for agriculture, has been positive and significant during the 90s; this has held
true for both rural and urban sectors. The ACGR of employment in the non-agriculture
sector during 1994-2000 has been less than in the previous reference period, 1983-1994. The
non-agriculture industrial categories where employment growth during the 90s was positive
and also higher than in the previous reference period were manufacturing, construction,
trade, transport, and business services. This trend in employment growth was slightly
different at the level of the rural and urban sectors. In the urban sector, manufacturing, trade,
transport and business services were the industries where employment growth during 90s
6 This change is observed at the third decimal place only. 7 For details, see Agriculture Statistics at a Glance, 2004 , a Government of India publication.
4
was higher than in the previous reference period; while in the rural sector, construction,
transport and business services, recorded a higher growth during the 90s as compared to the
previous decade. It must be noted that the base of these industrial categories in the rural
sector was very low.
Table 1: A Comparative Account of Growth in Employment and Income for selected Industries / Industry-groups during 1980s and 90s
Note: These estimates have been worked out with the Current Daily Status (CDS) figures of employment from the NSSO and income figures from the CSO, New Delhi.
In manufacturing, employment growth during the 80s was similar in both the rural
and urban sectors; disparity in the rate of growth between these sectors has surfaced in the
90s. The possible reasons for disparity in the rural and urban rate of growth of employment
in manufacturing during the 90s are as follow: (a) burgeoning gap in rural and urban
infrastructure facilities with regard to assured power and telecommunications; (b) increasing
focus on cost-competitiveness with trade liberalization which discourages rural
manufacturing that is generally small scale in either the organized or unorganized
categories; (c) uncertain policy environment for small-scale industry has also discouraged
some village resource-based manufacturing activities in the rural sector; and (d) with trade
liberalization and growing consumerism the relative importance of goods produced in the
urban sector has increased even for the rural masses. 8
8 Harris (1984) reported increase in relative importance of goods produced in metropolitan factories in the consumption basket of rural consumers.
5
A detailed study by Uma Rani et al. (2004) lists reasons for particular trend of
employment and income in the manufacturing sector. The study found that in manufacturing
activities undertaken in the organized and unorganized sectors during the years 1984-1999
the growth of employment, value-addition and capital in the organized manufacturing sector
has grown during 1984-95 and declined subsequently.9 The unorganized sector presents a
different trend. Growth in this sector has peaked up during the 1984-90, flattened during the
1989-95 and surged ahead in subsequent years (1995-00) following the adoption of
promotional policies towards unorganized segments of small-scale industries.10 This growth
has been particularly high for the organic as compared to the inorganic manufacturing
units.11 It is significant that organic manufacturing is mostly village resource-based and with
favourable infrastructures for manufacturing in the rural sector, organic manufacturing
industries can be attracted.
Employment growth in construction peaked during the 90s, though it was fairly high
(1.75%) even in the 80s. In the urban sector, construction activity has peaked early (in the
80s) while in rural India a high growth was experienced during the 90s. The extension of
basic infrastructure like roads in rural India might have encouraged employment growth in
rural construction during the 90s. A state-wise analysis of data would throw light on the
possible factors favouring the robust growth in construction activity. Certain economic
policies might also have encouraged construction activities in the 90s.12
Transport-storage-communication (TSC) and finance-insurance-real-estate-business
(FIREB) services are the industrial categories where employment increased in both the rural
9 This study on the basis of availability of data for unorganized manufacturing has divided the reference period (1984-00) into three phases, first phase is the initial period of partial liberalization (1984-89), the second and third phases, 1989-94 and 1994-00, respectively are the reform periods. 10 Examples of promotional policies in recent years are increase in investment limits for small-scale industries to infuse technology and increase scale economy in small-scale industries. 11 The organic manufacturing units referred here are NIC14 - NIC22, while inorganic manufacturing units are commodities classified under NIC-23 to NIC36. (NIC refers to National Industries Classifications) 12 Favourable policy environment for cement and other building construction industries and the consequent fall in the relative price of these commodities has encouraged construction activity after the mid-80s. Introduction of tax incentives in house loans towards the end of the 90s is another example of incentives for promotion of construction activity.
6
and urban sectors. Employment in TSC appears to be more influenced by increased
investment in infrastructure such as roads which are being prioritized in recent years.
Increased investment in infrastructure increases the quality of real estate and consequently,
the income and employment in real estate. This in turn has spread effects on the growth of
business services. Trade, hotels and restaurants (THR) are the other industrial categories
where employment growth was positive and significant in both the sectors, though the rate
of growth was higher in the urban sector.
In the 90s, employment growth was negative in mining and quarrying, utilities and
community services. These industries largely fall within the domain of the public sector.
Since there is already an effort to downsize the role of the public sector, a decline of
employment in these industrial categories is obvious. Incomes in these sectors are in fact
salaries and with an implementation of the Fifth Pay Commission recommendations during
the late 90s, salary in this industrial category has increased. In mining, the decline in
employment could also have been accentuated because of the strict environmental
regulations and an increased focus on clean technologies. Strict environmental regulations
have in fact, caused the closure of many mining units. Again the focus on cleaner
technology, which essentially means a greater use of gas and oil-based technology rather
than coal, has discouraged the production of coal. As a matter of fact, coal is labour-
intensive while gas and oil is capital-intensive; so this substitution could also have caused a
decline of employment despite increase of income in mining.
The above discussion suggests that growth of employment in agriculture plateaued,
though agricultural income has grown during the period. Job-less growth in agriculture is on
account of value-added growth in this sector. A continuous process of transformation from
subsistence to a commercial mode of production in agriculture and livestock has also
contributed to this trend. Manufacturing, which is another source of employment growth,
was also insignificant in the rural sector in the 90s. Employment growth in the rural sector
was propelled by construction, trade, transport and business services. It is interesting to note
that employment intensity in these industrial categories also increased during the 90s. These
industrial categories however, account for only 11 per cent of rural employment; therefore
employment intensity in the non-agriculture sector could not increase during the 90s.
7
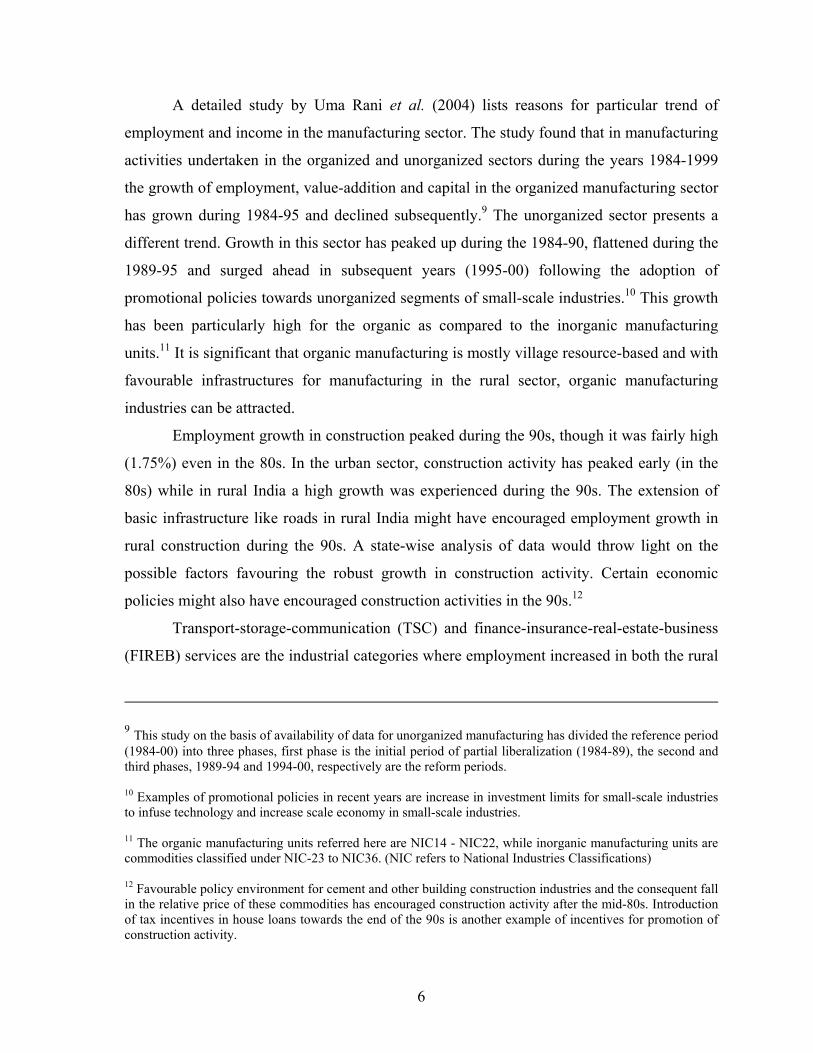
Rural Employment Trends in States The above discussion gives a comparative account of employment for major industries at the
aggregate level. Certain trends, which were evident at the aggregate level, may emerge
robust with the help of state-level information. Table 2 presents the share of different
industries in rural employment across states during the reference period (1983 and 1999-
2000). Table 2 shows that over a span of 17 years, the share of agriculture in rural
employment has declined by only 2 per cent at the aggregate level. There are mixed trends
from the states; the percent share of agriculture has not declined in the states of Andhra
Pradesh, Bihar, Karnataka, Madhya Pradesh, Maharashtra and Orissa. The reasons for non-
decline of rural employment in agriculture could be different for these states. In certain
states like Bihar and Orissa, a dearth of opportunity in the non-agricultural sector could have
pushed rural workers towards agriculture whereas in states like Maharashtra the pull factor
could have attracted the rural workforce in agriculture. These issues need further probing.
In the non-agriculture employment categories, manufacturing is the most important,
accounting for more than 7 per cent of rural employment in the country. With economic
development, one would expect manufacturing to become more important in the rural sector;
however there is only a marginal increase in its share during the reference period. The share
of manufacturing in rural employment has in fact declined in some states like Andhra
Gender Aspects of Rural Employment The gender dimension in rural employment has become important in recent decades
following growing concerns about the deteriorating status of females in a society. In all
major industrial categories, males dominate by accounting for around 70 per cent of rural
employment. The bulk of female workers are concentrated in agriculture, manufacturing and
community services. Table 3 therefore, presents a gender-wise proportion of rural workers
in these industrial categories for the important states of India. Like previous comparisons,
this state-wise information also spans the period between 1983 and 1999-00. It is evident
from Table 3 that approximately 30 per cent of the rural work force is female at all industry
levels. The corresponding share has increased marginally (0.5 per cent) at the aggregate
level during the reference period. Industrial category-wise gender proportions indicate that
females are concentrated more in agriculture followed by manufacturing and community
services. The proportion of females in these industrial categories has increased significantly;
by more than 2 per cent in agriculture and community services while less than 2 per cent for
manufacturing at the all India level.
Table 3 indicates that the trend in gender-wise employment in many states is
different from that of the country. In agriculture for instance, the proportion of females has
declined in Bihar, Madhya Pradesh and West Bengal. Amongst these in Bihar and Madhya
Pradesh the share of agriculture in rural employment did not decrease during the reference
period; this suggests that pressure on agriculture for rural employment is quite high and in
this kind of situation males are generally preferred over females for employment. This
reason does not hold good for West Bengal as this has experienced a spurt in agricultural
growth during the 80s, though this growth tapered off in subsequent years. Since
participation of females is often specific to particular agricultural operations any significant
change in the structure of agriculture and allied activity can also change woman’s share in
agriculture.
In community social and public services, though the share of females in rural
employment has increased at the aggregate level, the corresponding share has not increased
in the states of Assam, Haryana, Orissa and Rajasthan. These states barring Assam and
Rajasthan have registered a sharp decline in the share of CSP services in rural employment.
Since the bulk of employment in CSP services is under the organized sector, this is
12
considered better than many other employment categories for workers of similar
qualification. In this situation, competition for getting employed in this category increases
and probably males dominate in this competition since the difference between genders in
human development related statistics like literacy is sharper in these states.
In manufacturing, an increase in the share of females at the all-India level was
observed, the corresponding share declined in the states of Delhi, Goa, Haryana, Punjab,
Gujarat, Maharashtra, Karnataka and Himachal Pradesh. As many of these states have a
good road infrastructure, there is a possibility that urban manufacturing units are doing well
with the provision of cheap labour from the rural sector to these manufacturing units; while
males have it appears, some distinct advantages over females in commuting from rural to
urban places.
The share of females in the total rural employment has increased marginally during
the reference period. Many states in fact report a decline in the share of females in the total
rural employment; some of these states are Bihar, Madhya Pradesh, Rajasthan, Delhi, Goa,
Haryana and Kerala. These states present different reasons for a decline in the share of
female employment. The first group of states suggests push factors as possible reasons for a
decline in the employment share of females whereas the latter group of states suggests
urbanization and a high mobility of the work force as possible reasons for a decreasing share
of females in rural employment. The share of females in rural employment has increased in
relatively well-off states.
It must be noted that the proportion of females in the total rural employment has
increased (0.52%) marginally; though the corresponding share has increased significantly in
agriculture, manufacturing and community services. This difference in the temporal share of
females in rural vis-à-vis gender-wise important industrial categories like agriculture,
manufacturing and community services suggests that in rural India the share of females in
industries other than the above has declined. In this regard too, varying trends from different
states are present.
Quality of Rural Employment The quality of employment is as important as the quantity and in the rural sector disguised
unemployment is probably the most important issue while discussing the quality of rural
13
employment. The NSS data presents a comparative account of usually employed persons
and persons employed on the basis of current daily status (CDS) during a year; the
difference in the level of employment reveals disguised unemployment in the rural sector.
Disguised unemployment here means that persons employed on the basis of their
usual status are not getting employment for a sufficient number of man days to be termed as
employed on the basis of current daily status (CDS). Table 4 presents the per cent
distribution of usually employed persons by their broad CDS of employment. This
information is available separately for males and females in the rural and urban sectors of
India. The table indicates that out of one hundred usually employed rural males more than
10 per cent of rural males were either unemployed on the basis of CDS or are not in the
labour force during the year 1999-2000. A comparison of underemployment across
categories of workers in Table 4 suggests that underemployment is the highest for rural
females. It may be noted that women are often employed for specific agricultural operations
like harvesting, manual weeding, etc; women’s employment on these accounts may be less
frequent as compared to male and this is manifest as high disguised unemployment for
females.
The relative proportion of different categories of workers, self-employed, regular and
casual also explains the quality of employment. The present study assumes that with an
increase in the proportion of casual workers in the total work force, the quality of
employment decreases since social security measures for casual workers are less effective in
the country. Table 5 presents the per cent distribution of usually employed workers under
different categories of employment during the reference years. It is evident from the table
that in 1999-2000, in the rural sector, a large proportion of the male (54.4%) workforce is
self-employed, the group of casual workers is a distant second while regular employed
workers account for only a small proportion (9%) of the total workers and occupies the last
place. The urban sector presents a different picture, the regular employed is the most
dominant class of worker closely followed by the self-employed workers; casual workers are
the least important in terms of their proportions. Across gender, the problem of casualization
is more acute for females, especially, the rural female. A temporal comparison of
employment categories suggests that casualization, that is, the per cent of casual to regular
employed workers, is on the rise. Table 5 further shows that the proportion of self-employed
14
workers in the rural sector has declined while its share in the urban sector has increased
during the reference period. It must be noted that self-employed workers are associated more
with the own account enterprises; and in this context the above trend is important and
warrants further probing.
The quality of employment is often influenced by enterprise type, for instance, an
enterprise employing more than 20 workers is covered under the Factories Act, 1948 and
this Act to some extent protects employee’s interests. It may be noted that the quality of
employment is better for salaried workers, and the proportion of salaried workers increases
with the size of enterprises. Enterprise trends would generate more evidence about the
pattern of rural employment in the country.
There can be different ways of classifying enterprises. On account of social security
provisions for its workers, enterprises are of two types; one, organized sector enterprises
which include factories that have better social security provisions; while the unorganized
sector consists of smaller enterprise that are devoid of satisfactory social security
provisions.13 Enterprises classified on the basis of the number of persons hired are own
account enterprises (OAEs) and establishments. Again establishments identified on the basis
of number of people hired are Directory and Non-directory enterprises; these enterprises
vary on the basis of type of regulations. Enterprises can be further classified on the basis of
location namely; rural and urban; and type of activities being performed namely; agricultural
and non-agricultural enterprises. The present study discusses the trend in enterprises on the
basis of the above criteria. Enterprise-level information is obtained from the Economic
Census, and is available for the years 1980, 1990, and 1998. The Economic Census does not
include enterprises engaged in crop production and plantations.
Table 6 presents the distribution of agricultural and non-agricultural establishments
by size class of employment at the aggregate level. The table suggests that even in the rural
13 Enterprises on the basis of scale and applicability of social security provisions for its workers are of two types, organized and unorganized. The organized sector encompasses all the enterprises, which employ 10 or more workers with or without using power and 20 or more workers without using power. Enterprises, which employ workers less than the above numbers also require less mandatory social security provisions for its workers and are generally referred as the unorganized sector. The unorganized sector again depending on the number of workers it employs are of following categories; (i) OAMEs are the household-manned enterprise which at times may engage other family members to run the enterprises; (ii) NDMEs are the enterprises which employ up to five workers of whom at least one is hired; (iii) DMEs are those enterprise, which employ 6-9 workers with or without using power and 10-19 workers without using power.
15
sector, non-agricultural enterprises in terms of number of units and persons employed are
many times (12-18 times) higher than for agricultural enterprises. In the urban sector the
difference between agriculture and non-agricultural enterprises is even higher. As far as
distribution of enterprises according to the size-class of employment is concerned,
agriculture and non-agriculture enterprises are similar in both the sectors, rural and urban.
The difference between these enterprises becomes significant when the distribution of
employment in various size classes of enterprises is taken into account. In non-agricultural
enterprises, the concentration of employment is higher (33.6%) towards larger
establishments; this trend is more pronounced in the case of the urban sector. This particular
trend explains the presence of high regular / salaried workers in the urban sector.
The per cent share of non-agricultural enterprises and its trend during the last three
economic surveys 1980, 1990, and 1998 suggests a trend almost similar to that of the NSSO
quinquennial survey on employment. In rural enterprises, the per cent share of construction,
trade, transport and business services has increased, while the share of manufacturing
enterprises has declined in both the sectors (Jha 2005). Even though the number of
enterprises is on the rise, for the sake of quality of employment one would expect that the
average size of enterprises should grow. Data from the Economic Census however, do not
support this hypothesis (Jha 2005).
Pattern of Wages and Salaries The wages and salaries to some extent explain the productivity of labour in different sectors
and in the economy. The trend in labour productivity across industries and over the years
can be studied by comparing real wages in these sectors during different years. Thus, real
wages for an average illiterate employee by industry, sex and sectors for the selected years,
1987-88, 1993-94 and 1999-00 are presented in Table 7. The real wage is obtained by
dividing daily wage / salary as obtained from various NSS round surveys with the consumer
price index of agricultural workers (CPIAL) for the corresponding years.
Table 7 clearly shows that the average wage for a male worker is significantly higher
than that of the female worker for most of the industrial categories; this difference in wages
is at a maximum in the manufacturing sector. The wage difference appears to be related to
the differences in the productivity of male and female labour in these industrial categories. A
16
higher wage for female workers in certain employment categories as that of transport and
storage, agriculture in the urban sector may be ignored on account of the small sample size
for these specific categories of workers.
In rural India, the growth of real wages across industries suggests different trends.
This growth in real wages is based on three points of time, namely, 1987, 1993, and 1999.
Agricultural wages have grown at a faster rate as compared to the non-agriculture wages
during the first period (1987-93), whereas growth in non-agriculture wages has been higher
than agricultural wages during the later period (1993-99). This trend has probably a lot to do
with the real performance of the respective sectors during the reference periods. Several
indices related to agriculture suggest that performance of agriculture was better during the
earlier period. A comparison of real wages during the entire period (1987-99) suggests that
rural wages in agriculture, construction and trade doubled during the reference period.
Certain studies also report an abrupt increase in agricultural wages during the late 80s. A
relatively higher increase in real wages for these industrial categories might also have been
because of an abnormal base year (1987-88).14
A comparison of male wages between rural and urban sectors shows higher urban
wages for most of the industries. The real wage in the urban sector was significantly higher
than for the rural sector during the year 1993-94. This difference in wages was only
marginal for most of the industries during the year 1999-00. Given the general belief that
wages in the rural sector are low as compared to the urban sector, this trend is alarming. The
real wage for agriculture in the urban sector and that of non-organic manufacturing in the
rural sector is significantly higher than its counterpart during the year 1999-00. These
extreme cases may be ignored since the sizes of samples in these instances are too low.
Analysis of wages and salaries suggests that real wages have increased uniformly in
all the employment categories during the reference period (1987-1999). In most of the
employment categories, the real wage in the rural sector was significantly lower than for the
urban sector in the early 90s; the difference in wages between the rural and the urban sectors
has however tapered-off in non-agriculture employment categories during the year 1999-00,
negating the general belief that rural wages are significantly lower than the urban wages.
14 The year 1987-88 was a drought year and lower rural wages in this year on account of adverse weather conditions cannot be ruled out.
17
Table 3: Changing Proportion of Males in Rural Employment for Important
Industries across States in India
State Agriculture Manufacture CSP services Total rural
index (%) Female 1140.5 97.2 820.4 77.5 1332.4 77.3 1182.1 60.0Note: Casualization is per cent of casual workers to regular employed workers. Source: NSSO (2001). Table 6: Distribution of Agriculture and Non-Agriculture Establishments by
Size-class of Employment in Rural and Urban Sector in the Year 1998 Estab types & Sectors
Parameters Absolute numbers
One-two
Three-five
Six-nine
10-19 20 & above
Rural Est. units 3144 46.1 40.9 9.2 3.0 0.8 Agriculture Empl (US) 11504 21.6 41.0 17.3 10.1 10.1 Est. units 37923 60.0 28.2 8.3 5.1 2.6 Non-
Est. units 575 38.3 45.1 11.1 4.3 1.2 Agriculture Empl (US) 2447 16.4 38.9 18.0 12.4 14.2 Est. units 48089 39.7 39.5 10.9 6.2 3.7 Non-
agriculture Empl (US) 317088 11.0 21.8 11.6 11.8 43.8 Note: Economic Census (CSO, 2001). Table 7: Real wage / Salary Earnings for an Average Illiterate Employee by Industries, Sex and Sector (in Re. per day at 1986-87 price) Industry division Rural 1999 - 2000 Rural 1993 - 94 Rural 1987 - 88 Urban 1999 - 2000 Urban 1993
Note: Two districts representing high and low concentrations of rural non-farm employment in a state are selected. Subsequently, two village clusters, one near a rural town (within 3 km) and another away from the rural town (more than 10 km) are selected.
22
In order to investigate the possible determinants of rural non-farm employment
(RNFE); the RNFE per cent in selected states and districts are plotted separately with
agriculture income per hectare (PHAI), agricultural output per capita (PCAO), infrastructure
indices (INFI) in per cent and population density (PDS) per sq. km.15 In the above instances,
the observations, which depict RNFE as more than 40 per cent appear to be outliers for the
above sets of relationships. Even if we ignore these observations, a distinct relationship
between agricultural development and RNFE is not observed. This is so with both the
variants of agricultural development, per capita agricultural production and per hectare
agricultural income (see Figs 1 & 2). This trend is not in accordance with the theory of
15 Infrastructure index is the ratio of the infrastructure of individual district / state in relation to the country average. Various infrastructure facilities considered for calculating the index were villages electrified, railway route length per 100 sq km of area, surfaced and unsurfaced road per 100 sq km of area, gross irrigated area in per cent, bank branches and post office per lakh of population, telephone lines per 100 persons, primary school per lakh of population, hospital beds and primary health centres per lakh of popln. These indicators were grouped together conveniently as sectors. These sectors with their relative weight in parentheses are as follows: transport facilities (26), energy (24), irrigation facilities (20), banking facilities (12), communication infrastructure (6), educational institutes (6), health facilities (6). (Source: CMIE 2000).
In all four sets of specifications though, the adjusted R-square was not very high,
signs of the coefficients are along the expected line and also estimated coefficients for
variables other than agriculture are robust (significant at the 1 per cent level). It is interesting
to note that variables related to agriculture are the weakest determinants of rural non-farm
employment.16 Finally, equations 2 and 3 have been selected for the present discussion.
In a linear form of relationship, the infrastructure index is the most important
determinant followed by population density, both of these variables are significant at 1 per
cent. The importance of these variables in RNFE growth can be corroborated from certain
studies of the late 80s and 90s. These studies emphasize the role of infrastructure
development in increasing rural non-farm employment growth. Population density however
reflects the role of push or distress-related phenomenon in promoting RNFE. It is difficult to
accept that agriculture plays a lesser role in rural diversification.17 The issue of agriculture
and rural non-farm employment has therefore been discussed separately in the following sub
section.
16 In the linear specification, the PHAO is significant at the 18 per cent level whereas in log-linear specification, the PCAO is significant at a 13 per cent level of significance only. 17 It may be noted that data set for these estimations are different; in time period analysis for years 1983, 1993-94, 1999-00 employment data is on CDS basis and is sourced from the NSSO; while in previous estimations or equations presented above, the employment data is based on census data and involves a cross section of data from states and districts.
24
FigProduction
0
10000
20000
30000
40000
50000
0 20 40 60 80 10
RNFE in per centValue of prodn (Rs/hect)
Fig 2.3
0
50
100
150
200
0 20 40 60 80 10
RNFE in per cent Infrastructure developmentindex
Fig 2.4: y
0200
400600
8001000
1200
0 20 40 60 80 10
RNFE in per centpopln density per sq km
Fprodn.
0100020003000400050006000
0 20 40 60 80 10
RNFE in per cent Value of agril prodn(Rs/capita)
0
ig 2.1: Rural Non-farm Employment (RNFE) and Per capita Agril. Fig 4: Rural Non-farm Employment (RNFE) and Per Capita Agril. Prodn.
0
Rural Non-farm Employment and Population DensitFig 3: Rural Non-farm Employment and Population Density
0
: Rural Non-farm Employment and InfrastructureFig 2: Rural Non-farm Employment and Infrastructure
0
2.2: Rural Non-farm Employment and Agricultural Fig 1: Rural Non-fram Employment and Agricultural Production
25
Agriculture, Rural Non-Farm Employment and Poverty
In India, the land-man ratio is decreasing, employment elasticity in agriculture has not only
declined but has reached almost zero. In this situation, the rural non-farm sector is generally
perceived as the answer for tackling the twin problems of employment and poverty in rural
India. From this perspective, the determinant of employment in the rural non-farm sector has
been assessed. A review of contesting explanation/hypothesis in the detailed studies about
the determinants of rural non-farm employment growth, is presented nicely in Unni (1997).
Of all the hypotheses, one which is of particular interest for the present discussion, is the
agriculture-led growth of the non-farm sector proposed by Mellor (1978). He argues that
rural diversification in India is the outcome of technology-induced growth in the agricultural
sector.
Mellor (1978) illustrates the presence of production and consumption linkages of
agriculture with the non-farm sector. On the production side, a growing agriculture requires
inputs of fertilizer, seeds, herbicides, pumps, sprayers, equipment and repair services either
produced or distributed by non-farm enterprises. Increased agricultural output in a forward
direction also stimulates milling and processing activities. The consumption linkage in
agriculture arises when growing farm income boosts demand for basic consumer goods. This
linkage increases over time as rising per capita income (PCI) induces diversification of
consumption spending into non-foods. Much of the overall increase in demand for inputs,
services, distribution and many basic consumer goods can be serviced by firms in the rural
areas and towns, though heavy production inputs and consumer durables are more likely to
be produced in bigger manufacturing units in large cities. Researchers have also found a
third important link between agriculture and the rural non-farm sector, Hossain (1988)
termed it as the labour market interaction effect. Hossain (1988) argues that rising
agricultural wages in rural areas in particular raises the opportunity cost of labour in non-
farm activities. This induces a shift in the composition of non-farm activity from labour-
intensive, low-return activities to more skilled high investment - high return activities. The
rising agricultural productivity is thus instrumental in inducing a structural transformation of
the rural non-farm economy.
This process of growth in the rural non-farm sector is evident from the state of
Punjab where the dependence of labour on agriculture decreased substantially following
26
technology-led growth in agriculture. Transformation of the non-farm sector in Punjab
presents a similar example. Increased demand for agriculture labour has resulted in higher
farm wages, which led to a decline in low return household manufacturing and a parallel rise
in high return modern small factories and service industries (NHHI). As this generally
happened in towns with a rural vicinity, it resulted in the urbanization and growth of the
non-farm sector.
The above phenomenon prevalent in Punjab is not evident in many other parts of the
country due to reasons that are wide and varied. As a matter of fact technology-led growth in
agriculture was witnessed across a restricted part of the country only in the decade of 80s.
This growth in agriculture, unlike that in the Punjab, does not appear to have given enough
impetus to rural manufacturing activities in other states. To find the reasons for this setback
it is necessary to discuss the assumptions in the Mellor hypothesis. Agriculture-led growth
as propounded by Mellor and a few others presumes at least two necessary conditions; first,
close linkage between the agriculture and the non-agriculture sector as it holds in the
relatively closer village economy; second, impending conditions for the non-farm sector to
take-off.
The closeness of the village economy is viewed as the flow of agriculture income in
terms of rural vis-a-vis urban sector produced items. It assumes that the expenditure of a
large part of the agricultural income on items manufactured in the rural sector would
promote non-farm activities in the rural sector. It appears that with the opening up of the
economy, leakages in the rural economy, which were significantly high even in the mid-80s,
have increased further.18 Some of the possible reasons for the same may be; first, with trade
liberalization the importance of imported products increased in the rural consumption
basket, which discouraged domestic and village-based products; second, with the media
spread impact of advertisements, rural consumption of these goods increased. Small and
scattered rural manufacturing units cannot afford to spend a significant amount in
advertisements and are again losers.19 Third, an uncertain policy environment for small-scale
18 Harris et al (1984) reported a gradual decrease in the relative importance of goods manufactured in rural centres in the consumption basket of rural consumers. 19 The small manufacturing units suffer from scale-diseconomy in relation to advertisement and similar sales promotion schemes unless they conglomerate together as in the case of Lizzat papad.
27
industries discouraged its growth; a significant proportion of such industry is located in the
rural sector, so that rural manufacturing is thus discouraged.
Agriculture-led growth of the non-farm sector also presumes ‘impending conditions’
for growth of sectors other than agriculture. Impending conditions are nothing but the
public-good or over-head capital or infrastructure required for promotion of rural
manufacturing and similar other non-farm activities. In the 90s, rural infrastructure already
in a dilapidated condition has experienced a further disadvantage in that assured power and
telecommunication is missing. Nevertheless, Vyas et al, (1978) argue that skewed income
gains in agriculture limited consumption linkages while inadequate rural infrastructure
limited the ability of rural firms to supply the modest increase in input and consumer
demands.
The relationship between agriculture (AGRI) and rural non-farm employment
(RNFE) is formalized by regressing agricultural performance as measured by agriculture
income (Rs. per hectare of cultivable land) on rural non-farm employment (per cent of
RNFE in total employment) in states for reference years, namely, 1983, 1993-94, 1999-00
(See Anx Box I). The R-square values and elasticity coefficients suggest that the
relationship between agriculture and rural non-farm employment is quite strong; though the
strength of this relationship reduced over the years. The decreasing role of agriculture on
rural diversification is in accordance with the overall trend in studies related to determinants
of rural non-farm sector growth.
The above discussions suggest an alternate pattern of growth in rural employment.
Such an alternate growth pattern has different implications for a region and also for the
welfare of the workers in the region. Though welfare is too subjective a term, poverty as
measured by persons below the poverty line is considered as an indicator of welfare for the
present discussion. An attempt has been made herewith to understand the welfare
implications of employment growth in the rural sector. Some of the important determinants
of the quantity and quality of rural employment in states are observed for association with
the incidence of poverty in the rural sector (See Anx Table 2). The important determinants
for rural employment considered for the present comparison are agriculture performance as
measured by the per hectare agricultural income, labour productivity as measured by the per
worker agricultural income, real wages in agriculture, and pressure on land. Employment in
28
the rural non-farm sector is also important from the perspective of quantity and quality of
rural employment in the country. Association between these variables and the incidence of
rural poverty in states are computed for the three reference years frequently used in the
paper; the same is presented in Box III.
Though the effect of agriculture performances on rural employment has decreased
over the years, it remains an important determinant of rural poverty following Ahluwalia
(1978). The correlation coefficients as presented in the box have the expected sign, but the
coefficients are not significant at even 10 per cent levels of significance. The productivity of
labour is undoubtedly an important indicator of rural welfare since Lewis (1954) and others
view that the tenet of rural development rests on surplus in agriculture. Surpluses and labour
productivity in agriculture are concepts with similar connotations. The association between
labour productivity in agriculture and the incidence of rural poverty is significant at five per
cent only. The negative sign suggests that states with higher labour productivity in
agriculture have a lower incidence of rural poverty. This is quite plausible. Another similar
indicator of the quality of rural employment, that is, real wages in agriculture also has
similar results. It is however, interesting to note that the association between real wages in
agriculture and rural poverty in states has weakened during the 90s. The correlation
coefficient significant at 1 per cent in the year 1983 remained significant at 10 per cent only
during the 90s. It may be noted that the growth of real wages in agriculture towards the end
of the 90s was not duly supported by the real factors in agriculture. The labour-land ratio,
which reflects a distress-like situation in agriculture and the rural sector, has not affected
rural poverty significantly, though the positive sign of the coefficient is on expected lines.
The association between non-farm employment and rural poverty was not significant in the
early 80s; this coefficient however emerged significant (at 10 per cent) in the 90s.
A comparison of changes in the above indicators (agriculture performance, labour
productivity, real wage, non-farm employment) with the incidence of rural poverty is needed
in an assessment of the welfare implications of growth in rural employment; the
corresponding figures are presented in Annexure Table 2. The last four columns of the table
show a decline in persons below the poverty line during the reference periods at the
aggregate and also at the sectoral levels in states. The larger the decline in negative values
the better is the rural poverty situation in the state during the reference period. Poverty at the
29
aggregate level or at the level of the specific sector has declined for all the states during both
the decades (1980s and 1990s). Though poverty estimates of 55th round is not strictly
comparable with the poverty estimates of 50th round and 55th round; 20 some of the states that
show a relatively larger decline in rural poverty during 1990s are Himachal Pradesh (HP),
Haryana, Karnataka, Kerala, Maharashtra; whereas, states showing a lower decline in rural
poverty are Orissa, Madhya Pradesh, Andhra Pradesh and Assam.
On the basis of information in the Annexure Table 2, the correlation between growth
in various indicators of rural prosperity and decline in rural poverty during 1980s and 1990s
is presented in the Box III. One would expect a positive relationship between these
variables, the signs of coefficients have however varied for most of the indicators barring
real wage. It may be noted that the negative sign of the correlation coefficient is more a
statistical problem. The negative relationship reflects that a higher value of an indicator for
example, agriculture growth, is associated with a lower value of decline in rural poverty
during a decade. Since decline in rural poverty during the reference period is a negative
term, the lower value in actual fact reflects a higher decline in rural poverty, that is persons
below the poverty line. Thus, the negative coefficient shows a positive association between
growth in agriculture and the status of rural poverty in the country.
Box III: Correlates of Rural Poverty across States
Correlation Coefficients between Incidence of Rural Poverty / Decline inRural Poverty and Levels / Growth in respective indicators
Indicators 1983 1993-94 1999-00 1980s 1990s Agriculture performance -0.11 -0.22 -0.35 0.56 -0.57 Labour productivity in agl. -0.62 -0.55 -0.62 0.06 -0.54 Real wages in agriculture -0.68 -0.48 -0.49 -0.58 -0.02 Labour-land ratio 0.34 0.47 0.36 -0.48 0.01 Concentration of RNFE -0.24 -0.54 -0.46 0.30 -0.04 Note: The 2nd , 3rd and 4th columns shows correlation coefficients between incidenceof rural poverty and levels of the respective indicators, whereas the 5th and 6th columnfigure is obtained with decline in rural poverty and growth in respective indicators.At n=15, significant correlation coefficients with levels of significance in parenthesesare 0.65 (at 0.01%), 0.52 (at 0.05%) and 0.44 (at 0.10%).
20 The NSSO in Round 55 (1999-00) made a major deviation in the technique it had been using to establish household consumption levels in terms of the reference periods used. For consumption of food and similar items the reference period used in the 55th round was 'past week’ instead of ‘past thirty days’ though the reference period for certain other non-food items remains ‘past 365 days’. Due to difference of reference period Round 55 obtained higher consumption level, especially for lower-income households and lower levels of poverty during the year 1999-00.
30
The strength of this relationship as is apparent from Box III is not very strong. The
correlation coefficient between agriculture performance and rural poverty is more than 0.5
per cent during both the periods. Signs of the above coefficients are however different; a
positive association between agriculture performance and decline in rural poverty during the
1990s is as per expectation. The above association during the 80s was however negative
(positive sign for correlation coefficient); the underlying implication is difficult to accept
since agricultural growth during the 80s is largely acclaimed for its better distribution across
space and persons (Bhalla et al 1997). The changing signs also show inconsistency in
relationships with variation in the data set. It is difficult to establish a relationship between
changes in two variables; in that sense such inconsistency is not unfounded.
The association of rural poverty with wage and labour productivity in agriculture is
significant in alternate decades, the 80s and 90s, respectively. It is interesting to note that
whenever the coefficients are significant, the sign (negative) is also on expected lines.
Growth of real wages and labour productivity in agriculture had a positive influence on
decline in rural poverty. Most astonishingly, the growth of non-farm employment and
decline in rural poverty was not associated; though a weak relationship is evident during the
80s. It is difficult to accept that growth of non-farm employment is not associated with a
decline of rural poverty during the 90s. It may be that ‘growth’ and ‘decline’ in respective
parameters and poverty levels are not associated, though non-farm employment and rural
poverty is. This may be true with some other estimates of the box as well. Nevertheless, a
decline of rural poverty during the 90s has in fact initiated a whole range of issues in the
debate on rural poverty estimates.
In a nutshell, the regression analysis to find the determinants of rural non-farm
employment show that the infrastructure index is the most important determinant followed
by population density; both of these variables are significant at the 1 per cent. It is however,
difficult to accept that agriculture plays a lesser role as compared to the above parameters of
rural diversification.21 The issues of agriculture and rural non-farm employment growth
when discussed separately during the reference years show a decreasing role of agriculture 21 It may be noted that data set for these estimations are different; in the time period analysis for years 1983, 1993-94, 1999-00 employment data is on CDS basis and is sourced from NSSO; while in previous estimations or equations presented above, the employment data is based on the census data and involves a cross section of data from states and districts.
31
in rural non-farm employment growth. The changing role of these determinants on rural
diversification has different implications for rural welfare. The present study considers the
incidence of rural poverty as an estimate for the level of rural welfare in the states. The
welfare implications of the nature of growth of rural employment has been assessed by
computing the correlation coefficient between the incidence of rural poverty and some
indicators of the quality and quantity of rural employment in the country. Association
between the indicators (agriculture performance, labour productivity, real wage, non-farm
employment) of rural employment and the incidence of rural poverty during the reference
years is along expected lines; though association between changes in these variables during
the reference periods is not very consistent and the same may be ignored. Labour
productivity and wages in agriculture have a significant impact on rural poverty
emphasizing the importance of agriculture-induced rural diversification in declining the
rural poverty of the country.
IV. RURAL DIVERSIFICATION: SOME MICRO-EVIDENCES
The previous section shows that infrastructure and population density are the most important
determinants of rural diversification. The kind of impetus these factors provide to rural
diversification is not alike. The consequent impact of development- or distress- related rural
diversification on the welfare of workers would also be different. These processes of rural
diversification in the rural sector have been studied by means of household-level
information as collected by researchers in the Agro-economic Research Centres (AERC) and
coordinated by the present investigator. Selection of households involves multi-stage
stratified random sampling. In the states, districts with either high and low concentrations of
rural non-farm employment are selected since the kind of rural diversification is supposed to
be different in the extreme districts of a state. As urbanization encourages non-farm
employment growth in the surrounding rural areas, in each district two village clusters based
on proximity to a rural town, are selected.22 In other words, the present study expects
different kinds of rural diversification in villages near and away from a town. Finally, in a
22 The proximity of village clusters to rural town is determined with its distance from rural town by road; village cluster within 3 km of rural town and more than 10 km away from rural town were chosen in each district.
32
state there are four village clusters in two districts; and from each cluster 30 households are
selected to study the process of rural diversification.
The level of wages / salaries for rural non-farm activities in different village clusters
may suggest development or distress-led phenomenon in rural diversification. Other possible
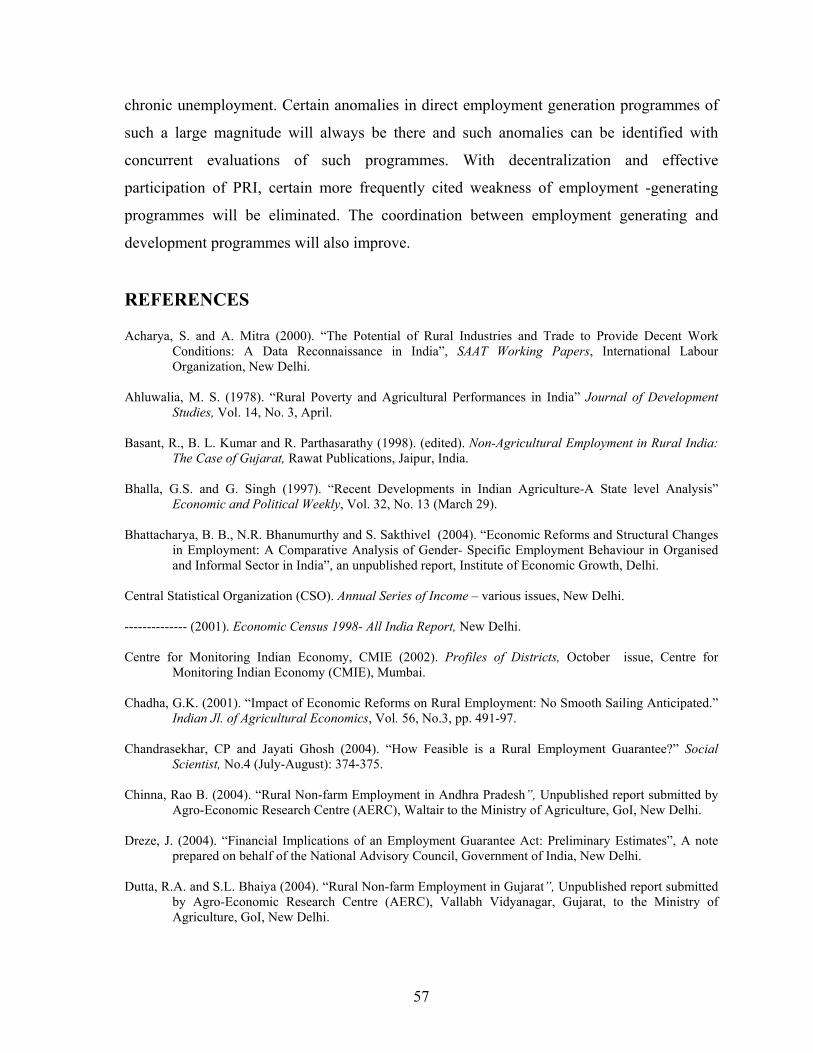
indicators for this purpose may include the average number of economic activities for a
worker. The available literature suggests that with an increase of penuries the number of
activities undertaken by an average worker increases. The presumption is that only after
performing many less remunerative casual jobs, does the family income of wage-earners
become sufficient to meet the household expenses.
The NSS data suggest that a significant proportion of rural workers are willing to
undertake more than one activity and one of the most important reasons for the same as per
the survey is to supplement their existing levels of income (for details, see Annexure Table
3). The number of economic activities recorded for an average worker suggests the influence
of distress - related factors. A relatively higher number of economic activities in low-RNFE
concentrated districts by and large support the above hypothesis. In some of the progressive
states like Gujarat and Maharashtra also, the average number of economic activities is high
in village clusters that are near as well as away from the rural town. In the above example,
the large numbers of economic activities are associated with the economic prosperity of the
region. The average counts of economic activity thus reflect opportunities as well, though
this is widely perceived to represent distress-related situations. In the extreme situation,
there are also instances of village clusters too poor to provide any profitable employment
opportunity for rural workers (for details, see Jha 2005).
The average counts of economic activity by itself does not explain distress- related
phenomenon, since in an extremely poor region sufficient remunerative economic
opportunities may not present themselves for workers to supplement their income with. In
this context, the average wage / salary for workers and the average employment of casual
workers in man-days can be some possible indicators that reflect the process of rural
diversification.
The average salary for salaried workers in different industrial categories is presented
in Table 8, while the salary is presented separately for villages near and away from a rural
town in the extreme districts of the state. It is apparent from the table that salary is generally
33
low for a worker in agriculture and its allied activity. In this context the evidence from
Maharashtra and Tamilnadu is different. In Maharashtra, the performance of horticulture-
based crops has been good in the 90s as value additions for these crops in the recent decade
have been quite high and so also is the marginal productivity of labour and the salary of the
agriculture worker in this state. A higher wage for agriculture workers in Tamilnadu during
the early years of this decade (2002-03) is largely because of the scarcity of agriculture
workers in the rural settings. The salary in certain employment categories is abnormally high
in some states / districts / villages. These abnormal figures may be ignored or interpreted
with caution, as the small size of the sample may be the reason responsible for this.
A comparison of salary across the non-agriculture industrial groups suggests that the
salary is high for workers in manufacturing as compared to the services sector (transport,
storage and communications). Salary is even lower for the construction workers. Salaried
workers in construction are generally less-skilled labour, who help the skilled mason;
whereas, the mason is generally self-employed in his own establishment. In non-agriculture
industrial categories, salaries are particularly high in Haryana and Punjab. In manufacturing,
a certain trend in salary for workers in villages near and away from the town is evident. The
salary is generally high for workers near the town as compared to the workers away from the
town. This is in accordance with the previous finding that as one moves away from rural
town, the distress-related process of rural diversification increases in many regions of the
country.
The average daily wages for casual workers in different industrial categories as
obtained in the AERC survey is presented for selected states in Table 9. It is interesting to
note that unlike salary, wages for the casual worker in agriculture is as high as in any
industrial category. The spatial trend in wages for casual workers in non-agriculture
industrial category by and large support the regional trend in salaries. The average wage in
the state of Haryana is higher than for many other states. There are reasons for higher wages
in this state. In manufacturing, the wages for workers vary across the states; some of the
disparity in wages is also on account of the wide and varied nature of manufacturing
activities (processing, services, repair, etc.,) and also the possibility of their differential
proportion in the AERC samples of different states. In retail trade and services also, wages
vary widely across states. Construction is the one employment category where the average
34
wage is high in all the states. It may be noted that construction, unlike many industrial
categories, is demand driven and the higher wages in this category are expected.
Even in a single state, the wage rate varies across selected districts and village
clusters. By and large, wages in village clusters away from a rural town are lower than in the
village clusters that are near towns. A marginal difference in wages between these villages
may be attributed to differences in the cost of living; yet, a relatively higher difference in
wages between these villages is perplexing. This disparity in wage suggests distress-led rural
diversification in villages away from rural towns. It is interesting to note that in
agriculturally prosperous districts like Mehsana, East Godavari, the disparity in wages
across village clusters is minimal. The trend from the above districts suggests that
agriculture-induced development of a region has better spatial spread across the region. This
at least is apparent from the wages of the agriculture workers.
For casual workers, the average employment in a year is as important as the wage
since a combination of both determines the average income of the casual worker, which is so
closely associated with the well-being of such a worker. The average employment of casual
workers in man-years for the agriculture year 2002-03 is presented in Table 10. A perusal of
the table indicates that an average employment of more than 60 per cent days in a year is
observed in Tamil Nadu, West Bengal, Himachal Pradesh. The average employment for
casual workers is particularly low in Gujarat and Madhya Pradesh. This indicates distress-
related employment diversification in the rural sector of the latter group of states.23 In this
context, the average employment in certain states like Bihar, which is showing symptoms of
distress-related phenomenon, is not very low; there is a possibility of workers involved in
some less remunerative work in this state.
Across industrial categories, the average employment is low for activities other than
construction work. The average employment in the manufacturing sector was interestingly
low, though manufacturing is generally perceived as a skill-intensive activity and the worker
/ entrepreneur are supposed to be engrossed with their enterprises, which are generally own
account enterprises. The average employment trend in these industries suggests that
23 A very low average employment in Madhya Pradesh is expected; but not in Gujarat since this is a relatively prosperous state. It may however be noted that prosperity in Gujarat is more on account of the robust manufacturing industry largely located in the urban sector.
35
disguised unemployment is not evident in the case of agriculture alone but that this is now
spreading to other non-agriculture industries as well.
The employment status of workers, that is, employee employed as self-employed /
salaried / casual worker, in an enterprise is one of the most important determinants of
employment quality, since this determines the social security provisions of the workers. It
may be noted that the NSS employment data at the aggregate level does not reflect the
industry-wise employment status of workers. In this context the AERC information is
important as this presents the employment status of workers in different industries in a
sample village (see Annexure Tables 5A and 5B).
The employment status of workers may also be influenced by development- or
distress-related phenomenon. Development-induced rural diversification is supposed to
encourage bigger enterprises and the proportion of salary workers should be higher in this
situation; whereas, in distress-led employment diversification the concentration of self-
employed and casual workers would be higher. The employment status of workers across
industries in selected states of the country based on the AERC sample-design suggests that
agriculture and construction are dominated by self-employed and casual workers, whereas,
in trade and hotels the proportion of self-employed and salaried workers is high. In
transport, storage and communication, the proportion of salary earners is high (see Annexure
Tables 5A & 5B).
Employment status in manufacturing displays a definite trend across states. In states
where the status of manufacturing or non-household industry (NHHI) is good as in
Maharashtra, the proportion of salaried workers is high, while in states with a not-so-good
state of manufacturing or NHHI as in Bihar, the per cent of self-employed worker is high.
This evidence accords with our hypothesis that development-induced rural diversification
leads to bigger enterprises and higher proportions of salaried workers. It may be noted that
salaried workers have better social security measures. The results from AERC survey
unfortunately do not show any pattern to suggest the effect of village locations on the status
of employment (for details, see Jha 2005).
36
T
able
8: A
vera
ge S
alar
y (R
s per
mon
th) d
urin
g th
e ye
ar 2
002-
03 fo
r W
orke
rs in
Spe
cific
Indu
stri
al C
ateg
ory
in S
ampl
e V
illag
es in
Sel
ecte
d St
ates
of I
ndia
K
arna
taka
M
ahar
asht
ra
And
hra
Prad
esh
Guj
arat
Bih
arIn
dust
rial
cat
egor
y c1
011 c
1015
c102
3c10
27c1
111c
1115
c112
3c11
27c1
211c
1215
c122
3c12
27 c1
311
c131
5c1
323
c132
7c1
511
c151
5c1
523
c152
7A
gric
ultu
re
30
00 2
000
1150
8208
5000
1333
300
1000
1350
12
0057
0
465
625
375
Man
ufac
turin
g, e
tc.,
3000
400
0
1200
3250
1950
1500
944
1000
2142
207
017
1536
1413
9613
6092
587
50
Con
stru
ctio
n
80
0 12
0030
0018
0012
00
1025
740
920
Trad
e &
hot
els
6000
545
0
15
0015
0010
00
17
5010
00
1208
1208
1430
1160
Tran
sp+s
tora
g+co
mn.
25
0033
0012
00 2
200
3250
3000
2833
2166
1156
1104
1275
2325
220
0
1940
1750
1350
1120
H
arya
na
Mad
hya
Prad
esh
Tam
ilnad
u W
est B
enga
l In
dust
rial
cat
egor
y c1
611
c161
5 c1
623
c162
7c1
811
c181
5c1
823
c182
7c1
911
c191
5 c1
923
c192
7c2
211
c221
5c2
223
c222
7A
gric
ultu
re
1897
2617
6000
7000
4500
4000
1200
12
50
Man
ufac
turin
g, e
tc.
5601
3964
5771
8751
2100
2100
5000
8000
6000
4500
20
0015
0018
00C
onst
ruct
ion
3375
4251
27
90
40
0030
0015
00Tr
ade
& h
otel
s
71
5148
3450
0110
0013
5050
055
0055
0065
0067
5010
0015
00Tr
ansp
+sto
r+co
mn.
5030
2850
1600
2600
1750
1500
1500
7000
5500
4500
7000
1950
2500
2125
1900
Not
e: In
the
4 di
git c
ode,
firs
t tw
o di
gits
indi
cate
stat
e as
pre
sent
ed in
the
Box
II,
third
dig
it (1
) and
(2) p
rese
nt h
igh
and
low
RN
FE d
istri
cts,
resp
ectiv
ely;
whi
le
the
four
th d
igit
depi
cts
villa
ge c
lust
ers
near
and
aw
ay f
rom
tow
n (1
) an
d (5
), re
spec
tivel
y in
hig
h R
NFE
dis
trict
s, w
hile
(3)
and
(7)
in lo
w R
NFE
dis
trict
s. (S
ourc
e: A
ERC
Sur
vey)
37
Tab
le 9
. Ave
rage
Wag
es (R
s per
day
) dur
ing
the
year
200
2-03
for
Cas
ual W
orke
rs in
Spe
cific
Indu
stri
al C
ateg
ory
in S
ampl
e V
illag
es
in S
elec
ted
Stat
es o
f Ind
ia
Kar
nata
ka
And
hra
Prad
esh
G
ujar
atB
ihar
Indu
stri
al c
ateg
ory
c101
1 c10
15 c1
023
c102
7c1
211
c121
5c1
223
c122
7 c1
311
c131
5 c1
323
c132
7c1
511
c151
5 c1
523
c152
7A
gric
ultu
re
83.0
57
.0
61.0
55
.0
62.0
50.0
56.0
60.0
63
.0
67.0
36
.0
90.0
46.0
39.0
41
.036
.0M
anuf
actu
ring,
etc
.
50.0
25.0
73.0
50.0
35.0
70
.061
.030
.065
.040
.038
.074
.063
.057
.048
.0C
onst
ruct
ion
89.0
58
.098
.050
.073
.070
.065
.055
.069
.010
0.0
100.
050
.011
5.0
90.0
104.
087
.0Tr
ade
inc.
hot
els
70.0
32
.0
38.0
30
.0
61
.058
.043
.0
49.0
44.0
Ttra
ns+s
tor+
com
n.
50.0
59.0
0.0
25.0
42.0
40.0
60.0
50.0
70.0
60.0
42
.036
.037
.034
.0
H
arya
na
Mad
hya
Prad
esh
Utt
ar P
rade
sh
Indu
stri
al c
ateg
ory
c161
1 c1
615
c162
3 c1
627
c181
1c1
815
c182
3c1
827
c201
1 c2
015
c202
3 c2
027
Agr
icul
ture
11
8.0
113.
0 84
.0
75.0
42.0
36.0
37.0
35.0
50
.0
50.0
27
.0
27.0
Man
ufac
turin
g, e
tc.
122.
0 12
3.0
90.0
60
.027
.032
.0
67.0
25
.0
C
onst
ruct
ion
76.0
80
.0
104.
0 14
5.0
70.0
67.0
66.0
93.0
62
.0
98
.031
.0
22.0
Trad
ing
inc.
hot
els
128.
0 72
.030
.0
30.0
98.0
Tr
ans+
stor
+com
n.
83.0
82.0
0.0
0.0
105.
080
.087
.070
.053
.023
.022
.0
Tam
ilnad
u W
estB
enga
lIn
dust
rial
cat
egor
y c1
911
c191
5c1
923
c192
7c2
211
c221
5c2
223
c222
7A
gric
ultu
re
56.0
58
.0
50.0
60.6
45.0
40.0
45.0
40.0
Man
ufac
turin
g, p
ro, s
er &
rep
61.5
50
.8
85.2
10
2.9
75
.0
80
.0
Con
stru
ctio
n 81
.6
141.
084
.5
89.6
60
.055
.0
60.0
Tr
ade
inc.
hot
els
62.2
50.5
45.0
50
.0
50.0
Tran
s+st
or+c
omn.
47
.150
.752
.460
.055
.055
.065
.0 N
ote:
In th
e 4
digi
t cod
e, fi
rst t
wo
indi
cate
stat
e as
in th
e B
ox II
, the
third
dig
its (1
) and
(2) p
rese
nt h
igh
and
low
RN
FE d
istri
cts,
resp
ectiv
ely,
whi
le
four
th d
igit
depi
cts
villa
ge c
lust
ers
near
and
aw
ay f
rom
tow
n (1
) an
d (5
), re
spec
tivel
y in
hig
h R
NFE
dis
trict
s, w
hile
(3)
and
(7)
in
low
RN
FE d
istri
cts.
38
Tab
le 1
0: A
vera
ge E
mpl
oym
ent i
n M
an-y
ears
for
Cas
ual W
orke
rs in
Spe
cific
Indu
stri
al C
ateg
ory
in S
elec
ted
AE
RC
Sur
veye
d St
ates
of I
ndia
in th
e ye
ar 2
002-
03
Kar
nata
ka
And
hra
Prad
esh
Guj
arat
Ass
amH
arya
naIn
dust
rial
cat
egor
y c1
011 c
1015
c102
3 c10
27c1
211c
1215
c122
3c12
27c1
311c
1315
c132
3c13
27 c2
111c
2115
c212
3c21
27c1
611
c161
5 c1
623
c162
7A
gri.
& a
llied
act
ivity
0.5
4 0.
53
0.44
0.
220.
470.
680.
540.
470.
190.
090.
160.
27
0.49
0.46
0.52
0.55
0.60
0.61
0.
55
0.51
Man
ufac
turin
g, e
tc.
0.71
0.36
0.41
0.31
0.55
0.
820.
320.
240.
160.
140.
310.
410.
440.
450.
470.
580.
520.
630.
54C
onst
ruct
ion
0.62
0.
510.
450.
460.
660.
620.
630.
740.
380.
390.
400.
390.
900.
500.
490.
48Tr
ade
and
hote
ls
0.
51
0.55
0.
47
0.29
0.48
0.77
0.82
0.74
0.40
0.46
Tran
s+st
or+c
omn.
0.
390.
580.
000.
270.
820.
630.
270.
550.
590.
740.
710.
700.
670.
500.
69
A
ggre
gate
ave
rage
0.
550.
500.
350.
310.
620.
640.
570.
520.
220.
120.
150.
390.
550.
550.
550.
510.
640.
580.
520.
50
M
adhy
a Pr
ades
h U
ttar
Pra
desh
T
amiln
adu
Wes
t Ben
gal
Indu
stri
al c
ateg
ory
c181
1 c1
815
c182
3 c1
827
c201
1c2
015
c202
3c2
027
c191
1 c1
915
c192
3 c1
927
c221
1c2
215
c222
3c2
227
Agr
i. &
alli
ed a
ctiv
ity
0.
370.
30
0.31
0.
270.
560.
440.
320.
570.
88
0.82
0.79
0.
71
0.62
0.53
0.55
0.54
Man
ufac
turin
g, e
tc.
0.
32
0.29
0.
600.
220.
86
0.81
0.48
0.
45
0.69
Con
stru
ctio
n 0.
50
0.31
0.45
0.41
0.41
0.52
0.39
0.44
0.74
0.70
0.43
0.70
0.80
0.56
0.55
Trad
e an
d ho
tels
0.55
0.55
0.
55
0.
790.
78
Ttra
ns+s
tor+
com
n.
0.
580.
330.
570.
490.
470.
680.
450.
840.
78
0.75
0.82
0.78
Agg
rega
te a
vera
ge
0.44
0.31
0.47
0.38
0.48
0.51
0.40
0.49
0.82
0.78
0.65
0.65
0.71
0.64
0.65
0.54
Not
e: I
n th
e 4
digi
t cod
e, f
irst t
wo
digi
t ind
icat
e st
ate,
third
dig
it (1
) an
d (2
) pr
esen
t hig
h an
d lo
w R
NFE
dis
trict
s, re
spec
tivel
y w
hile
the
four
th d
igit
depi
cts
villa
ge c
lust
ers n
ear a
nd a
way
from
tow
n (1
) and
(5),
resp
ectiv
ely
in h
igh
RN
FE d
istri
cts w
hile
(3) a
nd (7
) in
low
RN
FE d
istri
cts.
39
In brief, the above discussions show that employment diversification in the rural
sector even though slow is the result of diverse factors, grouped together as pull- and -push
related factors; these result in development or distress induced diversification. The
development- or distress- related rural diversification is location specific. Though there can
be various reasons for this process, the study shows that demographic pressure with limited
resources generates a push force, whereas a high infrastructure base creates pull forces for
employment diversification. The alternate situation can be distinguished however on the
basis of average wage / salary to workers, average days of employment in a year, number of
economic activities undertaken by an average worker. The average wage and salary directly
reflects the economic condition of the worker and is the most comprehensive indicator of
development- and distress- related diversification in the rural sector.
The other two indicators considered in the present study, namely, the average
number of days employed and number of economic activities undertaken, may be inferred
cautiously. The number of economic activities a worker has undertaken is said to indicate a
distress- related situation in rural diversification; at times this also reflects opportunity for
workers in a region. The AERC survey in combination with the NSS secondary information
breaks the general perception that agriculture is the only residual sector. Now there are
evidences of trade especially, retail trade and services emerging as a residual sector in
certain parts of the country. Increased fragmentation of land has made agriculture less
viable, whereas, increase in rural literacy encourages people to undertake trade and service
activities even though it is not a very profitable proposition.
V. POLICY OPTIONS
As discussed earlier, rural non-farm employment includes several heterogeneous non-farm
activities that have different demand and supply conditions in their input and output
markets; the policies therefore have to be industry- (within the broad RNFS) specific. In the
present discussion, government policies related to rural employment are essentially
industrial policies with a significant bearing on the intensity and productivity of labour in
the rural sector.24 Since employment and output in an industry are highly correlated, it is
24 Industries here refer to the CSO classification of industries, which consists of three sectors primary, secondary, tertiary and nine industries.
40
difficult to separate industrial development policies from those policies that are targeted
towards employment generation in an industry. This separation has become even more
difficult with the increased importance of cost efficiency in a liberalizing world. The
findings of the present study suggest that growth in either agriculture or the manufacturing
sector is important for the robust growth of employment in the rural sector; though the
debate on the sectoral precedence of agriculture vis-à-vis manufacturing in the short run
goes on.25 This paper therefore argues that depending on the resource endowment of the
region either of the above industry may be promoted. Subsequently, growth in other
industries may follow depending on the micro-level environment for growth in these
industries. Sub-section (A) discusses this issues.
The infrastructure-related issues in non-farm employment growth are discussed
separately in sub-section (B) of the present section. Experience shows that growth in
industry is often not sufficient for employment growth especially in terms of quality of
employment. Industry often encompasses enterprises of different sizes having different
levels of profitability and working conditions for workers / labour. Government therefore
mediates in the rural labour market. These mediations in the form of assuring minimum
wages or in the form of provisioning of satisfactory social security are also discussed in this
sub-section (B). Inspite of the creation of such infrastructure and environment a significant
proportion of the population is left out of the developmental process. As a result, direct
employment-generation programmes (EGP) have become part of our development planning
since the last few decades. The importance of such programmes has further increased with
the high incidence of unemployment. These issues are discussed separately in sub-section
(C) below.
(A) Sectoral Growth Though as per CSO classification there are nine industries and the growth in all these
industries are important. The present investigator believes that growth in agriculture and
25 Since Lewis (1954), industrialization was perceived as the prime mover of ‘trickle down’ this perception at least for developing countries weakened in 1970s and Ahluwalia (1978) argues that even within the prevalent inegalitarian institutional and property ownership structures growth of agricultural, GDP would trickle down and remove unemployment and rural poverty in country like India (Saith 1991).
41
manufacturing is important for a remunerative, broad-based growth of employment in the
rural sector. Growth in these industries would trigger employment growth in other
industries. The present sub-section discusses the manufacturing sector in detail; whereas,
suggestions encompassing other sectors / sub-sectors of the rural economy are grouped
together and presented below.
Agriculture Government policies related to agriculture during the planned development of the country
have passed through at least three distinct phases. The first shift in policy was evident in the
mid-60s with the increased importance given to self-sufficiency; the second line of
demarcation marked the opening up of trade in the early 90s. It is really difficult to separate
out employment-related policy in agriculture from the sectoral policy. Any government
policy, which increases cropped area and crop productivity would increase employment and
wages, respectively in agriculture. Some suggestions for increasing cropped area and
productivity in agriculture involve technological innovations, infrastructure development,
rationalization of farm input prices, besides other issues. These issues are have been
discussed elsewhere in detail (see Jha 2006).
There is also scope for increasing vertical integration of farm-firm. The less-
exploited options in the form of apiculture, sericulture, rearing of birds and small ruminants
need to be encouraged especially on small farms. This will increase the utilization of family
labour especially that of women and can make the small farm more viable.
Rural Manufacturing The rural sector has a definite advantage over its urban counterpart in manufacturing certain
groups of commodities. The first set of products, those which utilize local resources and are
semi-processed. These are not very scale intensive, while examples in this category include
honey and organic foods. The second set of products also based on local resources, is highly
processed, and are not scale neutral. In this category, technologies that are capital intensive
in nature often play a significant role. Agro-processing and ancillary units near urban centres
are examples in this category. The third set of products consists of unmanufactured or semi-
manufactured items. These are also labour-intensive and examples in this category are
traditional crafts by rural artisans. The Government of India has created specific institutions
42
for the promotion of these industries, among which specific mention may be made of the
Khadi and Village Industries Commission (KVIC).26 Certain government schemes
specifically targeted towards encouraging rural manufacturing include the reservation for
small-scale industry (SSI) and cluster programme.
The KVIC at the national level, Khadi and Handloom Boards at the state level and
innumerable institutions and cooperative societies at the disaggregate level were created for
the development of khadi and village industries. 27 The khadi and village industries are
launched to promote local-resource based products and traditional crafts in the rural areas.28
Apart from promoting rural entrepreneurship, KVI products which attract fiscal concessions
are often not cost-efficient for which the reasons generally cited are inefficiencies of the
KVI-system.29 There have been significant efforts in the recent years to reduce inefficiencies
in the KVIC. For instance, a market -development assistance scheme against the prevailing
rebate schemes for the KVI products was launched. The KVIC has also introduced a
franchise scheme for its products. For KVI products, quality has been a problem. To
improve the quality of KVI products, the KVIC in recent years has launched some brands
such as ‘Sarvodaya’ for fast moving capital goods like toilet soaps, pickles, honey; ‘Khadi’
for the upmarket and essential products such as essential oils and herbal products; and ‘Desi
Aahar’ for organic foods, cereals, and spices. The KVIC in order to promote marketing has
further united various product-based producers in a marketing federation (Confederation for
promotion of khadi and village industries, CPKVI) to take up the branding and marketing of
KVI products.
26 The KVIC is entrusted with planning, promoting, organizing and implementing programmes related to khadi and village industries in the country. 27 Khadi means any cloth woven on handloom in India from cotton, silk or woolen yarn handspun in India or from a mixture of any two or all of such yarns. Village industries means any industry located in a rural area which produces any goods or renders any service with or without use of power, in which fixed capital investment (in plant, machinery, land and building) per head of an artisan or a worker does not exceed rupees fifty thousand. 28 The rural area here is any area classified as village as per the revenue records of the state, irrespective of population. This also includes those areas, which are classified as town but the population of such area does not exceed 20,000. 29 The KVIC has identified and accredited training centres all over the country to conduct entrepreneurial development programme (EDP) for entrepreneurs. The KVIC in its rural employment generating programme also provides margin money for financing viable village industries projects with an investment limit up to Re. 2.5 million and Re. 1 million in the case of institutions and individuals, respectively.
43
Government carved out the SSI in its industrial policy resolution which also creates
several institutions to promote the small-scale sector (Jha 2005a). A significant proportion of
small industries are in the rural sector therefore, robust growth in the SSIs is important for
growth of rural manufacturing. Government has taken certain steps in the recent years to
promote growth in these industries. Thus, investment ceilings for the small-scale industries
have been hiked to Rs. 10 million, for selected items this hike has been to the extent of Rs
50 million. Government has also attempted to revive the sector by infusing credit through
SSI specialized bank branches, a small and medium enterprise fund under SIDBI, laghu
udyami credit card scheme, etc. Certain problems specific to the SSIs however remain.30 In
an open economy, the very concept of reserving industries is not tenable; therefore, the
uncertainty associated with the reservation of SSIs must end with some categorical stand
regarding this. The performance of small and tiny industries also depends on the economic
performance of some public sector monopolies that provide basic goods and services. Many
of these units have unfortunately less regard for cost efficiency, while the unit cost of
production is becoming important in an open economy.
In a globalizing world when technology, cost and quality have become important,
rural industrialization cannot rest solely with the KVI, SSIs. Increased private participation
is desired to achieve a robust growth in rural manufacturing. Favorable infrastructures,
largely under the public domain are also required. International experiences suggest the
creation of industry clusters in the rural vicinity as an effective process of rural
industrialization. The union government has identified 60 industry clusters in July 2003 for
focused development by including their credit requirements in the state credit plan. More
recently, the KVIC with the help of SIDBI and NABARD and support of the Ministry of
Agriculture and Rural Industries is trying to implement the National Policy for Agriculture
and Rural Industries (NPRI). This consists essentially of technological advancement and
skill upgradation for effective development of industrial clusters at the district level. This
scheme will promote the participation of private entrepreneurs and NGOs. The Ministry of
Food Processing Industry has also set up food parks in different parts of the country. This is
30 Some problems of the small scale industries which still exist are; prevalence of inspector-raj beyond the turnover of Rs.10 million, adhocism and arbitrariness in de-reservation, high cost in obtaining basic goods and services because of prevalence of public sector monopolies in these industries, arbitrariness in import tariff charges for goods already reserved in the SSI or for similar competing goods in the SSI.
44
to provide capital-intensive common facilities such as cold storage, warehouses, quality
control laboratories, effluent treatment plants, etc. to the adjoining processing units. The
public sector units or corporate or even cooperatives are eligible for grants up to Rs. 4 crore
for the creation of such facilities. So far, 20 food parks have already been sanctioned (GOI,
2004); implementation in actual fact is however, not known.
In spite of these efforts, the performance of rural manufacturing in the 90s has not
been satisfactory. The reasons can be numerous for example; The example policy
impediments for specific rural industry, the burgeoning gap between rural and urban
infrastructure, or decline in demand for products manufactured in the rural sector. With the
opening of the economy and the increasing role of advertisement in the marketing of
consumer goods, it is easy to influence the rural expenditure pattern for urban manufactured
items. There is always the possibility of creating suitable conditions and institutions for rural
manufacture.
The KVIC as discussed earlier plays an important role in the production and
marketing of unmanufactured or semi-manufactured products. The performance of the
KVIC has however been far-from satisfactory. There are suggestions to convert it into a
promotional and development agency rather than a financial agency. The KVIC should
provide technical support to the KVI units; this includes product process research and
market strategies for the KVI-products. Since the village resource-based products have a
niche in the international market, the KVIs need to do some aggressive marketing. There is
sufficient scope for also reducing corruption in the KVI-system. Regular vigilance for
example, may check malpractices in the khadi rebate disbursal. While adequate checks are
needed for irregular release of export incentives, ad-hocism in the provisioning of rebate to
the khadi sector may be abolished and a medium-term strategy on rebate must be chalked
out so that production and planning are not disjointed.
Since the KVIC has failed miserably in performing its duties there is need to involve
the private sector and NGOs in the development of khadi and village industries for an
optimal utilization of resources and reap the promise of opportunities in a liberalizing world.
In order to increase the cost competitiveness of KVI and similar products often, there are
demands for exempting these products from the value-added-tax (VAT). The Department of
45
Agriculture and Rural Industry may pursue this suggestion with the state government; it may
be noted that all state governments are to adopt the VAT system.
Though the rural sector has distinct advantages in agro-processing, many large-scale
processing units have not emerged in the rural region in many parts of the country. The
organized growth of the processing industry also requires an emphasis on post- harvest
infrastructures. There is scope for increasing private participation in the development of
post-harvest infrastructures such as silos and warehouses, cold storage facilities and air-
conditioned transport. In order to remove some of the bottlenecks, contract farming is being
practiced in different parts of the country; a wider success of contract farming among other
things also requires the promotion of formal relations between growers and industry.31 In the
rural sector there is need for the establishment of small-scale processing units involving the
latest technology. Unfortunately efficient technology for small scale processing has not
received due attention.
International experiences suggest the formation of industry cluster as a possible way
of rural industrialization. In the recent decades, several ministries and departments have also
initiated efforts towards the creation of industry clusters. These efforts need to be
coordinated as adequate synergy between these schemes may leave sufficient funds to
promote many industrial clusters in a large part of the country. Government may also devise
ways to encourage private participation in creating some of the common facilities in
industrial clusters.
The rural sector in India has a large number of artisans. In this changing world, the
demand for some products of the artisans’ work has declined, while that of some other skill-
intensive, artisan-like work has increased; such shifts in demands need to be assessed. In a
liberalizing world, when distance is shrinking there may be a latent demand for an artisan’s
work in a distant market, the tapping of which requires the help of market professionals. In
the context of emerging opportunities rural artisans abilities may be increased on a selective
basis; while care is taken to ensure that this training is integrated with the production and
marketing of such products. Though some public institutions such as the KVIC have been
mandated for similar purposes, they have failed miserably in performing their role. There is
31 Some of the important problems are dearth of economies of scale, lack of assured quality of raw material, lack of incentive to either producer or consumer because of multiplicity of middlemen on account of small scale of production.
46
a need for alternate institutions and producers’ associations to undertake the job of training,
producing and marketing the rural artisan’s products. NGOs may encourage the formation of
producers’ SHGs to share the benefits of lucrative prices in distant markets; a good example
of which is presented by lijjat papad. The formation of clusters would also help artisans’ in
removing many of their size and scale-specific bottlenecks.
Box IV: Lijjat Papad Shree Mahila Udyog Samiti is a successful cooperative venture with 1800 member femaleworkers in Pune alone. They manufacture Lijjat papad, for which individual members areprovided with dough; later they market together. They have an informal way of trainingnew incumbents by an existing member.
The subject of rural industrialization is related to many government departments/
ministries; for instance, the Ministry of Industries, Department of Agriculture and Rural
Industries, Ministry of Rural Development, Department of Food Processing Industries.
Similarly, public institutions created for rural industrialization or entrusted with the job of
rural industrialization are also numerous. The lack of proper coordination among these
institutions also leads to the tardy progress of rural industrialization in the country.
The above discussion shows that the rural sector has an advantage in certain kinds of
manufacturing activities. These manufacturing activities depending on the typology require
different kinds of institutional support. In labour-intensive, capital-light, local resource-
based manufacturing activities, there is sufficient scope of improvement in the functioning
of KVIC, there is also need for encouraging producer-based small SHGs. For capital-
intensive rural manufacturing activities common-facility centres, and a facility for industry-
agglomeration is required. As, rural manufacturing is central concern of many government
department plans, poor coordination between these departments often results in duplication
of some programmes while tardy progress occurs in other programmes related to
manufacturing activities.
Other Sectors
Though agriculture and rural manufacturing bear the onus of employment growth in the
rural sector, several other industries like construction, trade, transport and business services
have emerged as important in recent years. Employment growth in these industries depends
47
on factors, such as infrastructure, per capita income, population density. Again a host of
government policies influence these factors.32
Employment declined in utilities and community services; these industries fall
largely under the public domain and since government is reducing its staff strength,
employment under these categories has also declined. Demand for these services has
however not declined, and has in fact increased with the pressure of population and
shrinkage of common resources. There is enormous potential for private participation in the
delivery of utilities and community services and thereby increasing rural employment in the
country.
B. Infrastructure and Environment for Employment Certain government policies, though basic for the growth of industry, are not industry-
specific, these transgress across industries / sectors. Examples under this category include
credit and infrastructure-related policies. Traditionally, the state is perceived as the provider
of infrastructure and public institutions as the creator of rural technology. This perception is
however changing with the emergence of new institutional alternatives. The sustenance of
such institutions also requires government support, which may be in the form of suitable
legislative environment. Another set of government policies increases the capabilities of
workers by providing better education and health facilities. Still another set of government
policies for the social security of the workers attempt to protect vulnerable workers from
contingencies such as, illness, accident, untimely death of bread-winner, old age and
unemployment. Some of the above issues are illustrated below.
Technology and Skill Formation
Technology generation and dissemination, which is of special of interest to the rural sector is
largely confined to the public domain. There is a general feeling that our public-funded
research and extension system is less responsive to the needs of the people. The response of
the farmer or target groups may be assessed through their willingness-to-pay for the research
and extension services. With the user’s payment principle, the research and extension 32 Some of these government policies, lay an increased emphasis on basic infrastructures like road; fiscal concessions for construction of houses, policies helpful in decreasing the relative price of building materials like cement, iron, etc.
48
system may emerge as more accountable and self-sustaining in the long run. In this regard,
the government has made some progress with the agri-clinics; and there are also suggestions
for village knowledge centres. The present investigator believes that information technology
(IT) - enabled knowledge dissemination centres can potentially provide a viable solution to
individual’s problems at a distant isolated place.
The present investigator essentially proposes a public-private partnership, wherein
technology generation will largely be in the public domain and its extension would partly be
with the private, voluntary organizations. Some voluntary organizations are documenting
available technologies and are also disseminating these in the rural area. Such efforts
however, need to be consolidated and further replicated in a large part of the country.
The existing training infrastructure that has some relevance for the rural sector, such
as the District Industry Centre (DIC), Industrial Training Institutes (ITIs), rural poly-
techniques is in a bad shape. These institutions must be revitalized and made relevant to
local needs. These rural institutes should also identify newer trades for training taking note
of the resource endowment of the region and also the emerging opportunities in a liberalized
/ globalized context. Such trainings should be coordinated by local institutions, such as, the
DIC, District Rural Development Agency (DRDA).
Finance and Infrastructure
In spite of the heavy emphasis on institutional credit for farm and non-farm sector, these
remain capital-starved. Financial institutions on the other hand often miss their target for
priority sector lending. The supply-demand mis-match in rural credit is often on account of
lack of sufficient collateral. The concept of community collateral has emerged as important
in recent years. The self-help-groups (SHGs) present a viable mode of arranging community
collaterals. The SHGs in addition to serving the needs of individual small-scale finances also
resolve some specific problems associated with small-scale production of the non-farm
sector. The performance of SHGs due to various reasons has however not been uniform
across the country. The skewed distribution of non-banking finance institutions (NBFI),
which is instrumental in the disbursement of credit to SHGs in the states, is the most
49
important among these. In order to encourage the activity and distribution of NBFI across
the country, the credit limits of the NBFI may be reduced.33
There are suggestions to involve the regional rural banks (RRBs) in disbursing credit
through SHGs, since the RRBs are relatively better distributed in the country. As there are
already discussions about the ways to increase the viability of RRBs, this additional work
will spread their portfolios and may help in making these units more viable. A uniform
spread of SHGs in addition to other actors also requires many credible NGOs in a large part
of the country.
A part of the need for credit will be solved if the community collateral and
borrowing for viable industry- / product-specific infrastructure project is allowed on an
extended scale. In order to overcome some other problems related to collateral, industry
associations and cluster-level units, may also be encouraged to form a mutual credit
guarantee fund. Service sector units such as trading houses / agencies which assist in
marketing or brand building of rural products may be given due priority by the banks and
financial institutions.
The kind of infrastructure required for a specific industry or a product-group varies.
Some industry-specific infrastructure like, cool van, quality-control laboratories for agro-
processing, etc., may be initiated by private parties or producers’ and traders’ associations
and such initiatives definitely require a favourable incentive structure. Government may
focus on basic infrastructure like road, power and communications, since in the rural areas
such basic infrastructure would largely remain in the public domain. In this context, there
are suggestions that the Rural Infrastructure Development Fund (RIDF) may be used more
liberally in making investments in projects other than irrigation as well. The existing RIDF
disbursements across states are highly skewed so that for generally prosperous states the
share in total disbursement is higher. A better regional distribution requires relatively easy
conditions for disbursement of rural credit under RIDF. More recently, government has
launched the Bharat Nirman programme precisely to strengthen the rural infrastructure of
the country.
33 The Small Industries Development Bank of India (SIDBI) also funds the SHGs through NBFIs; the required credit limit for the NBFI (which is supposed to operate on a no-profit basis) is too high (Rs. 2 crore).
50
Social Security and Labour Welfare
Most of the social security and labour welfare policies in India cater to the organized sector,
whereas, it is the unorganized sector which provides the bulk of employment to rural
people.34 There is a general feeling that workers in the organized sector are over-protected,
while their counterparts in the unorganized sector lack minimum social security provisions.
The nature of rural employment is often cited as a possible reason for such apathy.
Employment in the non-farm sector is often seasonal, earnings are also irregular and low,
while in many cases, the employer-employee relationship also does not exist. Though the
employer-employee relationship exists in establishments, these are often not registered with
the state governments.
Minimum wage is an important instrument for the provisioning of labour welfare,
though instances of violations of minimum wages are numerous. The legal limitations,
definitional constraints and over-burdened courts are often cited as reasons for the violation
of minimum wages. In the unorganized sector where workers are regular and an employee-
employer relationship exists, the provisions of minimum wages and social security to
workers only requires that it may be made obligatory on the employer. This of course
requires identification of such establishments; the second National Commission on Labour
(NCL) suggests enactment of the Small Entrepreneurs (Employment Relations) Bill to cover
all establishments employing up to 19 workers and protection to all aspects of workers
including wages, social security, safety and health. The NCL also proposes an umbrella
legislation to ensure minimum wages to workers in the unorganized sector. For this purpose
a worker is defined as one who is registered with a government agency and would permit the
administrative body to decide the matter in case of dispute.
Absence of the employer- employee relationship in certain rural enterprises, requires
some innovative schemes suitable for particular micro-settings. Some state government has
attempted to create a welfare fund for target groups of producers like, bidi workers, by
collecting ‘cess’ from consumers of the finished products. Certain state governments in
association with Non-Government-Organizations (NGOs) have introduced social security
34 About 92 per cent of our total workforce is unorganized; most of the rural workers fall within the unorganized category.
51
schemes for specific target groups of workers; some of the successful schemes out of these
experimentations need to be replicated throughout the country.
Government has recently introduced the Social Security Group Insurance Scheme for
the unorganized workers with the help of the Life Insurance Corporation of India.35 Often,
the reach of government social security schemes is limited because of poor literacy,
unawareness of rural workers, they are also less organized. Some of the anomalies specific
to rural workers can be reduced by the formation of Self-help-Groups (SHGs) of workers
employed in similar activities. The SHGs so formed can participate in certain welfare
schemes of the government. The SHGs with the help of NGOs can interface with the
government agency in a better way.
In India, the expenditure on social security is also low (less than 2 per cent) as
compared to many similar countries like Sri Lanka (4.7 per cent) and China (3.6).
Nevertheless, a large part of this expenditure is being incurred for the organized sector.
More recently, the National Committee for Enterprises in the Unorganized Sector under the
chairmanship of Prof. Arjun Sengupta has drafted a scheme to provide benefits of health
insurance, life insurance and old age security to the entire unorganized workforce of the
country. An alarming situation on account of social security for unorganized workers
suggests that the committee report may be adopted.
C. Employment Generation Programmes There has been a general feeling that the benefits of the growth process did not trickle down
to certain disadvantaged sections of the society. Lipton (1983) illustrated some socio-
economic attributes about the disadvantaged section, 36 which restricts them from joining the
trickle-down queues. This section of the society requires programmes especially targeted
towards them and now for a considerable period of time various income and employment 35 This scheme covers all persons in the age group of 18-60 years belonging to 24 approved occupation groups. The premium under the scheme is Re. 10 per thousand sum assured of which 50 per cent is paid out of the social security fund and the remaining 50 per cent is paid by beneficiary or the nodal agency. 36 The socio-economic attributes as per Lipton are with respect to demographic, nutritional, labour market, asset ownership and other variables. He contends that with respect to the above variables it is possible to observe a discontinuity in the form of a reversal or a point of inflection in their distribution over households ordered according to their average per capita income. The strata below the kink are then defined as being the ‘poorest’ / disadvantaged.
52
generating programmes are in existence in India. The employment generating programmes
largely fall under two broad categories; self-employment generating and wage based
employment generating programme. The first set of employment generation programme
(EGP) attempt to remove chronic unemployment by providing economic assets to the
beneficiary while the second group of programmes provides supplementary employment to
stave-off seasonal unemployment. Some important suggestions in relation to these
progarmme have been presented below.
The self-employment generating programmes have been modified frequently;
Swarnajayanti Gram Swarozgar Yojana (SGSY) for instance, was launched in April 1999
after review and restructuring of the erstwhile IRDP and allied schemes. The broad objective
and instruments of the programme remain the same as that of the IRDP. A high non-willful
default rate of the SGSY beneficiaries in fact, suggests that the assets provided to them in
the self-employment generating programme do not remain viable in the long run. In the
SGSY, selection of projects for beneficiaries should be such as to consistently increase the
productive capacity of individuals in the long run. Assessing the suitability of economic
activities / enterprises for individuals in particular micro-settings may require the help of
professionals. Financial institutions like the National Bank for Agriculture and Rural
Development (NABARD) provides such services at a relatively aggregate level; but their
reach in terms of provisioning of consultancy services for the selection of individual projects
is limited. In this regard it may be noted that nationalized banks were appointing agriculture
specialists for a similar purpose; the practice of appointing an agriculture specialist has
unfortunately been discontinued in the recent decades.
The projects related to allied activities are important considering the kind of pressure
on the land. It is generally felt that the project fund being released in the SGSY or similar
rural development programmes are inadequate for the programme beneficiaries to start their
operations on a large scale. Many of the disadvantages of these beneficiaries are in fact
associated with the lower-scale of production; this can be improved by creating producers’
groups as in the SHGs. Certain innovative arrangements as that of contract farming can also
improve the viability of small and scattered production units. The long- run viability of the
self-employment generating programme therefore depends on the scale of finance, the kind
of projects selected and also the institutional arrangements of the production units.
53
The wage-based employment generating programmes were also modified frequently,
for example, in September 2001, all wage-based employment generating programmes were
merged into the Sampoorna Grammen Rozgar Yojana (SGRY). Unlike many other
programmes of the present day, the SGRY is implemented through the Panchayati Raj
Institutions (PRI). In February 2001, the food-for-work programme was also launched in
some backward regions of the country. In SGRY or similar wage-based employment
generating programmes (EGP), the rural asset is an important component. These
programmes may be recast in a way that the programme apart from providing short-term
employment also helps in building the productive capacity of the region. In rural assets, the
programme should prioritize community assets whose benefits can be shared by a large
number of people. The present investigator believes that the wages in the EGP must not be
higher than the minimum wage prevailing in that region; the lower wage may be used as an
instrument of self-exclusion for the rural work programme (RWP). Studies suggest that
income as a criterion for selection of beneficiary has resulted in various pilferages in the
programme.
In spite of the large emphasis on different wage-based employment generating
programmes, the scale of employment provided by these programmes has been inadequate.37
Considering the grim unemployment scenario in rural areas, the United Progressive Alliance
(UPA) Government enforced the Rural Employment Guarantee Act that would legally
guarantee employment to one person in every poor household for a minimum of 100 days on
asset-creating public works. Programmes of such large magnitude have other implications as
well, it is generally felt that increase of expenditure in such programmes is often associated
with a decrease of public expenditures in the social sectors (Mahendra Dev 2000).
Investment in the social sector is however, important for a long-term growth of the rural
sector.
Though there have been efforts in recent years to unify many of the wage-based
EGP, the present study finds that the possibility of further consolidating employment
generation and developmental programmes exists. Examples of some labour intensive rural
works programmes undertaken by different government departments are soil conservation,
37 GOI document on the REG Bill states that the average scale of employment under SGRY during the year 2002-03 and 2003-04 was 20 man-days for each household Below Poverty Line (BPL).
54
watershed development, construction of schools and pucca roads. There is a feeling that if
works under these departments are pooled and coordinated at the district level, it would
leave sufficient funds for broadening the wage-based employment programmes and for
simultaneously creating durable community assets in the rural sector.
With decentralization under PRI, the unification of various labour intensive rural
works programme (RWP) may not remain a far-fetched idea. This probably requires the
formulation of district level plans and proper coordination between elected body,
bureaucracy, and professionals like subject matter specialists at the district level. The
district-level plan may take some more time to realize. For the time being, a clearing house
at the district level may be setup for sharing of information by various agencies
administering the employment generation programme so as to avoid duplication of
beneficiaries and the creation of durable assets in the programme.
VI. CONCLUSION Though rural manufacturing is the most important industrial category in the non-farm sector,
employment growth in it decelerated during the 90s. There are also evidences of
manufacturing activities shifting away from the rural to urban sector in the country.
Construction, trade, transport and business services have spear- headed rural employment
growth. Employment growth in these industries is not autonomous; it depends on a host of
developmental and demographic factors generally associated with the developmental stage
of the region. Moreover, these industries together account for only 11 per cent of rural
employment in the country; therefore there is a slim chance that these industries would
remain the driver of rural employment growth in the country. It is interesting to note that
though the quality of rural employment has deteriorated, casualization of rural workers also
increased. The real wages for rural workers increased consistently and disparity in the rural
urban wages also reduced towards the end of 90s. The NSS state-level data suggest that both
push-and-pull factors have contributed to rural non-farm employment growth in the country.
In certain states like Bihar, where push-related factors are strong, there are evidences of
male workers crowding out female workers in the rural sector.
In development-related factors of rural diversification, infrastructure has emerged as
more important during the 90s. Agriculture, which used to be the most important
55
determinant of rural diversification has lost its place of eminence during the period. The
study with the help of micro-level data from the AERC distinguishes income-infusing and
income-absorbing rural activities. The study suggests that growth in income-infusing
activities as that of agriculture, manufacturing, tourism encourage development-induced
diversification while dearth of such activities leads to distress-induced diversification in the
country. It is interesting to note that though the influence of agriculture on rural non-farm
growth has decreased, prosperity associated with the agriculture-induced rural
diversification is better spread across space in a region. The study with the help of the
AERC household-level survey showed that though there are many indicators to distinguish
development and distress-induced rural diversification, the average wage and salary is the
most comprehensive indicator.
The present study argues that growth in agriculture and manufacturing is important
for a broad-based growth of development-induced diversification in the country. Strategies
to increase rural non-farm employment growth therefore lay greater stress on these sectors;
though other sectors and issues related to non-farm employment in the country are discussed
as well. The discussion is more to do with institutional alternatives; and a review of public
institutions performances suggest sufficient scope for improvement by making them more
accountable. Stakeholder’s participation in the management of these institutions and a levy
of user’s charges for availing of the services of public institutions are some suggestions to
make these institutions more accountable. To allay the disadvantages associated with small
producers certain innovative institutions like SHGs of producers or cooperatives with
corporates as one of the stakeholders have emerged in select parts of the country. Such
successful experiments need to be replicated over a wider area. The non-farm sector
encompasses a large number of activities, the success of which in a country as diverse as
India requires frequent innovations in rural institutions depending on the changed
perspective and socio-economic conditions of people.
In direct measures of employment, the rural works programmes are important for at
least three reasons namely, increased marginalization of agriculture land, increased
seasonality of employment and the importance of public goods in the rural sector. The study
however feels that other employment-generation programmes such as the self-employment
generation programme are not less important. This programme primarily caters to the
56
chronic unemployment. Certain anomalies in direct employment generation programmes of
such a large magnitude will always be there and such anomalies can be identified with
concurrent evaluations of such programmes. With decentralization and effective
participation of PRI, certain more frequently cited weakness of employment -generating
programmes will be eliminated. The coordination between employment generating and
development programmes will also improve.
REFERENCES Acharya, S. and A. Mitra (2000). “The Potential of Rural Industries and Trade to Provide Decent Work
Conditions: A Data Reconnaissance in India”, SAAT Working Papers, International Labour Organization, New Delhi.
Ahluwalia, M. S. (1978). “Rural Poverty and Agricultural Performances in India” Journal of Development
Studies, Vol. 14, No. 3, April. Basant, R., B. L. Kumar and R. Parthasarathy (1998). (edited). Non-Agricultural Employment in Rural India:
The Case of Gujarat, Rawat Publications, Jaipur, India. Bhalla, G.S. and G. Singh (1997). “Recent Developments in Indian Agriculture-A State level Analysis”
Economic and Political Weekly, Vol. 32, No. 13 (March 29). Bhattacharya, B. B., N.R. Bhanumurthy and S. Sakthivel (2004). “Economic Reforms and Structural Changes
in Employment: A Comparative Analysis of Gender- Specific Employment Behaviour in Organised and Informal Sector in India”, an unpublished report, Institute of Economic Growth, Delhi.
Central Statistical Organization (CSO). Annual Series of Income – various issues, New Delhi. -------------- (2001). Economic Census 1998- All India Report, New Delhi. Centre for Monitoring Indian Economy, CMIE (2002). Profiles of Districts, October issue, Centre for
Monitoring Indian Economy (CMIE), Mumbai. Chadha, G.K. (2001). “Impact of Economic Reforms on Rural Employment: No Smooth Sailing Anticipated.”
Indian Jl. of Agricultural Economics, Vol. 56, No.3, pp. 491-97. Chandrasekhar, CP and Jayati Ghosh (2004). “How Feasible is a Rural Employment Guarantee?” Social
Scientist, No.4 (July-August): 374-375. Chinna, Rao B. (2004). “Rural Non-farm Employment in Andhra Pradesh”, Unpublished report submitted by
Agro-Economic Research Centre (AERC), Waltair to the Ministry of Agriculture, GoI, New Delhi. Dreze, J. (2004). “Financial Implications of an Employment Guarantee Act: Preliminary Estimates”, A note
prepared on behalf of the National Advisory Council, Government of India, New Delhi. Dutta, R.A. and S.L. Bhaiya (2004). “Rural Non-farm Employment in Gujarat”, Unpublished report submitted
by Agro-Economic Research Centre (AERC), Vallabh Vidyanagar, Gujarat, to the Ministry of Agriculture, GoI, New Delhi.
57
Fisher, T. and V. Mahajan (1998). The Forgotten Sector: Non-farm Employment and Enterprises in Rural India, London: Intermediate Technology Publications.
Ghosh, J.K., V. Datta and A. Sinha (2004). “Rural Non-farm Employment in West Bengal”. Unpublished
report submitted by Agro-Economic Research Centre (AERC), Shantiniketan, West Bengal to the Ministry of Agriculture, GoI, New Delhi.
Gogoi Bharati (2004). “Rural Non-farm Employment in Assam”, Unpublished report submitted by Agro-
Economic Research Centre (AERC), Jorhat to the Ministry of Agriculture, GoI, New Delhi. Gopalappa, D. V. (2004). “Rural Non-farm Employment in Karnataka”, Unpublished report submitted by
Agriculture Development and Rural Transformation Unit of the Institute of Economic and Social Change, Bangalore to the Ministry of Agriculture, GoI, New Delhi.
Government of India (1994). Report of the Technical Committee on DPAP and DDP, Ministry of Rural
Development, New Delhi. -------------(2001). Report of the Task Force on Employment Opportunities, Planning Commission, July 2001. --------------(2002). Special Group on Targeting Ten Million Employment Opportunities Per Year, Planning
Commission, May 2002. --------------(2004). Economic Survey 2003-04, Economics Division, Ministry of Finance, GOI, New Delhi. Grover, D.K. and Sanjay Kumar (2004). “Rural Non-farm Employment in Punjab”, Unpublished report
submitted by Agro-Economic Research Centre (AERC), Ludhiana, to the Ministry of Agriculture, GOI, New Delhi.
Harriss, B. and J. Harris (1984). “Generative or Parasitic Urbanism? Some Observations from the Recent
History of a South Indian Market Town”, in J. Harris and M. Moore (eds), Development and the Rural Urban Divide, London: Frank Cass, pp. 82-101.
Hazell, P.B.R. and S. Haggblade (1991). “Rural-Urban Growth Linkages in India”, Indian Jl. of Agricultural
Economics, Vol. 46, No.4, pp. 515-529. Hossain, M. (1988). “Nature and Impact of the Green Revolution in Bangladesh,” Research Report no. 67,
International Food Policy Research Institute, Washington, D.C. USA. Islam Nurul (1997). The Non-farm Sector and Rural Development: Review of Issues and Evidences, FAED
paper no. 22, IFPRI, Washington DC. Jha, B. (2005). Rural Non-farm Employment in India, A coordinated and consolidated unpublished report,
submitted to Ministry of Agriculture, GOI, New Delhi. _____ (2006). “Employment, Wages and Productivity in Indian Agriculture”, IEG Working Paper Series No.
E/266/2006. Kajale, Jayanti (2004). “Rural Non-farm Employment in Maharashtra”, Unpublished report submitted by
Agro-Economic Research Centre (AERC), Pune to the Ministry of Agriculture, GOI, New Delhi. Kumar, Amalendu (2004). “Rural Non-farm Employment in Bihar”, Unpublished report submitted by Agro-
Economic Research Centre (AERC), Bhagalpur to the Ministry of Agriculture, GoI, New Delhi. Lanjouw, P. and A. Shariff (2002). “Rural Non-farm Employment in India: Access Impact and Poverty
Impact”, Working Paper Series N. 81, National Council of Applied Economic Research (NCAER), New Delhi.
58
Lewis, W. A., (1954). “Economic Development with Unlimited Supplies of Labour”, The Manchester School,
Vol. 22, No. 2, pp. 242-258. Lipton, M. (1983) “Poverty, Undernutrition and Hunger”, World Bank Staff Working Paper No. 597,
Washington: World Bank. Mahendra Dev, S (2000). “Economic Reforms, Poverty, Income Distribution and Employment”, Economic and
Political Weekly, Vol. 35, No. 10 (March 4). Mellor, John W. (1978) The New Economics of Growth – A Strategy for India and the Developing World, A
Twentieth Century Fund Study, Ithaca : Cornell University Press. Mishra, B. K. (2003). “Rural Non-farm Employment in Uttar Pradesh”, Unpublished reports submitted by
Agro-Economic Research Centre (AERC), Allahabad to the Ministry of Agriculture, GOI, New Delhi. NABARD (1992). Refinance Assistance for Non-Farm Sector Activities, NABARD, Mumbai. Nayyar, Rohini (1998). “An Assessment of Wage Employment Programmes”, in R. Radhakrishna and A. N.
Sharma (ed.), Empowering Rural Labour in India: Market, State and Mobilisation published by, Institute for Human Development, New Delhi.
National Sample Survey Organisation (NSSO, 1990). Results of the Fourth Quinquennial Survey on
Employment and Unemployment (All India), NSS Fortythird Round (July 1987- June 1988), NSS Report no. 409, New Delhi.
-------------- (NSSO, 1997). Employment and Unemployment in India, 1993-94, NSS Fiftieth Round (July 1993-
June 1994), NSS Report no. 409, New Delhi. --------------- (NSSO 2001). Employment and Unemployment Situation in India, 1999-2000, NSS Fifty-fifth
Round (July 1999-June 2000), NSS Report no. 458, Key Results, Part-I, Part-II, New Delhi. Papola, T.S. (1987). “Rural Industrialisation and Agricultural Growth: A Case Study in India”, in Islam
Rizwanul, (eds.) Rural Industrialisation and Employment in Asia, ILO / ARTEP, New Delhi. ______ (2005). “A Universal Programme is Feasible”, Economic and Political Weekly, Vol. (40), No.7
(February 12): 594-599. Patnaik, P. (2005). “On the Need for Providing Employment Guarantee”, Economic and Political
Weekly,Vol.40, No. 2 (January 15): pp. 203-207. Rajiv Gandhi Foundation (2000). Panchayati Raj in India Status Report 1999, Rajiv Gandhi Task Force on
Panchayati Raj, New Delhi. Saith, A. (1991). “Development Strategies and the Rural Poor”, Journal of Peasant Studies 17(2): 171-243. Saleth, R.M. (1999). Strategic Linkages in Rural Diversification: Empirical Analysis and Policy Issues. New
Delhi: Commonwealth Publishers. Sen, Abhijit (2003). “Globalisation Growth and Inequality in South Asia- The Evidence from Rural India”, in
Jayati Ghosh and C. P. Chandrasekhar (eds), Work and Well being in the Age of Finance, New Delhi : Tulika Books.
Shah, Mihir (2004). “National Rural Employment Guarantee Act: A Historic Opportunity”, Economic and
Political Weekly, Vol. 39, No.49 (December 11): 5287-5290.
59
Sidhu, R. S. and Sukhpal Singh (2004). “Agricultural Wages and Employment in Punjab,” Economic and Political Weekly, Vol.39, (September 11): 4132-4135.
Srivastava, A. (2004). “Rural Non-farm Employment in Madhya Pradesh”, Unpublished reports submitted by
Agro-Economic Research Centre (AERC), Jabalpur to the Ministry of Agriculture, GOI, New Delhi. Srivastava, Ravi (1997). “Poverty Reduction in India: Economic Growth, Human Development and Anti-
poverty Programme”, a background paper for the World Bank. Swaminathan, R. (2004). “Rural Non-farm Employment in Tamilnadu”, Unpublished report submitted by
Agro-Economic Research Centre (AERC), Chennai to the Ministry of Agriculture, GOI, New Delhi. Tuteja, U. (2004). “Rural Non-farm Employment in Haryana”, Unpublished report submitted by Agro-
Economic Research Centre (AERC), Delhi to the Ministry of Agriculture, GOI, New Delhi. Uma Rani and Jeemol Unni (2004). “Unorganised and Organised Manufacturing in India- Potential for
Employment Generating Growth” Economic and Political Weekly, Vol. 49, (October 9): 4568-4580. Unni, J. (1997). ‘Non-Agricultural Employment, Livelihoods and Poverty in Rural India”, Working Paper No.
88, Ahmedabad: Gujarat Institute of Development Research. Unni, Jeemol, N. Lalitha, and Uma Rani (2001). “Economic Reforms and Productivity Trends in Indian
Manufacturing”, Economic and Political Weekly,Vol..36, No. 41, pp. 3915-3922. Vaidya, C.S, M.L. Sharma and N.K. Sharma (2004). “Rural Non-farm Employment in Himachal Pradesh”, An
unpublished reports submitted by Agro-Economic Research Centre (AERC), Shimla to the Ministry of Agriculture, GoI, New Delhi.
Vaidyanathan, A. (1986). “Labour Use in Rural India: A Study of Spatial and Temporal Variations”, Economic
and Political Weekly, Vol.21, No. 52 (December 27): A130-A146. -------------- (1994). “Employment Situation: Some Emerging Perspectives,” Economic and Political Weekly,
Vol.29, No. 50 (December 10): 3147-3156. Visaria, P. and R. Basant (1994). “Non Agricultural Employment in India: Problems and Perspective”, in P.
Visaria and R. Basant (ed.) Non Agricultural Employment in India, New Delhi: Sage Publications Vyas, V. S. and G. Mathai (1978) “Farm and Non-Farm Employment in Rural Areas: A Perspective for
Planning” Economic and Political Weekly, Vol.13, No. 6 and 7, (February annual number): 333-347. ___