Russian Nitrogen Fertilizer Market TFI’s Outlook and Technology Conference Charleston South Carolina U S A LONDON | RALEIGH | WASHINGTON | BEIJING Charleston, South Carolina, U.S.A. 11-13 November, 2008 31 Mount Pleasant, London WC1X 0AD UK Tel +44 20 7903 2132 Fax +44 20 7833 4973 www.crugroup.com
Transcript
Russian Nitrogen Fertilizer Marketg
TFI’s Outlook and Technology ConferenceCharleston South Carolina U S A
LONDON | RALEIGH | WASHINGTON | BEIJING
Charleston, South Carolina, U.S.A.11-13 November, 2008
31 Mount Pleasant, London WC1X 0AD UK Tel +44 20 7903 2132 Fax +44 20 7833 4973
www.crugroup.com
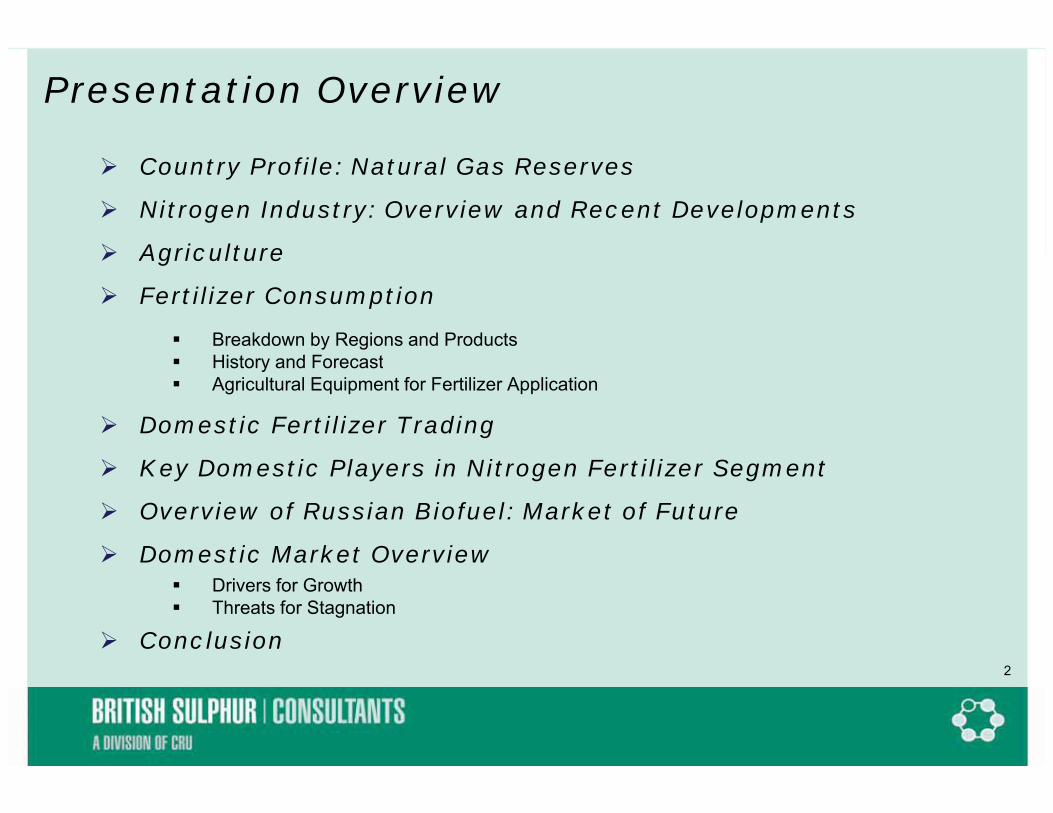
Presentation Overview
� Country Profile: Natural Gas Reserves
� Nitrogen Industry: Overview and Recent Developments
� Agriculture� Agriculture
� Fertilizer Consumption� Breakdown by Regions and Products
Hi t d F t
� Domestic Fertilizer Trading
� History and Forecast� Agricultural Equipment for Fertilizer Application
� Key Domestic Players in Nitrogen Fertilizer Segment
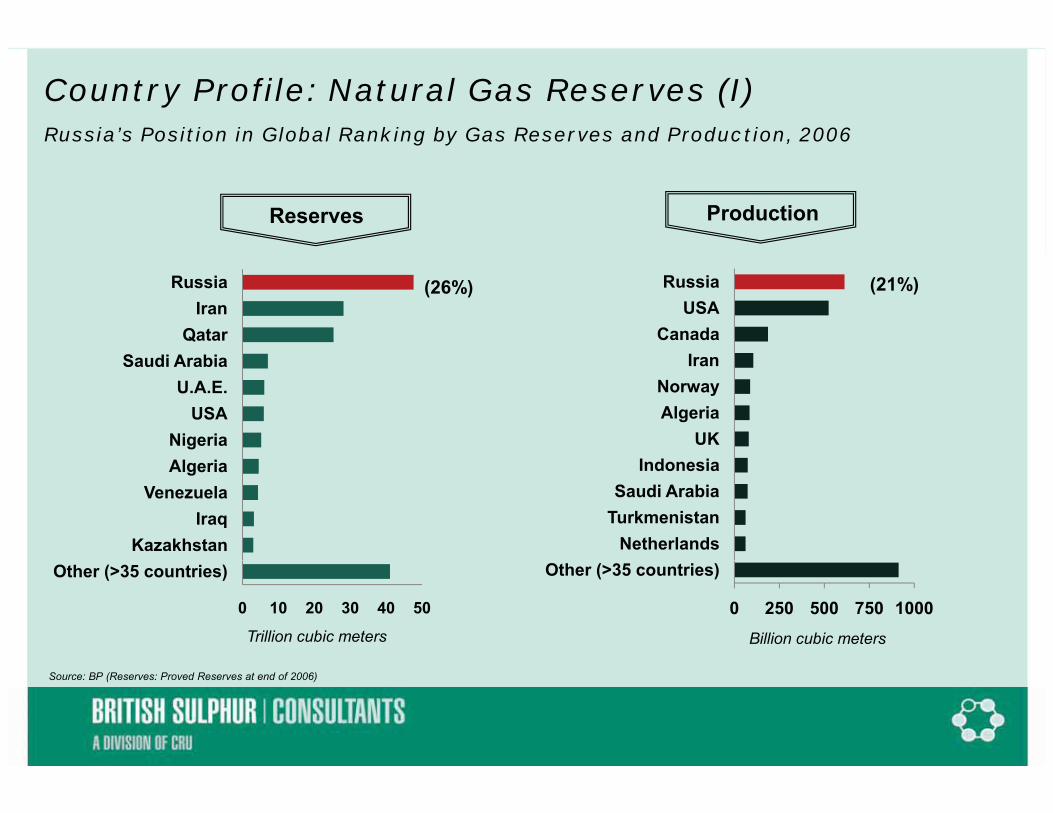
Country Profile: Natural Gas Reserves (I)Russia’s Position in Global Ranking by Gas Reserves and Production, 2006
Reserves Production
RussiaIran
QatarS di A bi
RussiaUSA
CanadaI
(26%) (21%)
Saudi ArabiaU.A.E.
USANigeria
IranNorwayAlgeria
UKAlgeria
VenezuelaIraq
Kazakhstan
IndonesiaSaudi Arabia
TurkmenistanNetherlands
0 10 20 30 40 50
Other (>35 countries)
Trillion cubic meters
0 250 500 750 1000
Other (>35 countries)
Billion cubic meters
Source: BP (Reserves: Proved Reserves at end of 2006)
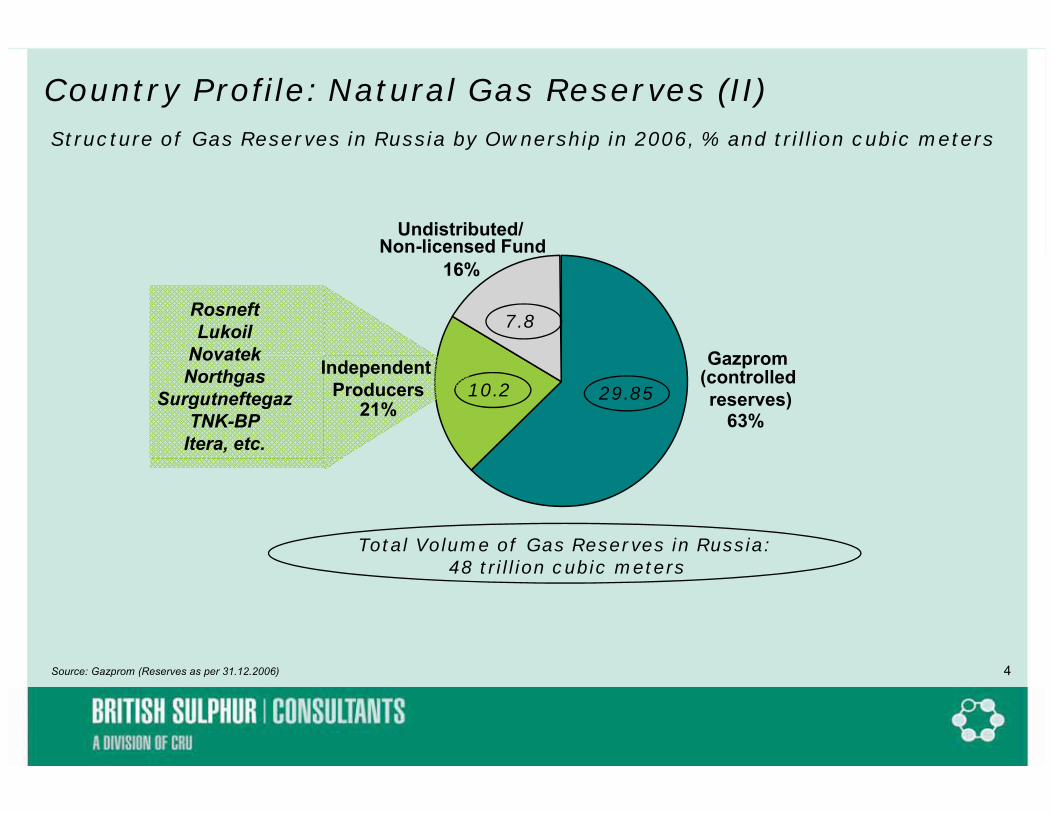
Country Profile: Natural Gas Reserves (II)Structure of Gas Reserves in Russia by Ownership in 2006, % and trillion cubic meters
Undistributed/Non-licensed Fund
16%
Gazprom
7.8RosneftLukoil
Novatek Gazprom(controlledreserves)
63%29.8510.2
IndependentProducers
21%
NovatekNorthgas
SurgutneftegazTNK-BP
Itera, etc.
Total Volume of Gas Reserves in Russia: 48 t illi bi t48 trillion cubic meters
4Source: Gazprom (Reserves as per 31.12.2006)
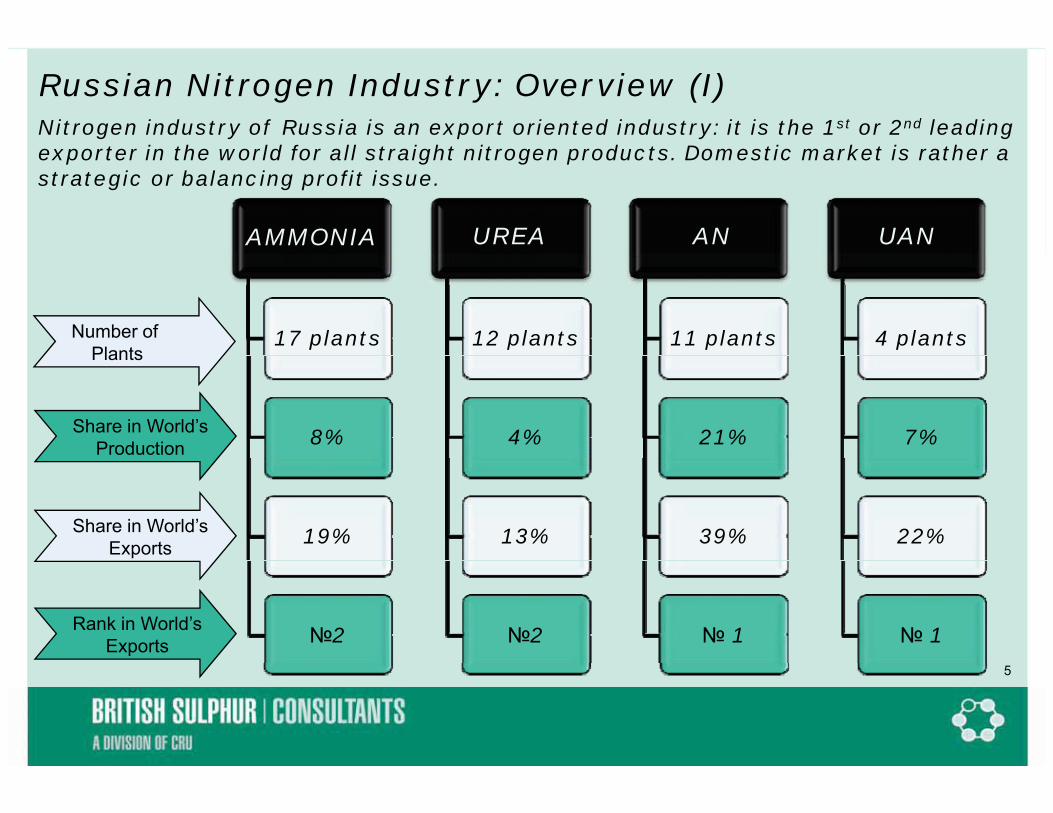
Russian Nitrogen Industry: Overview (I)Nitrogen industry of Russia is an export oriented industry: it is the 1st or 2nd leadingexporter in the world for all straight nitrogen products Domestic market is rather a exporter in the world for all straight nitrogen products. Domestic market is rather a strategic or balancing profit issue.
AMMONIA UREA AN UAN
17 plants 12 plants 11 plants 4 plantsNumber of Plants
8% 4% 21% 7%
Plants
Share in World’sProduction
19% 13% 39% 22%Share in World’sExports
�2 �2 � 1 � 1Rank in World’sExports
5
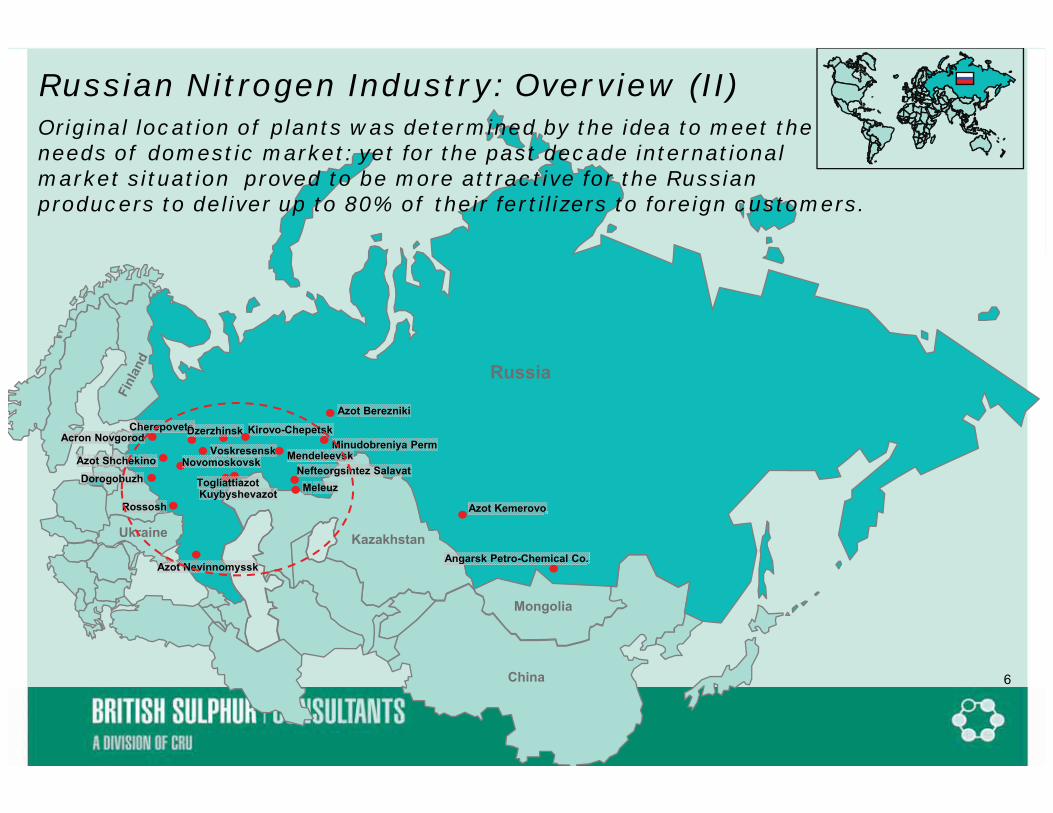
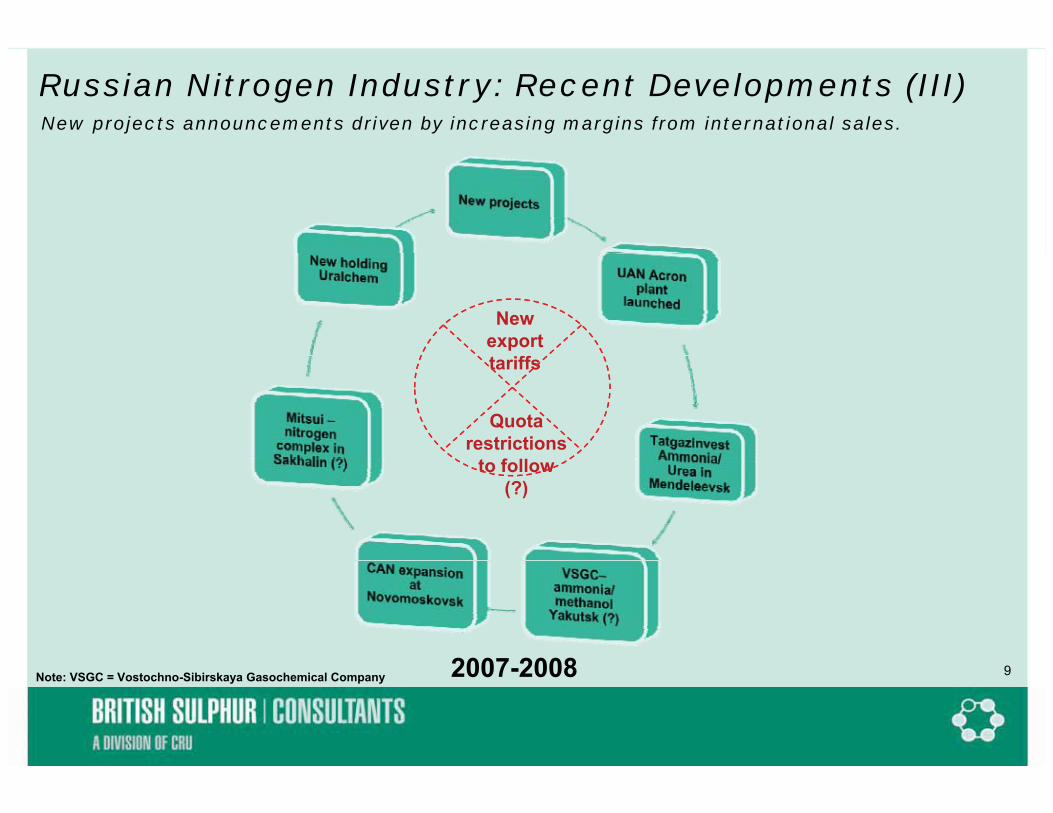
Russian Nitrogen Industry: Overview (II)Original location of plants was determined by the idea to meet the needs of domestic market: yet for the past decade international needs of domestic market: yet for the past decade international market situation proved to be more attractive for the Russian producers to deliver up to 80% of their fertilizers to foreign customers.
2007 2008 92007-2008Note: VSGC = Vostochno-Sibirskaya Gasochemical Company
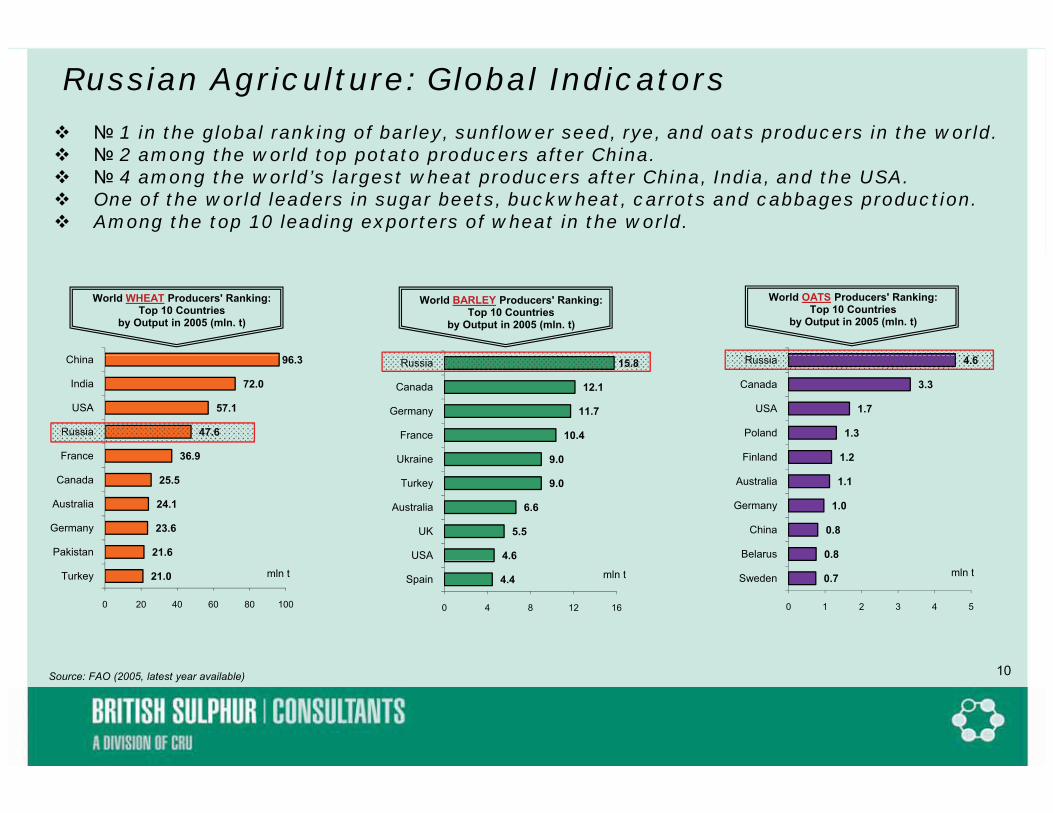
Russian Agriculture: Global Indicators� � 1 in the global ranking of barley, sunflower seed, rye, and oats producers in the world.� � 2 th ld t t t d ft Chi � � 2 among the world top potato producers after China.� � 4 among the world’s largest wheat producers after China, India, and the USA. � One of the world leaders in sugar beets, buckwheat, carrots and cabbages production.� Among the top 10 leading exporters of wheat in the world.
C
World WHEAT Producers' Ranking: Top 10 Countries
by Output in 2005 (mln. t)
World BARLEY Producers' Ranking: Top 10 Countries
by Output in 2005 (mln. t)
World OATS Producers' Ranking: Top 10 Countries
by Output in 2005 (mln. t)
96.3
72.0
57.1
47.6
36 9
China
India
USA
Russia
France
15.8
12.1
11.7
10.4
9 0
Russia
Canada
Germany
France
Ukraine
4.6
3.3
1.7
1.3
1 2
Russia
Canada
USA
Poland
Finland36.9
25.5
24.1
23.6
21.6
France
Canada
Australia
Germany
Pakistan
9.0
9.0
6.6
5.5
4.6
Ukraine
Turkey
Australia
UK
USA
1.2
1.1
1.0
0.8
0.8
Finland
Australia
Germany
China
Belarus
21.0
0 20 40 60 80 100
Turkey mln t 4.4
0 4 8 12 16
Spain mln t 0.7
0 1 2 3 4 5
Sweden mln t
10Source: FAO (2005, latest year available)
Russian Agriculture: Domestic Indicators
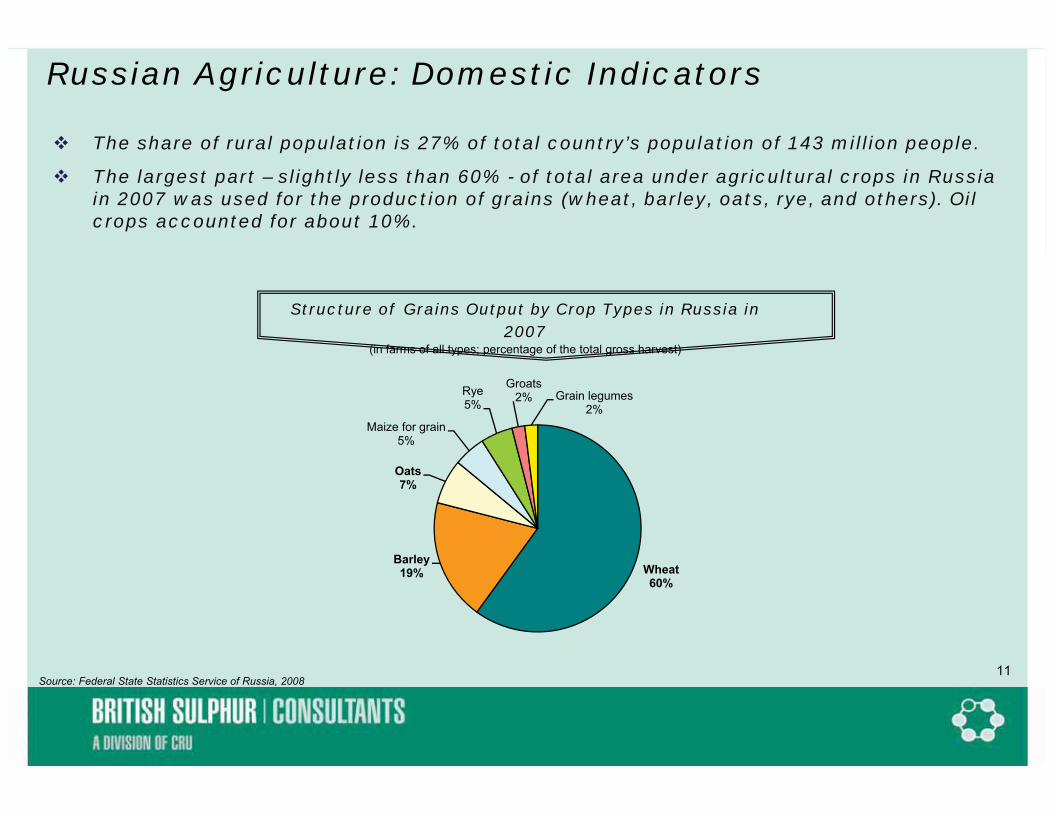
� The share of rural population is 27% of total country’s population of 143 million people.p p y p p p p
� The largest part – slightly less than 60% - of total area under agricultural crops in Russia in 2007 was used for the production of grains (wheat, barley, oats, rye, and others). Oil crops accounted for about 10%.
Structure of Grains Output by Crop Types in Russia in 2007
(in farms of all types; percentage of the total gross harvest)
Maize for grain5%
Rye5%
Groats2% Grain legumes
2%
( yp p g g )
Barley
Oats7%
Wheat60%
Barley19%
11Source: Federal State Statistics Service of Russia, 2008
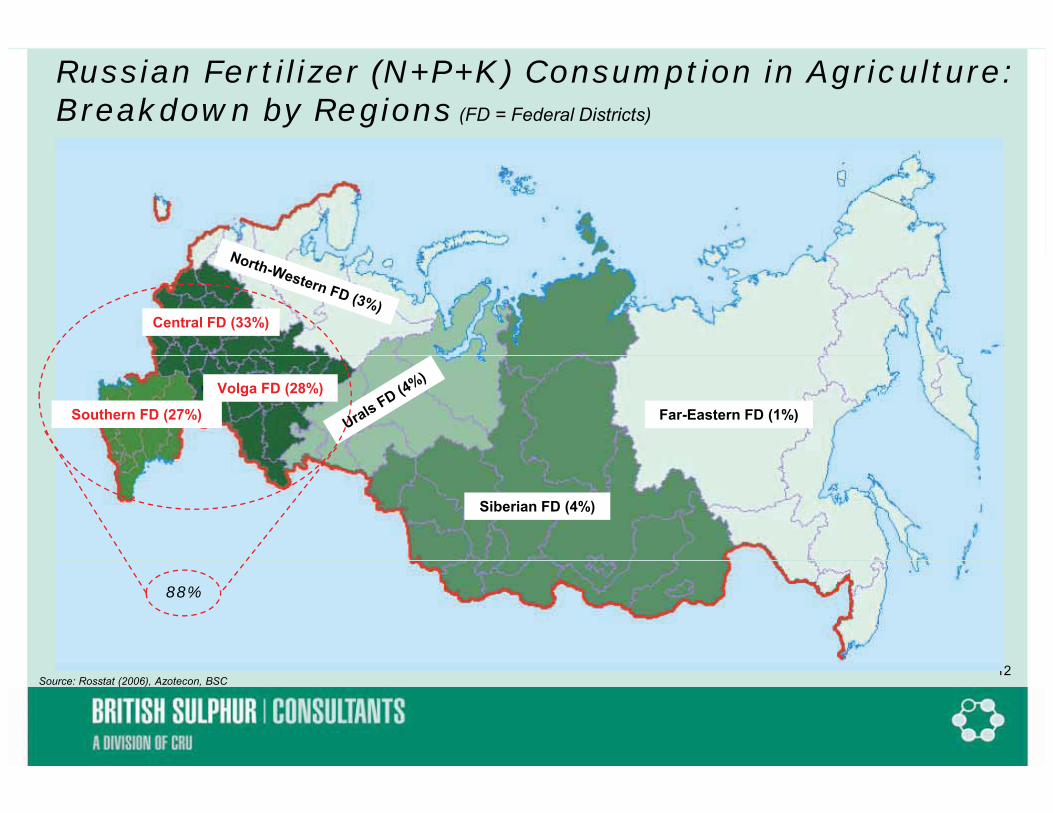
Russian Fertilizer (N+P+K) Consumption in Agriculture:Breakdown by Regions (FD = Federal Districts)
Central FD (33%)
Far-Eastern FD (1%)
Volga FD (28%)
Southern FD (27%)
Siberian FD (4%)
88%
12Source: Rosstat (2006), Azotecon, BSC
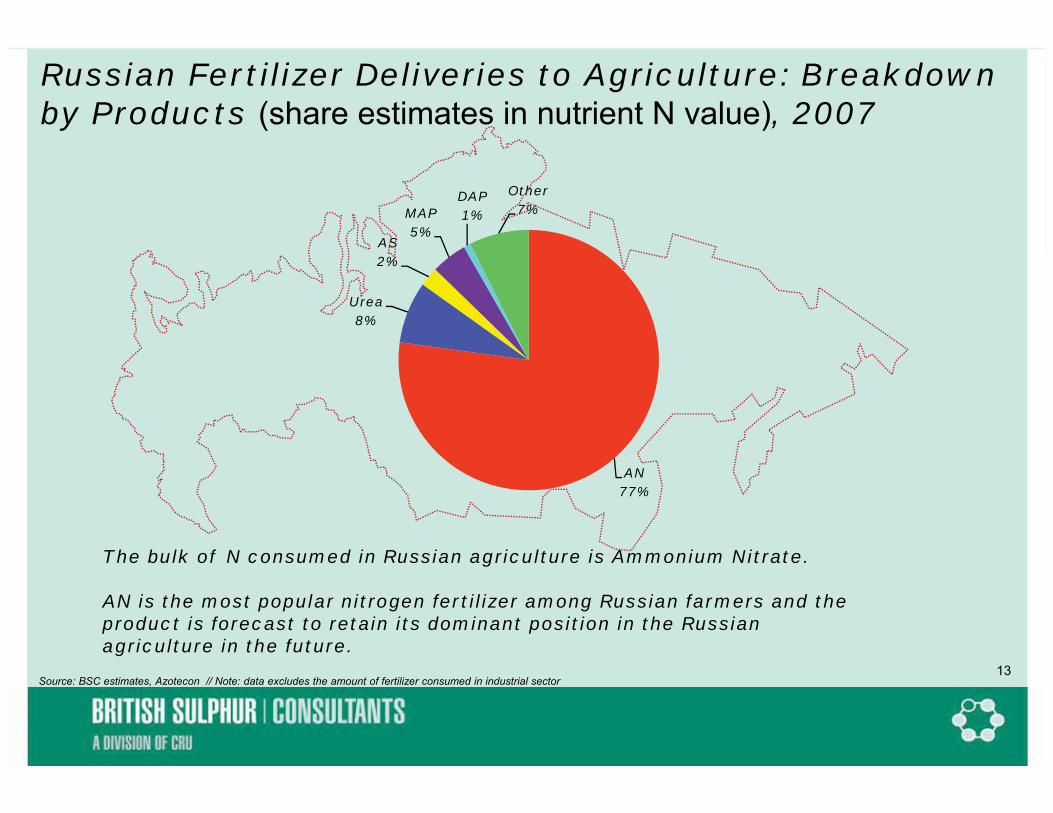
Russian Fertilizer Deliveries to Agriculture: Breakdown by Products (share estimates in nutrient N value), 2007
AS
MAP5%
DAP1%
Other7%
Urea8%
2%
AN77%
The bulk of N consumed in Russian agriculture is Ammonium Nitrate.The bulk of N consumed in Russian agriculture is Ammonium Nitrate.
AN is the most popular nitrogen fertilizer among Russian farmers and the product is forecast to retain its dominant position in the Russian agriculture in the future.
13Source: BSC estimates, Azotecon // Note: data excludes the amount of fertilizer consumed in industrial sector
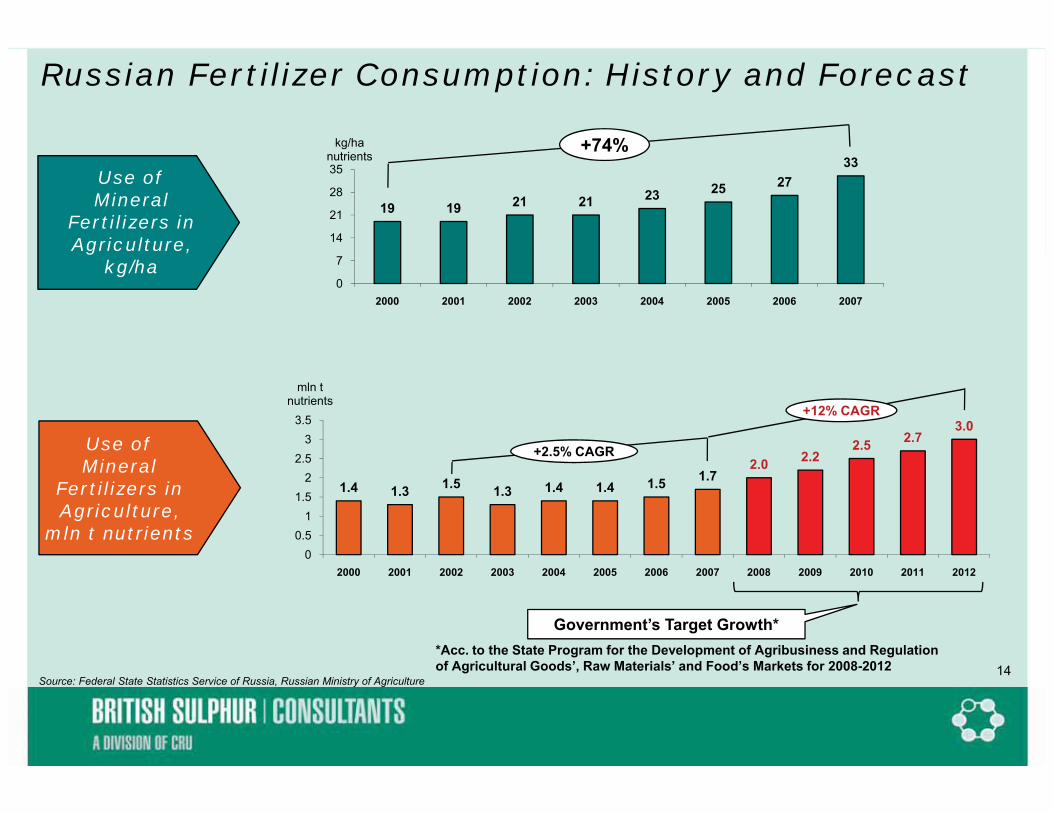
Russian Fertilizer Consumption: History and Forecast
Government’s Target Growth**Acc. to the State Program for the Development of Agribusiness and Regulation
f A i lt l G d ’ R M t i l ’ d F d’ M k t f 2008 2012 14Source: Federal State Statistics Service of Russia, Russian Ministry of Agriculture
of Agricultural Goods’, Raw Materials’ and Food’s Markets for 2008-2012
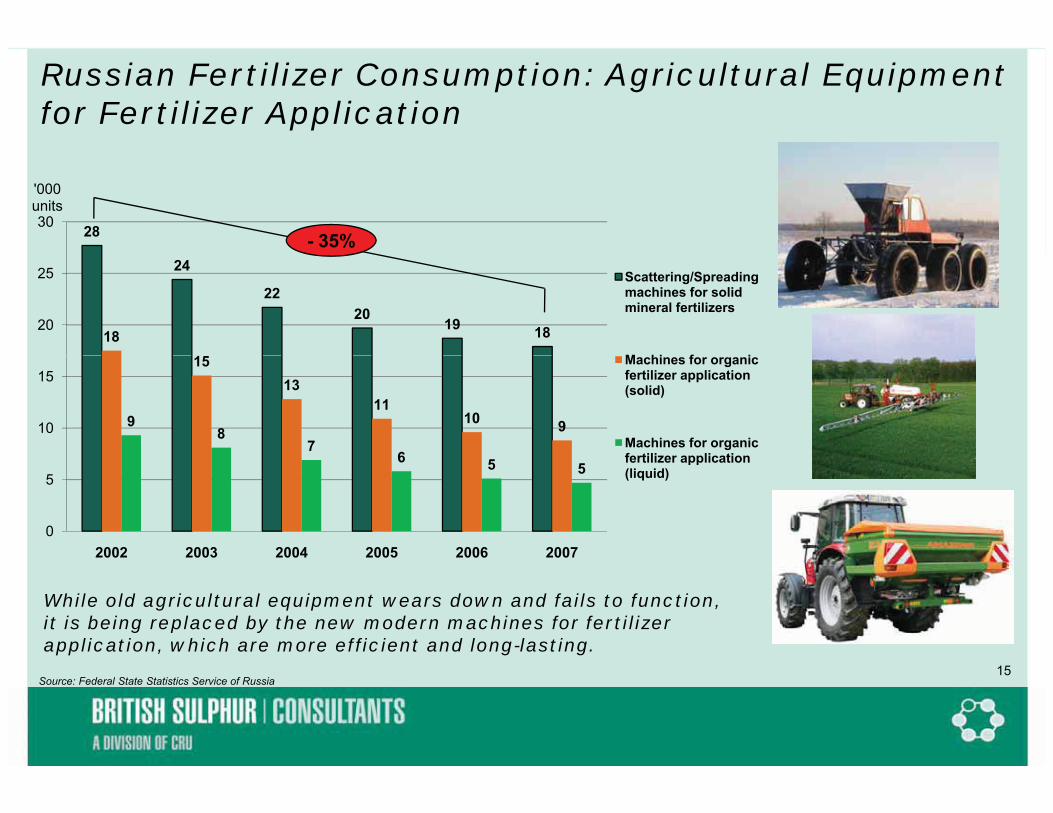
Russian Fertilizer Consumption: Agricultural Equipment for Fertilizer Application
2830
'000 units
- 35%24
2220
19 181820
25 Scattering/Spreadingmachines for solid mineral fertilizers
M hi f i1513
1110 99
87
6
10
15Machines for organicfertilizer application (solid)
Machines for organic fertilizer application6 5 5
0
5
2002 2003 2004 2005 2006 2007
fertilizer application(liquid)
While old agricultural equipment wears down and fails to function, it is being replaced by the new modern machines for fertilizer application, which are more efficient and long-lasting.
15Source: Federal State Statistics Service of Russia
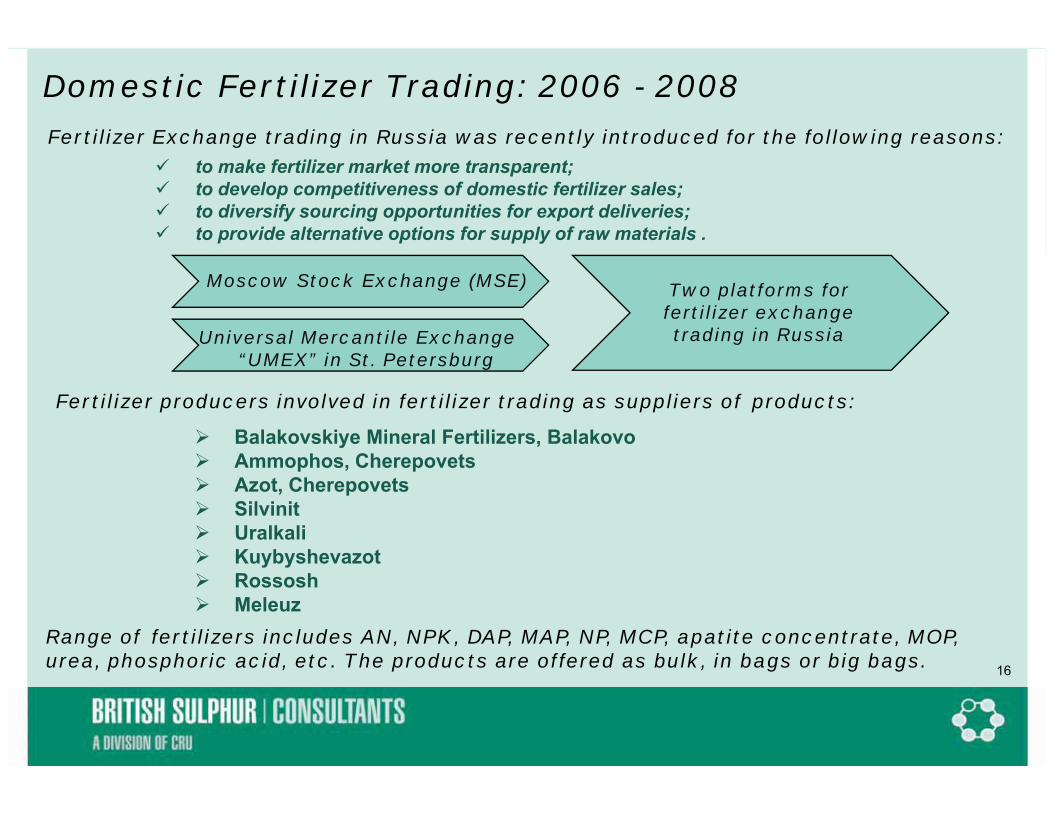
Domestic Fertilizer Trading: 2006 - 2008Fertilizer Exchange trading in Russia was recently introduced for the following reasons:
� to make fertilizer market more transparent;� to develop competitiveness of domestic fertilizer sales; � to diversify sourcing opportunities for export deliveries;� to provide alternative options for supply of raw materials .
Moscow Stock Exchange (MSE) Two platforms for fertilizer exchange trading in RussiaUniversal Mercantile Exchange
“UMEX” i St P t b“UMEX” in St. Petersburg
Fertilizer producers involved in fertilizer trading as suppliers of products:� Balakovskiye Mineral Fertilizers, Balakovo� Ammophos Cherepovets� Ammophos, Cherepovets� Azot, Cherepovets� Silvinit� Uralkali� Kuybyshevazot� Kuybyshevazot� Rossosh� Meleuz
Range of fertilizers includes AN, NPK, DAP, MAP, NP, MCP, apatite concentrate, MOP, urea phosphoric acid etc The products are offered as bulk in bags or big bags 16urea, phosphoric acid, etc. The products are offered as bulk, in bags or big bags.
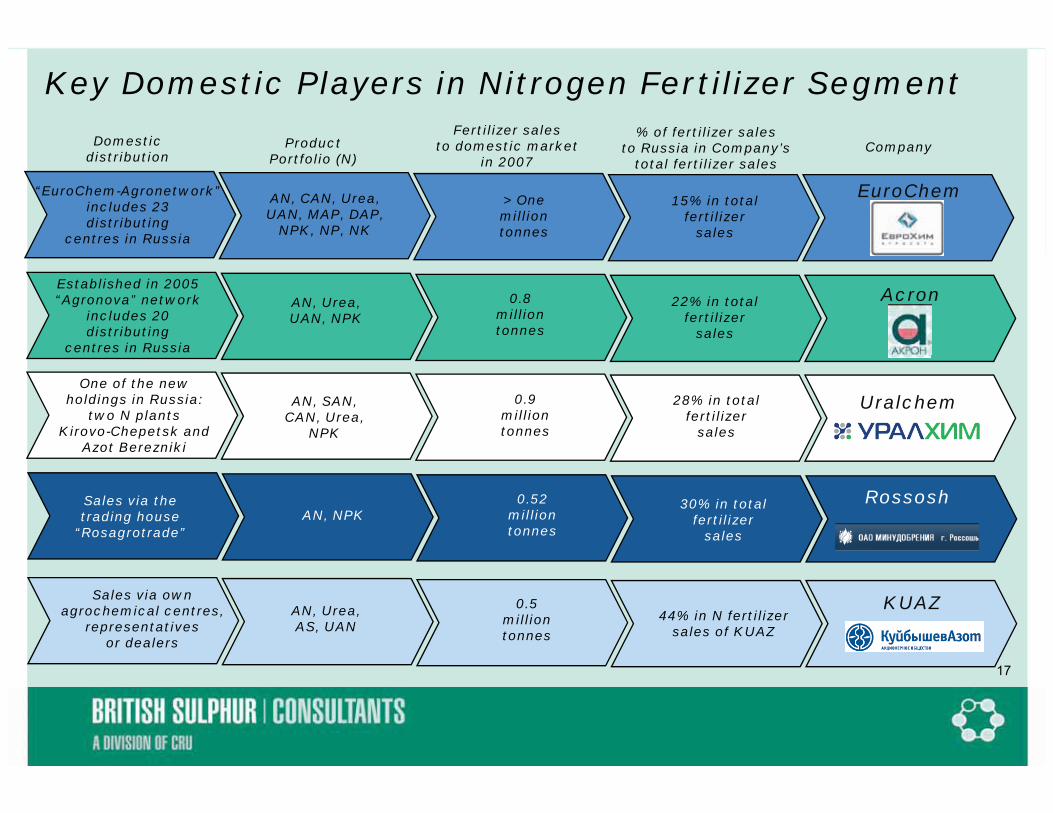
Key Domestic Players in Nitrogen Fertilizer SegmentDomestic Product
Fertilizer sales to domestic market
% of fertilizer sales to Russia in Company’s Company
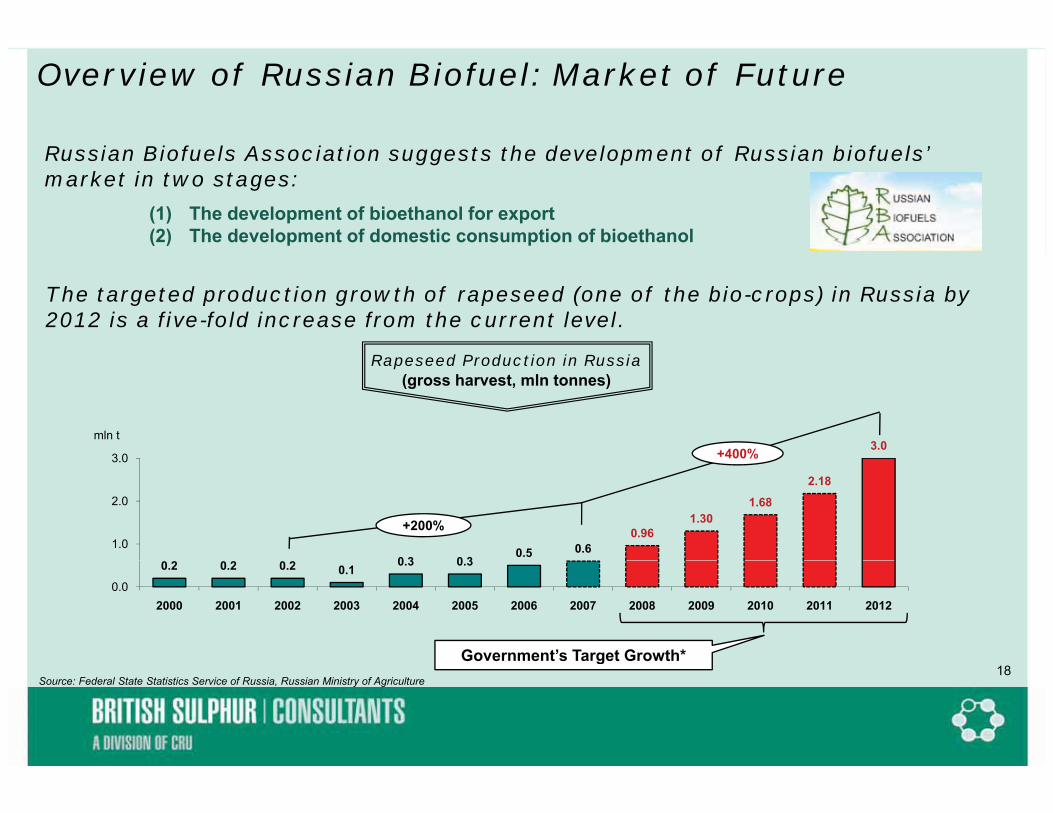
Russian Biofuels Association suggests the development of Russian biofuels’ Russian Biofuels Association suggests the development of Russian biofuels’ market in two stages:
(1) The development of bioethanol for export(2) The development of domestic consumption of bioethanol
R d P d ti i R i
The targeted production growth of rapeseed (one of the bio-crops) in Russia by 2012 is a five-fold increase from the current level.
Rapeseed Production in Russia(gross harvest, mln tonnes)
gSource: Federal State Statistics Service of Russia, Russian Ministry of Agriculture
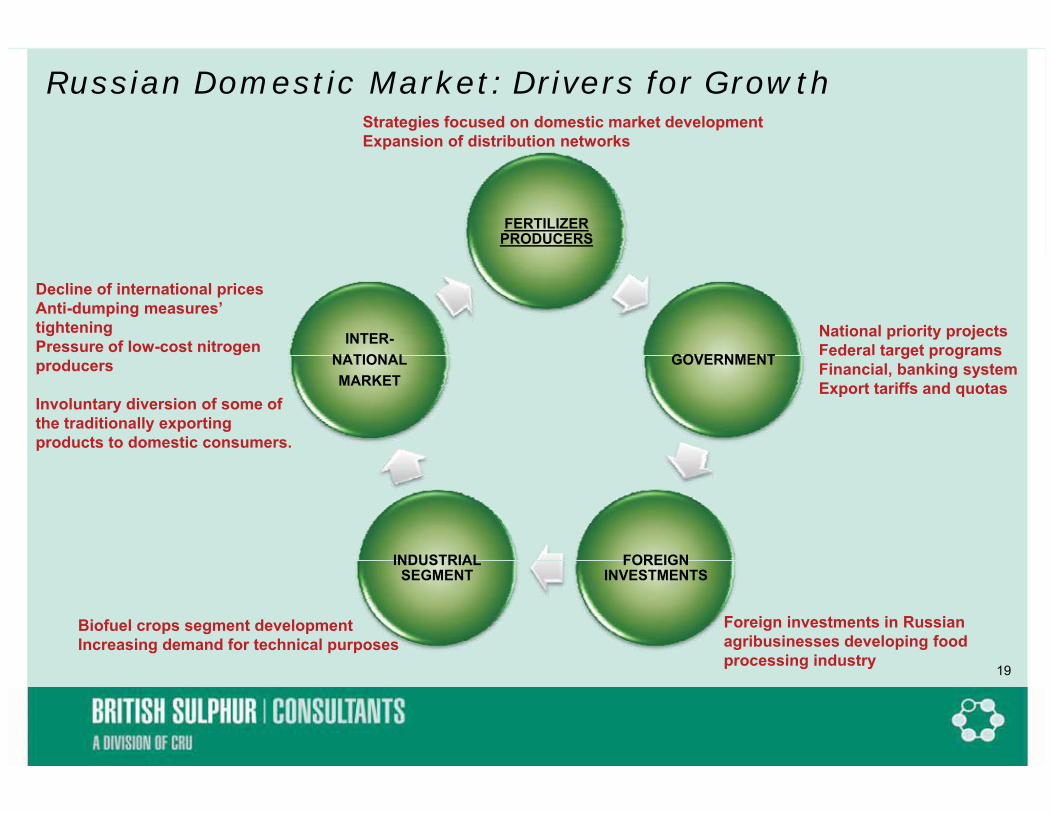
Russian Domestic Market: Drivers for Growth Strategies focused on domestic market developmentExpansion of distribution networks
FERTILIZERPRODUCERS
GOVERNMENTINTER-
NATIONAL
Decline of international prices Anti-dumping measures’ tighteningPressure of low-cost nitrogen
National priority projects Federal target programsGOVERNMENTNATIONAL
MARKETproducers
Involuntary diversion of some of the traditionally exporting products to domestic consumers.
ede a ta get p og a sFinancial, banking systemExport tariffs and quotas
FOREIGNINDUSTRIAL FOREIGNINVESTMENTS
INDUSTRIALSEGMENT
Foreign investments in Russian agribusinesses developing food processing industry
Biofuel crops segment developmentIncreasing demand for technical purposes
19processing industry
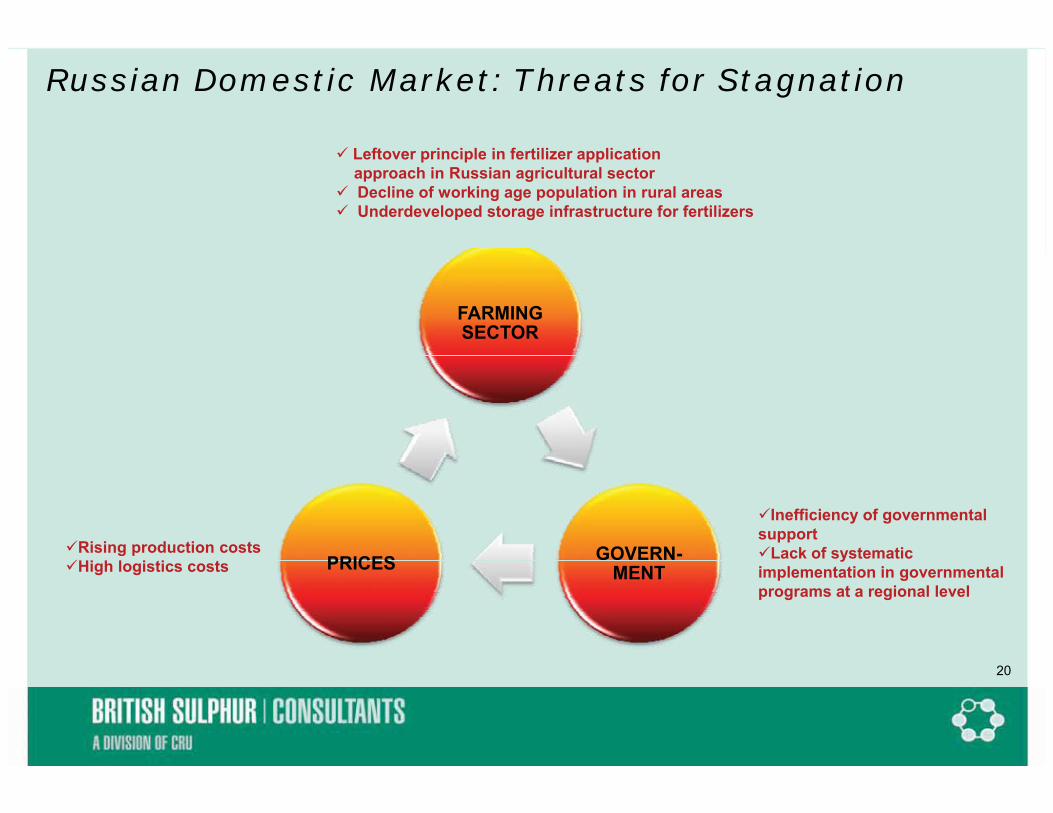
Russian Domestic Market: Threats for Stagnation
� L ft i i l i f tili li ti� Leftover principle in fertilizer applicationapproach in Russian agricultural sector
� Decline of working age population in rural areas� Underdeveloped storage infrastructure for fertilizers
FARMING SECTOR
GOVERN-PRICES
�Inefficiency of governmental support�Lack of systematic�Rising production costs
�Hi h l i i MENTPRICES yimplementation in governmental programs at a regional level
�High logistics costs
20
Conclusion
� Domestic market development is of high strategic value formost fertilizer manufacturers
�In the short-to-medium term the export share will retain itsdominance in Russian nitrogen industry: the country has beenand will remain the major player and exporter in the globalinternational nitrogen trade
� However, domestic market leaves vast opportunities with al t ti l d l t f l l d t tili th ilarge potential development for local producers to utilize theirnitrogen products
� As hedging from more pressure in the global trade at the bottom� As hedging from more pressure in the global trade at the bottomof the cycle the development of the domestic market might be asolution for surplus of products for Russian manufacturers