31
1 Russian VC market overview VTB Capital’s perspective Zurich, July 11, 2013 www.vtbcapital-im.com
1
Russian VC market overview
VTB Capital’s perspective
Zurich, July 11, 2013
www.vtbcapital-im.com

2
Table of contents
Venture Capital Business of VTB Capital 3
Our Market 6
Our Strategy and Investments 16
Our War Chest 22
3
Venture capital business of VTB Capital
Geography of investments
Co-investments with top-tier venture capital firms
Global geographic coverage
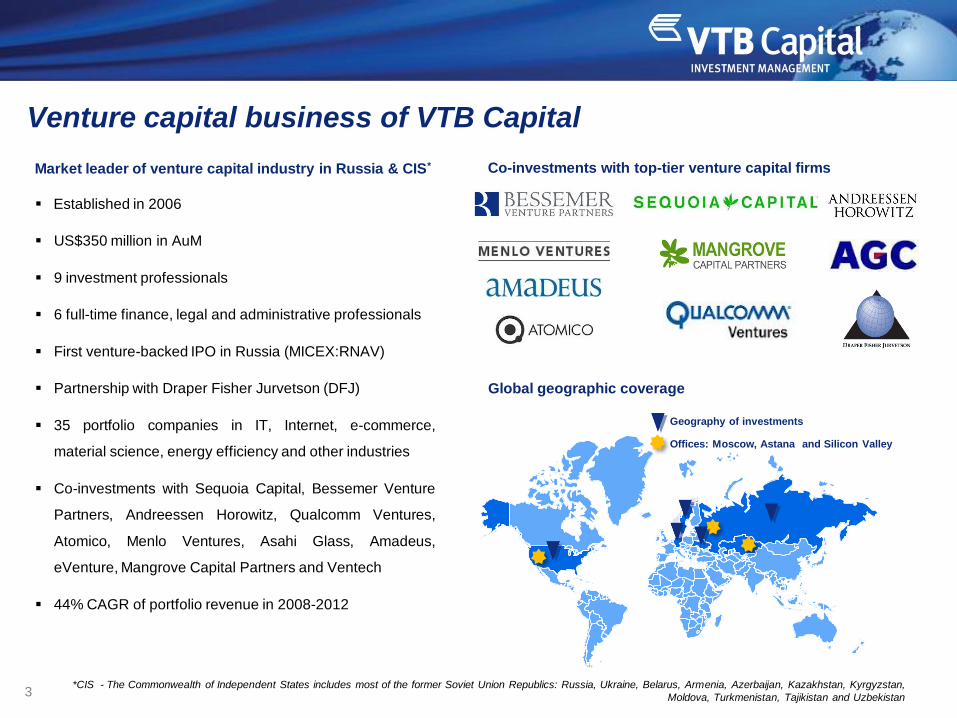
Established in 2006
US$350 million in AuM
9 investment professionals
6 full-time finance, legal and administrative professionals
First venture-backed IPO in Russia (MICEX:RNAV)
Partnership with Draper Fisher Jurvetson (DFJ)
35 portfolio companies in IT, Internet, e-commerce,
material science, energy efficiency and other industries
Co-investments with Sequoia Capital, Bessemer Venture
Partners, Andreessen Horowitz, Qualcomm Ventures,
Atomico, Menlo Ventures, Asahi Glass, Amadeus,
eVenture, Mangrove Capital Partners and Ventech
44% CAGR of portfolio revenue in 2008-2012
Market leader of venture capital industry in Russia & CIS*
Offices: Moscow, Astana and Silicon Valley
*CIS - The Commonwealth of Independent States includes most of the former Soviet Union Republics: Russia, Ukraine, Belarus, Armenia, Azerbaijan, Kazakhstan, Kyrgyzstan,
Moldova, Turkmenistan, Tajikistan and Uzbekistan
4
VTB Capital: investment banking arm of VTB Group
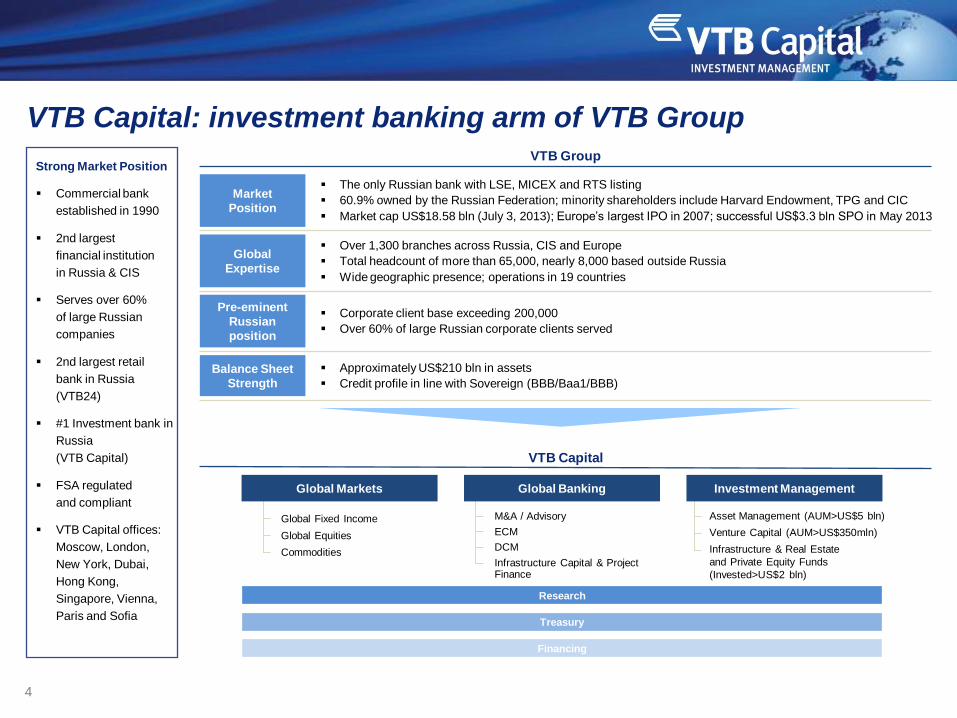
Global Fixed Income
Global Equities
Commodities
Asset Management (AUM>US$5 bln)
Venture Capital (AUM>US$350mln)
Infrastructure & Real Estate
and Private Equity Funds
(Invested>US$2 bln)
M&A / Advisory
ECM
DCM
Infrastructure Capital & Project Finance
Research
Treasury
Financing
Global Markets Global Banking Investment Management
Strong Market Position
Commercial bank
established in 1990
2nd largest
financial institution
in Russia & CIS
Serves over 60%
of large Russian
companies
2nd largest retail
bank in Russia
(VTB24)
#1 Investment bank in
Russia
(VTB Capital)
FSA regulated
and compliant
VTB Capital offices:
Moscow, London,
New York, Dubai,
Hong Kong,
Singapore, Vienna,
Paris and Sofia
Market
Position
The only Russian bank with LSE, MICEX and RTS listing
60.9% owned by the Russian Federation; minority shareholders include Harvard Endowment, TPG and CIC
Market cap US$18.58 bln (July 3, 2013); Europe’s largest IPO in 2007; successful US$3.3 bln SPO in May 2013
Global
Expertise
Over 1,300 branches across Russia, CIS and Europe
Total headcount of more than 65,000, nearly 8,000 based outside Russia
Wide geographic presence; operations in 19 countries
Pre-eminent
Russian
position
Corporate client base exceeding 200,000
Over 60% of large Russian corporate clients served
Balance Sheet
Strength
Approximately US$210 bln in assets
Credit profile in line with Sovereign (BBB/Baa1/BBB)
VTB Group
VTB Capital

5
Table of contents
Venture Capital Business of VTB Capital 3
Our Market 6
Our Strategy and Investments 16
Our War Chest 22
6
Macroeconomic trends in Russia
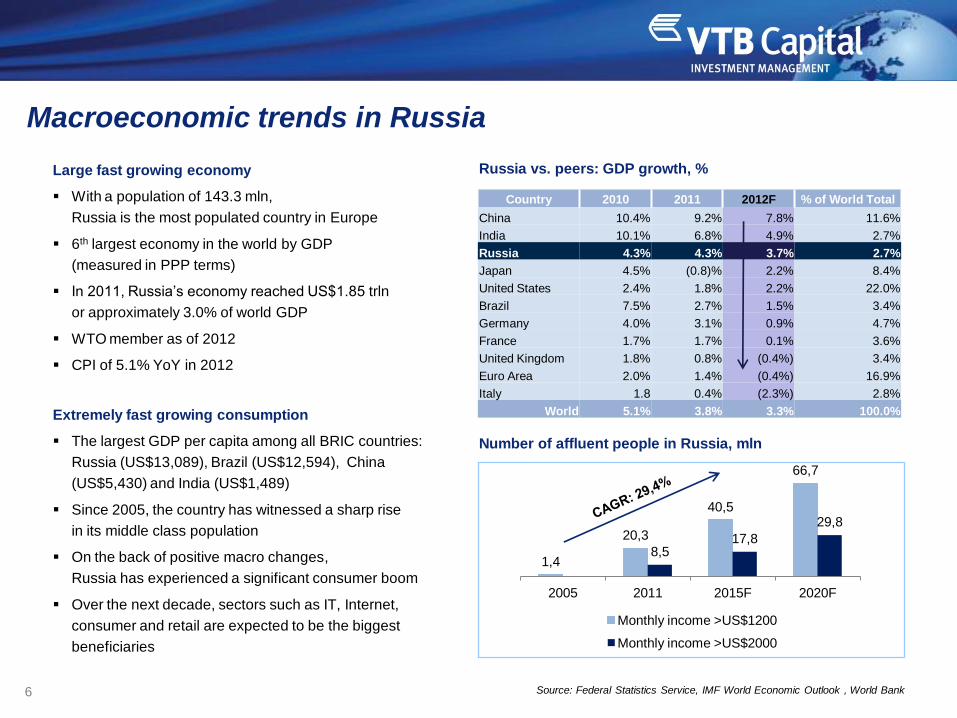
Large fast growing economy
With a population of 143.3 mln,
Russia is the most populated country in Europe
6th largest economy in the world by GDP
(measured in PPP terms)
In 2011, Russia’s economy reached US$1.85 trln
or approximately 3.0% of world GDP
WTO member as of 2012
CPI of 5.1% YoY in 2012
Source: Federal Statistics Service, IMF World Economic Outlook , World Bank
Number of affluent people in Russia, mln
Russia vs. peers: GDP growth, %
Extremely fast growing consumption
The largest GDP per capita among all BRIC countries:
Russia (US$13,089), Brazil (US$12,594), China
(US$5,430) and India (US$1,489)
Since 2005, the country has witnessed a sharp rise
in its middle class population
On the back of positive macro changes,
Russia has experienced a significant consumer boom
Over the next decade, sectors such as IT, Internet,
consumer and retail are expected to be the biggest
beneficiaries
1,4
20,3
40,5
66,7
8,5 17,8
29,8
2005 2011 2015F 2020F
Monthly income >US$1200
Monthly income >US$2000
Country 2010 2011 2012F % of World Total
China 10.4% 9.2% 7.8% 11.6%
India 10.1% 6.8% 4.9% 2.7%
Russia 4.3% 4.3% 3.7% 2.7%
Japan 4.5% (0.8)% 2.2% 8.4%
United States 2.4% 1.8% 2.2% 22.0%
Brazil 7.5% 2.7% 1.5% 3.4%
Germany 4.0% 3.1% 0.9% 4.7%
France 1.7% 1.7% 0.1% 3.6%
United Kingdom 1.8% 0.8% (0.4%) 3.4%
Euro Area 2.0% 1.4% (0.4%) 16.9%
Italy 1.8 0.4% (2.3%) 2.8%
World 5.1% 3.8% 3.3% 100.0%

7
Russian Internet: opportunity impossible to ignore
One of the biggest Internet markets in the world
Russian internet audience is one of the largest in
Europe, having approached Germany’s level in 2012
A total of 80 million Russian language
internet users worldwide constitutes the 5th largest
language group (after English, Chinese,
Japanese and Spanish)
European online audience (mln) – June 2012
Source: FOM, TNS Gallup, BofA Merill Lynch
Internet users as % of population: Russia vs. World – June 2012 Room to grow
Russia’s current Internet penetration level (52%)
is still behind developed countries and it is projected
to grow up to 82% in the long run (2018)
61 67
52 53
36 32
0
10
20
30
40
50
60
70
80
Russia Germany France UK Italy Spain
84%
83%
80%
80%
78%
67%
58%
52%
40%
39%
0% 10% 20% 30% 40% 50% 60% 70% 80% 90%
UK
Germany
France
Japan
USA
Spain
Italy
Russia
China
Brazil

8
Russian e-commerce: the next big thing
Key facts
In 2011, the e-commerce sector reached US$9.1 billion a year
According to Morgan Stanley Research, Russian e-commerce is expected to grow at 44% CAGR in 2012-2014
E-trade represents only 1.6% of total retail turnover, which leaves huge room to grow compared to USA (4.4%) and China
(3.7%), while it is similar to the US and Chinese ratios in 2000 and 2007, respectively
Source: Data Insight 2012, GP Bullhound, June 2012
E-commerce market in Russia (2008-2015F), US$ bln E-commerce share of total retail in Europe
5 6 8
9,1
18
30
0
5
10
15
20
25
30
35
2008 2009 2010 2011 2015F 2020F

9
0
2
4
6
8
10
12
14
16
18
20
2011 2012 2013 2014 2015
Wire transfers* Terminals E-money, virtual cards, mobile banking
E-payment industry in Russia Market size, bln USD
7,8
10,0
12,4
15,5
19,0
Source: BCG, Industry Analytics, Euro Monitor, Central Bank of Russia, FOM
* Card payments
92% 87%
62% 60%
28%
8% 13%
38% 40%
72%
Russia Eastern Europe
Latin America
Asia Developed countries
Cash Non-cash
Breakdown of payments by region
10
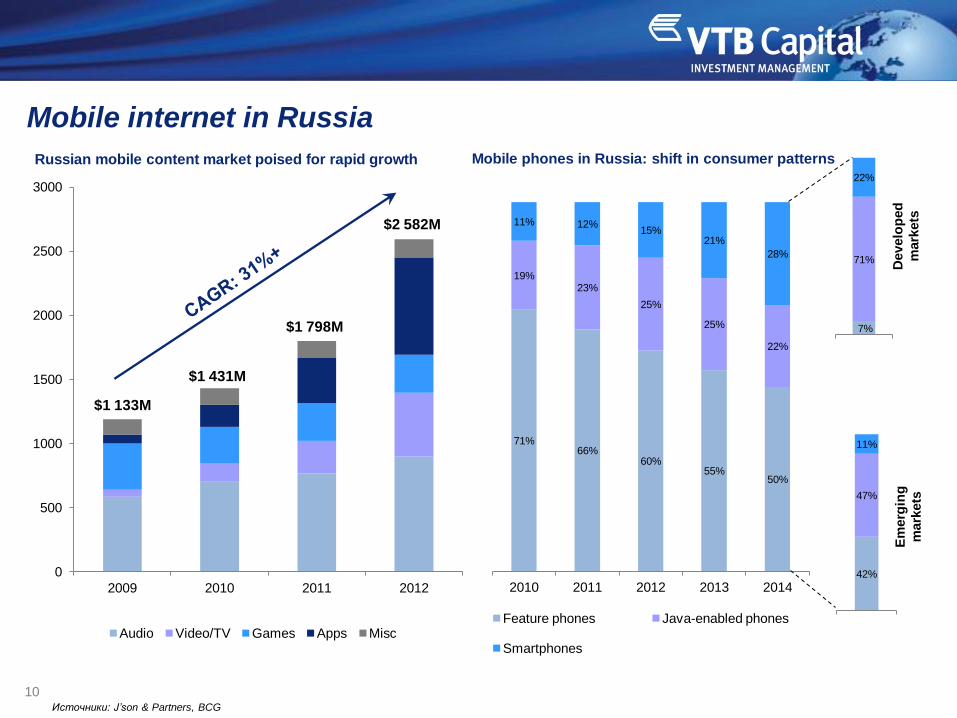
Mobile internet in Russia
71% 66%
60% 55%
50%
19% 23%
25%
25%
22%
11% 12% 15%
21%
28%
2010 2011 2012 2013 2014
Feature phones Java-enabled phones
Smartphones
7%
71%
22%
42%
47%
11%
Mobile phones in Russia: shift in consumer patterns
Develo
ped
mark
ets
E
merg
ing
mark
ets
0
500
1000
1500
2000
2500
3000
2009 2010 2011 2012
Audio Video/TV Games Apps Misc
$1 133M
$1 431M
$1 798M
$2 582M
Источники: J’son & Partners, BCG
Russian mobile content market poised for rapid growth

11
Russian Internet: local leaders dominate the market
Local start-ups have substantial advantages in winning and retaining market share over global leaders.
To conquer the market companies need to be local
International companies are likely to acquire successful local start-ups rather than build from scratch,
creating exit opportunities for start-ups
Russian Internet market
remains largely dominated by local players
Russian companies are leaders in their respective categories
Language complexities
Similar to China, Japan and South Korea, language is one of the
key barriers to entry in the Russian Internet market
Marketing specifics
Effective marketing campaigns require a specific understanding
of consumer preferences and behavioral habits
Logistics Impacting Profitability
The vast size of the country and shortage of fast, cheap
and reliable logistical systems is a natural barrier for many global e-
tailers. Local players like Ozon and KupiVIP have been able
to successfully solve this problem by building their own logistics.
Category Global Leader Russian Leader
Search engine
Electronics
retail
Social network
Online
classifieds
Genealogy
network
Mobile
payments

12
Russian Internet: VC landscape
9
18
35
16
0
5
10
15
20
25
30
35
40
2009 2010 2011 1H2012
52$ 69$
163$
228$
0
50
100
150
200
250
2009 2010 2011 1H2012
Capital raised, mln USD
Most active international players
Leading local investors
Number of deals
Source: GP Bullhound

13
Russian start-ups: stories of huge success and more to come
… and that is just the top of the iceberg: other success stories include ABBYY, Sapato, Darberry …
ParaGraph
3D Internet software
Founded in 1989 in
Moscow
Acquired by Silicon
Graphics (SGI) in
1997 for $200 mln
IPG Photonics
Provider of high power and
high performance fiber
lasers and amplifiers
Founded in 1989 in
Moscow
IPO on NASDAQ in Dec
2006
Current market cap: $3,2B
Mail.Ru Group
Russian major online
portal and Internet
holding
IPO on LSE in Nov 2010
at $5.7B
Yandex
Russian Google
Founded in 2000 in
Moscow
IPO on NASDAQ in May
2011 at $8.4B
Qiwi
Russian major e-
payment system
IPO on NASDAQ in
May 2013
$1.0B market cap
Evernote
Popular note-taking
service founded by
Stepan Pachikov
Over $40 mln users
worldwide
Over $1.0B current
evaluation
Kaspersky Labs
World’s largest privately-
held vendor of software
security
Founded in Moscow in
1997
General Atlantic acquired
20% in secondaries for
$200M in January 2011
Parallels
One of the worlds leading
providers of virtualization
software
Founded in 1999 by
Sergey Beloussov
Backed by Bessemer,
Insight, Intel, Siguler Guff,
Cisco and Almaz
Ozon
Russian Amazon
Founded in Moscow in
1998
Backed by Baring Vostok,
Index, Alpha Associates
Now preparing for IPO
1997 2006 2011 2010 2013 … … …

14
Hi-tech opportunity: products and markets
Hi-tech today represents multibillion markets with tremendous growth rates
Clean Energy
Market in 2017: US$114,7 bln
CAGR: 12,5%+*
Huge market with growth
based on exponential increase
of energy demand
Market in 2017: US$329,1 bln
CAGR: 5,4%+*
The industry is already
operating at nanoscale,
driven by Moore’s Law
Market in 2017: US$13,1 bln
CAGR: 54,9%+*
Fast growing market based
on opportunity to operate
with molecules and
nano ‘building blocks’
Market in 2017: US$3,4 bln
CAGR: 100%+**
Perspective industry due
to the fundamental advantages
of photons in comparison
with electrons
* Source: VTB Capital research
** Source: marketsandmarkets.com
Materials
Electronics
Nanooptics
15
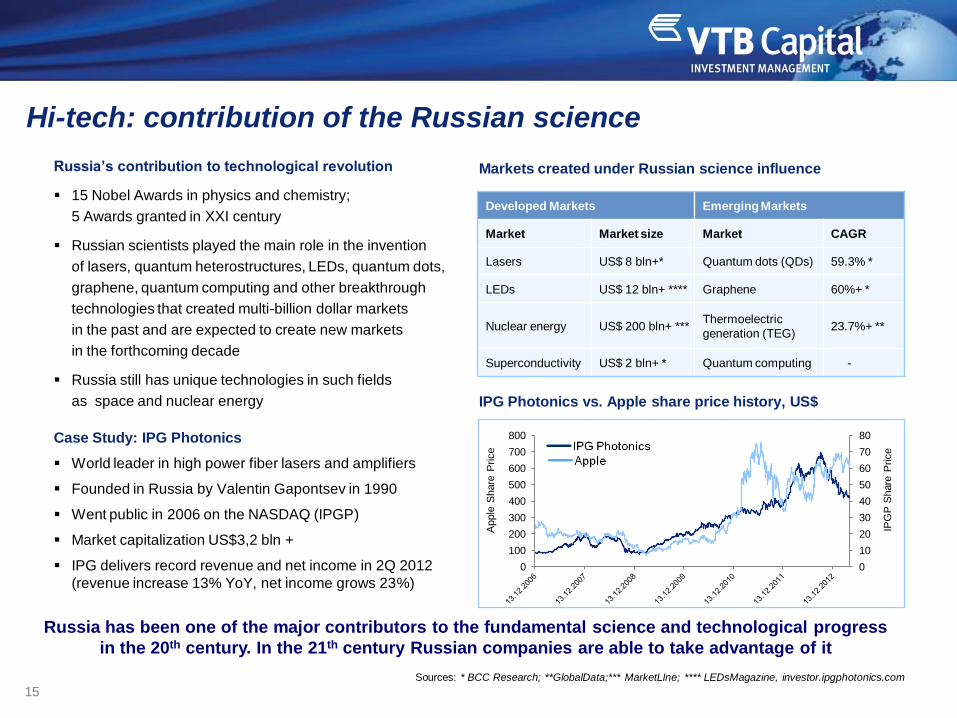
Russia’s contribution to technological revolution
15 Nobel Awards in physics and chemistry;
5 Awards granted in XXI century
Russian scientists played the main role in the invention
of lasers, quantum heterostructures, LEDs, quantum dots,
graphene, quantum computing and other breakthrough
technologies that created multi-billion dollar markets
in the past and are expected to create new markets
in the forthcoming decade
Russia still has unique technologies in such fields
as space and nuclear energy
Hi-tech: contribution of the Russian science
Developed Markets Emerging Markets
Market Market size Market CAGR
Lasers US$ 8 bln+* Quantum dots (QDs) 59.3% *
LEDs US$ 12 bln+ **** Graphene 60%+ *
Nuclear energy US$ 200 bln+ *** Thermoelectric
generation (TEG) 23.7%+ **
Superconductivity US$ 2 bln+ * Quantum computing -
Markets created under Russian science influence
Sources: * BCC Research; **GlobalData;*** MarketLIne; **** LEDsMagazine, investor.ipgphotonics.com
Russia has been one of the major contributors to the fundamental science and technological progress
in the 20th century. In the 21th century Russian companies are able to take advantage of it
Case Study: IPG Photonics
World leader in high power fiber lasers and amplifiers
Founded in Russia by Valentin Gapontsev in 1990
Went public in 2006 on the NASDAQ (IPGP)
Market capitalization US$3,2 bln +
IPG delivers record revenue and net income in 2Q 2012
(revenue increase 13% YoY, net income grows 23%)
IPG Photonics vs. Apple share price history, US$
0
10
20
30
40
50
60
70
80
0
100
200
300
400
500
600
700
800
IPG
P S
hare
Price
Apple
Share
Price
16
* Source: Ministry of Economic Development of the Russian Federation
** Source: EIU, UNESCO, Eurostat as of May 2012
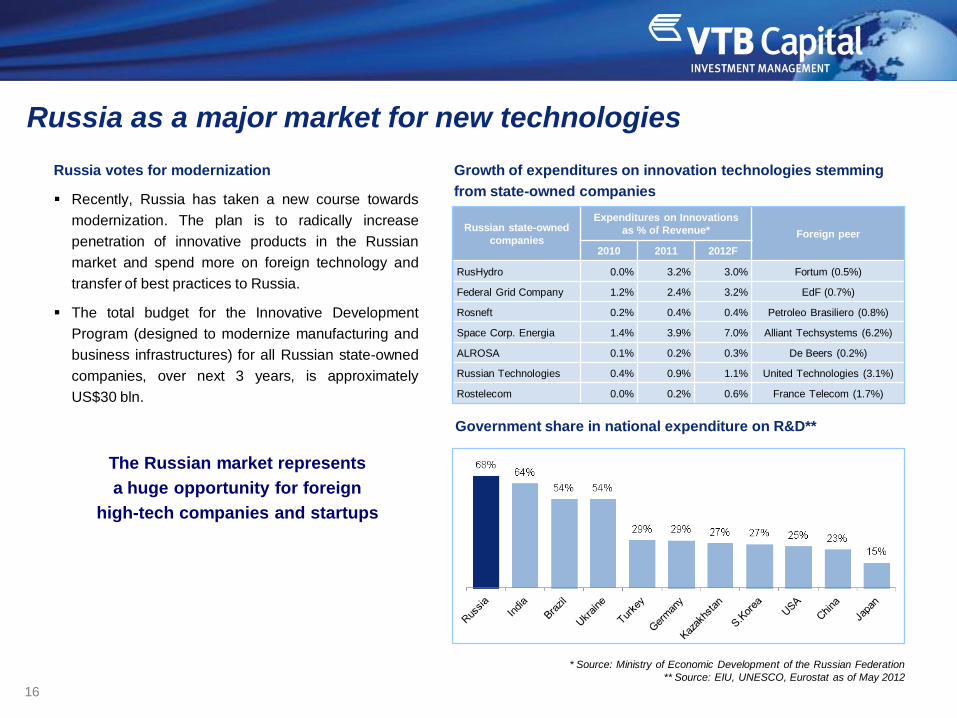
Russia as a major market for new technologies
Government share in national expenditure on R&D**
Russian state-owned
companies
Expenditures on Innovations
as % of Revenue* Foreign peer
2010 2011 2012F
RusHydro 0.0% 3.2% 3.0% Fortum (0.5%)
Federal Grid Company 1.2% 2.4% 3.2% EdF (0.7%)
Rosneft 0.2% 0.4% 0.4% Petroleo Brasiliero (0.8%)
Space Corp. Energia 1.4% 3.9% 7.0% Alliant Techsystems (6.2%)
ALROSA 0.1% 0.2% 0.3% De Beers (0.2%)
Russian Technologies 0.4% 0.9% 1.1% United Technologies (3.1%)
Rostelecom 0.0% 0.2% 0.6% France Telecom (1.7%)
Growth of expenditures on innovation technologies stemming
from state-owned companies
Russia votes for modernization
Recently, Russia has taken a new course towards
modernization. The plan is to radically increase
penetration of innovative products in the Russian
market and spend more on foreign technology and
transfer of best practices to Russia.
The total budget for the Innovative Development
Program (designed to modernize manufacturing and
business infrastructures) for all Russian state-owned
companies, over next 3 years, is approximately
US$30 bln.
The Russian market represents
a huge opportunity for foreign
high-tech companies and startups

17
Table of contents
Venture Capital Business of VTB Capital 3
Our Market 6
Our Strategy and Investments 16
Our War Chest 22

18
Global Markets
Taking global technologies to Russia Taking Russian technologies global
Silicon Valley start-ups with potential to penetrate the
Russian market
(later stage: rounds from C to pre-IPO)
Russian-origin start-ups developing and commercializing
products with unrevealed potential in the global markets
(early stage: rounds A and B)
Hi-tech, new materials, nanoelectronics,
nanophotonics, energy efficiency,
biopharmaceuticals
Enterprise software, cloud, big data and hi-tech
including space, nuclear technologies, new
materials, nanophotonics, quantum computing, etc.
Investment in local leaders
Technological enterprises – leaders and pioneers of their segment
inside Russia and CIS (early stage: rounds A and B)
Drivers of Growth
Fast growing middle class, healthy macroeconomics
Natural barriers for entry for foreign enterprises (language,
regulations, etc.)
Second largest internet audience in Europe, growing at 15% YoY
Global markets opportunity
Commercialization of Russian-originated IT
technologies leveraging Russia software expertise
Access to global technological companies,
involvement of foreign business executives and
investors, access to the developed innovative
infrastructure outside Russia
Direct access to one of the largest consumer
markets in Europe
Hugely underpenetrated market for innovative
technologies
VTB as strong local partner with direct access to all
major businesses and institutions inside Russia
Opportunity in Russia and CIS
E-commerce, e-payments, mobile, social, technology
Our investment strategy: leveraging Russia
Russia and CIS
40%
30% 30%

19
Leading developer of Internet
companies in Russia
Leading Russian online hotel
booking company
#1 genealogical social network
in Russia
Leading company in Russia & CIS
web-conferencing market
#1 company in mobile payments
in Russia
Leading company in Russian
NFC mobile payment market
Advanced technology platform
for large-scale eCommerce
PaaS provider of Dynamic Case
Management solutions
#1 Russian manufacturer of
laser cutting equipment
Pioneer manufacturer of skin
antiseptic in Russia
Our portfolio
#1 Russian vehicle-tracking
(GPS/GLONASS) company
Russian manufacturer of novel
microchannel plates
20
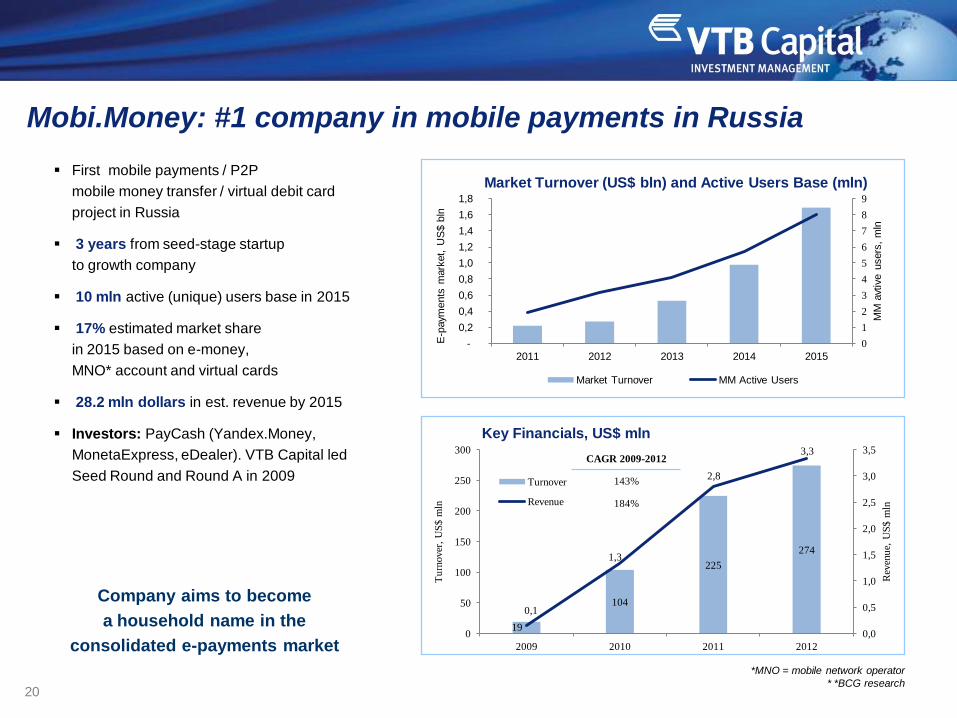
Mobi.Money: #1 company in mobile payments in Russia
First mobile payments / P2P
mobile money transfer / virtual debit card
project in Russia
3 years from seed-stage startup
to growth company
10 mln active (unique) users base in 2015
17% estimated market share
in 2015 based on e-money,
MNO* account and virtual cards
28.2 mln dollars in est. revenue by 2015
Investors: PayCash (Yandex.Money,
MonetaExpress, eDealer). VTB Capital led
Seed Round and Round A in 2009
Company aims to become
a household name in the
consolidated e-payments market
*MNO = mobile network operator
* *BCG research
Market Turnover (US$ bln) and Active Users Base (mln)
19
104
225
274
0,1
1,3
2,8
3,3
0,0
0,5
1,0
1,5
2,0
2,5
3,0
3,5
0
50
100
150
200
250
300
2009 2010 2011 2012
Rev
enu
e, U
S$
mln
Tu
rnover
, U
S$
mln
Key Financials, US$ mln
Turnover
Revenue
CAGR 2009-2012
143%
184%
0
1
2
3
4
5
6
7
8
9
-
0,2
0,4
0,6
0,8
1,0
1,2
1,4
1,6
1,8
2011 2012 2013 2014 2015
MM
avt
ive u
sers
, m
ln
E-p
aym
ents
mark
et, U
S$ b
ln
Market Turnover MM Active Users
21
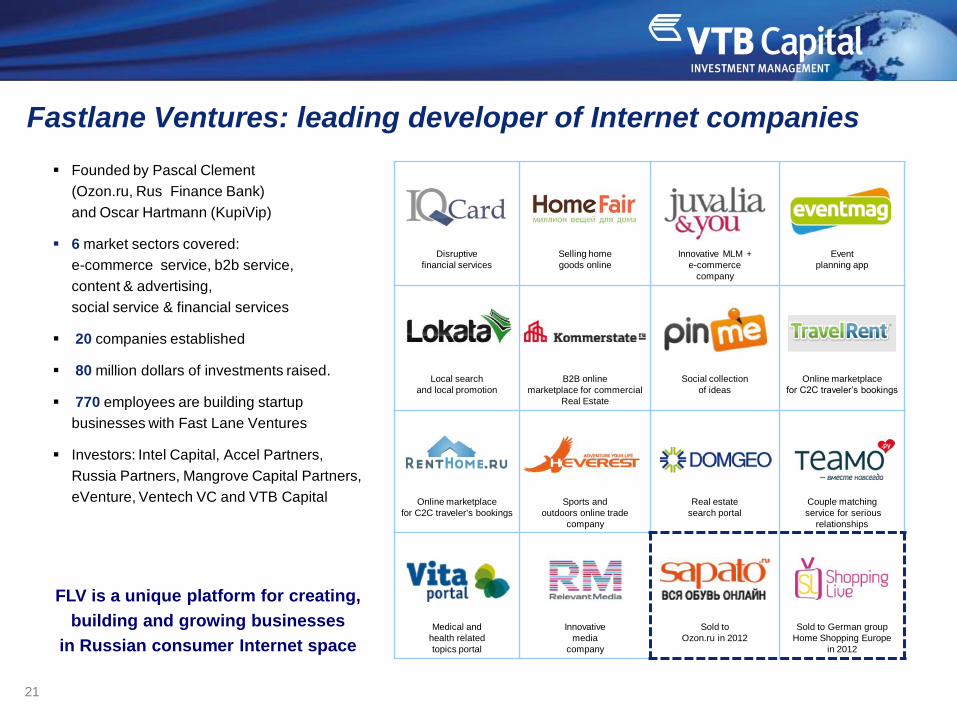
Fastlane Ventures: leading developer of Internet companies
Founded by Pascal Clement
(Ozon.ru, Rus Finance Bank)
and Oscar Hartmann (KupiVip)
6 market sectors covered:
e-commerce service, b2b service,
content & advertising,
social service & financial services
20 companies established
80 million dollars of investments raised.
770 employees are building startup
businesses with Fast Lane Ventures
Investors: Intel Capital, Accel Partners,
Russia Partners, Mangrove Capital Partners,
eVenture, Ventech VC and VTB Capital
FLV is a unique platform for creating,
building and growing businesses
in Russian consumer Internet space
Disruptive
financial services
Selling home
goods online
Innovative MLM +
e-commerce
company
Event
planning app
Local search
and local promotion
B2B online
marketplace for commercial
Real Estate
Social collection
of ideas
Online marketplace
for C2C traveler’s bookings
Online marketplace
for C2C traveler's bookings
Sports and
outdoors online trade
company
Real estate
search portal
Couple matching
service for serious
relationships
Medical and
health related
topics portal
Innovative
media
company
Sold to
Ozon.ru in 2012
Sold to German group
Home Shopping Europe
in 2012

22
RNT: pioneer in GLONASS and GPS smart fleet management
solutions
The first venture-backed IPO in Russia
(MICEX:RNAV, July 2010)
28% of the Russian market for vehicle tracking
solutions by number of installed units of
equipment
34%+ revenue CAGR during the last 4 years.
500+ investors, including institutional investors
and funds
4000+ clients in 9 countries of operations,
more than 92 dealers in 55 Russian regions
VTB Capital led round A in 2008
Company is expected to grow
by 50% during next 3 years
Installed Equipment, thousand units
Revenue, RUR mln
141 210
446
665
458
0
100
200
300
400
500
600
700
2008 2009 2010 2011 2012
60
101
170 190
0
20
40
60
80
100
120
140
160
180
200
2009 2010 2011 2012
* Company’s estimates

23
Table of contents
Venture Capital Business of VTB Capital 3
Our Market 6
Our Strategy and Investments 16
Our War Chest 22
24
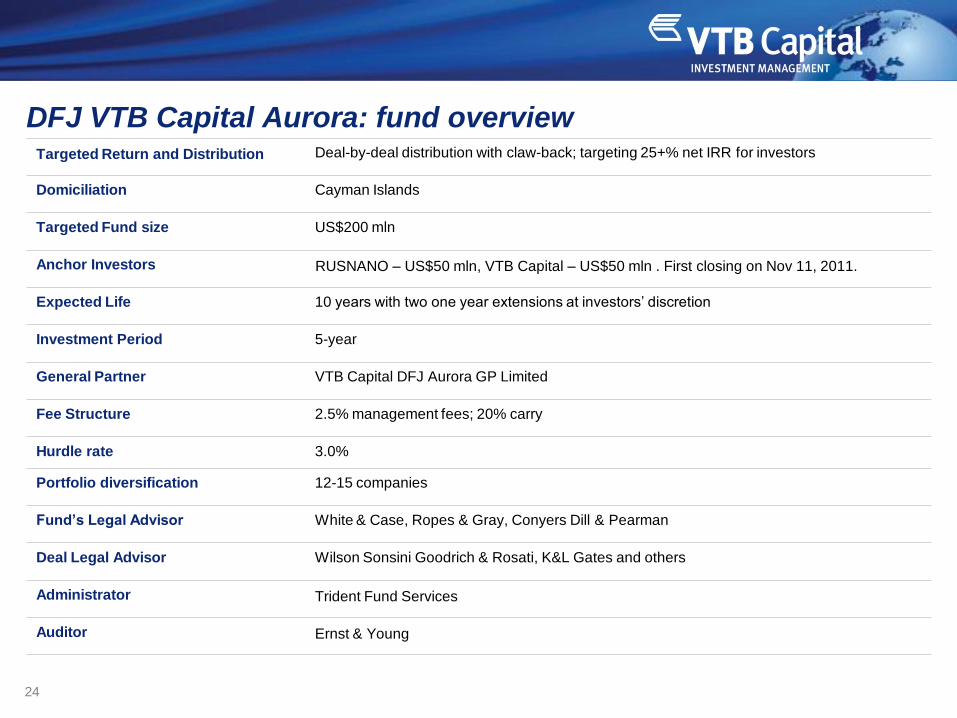
DFJ VTB Capital Aurora: fund overview
Targeted Return and Distribution Deal-by-deal distribution with claw-back; targeting 25+% net IRR for investors
Domiciliation Cayman Islands
Targeted Fund size US$200 mln
Anchor Investors RUSNANO – US$50 mln, VTB Capital – US$50 mln . First closing on Nov 11, 2011.
Expected Life 10 years with two one year extensions at investors’ discretion
Investment Period 5-year
General Partner VTB Capital DFJ Aurora GP Limited
Fee Structure 2.5% management fees; 20% carry
Hurdle rate 3.0%
Portfolio diversification 12-15 companies
Fund’s Legal Advisor White & Case, Ropes & Gray, Conyers Dill & Pearman
Deal Legal Advisor Wilson Sonsini Goodrich & Rosati, K&L Gates and others
Administrator Trident Fund Services
Auditor Ernst & Young

25
Partnerships
Asahi Glass Co (AGC):
Glass application development / Investor
SUSS Microtec AG:
Nanolithography equipment development
University of Michigan:
Mask fabrication materials & process technology Market
Rolith applications: nanostructured coatings for solar sells,
architectural glass and displays. Nanostructured coatings market:
US$1.1 bln – in 2009, US$3.5 bln – in 2015
Team
Boris Kobrin, CEO & Founder:
25 years experience in lithography and semiconductors industry
(Applied Microstructures, Onix Microsystems etc.)
Qualified technological team
Leading scientists from Stanford, University of Michigan,
Univ. of Illinois Urbana-Champaign are involved
Investors
DFJ VTB Capital Aurora: Round A lead (US$3 mln).
Asahi Glass Co (AGC): Seed (US$350k) + Round A
follow-up (US$2mln)
Technology
Near-field/soft lithography + cylindrical masks = sub-wavelength
resolution / scalability / low cost
“Rolling mask” specs: resolution ~ 10 nm; cost ~ US$2/m2;
throughput ~ 3 m2/min
Development Status
Prototype of “rolling mask” lithography
system is up and running
Nanopatterning technology
Is demonstrated on 300 mm wafers Intellectual Property
10+ Patents already filed (US and worldwide) & “know-how”
Rolith, Inc. is developing advanced technology and equipment for nanostructured coatings (anti-reflective, self-cleaning) for the solar panel,
display, and architectural glass markets using a proprietary nanolithography technology. Rolith is capable of making nanostructures cheaper,
faster, and over larger surface areas than currently existing technologies (Nanoimprint lithography, PVD, Sol-gel etc.)
Nature (mm2) Labs (cm2) Rolith (m2)
‘Scaling Nature’ Approach
Portfolio: Rolith

26
Samarium-Sulphide
Unique semiconductor rare earth material with phase transition
“semiconductor-metal” at 6.5 kBar
High levels of electron concentration in conduction band up to 1021
cм3 provide low sensitivity to impurity contamination
Isotropy of physical properties – polycrystalline material makes it
possible to use
SmS films deposited on different materials/substrates (metal, glass,
ceramic, silicon) have a suitable linear temperature expansion
coefficient
Products portfolio
Tenzosensors (Production stage)
Linear and high voltage output signal
High stability against radiation and strong magnetic fields
Wide temperature range -200 to +400°С
Thermoelectric generators, TEGs (R&D stage)
Generation without additional cooling and high efficiency
Can be designed as thin films
Portfolio: SmS Tenzotherm
SmS Tenzotherm GmbH is commercializing 30+ years experience of R&D in the field of the rare-earth Samarium Sulphide (SmS) semiconductors.
Unique properties of SmS open a path to advanced breakthrough products (Tenzosensors, Thermoelectrical generators).
Heat source
Seebek TEG
Heat source
SmS TEG
Cooling
Market
Sensors: US$6.3+ bln market in 2010
Application fields: Construction, oil & gas production, etc.
TEGs: US$1.3 bln market in 2012, CAGR >30%
Application example: Increasing solar panels efficiency by 100%,
cost savings of 25%
Russian-German collaboration
Ioffe Institute (Russia)
Transfer of developed IP to Germany, continuing R&D
MST Factory (Germany)
Manufacturing facilities for SmS products in Germany
Technical University of Dortmund (Germany)
Detailed characterization and fundamental studies of SmS
Intellectual property
Broad portfolio of “know-how” based on 30+ years experience
in Samaruim-Sulphide
Team
The world leading team in Samarium-Sulphide R&D, 30+ years
experience
Professional business team with successful exits in
semiconductor industry (Innolume, OptoGan)
Investors
Russian angel-investors: US$ 1mln (seed round)
DFJ VTB Capital Aurora: US$6 mln (Round A)
Russia’s Top 20
Best Start-ups 2013

27
Portfolio: Avalanche Technology
Avalanche is revolutionizing the US$ 70 bln computer memory market by developing a spin programmable memory (SPMEM) technology that by
itself, delivers on a number of key functional attributes found today only in separate memory technologies such as DRAM, SRAM, NOR and Flash
Technology
Proprietary Spin Programmable Memory (SPMEM)
Cell is 1/5th the size of any current memory device
Scalable beyond 10nm
Technology partners: US and Asian CMOS fabs
Team
Petro Estakhri (co-founder, CEO) took Lexar Media from a start-up
to $1B evaluation in less than 5 years including a successful IPO
and later acquisition by Micron
Dr. Rajiv Ranjan (co-founder, CTO)
former executive at Seagate and Komag
Dr. Yiming Huai (VP Technology), former CTO and co-founder
of Grandis, Inc., one of the pioneer in spin transfer torque magnetic
memory (STT-RAM), acquired by Samsung in 2011
Markets
Market #1: stand alone SPI & DDR end-products replacing current
NOR & HDD/SSD DRAM cache memory. Segment size: US$6+ bln.
Market #2: embedded STT MRAM solution for leading SOC
providers (BRCM, QCOM, NVIDIA) and large fabs (SMIC, Global,
TSMC, IBM, UMC). Segment size: US$10+ bln.
Market #3: STT MRAM enabled SSD’s. Segment size: US$10 bln.
Other Investors: The Fund co-invested US$8 mln in Round D
with US$22 mln from Sequoia Capital, Bessemer Venture Partners,
Vulcan Capital, Thomvest Ventures, and Qualcomm Ventures
Top 10 Most Promising
Storage Start-Ups in 2013

28
Portfolio: Fab.com
Social commerce platform, which allows people all over the globe to access everyday design objects from the world’s largest network of
designers. Fab is the fastest growing e-commerce company ever, having 600 employees in New York, Berlin and Pune (India) and selling
products in 26 countries all over the world.
0
500
1000
1500
2000
2500
2011 2012 2013 2014 2015
Turkey
India/Brazil/Russia
Japan
Europe
USA
New Design Discovery Paradigm in E-shopping Industry
Revenue Projections by Regions (2011-2015), US$ mln
Fab.com has raised over US$150mln from:
Andreessen Horowitz, Atomico, Baroda Ventures, Docomo, First Round
Capital, Mayfield Fund, Menlo Ventures, Pinnacle Ventures, RTP
Ventures, SoftTech VC, SV Angel, VTB Capital (US$7mln), Times
Internet, The Washington Post Company, Zelkova Ventures
verticals
Furniture & Art
Home ware
Home
accessories
Gifts
Fashion
accessories
Fashion
clothes
low price discovery
Today Fab sells 15,000 unique products
Fab sold US$25mln in the past 30 days
Fab’s gross margins are 40%+
11 million members
The average shipping time is 2 days across USA
Fab sells 23 products per minute
2012 sales will reach US$1113mln and will exceed US$247mln
in 2013
30% of sales come from Europe
(in 2011 100% of sales were from US customers)
56% of sales made via mobile devices on Christmas’12
50% of members come from social networks
65% are repeat buyers
Fab is after a US$70bln market (USA only)
The site was launched on 9 June, 2011 and just 18 months later:
Best E-Commerce
Application

29
DFJ Global Network
DFJ VTB Capital Aurora is the first and only DFJ Global Network fund in Russia and CIS
The DFJ Global Network is a unique global venture capital model encompassing a network of Network Partner
funds with operations in the US, China, India, Korea, Vietnam, Russia, Europe, Israel, Brazil, and Japan
representing over $7 billion in capital commitments and 600 funded portfolio companies.
Together, DFJ and the DFJ Network are the most active investors in the world.

30
Four reasons to invest
Why Russia?
World’s 6th largest economy (by GDP in PPP terms)
The most populated country in Europe
Rapidly growing middle class
Highest quality human capital in BRIC
One of the largest European Internet communities
Strong GR support of innovation policy
Why Venture Capital?
Counter-cycle asset class
Added value created by new technologies
Russia’s strong background in science
Investment to a better future
Why VTB Capital?
One of the most experienced Russian venture
capital firms
#1 Investment bank in Russia and CIS
Member of the DFJ Global Network
Part of VTB Group, the second largest financial group in
Russia and CIS
Why Now?
Russian Internet growth potential
First big exits achieved (Yandex, Mail.ru, Qiwi) with more
to come
Developed infrastructure for nanotechnology
commercialization
Multibillion markets for nanotech products
* See Catching Russian media with RuNet’, VTB Capital Research: March 27, 2012
31
Disclaimer
This is a marketing communication. It is not a research report. This document has been prepared by VTB Capital plc and/or one of its affiliates (“VTB Capital"), for information purposes only and is solely intended for the use of the intended
recipient(s). This document may include an indicative summary of the terms and conditions of the securities/transaction described herein and may be amended, superseded or replaced without notice. The conditions of the
securities/transaction will be set out in full in the applicable binding transaction document(s).
Not an offer: This document does not constitute an underwriting commitment, an offer of financing, an offer to sell, or the solicitation of an offer to buy or sell any securities described herein, which shall be subject to VTB Capital internal
approvals.
Not advice: VTB Capital is acting solely as principal and not as advisor or fiduciary. You must independently determine, with your own professional advisors, the appropriateness of any contemplated transaction or investment. No part of this
material constitutes tax, legal, accounting, financial or investment advice and should not be construed as such.VTB Capital accepts no liability whatsoever for any consequential losses arising from the use of this document or reliance on the
information contained herein.
Accuracy: Whilst every care has been taken in preparing this material, VTB Capital does not guarantee the accuracy or completeness of information which is contained in this document and which may have been obtained from or is based
upon data from third party sources. All information contained herein is subject to change without any notice. VTB Capital assumes no duty to update any of the content.
Opinions: Information and opinions contained herein have been compiled or arrived at by VTB Capital from publicly available information and sources that VTB Capital believes to be reliable. Any views expressed represent the personal
assessment of the author(s) only and do not necessarily reflect the views of VTB Capital and/or any of its worldwide affiliates (collectively, the “VTB Group”). All opinions and estimates are given as of the date hereof and are subject to
change.
Past performance: The value of any investment may fluctuate as a result of market changes. Past performance is not indicative of future performance. The information in this document is not intended to predict actual results and no
assurances are given with respect thereto.
Risks: Certain transactions, including futures, options and other derivatives, involve significant risk, and may not be suitable for all investors. Many persons, physical and legal, may be restricted from dealing in the securities
markets. Investors should perform their own due diligence before investing. Importantly, securities and financial instruments denominated in foreign currencies and ADRs and other investments are subject to exchange rate fluctuations that
may adversely affect the value of the investment. The value of investments may fall as well as rise and investors may not get back the amount invested.
Conflicts: The VTB Group may and may seek to do business with any companies covered in this material. Thus, investors should be aware that the VTB Group may have a conflict of interest that could affect the objectivity of this material.
The VTB Group, its officers, directors, and employees may from time to time have long or short positions in, act as principal in, and buy or sell, the securities or derivatives, if any, referred to in this material, and other divisions of the VTB
Group outside of the sales and trading division may perform investment banking or other services for any companies mentioned herein.
Professional Investors only: This material is intended only for persons regarded as investment professionals as defined in Article 19 of the Financial Services and Markets Act 2000 (Financial Promotion Order) 2001 or those that would be
classified as Eligible Counterparties or Professional Clients/Investors under the Financial Services Authority’s Conduct of Business rules (or equivalent outside of the UK) and is not intended to be distributed directly or indirectly to any other
class of person. It is not available to any retail investor. This material is intended for Institutional Investors only in connection with its distribution in the US.
THIS DOCUMENT DOES NOT DISCLOSE ALL THE RISKS AND OTHER ISSUES RELATED TO AN OR POTENTIAL INVESTMENT IN THE SECURITIES/TRANSACTION. PRIOR TO TRANSACTING, POTENTIAL INVESTORS SHOULD
ENSURE THAT THEY FULLY UNDERSTAND THE TERMS OF THE SECURITIES/TRANSACTION AND ANY RISKS ASSOCIATED THEREWITH. THIS DOCUMENT IS NOT A PROSPECTUS. INVESTORS SHOULD ONLY SUBSCRIBE
FOR ANY TRANSFERABLE SECURITIES DESCRIBED HEREIN ON THE BASIS OF INFORMATION IN THE LEGALLY BINDING TRANSACTION DOCUMENT(S) AND NOT ON THE BASIS OF ANY INFORMATION PROVIDED HEREIN.
VTB Capital plc is authorized and regulated in the United Kingdom by the Financial Services Authority, in Dubai by the Dubai Financial Services Authority, in Singapore by the Monetary Authority of Singapore and VTB Capital Hong Kong
Limited is licensed by the Securities and Futures Commission in Hong Kong. VTB Capital plc is a bank incorporated in England & Wales (registration no. 159752). VTB Capital Inc. is licensed and regulated in the United States by the
Financial Services Regulatory Authority (“FINRA”) and by the US Securities and Exchange Commission (“SEC”). VTB Capital plc and its affiliates are part of the investment business of JSC VTB Bank. This document is confidential, and no
part of it may be reproduced, distributed or transmitted without the prior written permission of VTB Capital.
Copyright VTB Capital 2012 (all rights reserved).
Alexander Pankov
Director
E-mail: [email protected]
Telephone: +7 (495) 725 55 40
Aidar Kaliev
Global Head of Venture Capital
E-mail: [email protected]
Telephone: +7 (495) 725 55 40
www.vtbcapital-im.com
Contact information


