6. S. D. Tayabji and E. J. Barenberg. Evaluation of Pavement Drainage Systems Made of Layers of Open-Graded Bituminous Aggregate Mixtures. TRB, Transportation Research Record 532, 1975, pp. 49-63. 7. J. H. Haynes and E. J. Yoder. Effect of Repeated Loading on Gravel and Crushed Stone Base Material Used in the AASHO Road Test. HRB, Highway Re- search Record 39, 1963, pp. 82-96. 8. E. J. Barenberg and B. P. Hazarika. Use of Uni- versity oflllinois Test Track to Evaluate Pavement Performance. TRB, Transportation Research Record 572, 1976, pp. 38-50. 9. E. J. Yoder. Principles of Pavement Design. Wiley, New York, 1959, pp. 21-32. 10. C. R. Foster and R. G. Ahlvin. Stresses and De- flections Induced by a Uniform Circular Load. Proc., HRB, Vol. 33, 1954, pp. 467-470. 11. D. M. Burmister . The Theory of Stresses and Displacements in Layered Systems and Applications to the Design of Airport Runways. Proc., HRB, Vol. 23, 1943, pp. 126-144. 75 12. A. W. Skempton. The Bearing Capacity of Clays. Proc., British Building Research Cong1·ess, Vol. 1, 1051, pp. 180-189. 13. L. Prantl. Penetrating Strengths of Plastic Con- struction Materials. Mathematical Mechanics, Vol. 1, 1921, pp. 15-20. 14. S. Rodin. Ability of a Clay Fill to Support Con- struction Plant. Journal of Terramechanics, Vol. 2, No. 4, 1965, pp. 51-68. 15. E. J. Barenberg, J. Hales, andJ. Dowland. Evaluation of Soil-Aggregate Systems with MIRAFI Fabric. Univ. of Illinois, Aug. 1975. 16. R. G. Ahlvin. Flexible Pavement Design Criteria. Journal of the Aerospace Transport Division, Proc., ASCE, Vol. 88, No. AT 1, 1962. Publication of this paper sponsored by Committee on Strength and De- formation Characteristics of Pavement Sections. Rutting Evaluation of Subgrade Soils in Ohio Kamran Majidzadeh, Fouad Bayomy, and Safwan Khedr, Department of Civil Engineering, Ohio State University The results of several previous investigations have led to the conclusion that rutting criteria should be included in any pavement design method- ology that attempts to achieve the goal of improved pavement service- ability. Moreover, in some practical cases, it is necessary to estimate the rutting expected to occur in a pavement system during a certain period. Therefore, it is necessary to develop a scheme for the estimation of rut- ting. Because it is the foundation of the pavement, the subgrade makes a considerable contribution to its rutting. The objective of this research was to study the rutting in subgrade soils experimentally. The rate- process theory approach was used for the analysis of the results. Five types of silty soils were obtained from four different construction sites in Ohio, and laboratory-prepared samples were used for uniaxial dynamic testing. A direct general relationship that relates rutting to the dynamic modulus and the applied stress level was developed. On the basis of that relationship, a scheme for the estimation of subgrade permanent deforma- tion is proposed and design nomographs for the soils studied were devel- oped. The findings of this study are limited to the types of soils (silty and clayey) tested; further studies should indicate their applicability to other materials also. In recent years, extensive studies have been carried out to develop various rational pavement design schemes and material-characterization techniques for use in evalu- ating pavement-component responses to loading and en- vironmental conditions. The analysis of permanent deformation (i.e., rutting) in a pavement system is an important element of many of the proposed rational pavement design schemes that require detailed consideration of the progressive accumulation of plastic strains in each layer of a pave- ment subsystem and its supporting layers. It has been estimated in the AASHTO Road Test that,in some cases, the subgrade layer contributes up to 19 percent of the total pavement system rutting. Therefore, i·utting in the Subgrade may be critical, especially for subgrades subjected to saturation for long periods and for weaker subgrades in which excessive permanent deformations are unavoidable. Hence, sub- grade i·utting should be considered in any new design methodology. In rational.design systems, the soil properties are described by tile subgrade modulus or modulus of re- silience (MR), which is dependent on the deviatoric stress, which, in turn, is influenced by load intensity and pavement geometric characteristics. The MR is also greatly dependent on the type of soil. From the pave- ment designer's viewpoint, although the knowledge of modulus versus stress and modulus versus type of soil relations are required, this information is not entirely sufficient. To estimate pavement rutting, there are two additional basic requirements: (a) a determinati on of environmental effects and (JJ) a determination of the properties affecting soil rutting under repeated loading. Thus, the problem is to develop a mechanistic pro- cedure for estimating the amount of rutting that will occur in a selected or designed pavement structure to be constructed in an area that has known climatic char- acteristics. One approach to the estimation of subgrade rutting involves limiting the vertical compressive strain at the subgra de surface to some tolerable level that is asso- ciated with a specific number of load repetitions (1). By controlling the material characteristics and the pave- ment thickness so that the strain level is not exceeded, a permanent deformation that is less than or equal to the presc1·ibed limit is ensured. The suggested limiting criteria depend on the method of analysis, the stiff-
Transcript
6. S. D. Tayabji and E. J. Barenberg. Evaluation of Pavement Drainage Systems Made of Layers of Open-Graded Bituminous Aggregate Mixtures. TRB, Transportation Research Record 532, 1975, pp. 49-63.
7. J. H. Haynes and E. J. Yoder. Effect of Repeated Loading on Gravel and Crushed Stone Base Material Used in the AASHO Road Test. HRB, Highway Research Record 39, 1963, pp. 82-96.
8. E. J. Barenberg and B. P. Hazarika. Use of University oflllinois Test Track to Evaluate Pavement Performance. TRB, Transportation Research Record 572, 1976, pp. 38-50.
9. E. J. Yoder. Principles of Pavement Design. Wiley, New York, 1959, pp. 21-32.
10. C. R. Foster and R. G. Ahlvin. Stresses and Deflections Induced by a Uniform Circular Load. Proc., HRB, Vol. 33, 1954, pp. 467-470.
11. D. M. Burmister. The Theory of Stresses and Displacements in Layered Systems and Applications
to the Design of Airport Runways. Proc., HRB, Vol. 23, 1943, pp. 126-144.
75
12. A. W. Skempton. The Bearing Capacity of Clays. Proc., British Building Research Cong1·ess, Vol. 1, 1051, pp. 180-189.
13. L. Prantl. Penetrating Strengths of Plastic Construction Materials. Mathematical Mechanics, Vol. 1, 1921, pp. 15-20.
14. S. Rodin. Ability of a Clay Fill to Support Construction Plant. Journal of Terramechanics, Vol. 2, No. 4, 1965, pp. 51-68.
15. E. J. Barenberg, J. Hales, andJ. Dowland. Evaluation of Soil-Aggregate Systems with MIRAFI Fabric. Univ. of Illinois, Aug. 1975.
16. R. G. Ahlvin. Flexible Pavement Design Criteria. Journal of the Aerospace Transport Division, Proc., ASCE, Vol. 88, No. AT 1, 1962.
Publication of this paper sponsored by Committee on Strength and Deformation Characteristics of Pavement Sections.
Rutting Evaluation of Subgrade Soils in Ohio Kamran Majidzadeh, Fouad Bayomy, and Safwan Khedr, Department of Civil
Engineering, Ohio State University
The results of several previous investigations have led to the conclusion that rutting criteria should be included in any pavement design methodology that attempts to achieve the goal of improved pavement serviceability. Moreover, in some practical cases, it is necessary to estimate the rutting expected to occur in a pavement system during a certain period. Therefore, it is necessary to develop a scheme for the estimation of rutting. Because it is the foundation of the pavement, the subgrade makes a considerable contribution to its rutting. The objective of this research was to study the rutting in subgrade soils experimentally. The rateprocess theory approach was used for the analysis of the results. Five types of silty soils were obtained from four different construction sites in Ohio, and laboratory-prepared samples were used for uniaxial dynamic testing. A direct general relationship that relates rutting to the dynamic modulus and the applied stress level was developed. On the basis of that relationship, a scheme for the estimation of subgrade permanent deformation is proposed and design nomographs for the soils studied were developed. The findings of this study are limited to the types of soils (silty and clayey) tested; further studies should indicate their applicability to other materials also.
In recent years, extensive studies have been carried out to develop various rational pavement design schemes and material-characterization techniques for use in evaluating pavement-component responses to loading and environmental conditions.
The analysis of permanent deformation (i.e., rutting) in a pavement system is an important element of many of the proposed rational pavement design schemes that require detailed consideration of the progressive accumulation of plastic strains in each layer of a pavement subsystem and its supporting layers.
It has been estimated in the AASHTO Road Test that,in some cases, the subgrade layer contributes up to 19 percent of the total pavement system rutting.
Therefore, i·utting in the Subgrade may be critical, especially for subgrades subjected to saturation for long periods and for weaker subgrades in which excessive permanent deformations are unavoidable . Hence, subgrade i·utting should be considered in any new design methodology.
In rational.design systems, the soil properties are described by tile subgrade modulus or modulus of resilience (MR), which is dependent on the deviatoric stress, which, in turn, is influenced by load intensity and pavement geometric characteristics. The MR is also greatly dependent on the type of soil. From the pavement designer's viewpoint, although the knowledge of modulus versus stress and modulus versus type of soil relations are required, this information is not entirely sufficient. To estimate pavement rutting, there are two additional basic requirements: (a) a determination of environmental effects and (JJ) a determination of the properties affecting soil rutting under repeated loading.
Thus, the problem is to develop a mechanistic procedure for estimating the amount of rutting that will occur in a selected or designed pavement structure to be constructed in an area that has known climatic characteristics.
One approach to the estimation of subgrade rutting involves limiting the vertical compressive strain at the subgrade surface to some tolerable level that is associated with a specific number of load repetitions (1). By controlling the material characteristics and the pavement thickness so that the strain level is not exceeded, a permanent deformation that is less than or equal to the presc1·ibed limit is ensured. The suggested limiting criteria depend on the method of analysis, the stiff-
76
Table 1. ASTM standards Liquid Plaetlc Plaeticlty (soil properties and soil Soll Project Limit Limit Index
classifications). No. County No. Location (:I\) (:') (:Ill
Soll Claee!Cication Specific Gravity" Unified AASHO FAA
l Auglaize 39-75 Greenville Road 18.6 13.2 5.4 2.720 SM A-4 E-3 2 Carroll 2-75 0-542 23.2 12.8 5.4 2.705 SM A-4 E-6 3 Licking 239-75 0-21 N (top 23.9 17. 7 6.2 2.631 ML-CL A-4 E-6
layer) 4 Licking 239-75 0-21 N (bottom NA NA 2.691 SM A-2-4 E-2
nesses, and the Poisson's ratios for each sublayer. The material characteristics considered in a pavement design should be within the same range as those used in the limiting analysis; otherwise, the resulting analysis will have little significance.
A Rer.rmct fl.pprofl.~h is to i:>stimate the rutting that results from repeated traffic loading over the design period. For subgrade rutting, Majidzadeh and others (2) and Monismith and others (3) have established the z.·elation
(!)
where
E:• = permanent strain, N =number of stress repetitions, and
A and m =rutting parameters; A = E:• at N = 1, and m is the slope of the straight-line relationship between log (E:./N) and log N.
Majidzadeh based this finding on a relationship between the creep strain versus time and plastic strain versus number of load applications relationships. Mitchell and others (4) had proposed a similar relationship for creep, based onthe rate process theory. Experimental studies (2, 5, 7) have suppo1·ted the validity of this i·elationship for a practical wide range of soil types, applied dynamic stresses, and environmental conditions.
Khedr (5) and Majidzadeh and others (6), in correlating the pa1::imeter A in Equation 1 to the modulus of resilience at a constant applied stress, have established the relationship
A= KIE*l 8 (2)
where
IE* I =dynamic modulus of resilience (i.e., magnitude of dynamic modulus) and
K and S = parameters that depend on applied dynamic stress .
Their findings that the parameter m is almost constant is also s upported by a statistical analysis of m-values by Bayomy (7).
In this stUCiy, the variation of A with stress level was investigated for different types of silty soils in various as-compacted and saturated conditions. The purpose was to develop a rutting estimation scheme for the subgrade that considers most of the possible influencing factors.
SOILS TESTED
In the laboratory phase of this study, five soils were obtained from four different locations in Ohio. Each soil was brought from the field, oven dried, and sieved through a 12. 7-mm (0. 5-in) sieve. The grain-size distribution was determined for each soil by using both the washing method and hydromet.er iimlyRiR. Standard soil identification and classification tests were carried out; the pe1·tinent p1·operties are summarized in Table 1 (7, 10). Figure 1 shows the unconfined-strength curves fur these soils. The :;Euuple:; Jut:a::;ured 70. 6 nun (2. 78 in) in diameter and 145-152 mm (5. 7-6.0 in) in height and were compacted by using drop-hammer compaction.
Uniaxial dynamic tests were performed on the laboratory-prepared soil samples. To avoid the effects of aging, the dynamic modulus (Mii) was determined after the first 2000 cycles were applied. Rutting curves (permanent deformation versus number of load repetitions) were measured for each sample before and after saturation to determine the corresponding subgrade rutting parameters (i.e., A and m).
ANALYSIS OF RESULTS
The parameter A is dependent on soil type and structure, moisture content, dry density, and dynamic stress level. In previous research (5, 6, 7), IE* I has been shown to represent soil structure, moisture content, and dry density. And, according to Equation 2, A is a function of dynamic modulus and applied stress. The relationship between E* and the applied stress (a.P1) is discussed in the following section.
Figure 2. Relationship between E* and a apt for different types of soil.
m ....
20, 000
~ 16, 000
ll.
Figure 3. Relationship between E* and aapl'
. .... • u .
12, 000
8, 000
4, 000
600-
.; 400
• "' . .:l " .,, :i!
200
0
-·- 0 Soll #1
' -· Soll #2
-- 0 Soll f3
W/C yd (Kg/m9)
8. 55 2221. 76
U.62 2006. 51
16. 53 1809. 45
I e ,. -·-0 Soll #5 17. 54 1862.15 ,. Note: 1 Pa= 0.000 145 lbf/in2 and 1 kg/m3 = 0.062 lb/in' .
Figures 2 and 3 show the general relationship between E* and O'apt for the soils used. The dynamic modulus generally is found to decrease rapidly with an increase in applied dynamic stress up to a certain level; then there is a slight increase in E* until, finally, it tends to converge to a steady value in the higher range of applied stresses. These results generally agree with the relationships proposed by Majidzadeh and others (2) and by Seed and others (8). -
For the range of applied stresses considered in this study, the E*-values were found to be almost constant above approximately 55.2 kPa (8 lbf/in2
). The consistency of E* in this range for each moisture content and dry density for all soils supports the choice of E* as a representative material characteristic in that its value
reflects such material properties as dry density, moistw·e content, and soil structure. Therefore, the dynamic modulus (Le., E*) is a material property that is dependent on soil type, applied stress, and moisture content.
In the Dynaflect in situ measurement of M. , the stresses in the subgrade under Dynaflect dynamic loading are considerably lower than tllose under the 40.5-kN (9000-lbf) design wheel load. Because of the stress dependency of the soil mvdulus, the dynamic modulus calculated from field Dynaflect measurements should be adjusted to represent the actual traffic loading conditions. The measured modulus values are higher than those under actual in situ support conditions. The laboratory dynamic modulus or field-adjusted dynamic modulus is then incorporated into the rational pavement design models.
-""'! """
78
Figure 4. Relationship between A and o•P• (soil no. 3 Licking County; top layer). 250
200
150
x
< 100
50
W/C Yd (Kg/uh
V 13.5 ± 0.15
• 11.5 ;!:_0.15
1946. 24
1962. 26
0 9.5 ± 0.25 1922.22
Note: 1 Pa • 0.000 145 lbf/in2 and 1 kg/m3 = 0.062 lbf/in3.
• • __ ...;OIL.- - ~--u-
9 • ---
Paramele1~ A
The experimental data indicate that the rutting parameter 11• and dynamic modulus E* are interrelated. The general relationship observed is that A increases as E* decreases and is dependent on O'apl· Although the variation of A is greatly dependent on O'apt in the wet range of soil conditions, this dependency may not have much signifi-
Figure 5. Relationship between A and I E *I at different applied stresses (soil no. 2).
10
crap!. (pascals)
---- 0 . 56.81 x io3
--- D • 85.22 x 10³
·- 0 • 113.56 x 10³
' \ ' ' • • t • Saturated Samples \
o a O v As Compacted o \
Note: 1Pa • 0.000 145 lbf/in2 •
100
170.04 x 10 1
' '
0 '
Dynamic Modulus E11 ( x 106 Pascals)
1,000
•
o;,pl. ( x 103 pascals)
cance on the dry side of optimum, as shown, for example, for soil no. 3 in Figure 4.
Figure 5 shows the relationship between A and E* on a log-log graph at a constant O'apf for soil no. 2. This straight-line relationship is consistent with Equation 2. As can be seen in this figure, these straight lines at different stresses are not generally parallel, and there are greater deviations in the wet range (low E* values). Unconfined ultimate compressive strength (au11) was thought to be the missing factor. To include this factor in the relationship between A, E*, and O'aph Figure 6 shows the linear relationship between log [A/exp(a,p1/0'u11)J and log E*
Figure 6. Rutting master curve: soil no. 2.
• -~ . -- . - ~~, ,· Correlotlon Fac tor
0.90194 1 I I • ".\ . • Noto : 1 Pa= 0.000 145 lbf/ln2 •
0. )( .,
..... <t
10
i~ >c ... . ' ~ • • ,. ,-, . ~
-~ •• •
100 Dynamic Modulus E'* (x 106 Pascals)
~ -
1,000
79
Table 2. Constants No. of F"
for rutting master Soil Samples Critical curve and test of No. County (N) R c rs CORR CORR Calculated 0.05, 1, n-2 linearity for soils used. 1 Auglaize 47 2.812 • 106 1.180 12.580 0. 759 26 0.285 61.250 4.06
11 Null hypothes'ls 11 log R • C • 0, and decillon is rejttet If F calculated > Ft (from table); i.e., accept linearity. 'Undluurb<!d llold samplo• of natu ral silty cloy [Khodr dorn l§l). • uborotorv·prtpared somplos o f ar1ilicial cloy ( Khedr dot• ~) .
Figure 7. Rutting 10-Z
master curve: artificial clay samples.
•
•
~ Correlation Factor "" 0.84595
Note: 1 Pa= 0.000 145 lbf/in 2 •
tT--"'-.• 10-3
._. - '• .•.. : I X' • ~ •• ~ •• • I
u ..... b "
. ~ .. ft(. . •
• • . ,-~ ,
0. ~
~ 0. ~ . <
10-4
. -~- ·')··· . ' , ·- : . ~-. • •• ~~ •
• =·~ ·~ :: .1 • --1· _,__
r I io8
Dynamic Modulus E* (pascals x io6)
for soil no. 2: Thus, this relationship can be written in the form
(3)
where R ana C are material constants and independent of U1e variables involved. The results found for Ute other types of soils were considered consistent with this analysis .
Equation 3 represents a master curve for each type of soil PY which the A can be directly determined fo1· any soil condition when obtaining Ute constants R and C. For the soils considered in this study, these constants and the correlation coefficients (CORR) were obtained for each relationship (see Figure 6). The CORR-values were compared with the critical coefficients for a 0.05 level of significance and were accepted, as shown in Table 2. To verify the linea1·ity of the proposed relationship, a statistical F-test was conducted for all relationships; it was found Ulat the linearity is valid.
The applicability of the model for other types of subgrade material was also investigated. Test data for undisturbed field samples from Cuyahoga and F1:anklin counties (soils no. 6 and 7), as well as for two groups of laboratory-prepared samples (soils no. 8 and 9) made of arUficial kaolin clay and silty clay (5), were reasonably consistent with this model. Figure 7-shows Ute master curve for the artificial clay samples. The proposed relationship appears to be general and is applicable for all soils in U1e silty or clayey categories. Further studies are recommended for soils in the wet and s-aturated conditions, to be validated in bulk media as well as for other types of granular materials that might be used as subgrades or subbases in pavement subsystems.
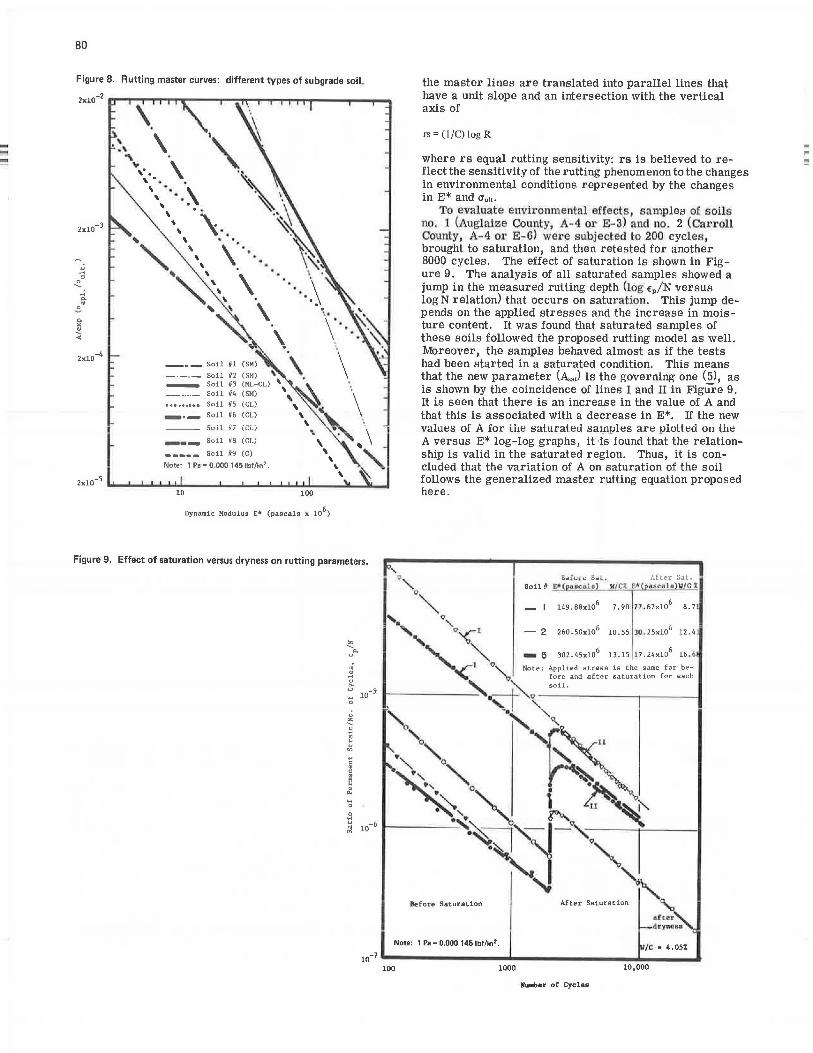
The va1·iation of soil effect on A ls summarized in Figure 8, which represents all of the relationships for the soils investigated by straight lines on a log-log graph.
Figure 9. Effect of saturation versus dryness on rutting parameters.
~ w°" . ~ "' u 10-7
'H 0
0 ~ .:i • !:l "' u
" . " • ~ " 'H 0
.s ~ 10-6
'°' Q'
the master lines are translated into parallel lines that have a unit slope and an intersection with the vertical axis of
rs= (l/C) log R
where rs equal rutting sensitivity: rs is believed to reflect the sensUi vity of the rutting phenomenon to the changes in environmental conditions represented by the changes in E* and O'uu.
To evaluate envu:onmental effects , samples of s oils no. 1 (Auglaize County, A-4 or E-3) and no. 2 (Cai-roll County, A-4 or E- 6) were subj ected to 200 cycles, brought to saturation, and then retested for another 8000 cycles. The effect of saturation is shown in Figure 9. The analysis of all saturated samples showed a jump in the measured rutting depth (log E"p/N versus log N relation) that occurs on saturation. This jump depends on the applied stresses and the increase in moisture content. It was found that saturated samples of these soils followed the proposed rutting model as well. Moreover, the samples behaved almost as if the tests had been started in a saturated condition. This means that the new parameter (A..1) is the governing one (5), as is shown by the coincidence of lines I and II in Figure 9. It is seen that there is an increase in the value of A and that this is associated With a decrease in E*. If the new values of A for the saturated samples are plotted on the A versus E* log-log graphs, it·is found that the relationship is valid in the saturated region. Thus, it is concluded that the variation of A on saturation of the soil follows the generalized master rutting equation proposed here.
After Sat. II/ct E•(o .. c•l•)ll/C %
o"' -1 149. 8Bxl06 7.90 17.67xl0
6 8. 71
' · " ' O~t - 2 260.50x10⁶
10.55 30 . 25x106
12.4
' ""' - 5 302.45x10⁶
13.15 17.24x10⁶
16 . 6 "'...,...-1 "'- Note: Applied stress is the same for be-" Q fore and after saturation for each
The parameter m in Equation 1 is the absolute value of the slope of the log (£,/N) versus log N straight line. An overall look at the m-values shows that they are almost constant-all values except those for a few points in soil no . 5 are between 0.83 and 0.94 . A one-way analysis of variance in m-means with a multiple comparison was conducted by using the Statistical Package for Social Sciences program (9) to determine if there is a significant difference in these values. Three techniques (Tukey (B), Tukey, and Scheffe) were used. The results obtained by using the Tukey (B) and Tukey techniques show no significant differences in their means for soils no . 1, 2, 3, and 4, although there is a difference in the means for soil no. 5. The results obtained by using the Scheffe technique showed no significant differences in the means for all the soils. From an engineering point of view, we can conclude that there is no significant difference in the mean values and that m is an almost universal constant for the group of soils considered in this study and ranges between 0.85 and 0.90 (see Figure 10).
To validate this conclusion, data from previous Ohio State University research (5) were analyzed for variations in m. The mean values were calculated, and it was found that they lie within the same range . These results are summarized below.
The parameter m was also investigated for saturated samples of soils no. 1 and 2, and it was noted that the
Figure 10. Relationship between m and E * for all soi Is.
l.O
81
m-values are almost the same, whether calculated separately for a saturated condition or as a continuation of a presaturation test.
To determine the effect of saturation on the m, the values were plotted against E* for both before and after saturation (Figure 11) . As shown in this figure, there is no pronounced change in m on saturation, although some samples did show slight decreases. At-test on the difference in the means before and after saturation was conducted; the results, summarized below, showed that, statistically, there is no significant difference in the mean m-values, and it was concluded that there is no significant change in this parameter on saturation.
Item Value Item Value
Number SD Before 26 Before 0.024 After 27 After 0.028
Mean value t Before 0.885 Calculated -0.820 26 After 0.891 Critical ±1.998 8
DEVELOPMENT OF DESIGN GUIDELINES FOR RUT-DEPTH DETERMINATION
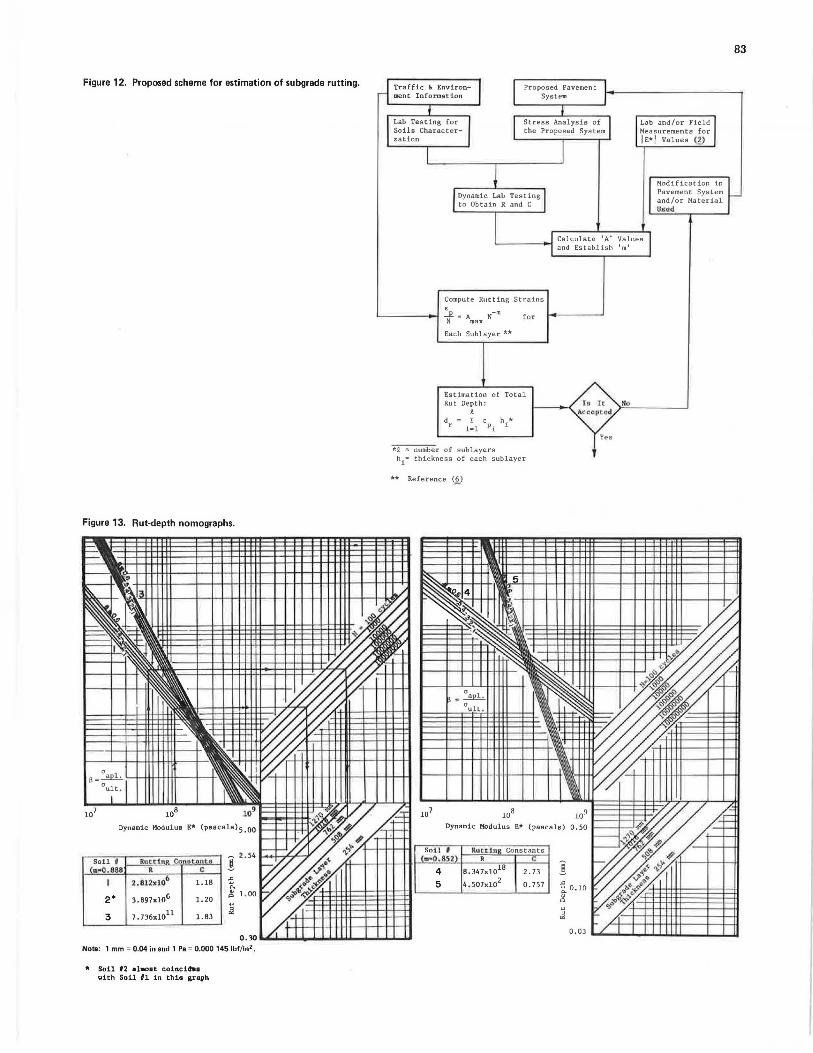
The par ameters A and m must be consider ed for a full evalua tion of subgrade permanent deformation. The experimental relationship fou nd in this study a (ld the determination of m for various types of subgrade soils can help the pavement design engineer to determine the amount of i·utting in the subgrade at any stage of pavement service life. A systematic procedure is developed here to give a quick and r easona bly accurate estimation of the rut depth. This pr ocedu1•e is summarized by the block diagram in Figure 12 and illustrated by the numerical example given below:
Assume a s ubg1·ade soil s imilar t o that of Auglaize County (s oil no . 1, R = 2.812 x 10⁸
, C = 1.18, and m = 0.888) and a soil condition t hat gives (1 MPa = 145 lbf/in2 and 1 mm = 0.04 in)
• Soil Ill
0 Soil f/2
o Soil 03
• Soil 114
0 0 sou 15 ""Q':(jg- ---..ll..- - -~o- - -- o - -o--- -Q ~ '· •• 0 0 'O •
0. 94
0 ~ ~· 0 Qt ~· ·- ~ • 170 0 0 0 0 0 " ~ D De. • e e 0 0 O D
• "o•••. a oo • •• • 0 0 s. 0 ~ .£.. __ _ • •
00 i--o - - o- - "--o"- -o-;.,-----
0. 9
0.83
0 . 8 0
• a
o. 7
• 0. 6
Note: 1 Pa • 0.000 145 lbl/in 2 •
50 100 150 200 250 300 350 400 450 500
Dynamic Modulus Ellr (x 10 3 pascals)
82
Soil at
Compaction Saturation
E* (MPa)
103.4 55.2
0.2 0.4
h (mm)
762 762
Determine the rut depth at compaction and at saturation by assuming N = 10 000 cycles for both conditions.
At compaction,
Equation 3 ........ A= 2.812 (10 6)(103.41 x 10 6)-
10- 3, and d, = f:p x h = 3.362 72 x 762 = 2.5624 mm
(0 .1009 in).
At saturation,
Equation 3 .... A= 2.812(10 6)(55.2 x 10 6)-
1•
18 x e0•
4 = 3.0734 x 10- 3 _
Equation 1 .... f:p = 3. 0734 x 10- 3(10 000)1- 0•888 = 8. 6222 x
10- 3, and d, 8.6222 x 10-a x 762 = 6.57 mm (0.2587 in) .
Based on the values determined for m for each soil group and by using the equations developed above, a rutdepth determination nomograph was developed for each category of soils that have the same m. These nomographs are shown in Figure 13.
The above example can be solved directly by using these nomographs as discussed below.
Following the line ........ in Figure 13, this subgrade is expected to have a rut depth (d,) of 2.56 mm (0 .1009 in) after a service life of N = 10 000 cycles. For the saturated condition where E* = 55.2 MPa and fJ = 0.4, the rut depth is determined by following the line .... , which gives d, = 6. 5 mm (0.256 in) for the same N-value.
SUMMARY AND CONCLUSIONS
1. The rutting model-t:p/N = AN-"-is applicable to the fine-grained soils investigated in this study.
2. The dynamic modulus IE* I is an appropriate measure that refiects the moisture content, the dry density, and the soil structure as far as the rutting process is concerned.
Figure 11. Effect of saturation on m: (suii nu. i, AugiC:ti.tt= Cou.-1ty}.
:-" ~ i " ~ ..
1.0
0.8
0.6
0.4
" " ~\ " " " " . " ' " " '"" "".
Note: 1 Pa= 0.000 145 lbf/in2
3. The parameter m was found to be constant and to vary between 0.85 and 0.90 and have a grand mean of 0.872, which could be considered in the evaluation of subgrade rutting potential. There is no statistically significant change in this parameter before and after saturation conditions.
4. The parameter A was established as a function of E*, a,.1, and au11 by using the relationship A = RE*- c exp (a. p1/ a u11>, where Rand Care material constants that can be determined experimentally. This equation accounts for the variation of A with type and structure of soil, environmental changes,and stress level.
5. The effect of saturation was found to result in an increase in the value of A associated with a decrease in E* for a specific applied stress. This behavior was found to follow the above relationship.
6. The relationship proposed here includes all of the factors that might affect the variation of A while m is constant and, therefore, represents a master curve that could be used to determine A (which is a key parameter for the determination of the rut depth of fine subgrade materials).
7. A rutting sensitivity is introduced and defined as rs = (1/C) log R. As far as rutting is concerned, this index may reflect the material sensitivity to changes in environmental conditions represented by E* and auu.
8. A proposed system for estimating subgrade rut depth is presented. This system is summarized by a block diagram. Nomographs have also been developed for the determination of rut depth; an example is given.
REFERENCES
1. G. Dorman and C. Metcalf. Design Curves for Flexible Pavements Based on Layered System Theory. HRB, Highway Research Record 71, 1965, pp. 69-84.
2. K. Majidzadeh and H. Guirguis. Field Study of Subgrade Con1pa~tion. Engineering Experhnent Station, Ohio State Univ., Columbus, Final Rept. EES 406, 1974.
3. C. Monismith, N. Ogan, and C. Freem. Permanent Defonnation Characteristics of Subgrade Soils in Repeated Loading. TRB, Transportation Research Record 537, 1975, pp. 1-17.
Figure 12. Proposed scheme for estimation of subgrade rutting.
Figure 13. Rut-depth nomographs.
8 = o apl. '-Hrt++++tt--t--+ a ult.
Dynamic Modulus E*
Soll f RuttinR Conatnnttt (11.• 0 .888 R c !
I 2. 812d06 1.18 -5 ""
2• 3.897xl06 1.20 ~
"' " 3 7. 736xl0
11 1.83 .il
Note: 1 mm = 0.04 in and 1 Pa = 0.000 145 lbf/in2 ,
• Soil 12 •1-o• t coincifta with Soil #1 in this graph
Traffic & Environment Information
Lab Testing for Soils Characterzation
Proposed Pavement System
Stress Analysis of the Proposed System
Dynamic Lab Testing to Obtain R and C
Lab and/or Field Measurements for IE• I Values (1)
Modification in Pavement System and/or Mate rial Used
Calculate 1 A1 Values '------1"'1 and Establ ish 1 m'
Compute Rutting Strains <
'-- ----I 'f • Amax N-m fo r
Each Sublayer **
Estimation of Total Rut Depth:
1 d =Ee: h*
r 1=1 Pi 1
*1 = number of sublayers h
1 = thickness of each sublaye r
** Reference (§)
108
Dynamic Modulus E* (pascals)
Soil I Ructing Constants -0.852 R
! 4 8, 34 7xl018 2. 73
5 4 .507xl02 o. 757
" , "'
No
83
-""! ...
84
4. J. K. Mitchell, R. G. Campanella, and A. Singh.
5.
6.
Soil Creep as a Rate Process. Journal of the Soil Mechanics and Foundation Division, Proc ., ASCE, Vol. 94, No. SMl, Jan. 1968. S. Khedr. Variation of Parameters of Permanent Deformation Mechanistic Model. Ohio State Univ., Columbus, MS thesis, 1975. K. Majidzadeh, S. Khedr, and H. Guirguis. Laboratory Verification of a Mechanistic Subgrade Rut-ting Model. TRB, Transportation Research Record 616, 1976, pp. 34-37.
7. F. Bayomy. The Effect of Soil Type and Saturation on Subgrade Rutting Parameters . Ohio State Univ., Columbus, MS thesis, 1977.
8. H. B. Seed, F. G. Mitry, C. L. Monismith, and
C. K. Chan. Prediction of Pavement Deflections From Laboratory Repeated-Load Tests. Institute of Transportation and Traffic Engineering, Univ. of California, Berkeley, Rept. No. TE-65-6, Oct. 1965.
9. Statistical Package for Social Sciences (SPSS). National Opinion Research Center, Univ. of Chicago, Version No. 6.02, 1970.
10. K. Majidzadeh, S. Khedr, and F. Bayomy. A Statewide Study of Subgrade Soil Support Conditions. Ohio State Univ., Columbus, 1978, in preparation.
Publication of this paper sponsored by Committee on Strength and Deformation Characteristics of Pavement Sections.
Laboratory Testing of Cohesive n 1 -. .....,., ... . 111 ... • •
~uograoes: Kesu1ts ana 1mp11cat1ons Relative to Structural Pavement Design and Distress Models Jens Poulsen, National Danish Road Laboratory R. N. Stubstad, Dynatest Consulting, Denmark
A thorough investigation of the distress and deformation properties of subgrade materials is under way at the National Danish Road Laboratory. Thus far, the program has concentrated on establishing sound laboratory relationships for cohesive subgrades with respect to resilient and permanent strain characteristics through the use of triaxial testing equipment. In the dynamic testing phase alone, more than 75 million repeated loads have been applied on a series of intact samples representing 12 test sites from 6 countries, and 4 new sites are being added. Although the results of the program thus far must be regarded as inconclusive from a predictive performance point of view, some basic relationships have tmnnyeu that are both sound and usefui. First, tile anaiysis of tile data collected has indicated that the concept of equivalent axle loads is both misleading and irrelevant with respect to directly related subgrade-distress causes. A criterion based on a realistic requirement aimed at limiting the amount of permanent deformation in the soil itself has an extremely high axle-load exponent (mean value greater than 15). Second, the use of a constitutive relationship that can describe the progress of permanent subgrade strain is possible, but because of other uncertainties associated with natural variations, inhomogeneities, and difficulties inherent in the determination of material-characterization constants, the use of a permissible subgrade dev_iator stress is preferred; the suggested one is a function of a reference resilient modulus (M0 ). As a result of the high load exponent hereby implied, this permissible stress is only slightly dependent on the number of load repetitions. On the other hand, the concept of a permissible resilient strain is shown to be poorly correlated with permanent strain and the number of repeated loads because of the various forms and degrees of nonlinear elastic response observed among the investigated subgrades. A fictive strain can, however, be used in lieu of the permissiblestress approach, althougll this will result in overly conservative designs if linear-elastic material behavior is assumed in the design technique.
The wealth of information and experience gained from the AASHO Road Test and subsequent smaller scale projects has, in a more or less direct manner, exerted
a great influence on flexible pavement design practice the world over. Based on this background, distress models have been empirically derived in accordance with various measures of serviceability. The question will now be raised as to the degree of validity of these models as applied to cohesive subgrndes on n global s cale, that is in general ter ms apart fr om the specific AASHO Road Test materials and structural systems, imposed traffic, climatic conditions, and subsequent int erpretat ions. The ioilowmg is intended to elucidate the results of research (which has thus far been limited to cohesive subgrades) that is intended to answer this question.
TERMINOLOGY AND NOMENCLATURE
The following notation and specific definitions are used in this paper.
N = number of loads, a = stress and is positive in compression, E = strain and is positive in compression,