Copyright ASCE 2004 Airfield Pavements 2003 Airfield Pavements Downloaded from ascelibrary.org by Memorial University of Newfoundland on 05/14/13. Copyright ASCE. For personal use only; all rights reserved. RUTTING STUDY OF NAPTF FLEXIBLE PAVEMENT TEST SECTIONS Kasthurirangan Gopalakrislman, MSCE 1 Marshall Thompson, PhD PE, Member ASCE 2 Abstract The National Airport Pavement Test Facility (NAPTF) was constructed to generate full-scale testing data to support the investigation of the performance of airport pavements subjected to complex gear loading configurations of new generation aircraft (NGA). The objectives of the NAPTF traffic/performance test program were to explore gear configuration/load and wander effects on pavement responses and performance as a function of number of load applications (N). Two gear configurations, a six-wheel tridem landing gear (B777) in one lane and a four-wheel dual-tandem landing gear (B747) in the other lane were tested simultaneously. Transverse surface profile (TSP) measurements and straightedge rut depth measurements were made at regular intervals to monitor the development of rut depth (RD). Using these measurements, a rutting study of the NAPTF flexible test sections was conducted. Statistical tests were performed to consider any difference in mean rut depths between B777 trafficking and B747 trafficking. The rut data were analyzed using the most common surface rutting models (the power model and the third-order polynomial model) and the models were compared. The results showed that the maximum surface rut at the termination of test trafficking is higher for conventional-base flexible test items than for stabilized-base flexible test items. From an engineering standpoint, the mean rut depths accumulated under B777 loading and B747 loading were similar. The number of passes required by the B777 and B747 gears in order to reach a 25.4-mm (I-inch) rut depth;,as similar. The power model was statistically significant at the 99% probability level for all of the sections. The third-order polynomial rutting model is a good curve-fitting model, but its engineering significance is questionable. The rutting rate (RDIN) exhibits a linear relation with the number of load repetitions on a log-log scale. KEY WORDS: airport pavement, rutting, transverse surface profile, straightedge, B777, B747 Introduction The National Airport Pavement Test Facility (NAPTF) located at the Federal Aviation Administration (FAA) William J. Hughes Teclmical Center, Atlantic City I Graduate Research Assistant. Dep. of Civil Engineering, University of I1linois at Urbana-Champaign, 205 N Mathews NCEL Rm. 3220, Urbana, IL 61801; Tel. 217-333-9312; [email protected]2 Professor Emeritus, Dep. of Civil Engineering, University of Illinois at Urbana-Champaign, 205 N Mathews NCEL Rm. 1215, Urbana, IL 61801; Tel. 217-333-3930; [email protected]73
RUTTING STUDY OF NAPTF FLEXIBLE PAVEMENT TEST SECTIONS
Kasthurirangan Gopalakrislman, MSCE1
Marshall Thompson, PhD PE, Member ASCE2
Abstract
The National Airport Pavement Test Facility (NAPTF) was constructed to generatefull-scale testing data to support the investigation of the performance of airportpavements subjected to complex gear loading configurations of new generationaircraft (NGA). The objectives of the NAPTF traffic/performance test program wereto explore gear configuration/load and wander effects on pavement responses andperformance as a function of number of load applications (N). Two gearconfigurations, a six-wheel tridem landing gear (B777) in one lane and a four-wheeldual-tandem landing gear (B747) in the other lane were tested simultaneously.Transverse surface profile (TSP) measurements and straightedge rut depthmeasurements were made at regular intervals to monitor the development of rut depth(RD). Using these measurements, a rutting study of the NAPTF flexible test sectionswas conducted. Statistical tests were performed to consider any difference in mean rutdepths between B777 trafficking and B747 trafficking. The rut data were analyzedusing the most common surface rutting models (the power model and the third-orderpolynomial model) and the models were compared.
The results showed that the maximum surface rut at the termination of testtrafficking is higher for conventional-base flexible test items than for stabilized-baseflexible test items. From an engineering standpoint, the mean rut depths accumulatedunder B777 loading and B747 loading were similar. The number of passes requiredby the B777 and B747 gears in order to reach a 25.4-mm (I-inch) rut depth;,assimilar. The power model was statistically significant at the 99% probability level forall of the sections. The third-order polynomial rutting model is a good curve-fittingmodel, but its engineering significance is questionable. The rutting rate (RDIN)exhibits a linear relation with the number of load repetitions on a log-log scale.
The National Airport Pavement Test Facility (NAPTF) located at the FederalAviation Administration (FAA) William J. Hughes Teclmical Center, Atlantic City
I Graduate Research Assistant. Dep. of Civil Engineering, University of I1linois at Urbana-Champaign,205 N Mathews NCEL Rm. 3220, Urbana, IL 61801; Tel. 217-333-9312; [email protected]
2 Professor Emeritus, Dep. of Civil Engineering, University of Illinois at Urbana-Champaign, 205 NMathews NCEL Rm. 1215, Urbana, IL 61801; Tel. 217-333-3930; [email protected]
International Airport, New Jersey was constructed to generate full-scale testing datato support the investigation of the performance of airport pavements subjected tocomplex gear loading configurations of new generation aircraft (NGA) such as theBoeing 777.
The test pavement area is 274.3 m (900 feet) long and 18.3 m (60 feet) wide.The first set of test pavements included a total of nine test sections (six flexible andthree rigid) built on three different subgrade materials: low-strength (target CBR of4), medium-strength (target CBR of 8), and high-strength (target CBR of 20). Twodifferent base sections were used: conventional (granular) and stabilized (asphaltconcrete). A plan view of the NAPTF test sections is shown in Figure 1.
Each NAPTF test section is identified using a three-character code. The firstcharacter indicates the subgrade strength (L for low, M for medium, and H for high),the second character indicates the test pavement type (F for flexible and R for rigid),and third character signifies whether the base material is conventional (C) orstabilized (S). For example, the test section MFC refers to a conventional-baseflexible pavement built over a medium-strength subgrade, whereas test section LFSrefers to a stabilized-base flexible pavement built over a low-strength subgrade.Cross-sectional views of the "as-built" NAPTF flexible test items are shown in Figure2.
The NAPTF pavement testing was conducted in two phases: a response testprogram and a traffic test program. The objectives of the traffic test program were toexplore gear configuration/load and wander effects on pavement responses (stresses,strains, and deflections) by monitoring pavement responses and performance (ruttingand cracking) as a function of number of load repetitions (N). Two gearconfigurations, a six-wheel tridem landing gear (B777) in one lane and a four-wheeldual-tandem landing gear (B747) in the other lane were tested simultaneously.
Sensor installation included Multi-Depth Deflectometers (MDDs) andPressure Cells (PCs) to capture critical pavement responses under traffic loading.Rutting was monitored throughout the traffic test program by transverse surfaceprofile (TSP) measurements and straightedge rut depth measurements. This paperpresents and discusses the results of analyzing the rut depths measured in NAPTFflexible test sections during traffic testing. All data referenced in this paper areaccessible from the FAA AAR-410 website http://www.aimorttech.tc.faa.gov.
NAPTF Material Properties
The physical properties of all of the materials used in the NAPTF test items weremeasured before, during and after construction for three purposes: constructionquality control (Qc), construction acceptance, and material characterization (Hayhoeand Garg 2001). The measured pavement material properties are available in the fonnof a database for download on the FAA Airport Pavement Technology web site:http://www.aimorttech.tc.faa.gov. Tests were also conducted at the University ofIllinois' Advanced Transportation Engineering Laboratory (U of I ATREL) tocharacterize these materials.
A six-wheel dual-tridem gear configuration (B777) with 1,372-mm (54-inch) dualspacing and 1,448-mm (57-inch) tandem spacing was loaded on the North wheeltrack (LANE 2) while the South side (LANE 5) was loaded with a four-wheel dualtandem gear configuration (B747) having 1,118-mm (44-inch) dual spacing and1,473-mm (58-inch) tandem spacing. The wheel loads were set to 20.4 tonnes (45,000Ibs) each and the tire pressure (cold) was 1,295 Kpa (188 psi). In the LFC and LFStest sections, the wheel loads were increased from 20.4 tonnes (45,000 Ibs) to 29.4tonnes (65,000 Ibs) after 20,000 initial load repetitions. The traffic speed was 8 kmJh(5 mph) throughout the traffic test program.
Traffic Wander
To realistically simulate transverse aircraft movements, a wander pattern (see Figure3) consisting of a fixed sequence of 66 vehicle passes (33 traveling East and 33traveling West), arranged in nine equally spaced wander positions (or tracks) atintervals of 260 mm (10.25 inches), was used during traffic testing. This wanderpattern simulates a normal distribution of aircraft traffic with a standard deviation (cr)of 775 mm (30.5 inches) that is typical of multiple gear passes in airport taxiways. Asshown in the Figure, among the nine different Track Nos. (-4 to +4) over thecenterline of gear passes, the North Side Track Nos. (-4 to 0) are for the B777trafficking and the South Side Track Nos. (0 to +4) correspond to B747 trafficking.To minimize the interaction of gear loads at the subgrade level, the two gears movedin phase, with both gears moving left and right together rather than towards and awayfrom each other.
Failure Criterion
The NAPTF 'failure' criterion, based on the criterion used by the US Corps ofEngineers' Multiple Wheel Heavy Gear Load (MWHGL) Tests (Ahlvin et aI1971), isat least 25.4 mm (l inch) surface upheaval adjacent to the traffic lane. This issupposed to reflect structural or shearing failure in the subgrade. During the MWHGLtests, the pavements were considered failed when either of the following conditionsoccurred: (a) surface upheaval of 25.4 mm (I inch) or more of the pavement adjacentto the traffic lane, (b) severe surface cracking to the point where the pavement was nolonger waterproof.
In the 25.4 mm (1 inch) surface upheaval 'failure' criterion, there is no limiton the maximum rut depth. Thus, a surface upheaval of 25.4 mm (I inch) may beaccompanied by a 13-mm (0.5-inch) rut depth or rut depths in excess of 50 mm (2inches) to 75 mm (3 inches) with no limit on the maximum allowable rut depth.However, according to the Unified Facilities Criteria (UFC) (US COE 2001), a rutdepth in excess of 25.4 mm (I inch) is considered as 'High' severity rutting and itconstitutes a significant functional failure requiring major maintenance activities.
Except for the high-strength (HFC and HFS) test sections, which are notconsidered in this paper, trafficking continued until the individual pavement test
sections were considered as 'failed'. The number of passes to 'failure' is summarizedin Table I for each flexible test section.
NAPTF Rutting Study
Rutting is the load-induced permanent deformation of a flexible pavement caused bya combination of densification and shear-related deformation (White et al. 2002).Rutting in paving materials develop gradually with an increasing number of loadapplications, usually appearing as longitudinal depressions in the wheel pathsaccompanied by small upheavals to the sides (Sousa et al. 1991). Permanentdeformation in any or all of thc pavement layers and/or subgrade under repeatedtraffic loading contributes to the total accumulation of pavement surface rutting.
Transverse surface profile (TSP) measurements as well as rut depthmeasurements using a 3.66 m- (12 foot-) long straightedge were made throughout thetraffic testing. Several rutting studies have identified the benefits oftransverse surfaceprofile (TSP) measurements. Recently, White et al. (2002) proposed a method (forhighway pavements) of estimating the contribution of individual pavement layers torutting from analysis ofTSPs.
Transverse Surface Profile (TSP) Measurements
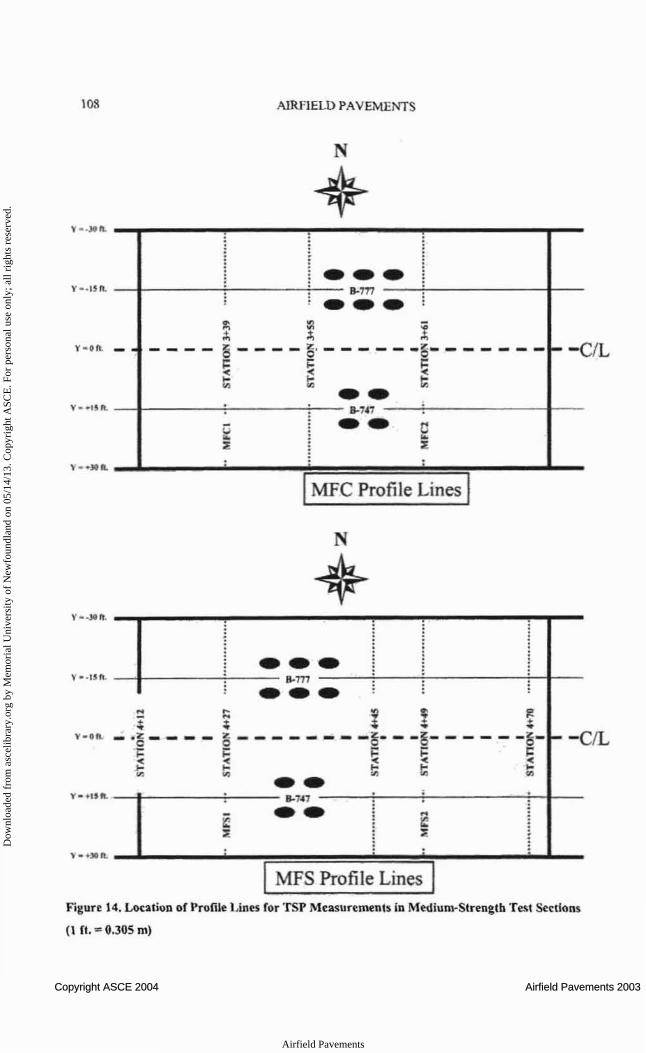
A manually propelled inertial profiling device, CSC Digital Profilite 300 Profilair,was used to measure the transverse surface elevation profiles. A recommended testspeed of 2.0~km/h (1.24-mph) was used and the profile elevation was recorded onceevery 250 mm (9.84 inches). In each test item, TSPs were measured along two mainprofile lines (Profile Line I and 2) marked across the pavement. In flexible test items,these two profile lines were at the one-third points along the test items about 152 mm(6 inches) to the West side of the Multi-Depth Deflectometers (MDDs). In Figure 4,the location of the main profile lines with respect to the MDD instrumentation and thelocation of traffic lanes together with test gear configurations are shown. All profileswere measured in the North-to-South direction. During data processing it was ensuredthat the final profile extends only across the 18.3-m (60-foot) width of the testpavement.
Using the TSP measurements, for a given number of load repetitions (N),maximum surface ruts were extracted from each traffic lane. For a given TSP, themaximum surface rut depth in a traffic lane was defined as the minimum profileelevation occurring within the width of that traffic lane (9.1 mm [30 ft.D.
Low-Strength Sections
The TSPs measured along profile lines I and 2 at specific number of load repetitions(N) are plotted in Figure 5 and Figure 6 for the low-strength flexible test sections(LFC and LFS). In the case of LFCI- profile line I in LFC test section and LFC2 profile line 2 in LFC test section, the TSPs are similar and exhibit significantupheaval outside the wheel paths at the termination of test trafficking (N = 44,095)(see Figure 5). The maximum surface rut at the termination oftest trafficking is about
76.2 mm (3 inches) in both B 777 and B 747 wheel paths. Similarly, the TSPscompare well between LFS1 (Figure 6) and LFS2 (Figure 6). The maximum surfacerut at 'failure' (N = 44,690) is between 50.8 to 68.6 mm (2 to 2.7 inches) andcompared to LFCI and LFC2 sections, the surface upheaval is smaller.
Medium-Strength Sections
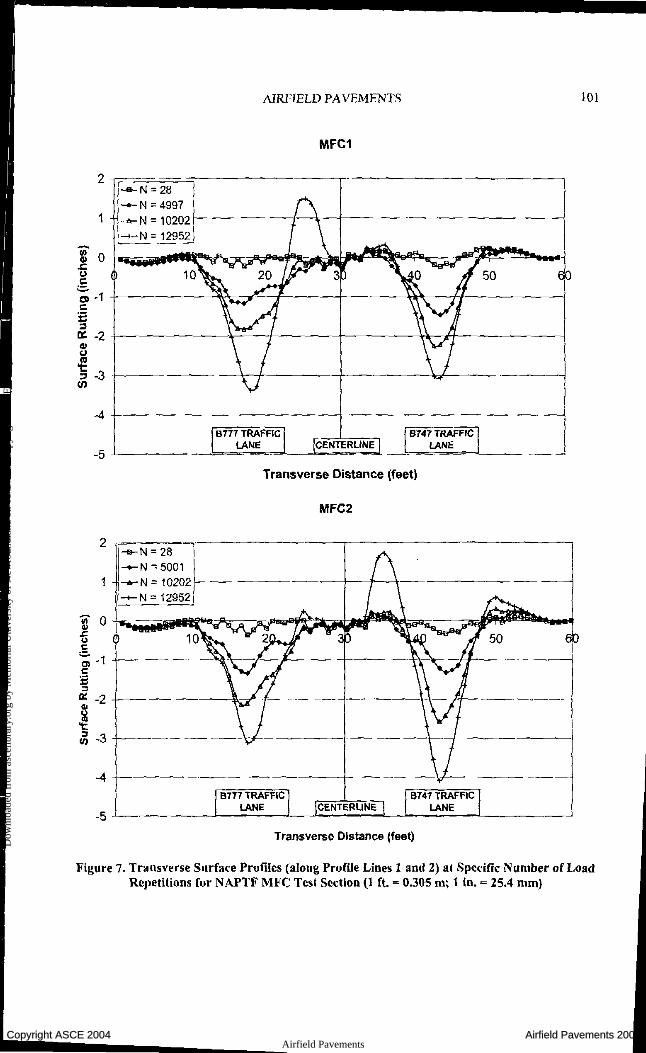
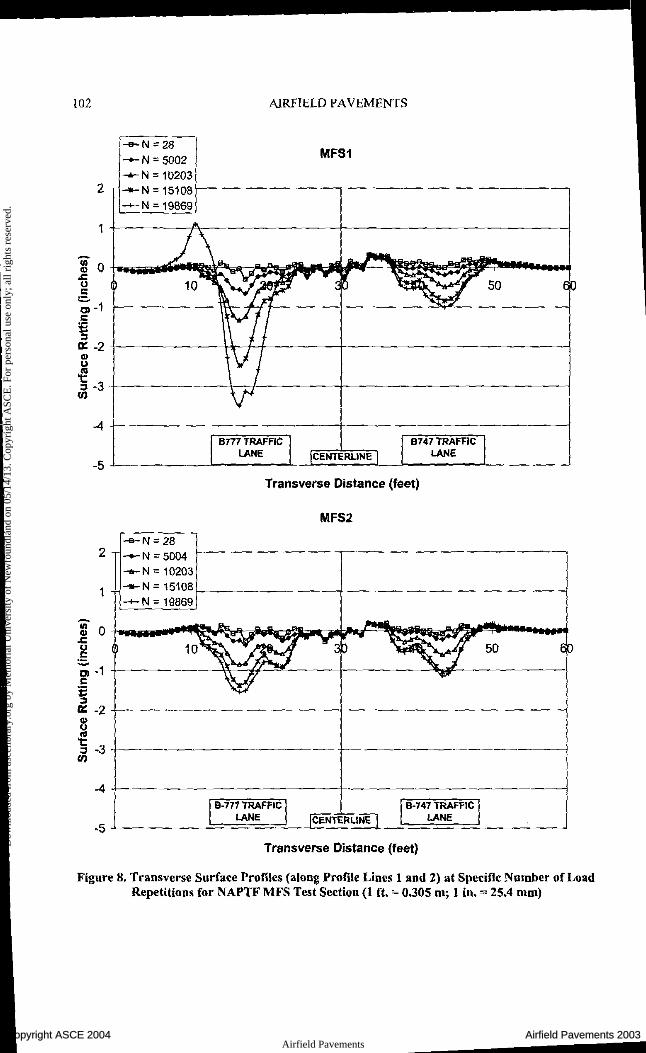
The TSPs measured along profile lines I and 2 are plotted in Figure 7 and Figure 8for the medium-strength flexible test sections (MFC and MFS). In the case of MFC1and MFC2, the maximum surface rut at the termination of test trafficking (N =12,952) is between 76.2 to 101.6 rom (3 to 4 inches) in both the traffic wheel paths(see Figure 7). The surface upheaval varies between 30.5 to 50.8 mm (1.2 to 2inches). In the B 777 wheel path, the maximum surface rut at 'failure' is about 89 mm(3.5 inches) for MFSI and 38.1 mID (1.5 inches) for MFS2, while it is about 25.4 mm(1 inch) in B 747 wheel paths for both MFSI and MFS2 (see Figure 8).
Rut Depth (RD) Measurements Using a StraigJrtedge
The rut depths were measured with a 3.6-m (12-foot) long straightedge at the samelongitudinal stations and at approximately the same times during trafficking as theTSPs. The maximum deviation of the pavement surface from the straightedge (withthe straightedge placed transverse to and centered in the traffic wheel path) wasrecorded as the measured rut depth. As the traffic wheel path was approximately thesame width as the length of the straightedge, the straightedge measurements did notinclude any indication of permanent deformation outside the wheel path. Some ruttinghad previously accumulated during the slow-rolling response testing. The rut depth atthe start of the traffic testing was subtracted from the traffic test rut depthmeasurements; thus, the reported results show the accumulation of rutting due totraffic.
Comparison of TSP and Straightedge Rut Depths
As N increases, the TSP-based rut depth measurements exceed the straightedge rutdepths. This is because, as the rut width increases above 305 rom (12 feet) due to theeffect of trafficking, the position of the 3.6-m (l2-ft) straightedge goes down, thusrecording smaller rut depths. It is also noted that the accuracy of straightedgemeasurements depends mostly on the ability of the operator to correctly place thestraightedge to measure the maximum ruts in the profile (Gramling et aI1991).
Low-Strength Sections
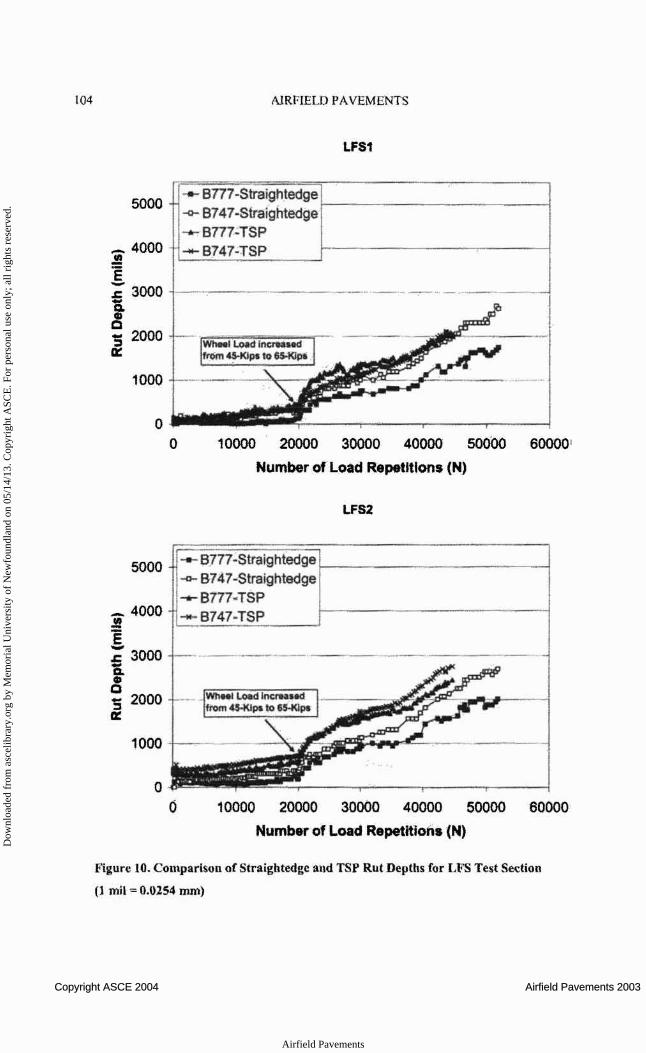
The straightedge rut depth measurements are compared against the TSP-basedmaximum rut depths in Figure 9 and Figure 10 for LFC and LFS test sectionsrespectively. The arrow in the Figures indicates where after 20,000 load repetitionsthe trafficking load magnitude, in the case of LFC and LFS test sections, wasincreased from 20.4 tonnes (45,000 Ibs) to 29.4 tonnes (65,000 lbs). The rutting
observed under 20.4 tonnes (45-Kips) loading is stable and uniform for both LFC andLFS sections. Under the 29.4 tonnes (65-Kips) loading, rutting increases rapidly asthe test sections approach 'failure' indicating unstable performance. An initial ruttingfollowed by a decreasing rutting rate with subsequent load applications (N) indicatesa stable pattern while unstable performance is characterized by a rapid/inconsistentincrease in rutting with increasing number of load repetitions (Bejarano andThompson 1999). A higher rate of rutting is observed in LFC compared to LFS.
Medium-Strength Sections
Comparisons of straightedge rut depth measurements versus TSP-based rut depthmeasurements are shown in Figure 11 and Figure 12 for MFC and MFS test sectionsrespectively. The maximum MFC surface rut at failure (N = 12,952) is almost twicethat of MFS (N = 19,869). For all of MFS TSPs, except B777-MFS1, the rate ofrutting approaches zero at 'failure' (N = 19,869). However. the B777 traffic lane inMFSi, exhibited a rapid increase in surface rutting after 12,000 load repetitions. Thereason for this aberrant behavior is not yet known. The NAPTF staff has indicatedthat a portion of the pavement on the North side (B 777) of the MFS section can beconsidered a separate case due to construction related problems.
In the medium-strength sections, a stable rutting trend is seen until about10,000 passes. However, as the test sections approach 'failure', rutting increasesrapidly and abruptly, indicative ofunstable performance.
Differences in Max. Rut Depths between B777 Trafficking and B747 Trafficking
In each flexible test section, in addition to profile lines 1 and 2, TSPs were alsomeasured at additional longitudinal stations such as at the beginning of a test section,approximate center of the test section and at the end of the test section. The locationof additional profile lines along with the main profile lines (J and 2) are shown inFigure 14 for medium-strength test sections and in Figure 13 for low-strength testsections. For a given number of load repetitions (N), each profile line contributes to apair of maximum rut depths (RDs) at the same test conditions: one for B777trafficking and one for B747 trafficking. The differences in maximum rut depthsbetween B777 trafficking and B747 trafficking at each profile line are plotted inFigure 16 for medium-strength test sections and in Figure 15 for low-strength testsections.
Low-Strength Sections
In the case of low-strength test sections (see Figure 15), the absolute differences inmaximum rut depths between 8777 trafficking and B747 trafficking do not exceed10.2 mrn (400 mils) for any of the profile lines. The scatter and the absolutemagnitude of the differences increase abruptly when the wheel loads increase from20.4 tonnes (45,000 Ibs) to 29.4 tonnes (65,000 Ibs) after 20,000 load repetitions. Thedifferences are more or less scattered around a mean value of zero indicating that theB777 and B747 rut depths are similar in the low-strength test sections.
In Figure 16, it is seen that for MFC test sections, the maximum rut depth differencesdo not exceed an absolute value of 12.7 mm (500 mils) for any of the profile linesuntil about 10,000 load repetitions. During the last 3,000 load repetitions, thedifferences increase rapidly approaching an absolute value of 38.1 mm (1500 mils).The B747 rut depths are consistently higher than the B777 rut depths. In the MFS testsection, the B777 rut depths are consistently higher than B747 rut depths and thedifferences increase as trafficking progresses; approaching an absolute difference of25.4 mm (1000 mils). As noted earlier, the B777 trafficking side is considered as aseparate case due to construction related problems. Therefore, any conclusion drawnregarding the differences in maximum rut depths in MFS test section must be treatedwith caution.
Paired t-Tests
To establish if the rut depths obtained under B777 trafficking are significantlydifferent (higher or lower) from those under B747 trafficking, paired t·tests wereperformed. The straightedge rut depths were considered unreliable and therefore notused in this study. For a given number of load repetitions (N), each profile linecontributes to a pair of maximum rut depths (RDs) and therefore one value fordifference in the rut depths. It is noted from Figure 13 and Figure 14 that each testsection has 3 to 4 profile lines and thus 3 or 4 samples (n). The tests were performedat specific number of load repetitions such as at N ~ 2000, 4000, etc. until thc numberof repetitions to reach 'failure'. It is noted that the paired t·tests were conducted onthe low-strength sections only for the 29.4 tonnes (65-Kips) wheel load rutting data asthe differences in rut depths under 20.4 tonnes (45,000 Ibs) wheel loading were veryminimal as noted earlier. The significance level (a.) was set to 0.05 for all the tests.The results of paired t-tests are shown in Figure 17 for low-strength test sections andin Figure 18 for medium-strength test sections. In the Figures, the symbol 'R' meansthat the results are statistically significant; thus rejecting the null hypothesis, i.e., themean B777 rut depths (I!Bm) are significantly different (higher or lower) than themean B747 rut depths (I!B747) at a given number ofload repetitions (N).
Low-Strength Sections
For LFC (Figure 17 - Top), there is not enough evidence to conclude that the mean8777 rut depths are significantly higher or lower than the mean 8747 rut depths. Thesame is true for LFS test section (Figure 17 - Bottom) except towards the end oftraffic testing where the mean B747 rut depths are found to be significantly higherthan the mean B777 rut depths at the 0.05 significance level. However, the actualmagnitude of differences does not exceed a maximum value of 5.1 mm (200 mils)which is considered insignificant from an engineering standpoint.
For the MFC test section (Figure 18 - Top), the mean B777 rut depths are similar tomean B747 rut depths except towards the end of traffic testing (N = 7000, 9000 and10000) where the results are statistically significant at the 0.05 significance level.Though, the mean B747 rut depths are consistently and significantly higher than themean B777 rut depths for these three cases, the maximum absolute difference is only10.2 mm (400 mils). In the case of the MFS test section (Figure 18 - Bottom), theresults are statistically significant for all the cases, I.e., the mean B777 rut depths aresignificantly higher than the mean B747 rut depths throughout trafficking. Themaximum absolute difference is around 17.8 mm (700 mils).
Number ofLoad Repetitions to Reach Specific Rut Depth Levels
The number of load repetitions (N) to reach specific rut depth levels (as per standard"pavement distress criteria") is recorded in Table 2 for low-strength test sections andin Table 3 for medium-strength test sections. These rut depth levels are typically usedby most airport agencies to trigger maintenance and rehabilitation activities. At the25.4-mm (I-inch) rut depth level, which is one of the popular failure criteria (USCOE 2001), the number ofpasses required by the B777 and that required by the B747are similar. This is more apparent in low-strength test sections than in mediumstrength test sections. The difference is, however, significant in MFS1 whichconfirms what has been previously said about the MFS test section.
Rutting Models
A number of analytically.based, statistically-based, mechanistic, or mechanistic·empirical, and phenomenological models have been proposed to predict permanentdeformation in asphalt concrete, granular materials, and soils. The NCHRP 1-26(1990) study considered several material permanent strain accumulation models andpavement system rutting models and concluded that the predominant flexiblepavement rutting model is the log permanent strain-log load repetitionsphenomenological model, also known as the power model. The power model isexpressed as follows:
10gBp =a+blogN
or
(1)
whereEp = permanent strain,a and b = experimentally determined factors, andA = antilog of a.
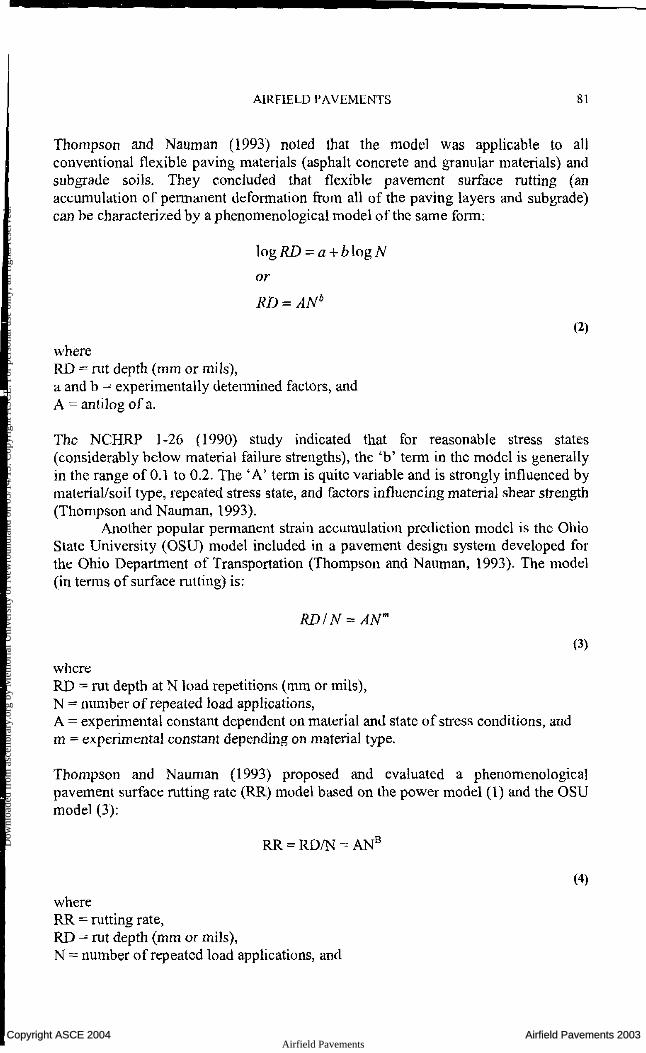
Thompson and Nauman (1993) noted that the model was applicable to allconventional flexible paving materials (asphalt concrete and granular materials) andsubgrade soils. They concluded that flexible pavement surface rutting (anaccumulation of permanent deformation from all of the paving layers and subgrade)can be characterized by a phenomenological model of the same form:
10gRD =' a +b log N
or
(2)
whereRD = rut depth (mm or mils),a and b = experimentally determined factors, andA = antilog of a.
The NCHRP J-26 (1990) study indicated that for reasonable stress states(considerably below material failure strengths), the 'b' term in the model is generallyin the range of 0.1 to 0.2. The' A' term is quite variable and is strongly influenced bymaterial/soil type, repeated stress state, and factors influencing material shear strength(Thompson and Nauman, 1993).
Another popular permanent strain accumulation prediction model is the OhioState University (OSU) model included in a pavement design system developed forthe Ohio Department of Transportation (Thompson and Nauman, 1993). The model(in terms of surface rutting) is:
RD/ N '" AW
(3)
whereRD =rut depth at N load repetitions (mm or mils),N = number of repeated load applications,A = experimental constant dependent on material and state of stress conditions, andm = experimental constant depending on material type.
Thompson and Nauman (J993) proposed and evaluated a phenomenologicalpavement surface rutting rate (RR) model based on the power model (1) and the OSUmodel (3):
RR '" RDIN '" ANB
(4)
whereRR = rutting rate,RD = rut depth (mm or mils),N = number of repeated load applications, and
A and B = tenns developed from field calibration testing data
Note that in (4), B = b - I, where b is the slope ofthe power model (1).The model proposed by McLean and Monisimith (1974) for asphalt concrete
was also evaluated. In tenns of surface rutting, the third-order polynomial model is
(5)
whereRD =rut depth (mm or mils)Co, Cj, C2, and C3 = regression parameters
NAPTF Rutting Analyses
Using the maximum surface ruts obtained from the TSPs, rutting analyses wereperfonned by applying the power model and the third-order polynomial model. It isnoted a priori that these rutting models are best suited for modeling stable ruttingperfonnance. The B777 rut depths and the B747 rut depths were separately analyzedand compared. The rutting analyses were perfonned using two approaches: (I) toconsider the NAPTF 'failure' criterion, i.e., to consider all of the rutting data in theanalyses, and (2) to consider rutting until it reached specific levels of rut depths (ex.,2504 mm [1 inch], 38.1 mm [1.5 inch], etc.) which are frequently used in triggeringmaintenance and rehabilitation activities at airports. The second approach ensures thatonly stable rutting trends are considered for analysis.
Power Model
Until 'Failure'
The maximum RDs were plotted against the number of load repetitions (N) until'failure' as defined by the NAPTF failure criterion and the data were analyzed usingthe power model to obtain the parameters A and b. The objective was to observe theeffects of loading gear configuration (B777 versus B747), profile line location(profile line 1 versus profile line 2), and presence (absence) of a stabilized basecourse on model parameters A and b.
In the low-strength sections, two different wheel load levels were used; 2004tonnes (45,000 lbs or 45-Kips) until 20,000 passes and 2904 tonnes (65,000 Ibs or 65Kips) after 20,000 passes. Two different rutting trends were observed (see Figure 9and Figure 10). It is expected that the model coefficients would be different forrutting under 20A-tonnes (45-Kips) wheel loading and under 29A-tonnes (65-Kips)wheel loading. The maximum rut depth did not reach up to 2504 mm (1 inch) duringthe first 20,000 passes in the low-strength test sections when 20A-tonnes (45-Kips)wheel load was used. In the case of LFCI and LFC2, the maximum rut depth at theend of 20,000 passes is between 0.6 to 0.9 inch. In the case of LFS I and LFS2, it isbetween 004 to 0.7 inch. In modeling the rutting data obtained under the 29A-tonnes
(65-Kips) wheel loading, the pre-accumulated rutting during the first 20,000 passeswas neglected (i.e., rutting at the initiation of 29.4 tonnes [65-Kips] traffic loadingwas set to zero).
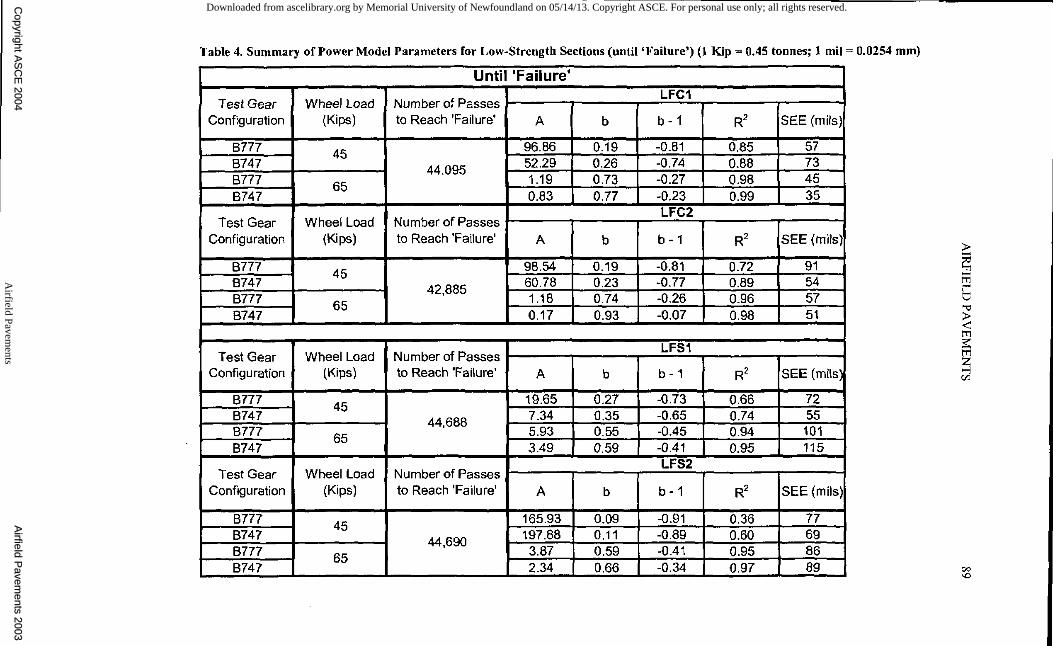
The results of the analyses are summarized in Table 4 and Table 5 for lowand medium-strength test sections respectively. For the low-strength test sections, therutting rates (values of b), in general, are higher under 29.4-tonnes (65-Kips) loadingcompared to 20A-tonnes (45·Kips) loading. Under 20A-tonnes (45-Kips) loading, therutting rates are higher for medium-strength test sections compared to low-strengthtest sections. An of the R2 values in Table 4 and Table 5 are significant at the 99%probability level. The Standard Error of Estimates (SEEs) are low (ranging from 35 to115 mils) for the low-strength sections but are relatively higher (ranging from 172 to610 mils) for the medium-strength sections.
Until Specific Rut Depth Levels
Rutting analyses were performed by considering specific levels of maximum rutdepths that are frequently used in triggering maintenance and rehabilitation activities.Two specific cases were considered: (1) until the rut depth reached 25.4 mm (1 inch)and (2) until the rut depth reached 38.1 mm (1.5 inches). From the rutting data,portions of the data relevant to these two cases were used in the rutting analysis.Regression analyses were performed to obtain the model coefficients A and b.
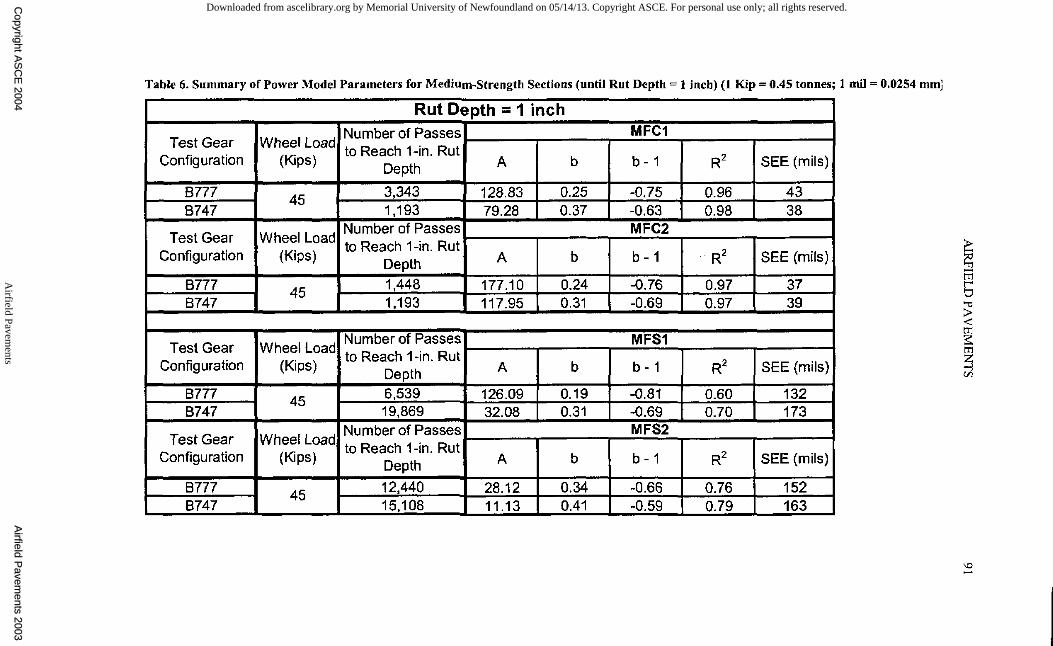
The results of the analyses are summarized in Table 6 and Table 7 formedium-strength test sections for both the cases. It is noted for MFS1 and MFS2 that,the maximum rut depth did not exceed 27.9 mm (1.1 inches) in the B747 traffic lane.In general, the R2 values are lower and the SEE values are higher (ranging from 3.3mm [132 mils] to 4.4 mm [173 mils] for case 1 and 4.4 mm [172 mils] to 5.5 mm[218 mils) for case 2) for MFS test sections compared to MFC test sections (rangingfrom 0.9 mm [37 mils] to 1.1 mID [43 mils] for case 1 and 1.1 mm [42 mils] to 2.3mm [92 mils] for case 2). The R2 values are lower and the SEE values are higher forcase 2 than for case 1, for both the test sections. This approach was not used toanalyze low-strength section rutting data.
The model parameters obtained using this approach are compared with thoseobtained using the previous approach in Figure 19 for medium-strength test sections.
Third-Order Polynomial Model
Until 'Failure'
The results of linear regression analyses using the third-order polynomial model areshown in Table 5 and Table 6 for low and medium strength flexible test sectionsrespectively. As seen in the Tables, a very good fit accompanied by lower SEEs(ranging from 0.6 mm [24 mils) to 2.0 mm [78 mils] for low-strength sections and 1.6mm [62 mils] to 6.0 mm [235 mils} for medium-strength sections) were found for allrutting data using the third-order polynomial rutting model.
Comparison ofPower Model and Third-Order Polynomial Model
All of the R2 values obtained using the power model were significant at the 99%probability level. In comparison to the power model, higher R2 values and lower SEEvalues were obtained using the third-order polynomial rutting model. However, thethird-order polynomial model parameters (Co, Ct, C2 , and C3) do not show consistentbehavior, but vary considrably (see Table 8 and Table 9). For instance, in LFC2, theCI, C2, and C3parameters are sometimes positive and sometimes negative and vary interms of magnitude (see Figure 20). Thus, the third-order polynomial model is a goodcurve-fitting model in terms of producing higher R2 and lower SEE values, but itsengineering significance is questionable. On the other hand, the parameters (A and b)of the power model are consistent (see Table 4 to Table 7), and meaningful (Le.parameter A is proportional to the magnitude of rutting and parameter b is the ruttingrate), and therefore comparable.
Pavement Surface Rutting Rate Model
Thompson and Nauman (1993) evaluated and validated the pavement surface ruttingrate (RR) model (4) by analyzing selected AASHO Road Test data and ruttingperfonnance information from IIlinois Department of Transportation rehabilitatedsections of the AASHO Road Test flexible pavement tangent sections. The Road Testdata showed that stable pavement rutting trends were related to estimated pavementstructural responses, particularly the subgrade stress ratio (SSR). They concluded thatthe RR model is particularly helpful in analyzing rutting data for a specific pavementsection and estimating the future rutting for pavement management system activities.
The rutting rates are plotted against the number of load repetitions (N) on aLog-Log scale for LFC and LFS test sections in Figure 21 and Figure 22 respectively.The same information is plotted for medium-strength sections in Figure 23. TheFigures show a linear relation between rutting rate and N for both low- and mediumstrength sections, under 20A-tonnes (45-Kips) wheel loading. As the low-strength testsections (under 29.4-tonnes [65-Kips] wheel loading) and medium-strength testsections (under 20A-tonnes [45.Kips] wheel loading) approach 'failure', the ruttingrates increase with increasing number of load repetitions, indicative of unstablerutting performance.
Summary
The National Airport Pavement Test Facility (NAPTF) was constructed to generatefull-scale testing data to support the investigation of the perfonnance of airportpavements subjected to complex gear loading configurations of new generationaircraft (NGA). Two gear configurations, a six-wheel tridem landing gear (B777) inone lane and a four-wheel dual-tandem landing gear (B747) in the other lane weretested simultaneously. To monitor rutting, transverse surface profile (TSP)measurements and rut depth measurements using a 3.6-m (l2-ft.) straightedge weremade throughout the traffic test program. Except for the high-strength flexible testsections (HFC and HFS) which are not considered in this paper, trafficking continued
until the individual pavement test sections were considered as 'failed'. The NAPTF'failure' criterion is defined as the presence of at least 25.4 mm (1 inch) surfaceupheaval adjacent to the traffic lane. The significant findings ofthe rutting study are
• In general, the maximum rut depth at 'failure' is higher for conventional-baseflexible test items than for stabilized-base flexible test items. More passes athigher wheel loads was required by low-strength test sections to reach'failure' compared to medium-strength test sections. It is noted that the totalpavement thicknesses (excluding the subgrade) are 1245 mm (49 in.) and1003 mm (39.5 in.) for LFC and LFS test sections respectively, while they are635 mm (25 in.) and 457 mm (18 in.) for MFC and MFS test sectionsrespectively.
• The number of passes required by B777 and B747 gears in order to reach a25.4~mm (I-inch) rut depth was similar.
• Results of the paired t-tests (of the mean rut depths) between the B777trafficking and the B747 trafficking showed that the rut depths do not differsignificantly between the two test gears.
• The power model, used in the rutting analysis, was statistically significant atthe 99% probability level for all of the sections.
• The third-order polynomial model was "better than" the power model in termsof producing higher R2 values and lower SEE values. However, the"engineering significance" of the model parameters is questionable.
• There is a linear relation between rutting rate (RR) and N for both low- andmedium-strength sections, under 20A-tormes (45-Kips) wheel loading.
• The pavement surface rutting rate model captures the unstable rutting trend(increasing rutting rate with increasing N) as the test sections approach'failure' .
AcknowledgmentslDisclaimer
This paper was prepared from a study conducted in the Center of Excellence forAirport Technology. Funding for the Center of Excellence is provided in part by theFederal Aviation Administration under Research Grant Number 95-C-OOl. TheCenter of Excellence is maintained at the University of Illinois at Urbana-Champaignwho works in partnership with Northwestern University and the Federal AviationAdministration. Ms. Patricia Watts is the FAA Program Manager for AirTransportation Centers of Excellence and Dr. Satish Agarwal is the Manager of theFAA Airport Technology R&D Branch.
The contents of this paper reflect the views of the authors who are responsiblefor the facts and accuracy of the data presented within. The contents do not
necessarily reflect the official views and policies of the Federal AviationAdministration. This paper does not constitute a standard, specification, or regulation.
References
Ahlvin, R. G. et at. (1971). Multiple~Wheel Heavy Gear Load Pavement Tests.Technical Report S-71-17, Vol, I, US Army Corps of Engineers, WaterwaysExperiment Station, Vicksburg, Mississippi.
Calibrated Mechanistic Structural Analysis Procedures for Pavements (1990). FinalReport, Volume II-Appendices. National Cooperative Highway Research ProgramProject 1-26. TRE, National Research Council, Washington, D.C.
Gramling, W. L., Hunt, J. E., and G. Suzuki (1991). "Rational Approach to CrossProfile and Rut Depth Analysis." In Transportation Research Record 1311,Transportation Research Board, National Research Council, Washington, D.C.
Hayhoe, G. F. and Garg, N. (2001). Material Properties Database for the TestPavements at the National Airport Pavement Test Facility (NAPTF).http://www.airporttech.tc.faa.govINAPTFlDownload! (Feb. 6,2002).
McLean, D. B. and C. L. Monismith (1974). "Estimation of Permanent Deformationin Asphalt Concrete Layers Due to Repeated Traffic Loading." In TransportationResearch Record 510, TRB, National Research Council, Washington, D.C.
Sousa, 1. B., J. Craus, and C. L. Monismith (1991). "Summary Report on PermanentDeformation in Asphalt Concrete." Strategic Highway Research Program ReportSHRP-A/IR-91-104. National Research Council, Washington, D.C.
Thompson, M. R. and D. Nauman (1993). "Rutting Rate Analyses ofthe AASHORoad Test Flexible Pavements." In Transportation Research Record 1384,Transportation Research Board, National Research Council, Washington, D.C.
US COE (2001). "0 & M: PAVER, Asphalt Surfaced Airfields Pavement ConditionIndex (PCn:' Unified Facilities Criteria (UFC). UFC 3~270-06, U.S. Army Corps ofEngineers (Preparing Activity), Naval Facilities Engineering Command, Air ForceCivil Engineering Support Agency.
White, TD., 1. E. Haddock, A. J. Hand, and H. Fang (2002). "Contributions ofPavement Structural Layers to Rutting of Hot Mix Asphalt Pavements." NationalCooperative Highway Research Program Report 468. Transportation ResearchBoard, National Research Council, Washington, D.C.
Figure S. Transverse Surface Profiles (along Profile Lines 1 and 2) at Specific Number of LoadRepetitions for NAPTF LFC Test Section (1 ft. ~ 0.305 m; 1 in. = 25.4 mm)
I 0-f.._iiII"'Il,O~l!'~ -, -I-------¥\:---,I'f---+--~'--_1f'----___f..r2+------"t:---t----+----+--+-----------i.il-3.+----------+-----------1
BmTRAfFICLAHE CENTERLINE
8147TMFFlCLAHE
TranSV8fS8 Distance ('liet)
Figure 6. Transverse Surfate Profiles (lIlong Profile Lines 1 lind 2) at Specific Number of loadRepetitions for NAP'fF LFS Test Seetll'm (I rt "" 0.305 m: I in. '" 25.4 mm)
2 ,r--,--~~....... N=28-+--N "5001--- N =10202f---~~-----+-+---___\----------~
--+- N " 12952
MFC1
MFC2
Transverse Distance (feet)
2-rr====;----~~~~~,__---~--~--_,
....... N =28-+-N =4997-<>-N =10202f---------+--I.--+----~-~--------_i
--+-N =12952
-5 L -..JlI-.B_7_77.;;;~I-.RAI-.EI_.F_F_'C.JI._ ___l.=:.....;.~;...;..L____l._ _=..=_ _L _.___J
~ +---------------+-----------------\6747 TRAFFIC
LANE-5 -L- -b===-'--_-'--__--L_.!====="---- --J
Figure 7. Transverse Surface Profiles (along Profile Lines 1 and 2) at Specific Number of LoadRepetitions for NAPTF MFC Test Section (1 ft. = 0.305 m; 1 in. = 25.4 mm)
Figure 8. Transverse Surfaee Profiles (along Profile Lines 1 and 2) at Spedfie Number of LoadRepetitions for NAPTF MFS Test Seetion (1 ft. ~ 0.305 m; 1 in. = 25.4 mm)
Figure 18. Results of Palrt!d t-Tests between B7i7 and B741 Mean Rut Depth.!! for Medlum~Strength Te.o>l Sections (J Kip - 0.45 formes; I nul =: 0.0254 rom)
Copyright ASCE 2004 Airfield Pavements 2003
Airfield Pavements
Dow
nloa
ded
from
asc
elib
rary
.org
by
Mem
oria
l Uni
vers
ity o
f N
ewfo
undl
and
on 0
5/14
/13.
Cop
yrig
ht A
SCE
. For
per
sona
l use
onl
y; a
ll ri
ghts
res
erve
d.
AIRflELD PAVEMENTS II)
:E~N• •~ .S-if••S• ~
III~ j
~ J ~! II
11 ! ~I ! J•~f o ~
Jgl
~
if ••~ ,2
I "•'"I i.••
I~ ~ II~b
~' 1~ I ~
,'ii., 0 • '~ " ; • :;
0 0 • 0 0 • • • • • 0
_~lll_A0 0 0 0 0 0 • •__"'_,oil; <1
••~, •c
, , •~~i ~ • •So
~•
•• ~..
IiIi • • • "Hih ..H-l 0
co. li.00. •••0
; I ..~
0
,1 c
.~II ! •~f gl
0-e0u
'"-~II~
,~
;;:
~ I ~~ ~ ~ ~ ~ § • • • • 0
~ ~ ~ ~ ~ § • • • • 0
~-.. ... _,w, ..........."'_,w.
Copyright A
SC
E 2004
Airfield P
avements 2003
Airfield Pavem
ents
Downloaded from ascelibrary.org by Memorial University of Newfoundland on 05/14/13. Copyright ASCE. For personal use only; all rights reserved.
lFC2--~
>~iii5~
~~
- -C3~ .;
:ll ~
~ ~
~ 8:::29 .
h.,
~o
1log RD = Co + C,(Iog Nl+C,(log Nl' + C,(Iog Nl'l
III B777-45Kips~:i II§ B747-45Kips
I 1111 B777-65Kips• B747-65Ki~
25.0
20.0
III 15.0CD::l-~ 10.0of!
5.0SCDE
0.0Eco I
,COQ.
a; -5.0'00
::E -10.0
-15.0 -
-20.0
Figure 20. Variation in Tblrd-Order Pol)'nomilIl Model Paramlers' Values (I Kip - 0.45 lou net)