-- --- -- --------- -------------- I National Criminal .Justice Reference Service j ! \ "\ I ) ) nCJrs This microfiche was produced from documents received for indusion in the NCJRS data base. Since NCJRS cannot exercise control over the physical condition of the documents submitted, the individual frame quality will vary. The resolution chart on this frame may be used to evaluate the document quality. 1.0 11111 1 • 1 :; !!!Fa Illp·5 : I .2 w I:.l Ii L:.:. u & .. 11.:.1.1. I 111111.4 IIIII 1.6 MICROCOPY RESOLUTION TEST CHART NATIONAL BUREAU OF STANDARDS-1963-A Microfilming procedures used to create this fiche comply with the standards set forth in 41CFR 101-11.504. Points of view or opinions stated in this document are those of the author(s) and do not represent the official position or policies of the U. S. Department of Justice. National Institute of Justice United States Department of Justice Washington, D. C. 20!l31. •. '.t>_" -- :" ,,; ,« b " .\ " l .. , « , i ) I I. If you have issues viewing or accessing this file contact us at NCJRS.gov.
Transcript
-- ---~ ----- --------- -------------- -----~---
I National Criminal .Justice Reference Service
--------~~----------------------------j
! ~
\ "\ I
) )
nCJrs This microfiche was produced from documents received for indusion in the NCJRS data base. Since NCJRS cannot exercise control over the physical condition of the documents submitted, the individual frame quality will vary. The resolution chart on this frame may be used to evaluate the document quality.
1.0
111111•1
:; !!!Fa Illp·5 : 11~13.2 I .2 w m~ I:.l Ii I~ L:.:. u & .. 11.:.1.1.
I
IIIII~ 111111.4 IIIII 1.6
MICROCOPY RESOLUTION TEST CHART NATIONAL BUREAU OF STANDARDS-1963-A
Microfilming procedures used to create this fiche comply with the standards set forth in 41CFR 101-11.504.
Points of view or opinions stated in this document are those of the author(s) and do not represent the official position or policies of the U. S. Department of Justice.
National Institute of Justice United States Department of Justice Washington, D. C. 20!l31.
"~"'_ •. '.t>_"
-- :" ,,; ,« b
"
.\ "
l 024/86~. .. ,
« ,
i ) I I.
If you have issues viewing or accessing this file contact us at NCJRS.gov.
I TABLE OF CONTENTS
FOREWORD The statistical profile of this annual report was designed by Dr. Stanley Vanagunas of Arkansas State University. Dr. Vanagunas believes that the police annual report can be an instrument for police improvement if it is responsive to the informational needs of those with strong interests in policing. With funding support provided by a National Institute of Justice grant, Dr. Vanagunas sampled the informational preference of five police "constituencies." These were: the police administrative community; city managers; district attorneys; human rights agency directors; and, the directors of chambers of commerce. The 1983 Minneapolis Police Department Annual Report is a "model" report based on the more salient findings of that study.
The Annual Report is prepared by the Minneapolis Police Department's Administrative Services Division. Editing ............................................. William O'Rourke LayoutlKeylining & Cover ............................ Robert E. Hafvenstein
1
2
MINNEAPOLIS
Population 364,160
Minority Population 47,120 12.9%
Land Area (Square Miles) 58.7
Calls For Police Service 230,768
Total Police Department Strength (Sworn Personnel) 690
1983 FLEET
111 Marked Squads
108 Unmarked Squads
12 Trucks and Vans
DEMOGRAPHICS I r MAYOR'S LETTER
Photo by Philip C. Osterhus
TO: THE CITIZENS OF MINNEAPOLIS
Nineteen eighty-three was a year of outstanding achievement for the Minneapolis Police Department. Let me list a few of those achievements:
· . Minneapolis achieved the lowef.t rate of traffic fatalities of any large city in the United States ... with a 57% reduction in fatal accidents. This record was achieved largely because the Police Department more than tripled the number of hit and run drivers charged and reduced hit and run accidents. The Police also conducted more chemical blood alcohol tests and issued more tags for moving violations in 1983.
· . Minneapolis completed the first full year of successful operation of the "9-1-1" emergency communications system and hosted the national "9-1-1" conference. Through "9-1-1," the Police Department responded to 230,768 calls for police service.
· . I appointed a Police Review Panel to provide a "window" for citizens on the Internal Affairs Division of the Police Department. This three-member panel has reviewed all Internal Affairs cases and made recommendations for improving the process of that division.
· . Minneapolis furthered its affirmative action when the Police Department hired an additional 20 police officers, 16 of whom are members of the protected classes.
· . Minneapolis improved its physical facilities by remodeling the 2nd Precinct Station, moving the 5th Precinct to remodeled quarters, and undertaking planning for a new 3rd Precinct Station. The 4th Precinct Station will be the next on our list for new construction.
· . The Community Crime Prevention Program increased the use
of volunteers in crime prevention, increased the number of block clubs organized, introduced the "Cop on the Block" project which matches individual police officers with block clubs, and completed the first year of the "Neighborhood Watch" project.
· . The City initiated a program to use ninth graders in the public schools to train lower grade students in police education programs.
· . My office sponsored a successful conference for representatives of the juvenile justice system and community leaders to explore alternatives for community involvement in juvenile delinquency ... which has since paid off in the creation of a number of neighborhood projects.
· . Minneapolis established a Public Safety Task Force to explore
ways that various City departments might coordinate efforts and deliver services to residents through block clubs and other innovative programs.
.. The Police Department handled with carefully developed procedures a number of demonstrations of civil disobedience by organized groups and managed these events in such a way that no serious injuries occurred.
Thanks to the leadership of Chief Anthony Bouza, a man who has contributed much to this community through and in addition to his role as Police Chief, and to the dedicated service by our police officers, the services provided by the Minneapolis Police Department are trusted and improving steadily.
1983 proved a good year for the Minneapolis Police Department and the community it serves. In the three principal areas of concern, street crime, response to emergencies and traffic safety, real progress was recorded. The trimming and reshaping of the department continued.
Part I crime declined 7%, while arrests remained at the high level of just under 6,000. The 911 system had its first anniversary and it is rapidly becoming an essential feature of daily life. One person patrols continue to work very well. We were able to handle just over a quarter million calls for help very efficiently. The traffic safety story is one of sharply reduced deaths, injuries and accidents, combined with sharply increased enforcement, for DWI and moving violations especially.
The integration of the department continued. A total of 59 cops have now been hired, since ~980, and 45 were
4
CHIEF'S LETTER I
women or minority candidates. All are of high quality.
The physical plant is being upgraded. We moved into a new 5th Precinct in September, and remodeled the 2nd. A new 3rd will be built in 1984.
The Police Review Panel is up and working and bringing a new dimension to responsible citizen analysis of police actions. Expanded certification, a remarkable innovation for integrating an agency, has been tested and found to work splendidly.
Attrition continues to reduce the supervisory levels and, while the sworn complement has gone from 735 to 690, in four years, the number of cops on the street has remained stable.
Equipment is in good shape and it will at least maintain that level in 1984.
Partisan political activities, on the part of large numbers of employees, appear to be a thing of the past. Recent campaigns have been marked by decorum and dignity and an absence of the
M ? ,
indecorous behavior that had once been so prevalent.
Training has been extensive and deep. Career enrichment programs permit our officers to really see and feel how other aspects of policing work. Our curriculum runs the gamut, from physical fitness to CPR, and beyond. A well organized stress program ministers to the needs of our employees.
The civilians, cops and reservists have produced a year we can all be proud of, as performance levels rose on all fronts. 1983 was a year of solid achievement for the Minneapolis Police Department and we look forward to further progress in 1984.
Thank you for your guidance and support.
~f:;blIkM '" Chief of p~li{e I v v - rl
b • +
Berkeley, David W. Billings, Thomas H. (2) Bird, Ronald M. Bjergo, Gary L. Boran, Theodore J. Brodin, John R. Brotkowski, Roger J. Browne, John J. Budinger, Bruce W.
Carey, Michael F. Cassman, Mark T. Costello, Paul A.
Dahlin, James Dalsin, Edwin B. Danielson, Douglas J. Dehn, Robert A. Dolan, Timothy J. Donaldson, Charles W.
Emerson, Alva W. Ellingboe, Richard E. (2)
Farmer, Deborah L. Ferguson, Gerald R. (2) Fischer, Richard H. Fredrickson, Duane A.
Ganley, Michael J. Gilchrist, Riley N. Globa, Anatoli Gra1es, Jeffery J. (2) Green, Michael A.
Haff, Jerome V. Hafvenstein, Phillip A. Hannan, William J. Harris, Cozell (2)
•
1983 DEPARTMENTAL AWARDS
MEDAL OF VALOR Dodge, Charles M. Green, Michael A.
MEDAL OF COMMENDATION Howell, James E. (2) Humphrey. Wayne E.
Jensen, Robert W. (3) Johnson, Bradley C. Johnson, Bruce S. (2) Johnson, Clifford A. Johnson, Randall A. Joyce, Michael W. Juntilla, Edward A.
Kiely, Patrick E. (2) Kramer, Allen C. Krebs, Robert R. (4) Kurtz, George H.
Leon, Joseph A. Lindman, David A. Lorenson, Richard D. (2) Luckow, W. R.
McCandless, Anne E. (2) McGaughey, Gary E. McKenzie, Thomas J. Mesenbourg, Jerome E. Miezwa, James A. Moses, Terrance J.
Norrbom, Hugh L.
Odden, William C. Olson, Kenneth R. (2) Olson, Robert W. (2) O'Meara, James M. Ostergren, Wayne W. Ottoson, Ronald F.
Palmborg, James M. Palmer, David H. (3) Palmquist, Charles O.
CHIEF'S AWARD OF MERIT Hafvenstein, Robert E.
CIVILIAN EMPLOYEES
Father Terry Hayes Commendation Hamel, Loren Chief's Award of Merit Holmberg, Ralph Chief's Award of
Merit Irving, Harold Chief's Award of Merit
Paulson, Erwin M. Peterson, Bruce D. Peterson, Thomas R. Pihl, Duane R. Plewacki, Gail J. (2) Prill, Timothy K. (2)
Resch, John P. Roache, Bradley A. Rose, Vernon D. Rumpza, David L.
Savage, Andrew J. Sawina, Thomas R. Scott, William G. Schliesman, Myron E. Severson, Dc. .. <31 D. Severson, Kenneth E. Snover, Terry L. Stahura, Richard L. Subject, Edmond S. (2)
Thernell, James L. Thunder, Robert A.
Warn, Kenneth E. Will, Martha E. Wiswell, Daniel L.
Zentzis, Edward S. Zipoy, Gregory G. (2)
PARK POLICE Christianson, Ronald W. Dale, James C. Evenrud, Loren A. Kirkland, David T. Schnickel, Robert G.
5
1983 CITIZEN AWARDS 1
MEDAL OF VALOR Jeane M. Gulner Mary Harder Luvenia Harris
CERTIFICATE OF APPRECIATION
Kenneth Alexander James Hanson Kandy Ashley Elizabeth Harris
Jennifer Bailey Nancy Hart Thomas Hartman Darrell W. Barnes Billy Herman Rico Barrientz
Carl Bartholomew Cliff Hill John Hill Ellen Batke Mark Hill Leroy Bellcourt
Michael Bellcourt Jerry Hockensmith
Kent Bergner Steve Houle
Tim Bodin Tim Holmgren
Dennis Boettcher Bradley Hove
Mary Boom Mark James Wendy Bros Dave Johnson Charles Brown Konnie Johnson Theodore Brown Tom Johnson Larry A. Buhl Walter Johnson Douglas Buxton Tay Karels Steve Castle Ryan Kelbrants Lenore Costello Nathaneal Kelt Judy Coultier Jeff Kemper Joe Cox Craig Kinstler
George Klick Patrick Doodnauth Sarah R. Dowsett Dave Koslick
Gary Feather John Littmann Mary Finney Timotliy D. Lowey Mark Flannagan
Mark McColiouth Lucy Gaines Fred McCormick (Police Reservist) Roosevelt Gaines Kathy Mcilwain Gerald Ganley Sheila Mehr Tim Geelan Minnesota Wing-Civil Air Patrol Eugene Gittelson Anna Mulfinger Jerome Gordon
Robert R. Nellermor Ernie J. Guajardo Nathan Nelson
Robert R. Hall Terry Nelson Brad Hanson
6
Mark Olezsek Richard Olson Jill Pattinson Jack Peters Ida Prasad Mike Prasad Michael Prestegard Shane Priem
Robert Ready Kenneth Reed Emespino Riveria Whisty Rorobacher Darren Rosenkranz
Randolph S. Samples Douglas Schomyer Scott Schroeder Mark Schulty William G. Scott D[ Michael Sirr Scott Skordahl Dennis Slama Clarence Smerson Eleanor Smerson Marshall Smith Scott Soukup Bonnie Steele Jerry Steele Peter Stephenson Bill Sullivan Liz Sullivan Richard Swanson
Mike Tongen (Police Reservist) Janet Trasky
Jean Uhlenkott Kathy Uhlenkott
William Wagner Steven WaJin Edward Ward Linda Wendlandt Bradley WerdaJ Gary Weseman Pat Weseman Don Westlin
j ,j
' ~ i
.! 1 I
:1 it
~
~
I,
I RETIREMENTS AND OBITUARIES
1983 RETIREES-SWORN PERSONNEL Emery, Off. William O. 21 Years
28 Years 22 Years 28 Years 26 Years 23 Years 21 Years 24 Years 25 Years 21 Years 23 Years 35 Years 28 Years 25 Years 21 Years 21 Years
Erickson, Sgt. Albert B. Gravem, Off. Paul L. Hanson, Off. Harry M. Hnath, Lt. Raymond J. Keavy, Off. James R. Lundquist, Off. Harlan Morse, Sgt. Raymond G. Olson, Sgt. Clinton C. Pelkey, Lt. Donald H. Pieri, Sgt. Ronald W. Scott, Lt. Paul W. Seawell, Off. Thomas W. Smith, Off. Gerald L. Thorson, Off. Richard E. Wasserman, Off. Herbert
INTERNAL AFFAIRS DIVISION POLICE ASSISTANCE PROGRAM Weekly group meetings estab- receptive to aid offered by their fellow REVIEW PANEL
The Police Assistance Program of th6 Hshed. The program staff facilitated officers. These Police Assistance Con-In May, 1982, a task force was estab- Minneapolis Police Department formally four weekly groups: Police Professional tact Officers (PACOs) were trained in
I
Concerns Group; Women's Support basic counseling and crisis intervention lish&d to Dtudy the procedures and I ' opened its doors June 1, 1983, at 1101 ,I
actions taken by the Internal Affairs ' ,
South 7th Street in Minneapolis. With Group; Policewomen's Professionai skills and offer "front-line" counseling Division of the Minneapolis Police De- 11 completion of his training as a chemical Concerns Group; and, an AA group. contact for their fellow officers. One of partment in handling complaints dependency counselor, Officer Bob These groups provide pOlice officers, these peer counselors is on-call with a against Minneapolis police officers. Anderson took over as Director of the their spouses, significant others and beeper 24 hours a day, 365 days a year. Additionally, that task force was to rec- program. family members a place to work on their When appropriate or desired, the PA-om mend what, if any, changes should The Police Assistance Program can personal and work-related problems in COs may refer their clients to Bob An-be made in those procedures. On Janu- trace its roots to 1981 when a patrol an atmosphere of understanding and derson or Robin King Cooper, a ii-
i.
support with others with similar con- censed psychologist specializing in ary 21, 1983, a "Task Force Report" was i
officer challenged Chief Bouza about prepared and submitted to Mayor the lack of services available to help cerns. Group counseling within the police psychology, for further services. Donald M. Fraser. police officers deal with stress. As a Police Assistance Program often is a To augment their skills, professional
Contained in that "Report" were result of that challenge, Officer Dick treatment of choice as well as a short- consultation is available to the PACOs recommendations for the establish- Stahura was invited by the Chief to term, supportive alternative until a client on an on-going basis. This program is ment, purpose and operating proce- establish a program to fill those need::;. can (or will) take a referral to outside modeled after the best police assist-dures of an Internal Affairs Division The City of Minneapolis sent Officer resources. ance programs in the country and is the Review Panel, consisting of three per- Anderson to the Hazelden Foundation Service. Of the 110 persons who first of its kind in Minnesota. , ,
sons. The members of that panel, Isa- ! ( in Center City, Minnesota, for counselor received services from the Police As- Seminars. In line with a philosophy bel Gomez Edwards, Russell W. i: training and a $55,000 McKnight Foun- sistance Program, 61 were police offi- of positive mental health, the Police Lindquist and Raymond O. Presley, I dation grant provided funding for a cers, 28 were spouses or family mem- Assistance Program will sponsor a were appointed by the Mayor and are facility, peer counselor training and bers of police officers, 11 wsre series of seminars during the coming serving pursuant to a written agreement
\ i
psychological services. significant others (persons in important year focusing on stress management, with the Mayor, the Chief of Police and With the initiation of this program, the relationships with the officers, but not. chemically free lifestyles, financial plan-the City. ! ! Minneapolis Police Department took married to them), and 10 were depart- ning and effective communication.
The Internal Affairs Review Panel ! i action to rec\vgnize that problems of a ment employees (non-sworn). Men and Bob Anderson is active in the com-began its work on July 1, 1983. Consid- i: personal nature can have an adverse women were served by the program in Ii munity representing the Minneapolis erable time was initially spent in deve- J I effect on an €'~nployee's job perform- exactly equal numbers. Personal/emo- Police Department and more specifi-loping a foundation for its work and I; ance. The objective of the Police Assist- tional (41 clients) were the primary prob-Ii cally the Minneapolis Police Assistance delineating criteria for evaluating the
! j ance Program is to help identify these lem areas of persons served by the Program. He is currently serving on the Internal Affairs Division's investigations problems at an early stage and provide program. Other assessed problems Hazelden Alumni Association Board, a and dispositions. Once those were
Ii the necessary evaluation, counseling included chemical dependency (20), board member of One-Hundred Eighty established, each member of the Panel and referral for successful resolution. career issues (10), financial problems Degrees Half Way House for ex-con-read and evaluated the investigation The program is a broad-based em- (7) and legal problems (3). While most viets, was recently reapPointed to a files opened by the Internal Affairs Divi-
I ployee assistance program which is clients experience problems in more second two year term as an advisory' sion on or after July 1,1983, and closed designed to deal with human relations than one of the above categories simul- board member of 3 R's Family Treat-on or before October 31, 1983. During } problems such as drug and alcohol taneously (for example, a client with I ment Center, is a community member that period 92 files were opened, each abuse, emotional/behavioral disorder, chemical dependency problems often is on the Mayor's Committee on Alcohol of which contained one or more com- I family and marital discord, financial, experienCing personal, relationship, and Drugs, a member of the Associa-plaints of alleged misconduct by Minne- I legal and other personal problems. financial and legai problems as well), tion of Labor, Management, Administra-i apolis pOlice officers. As of October 31, f The Police Assistance Program has these numbers reflect the primary prob- tors, and Consultants on Alcoholism, l fifty-five of those files had been closed; accomplished several major objectives lem area as assessed by the counselor. and works with the Minneapolis Health '" , the complaints therein having been in its first seven months of operation. Training. Eleven police officers vol- Department in promotiny diabetes investigated and determinations with Some of these include: untarily completed a 32-week course in testing for the Minneapolis Police De-respect thereto having been made.
Establishment of a counseling peer counseling under the direction of partment. On November 1, 1983, the Review facility at 1101 South 7th Street, Min- Or. Herdie Baisden of the Rational Life ~ Panel released its first report with re-neapolis. By being detached from any Center. Both experience and many gard to the categories of complaints other police facility, the program offers publications on police stress have indi-received, the determinations in each the privacy and confidentiality that is cated that police officers may be slow to category and the adequacy of the Inter-crucial for the success of an employee seek mental health services from com-nal Affairs Division investigations. assistance program. munity professionals but may be more
8
ORGANIZATIONAL CHART I I CHIEF OF POll CE
I INTERNAL I AFFAIRS
ADMIN. ASST.
DIVISION I TO CHIEF
I DEPUTY CHIEF DEPUTY CHIEF DEPUTY CHIEF
PATROL INVESTIGATIVE SERVICES 1983'
" BUREAU BUREAU BUREAU
\.:;)
~ H INSPECTIONS HOMICIDE/ ORGANIZED INSPECTORS ROBBERY/
COMMUN ITY SUPPORT DIVISION I-e- CRIME RE L.H IONS !- SERVICES
FAMll Y VIOLENCE
DIVISION DIVISION DIVISION
DIVISION
SECOND FlJ;';~TH PAWNSHOP /Nt, H CRIME PROPERTY & ~ PRECINCT I-f- PRECIN(,T NTI-FENCIN PREVENTION EVIDENCE
DIVISION DIVISION UNIT . UNIT UNIT
- JUVENILE I-DIVISION
~ Y SCHOOL CRIME
~ ~ ~ LICENSE
PATROL PATROL UNIT PATROL ANALYSIS
UNIT liN IT .-J UNIT UNIT
H INVEST. UNIT BOMB SOUAD-~ CRIMINAL } Y ~ INVEST. INVEST. UNIT ADMINISTRATIVE
HISTORY
UNIT UNIT UNIT SCHOOL I
SERVICES I-DIVISION LIAISON RECORDS/ '~
UNIT TRANSCRIPT/ VICE,'
THIRD FIFTH I- NARCOTICS UNIT H PERSONNEL
PRECINCT !-f- PRECINCT DIVISION UNIT DIVISION DIVISION FORGERY/FRAUD/
STATISTICAL o
PROFILE I
AUTO THEFT I-DIVISION H RESEARCH & IDENTIFICATION
H ~ e-
PATROL PATROL DEVELOPMENT DIVISION
UNIT UNIT UNIT
1 I ~ H TRAINING I FIELD ~ INVEST. INVEST. UNIT OPERATIONS
UNIT UNIT UNIT
Y FINANCE/
PHOTO LAB ~ PAYROLL
STREET UNIT UNIT
CRIMES e-I- TRAFFIC
DIVISION UNIT -------- I CRIME LAB .. ~ I I EMERGENCY I UNIT
u Q
.'
H I PATROL CHEM TEST ~ I COMMUNICATIONS
UNIT SECTION I I --------
Y CANINE HIT & RUN ~
UNIT SECTION
MINNEAPOLIS POLICE DEPARTMENT "'~
TRAFFIC
~ CIVIL DE~~ CONTROL SECTION
o
o
" ,-.' "
11 10 ..
12
-I
The statistical presentations which follow profile the 1983 record of the Minneapolis Police Department from three important and interrelated perspectives: what service demand the Department confronted in 1983; how the Department was organized and what operations it undertook to respond to such workload; and, lastly, how the Department performed in meeting the community's service needs and other exnectations.
Two central ideas guided the selection of data for inclusion in this annual report: one, to accurately and realistically depict the nature of Minneapolis police responsibilities, operations and capabilities; and two, to present such statistical information which would permit a reasonable and realistic assessment of the Department's performance.
The concern with accuracy and realism prompts a format of presentation whereby each statistical table is accompanied by an interpretative comment. Urban policing is a complex enterprise. Bare police statistics, particularly when viewed by one who is not familiar with policework, can easily be misinterpreted.
August, 1983 Dispatches in Response to Citizen Requests for Police Assistance, by Type of Incident ................................ 17
1983 Dispatch Totals for 20 Selected Incidents ............................ 18
Major Offenses Reported to the Police, 1980-1983 ......................... 21
Major Offenses Reported to the Police, 1982-1983, Comparison Among Precincts ........................................ 22
Other Offenses Reported to the Police, 1980-1983 ......................... 23
Major Offenses Known to the Police, Selected Cities, 1982 ................... 24
Analysis of Traffic Accidents, 1983 ..................................... 25
Distribution of Accidents by Time of Day ................................ 26
Distribution of Accidents by Day of Week ................................ 27
Selected Characteristics of Victims of Violent Crime ........................ 27
PROFILE OF POLICE OPERATIONS
Distribution of Operating Costs and Personnel in 1983, by Major Departmental Divisions ...................................... 29
Distribution of Operating Costs in 1983, by Object of Expenditure ..................................................... 29
Organization of Patrol Bureau ........................................ 30
Organization of Investigation Bureau ................................... 31
Organization of Service Bureau ....................................... 32
Distribution of Departmental Personnel, by Rank, Sex and Ethnicity, 1983 .................................................... 33
PROFILi:: OF POLICE PERFORMANCE
Juveniles Arrested in 1983, by Age and Sex .............................. 35
Adults Arrested in 1983, by Age and Sex ................................ 36
Total Persons Arrested in 1983, Comparison Among Precincts ........................................................ 37
Proportion of Known Offenses Cleared, 1980-1983 ......................... 38
Selected Traffic Law Enforcement Data, 1980-1983 ......................... 39
Comparison of Trends in Hazardous Violations Enforcement and Selected Accident Data, 1977-1983 ....................... 40
Disposition of Complaints Against the Police, 1983 ......................... 41
Summary of Disciplinary Actions Taken in Response to Sustained Complaints, 1983 ....................................... 41 \.
Selected Data on Police Activity to Encourage Community Crime Prevention Programs ................................ 43
Selected Data Indic~tive of the Degree of Citizen Satisfaction with Police Services ...................................... 44
The city is divided into four precincts each served by a precinct station. There are considerable differences among the demographic and socioeconomic characteristics of each precinct.
The Second Precinct (generally encompassing the Northeast and University communities) contains 18% of the city's population of whom 7% are minority citizens. The University of Minnesota is in the precinct and it provides its own pOlice services on the university grounds. There are 70 members of the Minneapolis Police Department assigned to the Second Precinct.
The Third Precinct (generally encompassing the Powderhorn, Longfellow, Nokomis and Phillips neighborhoods) contains 37% of the city's population of whom 17% are minority citizens. In terms of various socioeconomic indicators, the Phillips community, for example, is second only to the Central area, of the Fourth Precinct, in the number of social services and public assistance funds provided in 1982. The Powderhorn community ranked fourth in . such assistance. There are 121 police department personnel aSSigned to the Third Precinct.
14
POLICE PRECINCTS I
The Fourth Precinct (generally encompassing the Camden, Near North and Central neighborhoods) contains 22% of the city's population of whom 23% are minority citizens. The Central, downtown, area leads the city in such indicators as the number of social service cases, public assistance expenditures, low-education levels of the population, and the number of out-of wedlock births. The Near North area tends to be third among the neighborhoods of the city in such, and similar, Indicators of urban pathology. The Fourth Precinct contains some of the poorest, most blighted parts of the city. There are 121 members of the Minneapolis Police Department aSSigned to this precinct.
The Fifth Precinct (generally encompassing the Calhoun-Isles and Southwest communities) contains 23% of the city's population of whom 5% are minority citizens. Relative to the other three precincts, the Fifth encompasses the more affluent sections of the city. There are 91 members of the Minneapolis Police Department assigned to the Fifth Precinct.
The unique features of each precinct impact differently upon poliCing. Some such variations in police service demand are reflected in the ensuing statistics by precincts. For example, precincts show a differing crime rate. Since police are aSSigned to each precinct in proportion to the degree of anticipated need, such differences should not be presumed to be due to a variation in police effort among precincts. It is well known that crime has a relationship between such factors as the proportion of young males in the population, to various indicators of low socioeconomi(; standing, or to the nature and numbef of business establishments in the neighborhood. Consequently, for example, it is to be expected that those precincts which have more Y0'mg people and more poor will also tend to h~ve more crime.
UJ ::J Z UJ > « UJ u z « a: u.
UJ ::J Z UJ > « CIl UJ x a: UJ x
UJ > « CIl UJ x a: UJ x
I PRECINCT BOUNDARIES
53RD AVENUE
37TH AVENUE ci > -l :IJ Z o CIl z 1= CIl
LOWRY AVENUE
4TH PRECINCT
H/WAY 12
5TH PRECINCT
2ND PRECINCT
62ND S REET
3RD PRECINCT
li:i UJ a: ICIl
o a: C') C')
:!:: Cii CIl Cii SQ "0 ::2 :0 <: m :0
54TH STREET
15
---- ------------------------- ----- -- ---- ----
PROFILE OF POLICE SERVICE DEMAND I This section presents statistical infor
mation about the major types of services iNhich the public demands from the Minneapolis Police Department. The data have been selected to convey several key realizations about the work of your police:
· .. City policing entails much more than law enforcement and control of crime. Police are called upon to resolve family problems, deal with various other citizen conflicts, and to respond to a miscellanyof non-criminal emergencies many of which pose a serious threat to persons and property;
· .. Police are primarily reactive in their tactics. The vast preponderance of criminal incidents which the pOlice handle, for example, come to the attention of the police through information provided by citizens. Consequently, citizen cooperation with the police is the vital link for effective order maintenance and crime control; and
· .. The city's poorer citizens need and use the police more than other classes of citizens. This is because the poorer segments of Minneapolis population are victimized more by crime and generally, turn to the police more frequently for assistance to resolve various problems, such as family problems.
THE DIVERSE NATURE OF POLICE SERVICES
Tables 1 A and 1 B summarize the number and type of citizen requests for assistance to which the Minneapolis Police Department responded in 1983. Table·1 A shows the dispatched calls for the month of August, grouping those dispatches into four general categories of incidents: crime related, citizen conflicts, traffic safety related, and miscellaneous emergencies. Table 1 B is a listing of the total number of calls dispa.tched for twenty types of incidents, accounting for 37% of all dispatched calls during 1983.
16
At the outset it should be noted that a measure of arbitrariness is involved in classifying any given request for police services. For example, a fight between spouses is considered a "family problem". Yet if criminal assault is present, then the particular in,cident becomes a "crime" rather than a "family problem". Similarly, while most traffic incidents to which police respond invc!'!~ ::lnly a traffic ordinance violation, some such traffic incidents, such as drunk driving or hit and run, entail a serious criminal offense.
The data on citizen calls for assistance reveal a great de~:11 about the nature of urban policing.
· .. Inspection of Tables 1 A and B will clearly show that city policing is a complex, diverse enterprise and that it is erroneous to consider the police department as an agency strictly specializing in crime control. While crime, of course, is a paramount police concern, it cannot ignore the many other important service demands of the public.
· .. Most criminal incidents to which police attend are reports of crimes after the event. Request for police to intervene while the crime is in progress are relatively few. In contrast, many calls pertaining to citizen conflict and to various other emergencies deal with events in progress where a rapid and competent pOlice presence can immediately prevent serious harm to persons or to property.
· .. The diversity of incidents which the police are expected to handle well points up the need for the employment of high caliber personnel. No single skill defines a good police officer: He or she must be capable, for example, to investigate a crime, to intervene and resolve an emotion ridden interpersonal conflict, to assist an injured or ill person, to control traffic, or, last but not least, to prudently enforce the law. PoliCing, contrary to many occupations, often requires the capability to exercise cool, sophisticated judgements in delicate and dangerous situations.
The fact that the Minneapolis Police Department, as other urban police agencies, has diverse and complex responsibilities is explainable by several.
reasons. First, the police are legally mandated to enforce the law, maintain order and control crime. Second, the Department is highly mobile, it has superb communications and, consequently, it is particularly equipped to respond to reports of emergencies and unusual occurrences. Third, contrary to most governmental agencies, the police are available to provide assistance to the public on a twenty four hour basis for all days of the year:
I
Table 1A
AUGUST, 1983 DISPATCHES IN RESPONSE TO CITIZEN REQUESTS FOR POUCE ASSISTANCE, BY TYPE OF INCIDENT
ASSISTANCE RELATED TO CRIMINAL EVENTS Assault Assault in Progress Criminal Sexual Conduct (Rape) Robbery (Business, Dwelling, Person) Robbery of Business in Progress Burglary (Business, Dwelling) Burglary in Progress (Business, Dwelling) Theft (Including in Progress) Auto Theft Other Crime-Related Calls (Stabbing, Person with
a Weapon, Person with a Gun, Shooting, Shots, Damage to Property)
ASSISTANCE RELATED TO CITIZEN CONFLICT Family Problems (Domestic, Domestic with Weapon,
Heavy Domestic) Kid Trouble Customer Trouble Neighbor Trouble LandlordfTenant Dispute Loud Parties and Disturbances (Music) Unwanted Person on Premises (Including Intoxicated
Persons) Fights and Other Altercations (Fight with Weapon)
ASSISTANCE RELATED TO TRAFFIC SAFETY Property Damage Accidents Personal Injury Accidents Parking Problems Traffic Law Enforcement Dispatches
ASSISTANCE RELATED TO MISCELLANEOUS EMERGENCIES Alarm Calls (Holdup, Silent, Audible) Suspicious Events (Prowlers, Suspicious Person,
Suspicious Vehicle, Unknown Trouble) Abandoned Children Assist Sick or Injured (Slumper, Person Down,
Check the Welfare, Overdose) Notification to Citizens of Emergencies Other (Receive Information, Lockout,
Recover Property, Assist Officer) Other Miscellaneous
Total of Above Categories Total Dispatches/August
Number of %of Requests Month Total
534 2.4 94 .4 62 .3
251 1.2 1 .0
1007 4.5 323 1.5 934 4.2 211 .9 688 3.1
4105 18.5
1454 6.5
402 1.8 224 1.0 150 .7 64 .3
1953 B.B 1023 4.6
~ -1JL 5686 25.6
n1 3.5 345 1.6 281 1.3
--1E1 .2.!. 3121 14.2
991 4.5 1730 7.8
20 .1 985 4.4
120 .5 ~ 1211 5.4
980 .....1:1 6037 27.1
18,959 85.4 22,239
17
------------------ ----- - - - ------~-----
I
Table 1B SELECTED 1983 DISPATCHES, YEAR TOTALS, IN RESPONSE TO CITIZEN REQUESTS FOR POLICE ASSISTANCE
Robbery of Business ..................................... . 374
Robbery of Person ...................................... . 2003
Traffic Law Enforcement .................................. . 17835
85,544
Total Calls Dispatched, 1983 230,768
18
% Of Total Calls Dispatched
1.9
2.6
2.4
1.0
1.0
.3
3.6
1.2
. 2
.08
.2
4.8
1.4
.2
4.1
1.1
3.0
.2
.9
7.7
37%
IMPERFECTIONS OF CRIME STATISTICS
Tables 2 through 5 consist of statistics which profile crime in the city. Such statistics meet the requirements of the Uniform Crime Reports (UCR) of the Federal Bureau of Investigation. The FBI compiles crime data for the nation and publishes it on a regular basis. The Uniform Crime Reports are divided into Part I and Part II crimes. Part I offenses are considered to be the more serious crimes since they include violent crimes and the most prevalent crimes against property. They are criminal homicide, forcible mpe, aggravated assault, robbery, burglary, larceny, auto theft, and arson. Other crimes, such as simple assaults, frauds and morals offenses, are classified as Part II crimes (See Table 4).
The first thing that must be understood by any individual looking at crime data based on the UCR, which is the most established method for tabulating crime statistics, is that such data do not
I CRIME IN MINNEAPOLIS
represent the actual crimes that were perpetrated during a given period, but, rather, they represent merely crimes that are known to the police. Police find out about crimes primarily from reports by victims or other witnesses. Unfortunately, much crime goes unreported . Some people do not report crime to the pOlice because they may fear reprisals from the offender, others do not wish to
. get the offender "into trouble", some think the police will not be of any use, and others Simply do not wish "to bother".
What the real or actual crime rate is in Minneapolis or, for that matter, in any large city, is hard to determine. Clearly, it is substantially higher than what the ensuing tables represent. National victimization studies, which consist of interviews with samples of citizens selected under statistical controls, seem to indicate that the actual crime rate when compared to the UCR reported rate, is much greater; about twice what is reported to the police.
Thus, for example, larceny may be four times higher than what is reported to the police, forcible rape about two times higher and burglary about three times what is reported by the public. It is not known what, in fact, is the discrepancy factor between the actual and reported crime in the City of Minneapolis at the present time.
Reluctance by the public to report crime presents some serious operational problems to the Department. In the first place, since periodic changes in the Minnapolis crime data may be only shifts in the rate of "crime reporting" rather than in the rate of crime, the Department has some difficulty in judging the effectiveness of its tactics to control crime. In the second place, and most importantly, if the police do not know about criminal events, how can they possibly seek to solve them? The citizen is a vital link in the police effort to control crime. At the very least, citizen cooperation with the police must extend to the reporting of a crime.
19 __
-~~--- ---
CRIME PATTERNS Analysis of reported offenses shows
some persistent patterns the highlighting of which may more realistically depict the problem of crime in Minneapolis. Such patterns, generally, are not unique to the city and show up in many urban areas of the nation.
Crime is not equally distributed throughout the city. This can be seen by inspecting reported offense data by police precinct (See Table 3). Even within precincts there is variation among neighborhoods. Highest crime rates are associated with city areas which are marked by higher incidence of other social problems: low income, broken families, substandard housing, unemployment and the like. Most offenses are unsophisticated, momentof-convenience crimes which are perpetrated within the neighborhood of the offender's residence. A partial explanation for this is that a disproportionate amount of crime is committed by the young, preponderantly young males. The peak age for property offenders is in the mid-teens while that for violent offenders, early twenties. (This will be made more clear later in this report when arrest information is presented). Such patterns of crime make it quite apparent that the poorer segments of the Minneapolis community, those individuals and families which are compelled by circumstance to live in the high crime areas, run the greatest risk of being victimized and, consequently, are in the greatest need for police services and protection and of other programs to control crime.
20
CRIME PATIERNS I
Approximately one out of ten major offenses are violent crimes; mainly, forcible rape, robbery and aggravated assault. The bulk of offenses are against property, principally larceny and burglary. Often a perpetrator of a violent crime, such as forcible rape and aggravated assault, is previously known to the victim.·While it may seem paradoxical, offense statistics imp!)' that one should fear such violence more from acqaintances, friends and relatives than from strangers. The converse is true however, in the case of robbery. Most robberies are "Strangeron-stranger" offenses.
Robbery of business represents about 19% of all robberies. Businesses which run the most risk of being robbed are service stations, convenience stores, bars and drug stores. A weapon is used more frequently in the robbery of a business than in the robbery of a person. Approximately 54% of robberies of person are "strong arm", those not involving intimidation by means of a weapon. About 65% of robberies occur on the street while the remainder are inside the person's home or inside business or other premises.
Business burglaries average about 25% of all burglaries. The rest are burglaries of private residences or the garages at those residences. Approximately one-third of the burglaries do not involve forced entry. This clearly indiGates that a substantial property loss could be prevented if citizens exercised more prudence by securing their residences or places of business.
About 60% of the burglaries, when the time of the offense is known, are perpetr'lted at night. Items most frequently taken during a burglary are cash, stereos, televisions and jewelry. Residences which tend to be most susceptible to burglaries are homes left unwatched while the residents are out of town and corner homes. Many burglaries are committed by teenagers who reside in the victim's neighborhood.
About 40% of larcenies are of automobile accessories or personal property left in an unsecured automobile. Bicycles lead the list of other items which are frequently stolen.
On the average, about 30% of motor vehicle thefts are thefts for profit derived from resale of the vehicle or its parts. The remainder of vehicle thefts can be categorized as "joy ride" thefts, personal use thefts, or otherwise thefts not intended for the resale of the vehicle or its components.
Lastly, it should be kept in mind that many of the reported major offenses are perpetrated indoors, within the confines of private businesses, residences or public buildings. Since considerations of customs, laws and practicality restrict police crime deterrence tactics to generally outdoor settings, it should be apparent that police unilateral ability to prevent crime is closely tied to the efforts and initiative of the citizenry to be watchful, prudent in safeguarding property and especially in cooperating with the police by, at the very least, the conscientious reporting of crimes and suspicious events.
.l
I
I Table 2
MAdOR OFFENSES REPORTED TO THE POLICE, 1980·1983 Uniform Crime Reports Basis (Part I,
OFFENSE CLASSIFICATION
1980
CRIMINAL HOMICIDE Total 37
A-Murder/Nonnegligent Manslaughter 37 B-Manslaughter by negligence 0
TOTAL MAJOR OFFENSES REPORTED 4373 3955 11,601 10,432
(%) Distribution by Precinct 12% 11% 31% 30%
22
4 Pet 1982 1983
18 7 0 1
18 8
98 94 11 12
109 106
260 170 161 137 44 45
622 517
1087 869
172 151 271 243 97 103 33 23
573 520
2363 2386 1018 942 193 188
3574 3516
6468 6783
645 555 108 75 11:)4 100
917 730
18 19
12,764 12,551
34% 36%
5 Pet 1982 1983
4 5 0 0
4 5
74 58 26 13
100 71
193 129 104 67 43 27
316 294
656 517
61 48 94 87 66 44 31 10
252 189
1435 1213 1085 1036
120 140
2640 2389
4491 4206
314 270 29 35 80 83
423 388
15 13
8581 7778
23% 23%
i /1 ,
\\ II I
I 18ble4
OTHER OFFENSES REPORTED TO THE POLICE, 1980·1983 Uniform Crime Reports Basis (Part II)
OFFENSE CLASSIFICATION 1980 1981
Simple Assault 3701 4261
Vandalism 6419 6423
Weapons Violation 334 430
Prostitution 779 654
Sex Offenses 666 703
Narcotic Drug Laws 542 626
Driving Under Influence 1175 1562
All Other Part II 1282 1405
TOTAL 14,898 16,064
Percent Change 1982 1983 198(1-1983
3572 4265 +-15%
5489 5630 =14%
332 284 -15%
1091 1005 +29%
649 619 -- 7%
576 562 + 4%
1842 1834 +56%
1423 1326 + 3%
14,974 15,524 ... 4%
23
COMPARISON OF CRIME IN MINNEAPOLIS AND IN OTHER CITIES
In Table 5 a comparison is made of reported major offenses in Minneapolis and in other cities which have a comparable population. These cities have been selected randomly. The data are for 1982.
Caution must be exercised in drawing conclusions about the relative safety from crime of Minneapolis residents as
TableS
I opposed to the residents of the cities being compared. As previously explained, since the data deal with reported offenses, the inter-city va~iations may be not of the crime rate but pf the "reporting rate". Th~s, for examRle, if the police of a given city are highly successful in encouraging the public to report crimes to the pOlice, that city will show more "crime".
Nor should crime rate variations be presumed to necessarily occur because of variations in police productivity.
MAdOR OFFENSES KNOWN TO THE POLICE Uniform Crime Reports Basis (Part I) Selected Cities * , 1982
Criminal Forcible Aggravated City Homicide Rape Robbery Assault Burglary
MINNEAPOLIS 36 314 2583 1314 11,467
Tucson 31 236 910 1748 9481
Miami 190 349 5123· 4301 11,130
Newark 117 489 6393 3705 8697
Albuquerque 26 199 926 1508 7980
Buffalo 42 247 1653 1615 7969
Toledo 24 215 1473 684 8435
Tulsa 31 228 1050 1395 9564
I Portl~nd 36 392 2811 3245 13,728
*Cities in the 350-400 thousand population range, randomly selected. SOURCE: Federal Bureau of Investigation, Crime in the United States, 1982.
Crime has strong relationships with certain socioeconomic and demographic characteristics of an urban population, the strength of which obscures police agency contribution to crime prevention and control. For example, cities which have a higher proportion of young people and/or economically disadvantaged groups, will tend to show more crime even though tney may be serviced by a highly profession ali police department.
Auto Larceny Theft Arson Total
19,058 2487 140 37,399
21,803 1716 346 36,271
26,329 5479 134 53,035
10,347 6424 1448 37,620
17,214 1361 N/A 29,214
13,608 3458 498 29,090
17,428 1978 790 31,027
17,134 3444 346 33,192
25,632 2248 623 48,715
VICTIMS OF CRIME Figure 1 depicts selected characteris
tics of victims of violent crime. It should be noted that the graph represents characteristics based on a national study of victimization. The profile of Minneapolis victims may, consequently, differ although the Department believes that the city's victim prOfile would tend to be generally similar to that of the nation.
It can be seen that the incidence of personal crimes of violence (rape, rob-
Figure 1
r bery and assault) was relatively higher among males, younger persons, blacks, Hispanics, those divorced or separated, the poor, and the unemployed.
While not shown in Figure 1, it was found that members of some groups with the same characteristics, such as males and the young, also were the more likely victims of theft. Blacks had higher victimization rates than whites for household burglary and motor vehicle theft. The poor were the most likely
victims of burglary but the least likely victims of larceny and motor vehicle theft. The homes of younger individuals, city people, renters, and members of large households were affected relatively more by property crime than were others.
The above information is based not on reported offenses but on interviews of a national sample of citizens selected under statistical controls.
Selected Characteristics of Victims of Violent Crime, National Sample, 1977
The difference between rates within cataC)ories are statistically significant. Rate differen~es between catagories may or may not be significant.
Source: National Criminal Justice Information and Statistics Service, U.S. Department of Justice. Criminal Victimization in the United States, 1977: A National Crime Survey Report. (December, 1979) p. 7.
25
--------------------------~--------
TRAFFIC HAZARD IN MINNEAPOLIS
Table 6 and Figures 2 and 3 profile the traffic accident patterns during 1983. Most accidents consist of one vehicle striking another in traffic. The automobile accident rate varies by time of day and by the day of the week. As can be seen in the graphs, accident hazard is high during late afternoon hours, the period between 3 and 6 p.m. on Friday being particularly hazardous.The hour between 12 and 1 a.m., Friday night to Saturday morning, also shows a conspicuously higher traffic accident rate.
While accidents involving pedestrians, bicyclists and motorcyclists are much fewer in number, regrettably they almost invariably cause personal injury.
Reducing the traffic hazard in the city is of paramount concern to the Minneapolis Police Department. As will be seen in later statistical presentations, a vigorous traffic law enforcement policy during the past several years has led to a sharp reduction in accidents.
Table 6
I
ANALYSIS OF TRAFFIC ACCIDENTS, 1983
__ • 4_"~ ____ r ....... ·
TYPE OF ACCIDENT Total
Ran off Road 18 Overturned on Road 30 Pedestrian 424 Motor Vehicle in Traffic 2963 Parked Motor Vehicle 2214 Railroad Train 7 Bicyclist 233 Fixed Object 751 Other Object 20
This section presents narrative and statistical information descriptive of the Minneapolis Police Department's organizational structure and operations. The resource deployment pattern portrayed, such as represented by personnel assignments and budgetary allocations, clearly shows that the heart of police operations is found in the Patrol Division to which other police organizational units relate in a supportive capacity.
The uniformed patrol officer should consequently be seen as the most important element in the police service delivery system. He or she embodies the full range of police responsibilities and is expected to meet them with skill and prudent discretion. It is not an exaggeration to say that the quality of any city police agency depends upon the quality of its uniformed patrol force. How patrol officers are selected, trained and rewarded vitally determines how well police will do its job.
28
DEPARTMENTAL ORGANIZATION
Figure 4 depicts the relative resource distribution patterns expressed as sharE?s of the 1983 budget and as a proportion of personnel assigned, by four major division of the Minneapolis Police Department.
The Office of the Chief coordinates the collective effort of the Department. One of the principal tasks of this office is to create such an organizational environment which is most conducive to superior performance by individual police officers of thGir responsibilities. Another principal task of the Chief is to maintain the professional integrity of departmental members. For this purpose, the Internal Affairs section is located within the Office of the Chief and reports directly to him. The main responsibility of Internal Affairs is to investigate complaints, both from citizens and those internally derived, against officers relating to personal misconduct or to imprudent performance of duty.
Approximately 58% of departmental resources are devoted to the Patrol Bureau. It performs comprehensive police service such as control of crime, resolution of citizen conflict, regulation of traffic, and the provision of miscellaneous emergency services. The Patrol Bureau is the heart and center of departmental operations. Its importance and size can be best understood in the context of the main tactics which police employ to achieve their objectives. Police rely on two key tactics. The first is a "reactive" tactic; that is, where the
police respond to the scene of an incident at the request of a citizen. The second tactic is "proactive"; that is, where police, on their own initiative, undertake some activity designed to accomplish police departmental objectives. Examples of proactive tactics would be surveillance of possible criminal activity, gathering of crime related intelligence, or patrol designed to intercept criminal activity. Since in democratic societies, custom, legal standards guiding police operations, and resource constraints limit police initiative, the principal tactic used by the police is the reactive one. The vast proportion of incidents which police handle come to its attention through citizen calls for assistance. The Patrol Bureau is particularly organized to react to such requests.
The Investigation Bureau is primarily responsible for investigating cases not cleared by the Patrol Bureau, for gathering information about possible organized criminal activity in Minneapolis, and for obtaining additional evidence about the crimes of persons arrested in order to assist in their prosecution. The Service Bureau provides varied technical and logistical support to operations. (More detailed information about each bureau and its organization follows. Please see Figures, 6, 7 and 8.)
Figure 5 depicts the distribution of 1983 Department budget by type of expenditure. It should be noted that most of police costs are those for personnel; salaries and fringes constitute 88% of all expenditures. This clearly indicates that the quality of police personnel is the key to quality pOlicing.
I Figure 4
Distribution of Operating Costs and Personnel in 1983, By Major Departmental Division
Off\ce of the Chief
6% Costs: $1,949,068 Sworn: 7 Civ.: 3 -
Patrol Bureau
57.6% Costs: $18,672,336 Sworn: 473 Civ.: 13
Investigation Bureau
24.5% Costs: $7,958,352 Sworn: 134 Civ.: 11
Service Bureau
11.9% Costs: $3,864,634 Departmental Total Sworn: 76 Civ.: 60
FigureS
Distribution of Operating Costs In 1983, By Object of Expenditure
1983 Costs of Operation: Total Sworn Personnel: Total Civilian Personnel:
WAGES & SALARIES
OTHER ~"'o.J ------ OPERATING
COSTS
~ EQUIPMENT $128,053 PURCHASES .40%
WORKMAN'S COMPENSATION COSTS '------ $947,642
2.92%
$598,023 1.84%
$32,444,390 690 87
29
~-~---------------------
Deputy Chief LEONARD V. BRUCCIANI
THE PATROL BUREAU Major Responsibilities:
The Patrol Bureau of the Minneapolis Police Department provides general patrol and traffic law enforcement functions for the department.
The patrol function includes responsibility for responding to requests for emergency and non-emergency pOlice service, offender apprehension, prevention and deterrence of crime, initial investigation and evidence gathering and maintenance of order within the community.
The traffic law enforcement function includes responsibility for responding to personal injury vehicular accidents, maintaining proper traffic control and flow throughout the city, and the issuance of traffic violation citations to encourage compliance with existing traffic ordinances or laws.
30
3
70
121
40
3
PATROL BUREAU I
DEPUTY CHIEF 1* PATRDL
BUREAU
INSPECTORS
SECOND PRECINCT DIVISION
I-- PATROL UNIT
Y INVESt UNIT
THIRD PRECINCT DIVISION
- PATROL UNIT
INVESt UNIT
STREET CRIMES DIVISION
I--PATROL
UNIT
- CANINE UNIT
CIVIL DEFENSE r-
INSPECTIDNS DIVISION
FOURTH PRECINCT DIVISION
PATROL r--UNIT
INVESt I--UNIT
FIFTH PRECINCT DIVISION
PATROL 1-UNIT
INVEST. r--UNIT
TRAFFIC UNIT
CHEll'. TEST SECTION I--
HIT & RUN t--SECTION
TRAFFIC CONTROL t--SECTION
3
121
91
32
*Number of personnel assigned
50
34
20
*Number of personnel assigned
1 *
HOMICIDE! ROBBERY! FAMILY VIOLENCE
DIVISION
JUVENILE DIVISION
INVESt - UNIT
SCHOOL L-.- LIAISON
UNIT
FORGERY!FRAUDI AUTO THEFT
DIVISION
!INVESTIGATIVE BUREAU
DEPUTY CHIEF INVESTIGATIVE
BUREAU
ORGANIZED CRIME 20
DIVISION
PAWNSHOP! ANTIJENCING I--
UNIT I--
LICENSE I--UNIT
BOMB SQUAD I--UNIT
VICE! I-- NARCOTICS 20
I--DIVISION
J
1 Deputy Chief
BERNARD A. JABLONSKI
THE INVESTIGATIVE BUREAU
Major Responsibilities: The Investigative Bureau ~s co~.
prised of specialized a~d te.chnlc~1 d~vl sions and units providing investigativE capability for the department.
The investigative function includes responsitlility for gathering. evidence, identifying and apprehending off~nd~rs, preparing cases for trial, and maintaining liaison with prosecutors, courts, corrections, and other law enforcement agencies.
Selected Activity Measures:
Total cases investigated: Homicide 2192 Robbery 994 Family Violence 2271 Forgery/Fraud 1674 Auto Theft 2314 Vice 2473 Narcotics Organized Crime
31
Deputy Chief PATRICK J. FARRELL
THE SERVICE BUREAU Major Responsibilities:
. Th~ Service Burea~ of the Minneapolis Police Department IS comprised of various areas of work specialization providing service or administrative functions for the department.
Service Bureau Divisions and Units provide service to other department components. The Service Bureau includes Research and Development, Admi~istrative Services, Community Relations and Central Records providing expertise and specialization.
Major Activities:
Community relations programs Neighborhood crime prevention programs Selection and training of personnel Fiscal control of departmental operations Maintenance of central police records Provision of criminal identification information Statistical analysis of crime trends Crime laboratory-criminalistics support
32
SERVICE BUREAU I
DEPUTY CHIEF 1 * SERVICE
BUREAU
COMMUNITY
12 RELATIONS DIVISION
27
CRIME - PREVENTION UNIT
SCHOOL '--- PATROL
UNIT
ADMINISTRATIVE SERVICES "-DIVISION
- PERSONNEL UNIT
RESEARCH & - DEVELOPMENT UNIT
- TRAINING UNIT
FINANCEI "'"- PAYROLL
UNIT
---------I II I
EMERGENCY COMMUNICATIONS !-I L - _____ __ .J
I--
SUPPORT SERVICES DIVISION
PROPERTY & EVIDENCE I--
UNIT
CRIME ANALYSIS I--
UNIT
CRIMINAL HISTORY -UNIT
RECORDSI TRANSCRIPTI I--
UNIT
IDENTIFICATION DIVISION
FIELD OPERATIONS I--
UNIT
PHOTO LAB I--UNIT
CRIME LAB UNIT -
59
19
*N umber of personnel assigned
) 1
·,t
I .~ t <.~ , ., ~ } i ..
",\, '~ ,
1 f ~ ~ .$
4
l l 1 -~,'
DEPARTMENTAL PERSONNEL With the creation of the Minnesota
Peace Officers Standards and Training (P.O.S.T.) Board in 1977, hiring standards for police officers were established by the state of Minnesota. State law requires that peace officers be United States citizens, possess a valid driver's license, have no felony convictions and possess the necessary physical and psychological capabilities to function in a law enforcement capacity. Prospective
Table 8
I officers, in order to be licensed, must also complete the following: 1) complete a law enforcement program at a two or four year P.O.S.T.-certified institution; 2) pass the academic portion of the P.O.S.T.licensing examination; 3) complete a P.O.S.T.-certified skills course; and, 4) pass the skills portion of the P.O.S.T.-licensinJ examination. Peace officers from other states who have successfully completed a basic police training course may take a P.O.S:t
administered reciprocity examination to become eligible for licensing.
To obtain the highest caliber of candidates possible, the Department participates in the recruitment process along with the Minneapolis Civil Service Commission.lnherent in the Department's selection process is an active policy of Affirmative Action and Equal Employment Opportunity for women and ethnic minorities.
DISTRIBUTION OF DEPARTMENTAL PERSONNEL BY RANK, SEX AND ETHNICITV, 1983
Sex Ethnicity SWORN PERSONNEL Total Male Female White Black Hispanic Native Am Other
Chief 1 1 1
Deputy Chief 3 3 3
Inspector 3 3 2 1
Captain 15 15 15
Detective Supervisor 3 3 3
Lieutenant 87 87 87
Sergeant 146 146 146
Officer 432 404 28 389 21 9 12 1
Total Sworn 690 662196% 28/4% 645/93.5% 2213.2% 10/1.4% 1211.7% 1/.1%
This section presents statistical information selected to show, at least in a summary manner, how the Minneapolis Police Department performed.
It should be realized that the measurement of police performance is difficult. As seen in the preceding statistical sections of this report, the Department provides a variety of services to the community. It seeks, for example, to control crime, to maintain order, to promote traffic safety, and to provide miscellaneous emergency assistance. The diversity of the police task makes it difficult to determine which responsibility should get the lion's share of attention when trying to account for accomplishments.
Police performance measurement is also hard because there are several criteria for such measurement. Should police be held accountable to a standard of effectiveness, a criterion which emphasizes results without paying much attention to the cost of achieving them? Should police be held to a standard of efficiency which tends to emphasize the frugal use of public resources? Should the police be held to a standard of equity, a notion which has little to do with economics but a great deal to do with the ideal of a fair and equal distribution of services for all citizens? Consequently, how the police are judged often depends upon an individual's point of view. The data that follow have been selected to show the Department's performance from several such points of view.
PERSONS ARRESTED IN 1983 Tables 9, 10 and 11, present an analy
sis of persons arrested in various offenses in 1983. The data are grouped to show the age of individuals arrested, their sex and the distribution of arrests by precinct.
34
Laws of criminal procedure allow the police to make an arrest when police have reasonable grounds to believe that a person has committed the crime. That is, police must have "probable cause" before they can arrest anyone. This long established legal principle guiding police arrest procedure is very significant for the interpretation of arrest statistics and for the proper understanding of how police arrest activity impacts upon crime control in the city.
The "probable cause" standard, however, does not mean that every arrest will lead to the person's prosecution, trial or conviction. Evidentiary grounds for police to make a lawful arrest are not the same as for sustaining charges during the later stages in the criminal justice process. Thus, for example, the prosecutor may not choose to charge the person with the crime because in his judgement the evidence my not be of sufficient strength to warrant a formal charge; a process which is time-consuming and expensive to the state. Or, for example, even if a charge is filed, the evidence, in the eyes of the court, may not be sufficient for it to be sustained. Although police seek to obtain the best possible evidence before making an arrest, what happens to the person further in the criminal justice process is necessarily based on stricter evidentiary standards as primarily interpreted by prosecutorial and judicial officials.
Police obtain probable cause for making an arrest primarily from interviewing victims and other witnesses of a crime. In the vast preponderance of cases, it is the citizen's action rather than independent police investigative action which most directly leads to an arrest of a suspect. This is very significant for containment of crime in Minneapolis. It means that citizens' cooperation with the police, expressed, for example as willingness to report crime,
to provide information to the police, to testify, is of fundamental necessity if pOlice are to be successful in obtaining the maximum possible arrest rate of suspects. The police-citizen link in crime control is absolutely vital. On their own, police can do but little to apprehend suspected criminal offenders.
From arrest statistics for major offenses, a general profile can be drawn of the crime problem in Minneapolis. Such a profile should be accepted with caution as arrest statistics depict only those individuals who are taken into custody. There are many who escape arrest and, consequently, their characteristics are not known to the police.
A typical offender is young. About three-fourths of those arrested for major offenses (Part I of UCR) are 25 years of age or younger; about 40% are juveniles, those below the age of 18. Those who are in the 18 to 25 age bracket are disproportionately arrested for violent crimes such as rape, robbery and assault. Those below eighteen, are disproportionately arrested for crimes involving theft. Girls and women are arrested about three times less frequently than boys and men for major offenses. A disproportionate number of persons arrested come from the poorest sections of the city.
In sum, the Department's arrest statistics profile the crime problem in MinneapOlis not as one in which the police confront a hardbitten criminal underworld. It is one where police confront the usually ad-hoc, moment of convenience, unsophisticated, yet at times brutal criminality of young males from the most disadvantaged families in the city. The linkages of crime, youth and poverty are profound, disturbing and clearly indicate that the city's crime problem is beyond solutions provided exclusively by pOlice law enforcement and crime prevention tactics.
mercial Vice 12 Sex Offenses 9 Narcotic Drug Laws 20 Driving Under
Influence 241 Other Part II 853
Sub total Part II 1328 % 7.1
Total Offenses 1734 % 7.1
3rd Pet.
3 15 73 72
291 1347
94 6
1901 31.9
431 154 45
219 35
104
599 4387
5974 32.4
7875 32.2
Outside 4th Pet. 5th Pet. City Total
3 3 1 10 21 10 49
156 58 11 314 130 49 5 277 283 186 5 847
1784 756 9 4156 130 46 290 12 3 25
2521 1111 31 5968 42.2 18.6 .5
512 234 3 1310 185 75 3 470
81 40 2 178
399 408 4 1042 57 21 3 125
242 '132 15 513
576 413 5 1834 4866 2823 56 12,985
6918 4146 91 18,457 37.5 22.5 .5
9439 5257 122 24,425 38.7 21.5 .5
37
CRIMES CLEARED BY THE POLICE
Table 12 summarizes the proportion of known major offenses cleared by the Department from 1980 through 1983. An offense is considered to be cleared when the police have identified the offender, have sufficient evidence to charge him, and actually take him into custody. In exceptional instances, crimes may be cleared when some element beyond police control precludes taking the offender into custody. Examples of circumstances resulting in exceptional clearances would be the death of the offender (suicide, deathbed
Table 12
confession, etc.) or the refusal of a victim to cooperate in the prosecution after an offender is identified. It should be noted that the arrest of one person can clear several crimes or several persons may be arrested in the process of clearing one crime.
The fact that criminal homicide, rape and aggravated assault are cleared at a higher rate than other major offenses should not be exclusively attributed to greater police investigative effort of these violent offenses. These crimes are cheracterized by circumstances whereby there often is a previous known relationship between the victim and the offender. This results in an. easier avail-
I
PROPORTION OF KNOWN MAJOR OFFENSES CLEARED, 1980·1983
MAJOR OFFENSES 1980 1981 (UCR Part I) Rptd. Cleared % Rptd. Cleared % Rptd.
Criminal Homicide 36 26 72 28 26 93 36
Forcible Rape 373 48 13 367 93 25 314
Robbery 2267 196 9 2296 531 23 2583
Aggravated Assault 1241 306 25 1192 748 63 1314
Burglary 11,609 554 5 12,543 2055 16 11,467
Larceny 17,504 2826 16 18,943 6827 37 19,058
Motor Vehicle Theft 2790 143 5 2846 313 11 2487
Arson
Total Major Offenses 36,027 4146 12 38,215 10,593 28 37,259
38
ability of victim/witness furnished evidence. Crime clearance rates, it should be stressed again, are highly dependent upon citizen cooperation with the police.
Since crime clearances relate reported offenses to police arrests, cautionary remarks made in regard to the latter two sets of data apply here. Since many citizens fail to report a substantial proportion of offenses, the actual crime clearance rate is substantially lower. Also, since not all arrests necessarily lead to prosecutions, it should not be presumed that all crime clearances lead to the filing of formal charges and to the adjudication of the offender.
1982 I 1983 Cleared % Rptd. Cleared %
31 86 17 13 76
73 23 314 78 24
418 16 1989 366 18
718 55 1149 659 57
1792 16 10,677 1004 9
6665 35 18,372 5815 32
210 8 2119 147 7
9907 27 34,650 8082 23
IMPROVING TRAFFIC SAFETY
The purpose of police traffic regulation activities is to minimize the threat to life and property due to vehicles using public streets. This objective is not easy to obtain as traffic accidents, not unlike crimes, tend to be random occurrences which do not readily lend themselves to prediction and, consequently, to timely preventative action by the police. Nevertheless, the Department employs three main tactics which have proven themselves over time as having a definite, although not always an easily measurable impact on improving traffic safety.
Table 14
I The first tactic consists of traffic con
trol during occasions of high and dangerous vehicular or pedestrian congestion. Sporting events, parades, disasters, fires are good examples of such occasions.
The second means of obtaining better traffic safety involves traffic accident investigation. Such investigations result in the citation, and thus penalizing, of individuals responsible for the accident. However, the more concrete safety related benefit that ensues from accident investigation is that of identification of probable accident causes unrelated to driver fault. Over time, the police
SELECTED TRAFFIC LAW ENFORCEMENT DATA, 1980.1983
DATA CATEGORY 1980 1981 1982 1983
Hazardous Violations: 13,940 23,322 39,979 39,854 Speeding 6,503 11,618 21,374 21,214 Running a Red Light 384 517 807 887 Failure to Stop at Sign 3,465 6,382 11,080 6,818 Improper Turn 169 325 2,541 6,493 Other 3,419 4,480 4,177 4,442
Hit and Runs Cleared 2,154 2,241 1,922 1,924 Hit and Run Drivers Charged 329 342 301 398
Persons Stopped for DWI: 2,050 2,657 2,557 2,693 Breath Tests Given 1,640 1,517 1,588 Requests for Blood Tests 328 159 70 Refusal of Tests 698 881 1,035
obtain data which points to, for example, the lack of adequate signals or to hazardous configuration of streets as phYSical contributors to accidents. These findings are brought to the attention of the citys traffic and street engineering experts.
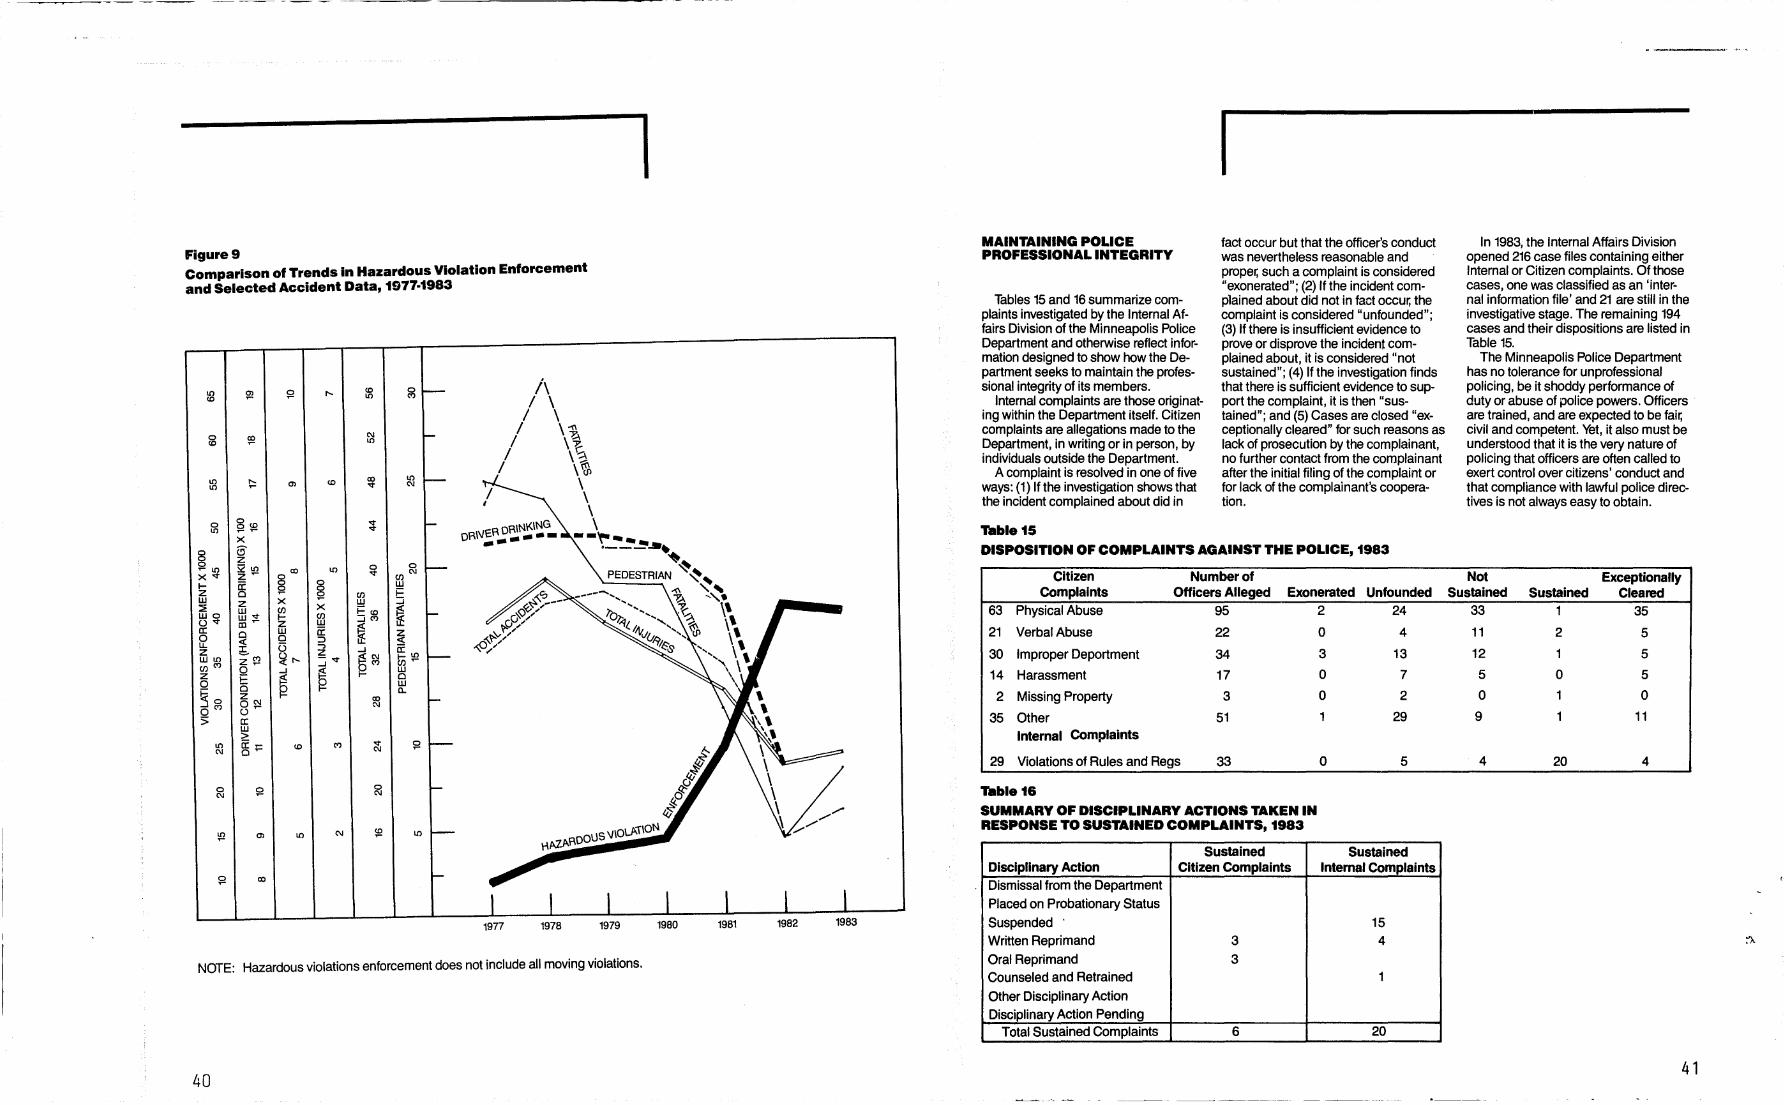
The third and the principal tactic for obtaining better traffic safety is that of law enforcement. Vigorous enforcement, particularly of hazardous violations such as reckless driving and driving while intOXicated, has resulted in a noticeable decline during the past several years in the number of accidents as well as accident related injuries and fatalities. (See Table 14 and Figure 9)
39
(.
--- - -- -- - ------ --------------~
Figure 9 Comparison of Trends in Hazardous Violation Enforcement and Selected Accident Data, 1977·1983
lfl ~ $2 to to lfl
0 ~ C\I
to lfl
lfl ~ co lfl
lfl v C\I
0 ~~ lfl X
8 8' Z S2lfl ~
0 T"lfl co lfl (f)C\I xv zT"
~ I- a: ~ W
z 0 (f) E W z x W -' :E Wv (f) x §~ ~ wo I- (f)
OV ~T" Z W ~
tt a: 0 w a: z ~ « 0 :::> tt «
6- (3 -" -' a:lfl z stl'- z
~~ Wlfl z~ ::::iv ~T"
(f)M 0 -'
~ W
z E ~ 0
Q W 0 0-
~o Z co OC\l C\I
OM oT" :> a:
W >
lfl a:T" ~ $2 C\I oT"
0 0 $2 C\I C\I
~ \Q lfl
I-\,t>,ZAROO
$2 co
I
US \/IOLAiION
NOTE: Hazardous violations enforcement does not include all moving violations.
40
t-~
If ~
# (j)
MAINTAINING POLICE PROFESSIONAL INTEGRITY
Tables 15 and 16 summarize complaints investigated by the Internal Affairs Division of the Minneapolis Police Department and otherwise reflect information designed to show how the Department seeks to maintain the professional integrity of its members.
Internal complaints are those originating within the Department itself. Citizen complaints are allegations made to the Department, in writing or in person, by individuals outside the Department.
A complaint is resolved in one of five ways: (1) If the investigation shows that the incident complained about did in
Table 15
I fact occur but that the officer's conduct was nevertheless reasonable and proper, such a complaint is considered "exonerated"; (2) If the incident complained about did not in fact occur, the complaint is considered "unfounded"; (3) If there is insufficient evidence to prove or disprove the incident complained about, it is considered "not sustained"; (4) If the investigation finds that there is sufficient evidence to support the complaint, it is then "sustained"; and (5) Cases are closed "exceptionally cleared" for such reasons as lack of prosecution by the complainant, no further contact from the complainant after the initial filing of the complaint or for lack of the complainant's cooperation.
DISPOSITION OF COMPLAINTS AGAINST THE POLICE, 1983
Citizen Number of Complaints Officers Alleged Exonerated Unfounded
63 Physical Abuse 95
21 Verbal Abuse 22
30 Improper Deportment 34
14 Harassment 17
2 MiSSing Property 3
35 Other 51 Internal Complaints
29 Violations of Rules and Regs 33
Table 16 SUMMARY OF DISCIPLINARY ACTIONS TAKEN IN RESPONSE TO SUSTAINED COMPLAINTS, 1983
Sustained Disciplinary Action Citizen Complaints Dismissal from the Department Placed on Probationary Status Suspended . Written Reprimand 3 Oral Reprimand 3 Counseled and Retrained Other Disciplinary Action Disciplinary Action Pending
Total Sustained Complaints 6
2 24
0 4
3 13
0 7
0 2
1 29
0 5
Sustained Internal Complaints
15 4
1
20
In 1983, the Internal Affairs Division opened 216 case files containing either Internal or Citizen complaints. Of those cases, one was classified as an 'internal information file' and 21 are still in the investigative stage. The remaining 194 cases and their dispositions are listed in Table 15.
The Minneapolis Police Department has no tolerance for unprofessional policing, be it shoddy performance of duty or abuse of police powers. Officers are trained, and are expected to be fair, civil and competent. Yet, it also must be understood that it is the very nature of policing that officers are often called to exert control over citizens' conduct and that compliance with lawful police directives is not always easy to obtain.
Not Exceptionally Sustained Sustained Cleared
33 1 35
11 2 5
12 1 5
5 0 5
0 1 0
9 11
4 20 4
41
COMMUNITY CRIME PREVENTION
As indicated in the previous sections of this annual report, considerations of custom, law and practicality limit the police capability to prevent crime. Much of crime is perpetrated indoors; that is, in places where police have no authority to enter unless requested by citizens to do so. Much of crime simply occurs in places and during times where and when police are absent due to their limited manpower resources. Consequently, it is clear that a neighborhood's freedom from criminality rests considerably upon the efforts of citizens themselves to be watchful of suspicious individuals or circumstances, to be prudent in safeguarding their persons or their property, and to be ready and willing to cooperate with their police.
There is strong evidence to indicate that such citizen activity, particularly when organized and coordinated, is quite effective in preventing a substantial amount of crime. In recognition of this, the Department undertakes varied programs designed to encourage citizen participation in crime prevention. Table 17 summarizes examples of such programs conducted during 1983.
42
I I Table 17 SELECTED DATA ON POLICE PROGRAMS TO ENCOURAGE COMMUNITY CRIME PREVENTION ACTIVITY IN 1983
A. Community Crime Prevention 1983 was another very productive year for the Community Crime Prevention program (CCP) and its relationship with the Minneapolis Police Department. CCP is a city agency assigned to the City Coordinators Office and has crime prevention responsibility to organize a Neighborhood Crime Watch Program throughout the city by organizing block clubs. These block clubs become the corner stones for the Neighborhood Crime Watch Program in addition to serving as the method by which crime prevention education is conducted and information dispersed. In 1983, CCP generated nearly 500 block events and close to 900 new Operation Identification enrolls. Crime prevention literature was distributed to more than 6,000 Minneapolis residents as a result of CCP's efforts in 1983. Planning was begun for the second Crime Prevention Fair to be held in February 1984 and co-sponsored by CCP and the Minneapolis Police Department, with funding being provided by the McKnight Foundation. The close working relationship between CCP and the Minneapolis Police Department is a nationally rec~gnized model of effective police/community cooperation in the fight against crime.
B. Cop of the Block Program 1983 saw the beginning of a nationally innovative CCP "special project" funded by local corporations and foundations. The project is a three year scientifically designed study to test the effectiveness of community based crime prevention strategies. The Minneapolis Police Department is participating in this special project by assigning 22 officers to a novel and critical part of this Cop of the Block Program. Those officers are assigned to specific blocks where block clubs have been organized and they act as a resource to those groups. Their role is considered a vital ingredient for keeping the block clubs active and effective.
C. Senior Crime Prevention Program 1983 was the second year of a two-year grant which has enabled the Department to provide crime prevention information to the senior citizens of our city. The Director of Senior Services, Mr. Robert F. Therien, is himself a senior citizen who is responsibile for production, coordination, presentation and evaluation of all senior programs and activties. The program is estimated to have reached from 20,000 to 30,000 seniors through such services as: 1) instructional/discussion sessions presented to seniors at high-rises, churches and community centers; 2) the production and presentation of a weekly cable television program for seniors on home security; and, 3) the publication of a monthly crime prevention article in the Minneapolis Senior Newsletter.
D. Junior Police Program Over 3,600 third grade students received two hours of instruction in home security, emergency phone use, reporting crimes to the police, vandalism prevention, dangerous strangers and other crime prevention related topics.
-------------------------------------~-- -
43
I Table 18
SELECTED DATA INDICATIVE OF THE DEGREE OF CITIZEN SATISFACTION WITH POLICE SERVICES
In 1983, the Minnesota Center for Social Research conducted a survey of Twin City citizens' opinion about their perceptions of the quality of life in the area. A sample of 1101 persons were interviewed. The data below presents a summary of Minneapolis residf'nts' responses bearing upon their evaluation of the Minneapolis Police Department.
A. Question for individuals who had previous direct contact (other than social) with a Minneapolis police officer: Was (were) the police officer(s) you had contact with generally:
B. Question for individuals who had been victims of a crime in the preceding twelve months: Are you satisfied with the initial (Minneapolis) pOlice response? Satisfied 68% 32%
C. Question to Minneapolis residents: Do you agree or disagree that your police department investigates citizen complaints about its police officers thoroughly and impartially?
D. Question to Minneapolis residents: If a police officer in your city were found guilty of misconduct, would the department discipline the police officer ....
Percent Responding
Very leniently ................... 3% Leniently ..................... 39% Severely ...................... 49% Very severely ................... 9%