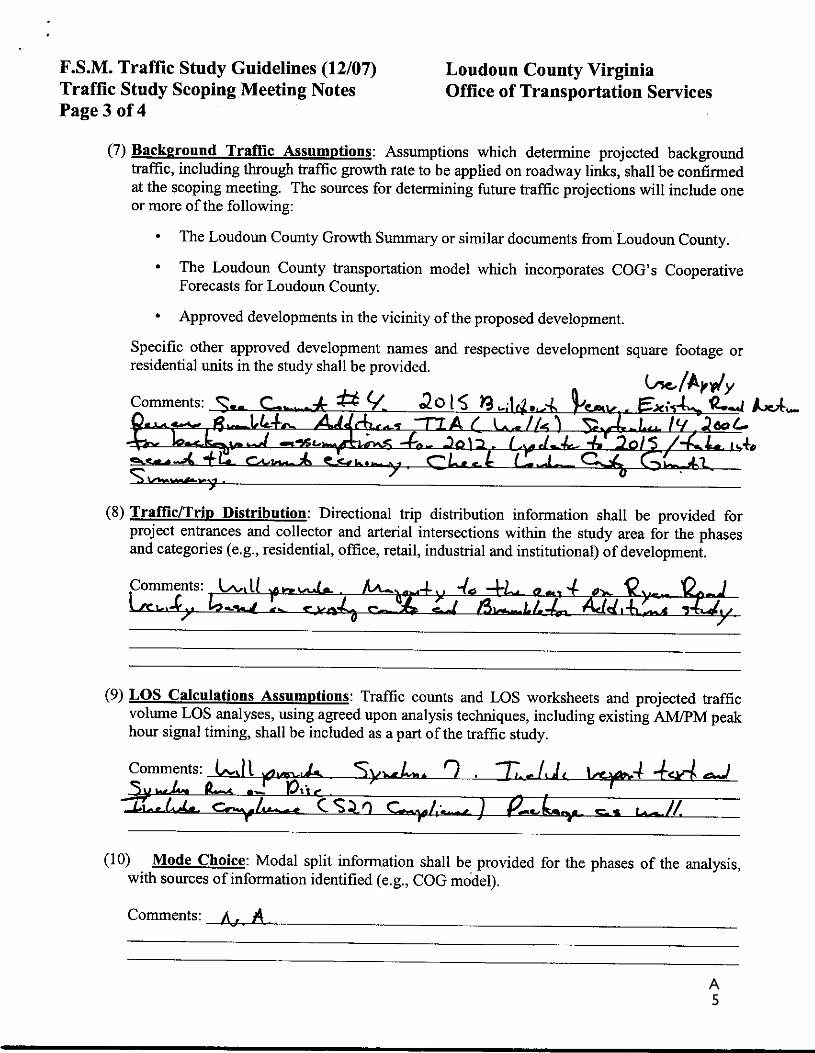
1420 Spring Hill Road, Suite 600 • McLean, Virginia 22102 • 703 / 917-6620 • Fax: 703 / 917-0739 MEMORANDUM To: George R. Phillips, AICP Loudoun County Office of Transportation Services CC: Roy Barnett Jeff Nein Jeff Gilliland From: Michael J. Workosky, PTP, TOPS James W. Watson, PTP Wells + Associates, Inc. Date: January 8, 2010 Subject: Ryan Road Property Special Exception (SPEX) Traffic Impact Analysis; Loudoun County, Virginia Introduction This memorandum presents a traffic impact analysis for the Ryan Road Property. The property is located on the north side of Ryan Road (VA Route 772) and east of Belmont Ridge Road (VA Route 659) in the Brambleton area of Loudoun County, Virginia, as shown on Figure 1. The property is defined on the Loudoun County Tax Map with Pin Number 158-27-9331. The property consists of 7.7389 acres and is zoned R-1 that would allow for up to seven (7) single- family homes. A two-acre portion of the property is proposed to obtain a Special Exception to allow for a child care center of up to 208 students. The remaining five-acre portion would be developed under the current R-1 zoning at a later date along with the adjacent approximately 12-acre parcel. This traffic study serves as an update to the previously submitted Ryan Road Property rezoning traffic impact study, dated April 1, 2009. The April 2009 report proposed a larger property (19.68-acres) to be rezoned to increase the residential density from 21 units to 49 units. Comments were provided by both the Loudoun County Office of Transportation Services (OTS) and Virginia Department of Transportation (VDOT). Responses to these comments are contained in Appendix A and incorporated into this report. Confirmation of the scope for the updated traffic report and original traffic study scope are also included in Appendix A. Consistent with the previously submitted traffic study, a buildout year of 2015 was assumed for purposes of this analysis.
Transcript
1420 Spring Hill Road, Suite 600 • McLean, Virginia 22102 • 703 / 917-6620 • Fax: 703 / 917-0739
MEMORANDUM To: George R. Phillips, AICP
Loudoun County Office of Transportation Services CC: Roy Barnett Jeff Nein Jeff Gilliland From: Michael J. Workosky, PTP, TOPS James W. Watson, PTP Wells + Associates, Inc. Date: January 8, 2010 Subject: Ryan Road Property Special Exception (SPEX)
Traffic Impact Analysis; Loudoun County, Virginia Introduction This memorandum presents a traffic impact analysis for the Ryan Road Property. The property is located on the north side of Ryan Road (VA Route 772) and east of Belmont Ridge Road (VA Route 659) in the Brambleton area of Loudoun County, Virginia, as shown on Figure 1. The property is defined on the Loudoun County Tax Map with Pin Number 158-27-9331. The property consists of 7.7389 acres and is zoned R-1 that would allow for up to seven (7) single-family homes. A two-acre portion of the property is proposed to obtain a Special Exception to allow for a child care center of up to 208 students. The remaining five-acre portion would be developed under the current R-1 zoning at a later date along with the adjacent approximately 12-acre parcel. This traffic study serves as an update to the previously submitted Ryan Road Property rezoning traffic impact study, dated April 1, 2009. The April 2009 report proposed a larger property (19.68-acres) to be rezoned to increase the residential density from 21 units to 49 units. Comments were provided by both the Loudoun County Office of Transportation Services (OTS) and Virginia Department of Transportation (VDOT). Responses to these comments are contained in Appendix A and incorporated into this report. Confirmation of the scope for the updated traffic report and original traffic study scope are also included in Appendix A. Consistent with the previously submitted traffic study, a buildout year of 2015 was assumed for purposes of this analysis.
2
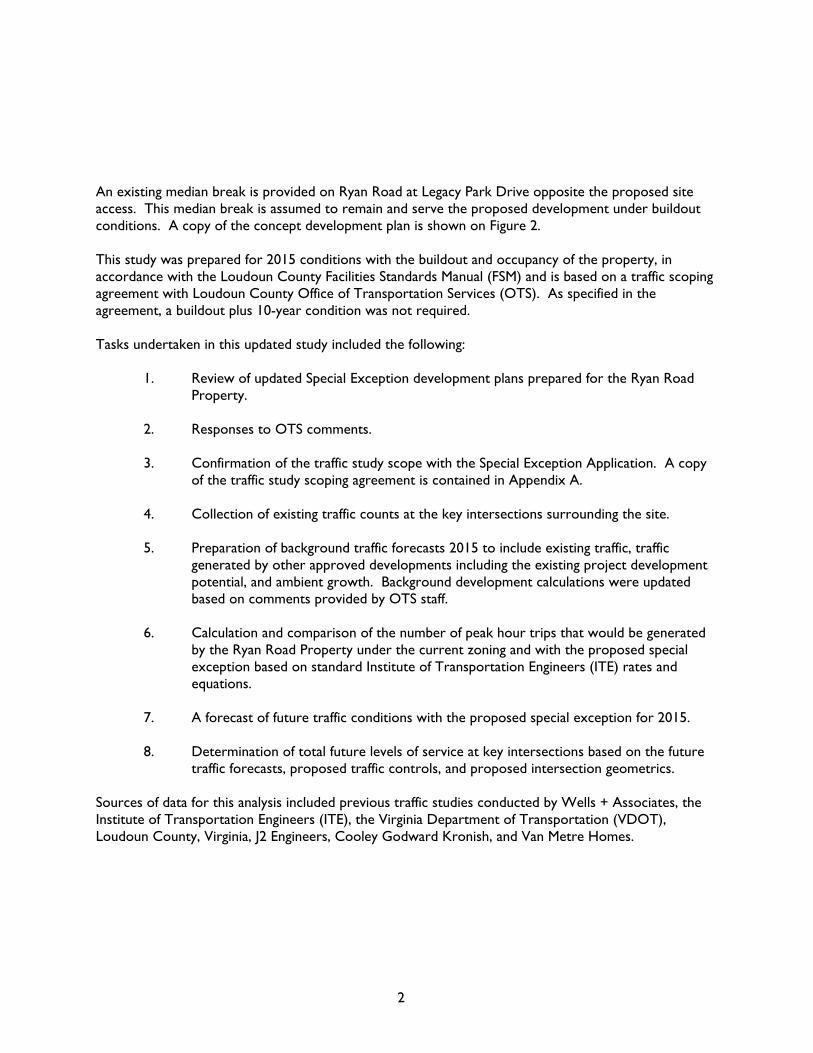
An existing median break is provided on Ryan Road at Legacy Park Drive opposite the proposed site access. This median break is assumed to remain and serve the proposed development under buildout conditions. A copy of the concept development plan is shown on Figure 2. This study was prepared for 2015 conditions with the buildout and occupancy of the property, in accordance with the Loudoun County Facilities Standards Manual (FSM) and is based on a traffic scoping agreement with Loudoun County Office of Transportation Services (OTS). As specified in the agreement, a buildout plus 10-year condition was not required. Tasks undertaken in this updated study included the following:
1. Review of updated Special Exception development plans prepared for the Ryan Road Property.
2. Responses to OTS comments. 3. Confirmation of the traffic study scope with the Special Exception Application. A copy
of the traffic study scoping agreement is contained in Appendix A. 4. Collection of existing traffic counts at the key intersections surrounding the site. 5. Preparation of background traffic forecasts 2015 to include existing traffic, traffic
generated by other approved developments including the existing project development potential, and ambient growth. Background development calculations were updated based on comments provided by OTS staff.
6. Calculation and comparison of the number of peak hour trips that would be generated
by the Ryan Road Property under the current zoning and with the proposed special exception based on standard Institute of Transportation Engineers (ITE) rates and equations.
7. A forecast of future traffic conditions with the proposed special exception for 2015. 8. Determination of total future levels of service at key intersections based on the future
traffic forecasts, proposed traffic controls, and proposed intersection geometrics. Sources of data for this analysis included previous traffic studies conducted by Wells + Associates, the Institute of Transportation Engineers (ITE), the Virginia Department of Transportation (VDOT), Loudoun County, Virginia, J2 Engineers, Cooley Godward Kronish, and Van Metre Homes.
SITE
Wells + Associat es, Inc.
3
Wel
ls +
Ass
oci
ates
, Inc
.
4
5
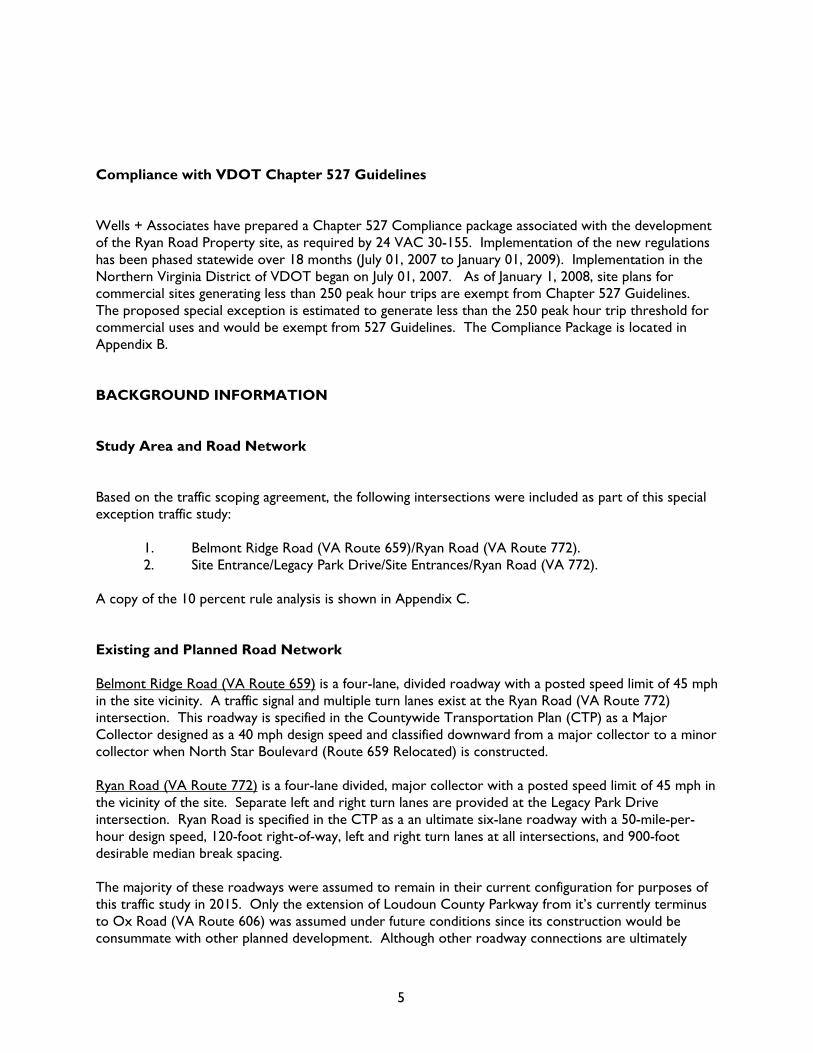
Compliance with VDOT Chapter 527 Guidelines Wells + Associates have prepared a Chapter 527 Compliance package associated with the development of the Ryan Road Property site, as required by 24 VAC 30-155. Implementation of the new regulations has been phased statewide over 18 months (July 01, 2007 to January 01, 2009). Implementation in the Northern Virginia District of VDOT began on July 01, 2007. As of January 1, 2008, site plans for commercial sites generating less than 250 peak hour trips are exempt from Chapter 527 Guidelines. The proposed special exception is estimated to generate less than the 250 peak hour trip threshold for commercial uses and would be exempt from 527 Guidelines. The Compliance Package is located in Appendix B. BACKGROUND INFORMATION Study Area and Road Network Based on the traffic scoping agreement, the following intersections were included as part of this special exception traffic study:
1. Belmont Ridge Road (VA Route 659)/Ryan Road (VA Route 772). 2. Site Entrance/Legacy Park Drive/Site Entrances/Ryan Road (VA 772).
A copy of the 10 percent rule analysis is shown in Appendix C. Existing and Planned Road Network Belmont Ridge Road (VA Route 659) is a four-lane, divided roadway with a posted speed limit of 45 mph in the site vicinity. A traffic signal and multiple turn lanes exist at the Ryan Road (VA Route 772) intersection. This roadway is specified in the Countywide Transportation Plan (CTP) as a Major Collector designed as a 40 mph design speed and classified downward from a major collector to a minor collector when North Star Boulevard (Route 659 Relocated) is constructed. Ryan Road (VA Route 772) is a four-lane divided, major collector with a posted speed limit of 45 mph in the vicinity of the site. Separate left and right turn lanes are provided at the Legacy Park Drive intersection. Ryan Road is specified in the CTP as a an ultimate six-lane roadway with a 50-mile-per-hour design speed, 120-foot right-of-way, left and right turn lanes at all intersections, and 900-foot desirable median break spacing. The majority of these roadways were assumed to remain in their current configuration for purposes of this traffic study in 2015. Only the extension of Loudoun County Parkway from it’s currently terminus to Ox Road (VA Route 606) was assumed under future conditions since its construction would be consummate with other planned development. Although other roadway connections are ultimately
6
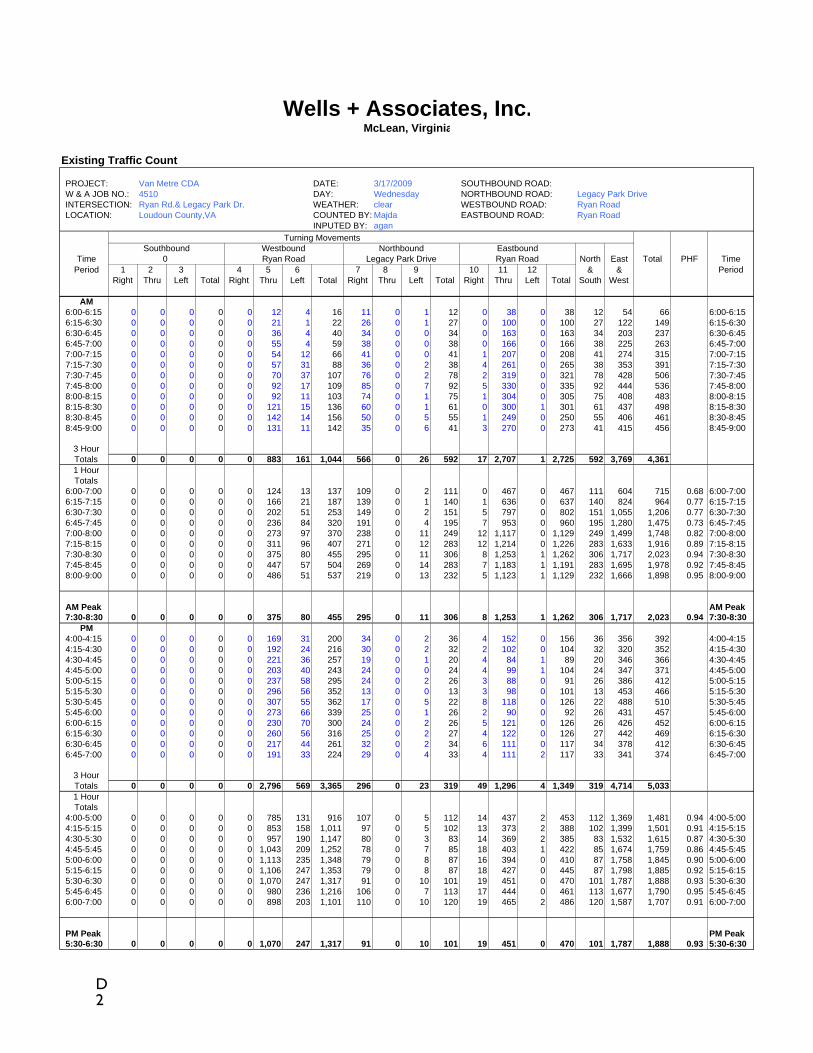
planned, that include North Star Boulevard (Route 659 Relocated) and Route 621 Relocated, these facilities were not assumed in the future analyses to provide a conservative condition since there are no immediate plans for their construction. Existing and planned intersection lane use and traffic control at key intersections in the site vicinity are shown on Figure 3. Existing Traffic Counts Wells + Associates conducted peak hour traffic counts at the previously mentioned intersections on Wednesday, March 17, 2009. The results are shown on Figure 3 and contained in Appendix D. Note that the through movements on Ryan Road at Legacy Park Drive were reasonably balance with the counts collected at the Ryan Road/Belmont Ridge Road intersection. Hazardous Locations Based on a field evaluation, Ryan Road has a crest vertical curve in the vicinity of the proposed site entrance opposite Legacy Park Drive. It appears that adequate sight distance exists and the recently constructed roadway does not present any apparent safety hazards. Site Access A full-movement median break currently exists on Ryan Road opposite the proposed site driveway at Legacy Park Drive. It is located approximately 850 feet east of the signalized Belmont Ridge Road/Ryan Road intersection. The existing median on Ryan Road is approximately 50-feet wide and provides separate eastbound and westbound left turn lanes with approximately 350 feet of storage. A separate eastbound right turn lane into Legacy Park Drive is also constructed. The proposed site driveway would be served by the existing eastbound left turn lane with a new westbound right turn lane constructed in accordance with the CTP. An existing driveway located approximately 400 feet east of the proposed site driveway will be closed. As noted by OTS staff, the available sight distance will be verified by J2 Engineers for adequacy with the presence of the crest vertical curve mentioned previously. The road section for the site driveway with the public street option would ultimately provide 36 feet of pavement that allows for a single inbound lane and two outbound lanes. The anticipated access scheme is shown on Figure 3. A 10-foot wide public access easement is proposed to be provided along the Ryan Road frontage.
SPEXSITE
SPEXSITE
Wells + Associat es, Inc.
7
RYAN ROAD
BEL
MO
NT
RID
GE
RO
AD
LEG
ACY
PA
RK
DR
IVE
RYAN ROAD
Existing Peak Hour Traffic Counts
772
659
RYAN ROAD
BEL
MO
NT
RID
GE
RO
AD
LEG
ACY
PA
RK
DR
IVE
RYAN ROAD
Existing Lane Use and Traffic Control
772
659
9,44
0
15,8
80
ADT
X/XX/X
B/AA/A
A/AA/A
A/A
C/C
B/BC/CC/B
B/B
C/C
C/C
C/CC/CB/C
C/C
C/C
C/C
C/C
8
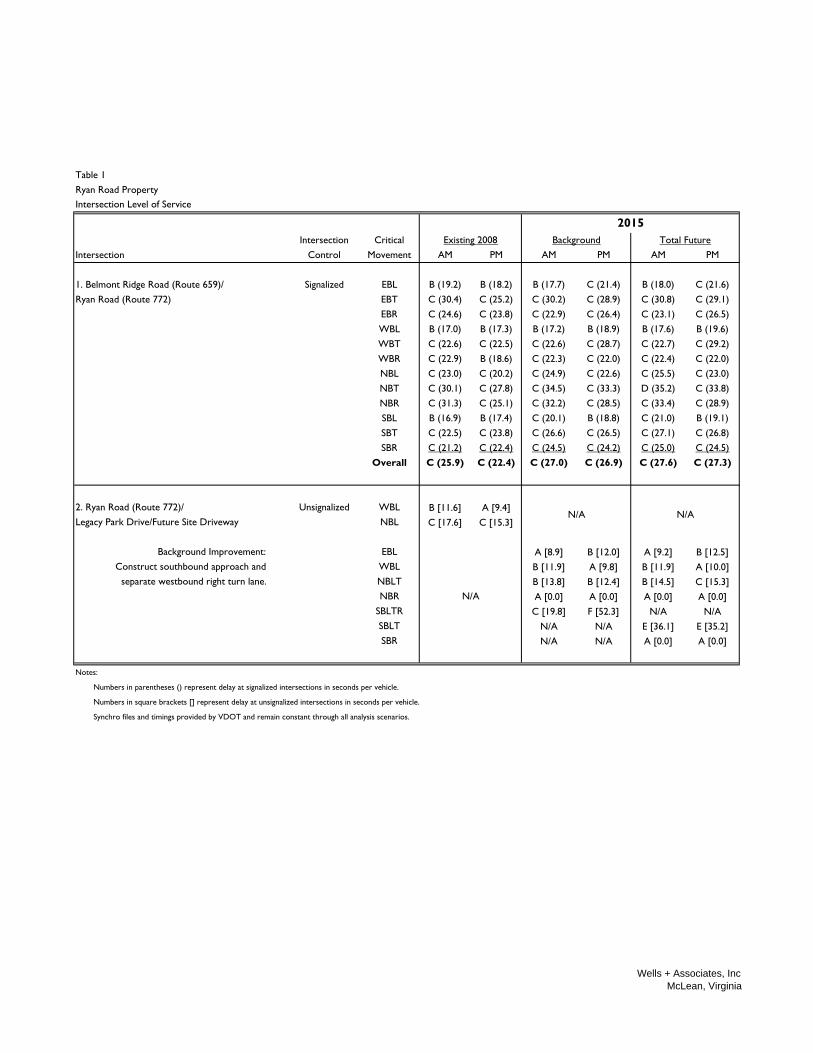
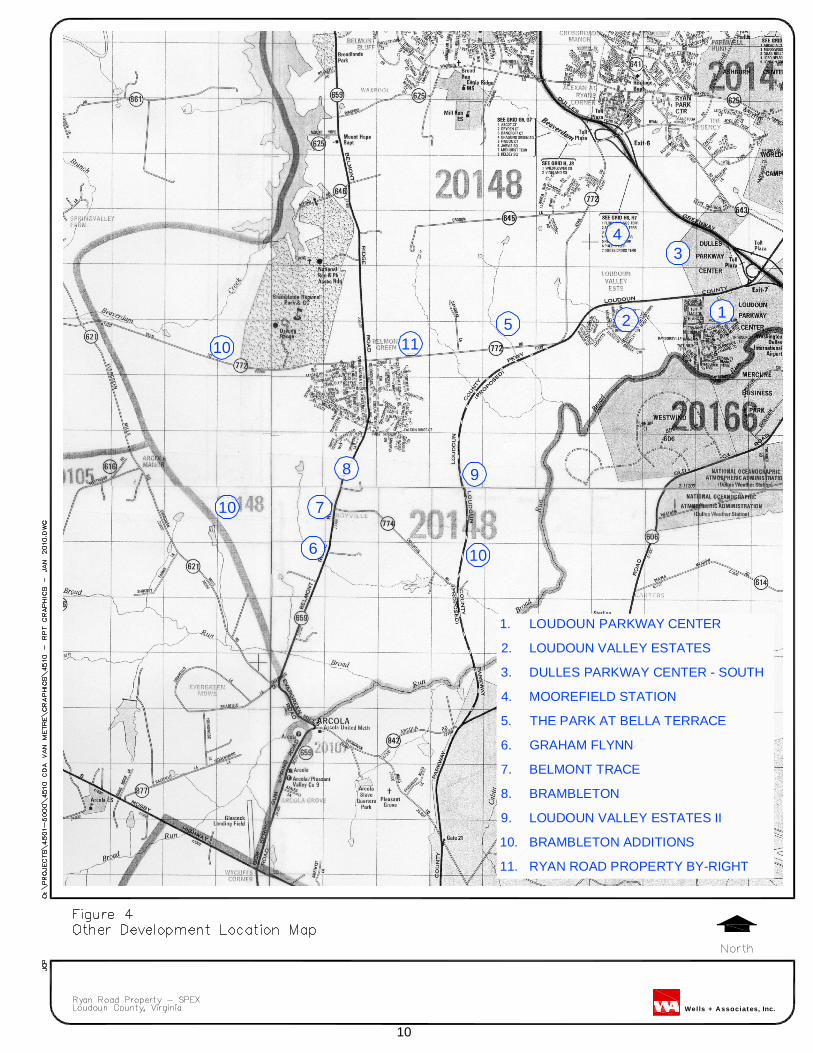
Existing Levels of Service Existing peak hour levels of service were estimated at the existing intersections in the study area based on the existing lane usage and traffic control and existing traffic volumes shown on Figure 3, and the Highway Capacity Manual methodology (Synchro version 7). The results are presented in Appendix E and summarized in Table 1, and indicate that all of the approaches at the Belmont Ridge Road (VA Route 659)/Ryan Road (VA Route 772) intersection currently operate at acceptable levels of service during both the AM and PM peak hours under signal control. In addition, all of the individual turning movements at the Legacy Park Drive/Ryan Road (VA Route 772) intersection operate at acceptable levels of service under stop sign control during both peak periods. Other Approved Developments Overview. This traffic study includes traffic generated by 11 other approved development projects in the region, including the currently approved development program for the site. The following projects were considered in this traffic study:
1. Loudoun Parkway Center. 2. Loudoun Valley Estates. 3. Dulles Parkway Center - South. 4. Moorefield Station. 5. Park at Bella Terra. 6. Graham Flynn. 7. Belmont Trace. 8. Brambleton. 9. Loudoun Valley Estates II. 10. Brambleton Additions. 11. Ryan Road Property (existing zoning).
The level of development within each of the other approved projects listed above was updated based on comments provided by OTS on the April 2009 rezoning traffic study. The location of these other developments is shown on Figure 4.
Table 1Ryan Road PropertyIntersection Level of Service
Intersection Critical Existing 2008 Background Total FutureIntersection Control Movement AM PM AM PM AM PM
1. Belmont Ridge Road (Route 659)/ Signalized EBL B (19.2) B (18.2) B (17.7) C (21.4) B (18.0) C (21.6)Ryan Road (Route 772) EBT C (30.4) C (25.2) C (30.2) C (28.9) C (30.8) C (29.1)
EBR C (24.6) C (23.8) C (22.9) C (26.4) C (23.1) C (26.5)WBL B (17.0) B (17.3) B (17.2) B (18.9) B (17.6) B (19.6)WBT C (22.6) C (22.5) C (22.6) C (28.7) C (22.7) C (29.2)WBR C (22.9) B (18.6) C (22.3) C (22.0) C (22.4) C (22.0)NBL C (23.0) C (20.2) C (24.9) C (22.6) C (25.5) C (23.0)NBT C (30.1) C (27.8) C (34.5) C (33.3) D (35.2) C (33.8)NBR C (31.3) C (25.1) C (32.2) C (28.5) C (33.4) C (28.9)SBL B (16.9) B (17.4) C (20.1) B (18.8) C (21.0) B (19.1)SBT C (22.5) C (23.8) C (26.6) C (26.5) C (27.1) C (26.8)SBR C (21.2) C (22.4) C (24.5) C (24.2) C (25.0) C (24.5)
Overall C (25.9) C (22.4) C (27.0) C (26.9) C (27.6) C (27.3)
2. Ryan Road (Route 772)/ Unsignalized WBL B [11.6] A [9.4]Legacy Park Drive/Future Site Driveway NBL C [17.6] C [15.3]
Background Improvement: EBL A [8.9] B [12.0] A [9.2] B [12.5]Construct southbound approach and WBL B [11.9] A [9.8] B [11.9] A [10.0]
separate westbound right turn lane. NBLT B [13.8] B [12.4] B [14.5] C [15.3]NBR A [0.0] A [0.0] A [0.0] A [0.0]
SBLTR C [19.8] F [52.3] N/A N/ASBLT N/A N/A E [36.1] E [35.2]SBR N/A N/A A [0.0] A [0.0]
Notes:
Numbers in parentheses () represent delay at signalized intersections in seconds per vehicle.
Numbers in square brackets [] represent delay at unsignalized intersections in seconds per vehicle.
Synchro files and timings provided by VDOT and remain constant through all analysis scenarios.
N/A
2015
N/A N/A
Wells + Associates, IncMcLean, Virginia
10
10
6
7
10
8
115
43
12
9
Wells + Associat es, Inc.
10
1. LOUDOUN PARKWAY CENTER
2. LOUDOUN VALLEY ESTATES
3. DULLES PARKWAY CENTER - SOUTH
4. MOOREFIELD STATION
5. THE PARK AT BELLA TERRACE
6. GRAHAM FLYNN
7. BELMONT TRACE
8. BRAMBLETON
9. LOUDOUN VALLEY ESTATES II
10. BRAMBLETON ADDITIONS
11. RYAN ROAD PROPERTY BY-RIGHT
11
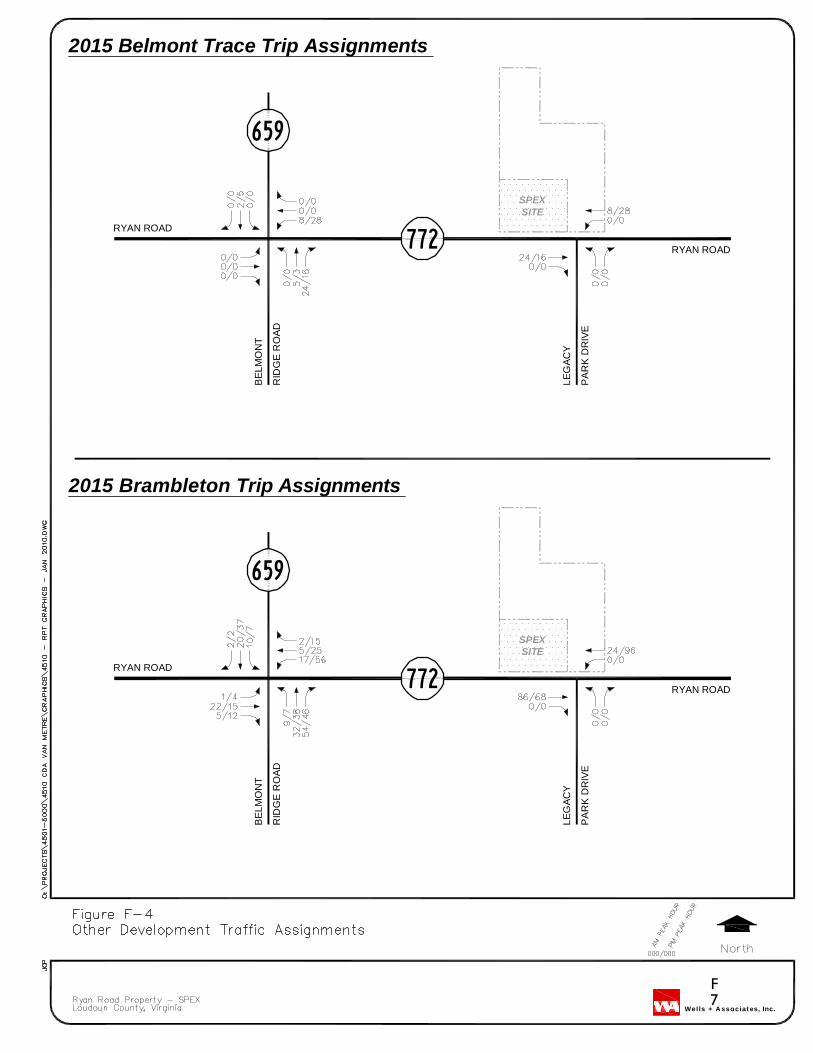
Background Development Trip Assignments
The traffic anticipated to be generated by the other developments including the approved development program for the Ryan Road Property and adjacent parcel (21 SFDU) were assigned to the study network according to distributions from previous studies, existing travel patterns and traffic counts, and local knowledge.
Trip assignments generated by all other approved developments for 2015 are shown on Figure 5. Confirmation of the updated background development assumptions, trip generation estimates, and isolated traffic assignments for background developments are contained in Appendix F. Adjustments to Existing Traffic The existing traffic counts were adjusted to reflect the construction of Loudoun County Parkway from its current terminus to Ox Road (VA Route 606). As part of this improvement, one-half of the westbound left turns and northbound right turns were assumed to utilize Loudoun County Parkway rather than Belmont Ridge Road. These adjustments are shown on Figure 5. Growth Rate Consistent with the aforementioned study, a regional growth rate of 1.0 percent per year, compounded annually, was applied to all turning movements at the Belmont Ridge Road (VA Route 659)/Ryan Road (VA Route 772) intersection and on the through traffic movements on Ryan Road at the Legacy Park Drive intersection. The annually compounded growth is depicted on Figure 5.
Wells + Associat es, Inc.
12
RYAN ROAD
BEL
MO
NT
RID
GE
RO
AD
LEG
AC
Y
PA
RK
DR
IVE
RYAN ROAD
2015 Other Development Traffic Assignments
772
659
RYAN ROAD
BEL
MO
NT
RID
GE
RO
AD
LEG
AC
Y
PA
RK
DR
IVE
RYAN ROAD
2015 Regional Growth (1% Compounded Annually)
772
659
FUTU
RE
SITE
DR
IVE
WA
Y
RYAN ROAD
BEL
MO
NT
RID
GE
RO
AD
LEG
AC
Y
PA
RK
DR
IVE
RYAN ROAD
2015 Existing Traffic Diversions
772
659
FUTU
RE
SIT
E
DR
IVE
WA
Y
FUTU
RE
SITE
DR
IVE
WA
Y
13
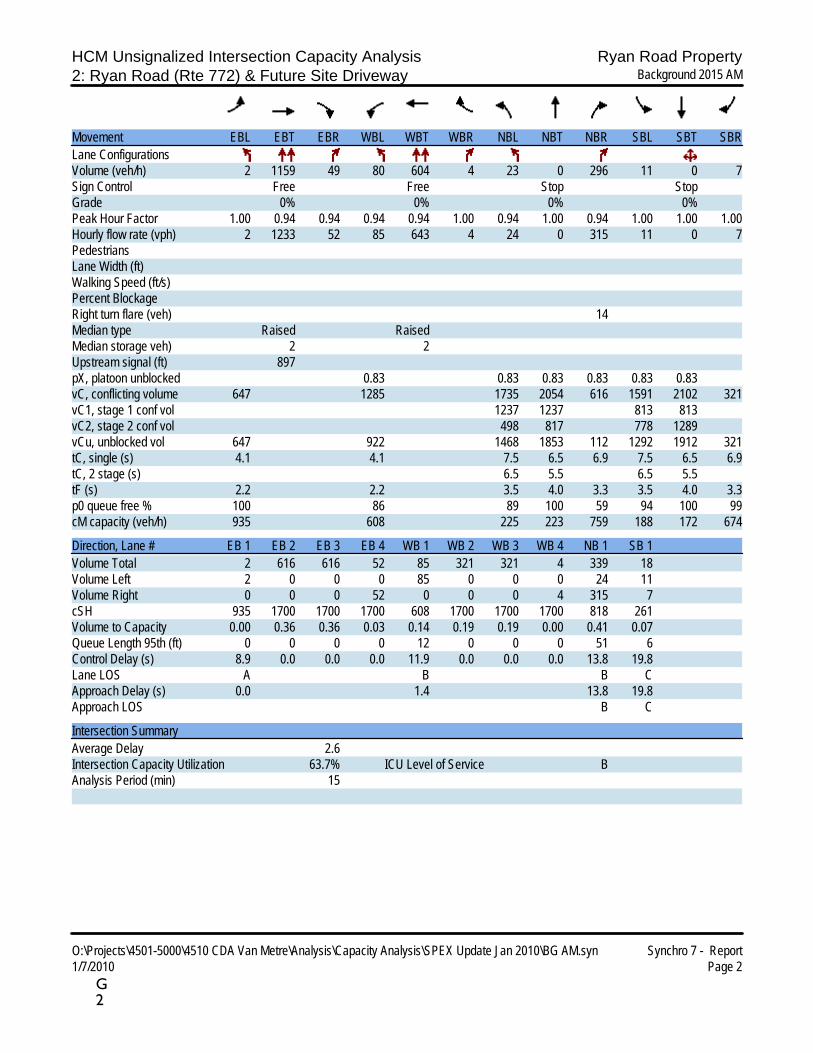
Year 2015 Background Traffic Forecasts Background traffic forecasts for 2015 were developed based on the existing traffic counts, applied growth rate, and traffic generated by other approved developments including the current zoning of the Ryan Road Property. These forecasts assume the site and adjacent property to be developed with 21 single-family homes as allowed under the current R-1 zoning. The results are summarized on Figure 6. Year 2015 Background Levels of Service Peak hour levels of service under background 2015 conditions were estimated at the study intersections based on the existing and future lane usage and traffic control shown on Figure 3, the traffic volumes shown on Figure 6, and the Highway Capacity Manual methodology (Synchro version 7). The results are presented in Appendix G and indicate the following:
1. The Belmont Ridge Road (VA Route 659)/Ryan Road (VA Route 772) intersection would continue to operate at overall acceptable levels of service, at LOS “C” during the AM peak hour and at LOS “C” during the PM peak hour.
2. All of the turning movements at the Site Driveway/Legacy Park Drive/Ryan Road intersection would operate at acceptable levels of service during both the AM and PM peak hours under stop sign control with the exception of the southbound approach. This movement would theoretically operate beyond capacity during the PM peak hour, but would likely utilize gaps in through traffic created by the traffic signal at Belmont Ridge Road (VA Route 659) and the wide median to travel east on Ryan Road, minimizing delays. Note that the analysis assumed site development under the current zoning would provide single lanes for the southbound Site Driveway approach and would require a separate westbound right turn lane on Ryan Road. The single southbound lane contributes to the increased delay for this movement.
3. Since the southbound approach of the Site Driveway on Ryan Road is forecasted to operate
beyond capacity during the PM peak hour, warrants for signalization were reviewed. The results indicate that traffic signal warrants would not be met at this location based on the volume and its proximity to the signalized Belmont Ridge Road/Ryan Road intersection 850 feet to the west.
These levels of service are depicted graphically on Figure 6.
Wells + Associat es, Inc.
14
RYAN ROAD
BEL
MO
NT
RID
GE
RO
AD
LEG
ACY
PA
RK
DR
IVE
RYAN ROAD
Background Future Traffic Forecasts
772
659
RYAN ROAD
BEL
MO
NT
RID
GE
RO
AD
LEG
ACY
PA
RK
DR
IVE
RYAN ROAD
Background Future Levels of Service
772
659FU
TUR
E S
ITE
DR
IVEW
AY
FUTU
RE
SIT
E
DR
IVEW
AY
12,5
20
21,1
80
ADT
X/XX/X
B/AA/A
A/AA/A
A/A
B/B
B/BC/CC/C
C/B
C/C
C/C
C/CC/CB/C
C/C
C/C
C/C
C/C
A/A
C/F
A/B
15
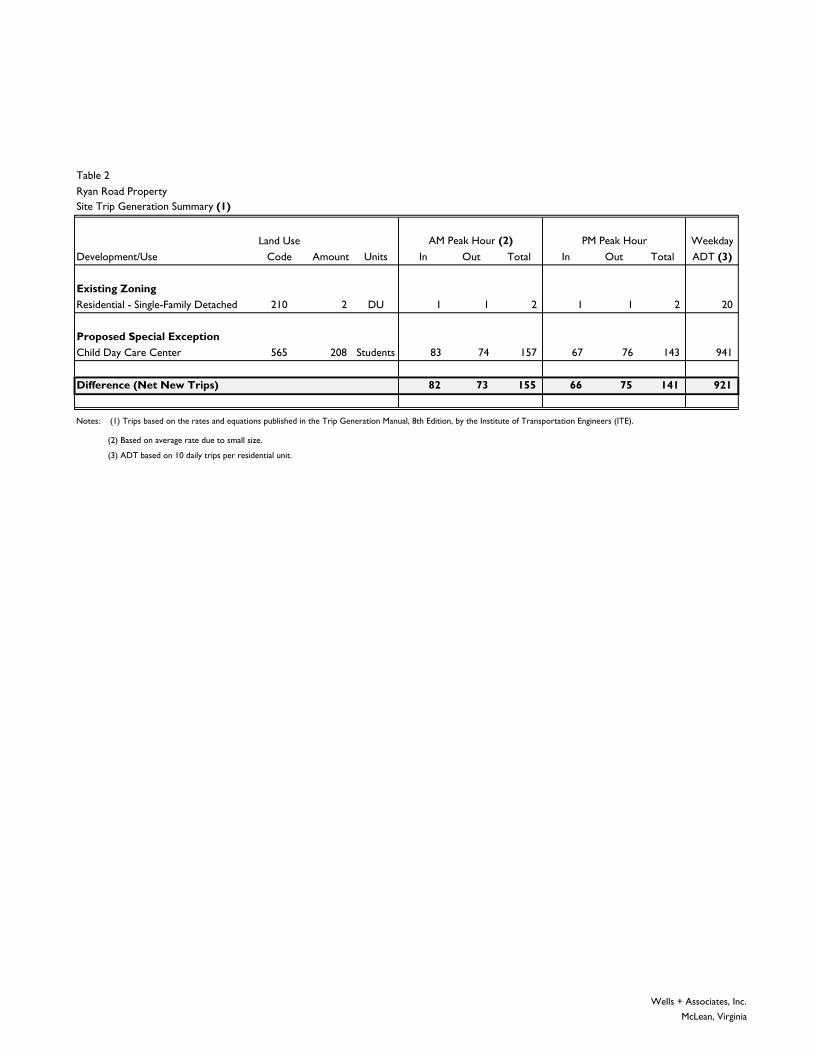
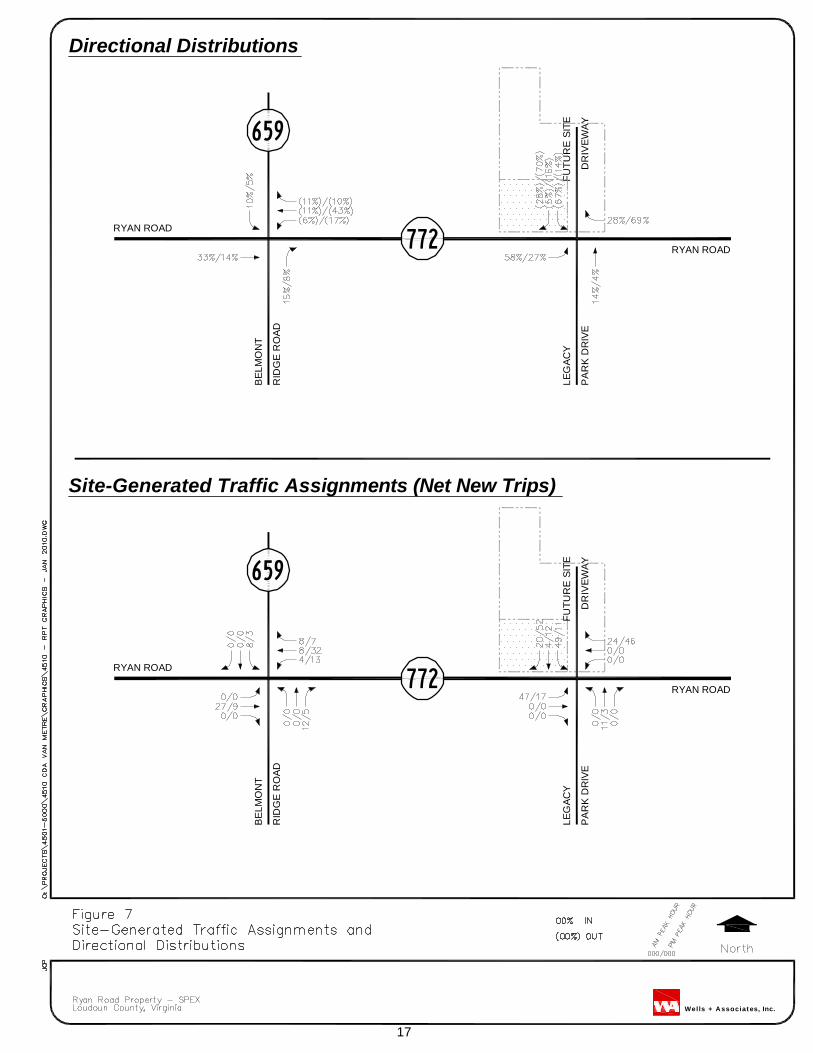
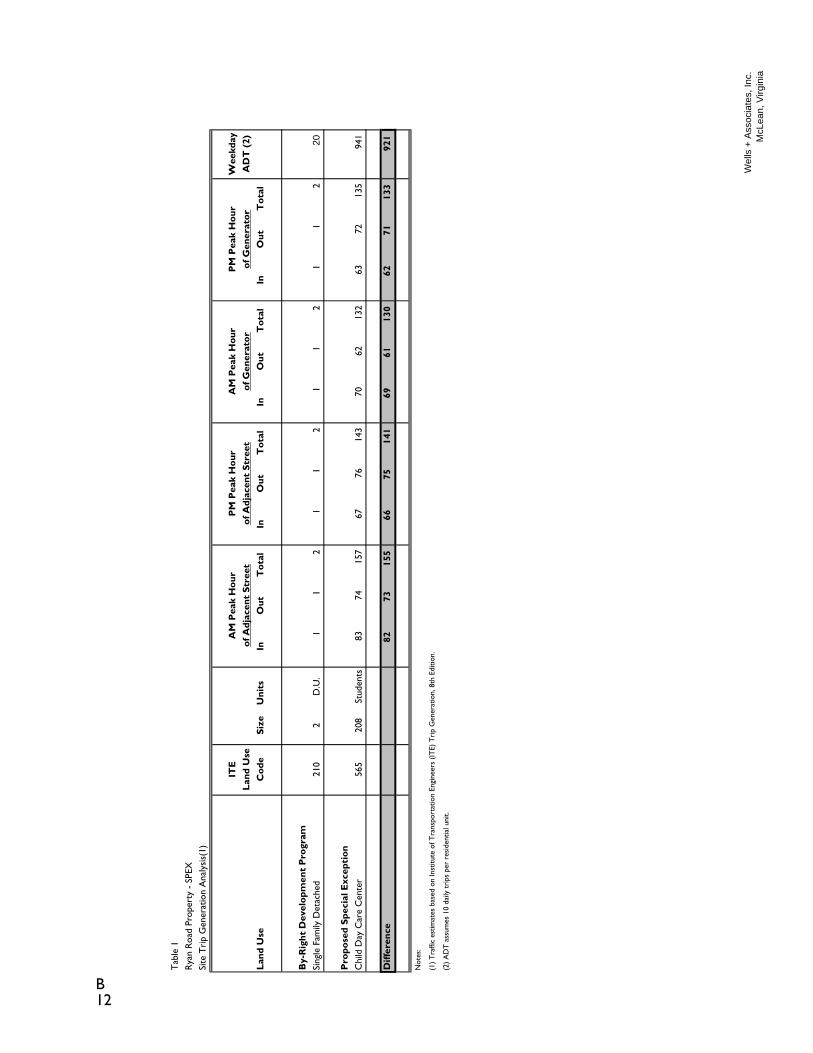
Site Trip Generation The number of trips generated by both the existing zoning and proposed development programs for the Ryan Road Property was calculated using the Institute of Transportation Engineers Trip Generation, 8th Edition trip rates and equations, and is summarized on Table 2. The existing zoning (R-1) would allow for the development of two (2) single-family homes, and would generate 2 AM peak hour trips (1 in and 1 out), 2 PM peak hour trips (1 in and 1 out) and 20 average daily (24-hour) trips. The proposed Ryan Road Property Special Exception program (208-student child care center) would generate 157 AM peak hour trips (83 in and 74 out), 143 PM peak hour trips (67 in and 76 out), and 941 average daily (24-hour) trips. Thus, the proposed special exception would generate 155 more AM peak hour trips, 141 more PM peak hour trips, and 921 more daily trips the current zoning. Site Generated Traffic Assignments The net new vehicle trips discussed above were applied to the road network based on forecasted traffic volumes and reflect home to work travel patterns for patrons of the child care center. Separate distributions were prepared for both the AM and PM peak hours for accuracy. The results are shown on Figure 7 with the site generated traffic assignments.
Notes: (1) Trips based on the rates and equations published in the Trip Generation Manual, 8th Edition, by the Institute of Transportation Engineers (ITE).
(2) Based on average rate due to small size.
(3) ADT based on 10 daily trips per residential unit.
AM Peak Hour (2) PM Peak Hour
Wells + Associates, Inc.
McLean, Virginia
Wells + Associat es, Inc.
17
RYAN ROAD
BEL
MO
NT
RID
GE
RO
AD
LEG
ACY
PA
RK
DR
IVE
RYAN ROAD
Site-Generated Traffic Assignments (Net New Trips)
772
659FU
TUR
E S
ITE
DR
IVEW
AY
RYAN ROAD
BEL
MO
NT
RID
GE
RO
AD
LEG
ACY
PA
RK
DR
IVE
RYAN ROAD
Directional Distributions
772
659
FUTU
RE
SIT
E
DR
IVEW
AY
18
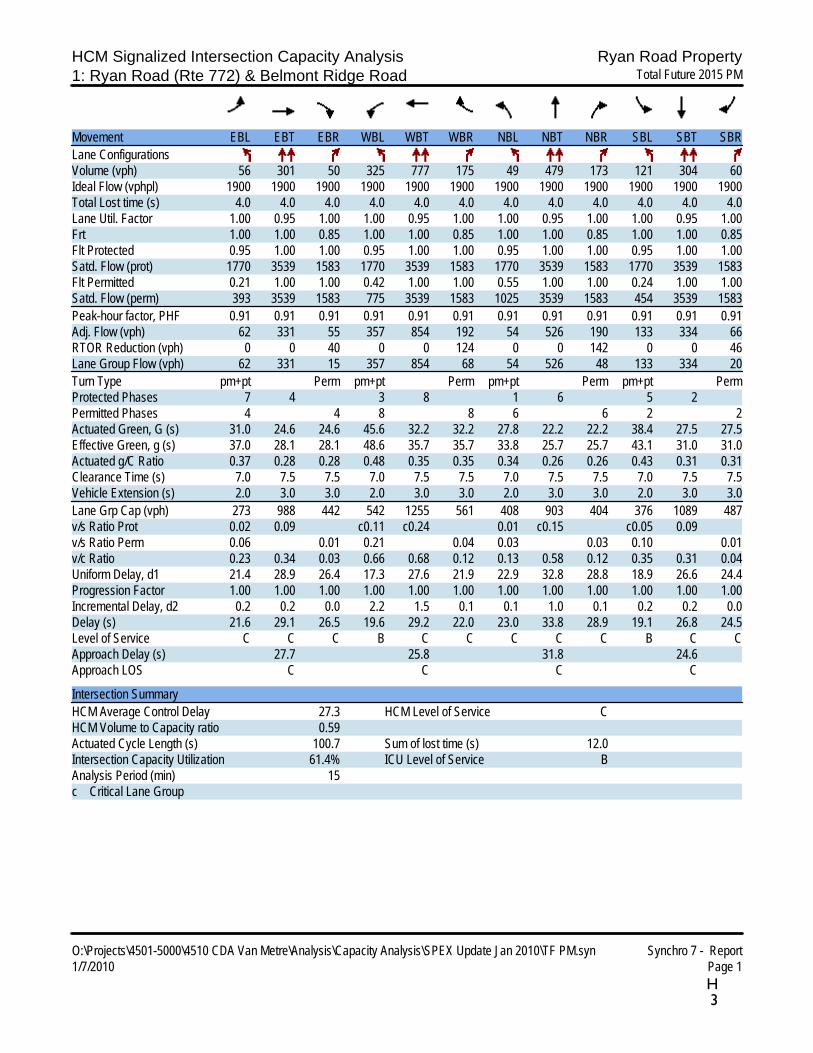
Year 2015 Total Future Traffic Forecasts Total future traffic forecasts for 2015 were prepared based on the existing traffic counts, applied growth rate, adjustments to existing traffic, background development and the net new trips generated by the proposed special exception program. These forecasts include the traffic generated by the 21 residential units that could be built on the adjacent property under the current zoning. (Note that only 19 units could be built due to the displacement caused by the Child Care Center, but no adjustments were made since these would have minimal impact on the overall road network.) The resultant traffic forecasts are shown on Figure 8. Year 2015 Total Future Levels of Service Capacity analyses were prepared for total future conditions with the proposed rezoning of the Ryan Road Property based on the lane use shown on Figure 3, the traffic forecasts shown on Figure 8 and the Synchro (version 7) capacity analysis procedures. The results are summarized in Table 1 and include a comparison of the existing versus proposed zoning. Capacity analysis worksheets are contained in Appendix H and depicted graphically on Figure 8, and indicate the following:
1. The Belmont Ridge Road (VA Route 659)/Ryan Road (VA Route 772) intersection would continue to operate at overall acceptable levels of service, at LOS “C” during the AM peak hour and at LOS “C” during the PM peak hour, with the proposed special exception. The site development would have only a minimal increase in delay at this intersection when compared to the density allowed by the currently approved zoning.
2. All of the turning movements at the Site Driveway/Legacy Park Drive/Ryan Road intersection would operate at acceptable levels of service during both the AM and PM peak hours under stop sign control with the exception of the southbound approach that is forecasted to operate at LOS “E” during both the AM and PM peak periods. The delay for this approach exceeds the threshold for LOS “D” by approximately one (1) second.
3. A review of the traffic signal warrants for the Site Driveway/Legacy Park Drive/Ryan Road
intersection indicates that warrants for signalization would not be met at this location. Further, the southbound approach is planned to provide a separate right turn lane that would better facilitate these movements. The southbound turning movements would utilize gaps in through traffic created by the traffic signal at Belmont Ridge Road and the wide median, reducing delay for these maneuvers.
The results of the total future analyses indicate that the additional traffic generated by the proposed special exception would have only a minor impact to the road network and intersection delays, and not require any additional road improvements beyond a separate westbound right turn lane on Ryan Road (VA Route 772) in accordance with the Countywide Transportation Plan. The existing eastbound left turn lane on Ryan Road (approximately 350 feet of storage) would adequately serve the site.
Wells + Associat es, Inc.
19
RYAN ROAD
BEL
MO
NT
RID
GE
RO
AD
LEG
ACY
PA
RK
DR
IVE
RYAN ROAD
Total Future Traffic Forecasts
772
659
RYAN ROAD
BEL
MO
NT
RID
GE
RO
AD
LEG
ACY
PA
RK
DR
IVE
RYAN ROAD
Total Future Levels of Service
772
659FU
TUR
E S
ITE
DR
IVEW
AY
FUTU
RE
SIT
E
DR
IVEW
AY
12,9
30
21,7
50
ADT
X/XX/X
B/AA/A
A/AA/A
A/A
B/C
B/BC/CC/C
C/B
C/C
C/C
C/CC/CB/C
C/C
D/C
C/C
C/C
A/A
E/E
A/B
20
Conclusions The conclusions of this traffic impact analysis are as follows:
1. All of the approaches and turning movements at the Belmont Ridge Road (VA Route 659)/Ryan Road (VA Route 772) intersection and the Legacy Park Drive/Ryan Road intersection currently operate at acceptable levels of service during both the AM and PM peak hours
2. The existing zoning (R-1) for the Ryan Road Property allows for the development of two (2) single-family homes that would generate 2 AM peak hour trips, 2 PM peak hour trips, and 20 average daily (24-hour) trips. The proposed Ryan Road Property Special Exception program (208-student child care center) would generate 157 AM peak hour trips (83 in and 74 out), 143 PM peak hour trips (67 in and 76 out), and 941 average daily (24-hour) trips. Thus, the proposed special exception would generate 155 more AM peak hour trips, 141 more PM peak hour trips, and 921 more daily trips the current zoning.
3. The Belmont Ridge Road (VA Route 659)/Ryan Road (VA Route 772) signalized intersection currently operates at overall acceptable levels of service during both the AM and PM peak hours, and is expected to continue to do so in 2015 with or without the proposed special exception, without further improvements.
4. All of the movements at the Belmont Ridge Road (VA Route 659) and Legacy Park
Drive/Site Entrance on Ryan Road are anticipated to operate at acceptable levels of service with the special exception, with the exception of the southbound approach of the Site Driveway. This approach would theoretically operate beyond capacity during the AM and/or PM peak hours under both background and future conditions. Warrants for signalization would not be met under either condition at this location. In addition, gaps in through traffic created by the traffic signal at Belmont Ridge Road, the wide median on Ryan Road, and separate lanes for southbound traffic exiting the Site Driveway are expected to facilitate these movements and minimize delay for motorists.
5. The results of the total future analyses indicate that the additional traffic generated by the
proposed special exception would have minimal impact to the road network and intersection delays, and not require any additional road improvements beyond a separate westbound right turn lane on Ryan Road (VA Route 772) in accordance with the Countywide Transportation Plan. The existing eastbound left turn lane on Ryan Road (approximately 350 feet of storage) would adequately serve the site.
Questions regarding this document should be directed to Wells + Associates. O:\PROJECTS\4501-5000\4510 CDA VAN METRE\DOCUMENTS\REPORTS\RYAN ROAD SPEX TIA (SUBMISSION) 1.8.10.DOC
Appendix A
Loudoun County OTS Scoping Agreement
1
Michael J. Workosky
From: phillips, george [[email protected]]Sent: Tuesday, December 08, 2009 6:15 PMTo: Michael J. WorkoskyCc: Michael J. Buelow; Mosurak, Lou; Beacher, AndrewSubject: RE:
Mike‐ 12/8/09 It looks good and am O.K. with it overall. However, for the background traffic, please check the 2008 Loudoun County Growth Summary and compare it to what was assumed before. I’m curious how they compare with the background developments assumed with the Brambleton Additions and other background developments. I want to make sure that the background traffic is not overestimated, especially given the current economy. Let’s talk once you check it out. Thanks, George
From: Michael J. Workosky [mailto:[email protected]] Sent: Tuesday, December 08, 2009 2:34 PM To: phillips, george Cc: Michael J. Buelow Subject: George, This email requests an updated traffic scope for the Ryan Road Property. Wells + Associates previously submitted a traffic study for the ZMAP application, dated April 1, 2009 to rezone the 19.68-acre site from R-1, allowing one residential unit per 40,000 S.F., or 21 single-family homes to R-3 Cluster to allow the development of 49 single-family homes. This application was withdrawn. Two units currently exist on the property. A copy of the previously submitted traffic study and the previous scoping agreement is attached for your reference. A pre-application conference was held on November 19, 2009. A new SPEX application will be filed to allow for an approximately 2 acre day care site (200-children) within the overall development. The daycare would be primarily a pick-up/drop-off facility with the majority of its trips occurring during the peak hour of adjacent street traffic. (Note that the day care center would generate fewer than 250 new peak hour trips and would therefore be exempt from 527 requirements.) The balance of the site would remain R-1 and be developed by-right with 19 single-family homes. Thus, the updated traffic study would include both the by-right condition with 2 single-family residential units versus the proposed 200-child day care. The project is still planned to be constructed in a single phase by 2015 as considered in the previously submitted study. The background developments and growth rate used in the previous study will be applied to this updated report. We propose to retain the scope included in the April 1, 2009 traffic study. We would use the previously collected traffic counts (March 1009) for the Belmont Ridge Road (Route 659)/Ryan Road (Route 772) and Ryan Road (Route 772)/Legacy Park Drive intersections. Similar to the previous plan, the proposed site entrance would be full access and be aligned opposite Legacy Park Drive. The site-generated traffic assignments will reflect the travel patterns for day-care patrons traveling to and from work. The study will address the need to provide left and right-turn lanes into the site and review peak hour signal warrants at the Ryan Road/Legacy Park Drive/Site Entrance intersection. Please respond to this email to confirm that this revised scope is adequate. Feel free to call or email me or Mike Buelow with any questions. Thanks. Mike. Michael J. Workosky, PTP, TOPS Principal Associate
A1
2
Wells + Associates, Inc. 1420 Spring Hill Road Suite 600 McLean, Virginia 22102 Ph: 703/917‐6620 Fax: 703/917‐0739 Cell: 703/898‐6712 Email: [email protected]
A2
A3
A4
A5
A6
Appendix B
VDOT Chapter 527 Compliance Package
1420 Spring Hill Road, Suite 600 • McLean, Virginia 22102 • 703 / 917-6620 • Fax: 703 / 917-0739
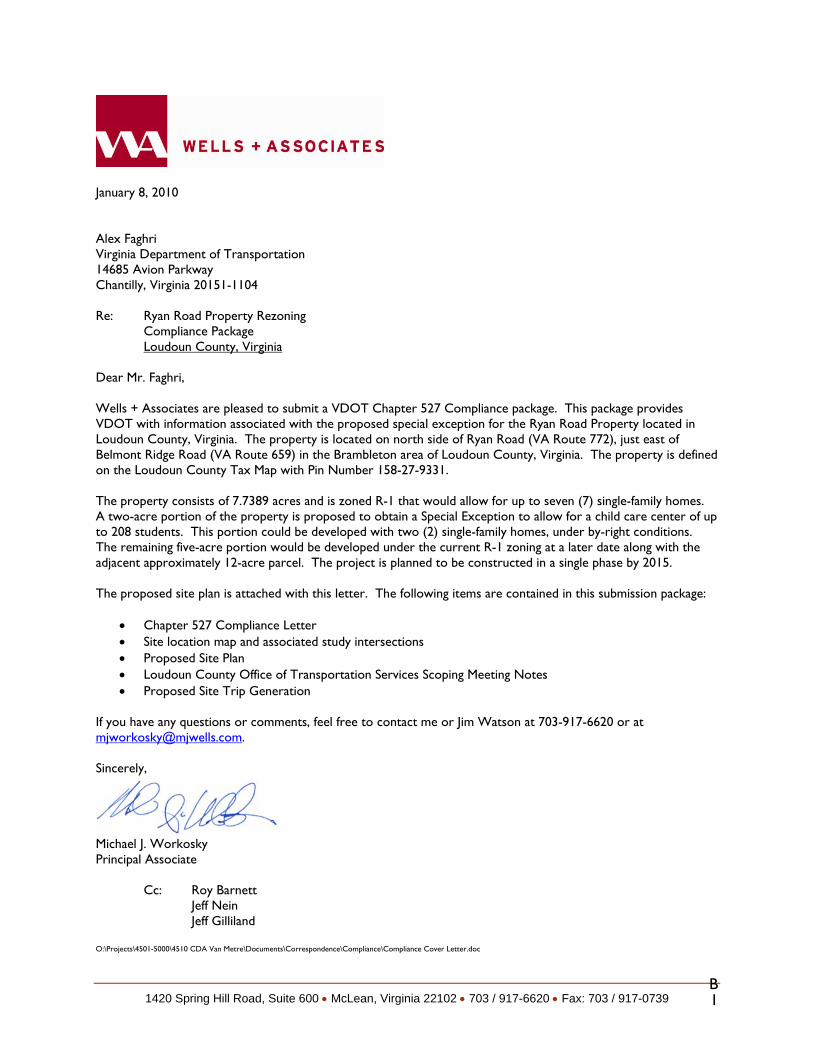
January 8, 2010 Alex Faghri Virginia Department of Transportation 14685 Avion Parkway Chantilly, Virginia 20151-1104 Re: Ryan Road Property Rezoning Compliance Package Loudoun County, Virginia Dear Mr. Faghri, Wells + Associates are pleased to submit a VDOT Chapter 527 Compliance package. This package provides VDOT with information associated with the proposed special exception for the Ryan Road Property located in Loudoun County, Virginia. The property is located on north side of Ryan Road (VA Route 772), just east of Belmont Ridge Road (VA Route 659) in the Brambleton area of Loudoun County, Virginia. The property is defined on the Loudoun County Tax Map with Pin Number 158-27-9331. The property consists of 7.7389 acres and is zoned R-1 that would allow for up to seven (7) single-family homes. A two-acre portion of the property is proposed to obtain a Special Exception to allow for a child care center of up to 208 students. This portion could be developed with two (2) single-family homes, under by-right conditions. The remaining five-acre portion would be developed under the current R-1 zoning at a later date along with the adjacent approximately 12-acre parcel. The project is planned to be constructed in a single phase by 2015. The proposed site plan is attached with this letter. The following items are contained in this submission package:
• Chapter 527 Compliance Letter • Site location map and associated study intersections • Proposed Site Plan • Loudoun County Office of Transportation Services Scoping Meeting Notes • Proposed Site Trip Generation
If you have any questions or comments, feel free to contact me or Jim Watson at 703-917-6620 or at [email protected]. Sincerely,
Michael J. Workosky Principal Associate
Cc: Roy Barnett Jeff Nein Jeff Gilliland
O:\Projects\4501-5000\4510 CDA Van Metre\Documents\Correspondence\Compliance\Compliance Cover Letter.doc
B1
1420 Spring Hill Road, Suite 600 • McLean, Virginia 22102 • 703 / 917-6620 • Fax: 703 / 917-0739
January 8, 2010 Alex Faghri Virginia Department of Transportation 14685 Avion Parkway Chantilly, Virginia 20151-1104 Re: Ryan Road Property Rezoning Compliance Letter VDOT Chapter 527 Regulations – Determination of Compliance Dear Mr. Faghri, As requested, Wells + Associates have completed a trip generation assessment associated with the proposed special exception for the Ryan Road Property, as required by 24 VAC 30-155. Implementation of these new regulations has been phased statewide over 18 months (July 01, 2007 to January 01, 2009). Implementation in the Northern Virginia District of VDOT began on July 01, 2007. As of January 1, 2008, site plans for commercial sites generating less than 250 peak hour trips are exempt. For purposes of determining compliance with the new regulations, trip generation calculations must meet the following trip criteria1:
• Shall be based upon the rates or equations published in the Institute of Transportation Engineers Trip Generation (described in the Reference Documents chapter, page 73).
• Shall not be reduced through internal capture rates, pass by rates, or any other reduction
methods. The opportunity to properly use these reduction rates will be provided in the traffic impact analysis itself and effect the negotiation of any proffered improvements.
• For redevelopment sites only (refer to the Definitions chapter 7), when an existing use is to be
development as a different or denser use, trips currently generated by existing development that will be removed may be deducted from the total trips that are generated by the proposed land use.
1 VDOT, Traffic Impact Analysis Regulations Administrative Guidelines – 24 VAC 30-155, 24 May 2007. The property is located on north side of Ryan Road (VA Route 772), just east of Belmont Ridge Road (VA Route 659) in the Brambleton area of Loudoun County, Virginia. The property is defined on the Loudoun County Tax Map with Pin Number 158-27-9331. The property consists of 7.7389 acres and is zoned R-1 that would allow for up to seven (7) single-family homes. A two-acre portion of the property is proposed to obtain a Special Exception to allow
B2
2
for a child care center of up to 208 students. This portion could be developed with two (2) single-family homes, under by-right conditions. The remaining five-acre portion would be developed under the current R-1 zoning at a later date along with the adjacent approximately 12-acre parcel. As shown in Table 1, the by-right development of the property with two residential units would generate approximately 2 AM peak hour of the adjacent street and peak hour of the generator trips, 2 PM peak hour of the adjacent street and peak hour of the generator trips, and 20 daily (24-hour) trips. The proposed 208 student child care center would generate 157 AM peak hour of the adjacent street trips, 143 PM peak hour of the adjacent street trips, 132 AM peak hour of the generator trips, 135 PM peak hour of the generator trips, and 941 daily (24-hour) trips. The net additional trips generated by the site would be 155 AM peak hour of the adjacent street trips, 141 PM peak hour of the adjacent street trips, 130 AM peak hour of the generator trips, 133 PM peak hour of the generator trips, and 921 daily (24-hour) trips. The trips generated for this development were calculated using ITE Trip Generation Handbook, 8th Edition rates. As shown above, this commercial development is estimated to generate less than the 250 peak hour trip threshold and would be exempt from Chapter 527 Guidelines. Please review this information and review this information and provide a response via email or letter confirming this projects compliance with the Chapter 527 Guidelines. If you have any questions or comments, feel free to contact me or Jim Watson at 703-917-6620 or at [email protected]. Sincerely,
Michael J. Workosky Principal Associate
Cc: Roy Barnett Jeff Nein Jeff Gilliland
O:\Projects\4501-5000\4510 CDA Van Metre\Documents\Correspondence\Compliance\CDA Property - Ryan Road Compliance Letter 1.8.10.doc
B3
SITE
Wells + Associat es, Inc.
3
B4
Wel
ls +
Ass
oci
ates
, Inc
.
4
B5
1
Michael J. Workosky
From: phillips, george [[email protected]]Sent: Tuesday, December 08, 2009 6:15 PMTo: Michael J. WorkoskyCc: Michael J. Buelow; Mosurak, Lou; Beacher, AndrewSubject: RE:
Mike‐ 12/8/09 It looks good and am O.K. with it overall. However, for the background traffic, please check the 2008 Loudoun County Growth Summary and compare it to what was assumed before. I’m curious how they compare with the background developments assumed with the Brambleton Additions and other background developments. I want to make sure that the background traffic is not overestimated, especially given the current economy. Let’s talk once you check it out. Thanks, George
From: Michael J. Workosky [mailto:[email protected]] Sent: Tuesday, December 08, 2009 2:34 PM To: phillips, george Cc: Michael J. Buelow Subject: George, This email requests an updated traffic scope for the Ryan Road Property. Wells + Associates previously submitted a traffic study for the ZMAP application, dated April 1, 2009 to rezone the 19.68-acre site from R-1, allowing one residential unit per 40,000 S.F., or 21 single-family homes to R-3 Cluster to allow the development of 49 single-family homes. This application was withdrawn. Two units currently exist on the property. A copy of the previously submitted traffic study and the previous scoping agreement is attached for your reference. A pre-application conference was held on November 19, 2009. A new SPEX application will be filed to allow for an approximately 2 acre day care site (200-children) within the overall development. The daycare would be primarily a pick-up/drop-off facility with the majority of its trips occurring during the peak hour of adjacent street traffic. (Note that the day care center would generate fewer than 250 new peak hour trips and would therefore be exempt from 527 requirements.) The balance of the site would remain R-1 and be developed by-right with 19 single-family homes. Thus, the updated traffic study would include both the by-right condition with 2 single-family residential units versus the proposed 200-child day care. The project is still planned to be constructed in a single phase by 2015 as considered in the previously submitted study. The background developments and growth rate used in the previous study will be applied to this updated report. We propose to retain the scope included in the April 1, 2009 traffic study. We would use the previously collected traffic counts (March 1009) for the Belmont Ridge Road (Route 659)/Ryan Road (Route 772) and Ryan Road (Route 772)/Legacy Park Drive intersections. Similar to the previous plan, the proposed site entrance would be full access and be aligned opposite Legacy Park Drive. The site-generated traffic assignments will reflect the travel patterns for day-care patrons traveling to and from work. The study will address the need to provide left and right-turn lanes into the site and review peak hour signal warrants at the Ryan Road/Legacy Park Drive/Site Entrance intersection. Please respond to this email to confirm that this revised scope is adequate. Feel free to call or email me or Mike Buelow with any questions. Thanks. Mike. Michael J. Workosky, PTP, TOPS Principal Associate
B6
2
Wells + Associates, Inc. 1420 Spring Hill Road Suite 600 McLean, Virginia 22102 Ph: 703/917‐6620 Fax: 703/917‐0739 Cell: 703/898‐6712 Email: [email protected]
B7
B8
B9
B10
B11
Tab
le 1
Rya
n R
oad
Prop
erty
- S
PEX
Site
Tri
p G
ener
atio
n A
naly
sis(
1)
ITE
AM
Pea
k H
our
PM
Pea
k H
our
AM
Pea
k H
our
PM
Pea
k H
our
Wee
kday
Land
Use
of A
djac
ent
Stre
etof
Adj
acen
t St
reet
of G
ener
ator
of G
ener
ator
AD
T (
2)La
nd U
seC
ode
Size
Uni
tsIn
Out
Tot
alIn
Out
Tot
alIn
Out
Tot
alIn
Out
Tot
al
By-
Rig
ht D
evel
opm
ent
Pro
gram
Sing
le F
amily
Det
ache
d21
02
D.U
.1
1
2
1
1
2
1
1
2
1
1
2
20
Pro
pose
d Sp
ecia
l Exc
epti
onC
hild
Day
Car
e C
ente
r56
520
8St
uden
ts83
74
15
7
67
76
143
70
62
13
2
63
72
135
94
1
Diff
eren
ce82
73
15
5
66
75
14
1
69
61
13
0
62
71
13
3
92
1
Not
es:
(1)
Tra
ffic
estim
ates
bas
ed o
n In
stitu
te o
f Tra
nspo
rtat
ion
Engi
neer
s (IT
E) T
rip
Gen
erat
ion,
8th
Edi
tion.
(2)
AD
T a
ssum
es 1
0 da
ily t
rips
per
res
iden
tial u
nit.
Wel
ls +
Ass
ocia
tes,
Inc.
McL
ean,
Virg
inia
B12
Appendix C
10 Percent Rule
Table C-1Ryan Road Property10% Rule
Intersection AM PMBelmont Ridge Road/Ryan Road Existing 2398 2319
Site 67 69% 3% 3%
Ryan Road/Legacy Park Drive/Site Driveway Existing 1750 1617Site 155 141% 9% 9%
Wells + Associates, Inc.McLean, Virginia
C1
Appendix D
Existing Traffic Counts
Existing Traffic Count
PROJECT: Van Metre CDA DATE: SOUTHBOUND ROAD: Belmont Ridge RoadW & A JOB NO.: 4510 DAY: Wednesday NORTHBOUND ROAD: Belmont Ridge RoadINTERSECTION: Belmont Ridge Rd.& Ryan Rd. WEATHER: clear WESTBOUND ROAD: Ryan RoadLOCATION: Loudoun County,VA COUNTED BY: Jim & Alosman EASTBOUND ROAD: Ryan Road
INPUTED BY: aganTurning Movements
Time North East Total PHF TimePeriod 1 2 3 4 5 6 7 8 9 10 11 12 & & Period
Right Thru Left Total Right Thru Left Total Right Thru Left Total Right Thru Left Total South West
Belmont Ridge Road Ryan Road Belmont Ridge Road Ryan Road
Wells + Associates, Inc.McLean, Virginia
3/17/2009
Southbound Westbound Northbound Eastbound
D1
Existing Traffic Count
PROJECT: Van Metre CDA DATE: SOUTHBOUND ROAD:W & A JOB NO.: 4510 DAY: Wednesday NORTHBOUND ROAD: Legacy Park DriveINTERSECTION: Ryan Rd.& Legacy Park Dr. WEATHER: clear WESTBOUND ROAD: Ryan RoadLOCATION: Loudoun County,VA COUNTED BY: Majda EASTBOUND ROAD: Ryan Road
INPUTED BY: aganTurning Movements
Time North East Total PHF TimePeriod 1 2 3 4 5 6 7 8 9 10 11 12 & & Period
Right Thru Left Total Right Thru Left Total Right Thru Left Total Right Thru Left Total South West
Intersection SummaryHCM Average Control Delay 25.9 HCM Level of Service CHCM Volume to Capacity ratio 0.53Actuated Cycle Length (s) 93.8 Sum of lost time (s) 20.0Intersection Capacity Utilization 60.6% ICU Level of Service BAnalysis Period (min) 15c Critical Lane Group
E1
HCM Unsignalized Intersection Capacity Analysis Ryan Road Property2: Ryan Road (Rte 772) & Legacy Park Drive Existing 2009 AM
Intersection SummaryHCM Average Control Delay 22.4 HCM Level of Service CHCM Volume to Capacity ratio 0.60Actuated Cycle Length (s) 84.0 Sum of lost time (s) 16.0Intersection Capacity Utilization 60.7% ICU Level of Service BAnalysis Period (min) 15c Critical Lane Group
E3
HCM Unsignalized Intersection Capacity Analysis Ryan Road Property2: Ryan Road (Rte 772) & Legacy Park Drive Existing 2009 PM
Direction, Lane # EB 1 EB 2 EB 3 EB 4 WB 1 WB 2 WB 3 NB 1Volume Total 224 224 20 0 266 606 606 109Volume Left 0 0 0 0 266 0 0 11Volume Right 0 0 20 0 0 0 0 98cSH 1700 1700 1700 1700 1089 1700 1700 755Volume to Capacity 0.13 0.13 0.01 0.00 0.24 0.36 0.36 0.14Queue Length 95th (ft) 0 0 0 0 24 0 0 13Control Delay (s) 0.0 0.0 0.0 0.0 9.4 0.0 0.0 15.3Lane LOS A CApproach Delay (s) 0.0 1.7 15.3Approach LOS C
Intersection SummaryAverage Delay 2.0Intersection Capacity Utilization 47.8% ICU Level of Service AAnalysis Period (min) 15
E4
Appendix F
Background Development Trip Generation
And Traffic Assignments
1
Michael J. Workosky
From: phillips, george [[email protected]]Sent: Wednesday, January 06, 2010 9:37 AMTo: Michael J. WorkoskyCc: Mosurak, Lou; Beacher, AndrewSubject: RE: Ryan Road SPEX - Background Development
Mike‐ 1/6/09 Thanks for the information. I compared the original trip gen table with the updated table and agree that the updated table is more realistic (much lower)given the near term economic outlook in terms of development. Your updated table is based on the Loudoun County publications (2008 Growth Summary and the 2009 Fiscal Impact Committee Guidelines) which are the best projections we have at this point. This is acceptable. Go ahead and include this background development in the Ryan Road TIA. Let me know if you have any other questions. Thanks, George
From: Michael J. Workosky [mailto:[email protected]] Sent: Tuesday, January 05, 2010 1:54 PM To: phillips, george Subject: RE: Ryan Road SPEX - Background Development George, Please see both the original and updated table for background development. I have adjusted the background development totals based on both the 2008 Annual Update and the 2009 Fiscal Impact Guidelines. If this is acceptable, please respond to this email so that I may finish up the analysis. Thanks for your attention to this and call me with any questions. Mike.
From: phillips, george [mailto:[email protected]] Sent: Tuesday, December 08, 2009 6:15 PM To: Michael J. Workosky Cc: Michael J. Buelow; Mosurak, Lou; Beacher, Andrew Subject: RE: Mike‐ 12/8/09 It looks good and am O.K. with it overall. However, for the background traffic, please check the 2008 Loudoun County Growth Summary and compare it to what was assumed before. I’m curious how they compare with the background developments assumed with the Brambleton Additions and other background developments. I want to make sure that the background traffic is not overestimated, especially given the current economy. Let’s talk once you check it out. Thanks, George
F1
2
From: Michael J. Workosky [mailto:[email protected]] Sent: Tuesday, December 08, 2009 2:34 PM To: phillips, george Cc: Michael J. Buelow Subject: George, This email requests an updated traffic scope for the Ryan Road Property. Wells + Associates previously submitted a traffic study for the ZMAP application, dated April 1, 2009 to rezone the 19.68-acre site from R-1, allowing one residential unit per 40,000 S.F., or 21 single-family homes to R-3 Cluster to allow the development of 49 single-family homes. This application was withdrawn. Two units currently exist on the property. A copy of the previously submitted traffic study and the previous scoping agreement is attached for your reference. A pre-application conference was held on November 19, 2009. A new SPEX application will be filed to allow for an approximately 2 acre day care site (200-children) within the overall development. The daycare would be primarily a pick-up/drop-off facility with the majority of its trips occurring during the peak hour of adjacent street traffic. (Note that the day care center would generate fewer than 250 new peak hour trips and would therefore be exempt from 527 requirements.) The balance of the site would remain R-1 and be developed by-right with 19 single-family homes. Thus, the updated traffic study would include both the by-right condition with 2 single-family residential units versus the proposed 200-child day care. The project is still planned to be constructed in a single phase by 2015 as considered in the previously submitted study. The background developments and growth rate used in the previous study will be applied to this updated report. We propose to retain the scope included in the April 1, 2009 traffic study. We would use the previously collected traffic counts (March 1009) for the Belmont Ridge Road (Route 659)/Ryan Road (Route 772) and Ryan Road (Route 772)/Legacy Park Drive intersections. Similar to the previous plan, the proposed site entrance would be full access and be aligned opposite Legacy Park Drive. The site-generated traffic assignments will reflect the travel patterns for day-care patrons traveling to and from work. The study will address the need to provide left and right-turn lanes into the site and review peak hour signal warrants at the Ryan Road/Legacy Park Drive/Site Entrance intersection. Please respond to this email to confirm that this revised scope is adequate. Feel free to call or email me or Mike Buelow with any questions. Thanks. Mike. Michael J. Workosky, PTP, TOPS Principal Associate Wells + Associates, Inc. 1420 Spring Hill Road Suite 600 McLean, Virginia 22102 Ph: 703/917‐6620 Fax: 703/917‐0739 Cell: 703/898‐6712 Email: [email protected]
F2
Table F-1
Ryan Road PropertyOther Development Trip Generation - 2015 (1)(2)(3)
Land Use ITE Amount Units Average
Code In Out Total In Out Total Daily
Traffic
1. Loudoun Parkway CenterSingle Family 210 92 DU 19 55 74 62 37 99 963
General Flex-Ind. 710/110 200,000 SF 189 26 215 30 142 172 1,967
Subtotal for Loudoun Parkway Center 208 81 289 92 179 271 2,930
2. Loudoun Valley EstatesSingle Family 210 200 DU 37 112 149 126 74 200 1,967
Intersection SummaryHCM Average Control Delay 27.0 HCM Level of Service CHCM Volume to Capacity ratio 0.57Actuated Cycle Length (s) 99.0 Sum of lost time (s) 16.0Intersection Capacity Utilization 60.9% ICU Level of Service BAnalysis Period (min) 15c Critical Lane Group
G1
HCM Unsignalized Intersection Capacity Analysis Ryan Road Property2: Ryan Road (Rte 772) & Future Site Driveway Background 2015 AM
O:\Projects\4501-5000\4510 CDA Van Metre\Analysis\Capacity Analysis\SPEX Update Jan 2010\BG AM.syn Synchro 7 - Report1/7/2010 Page 2
Intersection SummaryHCM Average Control Delay 26.9 HCM Level of Service CHCM Volume to Capacity ratio 0.58Actuated Cycle Length (s) 99.6 Sum of lost time (s) 12.0Intersection Capacity Utilization 60.4% ICU Level of Service BAnalysis Period (min) 15c Critical Lane Group
G3
HCM Unsignalized Intersection Capacity Analysis Ryan Road Property2: Ryan Road (Rte 772) & Future Site Driveway Background 2015 PM
O:\Projects\4501-5000\4510 CDA Van Metre\Analysis\Capacity Analysis\SPEX Update Jan 2010\BG PM.syn Synchro 7 - Report1/7/2010 Page 2
Intersection SummaryHCM Average Control Delay 27.6 HCM Level of Service CHCM Volume to Capacity ratio 0.60Actuated Cycle Length (s) 101.2 Sum of lost time (s) 16.0Intersection Capacity Utilization 62.3% ICU Level of Service BAnalysis Period (min) 15c Critical Lane Group
H1
HCM Unsignalized Intersection Capacity Analysis Ryan Road Property2: Ryan Road (Rte 772) & Future Site Driveway Total Future 2015 AM
O:\Projects\4501-5000\4510 CDA Van Metre\Analysis\Capacity Analysis\SPEX Update Jan 2010\TF AM.syn Synchro 7 - Report1/7/2010 Page 2
Intersection SummaryHCM Average Control Delay 27.3 HCM Level of Service CHCM Volume to Capacity ratio 0.59Actuated Cycle Length (s) 100.7 Sum of lost time (s) 12.0Intersection Capacity Utilization 61.4% ICU Level of Service BAnalysis Period (min) 15c Critical Lane Group
H3
HCM Unsignalized Intersection Capacity Analysis Ryan Road Property2: Ryan Road (Rte 772) & Future Site Driveway Total Future 2015 PM
O:\Projects\4501-5000\4510 CDA Van Metre\Analysis\Capacity Analysis\SPEX Update Jan 2010\TF PM.syn Synchro 7 - Report1/7/2010 Page 2