100
REPORT ANNUAL

REPORTANNUAL
SOU
THER
N C
RO
SS
AU
STEREO
| AN
NU
AL R
EP
OR
T 20
17


Southern Cross Austereo . Annual Report

ED SHEERAN – HANGING ROCK08.02.2017
Southern Cross Austereo . Annual Report6

#1 Online Radio Group
#1 Radio Group on Social
17 Local TV News Services
7.3 Million National Reach
4.6 Million listeners nationally each week
43 FM Stations
1 Podcast Network
3.5 Million listeners nationally each week
35 AM & FM Stations
AM, FM & Digital Radio Stations84
17
4.8 Million weekly TV viewers
2,500+Staff
$1 BillionCapitalisation
Southern Cross Austereo . Annual Report 7

4-5
8-9
10-11
12-13
14-15
16-17
18-19
20-21
22-23
24-25
26
Statistics Snapshot
SCA’s Winning Ambition
Metro Audiences Engage with SCA
Winning The Hearts of Locals in Regional Australia
Australia’s Largest Audio Network
The Commercial Power of SCA
Our People, Values & Partners
Board of Directors
Chairman’s Statement
CEO’s Report
Financial Report
Southern Cross Austereo . Annual Report8

9

LEADING BRANDSDelivering unrivalled scale & simplicity
Southern Cross Austereo . Annual Report10

SOUTHERN CROSS AUSTEREO’S
WINNING AMBITION S
CA is Australia’s pre-eminent and most diverse entertainment company, with audio and visual brands and content reaching 95%
of Australians.
SCA aspires to be the preferred entertainment company across its metro andregional markets.
Dominant brands supported by leading social media, live events, video, online and mobile assets, delivering truly national and
local content ensures communities want to watch, listen to and engage with SCA in a meaningful way every day.
Its strength as an entertainment company comes from its people; high profile national and local celebrities, and talented and dedicated employees located in more than 60 offices. Superior metrics and insightsinto audiences and their behaviour, together with the ability to attract revenue by connecting clients to engaged audiences, sets SCA apart.
Southern Cross Austereo . Annual Report 11
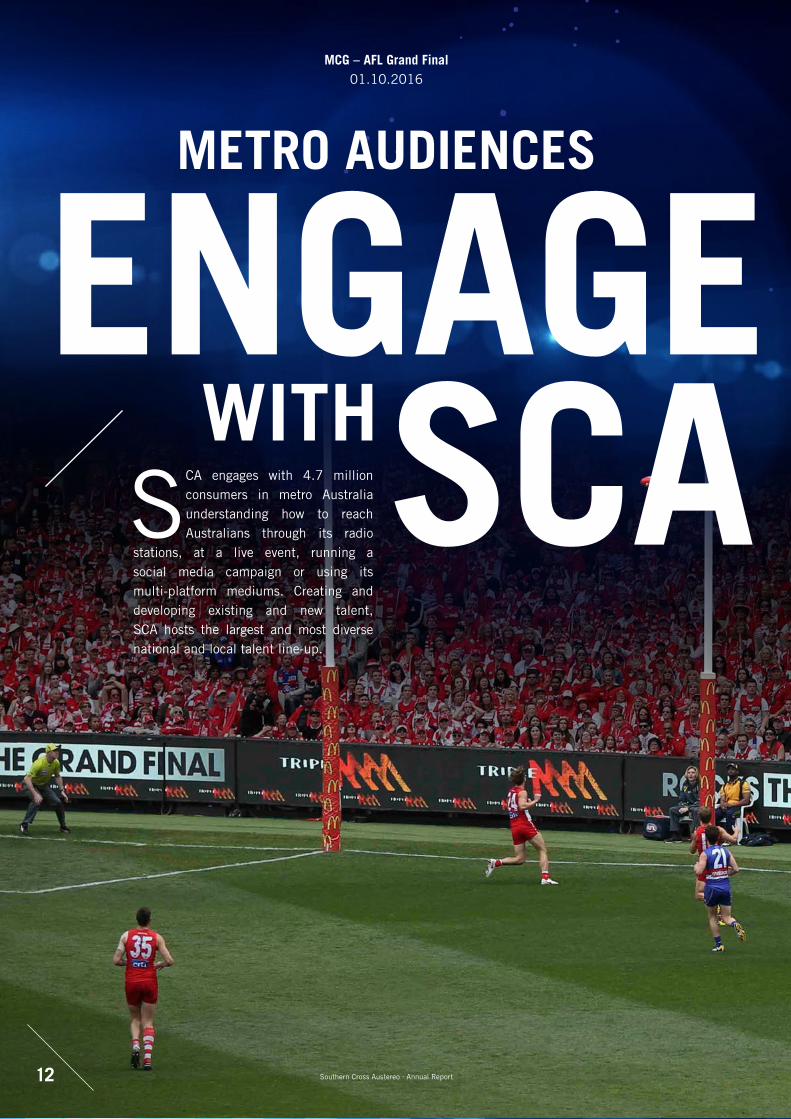
ENGAGESCA
METRO AUDIENCES
WITH
MCG – AFL Grand Final01.10.2016
SCA engages with 4.7 million consumers in metro Australia understanding how to reach Australians through its radio
stations, at a live event, running a social media campaign or using its multi-platform mediums. Creating and developing existing and new talent, SCA hosts the largest and most diverse national and local talent line-up.
Southern Cross Austereo . Annual Report12

The Hit Network
Focusing on hit music, old-school favourites and RNB Fridays with hit shows at Breakfast and Drive, Hit entertains 3 million radio listeners every week, 8.6 million Facebook fans, 1.98 million Twitter followers and 1.26 million Instagram followers.
Leading with audiences under 40 years of age, Hit supports popular personalities including Fifi Box, Em Rusciano, Osher Gunsberg, Abby Coleman, Harley Breen, Brendan Fevola, Dave Thornton, Hamish Blake, Andy Lee, Carrie Bickmore, Tommy Little, Constance Hall, Heidi Anderson, Angus O’Loughlin and Ash London.
Hit Network’s collaboration with Frontier Touring in 2016 saw sell-out RNB Fridays Live events in Sydney, Brisbane, Perth, Adelaide and Melbourne, with over 50,000 attendees and over 6 million participants across social media. And the World Famous Rooftop continues to host globally renowned artists such as Katy Perry, Robbie Williams, Keith Urban, Macklemore and Ed Sheeran. Fans attend the spectacular shows thatalso create world-class content across allthe Hit stations and its online and social media platforms.
Triple M
After nearly 40 years, Triple M continues to be an iconic radio entertainment brand bringing the best music, sport, comedy and entertainment to predominantly male audiences around Australia.
With 2.3 million radio listeners each week, 2.89 million Facebook fans and 425,000 Twitter followers, the Network continues to grow audiences with its depth of talent centred around sporting heroes, comedians and music gurus including Matty Johns, Mark Geyer, Gus Worland, Ryan Girdler, Peter Sterling, The Chaser, Roy & HG, Eddie McGuire, Luke Darcy, Mick Molloy, James Brayshaw, Billy Brownless, Chris Judd, Gorden Tallis, Greg Martin, Robin Bailey, Ed Kavalee, Libby Trickett, Dennis Cometti, Mark Ricciuto, Chris Dittmar, Andrew Jarman and Dale Lewis.
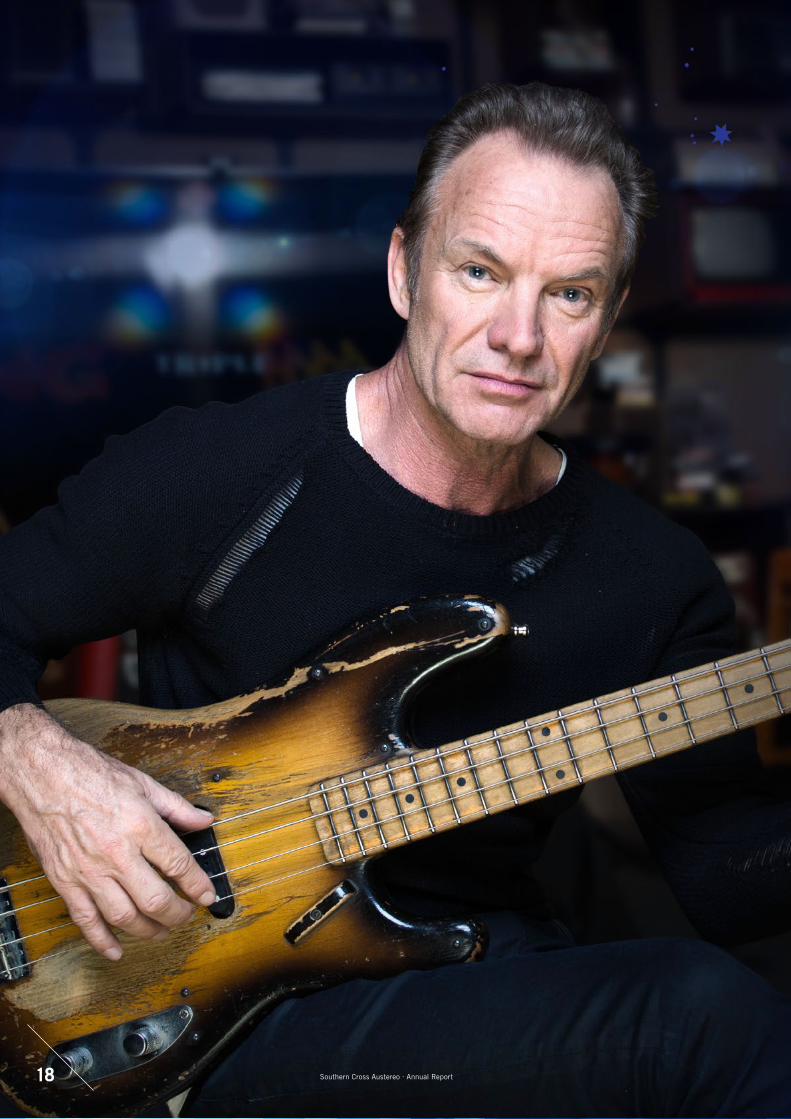
Offering live experiences for lucky listeners, together with creating great original online content, Triple M’s Garage Sessions showcase performances have included Sting and Bernard Fanning.
ENGAGE
Southern Cross Austereo . Annual Report 13

WINNINGTHE HEARTSOF LOCALS
IN REGIONAL AUSTRALIA
Broadcasting 68 radio stations and 89 free-to-air TV signals, SCA’s radio and TV assets reach all corners of regional Australia.
Millions watch SCA’s free-to-air TV in regional Australia
Under the Nine Network brand, SCA broadcasts TV in the regional Queensland, regional Victoria and regional Southern New South Wales licence areas.
And SCA also broadcasts the Seven Network channels in Tasmania, Darwin and the Remote Central and Eastern Australia; Nine, Seven and Ten channels in Broken Hill and Spencer Gulf and the Nine channels in Tasmania and Ten channels in Darwin and Remote Central and Eastern Australia (in joint ventures).
In partnership with the Federal Government, SCA offers the Viewer Access Satellite Television (VAST) services, giving TV to Australians living and travelling in remote Australia and in black-spot areas.
Australia’s biggest radio networks
In late 2016, the Hit and Triple M Networks were expanded to include most SCA regional radio stations. The Hit Network nowboasts 43 stations nationally and Triple M has 35 stations.
Listeners outside of the capital cities now have exposure to exciting Hit and Triple M competitions and experiences and events such as The Hit Network’s World Famous Rooftop and the Triple M Garage Sessions. SCA’s local stations continue to offer a wide range of music and great shows with firmly established and adored home-grown talent, local news and community information, meaning they remain firmly focused on “everything local”.
Measurement of local radio audiences continues to improve with SCA participating in 19 regional market surveys in 2017. It also shows audience shares have increased and the overall number has risen to as many as 2.4 million people.
Southern Cross Austereo . Annual Report14

Regional radio and TV delivers to local communities
Local TV news, sport and weather ensures viewers know what is going on in theirlocal communities.
SCA is now broadcasting 15 local news TV services across regional Victoria, Southern New South Wales and regional Queensland. News journalists and production staff employed by Nine are located in eachlocal market.
Local SCA teams produce a Tasmanian news bulletin and a local bulletin is produced for Broken Hill and Spencer Gulf.
Focused on content relevant to their communities, SCA’s local radio breakfast teams bring their listeners the latest from their regions including more than 21,500 hours/year of local news, sport and weather via 72 separate local news services.
Southern Cross Austereo . Annual Report 15

Southern Cross Austereo . Annual Report16

SCA offers listeners more music and content than ever and makes it available when and how they want it, via their devices of choice.
Radio stations are streamed from their websites, from the industry mobile app ‘RadioApp’ and from many SCA stations streamed from their own brandedmobile apps.
Stations are available live and via catch-up podcasts. Many SCA show podcasts are regularly in the top ten entertainment and comedy catch-up podcasts, with Em Rusciano and Harley Breen consistently achieving success in both rankings.
All metropolitan stations are broadcast in digital together with a further six stand-alone digital stations. The Hit Network broadcasts Buddha Hits, Easy Hits and Oldskool Hits and the Triple M Network broadcastsTriple M Classic Rock, Triple M Greatest Hits
AUSTRALIA’SLARGEST AUDIO
NETWORKand Triple M Modern Rock, all extendingthe listening options under each of the primary brands.
The future of Audio – Audio on demand; There’s One for Everyone
Consumers are keen to listen to some oftheir audio content on-demand as a personalised experience.
With its audio expertise, SCA has developed a new podcasting network offering listeners original audio content on-demand, available via the PodcastOne website and mobile app.
SCA is pioneering a new type of commercial entertainment in Australia, reinvigorating the art of compelling storytelling by creatingand commissioning original long-form content across multiple genres including lifestyle, sport, business, true crime, science and health.
KATY PERRY – WORLD FAMOUS ROOFTOP30.06.2017
Southern Cross Austereo . Annual Report 17
Southern Cross Austereo . Annual Report18

SCA delivers to its clients large-scale engaged radio and TV audiences, combined with consumers who are interacting with complementary
social media, online and streaming content.
And SCA is adapting to the changing media landscape, offering more opportunities to deliver audiences and an understanding of those audiences. By integrating new digital radio stations into the Hit and Triple M Networks, clients can reach their desired consumers across a family of “like-minded” but nuanced stations in each Network.
Moving into audio on demand SCA can deliver clients targeted audiences who have
THE COMMERCIAL
POWEROF SCA
specifically chosen the content and are often difficult to reach with other forms of media.
SCA’s exclusivity to sell Vevo digital inventory and music video content in Australia expands SCA’s credentials as the place for advertisers to go to for entertainment content.
With a strong research and analytics team, SCA deeply understands its audiences. Insight combined with reach and depth of brands and assets means clients are better able to build and amplify their campaigns. To enhance clients’ ability to measure and understand regional audiences, in 2017 SCA invested to give media agencies access to new survey data via “Frequency” software.
STING – Triple M Garage Session03.10.2016
Southern Cross Austereo . Annual Report 19

OUR PEOPLE, VALUES & PARTNERSS
CA prides itself on a culture that attracts and retains talented and creative people in an environment where they can perform at their
best. An employee engagement and culture audit has given SCA valuable insights into current culture and identified initiatives to build a high performance environment. Underpinning the culture are the SCA Values, which the company shares and identifies as its deepest beliefs and aspirations.
Learning and DevelopingReaching SCA’s strategic objectives requires a skilled, capable and progressive workforce, with the ability to adapt and respond to internal and external influences and changing priorities. SCA’s Learning and Development Plan focuses on building skills and capabilities to build ongoing success and support a culture of continuous learning and high performance.
Diversity and InclusionDiversity is a creative opportunity to respond and be relevant to audiences and clients. SCA creates a working environment that recognises and respects individuals’ unique contributions and encourages their full potential. Diversity is sought in all practices including recruitment and selection, talent management, succession planning, promotions and development opportunities.
SCA EmbraceSCA Embrace is a two-year charity partnership designed to concentrate resources to make a tangible difference to the community. Under the current two-year partnership SCA is working with and supporting OzHarvest, Black Dog Institute and CanTeen.
SCA Habitat for Humanity Build Team
Southern Cross Austereo . Annual Report20

Since 2016 SCA has provided the charities with more than $12 million in airtime, together with support for their events, access to talent for hosting rolls, on-air interviews, social media support, concert tickets, access to research and other departments and event day activation support.
Habitat For HumanityAnnually SCA selects staff to volunteer at an overseas location and work together in building secure and affordable homes in disadvantaged areas. In 2017 staff will visit Yogyakarta, Indonesia and participate in the “Rock the House” build project.
Give Me 5 For KidsSCA’s national fundraiser supports and raises funds for local children’s hospital wards across regional Australia. Over the last 20 years almost $20 million has been raised benefitting over 40 children’s hospital wards.
I Believe In ChristmasThe Salvation Army Christmas Appeal toy drive enables locals to donate toys for Christmas trees in each station’s reception area.
Southern Cross Austereo . Annual Report 21

MELANIE WILLISDirector
Appointed: 26 May 2016Most recently elected by shareholders: 20 October 2016 Board Committees: Chair, Audit & Risk Committee, People & Culture Committee
Melanie has extensive financial and professional services experience in a wide range of industries, including accounting and financial planning, infrastructure, property investment management and retail services. During the last 10 years, Melanie has held non-executive directorship roles at Aevum Ltd, Hydro Tasmania, Rhodium Asset Solutions, Crowe Horwath and Club Assist Ltd, as well as senior executive roles with Deutsche Bank, Bankers Trust Australia and NRMA Investments.
Melanie is currently a non-executive director of Mantra Group, Ardent Leisure Group and Pepper Financial Services Group.
GLEN BOREHAM AMDirector
Appointed: 1 September 2014Most recently elected by shareholders: 20 October 2016 Board Committees: Audit & Risk Committee
Glen Boreham AM had a distinguished career at IBM culminating in the role of Chief Executive Officer and Managing Director, IBM Australia and New Zealand from 2006 to 2010. Glen was the inaugural Chair of Screen Australia from 2008 to 2014, and also chaired the Australian Government’s Convergence Review of the media industry. Glen is Chair of the Business School Advisory Board at the University of Technology Sydney, and Chair of Advance, representing the one million Australians living overseas. He is a non-executive director of Cochlear Ltd and Link Group Ltd.
GRANT BLACKLEYCEO & Managing Director
Appointed: 29 June 2015Most recently elected by shareholders: 29 October 2015
Grant Blackley joined the Board in June 2015 as Chief Executive Officer and Managing Director. Grant’s media industry career spans over 30 years during which time he served in numerous senior leadership roles at the TEN Network, including as CEO from 2005 to 2010. Throughout this period he also held directorships at Free TV and Freeview Australia. Prior to becoming CEO, Grant served in key roles in network sales, digital media and multi-channel program development as well as being responsible for Group strategy, acquisitions and executive development programs.
Southern Cross Austereo . Annual Report22

PETER BUSHChairman
Appointed: 25 February 2015Most recently elected by shareholders: 29 October 2015Board Committees: Chairman, Nomination Committee
Peter Bush had a distinguished career in executive roles spanning the media, FMCG, advertising and consumer products sectors. He also brings considerable and highly respected public company directorship experience to Southern Cross Media Group. Peter is currently Chairman of Mantra Group Ltd and Inghams Group Ltd. He has previously served on the boards of Pacific Brands Ltd, Nine Entertainment Holdings, Insurance Australia Group, Miranda Wines, McDonald’s Australia Ltd and Lion Nathan.
LEON PASTERNAKDeputy Chairman
Appointed: 26 September 2005Most recently elected by shareholders: 20 October 2016Board Committees: Chairman, People & Culture Committee
Until February 2014, Leon held the positions of Vice Chairman and Managing Director with Merrill Lynch Markets (Australia) Pty Ltd (a subsidiary of Bank of America) with responsibility for the financial institutions group and mergers and acquisitions. Until July 2010, Leon Pasternak was a senior corporate partner at Freehills (now Herbert Smith Freehills) specialising in mergers and acquisitions, public finance and corporate reorganisations.
HELEN NASHDirector
Appointed 23 April 2015Most recently elected by shareholders: 29 October 2015Board Committees: Audit & Risk Committee, People & Culture Committee, Nomination Committee
Helen Nash has more than 20 years’ experience in brands and marketing, including seven years in FMCG at Procter & Gamble, followed by three years in publishing at IPC Media. Helen held a variety of senior executive roles at McDonald’s Australia Ltd over nearly 10 years, including Chief Operating Officer, overseeing restaurant operations, marketing, menu, insights and research and information technology. Helen is also a non-executive director of Blackmores Ltd, Metcash Ltd and Inghams Group Ltd. She was formerly a non-executive director of Pacific Brands Ltd.
ROBERT MURRAY Director
Appointed: 1 September 2014Most recently elected by shareholders: 21 October 2014Board Committees: People & Culture Committee, Nomination Committee
Robert Murray has had a distinguished career in sales, marketing and general management having served most recently as the CEO of Lion (formerly Lion Nathan), one of Australasia’s leading food and beverage companies, including during its acquisition by Kirin Holdings in 2009. Previously, Rob worked for Procter & Gamble for 12 years, and then for eight years with Nestlé, firstly as MD of the UK Food business, and from 2000 to 2004 as CEO of Nestlé Oceania. Rob is a board member of the Bestest Foundation and is Chairman of Metcash Ltd.
Southern Cross Austereo . Annual Report 23

CHAIRMAN’S STATEMENTOn behalf of the Board of Directors,
I am pleased to present Southern
Cross Austereo’s Annual Report for
the 2017 financial year.
The Company delivered sound
financial results in 2017, with
improvement across all key financial
measures compared to the previous
year. Revenue increased by 7.5%
to $690 million and underlying
net profit after tax increased by
21.5% to $93.8 million. The Board
declared fully franked dividends of
7.75 cents per share for the year, up
from 6.75 cents per share in 2016.
The Company aspires to be an
entertainment company that delivers
market-leading value-creating brands
and to be the preferred entertainment
company in our markets. Guided by
this aspiration, the Group is taking
proactive steps to take advantage
of the opportunities being created
by technological change and
ongoing convergence and diversity
of entertainment platforms. During
the year, this included successful
transition of audiences and revenue
to the Company’s new Nine Network
television programming in three
of the four aggregated markets
on the east coast, and sale of the
Company’s northern NSW Ten
Network affiliation and a portfolio of
45 transmission sites. Early in the
new financial year, the Company
launched new business partnerships
in growth areas with PodcastOne
(podcasting) and QIC (out-of-home
advertising).
We also continue to invest in our
people, with a strong focus on culture
and leadership and on strategies
to secure key talent and to identify
and develop the next generation of
talent for flagship radio shows and
podcasts.
The Company welcomed removal of
broadcasting licence fees in 2017
and is pleased that the spectrum
tax proposed for future years will be
less burdensome for broadcasters.
In partnership with other regional
and metropolitan broadcasters,
Southern Cross Austereo continues
to advocate for other changes to
bring Australia’s media regulation
up to date with modern technology.
At the time of writing, legislation to
remove the reach rule (that prevents
a person controlling commercial
television licences in areas with
more than 75% of Australia’s
population) and the two out of
three rule (that prevents a person
controlling a commercial radio
licence, a commercial television
licence and a newspaper in the same
area) remains under debate in the
Australian Parliament.
The Group enjoys being a proactive
contributor to the community. This
is primarily through our annual Give
Me Five for Kids campaign, which
raises funds for children’s hospitals
and children’s wards in regional
Australia. For the fourth year in a
row, this campaign raised over $2
million. Supported by the volunteer
spirit of our workforce, over 95%
of these funds were donated to
Keith Urban – World Famous Rooftop28.09.2016
charities. We also provided our
three charity partners - OzHarvest,
Black Dog Institute and CanTeen
with support for advertising and
commercial production, strategic
insights and consumer activations
(including volunteer support from
our people) to help grow and develop
their charitable activities.
I would like to thank Peter Harvie
for his significant contribution to
Southern Cross Austereo. Peter
retired as a director in March,
having joined the Board in 2011
upon the merger of Southern Cross
Broadcasting and Austereo Group
to form Southern Cross Austereo.
Peter also had a distinguished
executive career in media including
for 20 years as Managing Director
of Clemenger Harvie and 18 years
leading the Triple M Network and
Austereo Group before the 2011
merger.
The Company’s results for the year
are due to the efforts of all our
2500 employees and contractors,
led by Grant Blackley and his senior
leadership team. Through their
efforts, Southern Cross Austereo
continues to entertain and play an
important role in the lives of 10
million people around Australia
every week. Your Board is confident
in the outlook for Southern Cross
Austereo and we thank you for your
continued support.
Peter BushChairman
Southern Cross Austereo . Annual Report24

Southern Cross Austereo . Annual Report 25

Southern Cross Austereo . Annual Report26

CEO’S REPORT
Dear Shareholders,
In FY17, Southern Cross Austereo
revenue grew by 7.5% with across
the board increases in all assets
classes of radio, television and
digital, consolidating revenue gains
of 5.1% gains in the previous year.
The company has reported an
increase in NPAT of 40% benefitted
from a non-cash tax adjustment with
underlying NPAT growth of 21.5%
assisted by continuing reductions in
financing costs and a lower effective
tax rate.
SCA’s sales performance has been
underpinned by growth in both our
metro radio business which grew
its share of the market, and in
regional radio which experienced its
sixth consecutive year of growth. In
addition, we have also experienced
a highly successful transition of
our television affiliation from the
Ten Network to the Nine Network
in three of the four aggregated
markets, culminating in the rollout
of 15 new local TV news services in
each market.
SCA has continued its process
of divesting non-core assets and
utilising the capital proceeds to
strengthen our balance sheet. In
February we completed the sale of
45 transmission sites and in May we
sold our NNSW TV licence to WIN,
effectively eliminating any material
exposure to the Ten Network. We
have continued to utilise the finds to
pay down debt, with net debt having
been reduced by $186 million over
the past 24 months.
Looking forward SCA is
predominantly focused on audio
continuing to develop the national
Hit and Triple M brands and
extending our audience reach
through digital radio assets. We will
continue to improve our audio assets
by leveraging our core competencies
to develop new revenue streams in
adjacent areas. Our PodcastOne
Australia network has been launched
with a mix of unique original
Australian content together with
the best overseas content from our
US partner. Our partnership with
Vevo has continued to grow, with
SCA delivering increasing revenues
from Vevo’s premium digital video
content.
As technologies and audience
preferences change, we will
adapt our business to improve
the audience experience for our
audiences ensuring full accessibility
to our content across all new and
developing platforms. We will
increase our understanding of our
audiences through the data that
digital platforms provide and we will
continue to develop personalised
content for our audiences.
In relation to monetisation our
focus is on improving the audience
measurement tools and insights
that will provide further confidence
to advertisers around the return
on investment from our assets. We
will continue to invest in our sales
platforms to increase the automation
of sales trading and to improve the
ease of doing business with SCA.
As evidenced by our announcement to
partner with QIC to provide localised
video content on digital screens in
regional markets, we will continue
to explore adjacent markets to find
opportunities that complement our
existing asset set and fit with our
core competencies of our business:
the reach of our national business,
our ability to provide local content in
metro and regional markets and our
strong brands.
This has been another strong year of
growth for SCA and a strong strategic
plan has been put in place to grow
our existing businesses and develop
new avenues of growth to take
advantage of the opportunities that
improving technologies provide.
Grant BlackleyManaging Director & Chief Executive Officer
Southern Cross Austereo . Annual Report 27

FINANCIAL REPORT2017
Southern Cross Austereo . Annual Report28

Southern Cross Austereo . Annual Report 29

CONTENTSCorporate Governance Statement 29
Directors’ Report 29
Review and Results of Operations 29Distributions and Dividends 32Significant Changes in State of Affairs 32Events Occurring After Balance Date 32Likely Developments and Expected Results of Operations 32Indemnification and Insurance of Officers and Auditors 32Non-Audit Services 32Environmental Regulation 32Information on Directors 33Information on Company Secretary 34Meetings of Directors 34
Remuneration Report 35
Auditor’s Independence Declaration 53
Statement of Comprehensive Income 54
Statement of Financial Position 55
Statement of Changes in Equity 56
Statement of Cash Flows 57
Notes to the Financial Statements 58
Key Numbers 59Capital Management 72Group Structure 80Other 82
Directors’ Declaration 89
Independent Auditor’s Report 90
Additional Stock Exchange Information 97
Corporate Directory 98
The financial statements were authorised for issue by the Directors on 24 August 2017. The Directors have the power to amend and re-issue the financial statements.
28 Southern Cross Austereo . Annual Report

Corporate Governance StatementThe statement outlining Southern Cross Media Group Limited’s corporate governance framework and practices in the form of a report against the Australian Stock Exchange Corporate Governance Principles and Recommendations, 3rd Edition, will be available on the Southern Cross Austereo website, www.southerncrossaustereo.com.au, under the investor relations tab in accordance with listing rule 4.10.3 when the 2017 Annual Report is lodged. The 2017 Corporate Governance Statement is available in the 2017 Annual Report on the website.
Directors’ Report The Directors of Southern Cross Media Group Limited (“the Company”) submit the following report for Southern Cross Austereo, being Southern Cross Media Group Limited and its subsidiaries (“the Group”) for the year ended 30 June 2017. In order to comply with the provisions of the Corporations Act 2001, the Directors report as follows:
DirectorsThe following persons were Directors of the Company during the whole of the year, unless otherwise stated, and up to the date of this report: – Peter Bush (Chairman) – Leon Pasternak (Deputy Chairman) – Grant Blackley – Glen Boreham – Rob Murray – Helen Nash – Melanie Willis – Peter Harvie (resigned 28 March 2017)
Principal ActivitiesThe principal activities of the Group during the course of the financial year were the creation and broadcasting of content on free‑to‑air commercial radio (AM, FM and digital), TV and online media platforms across Australia. These media assets are monetised via revenue generated from the development and sale of advertising solutions for clients.
There were no changes in the nature of the Group during the year.
Review and Results of OperationsOperational ReviewGroup ResultsThe Group reported revenues of $687.2 million, up 7.4% on the prior year revenues of $639.6 million, and Earnings before Interest, Taxes, Depreciation and Amortisation (“EBITDA”) of $177.4 million, up 5.8% on prior year EBITDA of $167.7 million. Net Profit after Tax (“NPAT”) of $108.6 million is up 40.5% on a prior year NPAT of $77.2 million. Current year results include a net $10.9 million benefit from material one‑off items including the abolition of broadcast licence fees for the 2017 financial year, a net gain on the disposal of assets totalling $3.6 million and a $14.7 million deferred tax credit relating to the disposal of indefinite lived intangible assets in the Northern NSW television business. Net debt has reduced by a further 5.6% to $321.0 million and net finance costs of $18.8 million are down 23.9% on the prior year.
Segment Profit and Loss2017
$’m2016
$’m VarianceRegional 417.9 382.3 9.3%Metro 247.1 242.3 2.0%Corporate 22.2 15.0 48.0%Total Revenue 687.2 639.6 7.4%
EBITDARegional 125.8 131.1 (4.0%)Metro 60.1 51.4 16.9%Corporate (8.5) (14.8) 42.6%Total EBITDA 177.4 167.7 5.8%
Group NPAT 108.6 77.2 40.5%
RegionalThe Regional business consists of a number of regional radio and regional television licences. Each regional television licence receives programming from a metropolitan television network affiliate and 2017 was the first year in which the Group has received the majority of its programming from Channel Nine, compared with Channel Ten in previous years. This new affiliation arrangement has delivered incremental audience and has been the primary driver for the 9.3% revenue growth within the regional business.
On 31 May 2017, the Group completed the sale of its Channel Ten affiliated television business in Northern New South Wales (NNSW), to Network Investments Pty Ltd, a wholly owned subsidiary of the WIN Television Network. The NNSW television business contributed an estimated $10.0 million in EBITDA with total proceeds from the sale being $55.0 million. The transaction resulted in a loss on sale of $3.1 million.
DIRECTORS’ REPORTFOR YEAR ENDED 30 JUNE 2017
29Southern Cross Austereo . Annual Report
DIRECTORS’ REPORTFOR YEAR ENDED 30 JUNE 2017
Review and Results of Operations (continued)Operational Review (continued)Regional (continued)Regional radio continues to be a strong performer for the Group with advertising revenues of $165.4 million, up 2.0% on 2016. Revenue from national agency clients was up 3.4% as the Group has undertaken to increase the profile of Regional Radio by conducting audience surveys in many regional markets and working with key agency clients to help them better understand the benefits of Regional Radio advertising. Local revenues have been more subdued, growing at 1.3% as our local multimedia sales teams (radio and television) focused their efforts on the successful affiliation change to Nine.
As part of our Group‑wide capital management strategy we have continued the divestment of non‑core assets and in 2017 the Group completed the sale of 45 regional transmission sites to Axicom, a specialist tower operator. The transaction divested $1.5‑$2.0 million in EBITDA for total cash proceeds of $12.6 million, generated a profit on sale of $6.7 million and sees Axicom become responsible for all future site capital expenditure. The Group has entered into a long‑term agreement for use of the sites.
Our 2017 Regional results include a benefit from the abolition of broadcast licence fees and the profit on sale of non‑core assets as well as a negative earnings impact from additional investment in content, research and sales and the prior year sale and leaseback of certain properties.
MetroThe Metro business consists of two complementary radio brands operating in the Australian capital cities along with the digital assets associated with these two brands. The brands target different audience demographics with the Triple M network skewed towards males in the 25 to 54 age bracket and the Hit Network targeted towards females in the 18 to 39 age bracket.
Overall, the metropolitan free‑to‑air radio advertising market has been relatively weak throughout 2017, declining 0.2% on the 2016 financial year, whilst investments in content and improved monetisation of inventory have led to the Group’s share of this market increasing by 0.5 points to 29.1%. Improvements in the Hit Network have been the primary driver behind the Group’s improving revenue share, whilst the Triple M Network share has remained consistent.
Metro EBITDA is up 16.9% due to top line revenue growth and a focus on containing back of house costs, whilst investing further in content and on‑air activities. In addition, the 2017 results have benefited from the abolition of broadcast licence fees.
CorporateThe Corporate business comprises the Group‑wide centralised functions of the Group, as well as the results of the Canberra FM radio business in which the Group has a 50% shareholding. The 2017 results have been impacted by the favourable resolution of the copyright dispute.
Financial PositionThe financial position of the Group continues to improve with net debt reducing 5.6% on 2016 to finish the year at $321.0 million. In addition to this, the Group has extinguished its securitised receivables facility which had a drawn balance of $36.8 million at the end of 2016. The Group’s key debt measures continue to improve with a leverage ratio of 1.81 times, down from 1.89 times in June 2016, and interest cover improving to 10.0 times, up from 7.6 times in June 2016.
Strategic Update The 2017 financial year has seen the Group execute on a number of key strategic objectives:
1. Reduced exposure to free‑to‑air television through the sale of the Northern NSW business;
2. Optimisation of sales and improved monetisation of inventory has led to the Group outperforming the market in all revenue streams;
3. Successful implementation of the Nine television affiliation agreement and roll out of Nine Regional News has improved the outlook for the Group’s television assets;
4. Further divestment of non‑core assets simplifies the Group and improves future cash flows; and
5. Development and launch of PodcastOne Australia, a premium on‑demand podcast network.
The work that has been completed throughout 2017 leaves the Group in a strong operational position and well positioned to focus on its medium‑term strategic objectives:
1. Optimising key audio assets including maximising the value of our audiences across the Hit and Triple M Networks, creating digital radio sub‑brands and establishing PodcastOne as the pre‑eminent commercial podcast company in Australia.
2. Ensuring an improved audio experience for our audience through improved accessibility to our products on a range of different devices, enhanced consumer knowledge from mobile consumption and creating personalised audio experiences for our audiences.
3. Monetising all available audience efficiently with clients by delivering enhanced audience measurement and client friendly automated sales platforms.
4. Exploring non-audio entertainment in growth markets. The Group will investigate, validate and, where appropriate, create new businesses leveraging off the Group’s existing core competencies. Organic opportunities and acquisitions will be considered that complement the Group’s existing asset set.
2018 OutlookWe expect advertising markets to remain challenging, however consistency of Metro content, full establishment of regional television news and monetisation of digital radio will help deliver revenue growth. New revenue streams from PodcastOne and the launch of regional out of home advertising business, Mall Media, will complement revenue growth from existing assets. We will continue our focus on back office efficiency with non‑revenue related cost growth to be around 1.5%.
30 Southern Cross Austereo . Annual Report

Material RisksBusiness and operational risks that could affect the achievement of the Group’s financial prospects include the following risks:
Risk Mitigation StrategiesDecrease in the size of the free‑to‑air (“FTA”) television market at a faster rate than forecast
The Group has seen a decline in the television market of 4.1% year on year. Whilst there has been a continued shift towards digital advertising, there is a recognition that FTA television continues to deliver mass audiences and hence has a key place in media buying strategies.
The Group’s five‑year affiliation agreement with Nine, commenced on 1 July 2016, in Southern NSW, Regional Victoria and Queensland. Nine programming has traditionally delivered a significantly higher audience than Ten across these territories, which provided a revenue uplift in FY2017. A year on from transition and with a news service roll‑out nearing completion, there is further potential revenue upside.
The Group’s sales teams have established a Regional Development Program to drive incremental marketing in regional markets where there is an underinvestment in media spend on a per capita basis.
The Group is a diversified business covering television, radio and online, which provides a degree of protection against individual market weaknesses. On 31 May 2017 the Group completed the sale of its NNSW television operations, which reduced its exposure to the television market. As a television affiliate the Group pays a percentage of revenue to the broadcast partners meaning television has a higher variable cost structure than our radio or online businesses, which reduces the profit impact of any potential decline in revenue.
Finding and retaining good on‑air talent
Finding and retaining good on‑air talent is a key to retaining and growing audience share, and the Group is committed to developing talent across its national network of radio stations.
The Group maintains a risk‑based (opportunity) approach to unearthing and developing new talent. The nature of the Group’s regional and metro radio assets provides an opportunity for developing talent to be moved from smaller to larger markets over time.
Contracts are used to lock talent in for certain periods of time. The development of successful off‑air teams that help create high quality programming is also important in developing the loyalty of on‑air talent to the Group.
Decline in or loss of metro audience share leading to a loss of revenue
The Group has consolidated the gains in metro audience share since last year, with full‑year market share of 29.1% compared to 28.7% in 2016.
The Group will continue to focus on improving audience and commercial share through strategies, such as: – Investing in and retaining talent, as described above. – Securing sporting rights, including the new six‑year agreement with the AFL which commenced on
1 November 2016. – Ongoing investment in On‑Air tactics.
Threat of digital media (including television, radio, social) – emergence and convergence
With new alternative digital platforms and technologies emerging, there is a risk that the Group loses market share to alternative digital platforms and technologies, or fails to fully exploit the opportunity digital media represents for the business to lock in and grow new audience loyalty, or suffers financial loss due to a transfer of advertising spend to digital media.
The Group has employed a team of digital experts, which are now integrated into the Group’s day to day operations in order to leverage existing content and sales capabilities.
The Group invests in engaging digital audiences through the simulcast of its radio stations online and the creation of original digital content that extends its Hit and Triple M radio brands into multiple digital platforms. SCA is the number one radio group in the country with a unique digital audience of 1,257,0001, more than double our nearest competitor. Following the handover of RadioApp (which the Group helped develop) to the CRA, the Group is now focused on the development of its branded digital properties.
The Group’s digital strategy is to utilise its broadcast, social and website reach to continuously engage audiences around our digital audio offering, driving people to our branded apps on which they can listen either live or on‑demand. SCA currently has an install base of 1.7 million2 across its branded radio apps.
The Group has also developed key partnerships with technology and content partners to ensure a competitive commercial product offering. Two developments during the year are: – Acquisition of the rights to exclusively represent Vevo, an extremely high demand video platform, in
Australia, which entitles the Group to sell advertising for the region and talent integration for its clients, with a total audience of 8.4 million3.
– A partnership with PodcastOne, the largest advertiser‑supported network in the United States, to set up PodcastOne Australia which will make available the best existing PodcastOne programmes, together with new unique Australian content. PodcastOne Australia has been available via mobile app and websites since July 2017.
1 Nielsen Digital Ratings (Monthly), Figure for June 17.2 AppAnnie: All Time Downloads. 3 Vevo Analytics, Figures for May 17.
31Southern Cross Austereo . Annual Report

DIRECTORS’ REPORTFOR YEAR ENDED 30 JUNE 2017
Review and Results of Operations (continued)Community InvolvementAs a local media organisation, the Company acknowledges its role in the fabric of regional and rural communities. The Company’s local news services on radio and television keep communities up to date on the issues that matter to them, as well as providing local skilled jobs, promoting local events, supporting local businesses, providing local advertising opportunities and supporting local charities’ community initiatives. In conjunction with the Nine Network, during the year the Company rolled out enhanced local television news bulletins in regional Victoria, southern New South Wales and regional Queensland. In consultation with emergency and essential services organisations, the Company maintains procedures to broadcast warnings and information from emergency and essential services organisations where there is an existing or threatened emergency. During April 2017 the Company was proud to support essential services organisations and local communities in responding to Cyclone Debbie in regional Queensland and northern New South Wales.
The Company is a proactive contributor to the community. This is primarily through the annual Give Me 5 for Kids campaign, which raises funds for children’s hospitals and children’s wards in regional Australia. For the fourth year in a row, this campaign raised over $2 million. Supported by the volunteer spirit of our workforce, over 95% of these funds will be donated to local health services.
During 2016, the Company entered into two‑year partnerships with OzHarvest, Black Dog Institute and CanTeen which have causes aligned with the values and demographic profile of our brands, audience and employees. The Company contributes its significant media assets and workforce to help these organisations to grow and develop their charitable activities.
Distributions and Dividends
TypeCents
per shareTotal Amount
$’m Date of PaymentFinal 2016 Ordinary 3.50 26.9 11 October 2016Interim 2017 Ordinary 3.75 28.8 11 April 2017
Since the end of the financial year the Directors have declared the payment of a final 2017 ordinary dividend of $30.761 million (4.00 cents per fully paid share) out of current year earnings. This dividend will be paid on 10 October 2017 by the Company.
Significant Changes in State of AffairsIn the opinion of the Directors, there were no significant changes in the state of affairs of the Group that occurred during the year under review.
Events Occurring After Balance DateEvents occurring after balance date are outlined in note 24 “Events Occurring after Balance Date” to the Financial Statements.
Likely Developments and Expected Results of OperationsFurther information on likely developments relating to the operations of the Group in future years and the expected results of those operations has not been included in this report because the Directors of the Company believe it would be likely to result in unreasonable prejudice to the commercial interests of the Group.
Indemnification and Insurance of Officers and AuditorsDuring the year the Company paid a premium of $255,603 to insure its officers. So long as the officers of the Company act in accordance with the Constitution and the law, the officers remain indemnified out of the assets of the Company and the Group against any losses incurred while acting on behalf of the Company and the Group. The auditors of the Group are in no way indemnified out of the assets of the Group.
Non-Audit ServicesThe Company may decide to employ the auditor on assignments additional to their statutory audit duties where the auditor’s expertise and experience with the Group are important.
Details of the amounts paid or payable to the auditor (PricewaterhouseCoopers Australia) for audit and non‑audit services provided during the year are set out in note 21.
The Board has considered the position and, in accordance with advice received from the Audit & Risk Committee, is satisfied that the provision of the non‑audit services is compatible with the general standard of independence for auditors imposed by the Corporations Act 2001. The Directors are satisfied that the provision of non‑audit services by the auditor did not compromise the auditor independence requirements of the Corporations Act 2001 for the following reasons: – all non‑audit services have been reviewed by the Audit & Risk
Committee to ensure they do not impact the impartiality and objectivity of the auditor; and
– none of the services undermine the general principles relating to auditor independence as set out in APES 110 Code of Ethics for Professional Accountants.
Environmental RegulationThe operations of the Group are not subject to any significant environmental regulations under Australian Commonwealth, State or Territory law. The Directors are not aware of any breaches of any environmental regulations.
32 Southern Cross Austereo . Annual Report
Information on DirectorsChairman
Peter Bush
Appointed 25 February 2015
Most recently elected by shareholders: 29 October 2015
Board Committees: Chairman, Nomination Committee
Peter Bush had a distinguished career in executive roles spanning the media, FMCG, advertising and consumer products sectors. He also brings considerable and highly respected public company directorship experience to Southern Cross Media Group. Peter is currently Chairman of Mantra Group Ltd and Inghams Group Limited. He has previously served on the boards of Pacific Brands Ltd, Nine Entertainment Holdings, Insurance Australia Group, Miranda Wines, McDonald’s Australia Limited and Lion Nathan.
Deputy Chairman
Leon Pasternak
Appointed 26 September 2005
Most recently elected by shareholders: 20 October 2016
Board Committees: Chairman, People & Culture Committee
Until July 2010, Leon Pasternak was a senior corporate partner at Freehills (now Herbert Smith Freehills) specialising in mergers and acquisitions, public finance and corporate reorganisations. Until February 2014, Leon held the positions of Vice Chairman and Managing Director with Merrill Lynch Markets (Australia) Pty Limited (a subsidiary of Bank of America) with responsibility for the financial institutions group and mergers and acquisitions.
CEO and Managing Director
Grant Blackley
Appointed 29 June 2015
Most recently elected by shareholders: 29 October 2015
Grant Blackley joined the Board in June 2015 as Chief Executive Officer and Managing Director. Grant’s media industry career spans over 30 years during which time he served in numerous senior leadership roles at the TEN Network, including as CEO from 2005 to 2010. Throughout this period he also held directorships at Free TV and Freeview Australia. Prior to becoming CEO, Grant served in key roles in network sales, digital media and multi‑channel program development as well as being responsible for group strategy, acquisitions and executive development programs.
Director
Glen Boreham AM
Appointed 1 September 2014
Most recently elected by shareholders: 20 October 2016
Board Committees: Audit & Risk Committee
Glen Boreham AM had a distinguished career at IBM culminating in the role of Chief Executive Officer and Managing Director, IBM Australia and New Zealand from 2006 to 2010. Glen was the inaugural Chair of Screen Australia from 2008 to 2014, and also chaired the Australian Government’s Convergence Review of the media industry. Glen is Chair of the Business School Advisory Board at the University of Technology Sydney, and Chair of Advance, representing the one million Australians living overseas. He is a non‑executive director of Cochlear Limited and Link Group Limited.
Director
Robert Murray
Appointed 1 September 2014
Most recently elected by shareholders: 21 October 2014
Board Committees: People & Culture Committee, Nomination Committee
Robert Murray has had a distinguished career in sales, marketing and general management having served most recently as the CEO of Lion (formerly Lion Nathan), one of Australasia’s leading food and beverage companies, including during its acquisition by Kirin Holdings in 2009. Before joining Lion Nathan in 2004, Rob worked for Procter & Gamble for 12 years, and then for eight years with Nestlé, firstly as MD of the UK Food business, and from 2000 to 2004 as CEO of Nestlé Oceania. Rob is a board member of the Bestest Foundation and is Chairman of Metcash Ltd.
33Southern Cross Austereo . Annual Report

DIRECTORS’ REPORTFOR YEAR ENDED 30 JUNE 2017
Information on Directors (continued)Director
Helen Nash
Appointed 23 April 2015
Most recently elected by shareholders: 29 October 2015
Board Committees: Audit & Risk Committee, People & Culture Committee
Helen Nash has more than 20 years’ experience in brands and marketing, including seven years in FMCG at Procter & Gamble, followed by three years in publishing at IPC Media. Helen held a variety of senior executive roles at McDonald’s Australia Ltd over a period of nearly 10 years, including the position of Chief Operating Officer, overseeing restaurant operations, marketing, menu, insights and research and information technology. Helen is also a non‑executive director of Blackmores Ltd, Metcash Ltd and Inghams Group Ltd. She was formerly a non‑executive director of Pacific Brands Ltd.
Director
Melanie Willis
Appointed 26 May 2016
Most recently elected by shareholders: 20 October 2016
Board Committees: Chair, Audit & Risk Committee, People & Culture Committee
Melanie has extensive financial and professional services experience in both executive and non‑executive roles in a wide range of industries, including accounting and financial planning, infrastructure, property investment management, and retail services (including tourism and start‑up ventures). During the last 10 years, Melanie has held non‑executive directorship roles at Aevum Limited (including Audit Committee Chair), Hydro Tasmania (including Audit & Risk Committee Member), Rhodium Asset Solutions, Crowe Horwath and Club Assist Limited, as well as senior executive roles with Deutsche Bank (Director), Bankers Trust Australia (Vice President) and NRMA Investments (CEO). Melanie is currently a non‑executive director of Mantra Group, Ardent Leisure Group and Pepper Financial Services Group.
Information on Company SecretaryGeneral Counsel and Company Secretary
Tony Hudson
Appointed 7 September 2015
Tony Hudson has over 20 years’ experience in senior legal and governance roles. Tony was General Counsel and Company Secretary at ConnectEast from 2005 until 2015. Before that, Tony was a partner of Blake Dawson Waldron (now Ashurst Australia), working in the firm’s Melbourne office and from 1993 until 2000 in its Jakarta associated office. Tony is also a director of The Wheeler Centre, the centrepiece of Melbourne’s designation as a UNESCO City of Literature.
Meetings of DirectorsThe number of meetings of the Board of Directors and its committees that were held during the year and the number of meetings attended by each Director are summarised in the table below.
The Nomination Committee did not meet formally during the year. Members of the Nomination Committee met informally to discuss Board succession issues during the year, including upon the resignation of Peter Harvie.
Meetings of Committees
Board Audit & Risk People & Culture
Director Attended Held Attended Held Attended Held
Peter Bush 12 12 1 * * *Leon Pasternak 11 12 * * 5 5Grant Blackley 12 12 4 * 5 *Glen Boreham 10 12 4 4 2 *Peter Harvie1 9 9 * * * *Rob Murray 10 12 * * 5 5Helen Nash 12 12 4 4 5 5Melanie Willis 12 12 4 4 5 5
Held refers to the number of meetings held during the time the Director held office or was a member of the relevant committee during the year.
* Not a member of the relevant committee during the year.1 Peter Harvie retired as a Director on 28 March 2017.
34 Southern Cross Austereo . Annual Report

Letter from People & Culture CommitteeOn behalf of the Board, I am pleased to present the Company’s 2017 Remuneration Report. The People & Culture Committee (PCC) assists the Board in its oversight of management activities in developing and implementing strategies to improve the Company’s culture and diversity, consistent with our values. An important part of the committee’s role is to ensure that the Company’s remuneration policies are aligned with the creation of value for shareholders, having regard to applicable governance, legal and regulatory requirements and industry standards.
The Company had a strong year despite a number of challenges that resulted in some financial targets not being met, or only partially met. The impact of stagnation in advertising markets, in addition to some forecasting errors in the transition of television affiliation from the Ten Network to the Nine Network in three of the four aggregated markets on the eastern seaboard, was offset in part by the rebate of commercial broadcasting licence fees announced by the federal government in June.
Compared to the prior corresponding period, the Company increased revenue by 7.4% to $687.2 million and underlying net profit after tax increased by 21.5% to $93.8 million. Net debt reduced by 5.6% to $321 million and financing costs reduced by 23.9% to $18.8 million. Return on invested capital increased from 9.1% to 10.1%. Dividends of 7.75 cents per share were 14.8% higher than for the previous financial year.
Under the leadership of Grant Blackley, the management team has developed and started to implement a clear strategy for the Company. The foundation of this strategy is the Company’s aspiration to be an entertainment company that delivers market‑leading value‑creating brands and to be the preferred entertainment company in our markets. Key achievements this year included: – TV affiliation transition: On 1 July 2016, the Company’s new
affiliation arrangements with the Nine Network commenced in three of the four aggregated markets on the east coast. The transition of audiences and revenue occurred very successfully and with a seamless operational switchover. Regional news services have been rolled out across all markets to further improve the quality of programming and appeal to audiences and advertisers alike. The conversion of audience to revenue has been very strong, with power ratios of 1.04x achieved, demonstrating the benefit of transitioning to the stronger Nine Network programming.
– Regional radio surveys and re-branding: The program initiated by the Company in 2016 to expand radio ratings surveys in regional markets continued in 2017. Twenty‑eight individual market surveys were carried out, with some markets being surveyed for the first time in 20 years. This provided valuable information for national advertisers, enhancing the value of the Company’s national reach and local connections. The Company re‑branded 63 regional radio stations to either Hit or Triple M, clarifying the Company’s market position for listeners and national advertisers.
– Focus on culture: The Company engaged Human Synergistics to conduct a confidential employee survey to gain a deeper understanding of the Company’s culture and its impact on performance. The survey has provided valuable information about the strengths of the organisation and areas where the Company and individual offices or teams fall short of benchmarks for high performing organisations. A series of action plans have been developed across the organisation to respond to the survey results. These actions start with a focus on leadership. The Company’s top 45 executives have undertaken the Life Styles Inventory (LSI) diagnostic to increase their awareness of effective and ineffective styles. Each of these executives has committed to an individual development plan to build constructive leadership styles and behaviours and will be supported by an executive coach over the next two years. Reward and recognition programs have been aligned with these constructive behaviours and performance management processes will address negative behaviours.
– Major project groups – PodcastOne: The management team has implemented a major project groups methodology to identify and develop strategic initiatives in the business. The first of these to be launched in the business is the Company’s strategic partnership with PodcastOne from the USA. The Company’s initial suite of commissioned podcasts have now been released and are attracting interest from advertisers.
– Sports broadcasting rights: Triple M renewed its national AFL broadcasting rights until the 2022 season and began a two‑year partnership with Cricket Australia for broadcast of test matches. Triple M will broadcast all five Ashes tests in the coming season. A focus of the management team for the new year will be renewing radio broadcasting rights with the NRL.
– Disposal of non-core assets: The Company sold a portfolio of 45 transmission sites, while retaining long‑term access for its ongoing needs. Late in the year, the Company also sold its northern New South Wales Ten Network affiliation, which had become non‑core following the Company’s switch in affiliation to the Nine Network. These sales, along with disposal of several other properties, enabled the Company to further reduce its net debt and expand capital available for more effective use.
In considering the awards to be made to the senior leadership team under the Company’s short‑term incentive (STI) plan for the year, the Board excluded the impact of significant events (such as the profit on sale of transmission assets, the loss on disposal of the NNSW television operations, and the benefit of broadcasting licence fee relief) from assessment of financial measures. These adjustments resulted in nil awards for KPIs relating to Group (and Regional) EBITDA (because the adjusted outcome was less than 95% of the adjusted budget) and in 62% achievement of KPIs relating to Group NPAT (compared to over 100% were no adjustment made). Taking into account the management team’s achievements outlined above and the foundations laid for the future, the Board was satisfied that KPIs relating to operational improvements and cultural and behavioural influences were substantially achieved. The STI awards made to the senior leadership team reflect these assessments. Further details are provided in section 3 of the Remuneration Report that follows.
REMUNERATION REPORTFOR YEAR ENDED 30 JUNE 2017
35Southern Cross Austereo . Annual Report

REMUNERATION REPORTFOR YEAR ENDED 30 JUNE 2017
The Board was pleased that the Company’s long‑term incentive (LTI) plan partially vested for the first time since the Group was established in 2011. This was based on the Company’s relative total shareholder return (TSR) over the three years ended on 30 June 2017. The component of the LTI plan relating to the Company’s earnings per share performance did not vest.
During the year, the PCC engaged an independent expert consultant, Juno Partners, to help review the Company’s LTI plan. Following that review the Board has decided to remove relative TSR as a performance condition for grants to be made under the LTI plan in FY2018. Those grants will have two equally weighted performance hurdles: growth in earnings per share (EPS) and a new measure, return on invested capital (ROIC). The LTI plan will continue to have a three‑year performance period.
The PCC’s review concluded that executives’ perceived value of the LTI plan was low, due to low historic vesting and the opaque and capricious nature of the relative TSR measure. Executives have limited ability to influence the Company’s relative TSR performance, which is affected by extraneous factors influencing movements in the Company’s and the comparator group’s share market performance. The Company’s relative TSR performance throughout the three‑year period of an LTI grant is not readily observable or explicable to executives. The measure has not achieved the objective of providing executives with incentives to perform and remain with the Company.
ROIC measures management’s efficiency at allocating the capital under its control to generate profitable returns. To maintain and improve the Company’s ROIC, management is required to focus on the quality of earnings and the capital required to deliver improved earnings. The Company’s ROIC performance is substantially within management’s sphere of influence and is readily measurable at any time during the performance period of an LTI grant. It therefore provides a more effective incentive for management performance. In addition, sustained improvements in ROIC are highly correlated with improved shareholder value, measured in terms of the premium that a company trades at compared with its book value.
ROIC is defined as:
Operating earnings before interest and tax (EBIT)
Invested Capital (Net Debt plus Equity)
Further details of how ROIC is calculated are provided in the description of the LTI Plan in this Remuneration Report. It should particularly be noted that impairments and other significant items incurred during the life of an LTI grant will be added back to operating EBIT and Invested Capital in determining ROIC performance. In effect, for the purposes of the ROIC calculation, significant items will be reversed. In addition, for the purposes of calculating ROIC under the LTI plan, the Company will adopt AASB 16, including the estimated present value of non‑cancellable operating leases in Invested Capital. Although not considered significant, this will ensure a like with like comparison of ROIC performance following the Group’s adoption of AASB 16 for financial reporting purposes in FY2019.
The ROIC performance rights to be granted in FY2018 will vest if the Company’s ROIC performance in FY2020 is at or above 10.1%, which exceeds the Company’s pre‑tax cost of capital. Maximum vesting will be achieved if the Company’s ROIC performance in FY2020 is at or above 12.5%. These thresholds have been set by the Board after considering analysis of the ROIC performance of the Company, its listed media peers and participants in the ASX Consumer Discretionary Sector in recent years. The Company’s ROIC averaged 8% from FY2014 to FY2016. This was in the bottom decile of sector ROIC performance. The median sector ROIC over that period was 12.2%. The Company’s ROIC performance improved to 10.1% in FY2017, benefitting from a stronger balance sheet, earnings growth and broadcast licence fee relief.
Having regard to historical corporate and sector ROIC performance and the ongoing benefits of licence fee relief, the Board considers that maintaining ROIC performance of 10.1% is a fair gateway for vesting of rights under the LTI plan. As illustrated in the chart below, maintaining ROIC would equate to median historic performance of companies in the consumer discretionary sector over the three years to FY2016, in terms of ROIC improvement.
Figure 1 – Consumer Discretionary Sector ROIC performance FY2014 – FY2016 (outliers not shown)
The upper vesting limit of 12.5% is an ambitious target that will challenge the executive team to achieve step changes in the Company’s capital efficiency and profit margins and would be the equivalent of top quartile ROIC improvement, based on the consumer discretionary sector over the three years to FY2016.
FXJ
AP
NH
VNS
WM
GE
MP
MV
SG
RS
XLIVC
TTS
TAH
JBH
RFG
NVT
GU
DA
HG
GXL
AA
DS
UL
MYR
CW
ND
MP
CTD
BR
GA
RB
-15%
-10%
-5%
0%
5%
10%
15%
ROIC growth = 0%, 51st percentile
ROIC growth = 3.3% at the 75th percentile
36 Southern Cross Austereo . Annual Report
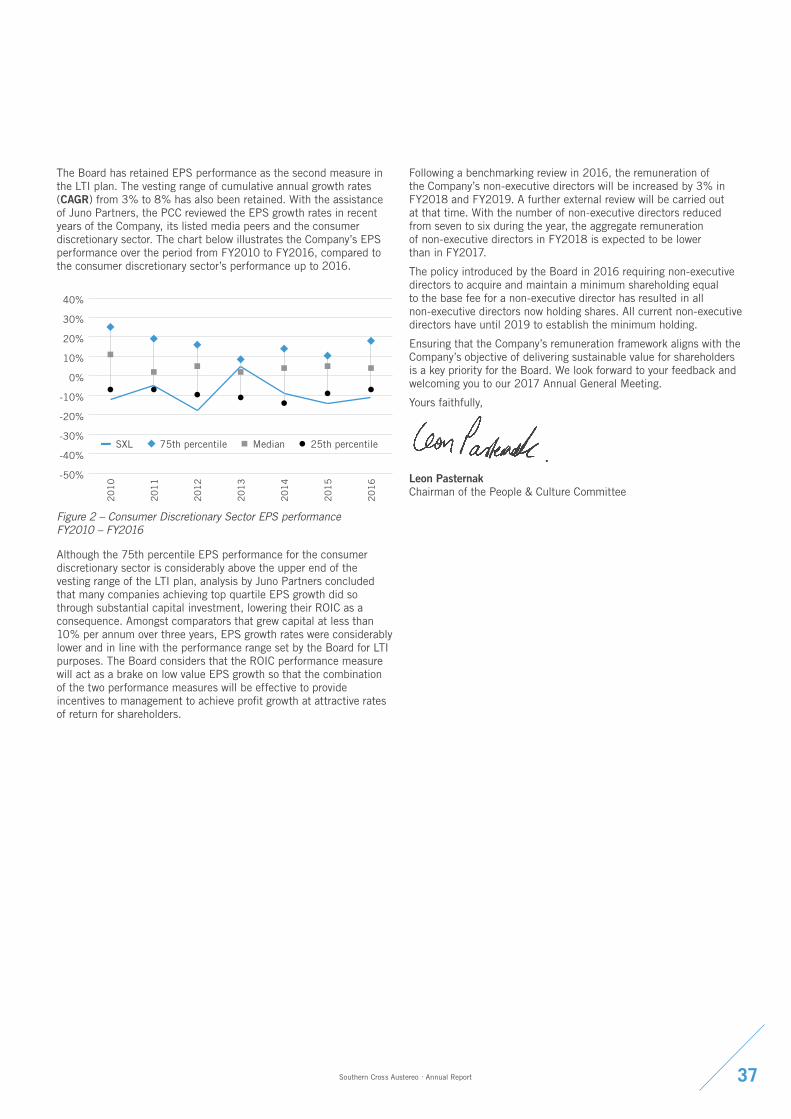
The Board has retained EPS performance as the second measure in the LTI plan. The vesting range of cumulative annual growth rates (CAGR) from 3% to 8% has also been retained. With the assistance of Juno Partners, the PCC reviewed the EPS growth rates in recent years of the Company, its listed media peers and the consumer discretionary sector. The chart below illustrates the Company’s EPS performance over the period from FY2010 to FY2016, compared to the consumer discretionary sector’s performance up to 2016.
Figure 2 – Consumer Discretionary Sector EPS performance FY2010 – FY2016
Although the 75th percentile EPS performance for the consumer discretionary sector is considerably above the upper end of the vesting range of the LTI plan, analysis by Juno Partners concluded that many companies achieving top quartile EPS growth did so through substantial capital investment, lowering their ROIC as a consequence. Amongst comparators that grew capital at less than 10% per annum over three years, EPS growth rates were considerably lower and in line with the performance range set by the Board for LTI purposes. The Board considers that the ROIC performance measure will act as a brake on low value EPS growth so that the combination of the two performance measures will be effective to provide incentives to management to achieve profit growth at attractive rates of return for shareholders.
Following a benchmarking review in 2016, the remuneration of the Company’s non‑executive directors will be increased by 3% in FY2018 and FY2019. A further external review will be carried out at that time. With the number of non‑executive directors reduced from seven to six during the year, the aggregate remuneration of non‑executive directors in FY2018 is expected to be lower than in FY2017.
The policy introduced by the Board in 2016 requiring non‑executive directors to acquire and maintain a minimum shareholding equal to the base fee for a non‑executive director has resulted in all non‑executive directors now holding shares. All current non‑executive directors have until 2019 to establish the minimum holding.
Ensuring that the Company’s remuneration framework aligns with the Company’s objective of delivering sustainable value for shareholders is a key priority for the Board. We look forward to your feedback and welcoming you to our 2017 Annual General Meeting.
Yours faithfully,
Leon Pasternak Chairman of the People & Culture Committee
20
10
20
11
20
12
20
13
20
14
20
15
20
16
SXL 25th percentileMedian75th percentile
-50%
-40%
-30%
-20%
-10%
0%
10%
20%
30%
40%
37Southern Cross Austereo . Annual Report

REMUNERATION REPORTFOR YEAR ENDED 30 JUNE 2017
1. Overview of FY2017 remunerationThis section provides an overview of the remuneration received by executive KMP and non‑executive directors in FY2017. The principles for remuneration of executive KMP are set out in section 2. Details of remuneration paid during the year are provided in sections 3 (Remuneration), 4 (short‑term incentives) and 5 (long‑term incentives).
1.1 Executive KMP
Name Year
Total remunerationShort-term incentive
opportunityLong-term incentive eligible for vesting1
Amount$
Performance-related
proportion%
Awarded%
Forfeited%
Vested%
Forfeited%
Grant Blackley Chief Executive Officer and Managing Director
2017 2,221,055 48.4 87.1 12.9 – –
2016 1,721,675 34.8 100 – – –Nick McKechnie Chief Financial Officer
2017 783,042 31.6 92.4 7.6 100 –2016 892,115 41.5 100 – – –
John Kelly2
Chief Operating Officer2017 773,257 28.6 87.4 12.6 – –2016 283,700 20.6 100 – – –
Brian Gallagher Chief Sales Officer
2017 759,038 29.3 73.7 26.3 – –2016 688,194 26.6 100 – – –
Guy Dobson Chief Creative Officer
2017 785,756 18.1 58.3 41.7 – 1002016 826,746 19.1 60.0 40.0 – 100
Rick Lenarcic Head of Regional Media
2017 581,769 25.2 63.6 36.4 – 1002016 607,478 30.1 96.7 3.3 – 100
Vijay Solanki3
Chief Digital Enablement Officer2017 – – – – – –2016 732,386 7.8 31.0 69.0 – –
Total executive KMP 2017 5,903,917 34.4 82.0 18.0 48.0 52.02016 5,752,294 28.0 91.2 8.8 – 100
1 The vested and forfeited proportion of LTI entitlements relate only to those LTI entitlements that were eligible for vesting during the year.2 John Kelly commenced on 1 February 2016. His remuneration is disclosed only for the period he was a KMP.3 Vijay Solanki resigned with effect from 30 June 2016.
1.2 Non-executive directorsThe aggregate remuneration of the Company’s non‑executive directors during the year was $1,167,750, compared to $1,275,940 in 2016. The principles for remuneration of non‑executive directors are set out in section 2. Details of the remuneration of non‑executive directors during the year are provided in section 3.
38 Southern Cross Austereo . Annual Report

2. Remuneration principles2.1 Overview of executive remunerationThe Company aims to ensure remuneration is competitive and appropriate for the results delivered. Executive reward is aligned with the achievement of strategic objectives and the creation of value for shareholders, and is informed by market practice for delivery of reward.
Executive remuneration packages include a mix of fixed and variable remuneration. Variable remuneration includes short and long‑term incentives. More senior roles in the organisation have a greater weighting towards variable remuneration.
The table below shows the target remuneration mix for executive KMP in 2017. The STI portion is shown at target levels and the LTI portion is based on the value granted in 2017.
Fixed remuneration STI LTI
Grant Blackley Chief Executive Officer and Managing Director 43% 27% 30%Nick McKechnie Chief Financial Officer 61% 19% 20%John Kelly Chief Operating Officer 62% 18% 20%Brian Gallagher Chief Sales Officer 64% 15% 21%Guy Dobson Chief Creative Officer 81% 7% 12%Rick Lenarcic Head of Regional Media 67% 12% 21%
2.2 Fixed remuneration for executive KMPFixed remuneration for executives is structured as a total employment package. Executives receive a combination of base pay, superannuation and prescribed non‑financial benefits at the executive’s discretion. The Company contributes superannuation on behalf of executives in accordance with the superannuation guarantee legislation.
Fixed remuneration is reviewed annually to ensure the executive’s pay is competitive and appropriate for the results delivered. There are no guaranteed fixed remuneration increases included in any executive KMP contracts.
39Southern Cross Austereo . Annual Report

REMUNERATION REPORTFOR YEAR ENDED 30 JUNE 2017
2.3 Variable remuneration for executive KMP2.3.1 Short-term incentivesThe table below outlines details of the Company’s short‑term incentive plan.
What is the incentive? The STI is an annual “at risk” bonus designed to reward executives for meeting or exceeding financial and non‑financial objectives.
How is each executive’s entitlement determined?
Each executive is allocated a dollar value (which may be a fixed percentage of the executive’s total remuneration) representing the executive’s STI opportunity for the year.
How is the incentive delivered?
STI awards for all executives other than the CEO are paid in cash according to the extent of achievement of the applicable performance measures. No portion of an STI award is subject to deferral.
The CEO’s STI award is payable partly in cash and partly in equity. The equity component is 25% of the after‑tax value of the total STI award.
What are the performance measures and hurdles?
The Board sets the annual KPIs for the CEO near the beginning of each financial year. The KPIs are allocated to three categories having regard to the Company’s business strategy: profitability and financial performance (40%), high level operational improvements (40%) and cultural and behavioural influences (20%).
The CEO determines the KPIs for the other members of the senior leadership team in the same three categories and having regard to their areas of responsibility. KPIs for the Chief Creative Officer may allocate up to 40% to creative and content performance instead of profitability and financial performance.
The metrics that applied under the STI plan in 2017 are summarised below.
Profitability and financial performance/Creative and content performance (40%) – Group NPAT compared with budget: Focuses on financial results and collaboration for the overall benefit of the
Group. This financial metric applies for the CEO, CFO and COO. – Segment EBITDA compared with budget: Focuses on the performance of segments for which they have direct
responsibility. This metric applies for the Head of Regional Media. – Sales-related targets: Focuses on achieving sustainable financial performance from growing top line revenue.
This metric applies for the Chief Sales Officer. – Ratings targets: Revenue and financial performance is heavily dependent on ratings on both radio and television.
This metric applies for the Chief Creative Officer (for radio).
Profitability and financial performance targets also include targets to ensure non‑revenue related costs are closely controlled and on the achievement of specific corporate strategy projects that improve the asset base.
The Board has discretion to adjust budget targets to take into account acquisitions or divestments or other significant items where appropriate for linking remuneration reward to corporate performance.
Achievements against financial metrics are based on the Company’s audited annual financial statements. The Board has discretion to make adjustments to take into account any significant non‑cash items (for example impairment losses), acquisitions and divestments and one‑off events/abnormal/non‑recurring items, where appropriate for linking remuneration reward to corporate performance.
High level operational performance (40%) – Strategy: Focuses on strategic initiatives (such as network strategy, material contracts and diversification of
revenue streams) that deliver growth, improved business performance and shareholder value. – Operational improvements: Focuses on effective management of business support functions and infrastructure
to sustain and improve long‑term earnings performance.
Cultural and behavioural influences (20%) – People: Focuses on effective leadership and development and retention of talent to sustain and improve
long‑term earnings performance.
– External relationships: Focuses on development and maintenance of constructive relationships with key stakeholders to sustain and improve long‑term earnings performance.
Is there a gateway? At least 95% of financial metrics relating to NPAT or EBITDA must be achieved before any STI based on those metrics is payable.
At least 97.5% of financial metrics for sales or costs must be achieved before any STI based on those metrics is payable. Where the budget for a financial year is less than the previous year’s actual result, the applicable financial metric will be the previous year’s actual result.
There is no gateway for non‑financial measures.
Individual performance must be at a “meets expectations” level before any STI is payable.
40 Southern Cross Austereo . Annual Report

What is the maximum amount payable?
The maximum award for non‑financial measures under the STI plan is 100% of an executive’s STI opportunity for those measures.
The maximum award for financial measures under the STI plan is 100% of an executive’s STI opportunity for that measure. In addition, an executive can earn up to 200% of the financial component (40%) of the executive’s STI if the Group achieves up to 105% of the Group’s NPAT target. An executive’s maximum STI opportunity is therefore 140% of target.
Having regard to assumptions underlying the budget, the Board considers that achieving 105% of the Group’s NPAT target would represent significant outperformance. Any STI award for such outperformance must be self‑funding. This means that the outperformance must be achieved after providing for the incremental cost of any STI award.
NPAT/EBITDA Sales % of financial STI payable<95% <97.5% 0%95% to 100% 97.5% to 100% Straight‑line between 50% and 100%
100% to 105% NPAT n/aProgressive scale between 100% and 200%
>105% n/a 200%
How is performance assessed?
CEO: At the end of each financial year, with the assistance of the Committee, the Board assesses the actual performance of the Company and the CEO against the applicable KPIs and determines the STI amount payable to the CEO.
Other executive KMP: At the end of the financial year the CEO assesses the actual performance of the Group and the executive KMPs against the applicable KPIs and determines the STI amount payable to each executive. The CEO provides these assessments to the Committee for review.
Cessation of employment “Bad Leavers” (who resign or are terminated for cause) will forfeit their STI entitlement, unless otherwise determined by the Board or the CEO as appropriate.
The STI payments of executives who cease employment for other reasons are pro‑rated for time and performance, unless otherwise determined by the Board.
Change of control In the event of a change of control before the STI payment date, the STI payment is pro‑rated for time and performance, subject to Board discretion.
Clawback The Board has discretion to reduce the benefit of an STI award to the extent its vesting was affected by fraud, dishonesty, breach of obligation or other action likely to result in long‑term detriment to the Company.
Other features Discretionary elements: The Board (for KMP) and the CEO (for other executives) have discretion to grant additional bonuses for special projects or achievements that are not contemplated in the normal course of business or that have a particular strategic impact for the Company, such as acquisitions and divestments, refinancing, or major capex projects.
Minimum employment period: Participants must be employed for at least three months in the performance period to be entitled to receive an STI payment.
2.3.2 Long-term incentivesThe table below outlines details of the Company’s long‑term incentive plan.
What is the incentive? The LTI plan provides executive KMP with grants of performance rights over ordinary shares, for nil consideration. Performance rights granted under the LTI plan are subject to a three‑year performance period. For 2017, the LTI plan has also been made available to about 20 executives in the next tiers of management.
How is each executive’s entitlement determined?
Each executive is allocated a dollar value (which may be a fixed percentage of the executive’s total remuneration) representing the executive’s maximum LTI opportunity for the year. This dollar value is converted into a number of performance rights in the LTI plan, based on the face value of performance rights at the applicable grant date. The face value of performance rights is calculated as: – the weighted average price of the Company’s shares for the five trading days commencing seven days after the
Company’s results for the prior financial year (ended 30 June 2017) are announced to the ASX; less – the amount of any final dividend per share declared as payable in respect of the prior financial year (year
ended 30 June 2017).
(For LTI grants made before 1 July 2017, the dollar value is based on the fair value of performance rights at the applicable grant date. Where relevant, the Company engages Deloitte Touche Tohmatsu (Deloitte) to determine the fair value of performance rights.)
How is the incentive delivered?
To the extent that the applicable vesting conditions are satisfied at the end of the three‑year performance period, LTI awards are delivered by allocation to participants of one fully paid ordinary share for each performance right that vests. The Board has discretion to settle vested awards in cash.
41Southern Cross Austereo . Annual Report

REMUNERATION REPORTFOR YEAR ENDED 30 JUNE 2017
What are the performance measures and hurdles?
From 1 July 2017, each grant under the LTI plan has two equally weighted performance hurdles over a three‑year period: Return on Invested Capital (ROIC) and Absolute Earnings per Share (EPS). ROIC has replaced Relative Total Shareholder Return (TSR), which, together with Absolute EPS, was the performance hurdle used in LTI grants made before 1 July 2017. This change was made following a review of the LTI plan by Juno Partners, an independent consultant. The Company’s ROIC Performance is more within management’s sphere of influence than is the Company’s Relative TSR Performance, is readily measurable at any time during the performance period of an LTI grant, and therefore provides a more effective incentive for management performance.
Return on Invested Capital Performance hurdle ROIC measures management’s efficiency at allocating the capital under its control to generate profitable returns. To maintain and improve the Company’s ROIC, management is required to focus on the quality of earnings and the capital required to deliver improved earnings.
ROIC is calculated as follows:
Operating earnings before interest and tax (EBIT)
Invested Capital (Net Debt plus Equity)
ROIC is defined by reference to factors substantially within management’s sphere of influence. Accordingly: – Operating EBIT is adjusted to exclude the impact of significant or non‑recurring items (both income and costs)
to provide a fair measure of underlying long‑term performance. – Impairments and other significant items during the life of an LTI grant are added back to operating EBIT and
Invested Capital. (Past impairments and significant items are not added back, it being recognised that these are not the responsibility of current management.)
– Non‑cancellable operating leases are included in Invested Capital. – Returns are measured pre‑tax. – Invested Capital is measured at the end of each month over the final year of an LTI grant and is averaged for
the purposes of calculating ROIC. – Where applicable, items used to calculate ROIC will be re‑based to accommodate changes in accounting
standards and policies during the life of an LTI grant. (This has been done for ROIC performance rights granted in FY2018. The change in accounting policy to recognise deferred tax on intangible assets has resulted in a reduction of $383.6 million in the Company’s equity (which forms part of Invested Capital in the ROIC calculation). This amount has been added back to Invested Capital for the purposes of the ROIC calculation.)
ROIC performance rights will vest if the Company’s ROIC performance in the final year of the performance period is at or above a threshold set by the Board at the time of making the relevant LTI grant. ROIC performance rights granted in FY2018 are eligible to vest according to the following schedule:
ROIC Performance in FY2020 % of allocation that vestsBelow 10.1% Nil10.1% 50%10.1% – 12.5% Straight‑line vesting between 50% and 100%At or above 12.5% 100%
Absolute EPS Performance hurdle (50%)Performance rights will vest if the Company’s adjusted EPS performance over the performance period is at or above a 3% Compound Annual Growth Rate (CAGR). Adjusted EPS excludes the impact of significant or non‑recurring items (both income and costs) and so provides a fair measure of underlying long‑term performance.
Adjusted EPS is calculated by dividing the adjusted profit after tax attributable to shareholders for the relevant reporting period (reported profit after tax, adjusted for the after‑tax effect of significant or non‑recurring items) by the weighted average number of ordinary shares on issue in the Company over the relevant reporting period.
Absolute EPS Performance % of allocation that vestsBelow 3% CAGR Nil3% CAGR 50%3% – 8% CAGR Straight‑line vesting between 50% and 100%At or above 8% CAGR 100%
42 Southern Cross Austereo . Annual Report

What are the performance measures and hurdles? (continued)
Relative TSR Performance hurdle (for LTI grants made before 1 July 2017)TSR provides a comparison of relative shareholder returns that is relevant to most of the Company’s investors.
The Relative TSR Performance hurdle takes into account share price appreciation plus reinvested dividends, expressed as a percentage of investment and adjusted for changes in the Company’s capital structure.
Performance rights will vest if the Company’s TSR over the performance period is at or above the 51st percentile against the constituents of the ASX Consumer Discretionary Index at each grant date, excluding News Corporation.
The comparator group represents a range of alternative companies that shareholders could invest in while maintaining portfolio sector balance. News Corporation has been excluded from each comparative group given the extent of its international business operations.
TSR Performance % of allocation that vestsBelow 51st percentile Nil51st percentile 50%51st to 75th percentile Straight‑line vesting between 50% and 100%At or above 75th percentile 100%
Grants made under the LTI plans in operation before 2015 included both executive KMP and other senior executives, had performance periods of three or four years, and will vest based on satisfaction of TSR performance criteria only. Performance rights granted under these plans have now reached their vesting dates.
Is there a gateway? The ROIC Performance hurdle will be achieved only if the Company’s adjusted ROIC performance in the final year of the performance period is at or above a threshold set by the Board at the time of making the relevant LTI grant. The ROIC Performance hurdle for grants made in FY2018 will be achieved if the Company’s adjusted ROIC performance in FY2020 is at or above 10.1%.
The Absolute EPS Performance hurdle will be achieved only if the Company’s EPS performance over the performance period is at or above 3% CAGR.
The Relative TSR Performance hurdle will be achieved only if the Company’s relative TSR over the performance period is at or above the 51st percentile of the comparator group.
What is the maximum amount payable?
The maximum award under the LTI plan is 100% of an executive’s grant if all vesting conditions are fully satisfied over the performance period.
How is performance assessed?
The Board will calculate the Company’s ROIC and EPS Performance at the end of the performance period for each LTI grant by reference to the Company’s accounting records and the Company’s audited financial reports. The Company may engage an independent consultant to review or carry out these calculations.
The Group engages Deloitte to report on the Company’s TSR ranking within the comparator group as defined in each of the LTI plans at each relevant vesting date.
There is no re‑testing of performance hurdles under the LTI plan.Cessation of employment “Bad Leavers” (who resign or are terminated for cause) will forfeit any unvested performance rights, unless
otherwise determined by the Board.
For executives who cease employment for other reasons, the Board has discretion to vest any unvested performance rights on a pro‑rata basis taking into account time and the current level of performance against the performance hurdle, or to hold the LTI award to be tested against performance hurdles at the end of the original vesting period.
Change of control In the event of a change of control before vesting of an LTI award, the Board has discretion as to how to treat the unvested award, including to determine that the award will vest or lapse in whole or in part, or that it will continue subject to the same or different conditions.
Clawback The Board has discretion to reduce the benefit of an LTI award to the extent its vesting was affected by fraud, dishonesty, breach of obligation or other action likely to result in long‑term detriment to the Company.
Other features Treatment of dividends: There are no dividends payable to participants on unvested performance rights. Once performance rights have vested to fully paid ordinary shares, the participant will be entitled to dividends on these shares.
Sourcing of shares: The Board has discretion to purchase shares on‑market or to issue new shares in respect of vested performance rights.
43Southern Cross Austereo . Annual Report

REMUNERATION REPORTFOR YEAR ENDED 30 JUNE 2017
2.4 Consequences of performance on shareholder valueIn considering the Group’s performance and the benefits for shareholder value, the Board has regard to the following indicators in the current financial year and the preceding four financial years.
30 June 2017$’000
30 June 2016$’000
30 June 2015$’000
30 June 2014$’000
30 June 2013$’000
Revenue 687,244 639,555 611,120 640,834 653,114EBITDA 177,393 167,722 163,262 179,705 210,991EBITDA % 25.8% 26.2% 26.7% 28.0% 32.3%Net profit before tax 127,738 114,177 (265,216) (279,577) 133,269Net profit after tax (“NPAT”) 108,563 77,243 (284,950) (296,008) 96,111NPAT % 15.8% 12.0% (46.6%) (46.2%) 14.7%Net profit after tax excluding significant items 108,563 77,243 64,783 79,629 96,111NPAT % excluding significant items 15.8% 12.0% 10.6% 12.4% 14.7%EPS (cents)1 12.20 10.12 8.93 11.29 13.64ROIC2 10.1% 9.1% n/a n/a n/a
30 June 2017 30 June 2016 30 June 2015 30 June 2014 30 June 2013Opening share price $1.25 $0.97 $1.07 $1.43 $1.20Closing share price $1.25 $1.25 $0.97 $1.07 $1.43Dividend/Distribution 7.25c 6.25c 6.0c 7.5c 9.0c
1 EPS is shown after adjustments to exclude the impact of significant or non‑recurring items (both income and costs) as approved by the Board for the purposes of the Company’s LTI plan.
2 ROIC is calculated in accordance with the principles outline in section 2.3.2. It has not been calculated for periods earlier than 2016 because of impairments recorded in those years.
2.5 Executive service contractsThe Company has entered into service contracts setting out the terms of employment of each executive KMP. All service contracts are for an indefinite term, subject to termination by either party on six months’ notice (12 weeks’ notice in the case of Rick Lenarcic). In recognition that Vijay Solanki had relocated from overseas to join the Company, his service contract included provision for termination on 12 months’ notice. Each executive service contract provides for the payment of base salary and participation in the Company’s STI and LTI plans, along with other prescribed non‑monetary benefits.
2.6 Services from remuneration consultantsDuring the year, the Committee engaged Juno Partners as an independent expert consultant to review the Company’s LTI plan. This review included recommendations about the performance conditions and vesting range for grants made under the LTI plan. As explained in this Remuneration Report, the Board decided following the review to remove relative total shareholder return (TSR) as a performance condition for grants to be made under the LTI plan in FY2018. Those grants will have two equally weighted performance hurdles: growth in earnings per share (EPS) and a new measure, return on invested capital (ROIC). The LTI plan will continue to have a three‑year performance period. Juno Partners was paid $42,594 for its services in 2017.
Deloitte was engaged during the year to assess the performance of the Company’s LTI plans as at each vesting date and, for this purpose, to determine the Group’s TSR ranking within the comparator group and EPS growth over the applicable performance periods. Deloitte was paid $12,600 for these services.
During 2016, the Committee engaged KPMG to provide an independent report benchmarking the remuneration of the Company’s executive KMP and its non‑executive directors. The remuneration of the Company’s executive KMP and non‑executive directors was adjusted following consideration of that benchmarking report. The Committee did not seek benchmarking advice during 2017.
44 Southern Cross Austereo . Annual Report

2.7 Remuneration of non-executive directorsThe Company enters into a letter of appointment with each non‑executive director. The letter sets out the Board’s expectations for non‑executive directors and the remuneration payable to non‑executive directors.
The maximum annual aggregate fee pool for non‑executive directors is $1,500,000. This was approved by shareholders at the 2011 Annual General Meeting.
The Chairman and the Deputy Chairman receive a fixed aggregate fee. Other non‑executive directors receive a base fee for acting as a director and additional fees for participation as chair or as a member of the Board’s committees. Non‑executive directors do not receive performance‑based fees and are not entitled to retirement benefits as part of their fees.
Following consideration of the benchmarking report prepared by KPMG in 2016, the Board’s base and committee fees will be increased by 3% in 2018 and 2019. The Committee intends to obtain a further benchmarking report in 2020. The number of non‑executive directors reduced from seven to six during the year and the aggregate remuneration of non‑executive directors in 2018 will be less than in 2017.
The table below sets out the fees for non‑executive directors that applied in 2016 and 2017 and those that will apply in 2018.
2016$
2017$
2018$
Base fees – AnnualChairman1 250,000 265,000 273,000Deputy Chairman1 161,500 171,000 176,000Other Non‑Executive Directors 125,000 132,500 136,500Committee fees – AnnualAudit & Risk Committee – Chairman 21,000 22,500 23,000Audit & Risk Committee – member 14,000 15,000 15,500People & Culture Committee – Chairman1 15,000 16,000 16,500People & Culture Committee – member 10,000 10,500 11,000Nomination Committee – Chairman1 15,000 16,000 16,500Nomination Committee – member 10,000 10,500 11,000
1 The Chairman and Deputy Chairman do not receive any additional fees for committee work. Accordingly, the fees set out above for Chair of the Nomination Committee and the People & Culture Committee respectively were not paid during 2016, 2017 or 2018.
45Southern Cross Austereo . Annual Report

REMUNERATION REPORTFOR YEAR ENDED 30 JUNE 2017
3. Remuneration of executive KMP and directors during the year3.1 Executive KMPThe table below sets out the nature and amount of each major element of the remuneration of each executive KMP in 2017 and 2016.
Executive Year
Short-term employee benefitsPost-
employment
Longservice
leave1
Term-ination
benefits
Share-based
payments Total
Perfor-mance-related
proportion
Salary and fees
$
STI cash bonus2
$
Non- monetary
$Total
$
Super con-tribution
$ $ $
Perfor-mance rights3
$ $ %Grant Blackley Chief Executive Officer and Managing Director
2017 1,121,884 705,240 4,315 1,831,439 19,616 – – 370,000 2,221,055 48.4
2016 1,098,501 500,000 3,866 1,602,367 19,308 – – 100,000 1,721,675 34.8Nick McKechnie Chief Financial Officer
2017 512,384 163,548 3,494 679,426 19,616 – – 84,000 783,042 31.6
2016 500,000 150,000 2,807 652,807 19,308 – – 220,0005 892,115 41.5John Kelly6
Chief Operating Officer
2017 528,384 159,942 4,315 692,641 19,616 – – 61,000 773,257 28.6
2016 214,872 58,330 844 274,046 9,654 – – – 283,700 20.6Brian Gallagher Chief Sales Officer
2017 512,384 130,390 4,315 647,089 19,616 – – 92,333 759,038 29.3
2016 481,884 150,000 3,669 635,553 19,308 – – 33,333 688,194 26.6Guy Dobson Chief Creative Officer
2017 633,530 58,333 4,315 696,178 19,616 11,629 – 58,333 785,756 18.1
2016 633,530 59,580 5,146 698,256 19,308 10,574 – 98,608 826,746 19.1Rick Lenarcic Head of Regional Media
2017 389,384 79,200 25,043 493,627 19,616 1,026 – 67,500 581,769 25.2
2016 359,545 96,700 25,178 481,423 19,308 20,638 – 86,109 607,478 30.1Vijay Solanki4 Chief Digital Enablement Officer
2017 – – – – – – – – – –
2016 351,500 24,000 5,146 380,646 23,876 – 294,531 33,333 732,386 7.8
Total executive KMP
2017 3,697,950 1,296,653 45,797 5,040,400 117,696 12,655 – 733,166 5,903,917 34.42016 3,639,832 1,038,610 46,656 4,725,098 130,070 31,212 294,531 571,383 5,752,294 28.0
1 Long service leave relates to amounts accrued during the year.2 The STI bonus is for performance during the year using the criteria set out on page 40. The amount was finally determined by the Board on 23 August 2017 after
considering recommendations of the People & Culture Committee. 3 The fair value of the performance rights granted during the year was determined by the Company’s independent consultant, Deloitte. In accordance with the applicable
accounting standards, AASB 2 “Share‑based Payment” and AASB 124 “Related Party Disclosures”, Deloitte used a Monte Carlo simulation model for the Relative TSR performance rights and a Black‑Scholes‑Merton model for the Absolute EPS performance rights. The value disclosed is the portion of the fair value of the rights recognised as an expense in each reporting period.
4 Vijay Solanki resigned with effect from 30 June 2016. His former position of Chief Digital Enablement Officer has not been replaced.5 Share‑based payments made to Nick McKechnie in 2016 included a retention bonus of $120,000. This was constituted by the grant of 117,878 performance rights in
accordance with the LTI plan.6 John Kelly commenced on 1 February 2016. His 2016 remuneration is disclosed only for the period he was a KMP.
46 Southern Cross Austereo . Annual Report

3.2 Non-executive directorsThe table below sets out the nature and amount of each major element of the remuneration of each non‑executive director in 2017 and 2016.
Non-executive director1 Year
Short-term employee benefitsPost-
employment TotalSalary
and fees$
Non-monetary$
Total$
Super contribution
$ $Peter Bush 2017 245,384 – 245,384 19,616 265,000Chairman 2016 230,692 – 230,692 19,308 250,000Leon Pasternak 2017 156,164 – 156,164 14,836 171,000Deputy Chairman 2016 147,488 – 147,488 14,012 161,500Glen Boreham 2017 134,704 – 134,704 12,796 147,500Non-executive director 2016 126,027 – 126,027 11,973 138,000Peter Harvie 2017 97,944 – 97,944 9,306 107,250Non-executive director 2016 123,288 – 123,288 11,712 135,000Rob Murray 2017 140,184 – 140,184 13,316 153,500Non-executive director 2016 133,333 – 133,333 12,667 146,000Helen Nash 2017 144,292 – 144,292 13,708 158,000Non-executive director 2016 126,940 – 126,940 12,060 139,000Melanie Willis 2017 151,140 – 151,140 14,360 165,500Non-executive director 2016 13,187 – 13,187 1,253 14,440Chris de Boer 2017 – – – – –Former non-executive director 2016 130,592 – 130,592 12,408 143,000Kathy Gramp 2017 – – – – –Former non-executive director 2016 136,072 – 136,072 12,928 149,000Total 2017 1,069,812 – 1,069,812 97,938 1,167,750
2016 1,167,619 – 1,167,619 108,321 1,275,940
A number of non‑executive directors did not hold their roles for the full financial year in 2016 or 2017. Remuneration is only disclosed for the time they were non‑executive directors in each year. Chris de Boer resigned on 26 May 2016. Kathy Gramp resigned on 21 June 2016. Peter Harvie resigned on 28 March 2017.
47Southern Cross Austereo . Annual Report

REMUNERATION REPORTFOR YEAR ENDED 30 JUNE 2017
4. Analysis of short-term incentives included in remuneration4.1 STI performance outcomesThe table below summaries the KPIs applicable for each KMP for FY2017 and the performance achieved.
KMP
Profitability and financial performance
High level operational improvements
Cultural and behavioural influences
40% 40% 20%Measure Performance Measure Performance Measure Performance
Grant Blackley Group NPAT
Group costs
Strategy
62% achieved
Achieved
Achieved
Improve radio assets, digital strategy, sales strategy
86.7% achieved Consistent leadership across business reputation with key stakeholders, cultural survey change management
Achieved
Nick McKechnie Group NPAT
Group costs
Strategy
62% achieved
Achieved
Achieved
Cost improvements in key areas, asset sales, TV playout strategy
Achieved Leadership on fiscal management, cultural survey change management, reputation with investors
Achieved
John Kelly Group NPAT
Sales systems
Technology investment
62% achieved
Achieved
Achieved
Metro controllable costs, major project group structure, digital audio/podcasting, digital strategy
87.5% achieved1 Personal development plan, cultural survey change management
Achieved
Brian Gallagher Group revenue
Sales department costs
25% achieved2
Achieved
Metro radio new business strategy, regional media growth strategy, metro radio power ratio
86.7% achieved Personal development plan, cultural survey change management, strong and respected sales culture
Achieved
Guy Dobson Group EBITDA
Sydney Hit Breakfast ratings
Triple M audience share
Not achieved
Not achieved
Not achieved
Regional radio rebranding, integration/promotion of digital assets, news publishing structure
Achieved Integration of metro/regional radio teams, cultural survey change management
91.7% achieved
Rick Lenarcic Group EBITDA
Regional EBITDA
Regional TV local revenue
Not achieved
Not achieved
97.5% achieved
Regional cost management, regional asset sales/TV playout strategy, respected voice in regional markets
93.3% achieved Regional customer satisfaction, mentoring direct reports/build diversity, cultural survey change management
81.7% achieved
1 The target for metro controllable costs was not achieved due largely to higher than forecast costs associated with renegotiation of certain key contracts. The Board exercised its discretion to award 50% for the applicable KPI for John Kelly in recognition of the longer‑term benefits resulting from renegotiation of these key contracts.
2 The target for Group revenue was not achieved. Group revenue was 7% higher than in FY2016 which, despite being short of the target, was a strong achievement in a year of significant change and uncertainty as a result of the transition from the Ten Network to the Nine Network in three of the four aggregated markets on the eastern seaboard. In recognition of these achievements, the Board exercised its discretion to award 25% for the applicable KPI for Brian Gallagher.
48 Southern Cross Austereo . Annual Report
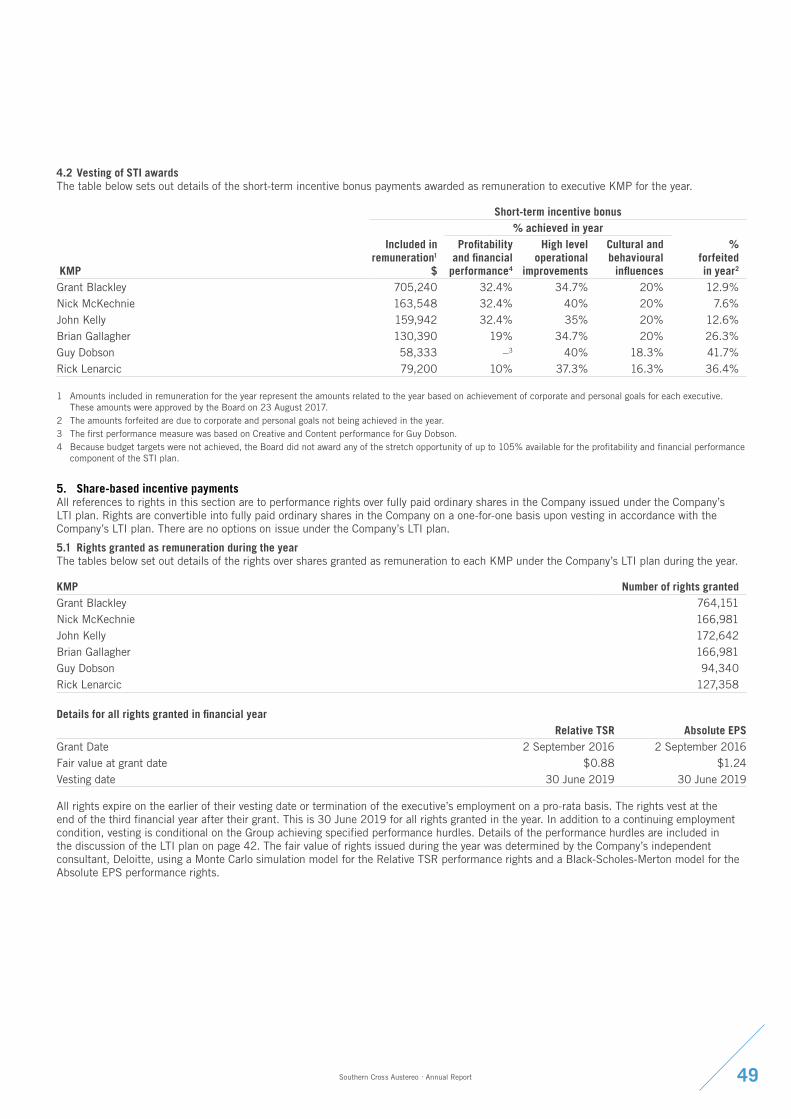
4.2 Vesting of STI awardsThe table below sets out details of the short‑term incentive bonus payments awarded as remuneration to executive KMP for the year.
KMP
Short-term incentive bonus
Included in remuneration1
$
% achieved in year%
forfeited in year2
Profitability and financial
performance4
High level operational
improvements
Cultural and behavioural
influencesGrant Blackley 705,240 32.4% 34.7% 20% 12.9%Nick McKechnie 163,548 32.4% 40% 20% 7.6%John Kelly 159,942 32.4% 35% 20% 12.6%Brian Gallagher 130,390 19% 34.7% 20% 26.3%Guy Dobson 58,333 –3 40% 18.3% 41.7%Rick Lenarcic 79,200 10% 37.3% 16.3% 36.4%
1 Amounts included in remuneration for the year represent the amounts related to the year based on achievement of corporate and personal goals for each executive. These amounts were approved by the Board on 23 August 2017.
2 The amounts forfeited are due to corporate and personal goals not being achieved in the year.3 The first performance measure was based on Creative and Content performance for Guy Dobson.4 Because budget targets were not achieved, the Board did not award any of the stretch opportunity of up to 105% available for the profitability and financial performance
component of the STI plan.
5. Share-based incentive paymentsAll references to rights in this section are to performance rights over fully paid ordinary shares in the Company issued under the Company’s LTI plan. Rights are convertible into fully paid ordinary shares in the Company on a one‑for‑one basis upon vesting in accordance with the Company’s LTI plan. There are no options on issue under the Company’s LTI plan.
5.1 Rights granted as remuneration during the yearThe tables below set out details of the rights over shares granted as remuneration to each KMP under the Company’s LTI plan during the year.
KMP Number of rights grantedGrant Blackley 764,151Nick McKechnie 166,981John Kelly 172,642Brian Gallagher 166,981Guy Dobson 94,340Rick Lenarcic 127,358
Details for all rights granted in financial yearRelative TSR Absolute EPS
Grant Date 2 September 2016 2 September 2016Fair value at grant date $0.88 $1.24Vesting date 30 June 2019 30 June 2019
All rights expire on the earlier of their vesting date or termination of the executive’s employment on a pro‑rata basis. The rights vest at the end of the third financial year after their grant. This is 30 June 2019 for all rights granted in the year. In addition to a continuing employment condition, vesting is conditional on the Group achieving specified performance hurdles. Details of the performance hurdles are included in the discussion of the LTI plan on page 42. The fair value of rights issued during the year was determined by the Company’s independent consultant, Deloitte, using a Monte Carlo simulation model for the Relative TSR performance rights and a Black‑Scholes‑Merton model for the Absolute EPS performance rights.
49Southern Cross Austereo . Annual Report
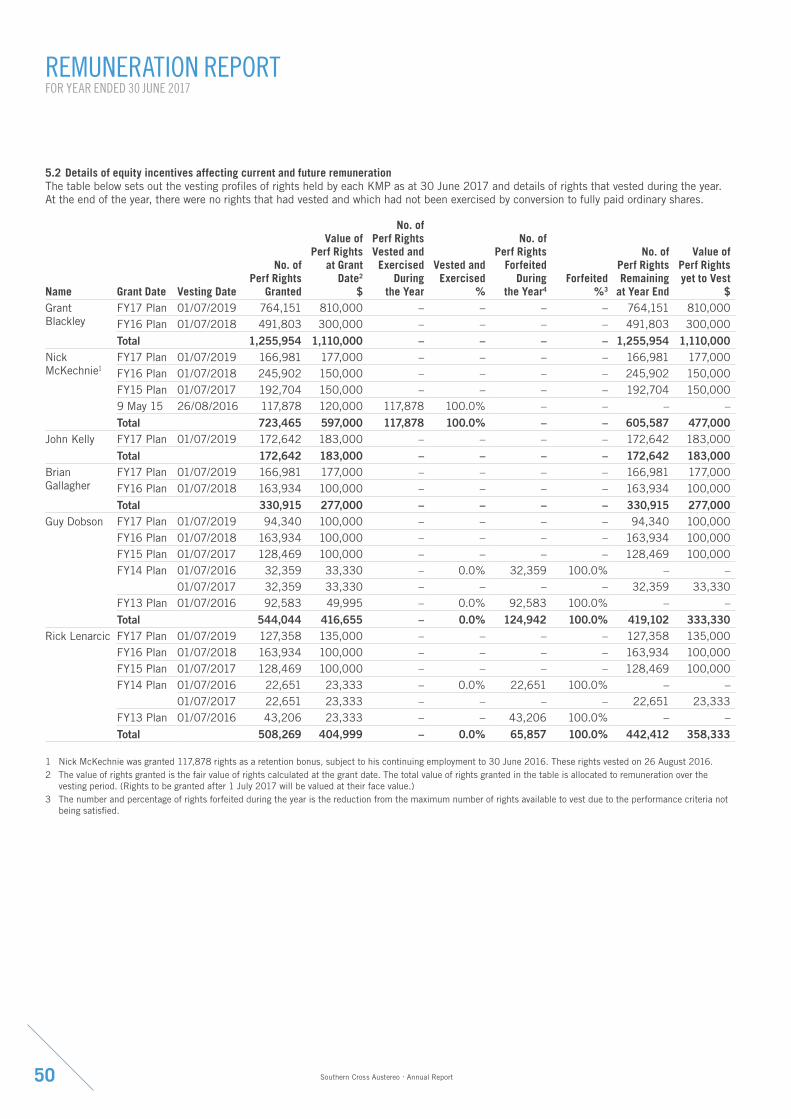
REMUNERATION REPORTFOR YEAR ENDED 30 JUNE 2017
5.2 Details of equity incentives affecting current and future remunerationThe table below sets out the vesting profiles of rights held by each KMP as at 30 June 2017 and details of rights that vested during the year. At the end of the year, there were no rights that had vested and which had not been exercised by conversion to fully paid ordinary shares.
Name Grant Date Vesting Date
No. of Perf Rights
Granted
Value of Perf Rights
at Grant Date2
$
No. of Perf Rights Vested and Exercised
During the Year
Vested and Exercised
%
No. of Perf Rights
Forfeited During
the Year4Forfeited
%3
No. of Perf Rights Remaining
at Year End
Value of Perf Rights yet to Vest
$Grant Blackley
FY17 Plan 01/07/2019 764,151 810,000 – – – – 764,151 810,000FY16 Plan 01/07/2018 491,803 300,000 – – – – 491,803 300,000Total 1,255,954 1,110,000 – – – – 1,255,954 1,110,000
Nick McKechnie1
FY17 Plan 01/07/2019 166,981 177,000 – – – – 166,981 177,000FY16 Plan 01/07/2018 245,902 150,000 – – – – 245,902 150,000FY15 Plan 01/07/2017 192,704 150,000 – – – – 192,704 150,0009 May 15 26/08/2016 117,878 120,000 117,878 100.0% – – – –Total 723,465 597,000 117,878 100.0% – – 605,587 477,000
John Kelly FY17 Plan 01/07/2019 172,642 183,000 – – – – 172,642 183,000Total 172,642 183,000 – – – – 172,642 183,000
Brian Gallagher
FY17 Plan 01/07/2019 166,981 177,000 – – – – 166,981 177,000FY16 Plan 01/07/2018 163,934 100,000 – – – – 163,934 100,000Total 330,915 277,000 – – – – 330,915 277,000
Guy Dobson FY17 Plan 01/07/2019 94,340 100,000 – – – – 94,340 100,000FY16 Plan 01/07/2018 163,934 100,000 – – – – 163,934 100,000FY15 Plan 01/07/2017 128,469 100,000 – – – – 128,469 100,000FY14 Plan 01/07/2016 32,359 33,330 – 0.0% 32,359 100.0% – –
01/07/2017 32,359 33,330 – – – – 32,359 33,330FY13 Plan 01/07/2016 92,583 49,995 – 0.0% 92,583 100.0% – –Total 544,044 416,655 – 0.0% 124,942 100.0% 419,102 333,330
Rick Lenarcic FY17 Plan 01/07/2019 127,358 135,000 – – – – 127,358 135,000FY16 Plan 01/07/2018 163,934 100,000 – – – – 163,934 100,000FY15 Plan 01/07/2017 128,469 100,000 – – – – 128,469 100,000FY14 Plan 01/07/2016 22,651 23,333 – 0.0% 22,651 100.0% – –
01/07/2017 22,651 23,333 – – – – 22,651 23,333FY13 Plan 01/07/2016 43,206 23,333 – – 43,206 100.0% – –Total 508,269 404,999 – 0.0% 65,857 100.0% 442,412 358,333
1 Nick McKechnie was granted 117,878 rights as a retention bonus, subject to his continuing employment to 30 June 2016. These rights vested on 26 August 2016. 2 The value of rights granted is the fair value of rights calculated at the grant date. The total value of rights granted in the table is allocated to remuneration over the
vesting period. (Rights to be granted after 1 July 2017 will be valued at their face value.)3 The number and percentage of rights forfeited during the year is the reduction from the maximum number of rights available to vest due to the performance criteria not
being satisfied.
50 Southern Cross Austereo . Annual Report

5.3 Vesting of rights during the yearThe only vesting condition for each grant of rights with a vesting date of 1 July 2016 was the Company’s relative TSR performance against companies in the comparator group over the vesting period. As indicated in the table above, the vesting condition for each of these grants was not achieved. A summary of the Company’s relative TSR performance over the vesting period for each of these grants, as provided by the Company’s independent consultant, Deloitte, is provided below.
Grant TSR Percentile ranking TSR % vestedFY2013 – Tranche 4 17.0 0%FY2014 – Tranche 3 27.0 0%
5.4 Vesting of rights as at 1 July 2017The fourth and final tranche of performance rights granted under the FY2014 plan and the performance rights granted under the FY2015 plan were eligible for vesting as at 30 June 2017. The FY2014 plan had a sole performance condition, which was the Company’s relative TSR performance over the relevant four‑year performance period. The FY2015 plan had two equally weighted performance conditions, the Company’s relative TSR performance and growth in the Company’s earnings per share (EPS) over the relevant three‑year performance period. The Company received a report from Deloitte relating to the TSR performance conditions for each of these grants. A summary of the Company’s relative TSR performance over the vesting period for each of these grants is provided below. The EPS performance condition did not vest because the Company’s EPS grew at a CAGR of 2.6% over the three‑year performance period. This was less than the vesting gateway of 3%. The grants that have vested will be included in the remuneration of participating executives in 2018.
Grant TSR Percentile ranking TSR % vestedFY2014 – Tranche 4 35th percentile 0%FY2015 – Tranche 3 56th percentile 60%
6. Payments to executives before taking officeThere were no payments made during the year to any person as part of the consideration for the person taking office.
7. Transactions with KMP7.1 Loans to KMPThere were no loans made to KMP or their related parties during the year.
7.2 Other transactions and balances with KMPThere were no other transactions with KMP or their related parties during the year.
8. KMP shareholdingsThe table below sets out the movements in shares held directly or indirectly by KMP during the year.
Balance at
start of year
Received during the year on exercise of
performance rightsOther changes during the year
Balance at end of year
Non-executive directorsPeter Bush – – 60,000 60,000Leon Pasternak 1,185,215 – – 1,185,215Glen Boreham 95,000 – – 95,000Rob Murray 50,000 – – 50,000Helen Nash 52,573 – – 52,573Melanie Willis – – 34,670 34,670
1,382,788 94,670 1,477,458ExecutivesGrant Blackley – – – –Nick McKechnie 26,760 117,878 (68,260) 76,378John Kelly – – – –Brian Gallagher – – – –Guy Dobson – – – –Rick Lenarcic – – – –
26,760 117,878 (68,260) 76,378
51Southern Cross Austereo . Annual Report

REMUNERATION REPORTFOR YEAR ENDED 30 JUNE 2017
A copy of the Auditor’s Independence Declaration, as required under s307C of the Corporations Act 2001, is set out on page 53.
This report is signed in accordance with resolutions of the Directors of Southern Cross Media Group Limited.
Peter Bush Leon Pasternak Chairman Deputy Chairman Southern Cross Media Group Limited Southern Cross Media Group Limited Sydney, Australia Sydney, Australia 24 August 2017 24 August 2017
52 Southern Cross Austereo . Annual Report

AUDITOR’S INDEPENDENCE DECLARATION
Auditor’s Independence Declaration
As lead auditor for the audit of Southern Cross Media Group Limited for the year ended 30 June 2017, I declare that to the best of my knowledge and belief, there have been:
(a) no contraventions of the auditor independence requirements of the Corporations Act 2001 in relation to the audit; and
(b) no contraventions of any applicable code of professional conduct in relation to the audit.
This declaration is in respect of Southern Cross Media Group Limited and the entities it controlled during the period.
Sam LobleyPartnerPricewaterhouseCoopers
Melbourne24 August 2017
PricewaterhouseCoopers, ABN 52 780 433 7572 Riverside Quay, SOUTHBANK VIC 3006, GPO Box 1331, MELBOURNE VIC 3001T: 61 3 8603 1000, F: 61 3 8603 1999, www.pwc.com.au
Liability limited by a scheme approved under Professional Standards Legislation.
53Southern Cross Austereo . Annual Report

Note
Consolidated2017
$’0002016
$’000Revenue from continuing operations 3 687,244 639,555Broadcast and production costs (131,394) (111,627)Employee expenses (200,514) (184,336)Selling costs (83,034) (79,908)Occupancy costs (31,702) (30,966)Promotions and marketing (19,584) (19,004)Administration costs (47,692) (49,012)Other income 4 3,559 2,734Share of net profit/(losses) of investments accounted for using the equity method 17 510 286Profit before depreciation, amortisation, interest, impairment, fair value movements on financial derivatives and income tax expenses for the year from continuing operations 177,393 167,722Depreciation and amortisation expense (30,870) (28,850)Interest expense and other borrowing costs 15 (19,510) (26,029)Interest revenue 725 1,334Profit before income tax expense for the year from continuing operations 127,738 114,177Income tax expense from continuing operations 5 (19,175) (36,934)Profit from continuing operations after income tax expense for the year 108,563 77,243Other comprehensive income that may be reclassified to profit or loss:Changes to fair value of cash flow hedges, net of tax 472 (1,080)Total comprehensive profit for the year attributable to shareholders 109,035 76,163
Earnings per share attributable to the ordinary equity holders of the Company:Basic earnings per share (cents) 13 14.12 10.12Diluted earnings per share (cents) 13 14.07 10.10
The above Statement of Comprehensive Income should be read in conjunction with the accompanying notes.
STATEMENT OF COMPREHENSIVE INCOMEFOR YEAR ENDED 30 JUNE 2017
Statement of Comprehensive Income
54 Southern Cross Austereo . Annual Report

Note
Consolidated2017
$’0002016
$’000Current assetsCash and cash equivalents 48,978 94,776Receivables 10 158,010 142,003Total current assets 206,988 236,779Non-current assetsReceivables 10 2,964 2,677Investments accounted for using the equity method 17 5,167 3,657Property, plant and equipment 6 136,178 145,249Intangible assets 7 1,248,955 1,289,509Total non-current assets 1,393,264 1,441,092Total assets 1,600,252 1,677,871Current liabilitiesPayables 10 81,042 86,388Deferred income 10 9,477 12,590Provisions 10 19,730 19,347Borrowings 15 86 36,930Current tax liabilities 3,942 9,109Derivative financial instruments 16 1,651 ‑Total current liabilities 115,928 164,364Non-current liabilitiesDeferred income 10 91,945 95,278Provisions 10 10,134 11,839Borrowings 15 368,762 432,891Deferred tax liability 5 361,438 373,678Derivative financial instruments 16 948 3,273Total non-current liabilities 833,227 916,959Total liabilities 949,155 1,081,323Net assets 651,097 596,548EquityContributed equity 14 1,379,736 1,379,386Reserves 3,851 2,462Other equity transaction 14 (77,406) (77,406)Accumulated losses (655,382) (708,192)Equity attributable to equity holders 650,799 596,250Non‑controlling interest 298 298Total equity 651,097 596,548
The above Statement of Financial Position should be read in conjunction with the accompanying notes.
STATEMENT OF FINANCIAL POSITIONAS AT 30 JUNE 2017
Statement of Financial Position
55Southern Cross Austereo . Annual Report

2017
Contributed equity $’000
Share-based payment reserve
$’000
Hedge reserve
$’000
Other equity transactions
$’000
(Accumulated losses)/retained
profits $’000
Total $’000
Non-controlling
interest $’000
Total equity $’000
Total equity at 1 July 2016 1,379,386 4,754 (2,292) (77,406) (708,192) 596,250 298 596,548Profit for the year – – – – 108,563 108,563 – 108,563 Other comprehensive income – – 472 – – 472 – 472Total comprehensive income – – 472 – 108,563 109,035 – 109,035
Transactions with equity holders in their capacity as equity holders:Employee share entitlements – 917 – – – 917 – 917Shares issued, net of transaction costs 350 – – – – 350 – 350Dividends paid – – – – (55,753) (55,753) – (55,753) 350 917 – – (55,753) (54,486) – (54,486)Total equity at 30 June 2017 1,379,736 5,671 (1,820) (77,406) (655,382) 650,799 298 651,097
2016
Contributed equity $’000
Share-based payment reserve
$’000
Hedge reserve
$’000
Other equity transactions
$’000
(Accumulated losses)/retained
profits $’000
Total $’000
Non-controlling
interest $’000
Total equity $’000
Total equity at 1 July 2015 1,365,110 4,226 (1,212) (77,406) (354,244) 936,474 298 936,772 Change in accounting policy (refer note 1) – – – – (383,600) (383,600) – (383,600)Revised total equity at 1 July 2015 1,365,110 4,226 (1,212) (77,406) (737,844) 552,874 298 553,172
Profit for the year – – – – 77,243 77,243 – 77,243 Other comprehensive income – – (1,080) – – (1,080) – (1,080)Total comprehensive income – – (1,080) – 77,243 76,163 – 76,163
Transactions with equity holders in their capacity as equity holders:Employee share entitlements – 528 – – – 528 – 528Shares issued, net of transaction costs 14,276 – – – – 14,276 – 14,276Dividends paid – – – – (47,591) (47,591) – (47,591) 14,276 528 – – (47,591) (32,787) – (32,787)Total equity at 30 June 2016 1,379,386 4,754 (2,292) (77,406) (708,192) 596,250 298 596,548
The above Statement of Changes in Equity should be read in conjunction with the accompanying notes.
STATEMENT OF CHANGES IN EQUITYFOR YEAR ENDED 30 JUNE 2017
56 Southern Cross Austereo . Annual Report

Note
Consolidated
2017$’000
2016$’000
Cash flows from operating activitiesReceipts from customers 741,340 793,755Payments to suppliers and employees (589,401) (538,508)Interest received from external parties 725 1,334Tax paid (36,423) (32,843)Net cash inflows from operating activities 9 116,241 223,738Cash flows from investing activitiesPayments for purchase of property, plant and equipment (30,086) (23,262)Payments for purchase of intangibles (7,196) (69)Proceeds from sale of property, plant and equipment 1,088 14,217Proceeds from sale of operations and assets 53,817 1,924Payments for purchase of investments (1,000) – Net cash flows used in investing activities 16,623 (7,190)Cash flows from financing activitiesDividends paid to security holders (55,753) (33,680)Net (repayment) of/proceeds from receivables financing facility (36,801) 14,640Repayment of borrowings from external parties (65,000) (215,000)Interest paid to external parties (20,937) (30,485)Payments for finance leases (171) (298)Net cash flows used in financing activities (178,662) (264,823)Net decrease in cash and cash equivalents (45,798) (48,275)Cash assets at the beginning of the year 94,776 143,051Cash assets at the end of the year 48,978 94,776
The above Statement of Cash Flows should be read in conjunction with the accompanying notes.
STATEMENT OF CASH FLOWSFOR YEAR ENDED 30 JUNE 2017
57Southern Cross Austereo . Annual Report

NOTES TO THE FINANCIAL STATEMENTSFOR YEAR ENDED 30 JUNE 2017
Key Numbers Capital Management Group Structure Other
1. Summary of Significant Accounting Policies
11. Capital Management Objectives
17. Non‑Current Assets – Investments Accounted for Using the Equity Method
20. Share‑Based Payments
2. Segment Information 12. Dividends Paid and Proposed
18. Subsidiaries 21. Remuneration of Auditors
3. Revenue 13. Earnings per Share 19. Parent Entity Financial Information
22. Related Party Disclosures
4. Other Income 14. Contributed Equity and Reserves
23. Leases and Other Commitments
5. Income Tax Expense 15. Borrowings 24. Events Occurring after Balance Date
6. Non‑Current Assets – Property, Plant and Equipment
16. Financial Risk Management
25. Other Accounting Policies
7. Non‑Current Assets – Intangible Assets
8. Impairment
9. Reconciliation of Profit after Income Tax to Net Cash Inflow from Operating Activities
10. Receivables, Payables, Deferred Income and Provisions
58 Southern Cross Austereo . Annual Report

Key Numbers1. Summary of Significant Accounting PoliciesThe principal accounting policies adopted in the preparation of these consolidated financial statements are set out below. In addition, significant and other accounting policies that summarise the measurement basis used and that are relevant to an understanding of the financial statements are provided throughout the notes to the financial statements. These policies have been consistently applied to all the years presented, unless otherwise stated. The financial statements are for the consolidated entity consisting of Southern Cross Media Group Limited (“the Company”) and its subsidiaries (“the Group”).
Basis of preparationThis general purpose financial report has been prepared in accordance with Australian Accounting Standards and the Corporations Act 2001 (where applicable). The Group is a for‑profit entity for the purpose of preparing the financial statements.
Information in respect of the parent entity in this financial report relates to Southern Cross Media Group Limited.
i) Compliance with IFRSCompliance with Australian Accounting Standards ensures that the financial statements and notes of the Group comply with International Financial Reporting Standards (“IFRS”) as issued by the International Accounting Standards Board (“IASB”). Consequently this financial report has also been prepared in accordance with and complies with IFRS as issued by the IASB.
ii) Historical cost conventionThese financial statements have been prepared under the historical cost convention, as modified by the revaluation of certain financial assets and liabilities (including derivative instruments) at fair value through profit or loss. All amounts are presented in Australian dollars, unless otherwise noted.
iii) Comparative figuresWhere necessary, comparative figures have been adjusted to conform to changes in presentation in the current year.
a) Principles of consolidationThe consolidated financial statements incorporate the assets and liabilities of all subsidiaries of the Company as at 30 June 2017 and the results of all subsidiaries for the year then ended. Subsidiaries are all entities over which the Group has control. The Group controls an entity when the Group is exposed to, or has rights to, variable returns from its involvement with the entity and has the ability to affect those returns through its power to direct the activities of the entity. Subsidiaries are fully consolidated from the date on which control is transferred to the Group. The effects of all transactions between entities in the Group are eliminated in full.
The purchase method of accounting is used to account for the acquisition of subsidiaries by the Group except as follows: – At the time of Initial Public Offering (“IPO”) Southern Cross Media
Australia Holdings Pty Limited (“SCMAHL”) was deemed to be the accounting acquirer of both Southern Cross Media Group Limited (“SCMGL”) and Southern Cross Media Trust (“SCMT”), which was neither the legal parent nor legal acquirer; and
– This reflects the requirements of AASB 3 that in situations where an existing entity (SCMAHL) arranges to be acquired by a smaller entity (SCMGL) for the purposes of a stock exchange listing, the existing entity (SCMAHL) should be deemed to be the acquirer, subject to consideration of other factors such as management of the entities involved in the transaction and relative fair values of the entities involved in the transaction. This is commonly referred to as a reverse acquisition.
At the time of IPO, in November 2005, the reverse acquisition guidance of AASB 3 was applied to the Group and the cost of the Business Combination was deemed to be paid by SCMAHL to acquire SCMGL and SCMT. The cost was determined by reference to the fair value of the net assets of SCMGL and SCMT immediately prior to the Business Combination. The investment made by the legal parent SCMGL in SCMAHL to legally acquire the existing radio assets is eliminated on consolidation. In applying the guidance of AASB 3, this elimination results in a debit of $77.4 million to other equity transactions. This does not affect the Group’s distributable profits.
Rounding of amountsThe Company is of a kind referred to in ASIC Legislative Instrument 2016/191, relating to the “rounding off” of amounts in the Directors’ Report and Financial Report. Amounts have been rounded off in accordance with the Instrument to the nearest thousand dollars, unless otherwise indicated.
59Southern Cross Austereo . Annual Report

NOTES TO THE FINANCIAL STATEMENTSFOR YEAR ENDED 30 JUNE 2017
1. Summary of Significant Accounting Policies (continued)Critical accounting estimates and judgementsThe preparation of the financial report in accordance with Australian Accounting Standards requires the use of certain critical accounting estimates. It also requires management to exercise judgement in the process of applying the accounting policies. Estimates and judgements are continually evaluated and are based on historical experience and other factors, including expectations of future events that may have a financial impact on the entity and that are believed to be reasonable under the circumstances. Management believes the estimates used in the preparation of the financial report are reasonable. Actual results in the future may differ from those reported. Judgements and estimates which are material to the financial report are found in the following notes:
Note 7 Non‑Current Assets – Intangible Assets
Note 8 Impairment
Notes to the financial statementsThe notes to the financial statements have been restructured to make the financial report more relevant and readable, with a focus on information that is material to the operations, financial position and performance of the Group. Additional information has also been included where it is important for understanding the Group’s performance.
Notes relating to individual line items in the financial statements now include accounting policy information where it is considered relevant to an understanding of these items, as well as information about critical accounting estimates and judgements. Details of the impact of new accounting policies and all other accounting policy information are disclosed at the end of the financial report in note 25.
Change in accounting policyIn November 2016, the IFRS Interpretations Committee (“IFRIC”) issued an agenda decision regarding a request to clarify how an entity determines the expected manner of recovery of an intangible asset with an indefinite useful life for the purposes of measuring deferred tax in accordance with AASB 112 Income Taxes. Although the IFRIC decided not to add this issue to its agenda, it noted that the fact that an entity does not amortise an intangible asset with an indefinite useful life does not mean that it has an infinite life and that the entity will recover the carrying amount of that asset only through sale and not through use. Instead, entities will need to determine whether they expect to recover the carrying amounts of their indefinite lived intangibles through use or sale and reflect this in the measurement of the deferred tax balances.
In response to this clarification, the Group has reviewed the tax effect accounting for its licences, brands and tradenames. The Group previously assumed that the carrying amounts of these assets were expected to be recovered through sale given their indefinite life, which meant that the capital gains tax base was used, which resulted in a small deferred tax balance being recognised. The Group has now changed its accounting policy for deferred tax on intangible assets with indefinite useful lives and have measured deferred taxes assuming recovery through use. This has resulted in the recognition of an additional deferred tax liability given there are no tax deductions available for the use of the assets. As the intangible assets were acquired as part of business combinations in prior years, and there were prior year impairments of goodwill, the corresponding adjustments have been made to accumulated losses.
The following table summarises the impact of this change in accounting policy, which has been applied retrospectively, on the Group’s previously reported statement of financial position. The change in accounting policy did not have an impact on the previously reported statement of comprehensive income or statement of cash flows.
Dr/(Cr)
As previously reported
$’000
Effect of change
in policy$’000
As currently reported
$’000As at 1 July 2015Deferred tax assets 12,336 (12,336) –Deferred tax liabilities – (371,264) (371,264)Accumulated losses 354,244 383,600 737,844As at 30 June 2016Deferred tax assets 9,922 (9,922) –Deferred tax liabilities – (373,678) (373,678)Accumulated losses 324,592 383,600 708,192
60 Southern Cross Austereo . Annual Report

2. Segment InformationAASB 8 requires operating segments to be identified on the basis of internal reports about components of the Group that are regularly reviewed by the chief operating decision maker in order to allocate resources to the segments and to assess their performance.
Management has determined operating segments based on the information reported to the Group CEO and the Company Board of Directors. Management has determined that the Group has two operating segments being the Regional free‑to‑air commercial radio and television broadcasting segment and the Metro free‑to‑air radio broadcasting segment.
Metro Regional Corporate Consolidated2017
$’0002016
$’0002017
$’0002016
$’0002017
$’0002016
$’0002017
$’0002016
$’000Segment Revenue 247,163 242,253 417,890 382,267 22,191 15,035 687,244 639,555 EBITDA/Segment Result 60,070 51,437 125,857 131,150 (8,534) (14,865) 177,393 167,722EBITDA % of Revenue 24.3% 21.2% 30.1% 34.3% (38.5%) (98.9%) 25.8% 26.2%Impairment of intangibles and investments – – – – – – – – Depreciation and amortisation (6,515) (5,502) (14,213) (13,981) (10,142) (9,367) (30,870) (28,850)Statutory EBIT/Segment Result 53,555 45,935 111,644 117,169 (18,676) (24,232) 146,523 138,872Financing costs – – – – – – (18,785) (24,695)Income tax expense – – – – – – (19,175) (36,934) Profit for the year attributable to shareholders – – – – – – 108,563 77,243
3. RevenueThe profit before income tax from continuing operations included the following specific items of revenue:
Consolidated2017
$’0002016
$’000Revenue from continuing operationsSales revenue 681,283 632,993Rental revenue 5,961 6,562Total revenue from continuing operations 687,244 639,555
Recognition and MeasurementRevenues are recognised at fair value of the consideration received or receivable net of the amount of GST payable to the relevant taxation authority.
Sales revenueRevenue represents revenue earned primarily from the sale of television, radio and digital advertising airtime and related activities, including sponsorship and promotions. Revenue is recorded when the service is provided, being primarily when the advertisement is aired. Commissions payable to media agencies are recognised as selling costs. Other regular sources of operating revenue are derived from commercial production for advertisers, including facility sharing revenue and program sharing revenue. Revenue from commercial production is recognised on invoice, at the time of completion of the commercial.
61Southern Cross Austereo . Annual Report

NOTES TO THE FINANCIAL STATEMENTSFOR YEAR ENDED 30 JUNE 2017
4. Other Income
Consolidated2017
$’0002016
$’000Net gain from disposal of operations and assets 3,559 2,734Total other income 3,559 2,734
During the year the Group completed the sale of its Northern NSW television operation to the WIN Television Network and the sale of 45 transmission sites to Axicom Pty Ltd.
2017 $’000
2016 $’000
Net assets disposed (59,568) –Gross cash consideration 53,007 1,924Gross deferred consideration 10,120 810Net gain from disposal of operations and assets before tax 3,559 2,734
5. Income Tax ExpenseThe income tax expense for the financial year differs from the amount calculated on the net result from continuing operations. The differences are reconciled as follows:
Consolidated2017
$’0002016
$’000Income tax expenseCurrent taxCurrent tax on profits for the year 36,207 33,188Adjustments for current tax of prior periods (4,590) 870Total current tax expense 31,617 34,058Deferred income taxDecrease in net deferred tax assets (12,171) 3,372Adjustments for deferred tax of prior periods (271) (496)Total deferred tax expense (12,442) 2,876Reconciliation of income tax expense to prima facie tax payableProfit/(Loss) before income tax expense 127,738 114,177Tax at the Australian tax rate of 30% 38,321 34,253Tax effect of amounts which are not deductible/(taxable) in calculating taxable incomeDisposal of indefinite lived intangibles (14,723) –Share of net profits of associates (247) (86)Non‑deductible entertainment expenses 1,213 1,693Other (deductible expenses)/(non‑assessable income)/non‑deductible expenses (528) 700Adjustments recognised in the current year in relation to prior years (4,861) 374Income tax expense 19,175 36,934
62 Southern Cross Austereo . Annual Report

Deferred Taxes
Consolidated2017
$’0002016
$’000The balance comprises temporary differences attributable to:Licences and brands (372,131) (386,853)Employee benefits 5,925 5,797Provisions 2,660 3,413Interest rate swaps 780 982Other 1,328 2,983Net balance disclosed as deferred tax liability (361,438) (373,678)
For the year ended 30 June 2017, the Company had $0.2 million of income tax expense (2016: $0.5 million benefit) recognised directly in equity in relation to cash flow hedges, with a corresponding deferred tax liability (2016: asset) being recognised. There are $70.917 million available unused tax losses on the capital account for which no deferred tax asset has been recognised (2016: $18.707 million). There are no other unused tax losses for which no deferred tax asset has been recognised.
Recognition and MeasurementIncome TaxIncome tax amounts recognised in the Group’s financial statements relate to tax paying entities within the Group and have been recognised in accordance with Group policy.
The income tax expense (or revenue) for the year is the tax payable on the current year’s taxable income based on the applicable tax rate for each jurisdiction adjusted by changes in deferred tax assets and liabilities attributable to temporary differences between the tax bases of assets and liabilities and their carrying amounts in the financial statements, and adjusted by changes to unused tax losses.
Deferred TaxesDeferred tax assets and liabilities are recognised for temporary differences at the tax rates expected to apply when the assets are recovered or liabilities are settled, based on those tax rates which are enacted or substantively enacted for each jurisdiction. The relevant tax rates are applied to the cumulative amounts of deductible and taxable temporary differences to measure the deferred tax asset or liability.
Deferred tax assets are recognised for deductible temporary differences and unused tax losses only if it is probable that future taxable amounts will be available to utilise those temporary differences and losses.
In determining the extent of temporary differences of assets, the carrying amount of assets is assumed to be recovered through use.
Tax Consolidated GroupThe Company is the head entity of the tax consolidated group. For further information, refer note 19.
63Southern Cross Austereo . Annual Report

NOTES TO THE FINANCIAL STATEMENTSFOR YEAR ENDED 30 JUNE 2017
6. Non-Current Assets – Property, Plant and Equipment
Consolidated2017
Land and Buildings
$’000
Leasehold Improvements
$’000
Plant and Equipment
$’000
Assets Under Construction
$’000Total
$’000Cost 33,652 38,887 350,645 8,620 431,804Accumulated depreciation expense (9,805) (21,931) (263,890) – (295,626)Net carrying amount 23,847 16,956 86,755 8,620 136,178 Movement Net carrying amount at beginning of year 27,522 13,668 95,411 8,648 145,249 Additions 283 6,333 15,066 6,411 28,093 Disposals (1,098) (11) 21 – (1,088)Disposal of operations and assets (1,789) (239) (4,556) – (6,584)Depreciation expense (1,071) (2,319) (26,102) – (29,492)Transfers – (476) 6,915 (6,439) –Net carrying amount at end of year 23,847 16,956 86,755 8,620 136,178
Consolidated2016
Land and Buildings
$’000
Leasehold Improvements
$’000
Plant and Equipment
$’000
Assets Under Construction
$’000Total
$’000Cost 38,050 34,590 355,883 8,648 437,171Accumulated depreciation expense (10,528) (20,922) (260,472) – (291,922)Net carrying amount 27,522 13,668 95,411 8,648 145,249 Movement Net carrying amount at beginning of year 34,122 15,484 106,004 8,231 163,841 Additions 1,390 329 13,049 7,947 22,715 Disposals (6,930) – (6,477) – (13,407)Depreciation expense (1,060) (2,000) (24,840) – (27,900)Transfers – (145) 7,675 (7,530) –Net carrying amount at end of year 27,522 13,668 95,411 8,648 145,249
Recognition and MeasurementProperty, Plant and Equipment at CostProperty, plant and equipment is recorded at cost less accumulated depreciation and cumulative impairment charges. Cost includes those costs directly attributable to bringing the assets into the location and working condition necessary for the asset to be capable of operating in the manner intended by management. The estimated cost of dismantling and removing infrastructure items and restoring the site on which the assets are located is only included in the cost of the asset to the extent that the Group has an obligation to restore the site and the cost of restoration is not recoverable from third parties. Additions, renewals and improvements are capitalised, while maintenance and repairs are expensed.
The carrying values of property, plant and equipment are reviewed for impairment whenever events or changes in circumstances indicate that the carrying amounts may not be recoverable. An asset’s carrying amount is written down immediately to its recoverable amount if the asset’s carrying amount is greater than its estimated recoverable amount.
DepreciationLand is not depreciated. Depreciation on other assets is calculated on a straight‑line basis to write off the cost of the asset over its estimated useful life.
Estimates of remaining useful life are made on a regular basis for all assets, with annual reassessments for major items. The expected useful life of property, plant and equipment is as follows:
Buildings 25 – 50 years Communication equipment 3 – 5 yearsLeasehold improvements 3 – 16 years Other plant and equipment 2 – 20 yearsNetwork equipment 2 – 10 years Leased plant and equipment 2 – 20 years
64 Southern Cross Austereo . Annual Report

7. Non-Current Assets – Intangible Assets
Consolidated2017
Goodwill $’000
Broadcasting Licences
$’000
Brands and Tradenames
$’000
Customer Contracts
$’000Total
$’000Cost 352,129 1,483,224 89,700 2,240 1,927,293Accumulated impairment expense (352,129) (300,583) (24,848) – (677,560)Accumulated amortisation expense – – – (778) (778)Net carrying amount – 1,182,641 64,852 1,462 1,248,955 Movement Net carrying amount at beginning of year – 1,224,773 64,736 – 1,289,509Additions – 6,940 116 2,240 9,296Amortisation expense – – – (778) (778)Disposal of operations and assets – (49,072) – – (49,072)Net carrying amount at end of year – 1,182,641 64,852 1,462 1,248,955
Consolidated2016
Goodwill $’000
Broadcasting Licences
$’000
Brands and Tradenames
$’000
Customer Contracts
$’000Total
$’000Cost 352,129 1,589,574 89,584 – 2,031,287Accumulated impairment expense (352,129) (364,801) (24,848) – (741,778)Net carrying amount – 1,224,773 64,736 – 1,289,509 Movement Net carrying amount at beginning of year – 1,224,773 64,667 – 1,289,440Additions – – 69 – 69Net carrying amount at end of year – 1,224,773 64,736 – 1,289,509
Goodwill and intangible assets with indefinite useful livesThe Group tests at least annually whether goodwill and intangible assets with indefinite useful lives have suffered any impairment, and when there is an indication of impairment. The tests incorporate assumptions regarding future events which may or may not occur, resulting in the need for future revisions of estimates. There are also judgements involved in determination of cash generating units.
Key JudgementUseful LifeA summary of the useful lives of intangible assets is as follows:
Commercial Television/Radio Broadcasting Licences Indefinite Brands and Tradenames Indefinite
LicencesTelevision and radio licences are initially recognised at cost. Analogue licences are renewable for a minimal cost every five years under provisions within the Broadcasting Services Act. Digital licences attach to the analogue licences and renew automatically. The Directors understand that the revocation of a commercial television or radio licence has never occurred in Australia and have no reason to believe the licences have a finite life. As a result, the free‑to‑air commercial television and radio broadcasting licences have been assessed to have indefinite useful lives.
BrandsBrands are initially recognised at cost. The brands have been assessed to have indefinite useful lives. The Group’s brands operate in established markets with limited restrictions and are expected to continue to complement the Group’s media initiatives. On this basis, the Directors have determined that brands have indefinite lives as there is no foreseeable limit to the period over which the assets are expected to generate net cash inflows.
65Southern Cross Austereo . Annual Report

NOTES TO THE FINANCIAL STATEMENTSFOR YEAR ENDED 30 JUNE 2017
8. Impairmenta) Impairment tests for licences, tradenames, brands and goodwillThe value of licences, tradenames, brands and goodwill is allocated to the Group’s cash generating units (“CGUs”), identified as Regional, being, Regional free‑to‑air commercial radio and television broadcasting, and Metro, being, Metro free‑to‑air commercial radio broadcasting.
The recoverable amount of Regional and Metro at 30 June 2017 and 30 June 2016 was determined based on a value in use discounted cash flow (“DCF”) model.
Allocation of goodwill and other intangible assets
Consolidated2017
Regional CGU$’000
Metro CGU$’000
Total$’000
Goodwill allocated to CGU – – –Indefinite lived intangible assets allocated to CGU 628,571 618,922 1,247,493Finite lived intangible assets allocated to CGU – 1,462 1,462Total goodwill, finite and indefinite lived intangible assets 628,571 620,384 1,248,955
Key Judgement % %Value in use assumptions (see part (b))Revenue growth – Forecast Period –0.3 2.9Cost growth – Forecast Period 0.2 2.1Long‑term growth rate – terminal value 1.3 2.3Discount rate (pre‑tax) 12.7 12.2
Consolidated2016
Regional CGU$’000
Metro CGU$’000
Total$’000
Goodwill allocated to CGU – – –Indefinite lived intangible assets allocated to CGU 673,239 616,270 1,289,509Total goodwill and indefinite lived intangible assets 673,239 616,270 1,289,509
Key Judgement % %Value in use assumptions (see part (b))Revenue growth – Forecast Period 0.3 3.6Cost growth – Forecast Period 0.8 2.8Long‑term growth rate – terminal value 1.0 2.3Discount rate (pre‑tax) 12.8 12.2
b) Key assumptions used for value in use calculationsThe value in use calculations use cash flow projections based on the 2018 financial budgets extended over the subsequent four‑year period (“Forecast Period”) and apply a terminal value calculation using estimated growth rates approved by the Board for the business relevant to each CGU. In determining appropriate growth rates to apply to the Forecast Period and to the terminal calculation, the Group considered forecast reports from independent media experts as well as internal company data and assumptions. In respect to each CGU the market growth rates did not exceed the independent forecast reports. The discount rate used reflects specific risks relating to the relevant segments and the economies in which they operate. The forecast period cash flows include the benefit of proposed ACMA licence fee reductions, the legislation for which has not been enacted. However, if this benefit is removed from the forecast period cash flows, the reduction would not be sufficient to reduce recoverable amount below carrying value in either CGU.
66 Southern Cross Austereo . Annual Report

c) SensitivityAny variation in key assumptions used to determine the value in use would result in a change in the recoverable amount of the Regional and Metro CGUs. The following shifts in key assumptions would result in a recoverable amount equal to the carrying value, however it is not considered any reasonable possible change to key assumptions would individually lead to the recoverable amount being below the carrying value.
Sensitivity2017
Change in variableRegional
CGU %Metro
CGU %Revenue growth – Forecast Period –0.6% –0.9%Cost growth – Forecast Period +0.9% +1.7%Long‑term growth rate – terminal value –0.6% –1.2%Discount rate (pre‑tax) +0.7% +1.3%
9. Reconciliation of Profit after Income Tax to Net Cash Inflow from Operating Activities
Consolidated2017
$’0002016
$’000Profit after income tax 108,563 77,243Depreciation and amortisation 30,870 28,850Net gain from disposal of operations and assets (3,559) (2,734)Share of associate profit (510) (286)Interest expense and other borrowing costs included in financing activities 19,510 26,029Share‑based payments 2,000 3,261Change in operating assets and liabilities:Increase in receivables (7,717) (20,772)(Increase)/Decrease in deferred taxes (net of tax movement in hedge reserve) (12,442) 2,876(Decrease)/increase in payables (excluding interest expense classified as financing activities) (6,064) 10,886(Decrease)/increase in deferred income (6,446) 100,100(Decrease)/increase in provision for income tax (4,951) 1,578Decrease in provisions (3,013) (3,293)Net cash inflows from operating activities 116,241 223,738
67Southern Cross Austereo . Annual Report

NOTES TO THE FINANCIAL STATEMENTSFOR YEAR ENDED 30 JUNE 2017
10. Receivables, Payables, Deferred Income and Provisionsa) Receivables
Consolidated2017
$’0002016
$’000CurrentTrade receivables 131,744 127,412Provision for doubtful debts (703) (650)Prepayments 12,795 12,520Other1 14,174 2,721
158,010 142,003
1 Included in Other in 2017 is $10.120 million of deferred consideration due in connection with the disposal of operations and assets (refer note 4).
Consolidated2017
$’0002016
$’000Non-currentRefundable deposits 138 81Related parties 1,543 786Other 1,283 1,810
2,964 2,677
The carrying amounts of the non‑current receivables approximate their fair value.
Ageing analysis of assetsThe tables below summarise the ageing analysis of assets past due but not impaired and impaired assets as at 30 June.
Consolidated As at 30 June 2017
Current – not past due
$’000
Past due – up to 60 days
$’000
Past due – 60 – 90 days
$’000
Past due – >90 days
$’000Total
$’000Trade receivables 113,877 11,854 3,098 2,915 131,744Provision for doubtful debts – – – (703) (703)
Consolidated As at 30 June 2016
Current – not past due
$’000
Past due – up to 60 days
$’000
Past due – 60 – 90 days
$’000
Past due – >90 days
$’000Total
$’000Trade receivables 115,263 8,136 1,952 2,061 127,412Provision for doubtful debts – – – (650) (650)
The Group has recognised expenses in respect of bad and doubtful trade receivables during the year ended 30 June 2017 of $1,130,603 (2016: expense of $665,927). This provision is based on known bad debts and past experience for receipt of trade receivables. A provision for doubtful debts is established when there is objective evidence that the Group will not be able to collect all amounts due according to the original terms of the receivable. The amount of the provision is recognised in profit or loss. Where a debt is known to be uncollectible, it is considered a bad debt and written off.
68 Southern Cross Austereo . Annual Report

Recognition and MeasurementTrade ReceivablesTrade receivables are recognised at fair value, being the original invoice amount and subsequently measured at amortised cost less provision for doubtful debts. Generally credit terms are for 30 days from date of invoice or 45 days for an accredited agency.
Transferred Trade ReceivablesThe carrying amounts of the trade receivables in 2016 include receivables which are subject to a non‑recourse securitisation arrangement. Under this arrangement, the Group has transferred the relevant receivables to the securitisation vehicle in exchange for cash, and is prevented from selling or pledging the receivables. Whilst legal ownership has been transferred to the securitisation vehicle, the Group retains a portion of late payment and credit risk for the amounts yet to be received from the securitisation vehicle in respect of the securitised receivables. The Group therefore continues to recognise the transferred assets in their entirety in the balance sheet. The amount received under the securitisation arrangement is presented as current secured borrowings in the balance sheet. The facility matured on 19 June 2017 and was not extended.
Consolidated2017
$’0002016
$’000CurrentCarrying amount of transferred receivables (included in trade receivables) – 55,427Carrying amount of associated secured borrowing (included in secured borrowings) – (36,801)
b) Payables
Consolidated2017
$’0002016
$’000CurrentTrade creditors 11,523 15,596GST payable 4,132 3,812Accruals and other payables 65,387 66,980
81,042 86,388
Recognition and MeasurementTrade Creditors, Accruals and Other PayablesThese amounts represent liabilities for goods and services provided to the Group prior to the end of the financial year and which are unpaid. The amounts are unsecured and are usually paid within 60 days of recognition.
69Southern Cross Austereo . Annual Report

NOTES TO THE FINANCIAL STATEMENTSFOR YEAR ENDED 30 JUNE 2017
10. Receivables, Payables, Deferred Income and Provisions (continued)c) Deferred Income
Consolidated2017
$’0002016
$’000CurrentDeferred income 9,477 12,590
9,477 12,590
Consolidated
2017$’000
2016$’000
Non-currentDeferred income 91,945 95,278
91,945 95,278
Recognition and MeasurementDeferred IncomeIn 2016, the Group entered into a long‑term contract with Australian Traffic Network (ATN) for it to provide traffic reports for broadcast on Southern Cross Austereo (SCA) radio stations. SCA received payment of $100 million from ATN in return for its stations broadcasting advertising tags provided by ATN attached to news and traffic reports. The contract has a term of 20 years, with an option for ATN to extend it by a further 10 years. The $100 million payment has been recorded on the balance sheet under “Deferred Income” and will be released to the Income Statement over a 30‑year period, unless the contract ends after 20 years at which point the remaining balance will be recognised as revenue in year 20. This treatment will match the receipt of future broadcasting services, airtime and traffic management services that the Group is required to provide over the life of the contract.
In addition to the payment received from ATN, deferred income represents government grants received. Grants from the government relating to costs are deferred and recognised in profit or loss over the period necessary to match them with the costs that they are intended to compensate.
Government grants relating to the purchase of property, plant and equipment are deferred and recognised in profit or loss on a straight‑line basis over the expected useful lives of the related assets.
d) Provisions
Consolidated2017
$’0002016
$’000CurrentEmployee benefits 17,766 17,178Onerous contracts 1,195 1,574Lease provisions 769 595
19,730 19,347
Consolidated2017
$’0002016
$’000Non-currentEmployee benefits 2,142 2,144Onerous contracts 1,381 3,241Lease provisions 6,611 6,454
10,134 11,839
70 Southern Cross Austereo . Annual Report

Movements in current and non‑current provisions, other than provisions for employee benefits, are set out below:
Consolidated2017
$’0002016
$’000Balance at the beginning of the financial year 11,864 14,109Additional provisions made in the period, including increases to existing provisions 602 –Amounts used during the period (1,695) (2,245)Unused amounts reversed during the period (815) –Balance at the end of the financial year 9,956 11,864
Recognition and MeasurementProvisionsA provision is recognised when there is a legal, equitable or constructive obligation as a result of a past event and it is probable that a future sacrifice of economic benefits will be required to settle the obligation, the timing or amount of which is uncertain.
Where there are a number of similar obligations, the likelihood that an outflow will be required in settlement is determined by considering the class of obligations as a whole. A provision is recognised even if the likelihood of an outflow with respect to any one item included in the same class of obligations may be small.
Provisions are measured at the present value of management’s best estimate of the expenditure required to settle the present obligation at the balance sheet date. The discount rate used to determine the present value reflects current market estimates of the time value of money and the risks specific to the liability. The increase in the provision due to the passage of time is recognised as interest expense.
Wages and salaries, leave and other entitlementsLiabilities for unpaid salaries, salary related costs and provisions for annual leave are recorded in the Statement of Financial Position at the salary rates which are expected to be paid when the liability is settled. Provisions for long service leave and other long‑term benefits are recognised at the present value of expected future payments to be made. In determining this amount, consideration is given to expected future salary levels and employee service histories. Expected future payments are discounted to their net present value using high quality corporate bond rates with terms that match as closely as possible to the expected future cash flows.
Onerous ContractsA provision for onerous contracts is recognised when the expected benefits to be derived by the Group from a contract are lower than the unavoidable costs of meeting the obligation under the contract. The provision is measured at the lower of the cost of fulfilling the contract and any compensation or penalties arising from the failure to fulfil it.
Lease ProvisionsThe lease provision covers lease arrangements to enable the lease expenses to be recognised on a straight‑line basis over the life of the lease. The provision also comprises of makegood provisions included in lease agreements for which the Group has a legal or constructive obligation. The present value of the estimated costs of dismantling and removing the asset and restoring the site is recognised as a provision. At each reporting date, the liability is remeasured in line with changes in discount rates, estimated cash flows and the timing of those cash flows.
71Southern Cross Austereo . Annual Report

NOTES TO THE FINANCIAL STATEMENTSFOR YEAR ENDED 30 JUNE 2017
Capital Management11. Capital Management ObjectivesThe Group’s objectives when managing capital are to safeguard the Group’s ability to continue as a going concern, so that it can continue to provide appropriate returns for shareholders and benefits for other stakeholders and to maintain an optimal capital structure to reduce the cost of capital.
In order to maintain or adjust the capital structure, the Group may adjust the amount of dividends paid to shareholders, maintain a fully underwritten dividend reinvestment plan, return capital to shareholders, issue new shares, buy back existing shares or sell assets to reduce debt. The Group has taken measures to reduce net debt and has achieved its stated objective of reaching a leverage ratio of below 2.5 times. The following outlines the capital management policies that are currently in place for the Group:
Dividend PolicyDividend Payout RatioThe Group’s dividend policy has been to pay out between 60‑70% of underlying financial year Net Profit After Tax, as advised in a Capital Management Initiatives media release on 24 November 2011. There has been no change to this stated policy since this media release.
Dividend Reinvestment Plan (“DRP”)The Group operates a DRP whereby shareholders can elect to receive their dividends by way of receiving shares in the Company instead of cash. The Company can elect to either issue new shares, or to buy shares on‑market. The DRP has been suspended since the 2016 interim dividend following the successful reduction in the Group’s leverage ratio.
Further details on the Group’s dividends are outlined in note 12.
Debt FacilitiesSyndicated Debt FacilityThe Group has a $470 million (2016: $495 million) revolving 5 year Syndicated Facility Agreement (“SFA”) expiring on 12 January 2019. This facility is used as core debt for the Group, and may be paid down and redrawn in accordance with the SFA. During the year, the Group cancelled $25 million of this facility to reduce its commitment from $495 million to $470 million.
CovenantsFor the duration of the Syndicated Facility Agreement, the Banking Group, being Southern Cross Austereo Pty Ltd and its subsidiaries, has a maximum leverage ratio covenant of 3.5 times and a minimum interest cover ratio of 3.0 times. As at 30 June 2017, the leverage ratio was 1.81 times and the interest cover ratio was 10.0 times.
Non-Recourse Receivables Financing FacilityIn June 2015 the Banking Group entered into a $65 million non‑recourse Receivables Financing Agreement (“RFA”) that enables the Group to convert receivables to cash quicker, providing an additional source of funding for the Group’s working capital needs. As the Group retains an interest in each of the receivables, and as the advance rate for each debtor is less than its face value and the Group only receives further payment if the debtor pays the receivable, the full face value of the receivable is retained on the Group’s balance sheet, and the amount advanced under the RFA is recorded as a liability. As the RFA is considered non‑recourse, it is excluded from net debt for the purposes of the leverage ratio calculation. The facility matured on 19 June 2017 and was not extended.
Further details on the Group’s debt facilities are outlined in note 15.
Property, Plant and Equipment and IntangiblesThe capital expenditure for 2017 was $28.613 million (2016: $22.715 million).
During the year the Group divested intangibles and other non‑core assets which resulted in approximately $54.905 million (2016: $16.141 million) cash being received which was used for the acquisition of the assets of Authentic Entertainment Pty Ltd for $7.196 million and to reduce net debt.
Further details on the Group’s fixed assets are outlined in note 6.
72 Southern Cross Austereo . Annual Report

12. Dividends Paid and ProposedThe dividends were paid as follows:
Consolidated2017
$’0002016
$’000The dividends were paid as follows: Interim dividend paid for the half year ended 31 December 2016/2015 – fully franked at the tax rate of 30% 28,838 24,983Final dividend paid for the year ended 30 June 2016/2015 – fully franked at the tax rate of 30% 26,915 22,608
55,753 47,591
Dividends paid in cash or satisfied by the issue of shares under the dividend reinvestment plan were as follows:Paid in cash 55,753 33,680Satisfied by issue of shares – 13,911
55,753 47,591
Cents per share
Cents per share
Interim dividend paid for the half year ended 31 December 3.75 3.25Final dividend paid for the year ended 30 June 3.50 3.00
7.25 6.25
The Group has $135.3 million of franking credits at 30 June 2017 (2016: $122.5 million).
Provision is made for the amount of any dividend declared, being appropriately authorised and no longer at the discretion of the Company, on or before the end of the financial year but not distributed at the end of the reporting period.
Since the end of the financial year the Directors have declared the payment of a final 2017 ordinary dividend of $30.761 million (4.00 cents per fully paid share) out of current year earnings. This dividend will be paid on 10 October 2017 by the Company.
13. Earnings per Share
Consolidated2017 2016
Continuing OperationsProfit attributable to shareholders from continuing operations ($’000) 108,563 77,243Weighted average number of shares used as the denominator in calculating basic earnings per share (shares, ’000) 769,005 763,422Weighted average number of ordinary shares and potential ordinary shares used as the denominator in calculating diluted earnings per share (shares, ’000) 771,676 765,025Basic earnings per share (cents per share) 14.12 10.12 Diluted earnings per share (cents per share) 14.07 10.10 Dividends paid/proposed for the year as a % of NPAT1 54.9% 67.2%
1 Profit attributable to shareholders from continuing operations included a $14.7 million non‑cash credit within deferred tax following the disposal of indefinite lived intangibles. Excluding this item the dividends paid/proposed for the year as a % of NPAT is 63.5%.
Recognition and MeasurementBasic earnings per shareBasic earnings per share is calculated by dividing the profit or loss attributable to equity holders of the Company, excluding any costs of servicing equity other than ordinary shares, by the weighted average number of shares outstanding during the financial year.
Diluted earnings per shareDiluted earnings per share adjusts the figures used in the determination of basic earnings per share to take into account the after income tax effect of interest and other financing costs associated with dilutive potential shares and the weighted average number of shares assumed to have been issued for no consideration in relation to dilutive potential shares.
73Southern Cross Austereo . Annual Report

NOTES TO THE FINANCIAL STATEMENTSFOR YEAR ENDED 30 JUNE 2017
14. Contributed Equity and Reserves
Consolidated2017
$’0002016
$’000Ordinary shares 1,379,736 1,379,386Contributed equity 1,379,736 1,379,386
Consolidated Consolidated
2017 $’000
2016 $’000
2017 Number of securities
’000
2016 Number of securities
’000On issue at the beginning of the financial year 1,379,386 1,365,110 768,727 753,586Shares issued for equity component in talent contracts 350 365 287 304Shares issued in relation to the DRP and DRP underwrite – 13,911 – 14,837On issue at the end of the financial year 1,379,736 1,379,386 769,014 768,727
Ordinary shares in Southern Cross Media Group LimitedOrdinary shares entitle the holder to participate in distributions and the proceeds on winding up of the Company in proportion to the number of and amounts paid on the shares held.
On a show of hands, each shareholder present in person and each other person present as a proxy has one vote and upon a poll, each share is entitled to one vote.
Ordinary shares have no par value and the Company does not have a limited amount of authorised capital.
Employee share entitlementsThe Group operates an LTI plan for its senior executives. Information relating to the employee share entitlements, including details of shares issued under the scheme, is set out in the Remuneration Report.
Nature and purpose of reservesa) Share-based payments reserve The share‑based payments reserve is used to recognise the fair value of future potential shares to be issued to employees for no consideration in respect of performance rights offered under the Long‑Term Incentive Plan. During the year, 219,872 performance rights have vested (2016: nil) and 2,245,096 (2016: 1,393,443) performance rights have been granted. In the current year, $917,018 (2016: $527,762) has been recognised as an expense in the Statement of Comprehensive Income as the fair value of potential shares to be issued.
b) Hedge reserve The hedge reserve is used to record gains or losses on a hedging instrument in a cash flow hedge that are recognised in Other Comprehensive Income. Amounts are reclassified to the Statement of Comprehensive Income when the associated hedged transaction affects profit or loss.
c) Reverse acquisition reserveAs described in note 1(a), there is a reverse acquisition reserve of $77.406 million (2016: $77.406 million) in connection with the IPO of the Group.
74 Southern Cross Austereo . Annual Report

15. Borrowingsa) Total interest bearing liabilities
Consolidated2017
$’0002016
$’000Current secured borrowingsSecuritised receivables – 36,801Lease liabilities 86 129Total secured current interest bearing liabilities 86 36,930
Consolidated2017
$’0002016
$’000Non-current secured borrowingsBank facilities 370,000 435,000Borrowing costs (1,268) (2,241)Lease liabilities 30 132Total secured non-current interest bearing liabilities 368,762 432,891Total current and non-current borrowings 368,848 469,821
For all non‑current borrowings, the carrying amount approximates fair value in the balance sheet. Of the $1.268 million of borrowing costs, $0.828 million (2016: $0.973 million) will reverse during the year ending 30 June 2018.
On 19 June 2015, the Company entered into a $65 million non‑recourse receivables financing facility. As at 30 June 2017 the amount of funding received under the securitised facility was $nil (2016: $36.801 million). The facility matured on 19 June 2017 and was not extended.
b) Interest expense
Consolidated2017
$’0002016
$’000Interest expense and other borrowing costsExternal banks 18,537 25,053Amortisation of borrowing costs 973 976Total interest expense and other borrowing costs 19,510 26,029
75Southern Cross Austereo . Annual Report

NOTES TO THE FINANCIAL STATEMENTSFOR YEAR ENDED 30 JUNE 2017
15. Borrowings (continued)c) Bank facilities and assets pledged as securityThe $470 million debt facilities (2016: $495 million) of the Banking Group are secured by a fixed and floating charge over the assets and undertakings of the Banking Group and its wholly owned subsidiaries and also by a mortgage over shares in Southern Cross Austereo Pty Ltd. These facilities mature on 12 January 2019 and have an average variable interest rate of 3.53% (2016: 4.28%). These facilities are denominated in Australian dollars.
There are certain financial and non‑financial covenants which are required to be met by subsidiaries in the Group. One of these covenants is an undertaking that the subsidiary is in compliance with the requirements of the facility before any amount may be distributed to the benefit of the ultimate parent entity, Southern Cross Media Group Limited. Covenant testing dates fall at 30 June and 31 December each year until the facility maturity date.
The carrying amounts of assets pledged as security by Southern Cross Austereo Pty Ltd for current and non‑current borrowings are:
Consolidated2017
$’0002016
$’000Current assetsFloating chargeCash and cash equivalents 48,972 94,770Receivables 157,441 141,068Total current assets pledged as security 206,413 235,838
Non-current assetsFloating chargeReceivables 2,824 2,597Investments accounted for using the equity method 4,088 3,266Property, plant and equipment 136,178 145,249Intangible assets 1,248,955 1,289,509Total non‑current assets pledged as security 1,392,045 1,440,621Total assets pledged as security 1,598,458 1,676,459
Recognition and MeasurementBorrowingsBorrowings are initially recognised at fair value, net of transaction costs incurred. Transaction costs that have been paid or accrued for prior to the drawdown of debt are classified as prepayments. Borrowings are subsequently measured at amortised cost. Any difference between the proceeds (net of transaction costs) and the redemption amount is recognised in profit or loss over the period of the borrowings using the effective interest method. Borrowings are classified as current liabilities unless the Group has an unconditional right to defer settlement of the liability for at least 12 months after the balance sheet date.
Borrowing costsBorrowing costs are expensed over the life of the facility to which they relate.
76 Southern Cross Austereo . Annual Report
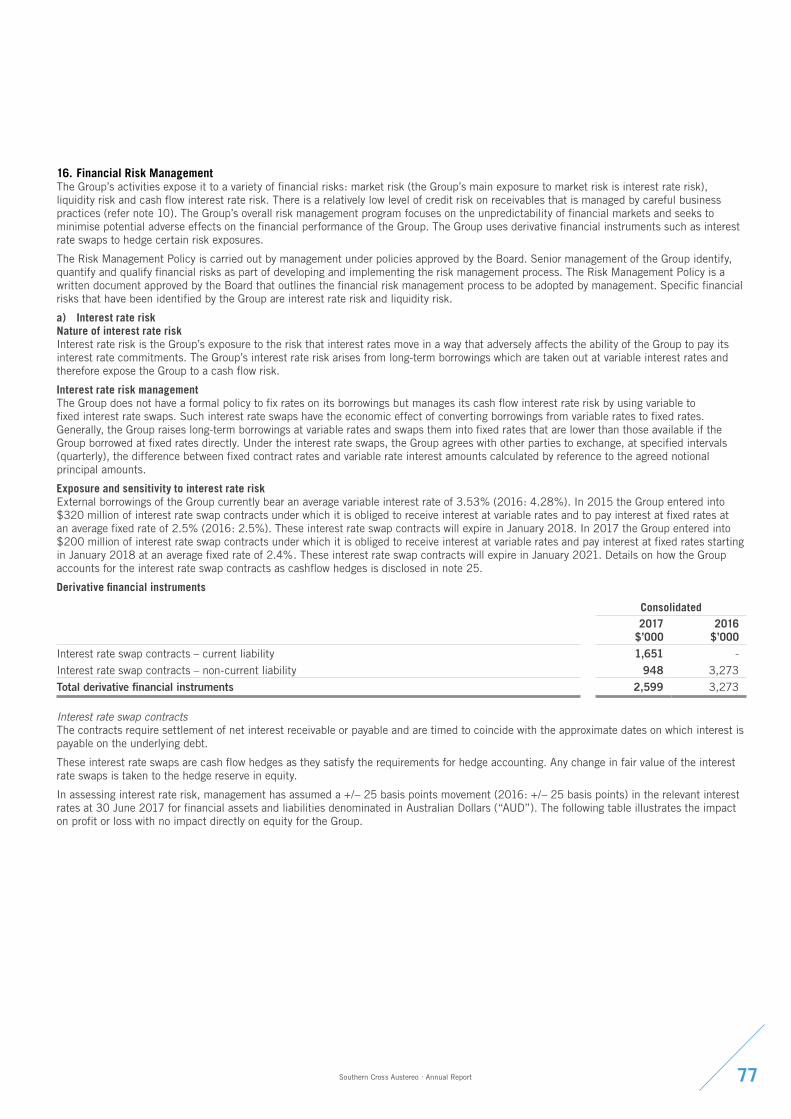
16. Financial Risk ManagementThe Group’s activities expose it to a variety of financial risks: market risk (the Group’s main exposure to market risk is interest rate risk), liquidity risk and cash flow interest rate risk. There is a relatively low level of credit risk on receivables that is managed by careful business practices (refer note 10). The Group’s overall risk management program focuses on the unpredictability of financial markets and seeks to minimise potential adverse effects on the financial performance of the Group. The Group uses derivative financial instruments such as interest rate swaps to hedge certain risk exposures.
The Risk Management Policy is carried out by management under policies approved by the Board. Senior management of the Group identify, quantify and qualify financial risks as part of developing and implementing the risk management process. The Risk Management Policy is a written document approved by the Board that outlines the financial risk management process to be adopted by management. Specific financial risks that have been identified by the Group are interest rate risk and liquidity risk.
a) Interest rate riskNature of interest rate riskInterest rate risk is the Group’s exposure to the risk that interest rates move in a way that adversely affects the ability of the Group to pay its interest rate commitments. The Group’s interest rate risk arises from long‑term borrowings which are taken out at variable interest rates and therefore expose the Group to a cash flow risk.
Interest rate risk managementThe Group does not have a formal policy to fix rates on its borrowings but manages its cash flow interest rate risk by using variable to fixed interest rate swaps. Such interest rate swaps have the economic effect of converting borrowings from variable rates to fixed rates. Generally, the Group raises long‑term borrowings at variable rates and swaps them into fixed rates that are lower than those available if the Group borrowed at fixed rates directly. Under the interest rate swaps, the Group agrees with other parties to exchange, at specified intervals (quarterly), the difference between fixed contract rates and variable rate interest amounts calculated by reference to the agreed notional principal amounts.
Exposure and sensitivity to interest rate riskExternal borrowings of the Group currently bear an average variable interest rate of 3.53% (2016: 4.28%). In 2015 the Group entered into $320 million of interest rate swap contracts under which it is obliged to receive interest at variable rates and to pay interest at fixed rates at an average fixed rate of 2.5% (2016: 2.5%). These interest rate swap contracts will expire in January 2018. In 2017 the Group entered into $200 million of interest rate swap contracts under which it is obliged to receive interest at variable rates and pay interest at fixed rates starting in January 2018 at an average fixed rate of 2.4%. These interest rate swap contracts will expire in January 2021. Details on how the Group accounts for the interest rate swap contracts as cashflow hedges is disclosed in note 25.
Derivative financial instruments
Consolidated2017
$’0002016
$’000Interest rate swap contracts – current liability 1,651 ‑Interest rate swap contracts – non‑current liability 948 3,273Total derivative financial instruments 2,599 3,273
Interest rate swap contractsThe contracts require settlement of net interest receivable or payable and are timed to coincide with the approximate dates on which interest is payable on the underlying debt.
These interest rate swaps are cash flow hedges as they satisfy the requirements for hedge accounting. Any change in fair value of the interest rate swaps is taken to the hedge reserve in equity.
In assessing interest rate risk, management has assumed a +/– 25 basis points movement (2016: +/– 25 basis points) in the relevant interest rates at 30 June 2017 for financial assets and liabilities denominated in Australian Dollars (“AUD”). The following table illustrates the impact on profit or loss with no impact directly on equity for the Group.
77Southern Cross Austereo . Annual Report

NOTES TO THE FINANCIAL STATEMENTSFOR YEAR ENDED 30 JUNE 2017
16. Financial Risk Management (continued)a) Interest rate risk (continued)
ConsolidatedAUD exposures
Carrying Value
Impact on post-tax profitsIncrease/(decrease)+/– 25 basis points
Impact on reservesIncrease/(decrease) +/– 25 basis points
$’000 $’000 $’000 $’000 $’0002017 +25 –25 +25 –25Cash at bank 48,978 86 (86) – –Interest rate swaps (2,599) 461 (461) 2,036 (2,051)Borrowings (370,000) (648) 648 – –2016 +25 –25 +25 –25Cash at bank 94,776 166 (166) – –Interest rate swaps (3,273) 560 (560) 1,396 (1,400)Borrowings (435,000) (761) 761 – –
b) Liquidity riskNature of liquidity riskLiquidity risk is the risk of an entity encountering difficulty in meeting obligations associated with financial liabilities.
Liquidity risk managementPrudent liquidity risk management implies maintaining sufficient cash, the availability of funding through an adequate amount of committed credit facilities and the ability to close out market positions. The Group and Company have a prudent liquidity management policy which manages liquidity risk by monitoring the stability of funding, surplus cash or near cash assets, anticipated cash in and outflows and exposure to connected parties.
Exposure and sensitivityFinancing arrangementsUnrestricted access was available at balance date to the following lines of credit:
Consolidated Bank
facilities
Working capital facility
Non-recourse receivables
financing facility
Total facilities
As at 30 June 2017 $’000 $’000 $’000 $’000Line of credit value 470,000 5,000 – 475,000Used at balance date (370,000) (4,168) – (374,168)Unused at balance date 100,000 832 – 100,832
Consolidated Bank
facilities
Working capital facility
Non-recourse receivables
financing facility
Total facilities
As at 30 June 2016 $’000 $’000 $’000 $’000Line of credit value 495,000 5,000 65,000 565,000Used at balance date (435,000) (4,113) (36,801) (475,914)Unused at balance date 60,000 887 28,199 89,086
The $470 million debt facility for the Group matures on 12 January 2019. The Group’s bank facilities are denominated in Australian dollars as at 30 June 2017 and 30 June 2016. The non‑recourse receivables financing facility matured on 19 June 2017 and was not extended.
78 Southern Cross Austereo . Annual Report
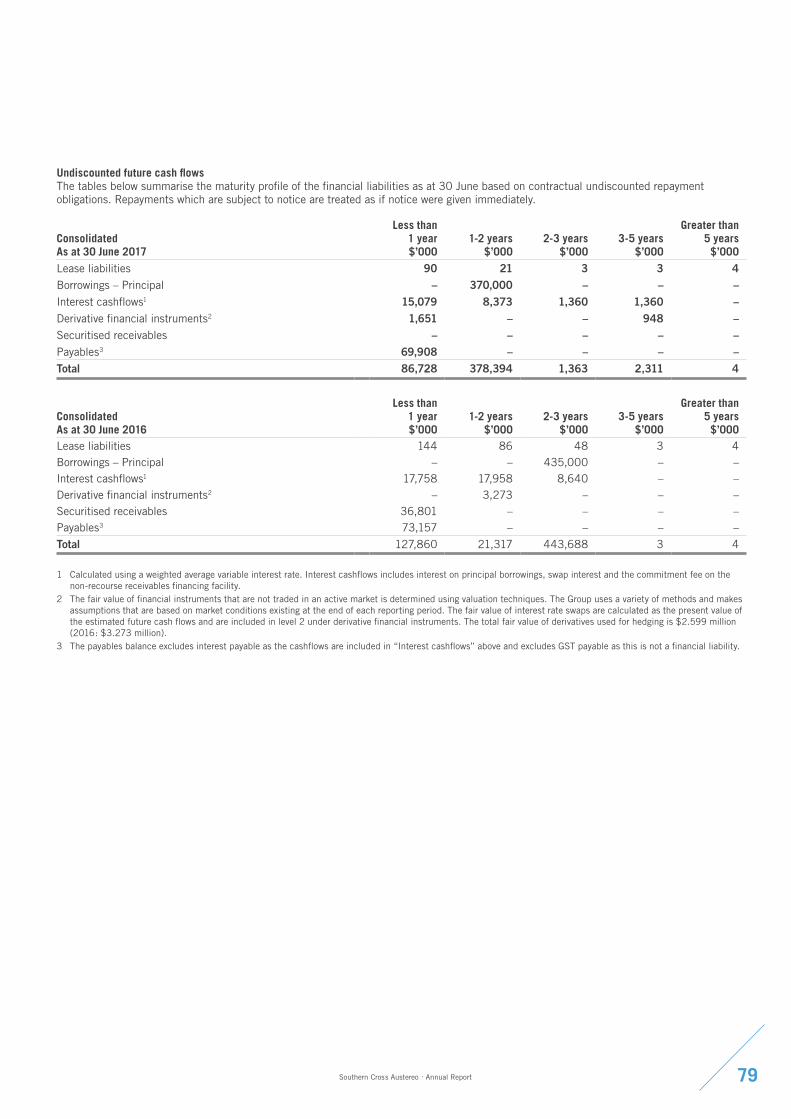
Undiscounted future cash flowsThe tables below summarise the maturity profile of the financial liabilities as at 30 June based on contractual undiscounted repayment obligations. Repayments which are subject to notice are treated as if notice were given immediately.
ConsolidatedAs at 30 June 2017
Less than 1 year $’000
1-2 years $’000
2-3 years $’000
3-5 years $’000
Greater than 5 years
$’000Lease liabilities 90 21 3 3 4Borrowings – Principal – 370,000 – – –Interest cashflows1 15,079 8,373 1,360 1,360 –Derivative financial instruments2 1,651 – – 948 –Securitised receivables – – – – –Payables3 69,908 – – – –Total 86,728 378,394 1,363 2,311 4
ConsolidatedAs at 30 June 2016
Less than 1 year $’000
1-2 years $’000
2-3 years $’000
3-5 years $’000
Greater than 5 years
$’000Lease liabilities 144 86 48 3 4Borrowings – Principal – – 435,000 – –Interest cashflows1 17,758 17,958 8,640 – –Derivative financial instruments2 – 3,273 – – –Securitised receivables 36,801 – – – –Payables3 73,157 – – – –Total 127,860 21,317 443,688 3 4
1 Calculated using a weighted average variable interest rate. Interest cashflows includes interest on principal borrowings, swap interest and the commitment fee on the non‑recourse receivables financing facility.
2 The fair value of financial instruments that are not traded in an active market is determined using valuation techniques. The Group uses a variety of methods and makes assumptions that are based on market conditions existing at the end of each reporting period. The fair value of interest rate swaps are calculated as the present value of the estimated future cash flows and are included in level 2 under derivative financial instruments. The total fair value of derivatives used for hedging is $2.599 million (2016: $3.273 million).
3 The payables balance excludes interest payable as the cashflows are included in “Interest cashflows” above and excludes GST payable as this is not a financial liability.
79Southern Cross Austereo . Annual Report

NOTES TO THE FINANCIAL STATEMENTSFOR YEAR ENDED 30 JUNE 2017
Group Structure17. Non-Current Assets – Investments Accounted for Using the Equity Method
Consolidated2017
$’0002016
$’000Carrying amount at the beginning of the financial year 3,657 3,059Share of profit/(losses) after income tax 510 286Acquisition of associates and joint ventures 1,000 –Contributions to associates and joint ventures – 312Carrying amount at the end of the financial year 5,167 3,657
18. SubsidiariesThe consolidated financial statements incorporate the assets, liabilities and results of the following subsidiaries:
Name of entityCountry of
incorporationClass of
shares/units
Effective ownership
interest2017
Effective ownership
interest2016
SCM No 1 Limited (SCM1) Australia Ordinary 100% 100%Southern Cross Media Australia Holdings Pty Limited (SCMAHL) Australia Ordinary 100% 100%Southern Cross Media Group Investments Pty Ltd (SCMGI) Australia Ordinary 100% 100%Southern Cross Austereo Pty Limited (SCAPL) and controlled entities Australia Ordinary 100% 100%
The proportion of ownership interest is equal to the proportion of voting power held unless otherwise indicated.
Recognition and Measurement SubsidiariesSubsidiaries are those entities over which the Group has the power to govern the financial and operating policies, generally accompanying a shareholding of more than one‑half of voting rights. Subsidiaries are fully consolidated from the date on which control is transferred to the Group. The existence and effect of potential voting rights that are currently exercisable or convertible are considered when assessing whether the Group controls another entity.
The purchase method of accounting is used to account for the acquisition of subsidiaries by the Group. Where control of an entity is obtained during a financial year, its results are included in the Statement of Comprehensive Income from the date on which control commences. Where control of an entity ceases during a financial year, its results are included for that part of the year during which control existed.
Intercompany transactions, balances and unrealised gains on transactions between Group companies are eliminated.
Non‑controlling interests in the results and equity of subsidiaries are shown separately in the consolidated Statements of Comprehensive Income and Statements of Financial Position respectively.
80 Southern Cross Austereo . Annual Report

19. Parent Entity Financial Informationa) Summary financial informationThe following aggregate amounts are disclosed in respect of the parent entity, Southern Cross Media Group Limited:
Southern Cross Media Group Limited
Statement of Financial Position2017
$’0002016
$’000Current assets 575 876Non‑current assets 966,576 964,654Total assets 967,151 965,530Current liabilities 2,080 4,260Total liabilities 2,080 4,260Net assets 965,071 961,270Issued capital 1,282,148 1,281,798Reserves 5,671 4,754Retained profits – 2013 reserve 67,648 67,648Accumulated losses – 2014 reserve (96,805) (96,805)Retained profits – 2015 H1 interim reserve 22,761 22,761Accumulated losses – 2015 H2 reserve (323,833) (323,833)Retained profits – 2016 reserve 4,947 4,947Retained profits – 2017 reserve 2,534 ‑Total equity 965,071 961,270Profit for the year 58,987 52,538Total comprehensive income 58,987 52,538
b) Guarantees entered into by the parent entityThe parent entity has not provided any financial guarantees in respect of bank overdrafts and loans of subsidiaries as at 30 June 2017 (2016: nil). The parent entity has not given any unsecured guarantees at 30 June 2017 (2016: nil).
c) Contingent liabilities of the parent entityThe parent entity did not have any contingent liabilities as at 30 June 2017 (30 June 2016: nil).
d) Contractual commitments for the acquisition of property, plant or equipmentAs at 30 June 2017, the parent entity had no contractual commitments (30 June 2016: nil).
Recognition and MeasurementParent entity financial information The financial information for the parent entity has been prepared on the same basis as the consolidated financial statements, except as set out on the following page.
i) Investments in subsidiaries, associates and joint venture entities Investments in subsidiaries are accounted for at cost in the financial statements of the Company, less any impairment charges.
ii) Tax consolidation legislation The Company and its wholly owned Australian controlled entities have implemented the tax consolidation legislation as of 23 November 2005.
The Company is the head entity of the tax consolidated group. Members of the group have entered into a tax sharing agreement in order to allocate income tax expense to the wholly owned subsidiaries on a stand‑alone basis. The tax sharing arrangement provides for the allocation of income tax liabilities between the entities should the head entity default on its tax payment obligations. The possibility of such a default is considered remote at the date of this report.
Members of the tax consolidated group have entered into a tax funding agreement. The Group has applied the group allocation approach in determining the appropriate amount of current taxes to allocate to members of the tax consolidated group. The tax funding agreement provides for each member of the tax consolidated group to pay a tax equivalent amount to or from the parent in accordance with their notional current tax liability or current tax asset. Such amounts are reflected in amounts receivable from or payable to the parent company in their accounts and are settled as soon as practicable after lodgement of the consolidated return and payment of the tax liability.
81Southern Cross Austereo . Annual Report
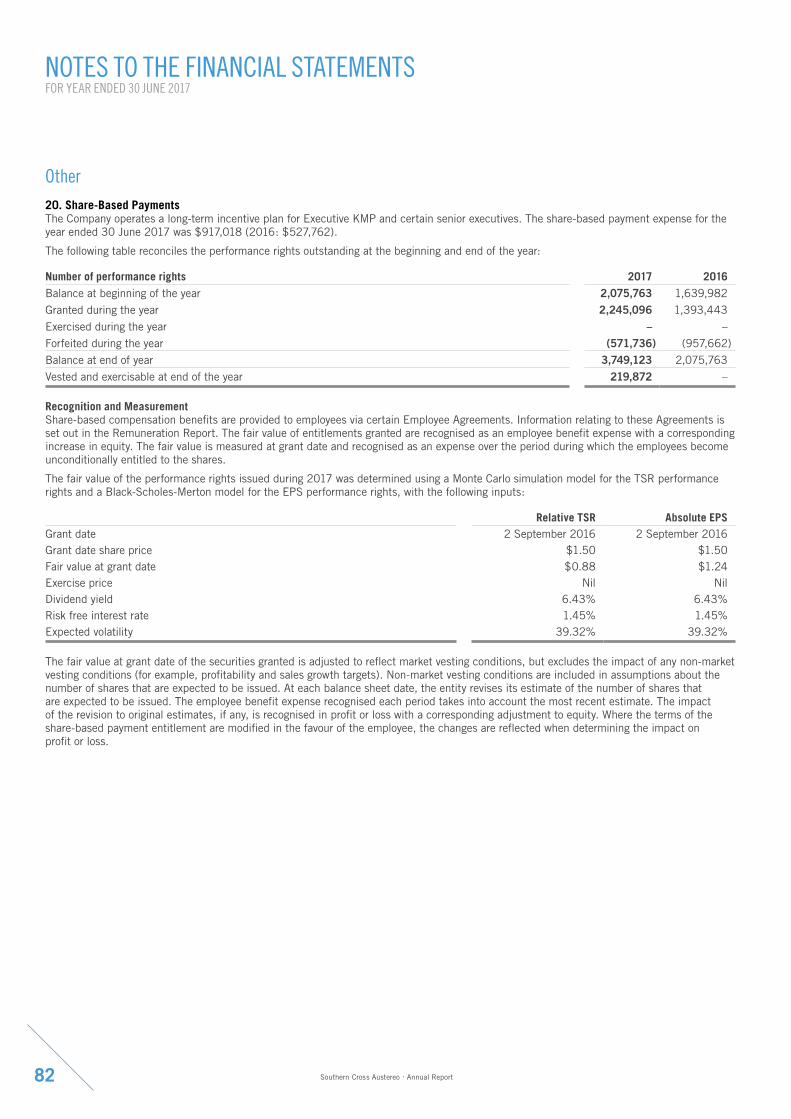
NOTES TO THE FINANCIAL STATEMENTSFOR YEAR ENDED 30 JUNE 2017
Other 20. Share-Based PaymentsThe Company operates a long‑term incentive plan for Executive KMP and certain senior executives. The share‑based payment expense for the year ended 30 June 2017 was $917,018 (2016: $527,762).
The following table reconciles the performance rights outstanding at the beginning and end of the year:
Number of performance rights 2017 2016Balance at beginning of the year 2,075,763 1,639,982Granted during the year 2,245,096 1,393,443Exercised during the year – –Forfeited during the year (571,736) (957,662)Balance at end of year 3,749,123 2,075,763Vested and exercisable at end of the year 219,872 –
Recognition and MeasurementShare‑based compensation benefits are provided to employees via certain Employee Agreements. Information relating to these Agreements is set out in the Remuneration Report. The fair value of entitlements granted are recognised as an employee benefit expense with a corresponding increase in equity. The fair value is measured at grant date and recognised as an expense over the period during which the employees become unconditionally entitled to the shares.
The fair value of the performance rights issued during 2017 was determined using a Monte Carlo simulation model for the TSR performance rights and a Black‑Scholes‑Merton model for the EPS performance rights, with the following inputs:
Relative TSR Absolute EPSGrant date 2 September 2016 2 September 2016Grant date share price $1.50 $1.50Fair value at grant date $0.88 $1.24Exercise price Nil NilDividend yield 6.43% 6.43%Risk free interest rate 1.45% 1.45%Expected volatility 39.32% 39.32%
The fair value at grant date of the securities granted is adjusted to reflect market vesting conditions, but excludes the impact of any non‑market vesting conditions (for example, profitability and sales growth targets). Non‑market vesting conditions are included in assumptions about the number of shares that are expected to be issued. At each balance sheet date, the entity revises its estimate of the number of shares that are expected to be issued. The employee benefit expense recognised each period takes into account the most recent estimate. The impact of the revision to original estimates, if any, is recognised in profit or loss with a corresponding adjustment to equity. Where the terms of the share‑based payment entitlement are modified in the favour of the employee, the changes are reflected when determining the impact on profit or loss.
82 Southern Cross Austereo . Annual Report

21. Remuneration of Auditors
Consolidated2017
$2016
$(a) Audit and other assurance servicesPricewaterhouseCoopers Australian firm:Statutory audit and review of financial reports 594,500 644,400Other assurance services 50,000 –Regulatory returns 27,000 35,000Total remuneration for audit and other assurance services 671,500 679,400(b) Taxation servicesPricewaterhouseCoopers Australian firm:Tax services – 21,750Total remuneration for taxation services – 21,750(c) Other services PricewaterhouseCoopers Australian firm:Debt advisory 12,000 –Total remuneration for other services 12,000 –Total 683,500 701,150
The Group may decide to employ the auditor on assignments additional to their statutory audit duties where the auditor’s expertise and experience with the Company and/or the Group are important.
The Board has considered the position and, in accordance with the advice received from the Audit & Risk Committee, is satisfied that the provision of the non‑audit services is compatible with the general standard of independence for auditors imposed by the Corporations Act 2001. The Directors are satisfied that the provision of non‑audit services by the auditor did not compromise the auditor independence requirements of the Corporations Act 2001 for the following reasons:
– all non‑audit services have been reviewed by the Audit & Risk Committee to ensure they do not impact the impartiality and objectivity of the auditor; and
– none of the services undermine the general principles relating to auditor independence as set out in APES 110: Code of Ethics for Professional Accountants, including reviewing or auditing the auditor’s own work, acting in a management or a decision‑making capacity for the Company, acting as advocate for the Company or jointly sharing economic risk and rewards.
83Southern Cross Austereo . Annual Report

NOTES TO THE FINANCIAL STATEMENTSFOR YEAR ENDED 30 JUNE 2017
22. Related Party DisclosuresBalances and transactions between the Company and its subsidiaries, which are related parties of the Company, have been eliminated on consolidation and are not disclosed in this note. Details of transactions between the Group and other related parties are disclosed below.
a) KMPDuring the year, no KMP of the Company or the Group has received or become entitled to receive any benefit because of a contract made by the Group with a KMP or with a firm of which a KMP is a member, or with an entity in which the KMP has a substantial interest, except on terms set out in the governing documents of the Group or as disclosed in this financial report.
The aggregate compensation of KMP of the Group is set out below:
Consolidated2017
$2016
$Short‑term employee benefits 6,110,212 5,892,717Post‑employment benefits 215,634 238,391Other long‑term benefits 12,655 31,212Termination payments – 294,531Share‑based payments 733,166 571,383
7,071,667 7,028,234
Note: Changes to KMP during the year can be found in the Remuneration Report.
The number of ordinary shares in the Company held during the financial year by KMP of the Company and Group, including their personally related parties, are set out in the Remuneration Report in the Directors’ Report. There were no loans made to or other transactions with KMP during the year (2016: nil).
b) Subsidiaries and AssociatesOwnership interests in subsidiaries are set out in note 18. Details of interests in associates and distributions received from associates are disclosed in note 17. Details of loans due from associates are disclosed in note 10.
84 Southern Cross Austereo . Annual Report

23. Leases and Other Commitments
Consolidated2017
$’0002016
$’000Capital commitmentsCommitments for the acquisition of plant and equipment contracted for at the reporting date but not recognised as liabilities are payable as follows:Within one year 1,085 2,850
1,085 2,850Operating leasesCommitments for minimum lease payments in relation to non‑cancellable operating leases are payable as follows:Within one year 20,192 22,457Later than one year but not later than five years 53,701 62,707Later than five years 20,603 31,113
94,496 116,277Finance lease payment commitmentsFinance lease commitments are payable as follows:Within one year 90 144Later than one year but not later than five years 27 136Later than five years 4 4
121 284Less: Future lease finance charges (5) (23)
116 261Lease liabilities provided for in the financial statements:Current 86 129Non‑current 30 132Total lease liability 116 261
LeasesLeases of property, plant and equipment where the Group, as lessee, has substantially all the risks and rewards of ownership are classified as finance leases. Finance leases are capitalised at the lease’s inception at the lower of the fair value of the leased property and the present value of the minimum lease payments. The corresponding rental obligations, net of finance charges, are included in other long‑term payables.
Leases in which a significant portion of the risks and rewards of ownership are retained by the lessor are classified as operating leases. Payments made under operating leases (net of any incentives received from the lessor) are charged to profit or loss on a straight‑line basis over the period of the lease.
The Group sub‑leases buildings under an operating lease and rent revenue is recorded as income in the profit or loss on a straight‑line basis.
Rental expense relating to operating leases included in occupancy costs is $26.9 million (2016: $25.5 million).
24. Events Occurring after Balance DateOther than matters outlined elsewhere in this report, no matters or circumstances have arisen since the end of the financial year that have significantly affected, or may significantly affect, the operations, results of operations or state of affairs of the Group in subsequent accounting periods.
85Southern Cross Austereo . Annual Report

NOTES TO THE FINANCIAL STATEMENTSFOR YEAR ENDED 30 JUNE 2017
25. Other Accounting PoliciesDefined contribution schemeThe Group operates a defined contribution scheme. The defined contribution scheme comprises fixed contributions made by the Group with the Group’s legal or constructive obligation being limited to these contributions. Contributions to the defined contribution scheme are recognised as an expense as they become payable. Prepaid contributions are recognised in the Statement of Financial Position as an asset to the extent that a cash refund or a reduction in the future payments is available. The defined contribution plan expense for the year was $14.4 million (2016: $13.3 million) and is included in employee expenses.
Derivative financial instruments The Group enters into interest rate swap agreements to manage its financial risks. Derivatives are initially recognised at fair value at the date a derivative contract is entered into and are subsequently remeasured to their fair value. The method of recognising the resulting gain or loss depends on whether the derivative is designated as a hedging instrument and, if so, the nature of the item being hedged. The Group may have derivative financial instruments which are economic hedges, but do not satisfy the requirements of hedge accounting. Gains or losses from changes in fair value of these economic hedges are taken through profit or loss.
If the derivative financial instrument meets the hedge accounting requirements, the Group designates the derivatives as either (1) hedges of the fair value of recognised assets or liabilities or a firm commitment (fair value hedge); or (2) hedges of highly probable forecast transactions (cash flow hedge). The Group documents at the inception of the transaction the relationship between hedging instruments and hedged items, as well as its risk management objective and strategy for undertaking various hedge transactions. The Group also documents its assessments, both at hedge inception and on an ongoing basis, of whether the derivatives that are used in hedging transactions have been and will continue to be highly effective in offsetting changes in fair values or cash flows of hedged items.
The fair values of over‑the‑counter derivatives are determined using valuation techniques adopted by the Directors with assumptions that are based on market conditions existing at each balance sheet date. The fair values of interest rate swaps are calculated as the present values of the estimated future cash flows.
Hedge accountingThe Group designated interest rates swaps held as at 1 July 2011 as cash flow hedges and has applied hedge accounting from this date.
The Group documents the relationship between hedging instruments and hedged items, as well as its risk management objective and strategy for undertaking the hedge transactions. The Group also documents its assessment, both at hedge inception and on an ongoing basis, of whether the derivatives that are used in hedging transactions have been and will continue to be highly effective in offsetting changes in cash flows of hedged items.
The fair values of derivative financial instruments used for hedging purposes are presented within the balance sheet. Movements in the hedging reserve are shown within the Statement of Changes in Equity. The full fair value of a hedging derivative is classified as a non‑current asset or liability when the remaining maturity of the hedged item is more than 12 months; it is classified as a current asset or liability when the remaining maturity of the hedged item is less than 12 months.
Cash flow hedge The effective portion of changes in the fair value of derivatives that are designated and qualify as cash flow hedges is recognised in other comprehensive income and accumulated in reserves in equity. The gain or loss relating to the ineffective portion is recognised immediately in the Statement of Comprehensive Income.
Amounts accumulated in equity are reclassified to profit or loss in the periods when the hedged item affects profit or loss (for instance when the forecast sale that is hedged takes place). The gain or loss relating to the effective portion of interest rate swaps hedging variable rate borrowings is recognised in profit or loss within “interest expense and other borrowing costs”. When a hedging instrument expires or is sold or terminated, or when a hedge no longer meets the criteria for hedge accounting, any cumulative gain or loss existing in equity at that time remains in equity and is recognised when the forecast transaction is ultimately recognised in profit or loss. When a forecast transaction is no longer expected to occur, the cumulative gain or loss that was reported in equity is immediately reclassified to profit or loss.
Fair value estimationThe fair value of financial assets and financial liabilities must be estimated for recognition and measurement or for disclosure purposes.
The Group has adopted AASB 7 Financial Instruments: Disclosures which requires disclosure of fair value measurements by level of the following fair value measurement hierarchy:
Level 1 – quoted prices (unadjusted) in active markets for identical assets or liabilities;
Level 2 – inputs other than quoted prices included within Level 1 that are observable for the asset or liability, either directly (as prices) or indirectly (derived from prices); and
Level 3 – inputs for the asset or liability that are not based on observable market data (unobservable inputs).
The fair value of financial instruments that are not traded in an active market (for example, unlisted convertible notes) is determined using valuation techniques. The Group uses a variety of methods and makes assumptions that are based on market conditions existing at each balance date. Other techniques, such as estimated discounted cash flows, are used to determine fair value for the remaining financial instruments. The fair value of interest rate swaps is calculated as the present value of the estimated future cash flows.
The nominal value less estimated credit adjustments of trade receivables and payables are assumed to approximate their fair values. The fair value of financial liabilities for disclosure purposes is estimated by discounting the future contractual cash flows at the current market interest rate that is available to the Group for similar financial instruments.
Impact of new accounting policiesThe year end financial statements have been prepared on a basis of accounting policies consistent with those applied in the 30 June 2016 Annual Report. The Group adopted certain accounting standards, amendments, and interpretations during the financial year which did not result in changes in accounting policies nor an adjustment to the amounts recognised in the financial statements. They also do not significantly affect the disclosures in the notes to the financial statements.
86 Southern Cross Austereo . Annual Report
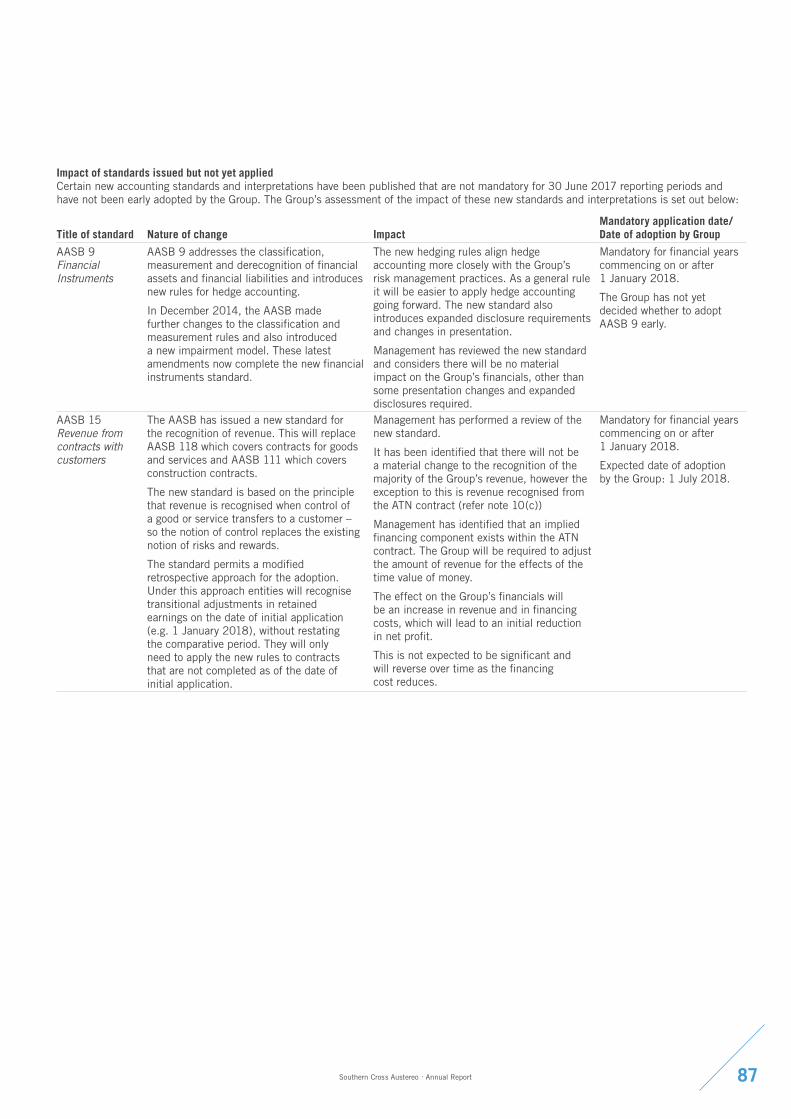
Impact of standards issued but not yet applied Certain new accounting standards and interpretations have been published that are not mandatory for 30 June 2017 reporting periods and have not been early adopted by the Group. The Group’s assessment of the impact of these new standards and interpretations is set out below:
Title of standard Nature of change ImpactMandatory application date/Date of adoption by Group
AASB 9 Financial Instruments
AASB 9 addresses the classification, measurement and derecognition of financial assets and financial liabilities and introduces new rules for hedge accounting.
In December 2014, the AASB made further changes to the classification and measurement rules and also introduced a new impairment model. These latest amendments now complete the new financial instruments standard.
The new hedging rules align hedge accounting more closely with the Group’s risk management practices. As a general rule it will be easier to apply hedge accounting going forward. The new standard also introduces expanded disclosure requirements and changes in presentation.
Management has reviewed the new standard and considers there will be no material impact on the Group’s financials, other than some presentation changes and expanded disclosures required.
Mandatory for financial years commencing on or after 1 January 2018.
The Group has not yet decided whether to adopt AASB 9 early.
AASB 15 Revenue from contracts with customers
The AASB has issued a new standard for the recognition of revenue. This will replace AASB 118 which covers contracts for goods and services and AASB 111 which covers construction contracts.
The new standard is based on the principle that revenue is recognised when control of a good or service transfers to a customer – so the notion of control replaces the existing notion of risks and rewards.
The standard permits a modified retrospective approach for the adoption. Under this approach entities will recognise transitional adjustments in retained earnings on the date of initial application (e.g. 1 January 2018), without restating the comparative period. They will only need to apply the new rules to contracts that are not completed as of the date of initial application.
Management has performed a review of the new standard.
It has been identified that there will not be a material change to the recognition of the majority of the Group’s revenue, however the exception to this is revenue recognised from the ATN contract (refer note 10(c))
Management has identified that an implied financing component exists within the ATN contract. The Group will be required to adjust the amount of revenue for the effects of the time value of money.
The effect on the Group’s financials will be an increase in revenue and in financing costs, which will lead to an initial reduction in net profit.
This is not expected to be significant and will reverse over time as the financing cost reduces.
Mandatory for financial years commencing on or after 1 January 2018.
Expected date of adoption by the Group: 1 July 2018.
87Southern Cross Austereo . Annual Report

NOTES TO THE FINANCIAL STATEMENTSFOR YEAR ENDED 30 JUNE 2017
Title of standard Nature of change ImpactMandatory application date/Date of adoption by Group
AASB 16 Leases The AASB has issued a new standard for lease accounting. AASB 16 will replace AASB 17.
Lessee accounting – Lessees are required to recognise assets
and liabilities for all leases with a term of more than 12 months, unless the underlying asset is of low value.
– A lessee measures right‑of‑use assets similarly to other non‑financial assets and lease liabilities similarly to other financial liabilities.
– Assets and liabilities arising from a lease are initially measured on a present value basis. The measurement includes non‑cancellable lease payments (including inflation‑linked payments), and also includes payments to be made in optional periods if the lessee is reasonably certain to exercise an option to extend the lease, or not to exercise an option to terminate the lease.
– AASB 16 includes disclosure requirements for lessees.
Lessor accounting will not change significantly.
Management has performed an initial assessment of the new standard and considers there will be a significant impact on the Group’s financials.
Applying the new standard will result in the following changes to the Group’s financials: – A decrease in operating costs due to the
reduction in operating lease expenditure. – An initial reduction in net profit for each
lease due to the increase in depreciation on the right‑of‑use lease asset and an increase in interest expense on the lease liabilities.
This is expected to reverse over time as the portfolio of leases matures.
– A gross‑up of the balance sheet to account for the new right‑of‑use lease assets and related lease liabilities.
Mandatory for financial years commencing on or after 1 January 2019 but available for early adoption.
Expected date of adoption by the Group: 1 July 2019.
25. Other Accounting Policies (continued)
88 Southern Cross Austereo . Annual Report

The Directors of the Company declare that:
1. in the Directors’ opinion, there are reasonable grounds to believe that the Company will be able to pay its debts as and when they become due and payable;
2. in the Directors’ opinion, the financial statements and notes as set out on pages 54 to 88 are in accordance with the Corporations Act 2001, including compliance with accounting standards and giving a true and fair view of the financial position and performance of the Company and the consolidated entity; and
3. the Directors have been given the declarations required by section 295A of the Corporations Act 2001.
4. Note 1(i) confirms that the financial statements also comply with International Financial Reporting Standards as issued by the International Accounting Standards Board.
Signed in accordance with a resolution of the Directors made pursuant to section 295(5) of the Corporations Act.
On behalf of the Directors
Peter Bush Leon Pasternak Chairman Deputy Chairman Sydney, Australia Sydney, Australia 24 August 2017 24 August 2017
DIRECTORS’ DECLARATION FOR YEAR ENDED 30 JUNE 2017
89Southern Cross Austereo . Annual Report
INDEPENDENT AUDITOR’S REPORT TO THE MEMBERS OF SOUTHERN CROSS MEDIA GROUP LIMITED
Independent auditor’s report To the shareholders of Southern Cross Media Group Limited
Report on the audit of the financial report Our opinion In our opinion:
The accompanying financial report of Southern Cross Media Group Limited (the Company) and its controlled entities (together the Group or Southern Cross Austereo) is in accordance with the Corporations Act 2001, including:
a) giving a true and fair view of the Group’s financial position as at 30 June 2017 and of its financial performance for the year then ended
b) complying with Australian Accounting Standards and the Corporations Regulations 2001.
What we have auditedThe Group financial report comprises:
• the statement of financial position as at 30 June 2017
• the statement of comprehensive income for the year then ended
• the statement of changes in equity for the year then ended
• the statement of cash flows for the year then ended
• the notes to the financial statements, which include a summary of significant accounting policies
• the directors’ declaration.
Basis for opinion We conducted our audit in accordance with Australian Auditing Standards. Our responsibilities under those standards are further described in the Auditor’s responsibilities for the audit of the financial report section of our report.
We believe that the audit evidence we have obtained is sufficient and appropriate to provide a basis for our opinion.
Independence
We are independent of the Group in accordance with the auditor independence requirements of the Corporations Act 2001 and the ethical requirements of the Accounting Professional and Ethical Standards Board’s APES 110 Code of Ethics for Professional Accountants (the Code) that are relevant to our audit of the financial report in Australia. We have also fulfilled our other ethical responsibilities in accordance with the Code.
PricewaterhouseCoopers, ABN 52 780 433 7572 Riverside Quay, Southbank VIC 3006, GPO BOX 1331, Melbourne VIC 3001 T +61 3 8603 1000, F +61 3 8603 1999, www.pwc.com.au
Liability limited by a scheme approved under Professional Standards Legislation.
90 Southern Cross Austereo . Annual Report

Our audit approach An audit is designed to provide reasonable assurance about whether the financial report is free from material misstatement. Misstatements may arise due to fraud or error. They are considered material if individually or in aggregate, they could reasonably be expected to influence the economic decisions of users taken on the basis of the financial report.
We tailored the scope of our audit to ensure that we performed enough work to be able to give an opinion on the financial report as a whole, taking into account the geographic and management structure of the Group, its accounting processes and controls and the industry in which it operates.
Materiality
For the purpose of our audit we used overall group materiality of $6.3 million, which represents approximately 5% of the Group’s profit before tax.
We applied this threshold, together with qualitative considerations, to determine the scope of our audit and the nature, timing and extent of our audit procedures and to evaluate the effect of misstatements on the financial report as a whole.
We chose group profit before tax because, in our view, it is the metric against which the performance of the Group is most commonly measured and is a generally accepted benchmark.
We selected 5% based on our professional judgement noting that it is within the range of commonly acceptable profit related thresholds.
Audit scope
Our audit focused on where the Group made subjective judgements for example, significant accounting estimates involving assumptions and inherently uncertain future events.
The Group operates in Australia and the audit is conducted by one engagement team.
Our scope reflects the Group’s business model, with multiple revenue accounting systems in operation for the majority of the year. Towards the end of the financial year, revenue systems were consolidated into two distinct systems that follow similar processes for consolidating into the general ledger accounting system. Given multiple systems were in place for the majority of the year, our audit comfort was predominantly obtained from substantive procedures such as analytical review and test of details.
91Southern Cross Austereo . Annual Report
INDEPENDENT AUDITOR’S REPORT TO THE MEMBERS OF SOUTHERN CROSS MEDIA GROUP LIMITED (CONTINUED)
Key audit matters Key audit matters are those matters that, in our professional judgement, were of most significance in our audit of the financial report for the current period. The key audit matters were communicated to the Audit and Risk Committee.
The key audit matters were addressed in the context of our audit of the financial report as a whole, and in forming our opinion thereon, and we do not provide a separate opinion on these matters. Further, any commentary on the outcomes of a particular audit procedure is made in that context.
Key audit matter How our audit addressed the key audit matterImpairment testing for licences, tradenames, and brands (Refer to note 8) Southern Cross Austereo recognised indefinite lived intangible assets totalling $1.25 billion as at 30 June 2017 which, under Australian Accounting Standards, must be tested annually for impairment.
This was a key audit matter because the determination of whether or not an impairment charge for intangible assets was necessary involved significant judgements by the Group about the future results of the business and assessment of future plans for the Group for both Regional and Metro cash generating units (CGUs). Judgements made in determining whether an impairment should be recorded included assumptions about internal and external factors such as the level of historic and forecast industry growth rates, the financial performance of Southern Cross Austereo in the markets in which it operatesand the discount rate.
In designing our audit approach for the key audit matter we considered:• whether there have been any changes in how
financial information is reported to the Group CEO and Company Board of Directors, to consider if CGUs have been identified appropriately for impairment testing
• the financial and operating performance of the CGUs compared with the budgets of prior years
• the challenging and changing operating environment within the TV industry, including the results of the new affiliation agreement between the Group and Channel Nine
• recent Radio and TV ratings and the impact on financial performance by the Group
• the status of the Government’s media reform package, including the proposed ACMA licence fee reductions
• the potential reasons for the change in market capitalisation of the Company and the carrying value of the assets through the year and their impact on our assessment of potential impairment; and
• developments during the year that could impact the discount rate and the long term growth rate calculations.
We obtained the value-in-use discounted cash flow model (the model) used for impairment testing by the Group and performed mathematical checks on the model.
We developed an understanding of the Group’sprocess for preparing forecast cash flows in the model and evaluated the Group’s ability to forecast future cash flows by considering thehistorical accuracy of budgeted cash flows.
We assessed key assumptions within the model with specific focus on forecast revenue and profit margins (including consideration of underlying
92 Southern Cross Austereo . Annual Report

Key audit matter How our audit addressed the key audit matterestimates such as market growth, forecast ratings results and sales conversion ratios). We compared the key assumptions in the model to readily available market information such as 3rd party market share publications, 3rd party forecast revenue projections for the television and radio industries, along with Group produced historical financial information and strategic plans. We considered the Directors’ judgement that the proposed ACMA licence fee reductions, the legislation for which has not been enacted, should be included in the forecast cash flows within the model.
Sensitivity analysis was performed over key assumptions in the model to ascertain the extent of change in those assumptions that either individually or collectively would result in the assets being impaired and we also assessed the likelihood of such a movement in those key assumptions arising.
We utilised PwC valuations experts to calculate an independent discount rate range to compare tothe discount rate used by the Group.
Indefinite life of intangible assets(Refer to note 7)On at least an annual basis, Southern Cross Austereo reviews its portfolio of intangible assets to determine whether they should be classified as amortising intangible assets with finite lives or non–amortising intangibles with indefinite lives. As of 30 June 2017, Southern Cross Austereo recognised $1.25 billion of intangible assets classified as non-amortising indefinite lived.
This was a key audit matter because determination of whether or not intangibles are indefinite lived involves significant judgements over multiple sources of externally and internally generated information. The determination has an impact on the financial statements as it affects whether amortisation is recorded in the statement of comprehensive income. Information assessed includes the regulatory and licencing framework and the ease of licence fee renewal. This information is then compared with relevant industry developments, such as the market share of new digital entrants that are not subject to the same regulatory and licence framework. Finally, relevant external developments are considered alongside Group prepared strategic plans and budgets to assess if the assets are indefinite lived.
In assessing the indefinite useful life of intangible assets we considered: • regulatory developments in the year with
specific focus on any changes to the licence renewal process
• whether there had been any revocation of television or radio licences in the year
• market share data related to new industry participants not subject to the same regulatory and licence framework and
• strategic plans for the Group’s intended use of the related assets.
We also benchmarked the conclusion made by Southern Cross Austereo against a selection of similar assets held by other industry participants.
93Southern Cross Austereo . Annual Report

INDEPENDENT AUDITOR’S REPORT TO THE MEMBERS OF SOUTHERN CROSS MEDIA GROUP LIMITED (CONTINUED)
Key audit matter How our audit addressed the key audit matter
Borrowings(Refer to note 15) The capital structure of the Group is importantto developing an understanding of the financial statements, as is the assessment of whether borrowings are current or non-current.
The Group has $370m of borrowings maturing in January 2019 that were classified as non-current at 30 June 2017. Where borrowings have been classified as non-current, the Groupassessed whether it had an unconditional right to defer payment for more than 12 months from the balance date.
This borrowings balance represented 39% of total liabilities and, due to the magnitude of the balance, was deemed to be a key audit matter.
To assess if the loan amount is appropriately recognised, a confirmation was obtained directly from the agent of the syndicated financial institutions that issued the loan. The confirmation detailed relevant information including amounts, tenor and other relevant conditions.
We obtained the debt agreement to develop our understanding of the arrangements of the loan and maturity profile of the facility. We compared the loan and maturity profile of the facility withinthe debt agreement to the classification of borrowings in the financial statements at 30 June 2017.
Deferred tax liability(Refer to note 1 and note 5) During the period, guidance was published by the IFRS Interpretation Committee (IFRIC) to clarify the accounting treatment of deferred tax in relation to indefinite lived intangible assets.
In reviewing this guidance, the Group made a judgement that, for tax purposes, the carrying value of the indefinite lived intangible assets should be determined on the basis of recoverythrough use rather than through sale. This resulted in a retrospective change in accounting policy, and a change in deferred tax recorded at 1 July 2015 from a deferred tax asset of $12.3m to a deferred tax liability of $371.3m.
Due to the magnitude of the balance this was deemed to be a key audit matter.
In assessing the change in accounting policy, we performed the following procedures:
• We considered the guidance published by IFRIC and compared to the Group’s analysis and conclusion and
• We re-performed the calculation underlying the $371.3m deferred tax liability.
Other information The directors are responsible for the other information. The other information included in the annual report comprises the Directors’ Report (but does not include the financial report and our auditor’s report thereon), which we obtained prior to the date of this auditor’s report. We also expect other information to be made available to us after the date of this auditor’s report, including the Chairman’sStatement, CEO’s Report, Additional Stock Exchange Information, Corporate Directory, Board of Directors overview, and other operational highlights including Statistics Snapshot, Brand Hierarchy, Metro Audiences Engage with SCA, Winning the Hearts of Locals in Regional Australia, Australia’s Largest Audio Network, The Commercial Power of SCA, and People, Values & Partners.
Our opinion on the financial report does not cover the other information and we do not and will not express an opinion or any form of assurance conclusion thereon.
94 Southern Cross Austereo . Annual Report

In connection with our audit of the financial report, our responsibility is to read the other information identified above and, in doing so, consider whether the other information is materially inconsistent with the financial report or our knowledge obtained in the audit, or otherwise appears to be materially misstated.
If, based on the work we have performed on the other information that we obtained prior to the date of this auditor’s report, we conclude that there is a material misstatement of this other information, we are required to report that fact. We have nothing to report in this regard.
When we read the other information not yet received as identified above, if we conclude that there is a material misstatement therein, we are required to communicate the matter to the directors and use our professional judgement to determine the appropriate action to take.
Responsibilities of the directors for the financial reportThe directors of the Company are responsible for the preparation of the financial report that gives a true and fair view in accordance with Australian Accounting Standards and the Corporations Act 2001and for such internal control as the directors determine is necessary to enable the preparation of the financial report that gives a true and fair view and is free from material misstatement, whether due to fraud or error.
In preparing the financial report, the directors are responsible for assessing the ability of the Group to continue as a going concern, disclosing, as applicable, matters related to going concern and using the going concern basis of accounting unless the directors either intend to liquidate the Group or to cease operations, or have no realistic alternative but to do so.
Auditor’s responsibilities for the audit of the financial reportOur objectives are to obtain reasonable assurance about whether the financial report as a whole is free from material misstatement, whether due to fraud or error, and to issue an auditor’s report that includes our opinion. Reasonable assurance is a high level of assurance, but is not a guarantee that an audit conducted in accordance with the Australian Auditing Standards will always detect a material misstatement when it exists. Misstatements can arise from fraud or error and are considered material if, individually or in the aggregate, they could reasonably be expected to influence the economic decisions of users taken on the basis of the financial report.
A further description of our responsibilities for the audit of the financial report is located at the Auditing and Assurance Standards Board website at: http://www.auasb.gov.au/auditors_responsibilities/ar1.pdf. This description forms part of our auditor’s report.
Report on the remuneration reportOur opinion on the remuneration reportWe have audited the remuneration report included in pages 35 to 51 of the directors’ report for the year ended 30 June 2017.
In our opinion, the remuneration report of Southern Cross Media Group Limited for the year ended 30 June 2017 complies with section 300A of the Corporations Act 2001.
95Southern Cross Austereo . Annual Report

INDEPENDENT AUDITOR’S REPORT TO THE MEMBERS OF SOUTHERN CROSS MEDIA GROUP LIMITED (CONTINUED)
Responsibilities The directors of the Company are responsible for the preparation and presentation of the remuneration report in accordance with section 300A of the Corporations Act 2001. Our responsibility is to express an opinion on the remuneration report, based on our audit conducted in accordance with Australian Auditing Standards.
PricewaterhouseCoopers
Sam Lobley MelbournePartner 24 August 2017
96 Southern Cross Austereo . Annual Report

ADDITIONAL STOCK EXCHANGE INFORMATION
The additional stock exchange information set out below was applicable as at 31 August 2017. The Company has only one class of shares, fully paid ordinary shares. All holders listed below hold fully paid ordinary shares and each holder has the same voting rights. There are no unlisted securities and there is currently no on‑market buy‑back.
The names of the 20 largest holders of the Company’s quoted equity securities are listed below.
NameFully paid ordinary
shares% of issued
capitalHSBC Custody Nominees (Australia) Limited 247,588,976 32.20J P Morgan Nominees Australia Limited 168,954,911 21.97Citicorp Nominees Pty Limited 136,276,953 17.72National Nominees Limited 84,521,742 10.99BNP Paribas Noms Pty Ltd (DRP) 25,014,402 3.25RBC Investor Services Australia Pty Limited (VFA A/C) 18,587,745 2.42BNP Paribas Nominees Pty Ltd (Agency Lending DRP A/C) 15,600,585 2.03AMP Life Limited 5,111,122 0.66Citicorp Nominees Pty Limited (Colonial First State Inv A/C) 4,454,915 0.58HSBC Custody Nominees (Australia) Limited‑GSCO ECA 3,009,661 0.39Brispot Nominees Pty Ltd (House Head Nominee A/C) 2,767,367 0.36Warbont Nominees Pty Ltd (Unpaid Entrepot A/C) 1,989,157 0.26Sandhurst Trustees Ltd (SISF A/C) 1,450,000 0.19HSBC Custody Nominees (Australia) Limited – A/C 2 964,464 0.13Ecapital Nominees Pty Limited (Accumulation A/C) 819,383 0.11Mr James Gardiner 800,000 0.10BNP Paribas Nominees Pty Ltd (Agency Lending Collateral) 783,000 0.10Aotearoa Investment Company Pty Limited (Roberts Investment No 2 A/C) 776,393 0.10Commercial Custodian Nominees Pty Ltd (Pasternak Super Fund A/C) 677,000 0.09Abbysah Pty Limited (Weiss Super Fund A/C) 614,397 0.08
720,762,173 93.73
Analysis of numbers of equity security holders by size of holding:
RangeNumber of
shareholdersFully paid
ordinary shares1 – 1,000 816 306,3361,001 – 5,000 1,391 4,048,8595,001 – 10,000 709 5,497,61410,001 – 100,000 996 25,762,992100,001 and over 80 733,397,804
3,992 769,013,605Holding less than a marketable parcel 452 23,648
Substantial holders in the Company (with holdings as notified to the Company most recently before 31 August 2017) are set out below:
NameFully paid ordinary
shares% of issued
capitalAllan Gray Australia Pty Ltd and its related bodies corporate 90,715,380 11.80%Commonwealth Bank of Australia and its related bodies corporate 42,887,576 5.57%Investors Mutual Ltd and its related bodies corporate 39,412,524 5.13%Dimension Fund Advisors LP and related entities 39,175,389 5.09%
163,428,082 21.25%
Securities subject to voluntary escrow are set out below:
TypeDate escrow period ends
Fully paid ordinary shares
Voluntary escrow N/a –
97Southern Cross Austereo . Annual Report

CORPORATE DIRECTORYSOUTHERN CROSS MEDIA GROUP LIMITEDABN 91 116 024 536
Company SecretaryMr Tony Hudson Registered OfficeLevel 2257 Clarendon StreetSouth Melbourne VIC 3205+61 3 9252 1019 Share RegistryComputershare Investor Services Pty LimitedYarra Falls452 Johnston StreetAbbotsford VIC 3067
The text of this report is printed on ecoStar, an environmentally responsible paper made Carbon Neutral. The greenhouse gas emissions of the manufacturing process including transportation of the finished product to BJ Ball Papers Warehouses has been measured by the Edinburgh Centre for Carbon Neutral Company and the fibre source has been independently certified by the Forest Stewardship Council (FSC®). ecoStar is manufactured from 100% Post Consumer Recycled paper in a Process Chlorine Free environment under the ISO 14001 environmental management system.
Sourcing included within this document: GFK Radio Ratings. Survey 5 2017‑ Metro / DAB+. Gold Coast, Newcastle & Canberra Survey #2 2017 Mon‑Sun 5:30‑12mn Cume. Xtra Insights Griffith, Mt Gambier, Shepparton, Toowoomba, West Gippsland, Orange, Wagga Wagga, Gosford, Rocky‑Gladstone, Mildura, Hobart , Bunbury, Bendigo and Townsville Survey 1 2016. Wheatbelt, Esperance, Dubbo, Mt Isa, Kingaroy, Roma, Emerald, Port Macquarie, Mackay, Cairns, Coffs Harbour, Albury, Bundaberg, Albany, Kalgoorlie, Maryborough Survey #1 2017, Mon‑Sun 5:30‑12mn Cume. Nielsen Online Ratings July 2017. Regional TAM. 4AGGS & TAS. 0200‑2600. Weekly reach divided by number of weeks = Ave Weekly Reach. Week 1‑ 34 2017. Facebook Insights as at 31.08.17. Facebook as at 31.08.17. Twitter as at 31.08.17. Instagram as at 31.08.17.
98 Southern Cross Austereo . Annual Report


REPORTANNUAL
SOU
THER
N C
RO
SS
AU
STEREO
| AN
NU
AL R
EP
OR
T 20
17


