This article appeared in a journal published by Elsevier. The attached copy is furnished to the author for internal non-commercial research and education use, including for instruction at the authors institution and sharing with colleagues. Other uses, including reproduction and distribution, or selling or licensing copies, or posting to personal, institutional or third party websites are prohibited. In most cases authors are permitted to post their version of the article (e.g. in Word or Tex form) to their personal website or institutional repository. Authors requiring further information regarding Elsevier’s archiving and manuscript policies are encouraged to visit: http://www.elsevier.com/authorsrights
Transcript
This article appeared in a journal published by Elsevier. The attachedcopy is furnished to the author for internal non-commercial researchand education use, including for instruction at the authors institution
and sharing with colleagues.
Other uses, including reproduction and distribution, or selling orlicensing copies, or posting to personal, institutional or third party
websites are prohibited.
In most cases authors are permitted to post their version of thearticle (e.g. in Word or Tex form) to their personal website orinstitutional repository. Authors requiring further information
regarding Elsevier’s archiving and manuscript policies areencouraged to visit:
Effect of frothers on bubble coalescence and foaming in electrolytesolutions and seawater
S. Castro a,⁎, C. Miranda a, P. Toledo b, J.S. Laskowski c
a Department of Metallurgical Engineering, University of Concepcion, Concepción, Chileb Department of Chemical Engineering, University of Concepcion, Concepción, Chilec Department on Mining Engineering, The University of British Columbia, Vancouver, Canada
a b s t r a c ta r t i c l e i n f o
Article history:Received 5 October 2011Received in revised form 11 July 2013Accepted 13 July 2013Available online 20 July 2013
Inhibition of bubble coalescence is of fundamental importance in a flotation process because it determinesthe size of bubbles and foam stability. For this work commercial frothers have been selected, MIBC, DF-250,DF-400 and DF-1012; and NaCl as inorganic electrolyte. Surface tension measurements used to characterizethe tested frothers revealed that these frothers have quite different properties. Polypropylene glycols are muchmore surface active than MIBC. The differences between these two are further augmented in concentratedNaCl electrolyte solutions. The concept of the surface tension switch point (s.t.s.p.) is introduced to characterizethe effect of electrolyte concentration on frother properties. The s.t.s.p. values for MIBC and DF-250 were deter-mined to be around 120 ppm and 1.2 ppm, respectively. The effect of MIBC and DF-250 frothers on bubblecoalescence was not very different, although finer bubbles were generated in the presence of MIBC thanof DF-250 in seawater. Only dynamics foamability measurements (DFI) confirmed the differences, thefoams produced in the presence of DF-250 were much more stable, also in electrolyte solutions. This factconfirms the importance of dynamic effects in foam formation and stabilization.
The sizes of bubbles, which are determined by bubble coalescence,play a very important role in the flotation process. Flotation frothers –weakly surface active compounds – are employed to facilitate air disper-sion into fine bubbles and to stabilize the froth. Bubble coalescence is aparticularly complex phenomenon especially when it takes place insaline water or seawater, since both surface active compound (frother)and surface-inactive compound (inorganic salt) are able to stabilizebubbles against coalescence and thus reduce bubble size.
The mechanism of bubble coalescence in solutions of frothers hasbeen extensively studied. The coalescence of bubbles can be completelyprevented at frother concentration exceeding a particular concentra-tion, referred to as critical coalescence concentration (CCC) (Cho andLaskowski, 2002; Laskowski et al., 2003; Grau et al., 2005; Grau andLaskowski, 2006).
Inorganic electrolytes also inhibit bubble coalescence (Laskowskiet al., 2003) and increase gas holdup in flotation systems (Quinn et al.,2007; Kracht and Finch, 2010). Smaller bubbles rise at lower velocitiesand thus gas residence time increases.
Most of common inorganic electrolytes show positive coalescenceinhibition, some salts do not affect it suggesting that specific-ion effectsand ion–water interactions play a role (Marrucci and Nicodemo, 1967;Zieminski and Whittemore, 1971; Lessard and Zieminski, 1971; Keiteland Onken, 1982; Craig et al., 1993a,b; Weissenborn and Pugh, 1995and 1996; Deschenes et al., 1998; Craig, 2004).
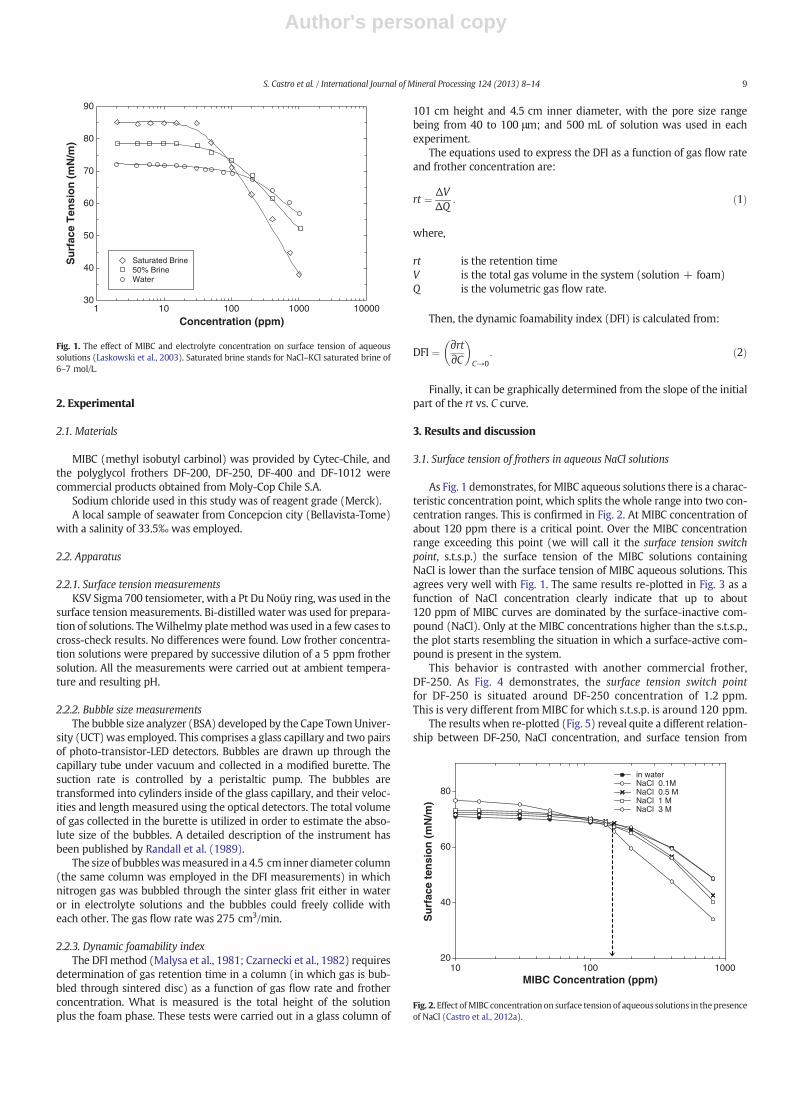
In a number of applications, e.g., froth flotation in brines and inseawater, frothers are used in concentrated electrolyte solutions. Flota-tion of potash ores is carried out in a NaCl–KCl saturated brine, which isa solution of 6–7 mol of NaCl–KCl/L. The surface tension measurementscarried out with MIBC under such conditions (Laskowski et al., 2003)revealed an interesting relationship between surface tension, MIBCconcentration and electrolyte concentration. This relationship is shownin Fig. 1 as we decided to explore it further in this work. As it is seen,the three experimental surface tension isotherms intersect at one MIBCconcentration and it seems that this intersection point could be used todepict the effect of ionic strength of the solution on the surface propertiesof tested frothers.
The aim of the present work is to study bubble coalescence in thepresence of common flotation frothers in electrolyte solutions and inseawater. A better understanding of the mechanism of bubble coales-cence in flotation cells, when seawater or saline water is used, is neededif seawater flotation is to be commercialized. The bubble coalescence inthiswork is studied using bubble sizemeasuring technique anddynamicfoamability tests.
International Journal of Mineral Processing 124 (2013) 8–14
⁎ Corresponding author.E-mail address: [email protected] (S. Castro).
j ourna l homepage: www.e lsev ie r .com/ locate / i jm inpro
Author's personal copy
2. Experimental
2.1. Materials
MIBC (methyl isobutyl carbinol) was provided by Cytec-Chile, andthe polyglycol frothers DF-200, DF-250, DF-400 and DF-1012 werecommercial products obtained from Moly-Cop Chile S.A.
Sodium chloride used in this study was of reagent grade (Merck).A local sample of seawater from Concepcion city (Bellavista-Tome)
with a salinity of 33.5‰ was employed.
2.2. Apparatus
2.2.1. Surface tension measurementsKSV Sigma 700 tensiometer, with a Pt Du Noüy ring, was used in the
surface tension measurements. Bi-distilled water was used for prepara-tion of solutions. TheWilhelmy platemethodwas used in a few cases tocross-check results. No differences were found. Low frother concentra-tion solutions were prepared by successive dilution of a 5 ppm frothersolution. All the measurements were carried out at ambient tempera-ture and resulting pH.
2.2.2. Bubble size measurementsThe bubble size analyzer (BSA) developed by the Cape TownUniver-
sity (UCT)was employed. This comprises a glass capillary and two pairsof photo-transistor-LED detectors. Bubbles are drawn up through thecapillary tube under vacuum and collected in a modified burette. Thesuction rate is controlled by a peristaltic pump. The bubbles aretransformed into cylinders inside of the glass capillary, and their veloc-ities and length measured using the optical detectors. The total volumeof gas collected in the burette is utilized in order to estimate the abso-lute size of the bubbles. A detailed description of the instrument hasbeen published by Randall et al. (1989).
The size of bubbleswasmeasured in a 4.5 cm inner diameter column(the same column was employed in the DFI measurements) in whichnitrogen gas was bubbled through the sinter glass frit either in wateror in electrolyte solutions and the bubbles could freely collide witheach other. The gas flow rate was 275 cm3/min.
2.2.3. Dynamic foamability indexThe DFI method (Malysa et al., 1981; Czarnecki et al., 1982) requires
determination of gas retention time in a column (in which gas is bub-bled through sintered disc) as a function of gas flow rate and frotherconcentration. What is measured is the total height of the solutionplus the foam phase. These tests were carried out in a glass column of
101 cm height and 4.5 cm inner diameter, with the pore size rangebeing from 40 to 100 μm; and 500 mL of solution was used in eachexperiment.
The equations used to express the DFI as a function of gas flow rateand frother concentration are:
rt ¼ ΔVΔQ
: ð1Þ
where,
rt is the retention timeV is the total gas volume in the system (solution + foam)Q is the volumetric gas flow rate.
Then, the dynamic foamability index (DFI) is calculated from:
DFI ¼ ∂rt∂C
� �C→0
: ð2Þ
Finally, it can be graphically determined from the slope of the initialpart of the rt vs. C curve.
3. Results and discussion
3.1. Surface tension of frothers in aqueous NaCl solutions
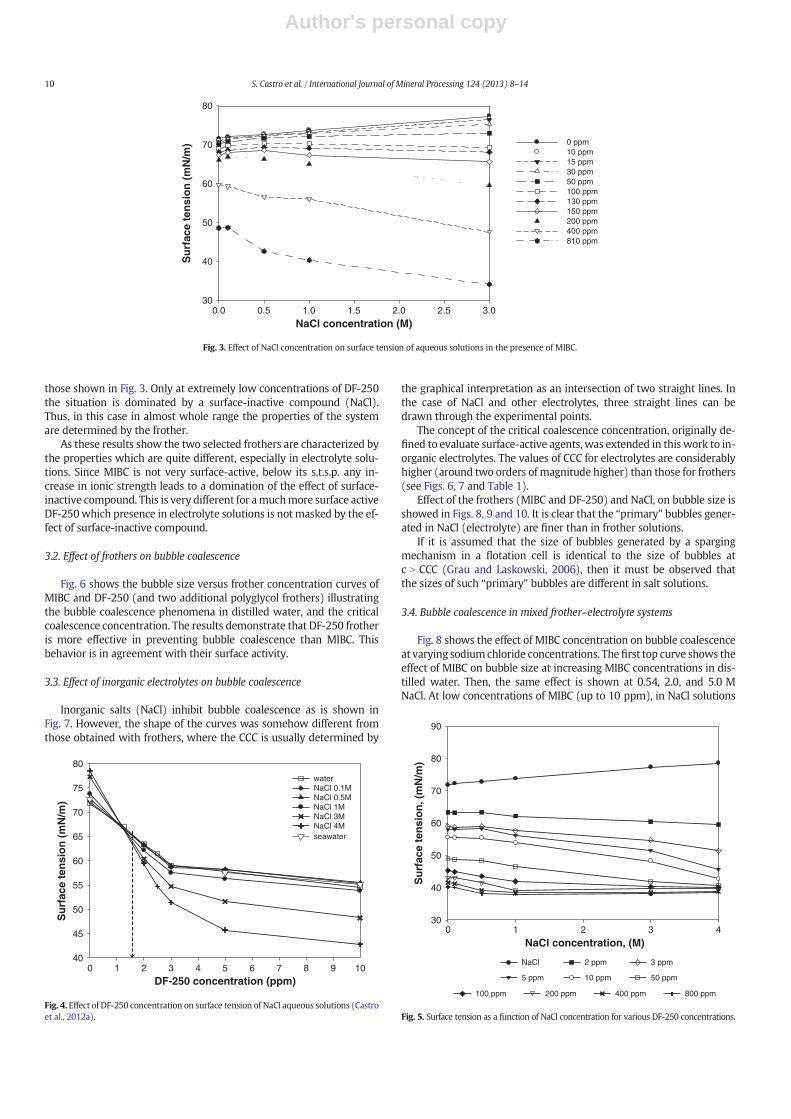
As Fig. 1 demonstrates, for MIBC aqueous solutions there is a charac-teristic concentration point, which splits the whole range into two con-centration ranges. This is confirmed in Fig. 2. At MIBC concentration ofabout 120 ppm there is a critical point. Over the MIBC concentrationrange exceeding this point (we will call it the surface tension switchpoint, s.t.s.p.) the surface tension of the MIBC solutions containingNaCl is lower than the surface tension of MIBC aqueous solutions. Thisagrees very well with Fig. 1. The same results re-plotted in Fig. 3 as afunction of NaCl concentration clearly indicate that up to about120 ppm of MIBC curves are dominated by the surface-inactive com-pound (NaCl). Only at the MIBC concentrations higher than the s.t.s.p.,the plot starts resembling the situation in which a surface-active com-pound is present in the system.
This behavior is contrasted with another commercial frother,DF-250. As Fig. 4 demonstrates, the surface tension switch pointfor DF-250 is situated around DF-250 concentration of 1.2 ppm.This is very different fromMIBC for which s.t.s.p. is around 120 ppm.
The results when re-plotted (Fig. 5) reveal quite a different relation-ship between DF-250, NaCl concentration, and surface tension from
Concentration (ppm)1 10 100 1000 10000
Su
rfac
e T
ensi
on
(m
N/m
)
30
40
50
60
70
80
90
Saturated Brine50% BrineWater
Fig. 1. The effect of MIBC and electrolyte concentration on surface tension of aqueoussolutions (Laskowski et al., 2003). Saturated brine stands for NaCl–KCl saturated brine of6–7 mol/L.
MIBC Concentration (ppm)10 100 1000
Su
rfac
e te
nsi
on
(m
N/m
)
20
40
60
80
in water NaCl 0.1M NaCl 0.5 M NaCl 1 M NaCl 3 M
Fig. 2. Effect ofMIBC concentration on surface tension of aqueous solutions in thepresenceof NaCl (Castro et al., 2012a).
9S. Castro et al. / International Journal of Mineral Processing 124 (2013) 8–14
Author's personal copy
those shown in Fig. 3. Only at extremely low concentrations of DF-250the situation is dominated by a surface-inactive compound (NaCl).Thus, in this case in almost whole range the properties of the systemare determined by the frother.
As these results show the two selected frothers are characterized bythe properties which are quite different, especially in electrolyte solu-tions. Since MIBC is not very surface-active, below its s.t.s.p. any in-crease in ionic strength leads to a domination of the effect of surface-inactive compound. This is very different for amuchmore surface activeDF-250which presence in electrolyte solutions is not masked by the ef-fect of surface-inactive compound.
3.2. Effect of frothers on bubble coalescence
Fig. 6 shows the bubble size versus frother concentration curves ofMIBC and DF-250 (and two additional polyglycol frothers) illustratingthe bubble coalescence phenomena in distilled water, and the criticalcoalescence concentration. The results demonstrate that DF-250 frotheris more effective in preventing bubble coalescence than MIBC. Thisbehavior is in agreement with their surface activity.
3.3. Effect of inorganic electrolytes on bubble coalescence
Inorganic salts (NaCl) inhibit bubble coalescence as is shown inFig. 7. However, the shape of the curves was somehow different fromthose obtained with frothers, where the CCC is usually determined by
the graphical interpretation as an intersection of two straight lines. Inthe case of NaCl and other electrolytes, three straight lines can bedrawn through the experimental points.
The concept of the critical coalescence concentration, originally de-fined to evaluate surface-active agents, was extended in this work to in-organic electrolytes. The values of CCC for electrolytes are considerablyhigher (around two orders of magnitude higher) than those for frothers(see Figs. 6, 7 and Table 1).
Effect of the frothers (MIBC and DF-250) and NaCl, on bubble size isshowed in Figs. 8, 9 and 10. It is clear that the “primary” bubbles gener-ated in NaCl (electrolyte) are finer than in frother solutions.
If it is assumed that the size of bubbles generated by a spargingmechanism in a flotation cell is identical to the size of bubbles atc N CCC (Grau and Laskowski, 2006), then it must be observed thatthe sizes of such “primary” bubbles are different in salt solutions.
3.4. Bubble coalescence in mixed frother–electrolyte systems
Fig. 8 shows the effect of MIBC concentration on bubble coalescenceat varying sodium chloride concentrations. Thefirst top curve shows theeffect of MIBC on bubble size at increasing MIBC concentrations in dis-tilled water. Then, the same effect is shown at 0.54, 2.0, and 5.0 MNaCl. At low concentrations of MIBC (up to 10 ppm), in NaCl solutions
Fig. 4. Effect of DF-250 concentration on surface tension of NaCl aqueous solutions (Castroet al., 2012a).
NaCl concentration, (M)0 1 2 3 4
Su
rfac
e te
nsi
on
, (m
N/m
)
30
40
50
60
70
80
90
NaCl 2 ppm 3 ppm
5 ppm 10 ppm 50 ppm
100 ppm 200 ppm 400 ppm 800 ppm
Fig. 5. Surface tension as a function of NaCl concentration for various DF-250 concentrations.
10 S. Castro et al. / International Journal of Mineral Processing 124 (2013) 8–14
Author's personal copy
the bubble size slightly tends to increase, but then it is stabilized anddecreases again. However, the bubble size in NaCl solutions, for allconcentrations of MIBC, was smaller than in distilled water. Hence,these results imply that the size of the primary bubbles generated by asparging mechanism depends on electrolyte concentration (decreaseswith increasing electrolyte concentration). The results obtained withDF-250 (Figs. 9 and 10) are similar.
3.5. Behavior of frothers in seawater
Seawater contains around 0.55–0.60 M NaCl, and some secondaryions, such as,magnesium, calcium, sulfate, etc. Seawater, similar to inor-ganic electrolytes, is by itself able to prevent bubble coalescence. How-ever, the effect of frothers on bubble coalescence wasmore pronouncedin seawater than in pure electrolyte solutions. These results suggest thatsecondary ions play a significant role. The blend of frothers and seawa-ter clearly stabilizes bubbles against coalescence (see Figs. 11–13)(Castro et al., 2010).
Comparison of Figs. 11 and 12 seems to indicate that the bubblesgenerated in seawater in the presence of MIBC are finer than those gen-erated in the presence of DF-250 (see Figs. 12 and 13).
3.6. Foamability in mixed frother–electrolyte systems
In this paper we also used the dynamic foamability index (DFI) as amethod of characterizing bubble coalescence. Fig. 14 shows the effect of
NaCl concentration on DFI of MIBC and DF-250 frothers. While thesurface tension measurements of MIBC and DF-250 solutions revealeda very large difference between these two frothers, the bubble coales-cence measurements in which the bubble size was monitored did notreveal significant differences. It is therefore interesting to observe thatthe foamability tests exhibit very significant differences between thetwo tested frothers.
4. Discussion
As concluded by Traube (1926), the surface-active substances aredisplaced from their aqueous solutions by surface-inactive substances,and this additionally decreases surface tension of water. Our Figs. 1, 2and 4 are clearly in agreement with this concept. With increasing con-centration of frother surface tension of the solution decreases, but asshown in Figs. 2 and 4 frother ability to decrease surface tension isaugmented in electrolyte solutions. Fig. 15 shows a schematic represen-tation of the s.t.s.p. concept. Since the slope of the curve when surfacetension is plotted versus frother concentration changes with electrolyteconcentration the two curves shown in Fig. 15 intersect at a givenfrother concentration. This concentration is the surface tension switchpoint. The change of the slope of the curve surface tension = f(c) indi-cates that a relatively weakly surface active compound changes into astronger surface active compound at increased electrolyte concentra-tion. This effect is very likely different in different electrolytes.
Our bubble sizemeasurements took place in a column inwhich bub-bles were generated by passing nitrogen under pressure through a glassfrit. Since a stream of bubbles is generated in such a device the bubblescollidewith each other and their size is preserved only if they do not co-alesce. As Fig. 6 indicates only at frother concentrations exceeding theCCC values the bubbles do not coalesce and all have uniform size. Ourfoamability tests were carried out in the same column which was usedfor bubble size measurements. The foam starts to form when the num-ber of bubbles arriving at the liquid/gas interface exceeds the number ofrupturing bubbles. However, this coalescence process now takes placein the foamand the properties and stability of the liquidfilms separating
Concentration, (mmol/L)
0.00 0.05 0.10 0.15 0.20 0.25 0.30Sau
ter
mea
n b
ub
ble
dia
met
er, (
mm
)
0.6
0.8
1.0
1.2
1.4
1.6
1.8
MIBCDF-250DF-400 DF-1012
0.08904
CCC MIBC
CCC DF-250
0.04165
CCC DF-1012
0.01580
0.02154
CCC DF-400
Fig. 6. Sauter bubble diameter as a function of the concentration of the frothers (MIBC,DF-250, DF-400 and DF-1012) in distilled water, with graphical determination of thecritical coalescence concentration.
NaCl concentration, (M)0 1 2 3 4 5
Sau
ter
mea
n b
ub
ble
dia
met
er, (
mm
)
0.4
0.6
0.8
1.0
1.2
1.4
1.6
CCC for NaCl
0.7780
Fig. 7. Sauter bubble diameter as a function of the concentration of NaCl solutions.
Table 1The critical coalescence concentration (CCC) for NaCl and frothers.
0.00 M NaCl 0.54 M NaCl (seawater) 2M NaCl 5M NaCl
Fig. 8. Sauter bubble diameter as a function of MIBC concentration, for 0; 0.54; 2; and 5 MNaCl solutions.
11S. Castro et al. / International Journal of Mineral Processing 124 (2013) 8–14
Author's personal copy
bubbles in the foam are now very different from the “films” separatingbubbles between colliding bubbles in an aqueous solution. The experi-mental results indicate that while the bubble coalescence characterizedby bubble sizemeasurementswas not very sensitive to a type of frother,the results of the foamability tests turned out to be very different.In comparison with MIBC, the foamability is obviously better whenDF-250 frother is utilized, especially at high salt concentrations. Thisconfirms the importance of dynamic effects in foam formation(Malysa, 1992; Malysa and Lunknheimer, 2008) and possibly differenttypes of the stabilizing forces which operate under studied conditions.While the bubble size measurements did not show any significant dif-ferences between the two studied frothers, these measurements turnedout to be sensitive to electrolyte composition. As Figs. 8, 9 and 10 dem-onstrate the size of the bubbles start increasing when frother (eitherMIBC or DF-250) is added to the solution. However, as Fig. 13 shows,when frothers are added to seawater the size of the bubbles decreases.Since seawater contains not only NaCl but also calcium, magnesiumand other ions, this effect implies a different influence of the inorganicions on the surface activity of the tested frothers.
As the results published a few years ago show (Grau and Laskowski,2006) the frothers affect not only bubble coalescence but also bubblebreaking process. These results (Figs. 7–13) indicate that the size ofprimary bubbles, the bubbles generated by a sparging device, is clearlyaffected by electrolytes. For example, this size decreases with seawaterconcentration suggesting that the bubble generating process in electro-lyte solutions is more efficient.
Surface elasticity forces are induced and operate only under dynamicconditions. It is a “self-healing” capacity of the film against external dis-turbances. The elasticity effects are possible only if a layerwith differentproperties is formed at the interface, the layer in which there is agradient of concentration. In the case of a surface-active agent this isvery easy to visualize: such molecules accumulate at the liquid/gasinterface (adsorption) and the gradient of concentrations at the inter-face is clearly established. The movement or any other dynamic distur-bance that affects this gradient will immediately initiate the action ofthe “self-healing” forces. These areMarangoni dynamic elasticity effects.In the case of aqueous solutions of inorganic electrolytes the concentra-tion of ions is lower in the surface layer than in the bulk (increasing sur-face tension), and the concentration gradientwithin this surface layer isalso established. The elasticity effects should then also be possible. But itis also known, that in the presence of electrolytes the foam becomesdrier, the bubbles carry less water with them and it was reported thatthe foaming is reduced under such conditions (Iskra and Laskowski,1969). Our measurements indicate that this happens only at very highelectrolyte concentrations; in the case of MIBC for NaCl concentrationhigher than 1 M, and of DF-250 for NaCl concentration higher than2 M. The surface tension measurements indicate that the accumulationof the frother at the interface (adsorption) increases with increasingelectrolyte concentration. This initially improves foaming. The adsorbedfrother bonds some water molecules by hydrogen bonding but, appar-ently, the amount of suchwater in a bubble “hydration shell” is reduced
Fig. 12. Sauter bubble diameter as a function of dilution of seawater (%), at differentDF-250 concentrations (Castro et al., 2010).
12 S. Castro et al. / International Journal of Mineral Processing 124 (2013) 8–14
Author's personal copy
at higher electrolyte concentrations. This seems to be explaining theobserved reduced foaming when electrolyte concentration is very high.
As Tan et al. (2004) demonstrated, the maximum in foamingwhen it is plotted vs. frother concentration also results from limit-ed solubility of the frother and appearance of undissolved dropletsat high concentrations. Since frother solubility is likely dependenton electrolyte concentration, this phenomenon may also play arole in concentrated electrolyte solutions. According to the mostrecent paper by Tan et al. (2009) a key parameter is the surfacedilational viscosity which determines the Marangoni effect and re-tards water drainage then resulting in wetter foams and increasedwater recovery.
Samples of commercial frothers were utilized in this project.Nominal chemical formulas of the tested frothers can be written as:CH3CH(CH3)CH2CH(OH)CH3 for MIBC and CH3(OC3H6)nOH of DF-series of polyglycol frothers. While n = 3 in DF-200 frother, n = 4in DF-250 and n = 6.3 in DF-1012. It must be borne in mind, how-ever, that these are nominal formulas. In one of our papers (Meloand Laskowski, 2006) we measured surface tension for the suiteof frothers which also included MIBC, DF-200 and DF-1012. WhileDF-200 is slightly more surface active than MIBC, DF-1012 wasmuch more surface active. The surface tension vs. concentrationcurve for DF-1012 is very similar to the curves obtained in thisproject for DF-250 (Fig. 4). However, if elasticity forces are responsi-ble for the stabilization of a dynamic system such as foam columnthen the stability of the foam is rather determined by the non-equilibrium adsorption parameters (Wantke et al., 1994).
The dynamic surface tension measurements (Comley et al., 2002)showed very large differences between DF-200 and MIBC; whiledynamic surface tensions for DF-200 practically did not depend on bub-ble life time this turned out to be very different for MIBC. This agreeswell with Grau and Laskowski's data (2006) for DF-200. Grau andLaskowski also showed that while the dynamic surface tensionsfor DF-250 and DF-1012 frothers were similar these dynamic effectswere very much larger than for DF-200. More complete analysis willrequire new dynamic surface tension measurements for the testedfrothers as the composition of the samples of commercial frothersmay differ; the tests should also include experiments at varying electro-lyte concentrations.
Finally, these results are relevant to flotation practice in highlyconcentrated saline solutions and in seawater. Inorganic electrolyte isable to reduce bubble size in a similarway to frothing agents, explainingwhy in the salt flotation process of natural hydrophobic minerals theaddition of a frother is not necessary (Klassen and Mokrousov, 1963;Castro and Laskowski, 2011). When a collector is necessary to conferhydrophobicity to mineral particles, the froth stability is a function ofbubble size, but other parameter needs also to be considered, such as,solid content, particle size, degree of hydrophobicity, water's salinity,pH, etc. (Castro et al., 2012b).
5. Conclusions
Two frothers (MIBC and DF-250), selected for the studies on bubblecoalescence in flotation systems, were shown to exhibit different sur-face activities as characterized by surface tension measurements.
Fig. 13. Sauter bubble diameter as a function of frother concentration, for MIBC, DF-250,DF-400, and DF-1012, in seawater.
Dyn
amic
Fo
amab
ility
Ind
ex, (
s x
L/m
ol)
5.0x10⁵
106
1.5x10⁶
2.0x10⁶
2.5x10⁶
3.0x10⁶
3.5x10⁶
DF-250 (Distilled water)DF-250 (Seawater)
NaCl concentration, (M)0 1 2 3 4 5
-20x103
-10x103
0
10x103
20x103
30x103
40x103
MIBC (Distilled water)MIBC (Seawater)
(b)
(a)
Fig. 14. Effect of NaCl concentration, and also seawater, on the dynamic foamability indexof DF-250 and MIBC.
Fig. 15. Schematic representation of the surface tension switch point (s.t.s.p.) concept.
13S. Castro et al. / International Journal of Mineral Processing 124 (2013) 8–14
Author's personal copy
These differences were further augmented in aqueous solutions at ahigh ionic strength. The concept of the surface tension switch point(s.t.s.p.) was introduced as the frother concentration at which thesurface tension of frother aqueous solutions containing NaCl is lowerthan the surface tension of the frother in distilled water. It is suggestedthat the s.t.s.p. values may characterize the effect of salt concentrationon frother properties. The s.t.s.p. values for MIBC and DF-250 weredetermined as 120 ppm for MIBC and 1.2 ppm for DF-250.
The bubble coalescence was studied through the measurements ofbubble size and foamability. The bubble size measurements revealedthat inorganic salts similar to frothers, are able to prevent bubble coales-cence, but at a concentration several orders of magnitude greater. Ifelectrolytes are comparedwith frothers, the finer bubbles are generatedin electrolyte solutions than in the presence of frothers.
In the bubble size measurements carried out in NaCl solutions, theaddition of MIBC or DF-250 does not decrease the size of bubblesbeyond the values observed in the electrolyte solution alone. This isvery different from seawater. In seawater with the addition of frotherthe bubble generation/coalescence produces finer bubbles. In this sys-tem, MIBC seems to be more efficient in preventing bubble coalescenceif compared with a polyglycol type frother.
While characterization of bubble coalescence in NaCl solutionsthrough bubble size measurements turned out not to be very sensitiveto differences between two tested frothers, the dynamic foamabilitytests showed much higher foamability of the DF-250 solutions in com-parison with MIBC. These differences were especially visible at highelectrolyte concentrations (and in seawater).
The differences observed when different experimental techniquesare utilized indicate that bubble stability against coalescence stronglydepends on the dynamic nature of the tests which are selected forsuch studies.
Acknowledgements
Funding for this project was provided by the CORFO-INNOVA CHILE(Project 08CM01-18), with industrial sponsorship from: AntofagastaMinerals, (Esperanza); BHP Billiton, (Minera Escondida Ltd.); AngloAmerican Chile (Mantos Blancos); and Teck (Carmen de Andacollo),through AMIRA-AUSTRALIA operating Research Grant P968.
References
Castro, S., Laskowski, J.S., 2011. Froth flotation in saline water. KONA Powder Part. J. 29,4–14.
Castro, S., Venegas, I., Landero, A., Laskowski, J.S., 2010. Frothing in seawater flotation sys-tems. Proc. XXV Int. Mineral Processing Congress. CURRAN ASSOCIATES INC., pp.4039–4047 (Brisbane).
Castro, S., Toledo, P., Laskowski, J.S., 2012a. Foaming properties of flotation frothers athigh electrolyte concentrations. In: Drelich, J. (Ed.), Proc. 1st International Sympo-sium. Water in Mineral Processing. SME, pp. 51–60.
Castro, S., Ramos, O., Cancino, J.P., Laskowski, J.S., 2012b. Frothing in the flotation of cop-per sulphide ores in sea water. In: Drelich, J. (Ed.), Proc. 1st International Symposium.Water in Mineral Processing. SME, pp. 211–223.
Cho, Y.S., Laskowski, J.S., 2002. Effect offlotation frothers on bubble size and foam stability.Int. J. Miner. Process. 64, 69–80.
Craig, V.S.J., Ninham, B.W., Pashley, R.M., 1993a. Effect of electrolytes on bubble coales-cence. Nature (London, United Kingdom) 364 (6435), 317–319.
Craig, V.S.J., Ninham, B.W., Pashley, R.M., 1993b. The effect of electrolytes on bubblecoalescence in water. J. Phys. Chem. 97 (39), 10192–10197.
Czarnecki, J., Malysa, K., Pomianowski, A., 1982. Dynamic frothability index. J. ColloidInterface Sci. 86, 570–572.
Deschenes, L.A., Barrett, J., Muller, L.J., Fourkas, J.T., Mohanty, U., 1998. Inhibition of bubblecoalescence in aqueous solutions. 1. Electrolytes. J. Phys. Chem. B 102, 5115–5119.
Grau, R.A., Laskowski, J.S., 2006. Role of frothers in bubble generation and coalescence in amechanical flotation cell. Can. J. Chem. Eng. 84, 170–182.
Grau, R.A., Laskowski, J.S., Heiskanen, K., 2005. Effect of frothers on bubble size. Int.J. Miner. Process. 76, 225–233.
Iskra, J., Laskowski, J.S., 1969. Quoted after J.S. Laskowski, frothers and frothing, frothing inflotation II. In: Laskowski, J.S.,Woodburn, E.T. (Eds.), Gordon andBreach, 1997, pp. 1–50.
Keitel, G., Onken, U., 1982. Inhibition of bubble coalescence by solutes in air/water disper-sions. Chem. Eng. Sci. 37, 1635–1638.
Klassen, V.I., Mokrousov, V.A., 1963. An Introduction to the Theory of Flotation.Butterworths, London.
Kracht, W., Finch, J.A., 2010. Effect of frother on initial bubble shape and velocity. Int.J. Miner. Process. 94, 115–120.
Laskowski, J.S., Cho, Y.S., Ding, K., 2003. Effect of frothers on bubble size and foam stabilityin potash ore flotation systems. Can. J. Chem. Eng. 81, 63–69.
Lessard, R.R., Zieminski, S.A., 1971. Bubble coalescence and gas transfer in aqueous elec-trolytic solutions. Ind. Eng. Chem. Fundam. 10 (2), 260–269.
Malysa, K., 1992. Wet foams: formation, properties and mechanism of stability. Adv. Col-loid Interf. Sci. 40, 37–83.
Malysa, K., Lunkenheimer, K., 2008. Foams under dynamic conditions. Curr. Opin. ColloidInterface Sci. 13, 150–162.
Malysa, K., Lunkenheimer, K., Miller, R., Hartenstein, C., 1981. Surface elasticity andfrothability of n-octanol and n-ostanoic acid solutions. Colloids Surf. 3, 329–338.
Marrucci, G., Nicodemo, L., 1967. Coalescence of gas bubbles in aqueous solutions of inor-ganic electrolytes. Chem. Eng. Sci. 22, 1257–1265.
Melo, F., Laskowski, J.S., 2006. Fundamental properties of flotation frothers and their effecton flotation. Miner. Eng. 19, 766–773.
Quinn, J.J., Kracht,W., Gomez, C.O., Gagnon, C., Finch, J.A., 2007. Comparing the effect of saltsand frother (MIBC) on gas dispersion and froth properties. Miner. Eng. 20, 1296–1302.
Randall, E.W., Goodall, C.M., Fairlamb, P.M., Dold, P.L., O'Connor, C.T., 1989. A method formeasuring the sizes of bubbles in two- and three-phase systems. J. Phys. Sect. E: Sci.Instrum. 22, 827–833.
Tan, S.N., Fornasiero, D., Sedev, R., Ralston, J., 2004. The interfacial conformation of poly-propylene glycols and foam behaviour. Colloids Surf. A 250, 307–325.
Tan, S.N., Jiang, A., Liau, J.J., Grano, S.R., Horn, R.G., 2009. The surface dilational viscosity ofpropylene glycol solutions and its influence on water flow and foam behaviour. Int.J. Miner. Process. 93, 194–203.
Traube, J., 1926. Attraction intensity or attraction pressure. In: Alexander, J. (Ed.), ColloidChemistry. Chemical Catalog Co., vol. 1, pp. 640–646.
Wantke, K., Malysa, K., Lunkenheimer, 1994. A relation between dynamic foam stabilityand surface elasticity. Colloids Surf. A 82, 183–191.
Weissenborn, P.K., Pugh, R.J., 1995. Surface tension and bubble coalescence phenomena ofaqueous solutions of electrolytes. Langmuir 11, 1422–1426.
Weissenborn, P.K., Pugh, R.J., 1996. Surface tension of aqueous solutions of electrolytes:relationship with ion hydration, oxygen solubility, and bubble coalescence. J. ColloidInterface Sci. 184, 550–563.
Zieminski, S.A., Whittemore, R.C., 1971. Behavior of gas bubbles in aqueous electrolytesolutions. Chem. Eng. Sci. 26, 509–520.
14 S. Castro et al. / International Journal of Mineral Processing 124 (2013) 8–14