28
Simple Min Investment of only Rs.2000 Intelligent Benefit from the Power of Compounding Practical With Auto Debit Facility DSPML Systematic Investment Plan (SIP)
| Date post: | 29-Dec-2015 |
| Category: |
Documents |
| Upload: | jade-kelley |
| View: | 213 times |
| Download: | 0 times |

SimpleMin Investment of only Rs.2000
IntelligentBenefit from the Power of Compounding
PracticalWith Auto Debit Facility
DSPML Systematic Investment Plan (SIP)

Did you know ?
If your current monthly expenses are
Rs. 30,000/- p.m, after 20 years you will
require Rs. 80,000/- p.m to maintain the
same lifestyle
Assuming inflation rate of 5%

Did you know ?
An education degree for your child
which currently costs Rs. 10 lakh will
cost Rs. 21 lakh after 15 years.
Assuming inflation rate of 5%

Individual Investor Needs: Investment Goals
• All individuals need to save for
– Retirement
– Child’s education / marriage
– Medical emergency
– Other family obligations
Every individual has one or more of the above goals

60Retirement
40Middle Age
27Young Married
22Young Independent
Individual Investor: Life Stages
Earnings
Consumption
Savings
All individuals have a finite period to save for their investment goals

Value of Money over time
Impact of inflation on monthly expenses of Rs. 30,000 today
Value of Rs. 100,000 over time
At inflation of 5%
Investors need to beat inflation
30,000
38,288
62,368
79,599
Today 5 years 15 years 20 years
100,000
78,353
48,102
37,689
Today 5 years 15 years 20 years

Performance of Various Asset Classes
Source: Internal
Equities outperform other asset classes over the long term
Cumulative annualised returns 1980-2004
6.7%5.7%
10.3%
3.55%
15.6%
8.9%
-1.1%
Inflation Gold Bank FDs BSE Sensex
Growth Real Growth

Individual investors are scared of …..
The Downside in Equities
The of Market Timing
The of Market Volatility
Risk
Risk
Risk

What else makes a material impact on investments in equity ?

Investing in the BSE Sensex – 25 years
Market timing does not matter over the long term
16.02%
Fixed investment on 1st day of every month
16.90%15.07%
Fixed investment athighest sensex value
every year
Fixed investment atlowest sensex value
every year
Data source: ICRA MFIE
Returns are from 1981- Dec 2005

The Power of Compounding
From Jan 1, 1984 to Dec 31, 2004 – a 21 year period
Final corpus Rs. 1.9 croreRs. 89 lakhRs. 43 lakh
Assumed
annualised return20%15%10%
Monthly investment
Rs. 5,000Rs. 5,000Rs. 5,000
BSE Sensex
Scenario B
BSE Sensex
Scenario A
Debt
Instrument

Summary
Investors needs to save regularly and invest those savings in higher return assets to create wealth
Long Term Systematic Monthly Investment in
equity schemes is ideal for this

How Do You Achieve Your Financial Goals
• Retirement
• Child’s education - international
• Family commitments - medical emergency, etc

TodayAt the time
of retirement
30,000
83,579
21 Yrs
Inflation 5%
Monthly Household ExpensesRetirement corpus required to meet post retirement expenses.(if invested at 7%)
1.4 crore
Monthly investment needed to meet post retirement expenses
at 12%
at 15%
at 18%
12,583
8,083
5,090
Retirement Planning

PresentWhen your child
actually goes for this degree
Child’s Education
11 Yrs
Inflation 5%
Educational Degree
Monthly investment needed to achieve this goal
at 12%
at 15%
at 18%
12,456
10,166
8,237
20,00,000
34,20,000
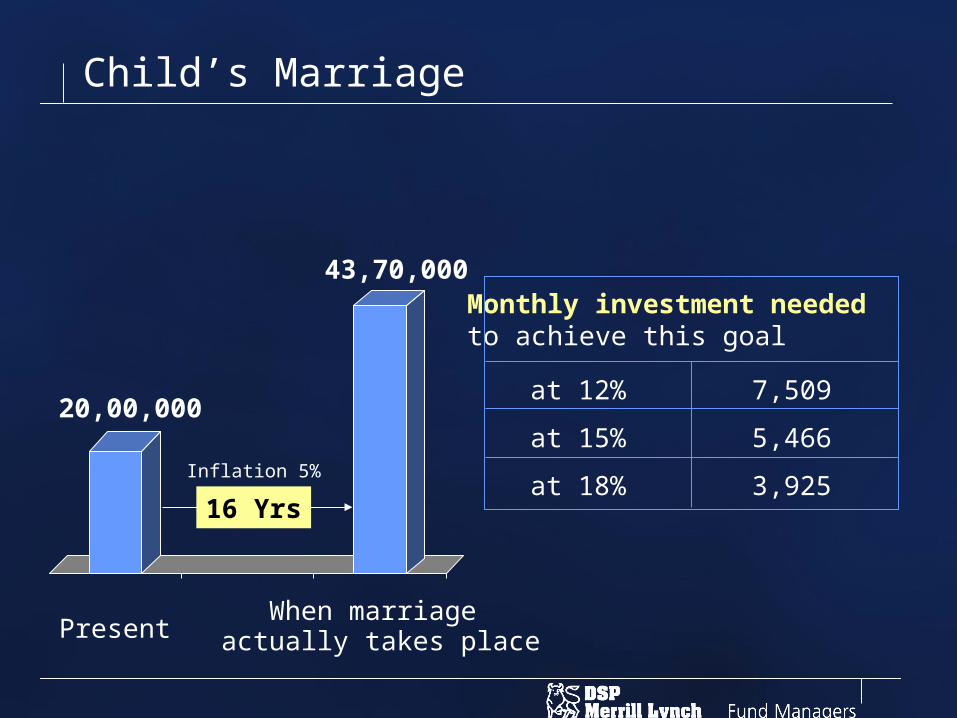
Child’s Marriage
Monthly investment needed to achieve this goal
at 12%
at 15%
at 18%
7,509
5,466
3,925
PresentWhen marriage
actually takes place
16 Yrs
Inflation 5%
20,00,000
43,70,000

So What Are The Benefits Of Investing Through
A Systematic Investment Plan !

Benefit : 1
• The Benefit of Long Term Equity Investment
– Equities give superior returns among all asset classes over the long term
– DSP Merrill Lynch Mutual Fund has a track record of consistent good performance relative to its peers

Benefit : 2
• The Benefits of Systematic Monthly Investment
– Takes out the risk of market timing
– Adds the benefits of the power of compounding and rupee cost averaging
Benefit : 3
• Flexibility
– You can choose from a wide array of schemes
– You can decide to keep invested amounts in an earlier scheme & invest future SIP instalments into a new scheme

Benefit : 4
• Added Convenience
– Auto debit facility across over 25 locations in India
– Regular account statements
– Redemption request directly credited into your bank account

Make your investment goals a reality
Start a S.I.P. today !

Track Record
Source: ICRA MFIE, Internal, Bm – Benchmark.
All returns shown above are for the growth option and do not take into account Entry Load, hence the actual returns will be lower . In case of DSPML Equity Fund returns assume the reinvestment of dividend at net asset value of the ex-dividend date. As per SEBI standards of performance reporting, the "since inception" returns are calculated on Rs. 10/- invested at inception date. The inception dates are as follows:- DSPML Balanced Fund - 27-May-99, DSPML Equity Fund - 29-Apr-97,DSPML Top 100 Equity Fund - 10-Mar-03, DSPML Opportunities Fund - 16-May-00, DSPML India TIGER Fund - 11-Jun-04. As on May 31, 2007 the NAVs of the schemes were as follows:- DSPML Balanced Fund - Rs 42.506, DSPML Equity Fund - Rs 44.229, DSPML Top 100 Equity Fund – Rs 63.884, DSPML Opportunities Fund - Rs 59.28, DSPML India TIGER Fund – Rs 36.684. Past performance may or may not be sustained in the future and should not be used as a basis for comparison with other investments
Returns are as on May 31, 2007
Scheme Name 1-year 3-years 5-yearsSince
Inception
F % Bm % F % Bm % F % Bm % F % Bm %
DSPML Equity Fund 42.86 39.88 58.19 42.53 52.11 33.07 28.93 14.90
DSPML Opportunities Fund 34.36 39.88 49.84 42.53 50.61 33.07 28.74 18.41
DSPML Top 100 Equity Fund 45.36 38.69 50.13 43.54 ----- ----- 55.07 45.13
DSPML India TIGER Fund 45.00 38.69 ----- ----- ----- ----- 54.91 43.13
DSPML Balanced Fund 33.04 25.29 35.57 25.33 35.35 21.83 19.78 NA
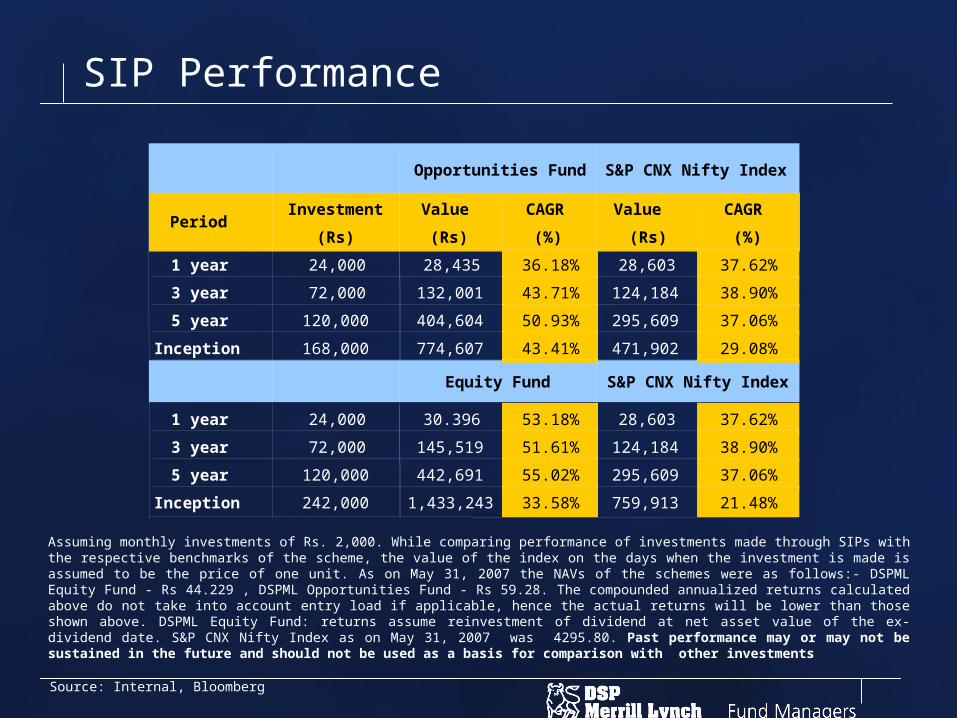
SIP Performance
Source: Internal, Bloomberg
Assuming monthly investments of Rs. 2,000. While comparing performance of investments made through SIPs with the respective benchmarks of the scheme, the value of the index on the days when the investment is made is assumed to be the price of one unit. As on May 31, 2007 the NAVs of the schemes were as follows:- DSPML Equity Fund - Rs 44.229 , DSPML Opportunities Fund - Rs 59.28. The compounded annualized returns calculated above do not take into account entry load if applicable, hence the actual returns will be lower than those shown above. DSPML Equity Fund: returns assume reinvestment of dividend at net asset value of the ex-dividend date. S&P CNX Nifty Index as on May 31, 2007 was 4295.80. Past performance may or may not be sustained in the future and should not be used as a basis for comparison with other investments
PeriodInvestment
(Rs)
Value
(Rs)
CAGR
(%)
Value
(Rs)
CAGR
(%)
1 year 24,000 28,435 36.18% 28,603 37.62%
3 year 72,000 132,001 43.71% 124,184 38.90%
5 year 120,000 404,604 50.93% 295,609 37.06%
Inception 168,000 774,607 43.41% 471,902 29.08%
1 year 24,000 30.396 53.18% 28,603 37.62%
3 year 72,000 145,519 51.61% 124,184 38.90%
5 year 120,000 442,691 55.02% 295,609 37.06%
Inception 242,000 1,433,243 33.58% 759,913 21.48%
S&P CNX Nifty Index
S&P CNX Nifty IndexOpportunities Fund
Equity Fund
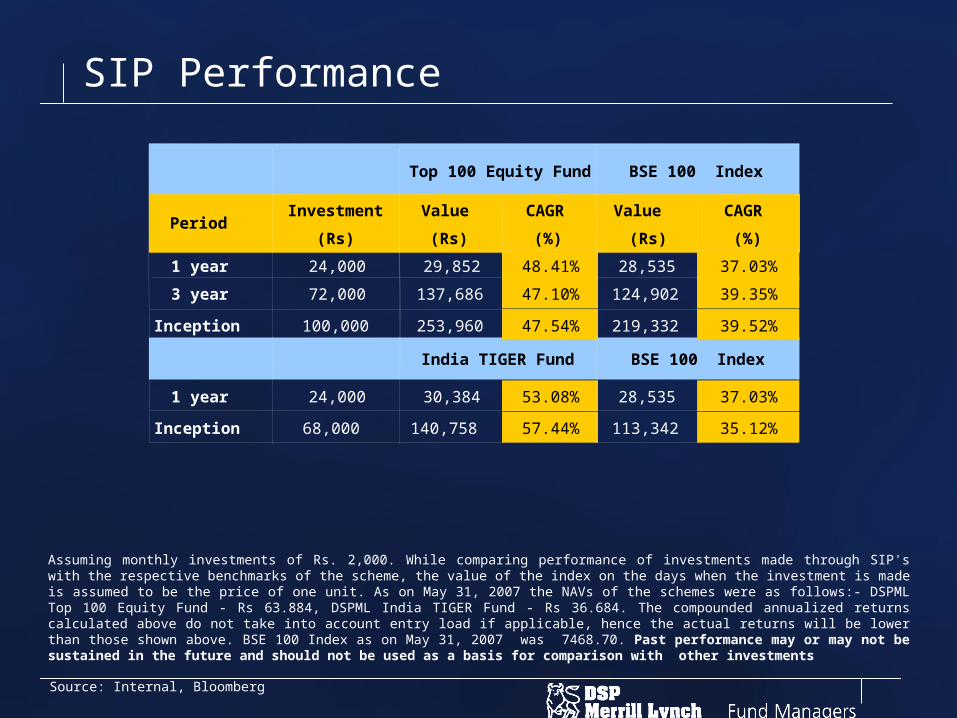
SIP Performance
Source: Internal, Bloomberg
PeriodInvestment
(Rs)
Value
(Rs)
CAGR
(%)
Value
(Rs)
CAGR
(%)
1 year 24,000 29,852 48.41% 28,535 37.03%
3 year 72,000 137,686 47.10% 124,902 39.35%
Inception 100,000 253,960 47.54% 219,332 39.52%
1 year 24,000 30,384 53.08% 28,535 37.03%
Inception 68,000 140,758 57.44% 113,342 35.12%
BSE 100 Index
BSE 100 IndexTop 100 Equity Fund
India TIGER Fund
Assuming monthly investments of Rs. 2,000. While comparing performance of investments made through SIP's with the respective benchmarks of the scheme, the value of the index on the days when the investment is made is assumed to be the price of one unit. As on May 31, 2007 the NAVs of the schemes were as follows:- DSPML Top 100 Equity Fund - Rs 63.884, DSPML India TIGER Fund - Rs 36.684. The compounded annualized returns calculated above do not take into account entry load if applicable, hence the actual returns will be lower than those shown above. BSE 100 Index as on May 31, 2007 was 7468.70. Past performance may or may not be sustained in the future and should not be used as a basis for comparison with other investments

SIP Performance
Source: Internal
Assuming monthly investments of Rs. 2,000. All returns shown above are for the growth option and do not take into account Entry Load, hence the actual returns will be lower. While comparing performance of investments made through SIP's with the respective benchmarks of the scheme, the value of the index on the days when the investment is made is assumed to be the price of one unit. As on May 31, 2007 the NAV of the DSPML Balanced Fund was Rs 42.506, CRISIL Balanced Fund Index – 2577.86. Past performance may or may not be sustained in the future and should not be used as a basis for comparison with other investments
PeriodInvestment
(Rs)
Value
(Rs)
CAGR
(%)
Value
(Rs)
CAGR
(%)
1 year 24,000 28,685 38.32% 26,935 23.55%
3 year 72,000 116,533 33.99% 102,179 24.16%
5 year 120,000 287,832 35.91% NA NA
Inception 192,000 585,028 27.02% NA NA
CRISIL Balanced Fund Index
DSPML Balanced Fund

Thank You
A Rupee Saved Is A Rupee Earned- A Long Journey Begins With A Small Step

DSPML Balanced Fund (DSPMLBalF) is an open-ended balanced scheme seeking to generate long-term capital appreciation and current income from a portfolio constituted of equity and equity related securities as well as debt & money market securities. Asset Allocation: Equity & equity related securities: approx. 60% (min 30%). Debt & money market securities: approx. 40% (min 30%). DSPML Equity Fund (DSPMLEF) is an open-ended growth scheme seeking to generate long-term capital appreciation, from a portfolio, which is substantially constituted of equity and equity related securities of issuers domiciled in India. The scheme may also invest a certain portion of its corpus in debt and money market securities, in order to meet liquidity requirements from time to time. Asset Allocation: Equity & equity related securities: approx. up to 90%. Debt & money market securities: approx. up to 10%. DSPML Opportunities Fund (DSPMLOF) is an open-ended growth scheme with a primary objective to generate long-term capital appreciation, and a secondary objective of income generation and distribution of dividend, from a portfolio constituted of equity and equity-related securities, concentrating on the investment focus of the scheme. Asset Allocation: Equity and equity related securities: 80-100%. Debt, securitised debt & money market securities: 0-20%. DSPML Top 100 Equity Fund is an open ended growth scheme seeking to generate capital appreciation, from a portfolio that is substantially constituted of equity and equity related securities of the 100 largest corporations by market capitalisation, listed in India. The scheme may also invest a certain portion of its corpus in debt and money market securities in order to meet liquidity requirements from time to time. Asset Allocation: Equity & equity related securities: 90-100%, Debt, securitised debt & money market securities: 0-10%. DSPML India T.I.G.E.R Fund (The Infrastructure Growth and Economic Reforms Fund) (DSPMLITF) is an open ended growth scheme whose primary investment objective is to seek to generate capital appreciation, from a portfolio that is substantially constituted of equity securities of corporations that could benefit from structural changes brought about by continuing liberalisation in economic policies by the government and/or from continuing investments in infrastructure, both by the public and private sector. Asset Allocation: Equity & equity related securities: 90-100%. Debt, securitised debt & money market securities 0%-10%. ADR, GDR & foreign securities: 0-25%. DSPMLEF, DSPMLTEF, DSPMLOF, DSPMLITF & DSPMLBalF Common Features: Min. investment Rs. 5,000/- and min. additional purchase of Rs 1000/- thereafter. Declaration of NAV on all Business Days. Redemption normally within 3 Business Days. No exit load. Sale and redemption of units on all Business Days at Purchase Price and Redemption Price. SIP, SWP, STP, Nomination facility and direct deposit application facility available. For load structure of SIP and SSIP please refer to the Standard Offer Document and / or the Key Information Memorandum cum Application Form. Scheme Specific Features: Growth and Dividend options available in all schemes except DSPMLEF where investors have the Pay Dividend and Reinvestment of Dividend options. No entry load for DSPMLBalF. For all other schemes entry load of 2.25% for investments < Rs. 5 crore. DSPMLBalF has a CDSC of 1.25% for investments redeemed within 12 months. For Entry / Exit Load applicable for investments done through SIP/SSIP in the respective schemes, please refer to the Standard Offer Document and / or the Key Information Memorandum cum Application Form. Statutory Details: DSP Merrill Lynch Mutual Fund (the Fund) was set up as a Trust by the settlors, DSP Merrill Lynch Ltd. and Merrill Lynch Investment Managers LP, USA. The Sponsor, Trustee and Investment Manager to the Fund are DSP Merrill Lynch Ltd., DSP Merrill Lynch Trustee Company Pvt. Ltd. and DSP Merrill Lynch Fund Managers Ltd. respectively. The Sponsor is not responsible or liable for any loss resulting from the operation of the Scheme beyond the initial contribution of Rs. 1 lakh towards setting up the Fund and such other accretions/additions to same. Risk Factors: Mutual funds, like securities investments, are subject to market and other risks and there can be no assurance that the Schemes’ objectives will be achieved. As with any investment in securities, the NAV of Units issued under the Schemes can go up or down depending on the factors and forces affecting capital markets. The NAV of the Schemes’ Units may be affected by changes in the general level of interest rates. The past performance of the mutual funds managed by the Sponsors and their affiliates/associates is not necessarily indicative of the future performance of the Schemes. Investors in the Schemes are not being offered a guaranteed or assured rate of return The liquidity of the Scheme’s investments may be restricted by trading volumes, settlement periods and transfer procedures. In the event of an inordinately large number of redemption requests or of a restructuring of either of the Scheme’s portfolios, the time taken by the Fund for redemption of Units may become significant. Please see ‘Risk Factors and Special Considerations’ and ‘Right to Limit Redemptions’ in the Standard Offer Document. The liquidity & valuation of the Schemes’ investments due to its holdings of unlisted securities may be affected if they have to be sold prior to their target date of divestment. In the event that investible funds of more than 50% of the total proceeds of the equity schemes are not invested in equity shares of domestic companies, the tax concessions on income distribution will not be available to the Unit Holders. The scheme may enter into derivatives transactions, which are subject to embedded risks. As per SEBI circular each scheme and individual plan(s) under the schemes should have a minimum of 20 investors and no single investor should account for more than 25% of the corpus of such scheme/plan(s). In case of non-fulfilment with either of the above two conditions on an ongoing basis for each calendar quarter, the respective schemes/plans shall be wound up by following the guidelines prescribed by SEBI and the investor’s money would be redeemed at applicable NAV. DSPMLITF will focus on companies which will benefit from structural changes brought about by continuing liberalisation in economic policies by the government and/or from continuing investments in infrastructure, both by the public and private sector. It is possible that such policies may not fructify or crystallise in a manner commensurate with expectations thereby affecting the prospects of companies held in the portfolio of the Scheme. Since the NAV of the scheme is linked to the share price performance of such companies, they may outperform or under perform the benchmark index (BSE 100) and/or the constituents of the said benchmark index. Since DSPMLOF’s investment focus is on select sectors of the market the portfolio will be concentrated in select companies across these sectors. This may make the portfolios vulnerable to factors that may affect these sectors in general thereby leading to increased volatility in the movement of the scheme’s NAV. The NAV of DSPMLTEF is linked to the share price performance of the top 100 listed companies, which may outperform or under perform the benchmark index (the BSE 100) and/or its constituents. DSPMLBalF, DSPMLEF, DSPMLTEF, DSPMLOF and DSPMLITF are the names of the Schemes and do not in any manner indicate the quality of the Schemes, their future prospects or returns. For more details, please refer to the Key Information Memorandum cum Application Form, which is available at the ISC/Distributor. Please read the Standard Offer Document before investing.


