36
S. Krishnaswamy Centre of Excellence in Bioinformatics School of Biotechnology Madurai Kamaraj University Madurai 625 021 [email protected] [email protected]
| Date post: | 17-Jan-2016 |
| Category: |
Documents |
| Upload: | lucas-copeland |
| View: | 228 times |
| Download: | 3 times |
S. Krishnaswamy
Centre of Excellence in Bioinformatics
School of Biotechnology
Madurai Kamaraj University
Madurai 625 021

Alphabet + Grammar + vocabulary Language
0, 1 a b c d e f . .
m M , < . .
A T C G
A C D E F G H I K L M N P Q R S T V W Y
. .

We are but aliens looking at the world of molecules.
The question is: Can we learn the language of the molecules?

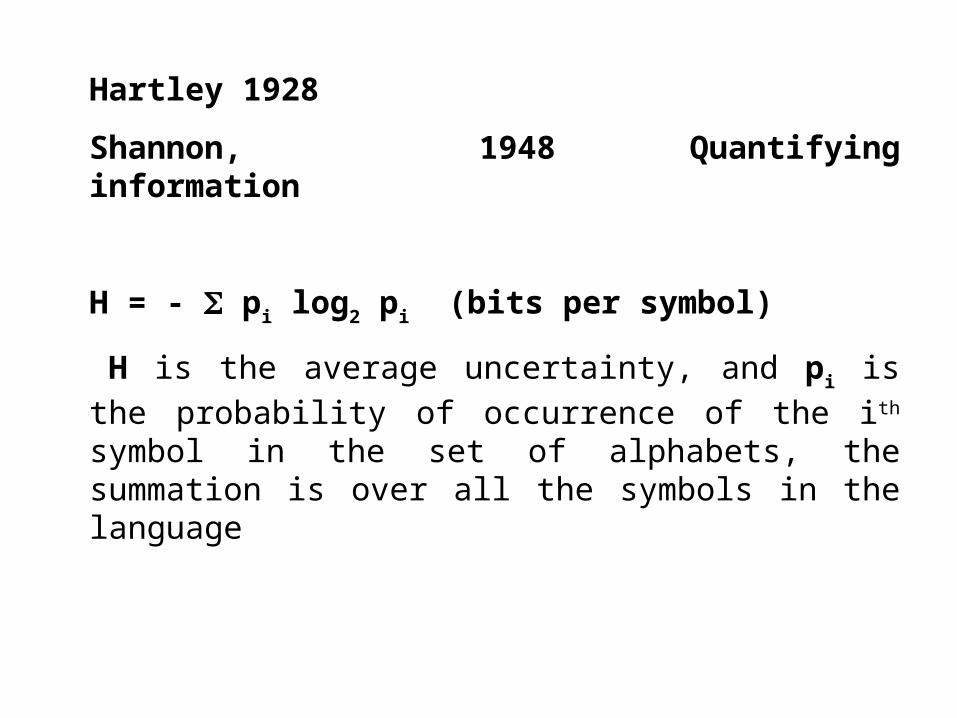
Hartley 1928
Shannon, 1948 Quantifying information
H = - pi log2 pi (bits per symbol)
H is the average uncertainty, and pi is the probability of
occurrence of the ith symbol in the set of alphabets, the summation is over all the symbols in the language
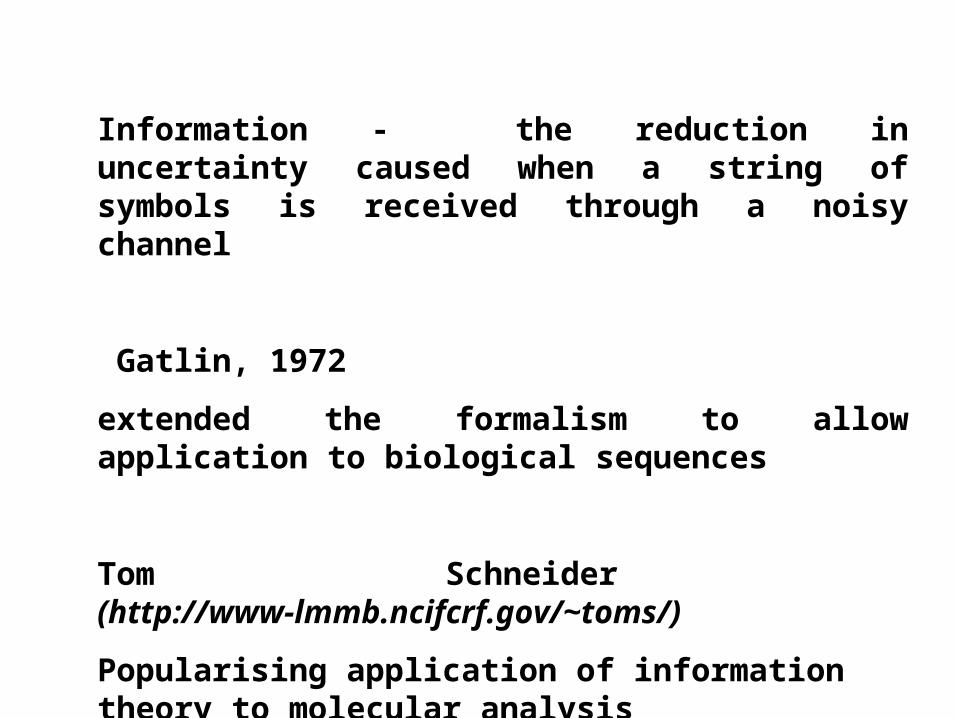
Information - the reduction in uncertainty caused when a string of symbols is received through a noisy channel
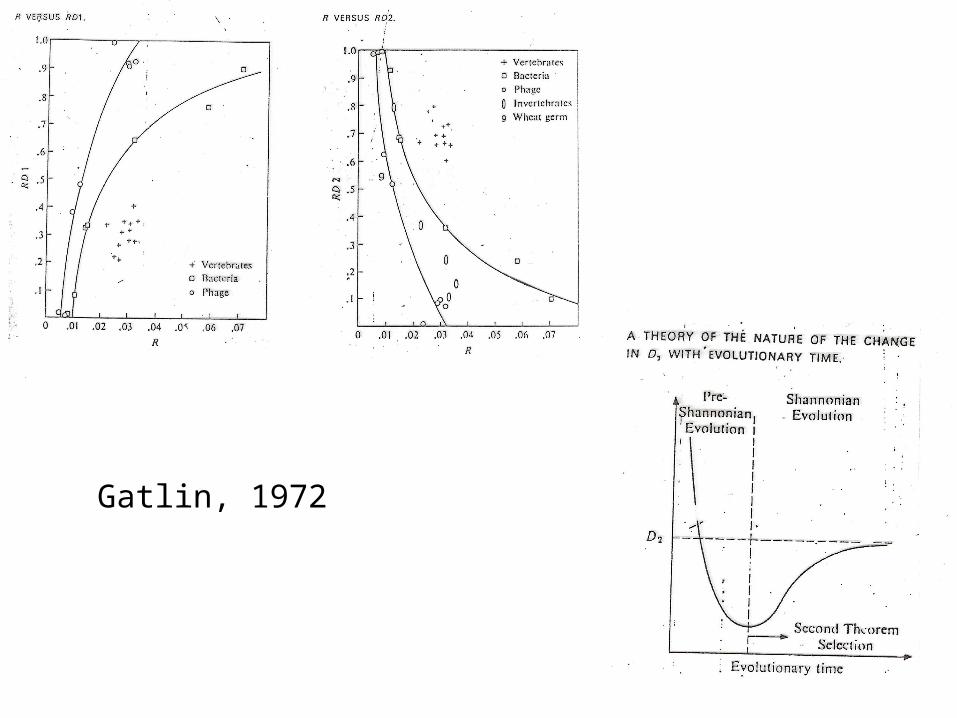
Gatlin, 1972
extended the formalism to allow application to biological sequences
Tom Schneider (http://www-lmmb.ncifcrf.gov/~toms/)
Popularising application of information theory to molecular analysis


Sequence logos


•T. D. Schneider et al J. Mol. Biol., 188, 415-431, 1986
•R. M. Stephens and T. D. Schneider J. Mol. Biol., 228, 1124-1136 1992

Scheider (2000) Nucl Acid Res 28:2794-2799


Scheider (2000) Nucl Acid Res 28:2794-2799

Sub-classification of HNHc class of proteins and identification of commonality in the His-Me
endonuclease superfamily
Preeti Mehta, Krishnamohan Katta and S Krishnaswamy
Sub-classification of HNHc class of proteins and identification of commonality in the His-Me endonuclease superfamily.
Protein Science (2004), 13:295–300.
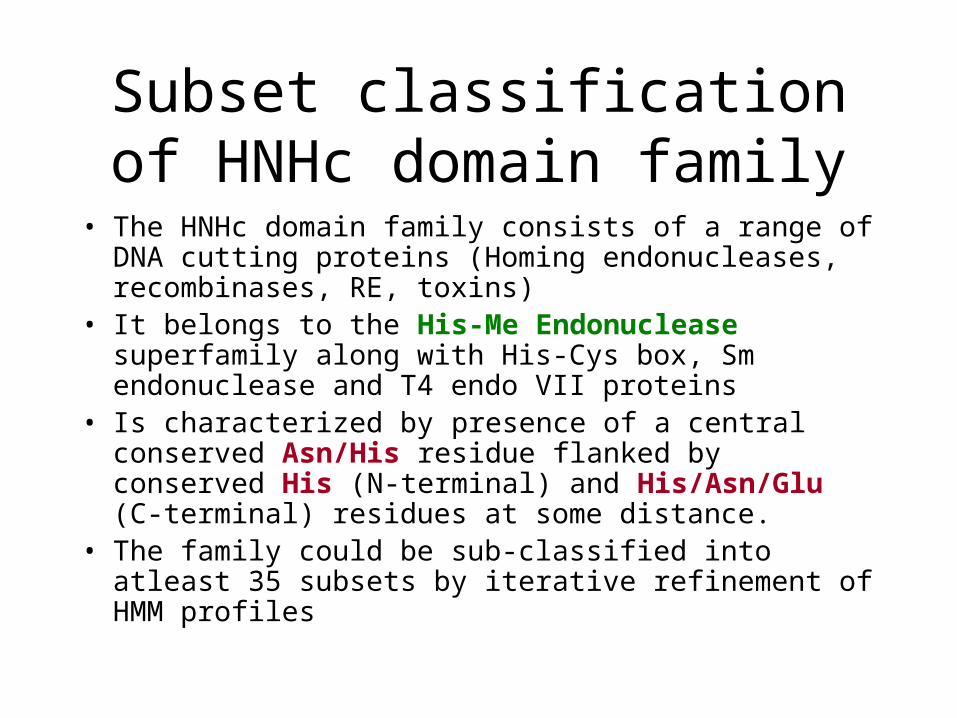
Subset classification of HNHc domain family
• The HNHc domain family consists of a range of DNA cutting proteins (Homing endonucleases, recombinases, RE, toxins)
• It belongs to the His-Me Endonuclease superfamily along with His-Cys box, Sm endonuclease and T4 endo VII proteins
• Is characterized by presence of a central conserved Asn/His residue flanked by conserved His (N-terminal) and His/Asn/Glu (C-terminal) residues at some distance.
• The family could be sub-classified into atleast 35 subsets by iterative refinement of HMM profiles

McrA: GICENCGKNAPFYLNDGNPYLEVHHVIPLSSGGADTTDNCVALCPNCHRELHYS
Gatlin, 1972

Highlights of genome analysis
• 141 prokaryotic chromosomes
•157 eukaryotic chromosomes
• Provides a framework for understanding messaging strategies
•Evolutionary aspects of genomes
•Server to calculate Informationt content
Preeti et al (submitted for publication)

Prokaryotes Eukaryotes
•Despite size and compositional variations, both prokaryotic and eukaryotic genomes do not deviate significantly from an equiprobable and random situation. But their distributions are different.

Inter and intra-strand A=T and G=C rules of Chargaff are broadly adhered to in all genomes.

For prokaryotes : Variation of information density
0.022 bits to 0.263 bits (0.083±0.052).

Information density of Eukaryotic chromosomes
0
0.05
0.1
0.15
0.2
0.25
0.3
0.35
0.4
Gtheta-1
Gtheta-2
Gtheta-3
Ecuniculi-1
Ecuniculi-2
Ecuniculi-3
Ecuniculi-4
Ecuniculi-5
Ecuniculi-6
Ecuniculi-7
Ecuniculi-8
Ecuniculi-9
Ecuniculi-10
Ecuniculi-11
Leishm
ania -1
Scer-1
Scer-2
Scer-3
Scer-4
Scer-5
Scer-6
Scer-7
Scer-8
Scer-9
Scer-10
Scer-11
Scer-12
Scer-13
Scer-14
Scer-15
Scer-16
Celegans-1
Celegans-2
Celegans-3
Celegans-4
Celegans-5
Celegans-X
Pfal-1
Pfal-2
Pfal-3
Pfal-4
Pfal-5
Pfal-6
Pfal-7
Pfal-8
Pfal-9
Pfal-10
Pfal-11
Pfal-12
Pfal-13
Pfal-14
Dm
el 2r
Dm
el 2l
Dm
el 3r
Dm
el 3l
Dm
el 4
Dm
el x
Pantrog-1
Pantrog-2
Pantrog-3
Pantrog-4
Pantrog-5
Pantrog-6
Pantrog-7
Pantrog-8
Pantrog-9
Pantrog-10
Pantrog-11
Pantrog-12
Pantrog-13
Pantrog-14
Pantrog-15
Pantrog-16
Pantrog-17
Pantrog-18
Pantrog-19
Pantrog-20
Pantrog-21
Pantrog-22
Pantrog-23
Pantrog -X
Pantrog -Y
Eukaryotic chromosomes
I d (
bits
)
•Chromosomes in eukaryotic organisms maintain similar information densities (Id) suggestive of common informational restraints.

PQ arm
00.020.040.060.080.1
0.120.140.160.180.2
Ath
a-1
Ath
a-2
Ath
a-3
Ath
a-4
Ath
a-5
Hsa
p-1
Hsa
p-2
Hsa
p-3
Hsa
p-4
Hsa
p-5
Hsa
p-6
Hsa
p-7
Hsa
p-8
Hsa
p-9
Hsa
p-1
0
Hsa
p-11
Hsa
p-1
2
Hsa
p-1
3
Hsa
p-1
4
Hsa
p-1
5
Hsa
p-1
6
Hsa
p-1
7
Hsa
p-1
8
Hsa
p-1
9
Hsa
p-2
0
Hsa
p-2
1
Hsa
p-2
2
Hsa
p-X
Hsa
p-Y
organism
Id v
alu
e o
f p
and
q a
rms
•A. thaliana, human chromosomes and Rattus norvegicus (not shown)
•Id values are similar also for the two arms of the chromosomes.

What is the smallest unit of a chromosome that maintains a constant information density?
Statistical similarity between the various chromosomes of yeast has been demonstrated previously (Li et al., 1998)

Two hypotheses, ‘single common origin’ or ‘duplication/polyploidization of a limited set of chromosome’ were suggested to explain the uniformity seen in the various chromosomes of an organism (Von Bertalanffy, 1975) : few rather than one Id should be seen
•Polyploidization of a few related sequences of a common origin, a mix of the two hypotheses, could explain the constancy amongst the chromosomes.
•A result of functional constraints imposed by the need to use common cellular machinery ?

0.000
0.050
0.100
0.150
0.200
0.250
0.300
0.350
0.400
0 5 10 15 20 25 30 35
|%AT-50|
bits
Variation of |%AT-50| with information density.
The thinner line corresponds to the D1 values for the respective genomes. The inverse correlation of (RD2+RD3) with |%AT-50| and the trend of D1 with |%AT-50| illustrates the balance between scalar (variation of nucleotides composition) and vector (variation in the order of occurrence of nucleotides) strategies to combat error
prokaryotes
eukaryotes

•Inverse correlation: contribution of compositional redundancy (RD1) and Shannon redundancy (dinucleotide (RD2) and trinucleotide (RD3) frequency distributions )
• (RD2+RD3) with | %AT-50 |. Correlation values -0.93 and -0.83 for prokaryotes and eukaryotes.
•D1 with the |%AT-50| follows that of Id except at compositional frequencies closer to the equiprobable (50%)
•RD1 with RD2: -0.89 and -0.90 prokaryotes and eukaryotes
•RD1 with RD3: -0.84 and -0.58 for prokaryotes and eukaryotes

Suggests to combat error
A balance between strategies
involving variation in nucleotide composition and variation in the order of occurrence of nucleotides.
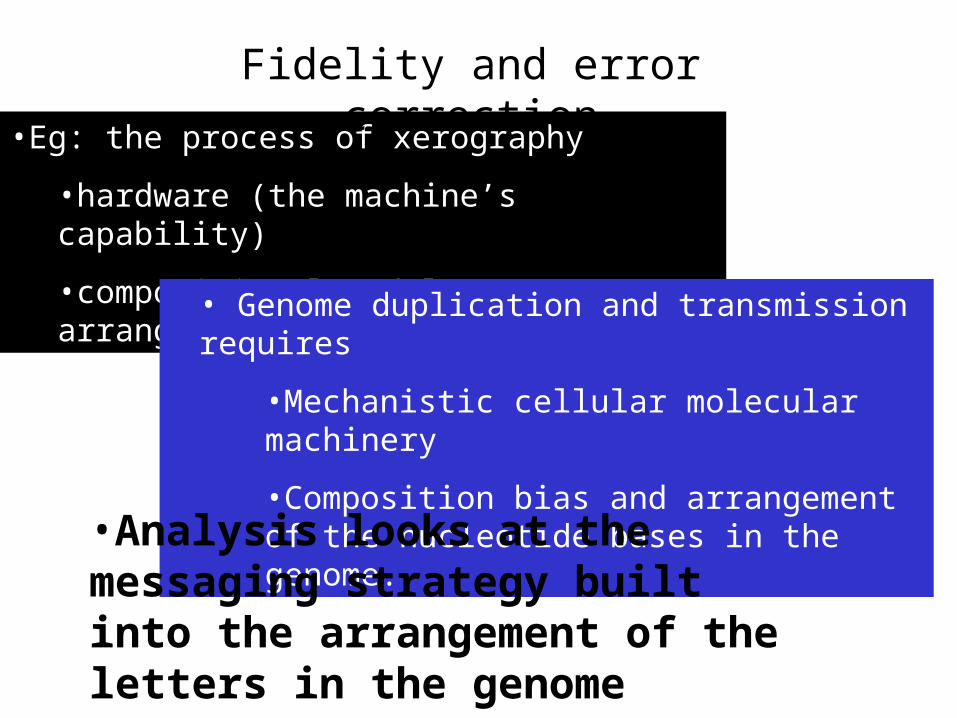
•Eg: the process of xerography
•hardware (the machine’s capability)
•compositional and letter arrangements of the text
Fidelity and error correction
• Genome duplication and transmission requires
•Mechanistic cellular molecular machinery
•Composition bias and arrangement of the nucleotide bases in the genome.
•Analysis looks at the messaging strategy built into the arrangement of the letters in the genome sequences.

Possibly the presence of a number of proof-reading mechanisms at various levels in the living systems (both within organisms and in evolution in the form of natural selection)
allows biological language strings to maintain higher potential information at the expense of retrievable information thereby providing the possibility of higher message variety.
Acknowledgements
Preeti Mehta,
Srividhya K.V
Alaguraj V
Hirendra Vikram
Govind, M.K.
Ramneek Gupta
DBT BTIS Bioinformatics


