Social Security Bulletin, Vol. 76, No. 3, 2016 17 Introduction The Supplemental Security Income (SSI) program is a crucial component of the social safety net for low- income adults with severe disabilities. In addition to providing federal cash payments (with optional state supplements), SSI often serves as a gateway to health insurance under Medicaid. Although SSI and Medicaid are both means-tested programs, finan- cial eligibility for SSI is determined using standard national criteria, whereas Medicaid is administered by the states, which have considerable leeway in developing Medicaid eligibility policies. In 40 states and the District of Columbia (41 jurisdictions), SSI awardees are categorically eligible for Medicaid. In 34 of those jurisdictions, the Social Security Admin- istration (SSA) promptly notifies the state Medicaid agency of an individual’s categorical eligibility for Medicaid upon award of SSI payments using an electronic transmission process—in other words, Medicaid enrollment is automatic. 1 However, in seven of the states where SSI eligibility confers Medicaid eligibility, SSI awardees must file a separate Medicaid application. 2 Ten other states also require a separate Medicaid application and employ Medicaid income or asset limits that are more restrictive than those for SSI, with the result that some SSI recipients do not qualify for Medicaid coverage in those states. 3 Thus, Selected Abbreviations ACA Affordable Care Act CMS Centers for Medicare and Medicaid Services DI Disability Insurance SSA Social Security Administration SSI Supplemental Security Income * Kalman Rupp is an Affiliated Scholar at the Urban Institute; when the study described in this article began, he was a senior economist with the Office of Policy Evaluation and Modeling, Office of Research, Evaluation, and Statistics, Office of Retirement and Disability Policy, Social Security Administration. Gerald Riley is a Senior Research Associate at the Actuarial Research Corporation; when the study described in this article began, he was a senior researcher in the Center for Medicare and Medicaid Innovation, Centers for Medicare and Medicaid Services. Note: Contents of this publication are not copyrighted; any items may be reprinted, but citation of the Social Security Bulletin as the source is requested. The Bulletin is available on the web at https://www.socialsecurity.gov/policy/docs/ssb/. The findings and conclusions presented in the Bulletin are those of the authors and do not necessarily represent the views of the Social Security Administration, the Centers for Medicare and Medicaid Services, or any other agency or organizational entity. STATE MEDICAID ELIGIBILITY AND ENROLLMENT POLICIES AND RATES OF MEDICAID P ARTICIPATION AMONG DISABLED SUPPLEMENTAL SECURITY INCOME RECIPIENTS by Kalman Rupp and Gerald F. Riley* In addition to providing income-maintenance payments to eligible participants, the Supplemental Security Income (SSI) program provides automatic Medicaid enrollment for applicants upon SSI award in most states. Other states require applicants to file a separate Medicaid application. Some use the SSI eligibility criteria for both programs; others use Medicaid eligibility rules that are more restrictive. We use matched monthly longitu- dinal administrative records to test whether automatic enrollment has a positive effect on Medicaid coverage. Using logistic regression with a combination of repeated cross-section and regression discontinuity approaches, we find positive effects of automatic enrollment on Medicaid coverage relative to other policies. The differences are attributable to a discontinuous increase in Medicaid coverage shortly after the final disability determination decision. The time lag arising from the often-lengthy disability determination process reduces the effectiveness of automatic enrollment, which depends critically on timeliness of the final award decision.
Transcript
Social Security Bulletin, Vol. 76, No. 3, 2016 17
IntroductionThe Supplemental Security Income (SSI) program is a crucial component of the social safety net for low-income adults with severe disabilities. In addition to providing federal cash payments (with optional state supplements), SSI often serves as a gateway to health insurance under Medicaid. Although SSI and Medicaid are both means-tested programs, finan-cial eligibility for SSI is determined using standard national criteria, whereas Medicaid is administered by the states, which have considerable leeway in developing Medicaid eligibility policies. In 40 states and the District of Columbia (41 jurisdictions), SSI awardees are categorically eligible for Medicaid. In 34 of those jurisdictions, the Social Security Admin-istration (SSA) promptly notifies the state Medicaid agency of an individual’s categorical eligibility for Medicaid upon award of SSI payments using an
electronic transmission process—in other words, Medicaid enrollment is automatic.1 However, in seven of the states where SSI eligibility confers Medicaid eligibility, SSI awardees must file a separate Medicaid application.2 Ten other states also require a separate Medicaid application and employ Medicaid income or asset limits that are more restrictive than those for SSI, with the result that some SSI recipients do not qualify for Medicaid coverage in those states.3 Thus,
Selected Abbreviations
ACA Affordable Care ActCMS Centers for Medicare and Medicaid ServicesDI Disability InsuranceSSA Social Security AdministrationSSI Supplemental Security Income
* Kalman Rupp is an Affiliated Scholar at the Urban Institute; when the study described in this article began, he was a senior economist with the Office of Policy Evaluation and Modeling, Office of Research, Evaluation, and Statistics, Office of Retirement and Disability Policy, Social Security Administration. Gerald Riley is a Senior Research Associate at the Actuarial Research Corporation; when the study described in this article began, he was a senior researcher in the Center for Medicare and Medicaid Innovation, Centers for Medicare and Medicaid Services.
Note: Contents of this publication are not copyrighted; any items may be reprinted, but citation of the Social Security Bulletin as the source is requested. The Bulletin is available on the web at https://www.socialsecurity.gov/policy/docs/ssb/. The findings and conclusions presented in the Bulletin are those of the authors and do not necessarily represent the views of the Social Security Administration, the Centers for Medicare and Medicaid Services, or any other agency or organizational entity.
State Medicaid eligibility and enrollMent PolicieS and rateS of Medicaid ParticiPation aMong diSabled SuPPleMental Security incoMe reciPientSby Kalman Rupp and Gerald F. Riley*
In addition to providing income-maintenance payments to eligible participants, the Supplemental Security Income (SSI) program provides automatic Medicaid enrollment for applicants upon SSI award in most states. Other states require applicants to file a separate Medicaid application. Some use the SSI eligibility criteria for both programs; others use Medicaid eligibility rules that are more restrictive. We use matched monthly longitu-dinal administrative records to test whether automatic enrollment has a positive effect on Medicaid coverage. Using logistic regression with a combination of repeated cross-section and regression discontinuity approaches, we find positive effects of automatic enrollment on Medicaid coverage relative to other policies. The differences are attributable to a discontinuous increase in Medicaid coverage shortly after the final disability determination decision. The time lag arising from the often-lengthy disability determination process reduces the effectiveness of automatic enrollment, which depends critically on timeliness of the final award decision.
we observe three distinct state Medicaid enrollment policy regimes for SSI awardees:1. automatic Medicaid enrollment of SSI awardees,
initiated by SSA, and categorical Medicaid eligibil-ity using uniform national standards to establish SSI eligibility for federal benefits (hereafter, auto-matic enrollment);
2. the requirement of a separate Medicaid application and the reliance on SSA’s determination of SSI eli-gibility to establish categorical Medicaid eligibility (hereafter, separate-application/nonrestrictive); and
3. the requirement of a separate Medicaid applica-tion with Medicaid eligibility criteria that are more restrictive than those for SSI (hereafter, separate-application/restrictive).
Box 1 summarizes the policy regimes and lists the states that have adopted them.
Requiring a separate Medicaid application may limit Medicaid enrollment among SSI recipients for several reasons. First, it imposes a burden of additional time and effort on the applicant. Recent evidence from behavioral economics suggests that default automatic enrollment substantially increases participation
(Knoll 2010). Second, requiring a separate applica-tion increases administrative complexity, which may result in processing delays and an extended period of uncertainty about ultimate eligibility for Medicaid coverage. Further, the Medicaid enrollment rates of SSI recipients in separate application/restrictive states are expected by design to be lower than those in other states, at least initially. However, automatic enroll-ment does not necessarily guarantee swift access to Medicaid coverage because it does not take place until after SSA determines that an SSI applicant meets the program’s definition of disability, which may require more than one level of adjudication; in some cases, that process may take more than 2 years. For these and other reasons, we are particularly interested in both temporary and long-term effects of automatic enroll-ment on Medicaid coverage, as compared with the separate-application policy regimes.
This study examines month-to-month longitudinal dynamics of Medicaid coverage among disabled adult first-time SSI awardees who do not receive any Social Security Disability Insurance (DI) benefits. We track Medicaid coverage not only for 72 months starting with the month of SSI award but also for the 12 months
Box 1. State Medicaid enrollment policies for SSI recipients
Policy regime Enrollment process SSI eligibility—a States
Automatic enrollment
SSA automatically notifies state Medicaid office upon determining that an SSI applicant is eligible for SSI.
Confers categorical eligibility for Medicaid.
Alabama, Arizona, Arkansas, California, Colorado, Delaware, District of Columbia, Florida, Georgia, Iowa, Kentucky, Louisiana, Maine, Maryland, Massachusetts, Michigan, Mississippi, Montana, New Jersey, New Mexico, New York, North Carolina, Pennsylvania, Rhode Island, South Carolina, South Dakota, Tennessee, Texas, Vermont, Washington, West Virginia, Wisconsin, and Wyoming.(Sometimes called the “1634 states.”)
Separate-application/ nonrestrictive
SSI applicant must file a separate Medicaid application.
Confers categorical eligibility for Medicaid.
Alaska, Idaho, Kansas, Nebraska, Nevada, Oregon, and Utah. (Sometimes called the “SSI criteria states.”)
Separate-application/ restrictive
SSI applicant must file a separate Medicaid application.
Does not confer categorical eligibility for Medicaid. State uses at least one eligibility criterion that is more restrictive than those of SSI.
Connecticut, Hawaii, Illinois, Indiana,b Minnesota, Missouri, New Hampshire, North Dakota, Ohio, Oklahoma, and Virginia.(Sometimes called the “209b states.”)
SOURCE: SSA (2014).a. Regardless of policy regime, SSI applicants who are not categorically eligible for SSI may yet be Medicaid-eligible depending on state
eligibility rules.b. Indiana converted to automatic enrollment in 2014, after the period studied in this analysis (2001–2006).
prior to eligibility onset. Throughout the article, “Med-icaid coverage” applies to individuals who are eligible for full Medicaid benefits and excludes those who receive only partial benefits under Medicare Savings Programs (such as the Qualified Medicare Beneficiary and the Specified Low Income Beneficiary programs).
In this article, we test the following four hypotheses:• That states requiring a separate application are
associated with lower Medicaid coverage than auto-matic enrollment states are, at least initially.
• That using restrictive eligibility rules further decreases Medicaid coverage among SSI awardees, at least initially.
• That the final determination that a working-age SSI applicant is categorically disabled produces a sharply discontinuous increase in Medicaid cover-age, regardless of the enrollment policy regime.
• That the positive Medicaid coverage effect of auto-matic enrollment is conditional on the timeliness of the final disability determination and subsequent receipt of the first SSI payment, such that extended lags in the receipt of the first SSI payment reduce the effectiveness of automatic enrollment.Although we are unaware of any studies that
directly test these hypotheses, we note two obser-vational studies that develop and test closely related hypotheses using cross-sectional regression methods. Ungaro and Federman (2009) hypothesize that restric-tive eligibility criteria should be associated with lower probability of Medicaid enrollment among the elderly. Their point estimate is consistent with their hypoth-esis, but is not statistically significant. Burns and oth-ers (2012) hypothesize that lack of insurance among adults with disabilities should be positively associated with separate-application policies relative to automatic enrollment. Their regression-adjusted estimates show statistically significant differences in the expected direction. Finally, we note that there is a broader body of literature looking at the effect of Medicaid expan-sion on various outcomes. Some studies use data from social experiments (Baicker and Finkelstein 2011; Finkelstein and others 2012; Baicker and others 2013; Taubman and others 2014; Weathers and Stegman 2012). Some focus on Medicaid expansion under the Affordable Care Act (ACA) (Dorn and others 2013; Flowers 2010; Musumeci 2012; Rudowitz and others 2014; Sheedy and Witgert 2013; Sommers, Baicker, and Epstein 2012). Swartz and others (2015) present simulation results showing that administrative inno-vation might reduce Medicaid “churning” (program
exits and reentries because of frequent income- or asset-related eligibility changes) and thereby increase coverage. Although our study covers a pre-ACA period, we find relevant implications for Medicaid enrollment under the ACA. In particular, because Medicaid expansion under the ACA effectively decouples SSI and Medicaid eligibility criteria in the affected “expansion states,” we will discuss a simple procedural change to the current Medicaid automatic enrollment process that could dramatically increase its scope and improve its timeliness.
DataWe use administrative records from SSA’s Disability Analysis File (DAF) linked to Medicaid records from the Centers for Medicare and Medicaid Services (CMS). The DAF combines program enrollment and benefit data from several SSA files on disabled benefi-ciaries of the SSI or DI programs (or both). From the DAF, we select a 10 percent sample of first-time SSI recipients aged 18–64 at program entry whose first month of payment eligibility was in 2000. For each sample member, we extract data on monthly benefit eligibility and actual payment status for SSI and DI from birth through 2006, state of residence at the month of first SSI eligibility in 2000, monthly survi-vor status for the 2000 to 2007 period, and selected demographic and diagnostic characteristics.
In this analysis, the key longitudinal data elements involve SSI payment status: specifically, whether the individual is eligible for SSI payment and whether the benefit is actually paid during a given month. Payment eligibility refers to having a payment due according to legislative design, while benefit payment refers to actual delivery by check or electronic transfer. The two may differ for a variety of reasons, most often because of the time lag involved in the initial disabil-ity determination.4 Unlike DI benefits, SSI payments cannot be granted for months prior to application, even if the person was disabled in those months. Neverthe-less, retroactivity arising from operational lags in the disability determination process applies to both programs. For practical purposes, the first month of SSI payment eligibility is the month immediately after application, and benefits are first paid shortly after the disability allowance decision. Thus, the lag between application and allowance is roughly equal to the lag between the first month of SSI eligibility and the first month of payment receipt. For that reason and others, we focus on those dates: that is, the first month of pay-ment eligibility and the first month of actual receipt.
The sample excludes adults who received SSI disability payments as children. We also exclude recipients with any DI benefit eligibility from 2000 through 2006 because DI eligibility can affect eligibil-ity for SSI and (indirectly) Medicaid benefits (Rupp and Riley 2011, 2012). Applicants for and recipients of concurrent SSI/DI benefits are subject to more com-plex eligibility rules and administrative procedures; in addition, working-age individuals at risk of DI and concurrent SSI/DI participation tend to have stronger labor force attachment and access to a wider array of health insurance options than those at risk of SSI-only participation. Moreover, because the dominant source of health insurance for SSI-only participants is clearly Medicaid, those individuals would stand to be the ones most affected by the state Medicaid policy regime (Rupp, Davies, and Strand 2008).
We link our sample file to annual Medicaid Ana-lytic Extract (MAX) personal summary files in the CMS Chronic Conditions Data Warehouse (CMS 2016) using Social Security number, sex, and date of birth. The MAX personal summary files include data on monthly Medicaid coverage, Medicaid payments, and demographics from 1999 (the year prior to first-ever month of SSI eligibility) through 2007. Additional details on the data set and sample selection are avail-able in Riley and Rupp (2014b).
Our analysis file includes demographic and diagno-sis data for the first month of SSI eligibility in 2000. It tracks 84 months of Medicaid coverage, SSI eligibility, and SSI payment status keyed to the first month of SSI eligibility (from the 12 months preceding the first month of eligibility through a period of 72 months starting with the month of award), as well as survival status and age for each sample member at any month in that span.
MethodsFirst, we test the relationship between automatic enroll-ment and the two alternative policies using repeated cross-section modeling. We use the following equation:
Y Xit t i t t it= + + +α β γ εPOLICY , (1)
where Yit is Medicaid coverage of individual i at month t (−12 to 72), X is a vector of individual characteristics, POLICY is the state-policy vector, and εit is the error term. In this formulation, t = 1 represents the month of first SSI payment eligibility.
Our basic model structure is similar to that of the cross-sectional models used in Ungaro and Federman (2009) and Burns and others (2012). Repeating the
cross-sections provides two improvements. First, with the monthly cross-sections prior to the first month of SSI eligibility, we can test the hypothesis of separate-application effects. Any significant positive or negative coefficient for 4 to 12 months before eligibility should represent unobserved differences among the three policy regimes that cannot be explained by automatic enrollment, which is triggered by a positive disability determination that can only occur after the first month of payment eligibility. However, the results for 1 to 3 months before eligibility may be somewhat affected by the few cases in which SSI disability determination is almost instantaneous, because Medicaid coverage can be granted for up to 3 months prior to SSI eligibil-ity. Second, our data allow 72 repeated cross-sections starting with the month of first SSI award, enabling us to analyze the temporal pattern of estimated policy-regime effects.
Next, we address how automatic enrollment in prac-tice may affect the results from equation 1. As noted earlier, SSI payments cannot be granted for months of disablement prior to application, but eligibility can start as early as the month after application. Here we face the inconvenient but operationally inevitable fact that the complex SSI disability determination process is typically far from instantaneous. In fact, the SSI final award decision lags substantially behind the application date in many cases. Initially rejected applicants might go through multiple layers of appeal; in some cases, the final determination can take more than 2 years. Once disability has been determined, two events occur within a short span, if not simultane-ously. First, the approved applicant starts to receive monthly payments (along with a retroactive lump-sum payment). Second, automatic enrollment occurs: SSA informs the state Medicaid office that the person is entitled to SSI payment and is therefore categorically eligible for Medicaid. This second step of course does not affect people living in states with separate-application policies.
The disability determination process may create a sharp discontinuity in Medicaid coverage rates that can be identified through regression analysis. From the applicant and Medicaid program perspectives, the ultimate eligibility of individuals awaiting an initial disability determination (or appealing a rejected initial determination) is uncertain. Under all three of the policy regimes, individuals can apply for Med-icaid regardless of SSI application status; but costs, information gaps, and barriers to access reduce the likelihood that they will do so. Thus, we hypothesize
a sharp increase in Medicaid coverage in automatic enrollment states for SSI recipients around the time of the first payment. Although coverage may also increase in the other two groups of states around the time of the first SSI payment (as SSA apprises award-ees of potential Medicaid eligibility), we hypothesize a discontinuous differential increase in Medicaid cover-age arising specifically from automatic enrollment. To test this hypothesis, we face two distinct challenges. The first is to demonstrate whether a sharp increase in Medicaid coverage is associated with the first SSI payment regardless of policy regime. The second is to detect any effect of automatic enrollment on Medicaid coverage conditional on the receipt of the first SSI payment. We use the following equation to address the first of these issues:
Y X Z Sit t i t itk tk t it= + + + +α β δ ζ ε , (2)
where Zitk is a vector that equals 1 if the first SSI pay-ment for individual i was made during month k ≤ t, and 0 if otherwise; and S is a vector of states. Our basic hypothesis is that there is a discontinuous jump around the month of the first SSI payment (t = k). The state dummies factor out time-invariant fixed effects, including policy regime. Again, because we follow up for 72 months, we have ample detail on the temporal patterns associated with the combination of t and k.
The next two equations are identical to equation 1 except that the estimates are conditioned on the receipt of the first SSI payment:
it it t i it t it| (PAIDY X) POLICY= = + + +1 α β γ ε , (3)and
it it t i it t it| (PAID ) POLICY= = + + +0 α β γ εY X , (4)
where PAIDit is an indicator that equals 1 if a first SSI payment was made in month k ≤ t, and 0 if otherwise.
Equation 3 is a direct test of the hypothesis of a positive effect for a subsample that is directly affected by automatic enrollment compared with two counterfactual policy-regime scenarios using the same sample-selection rule. Here, we expect posi-tive automatic-enrollment effects of greater absolute magnitude than those estimated by equation 1.
Conversely, equation 4 tests effects on applicants whose Medicaid eligibility should not be affected by automatic enrollment. Although in this case we expect no positive automatic-enrollment effect, our expecta-tions are otherwise somewhat ambiguous because the results are also influenced by the effectiveness of separate-application policy regimes. For example,
separate-application/nonrestrictive states may use other Medicaid eligibility categories to establish disability status for Medicaid applicants whose cases SSA has not yet adjudicated and thus whose final SSI eligibility status is yet uncertain. If such cases are frequent, we should expect a negative automatic enrollment estimate from equation 4.5
We use logistic regression and express the results in terms of relative odds. Although our key interest is in the coverage effect of automatic enrollment, we discuss our results from the perspective of the two alternative policies and cast automatic enrollment as the counterfactual reference-case scenario. Using this approach, we can easily estimate the effect of the absence of automatic enrollment—alone and in combination with stricter Medicaid financial eligibility rules. The estimated effects of automatic enrollment relative to the separate-application policy regimes can be obtained by either changing the sign of the estimate or calculating the inverse of the odds ratios presented, depending on the specification.
In addition to Medicaid coverage, we look at two factors that may also be associated with the policy regimes: Medicaid expenditures and participant demo-graphic characteristics. Because Medicaid expenditures vary widely, we analyze both average amounts and dis-tributional patterns. We calculate average expenditures per awardee for the full awardee cohort, including those who did not enroll in Medicaid. For SSI recipi-ents without Medicaid coverage and thus no record of Medicaid expenditures, we assign an expenditure amount of $0; those observations principally represent true zeros, not missing values. We examine annual and cumulative expenditures for the period 2001–2006. We expect variations in Medicaid expenditures per SSI awardee to reflect in part the financial impact of the different state Medicaid policy regimes. In the analysis of policy-regime differences in demographic charac-teristics, we use a difference-in-differences framework first to explore mortality then to look at associations between Medicaid policy regimes and enrollee demo-graphic characteristics conditional on survival.
The strength of the empirical analysis depends on the data available. The internal validity of observa-tional data such as ours may not be equal to that of data derived from social experiments. In particular, Medic-aid coverage may be affected by unmeasured variables associated with the timing of disability determinations, the policy regime, or both. We attempt to address this concern by using repeated preeligibility and posteli-gibility cross-sections, regression discontinuity, and
difference-in-differences techniques to test multiple implications of our core hypotheses. Although sur-vey data might have a richer array of information on applicant characteristics, administrative records provide tremendous advantages for this analysis, such as greater sample size, precise monthly measurements of SSI and Medicaid participation and mortality status over several years, exact timing of key program events, and precise data on Medicaid program expenditures. Some SSA and CMS records may have failed to match (because Social Security number data are occasionally inaccurate or missing from some Medicaid records), but such problems appear to be fairly minor in the data
set we use (Riley and Rupp 2014b). Again, although we cannot completely eliminate validity concerns arising from using these data, our analytic techniques have been selected in part to optimize identification.
ResultsTable 1 compares awardee characteristics by state policy regime. Percentage distributions by sex and primary diagnosis are fairly similar for the three regimes. The separate-application/restrictive states had a slightly younger SSI population and slightly higher proportions of recipients diagnosed with mental and intellectual disorders than the other states.
Circulatory system 0.3 1.3 0.6 0.3Digestive system 0.2 0.8 0.3 0.1Genitourinary system 0.2 0.6 0.3 0.1Musculoskeletal system 0.4 1.7 0.8 0.3Nervous system 0.3 1.6 0.6 0.2Respiratory system 0.2 1.1 0.4 0.2
0.1 0.6 0.2 0.10.2 1.1 0.5 0.2
Men
Intellectual disability
Endocrine, nutritional, and metabolic diseases
Women
Data missing
Sex
18–3031–4546–64
Age group
Characteristic Overall
Table 1. Percentage distributions of 2000 SSI awardees aged 18–64, by selected characteristics and state Medicaid policy regime—Continued
* = difference from the value for automatic enrollment states is statistically significant at the 0.05 level (two-tailed test).
SOURCE: Authors' calculations based on SSA and CMS administrative records.
NOTES: Sample comprises SSI awardees who were aged 18–64 at award in 2000. Sample is limited to first-time awardees who were not DI beneficiaries before or within 72 months of SSI award. SSI awardees who were first entitled to SSI payments prior to their 18th birthdays are not included in the sample cohort.
Rounded components of percentage distributions do not necessarily sum to 100.0.
UnknownOther nonmental impairments
SSA primary diagnosis
NeoplasmsCongenital anomalies
Mental impairments
Nonmental impairments
Diseases of the—
Other mental impairments
InjuriesInfectious and parasitic diseases
Medicaid policy regime
Standard errors
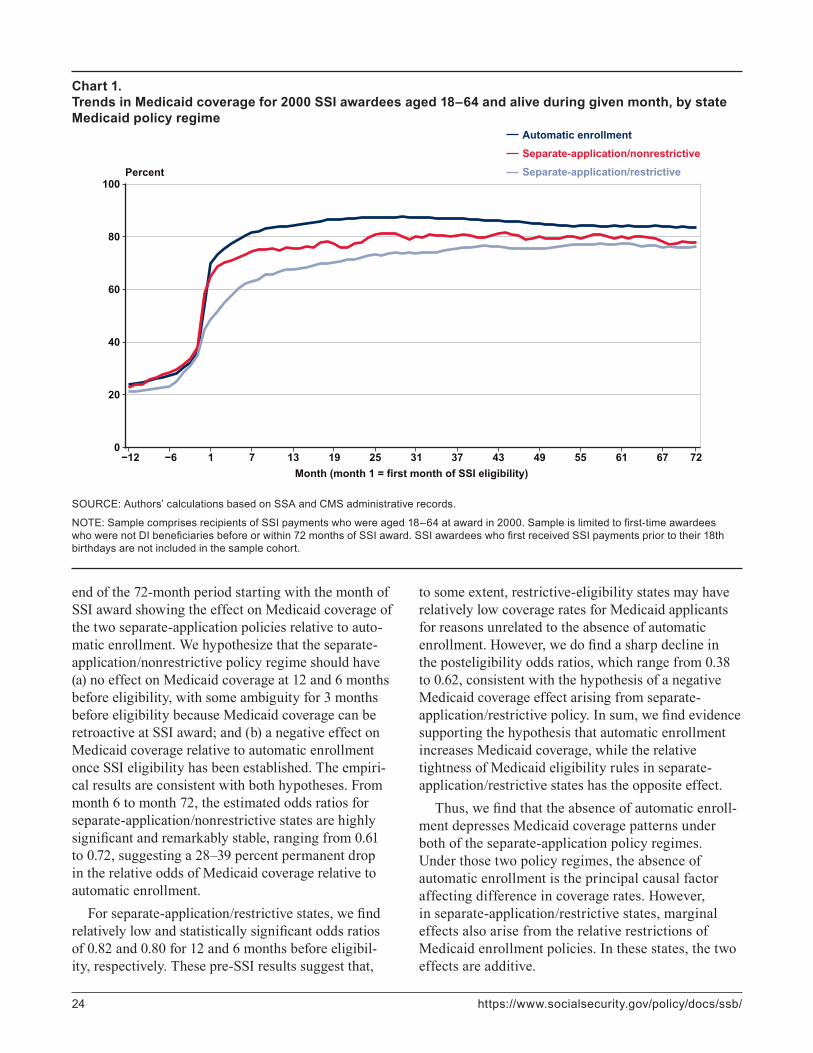
Medicaid CoverageChart 1 shows Medicaid coverage rates by month and policy regime. Residents of separate-application/restrictive states always have the lowest levels of Med-icaid coverage, while residents of automatic enroll-ment states usually have the highest coverage rates. Nevertheless, the temporal patterns are worth noting. The lower Medicaid coverage rates in the separate-application/restrictive states 4–12 months prior to SSI eligibility suggest some selection effect. However, the differences between separate-application/restrictive policy and the other regimes are much smaller in that
period than are the posteligibility differences. This difference in differences suggests that posteligibility variation in Medicaid coverage rates may be partly attributable to different state Medicaid enrollment policies and are not spurious reflections of unrelated factors. We also observe that posteligibility differ-ences tend to diminish through time. Thus, whereas part of the policy-regime effect seems relatively permanent, the rest might be temporary.
Next, we estimate equation 1. Table 2 presents regression-adjusted odds-ratio estimates at eight cross-sections from 12 months before SSI eligibility to the
end of the 72-month period starting with the month of SSI award showing the effect on Medicaid coverage of the two separate-application policies relative to auto-matic enrollment. We hypothesize that the separate-application/nonrestrictive policy regime should have (a) no effect on Medicaid coverage at 12 and 6 months before eligibility, with some ambiguity for 3 months before eligibility because Medicaid coverage can be retroactive at SSI award; and (b) a negative effect on Medicaid coverage relative to automatic enrollment once SSI eligibility has been established. The empiri-cal results are consistent with both hypotheses. From month 6 to month 72, the estimated odds ratios for separate-application/nonrestrictive states are highly significant and remarkably stable, ranging from 0.61 to 0.72, suggesting a 28–39 percent permanent drop in the relative odds of Medicaid coverage relative to automatic enrollment.
For separate-application/restrictive states, we find relatively low and statistically significant odds ratios of 0.82 and 0.80 for 12 and 6 months before eligibil-ity, respectively. These pre-SSI results suggest that,
to some extent, restrictive-eligibility states may have relatively low coverage rates for Medicaid applicants for reasons unrelated to the absence of automatic enrollment. However, we do find a sharp decline in the posteligibility odds ratios, which range from 0.38 to 0.62, consistent with the hypothesis of a negative Medicaid coverage effect arising from separate-application/restrictive policy. In sum, we find evidence supporting the hypothesis that automatic enrollment increases Medicaid coverage, while the relative tightness of Medicaid eligibility rules in separate-application/restrictive states has the opposite effect.
Thus, we find that the absence of automatic enroll-ment depresses Medicaid coverage patterns under both of the separate-application policy regimes. Under those two policy regimes, the absence of automatic enrollment is the principal causal factor affecting difference in coverage rates. However, in separate-application/restrictive states, marginal effects also arise from the relative restrictions of Medicaid enrollment policies. In these states, the two effects are additive.
Chart 1. Trends in Medicaid coverage for 2000 SSI awardees aged 18–64 and alive during given month, by state Medicaid policy regime
SOURCE: Authors’ calculations based on SSA and CMS administrative records.
NOTE: Sample comprises recipients of SSI payments who were aged 18–64 at award in 2000. Sample is limited to first-time awardees who were not DI beneficiaries before or within 72 months of SSI award. SSI awardees who first received SSI payments prior to their 18th birthdays are not included in the sample cohort.
SSI disability payments; until then, the applicant does not know the eventual award outcome.6 Therefore, automatic enrollment should have no positive effect on Medicaid coverage during the period prior to award, during which SSI eligibility remains uncertain.7
The degree to which lags in receiving the first SSI payment mediate the automatic enrollment effect is not trivial, because the SSI disability determination process is typically long. The lag between applica-tion and allowance provides an opportunity to test the effect of the timing of the first SSI payment on Med-icaid coverage by disaggregating the results according to SSI payment status. Doing so explicitly addresses the effect of the lag on Medicaid coverage. We test the hypothesis that the uncertainty arising from the lag in the SSI disability determination process has a negative effect on Medicaid coverage. An eventual SSI awardee does not know the results of the final disability determination until fairly close to the first actual SSI payment. In addition, SSI applicants who were initially denied retain that status until the denial is reversed at a higher level of adjudication. Although denied SSI applicants could possibly obtain Medicaid coverage (depending on Medicaid rules and eligibility determination practices in the given state), uncertainty about categorical SSI eligibility would presumably reduce the probability of that outcome.
To assess how delays in the disability determination affect Medicaid coverage by policy regime, we continue with a two-step analysis. First, we assess whether delays in receiving the first SSI payment affect Medicaid cov-erage overall. Second, we address the combined effect of automatic enrollment and delays in receiving the first SSI payment. Chart 2 and Table 3 address the first step.
Chart 2 shows Medicaid coverage rates at selected cross-sections separately for those who have been paid their first benefit by the given month and those who are not. Because of sample size constraints, month 60 is the last observation we present here. As expected, across time points, coverage rates for those in paid status exceed the rates for those who are not, with dif-ferences ranging from 20 to 27 percentage points.
To further explore whether these patterns reflect causal effects, we test the hypothesized negative effect of prolonged lags between SSI application and final award decision—primarily because of the multistep disability determination process—with a regression discontinuity design. We assume a discontinuity in Medicaid coverage patterns associated with the first month of SSI payment after the final award decision
Separate-application/
nonrestrictive
Separate-application/
restrictive
Odds ratio 1.01 0.82*P>z 0.92 0.00
Odds ratio 1.17 0.80*P>z 0.20 0.00
Odds ratio 1.14 0.94P>z 0.23 0.32
Odds ratio 0.85 0.39*P>z 0.15 0.00
Odds ratio 0.72* 0.39*P>z 0.01 0.00
Odds ratio 0.64* 0.38*P>z 0.00 0.00
Odds ratio 0.61* 0.39*P>z 0.00 0.00
Odds ratio 0.68* 0.62*P>z 0.01 0.00
3rd month
Table 2.Estimated regression-adjusted odds of Medicaid coverage, by separate-application policy regime relative to automatic enrollment: Selected time points before and after date of first SSI eligibility for 2000 awardees aged 18–64
Cross-section (relative to SSI eligibility onset)
12 months prior
6 months prior
3 months prior
The dependent variable for each cross-section is defined as a 0–1 variable, with Medicaid coverage for a given month coded as 1 and the lack of Medicaid coverage coded as 0.
Statistics are estimated from logistic regressions. Models include controls for demographic and diagnostic variables.
* = difference from odds of Medicaid enrollment in automatic enrollment states is statistically significant at the 0.05 level (two-tailed test).
6th month
12th month
24th month
72nd month
SOURCE: Authors' calculations based on SSA and CMS administrative records.
NOTES: Sample comprises SSI awardees who were aged 18–64 at award in 2000. Sample is limited to first-time awardees who were not DI beneficiaries before or within 72 months after SSI award; for a given cross-section, the sample is further limited to survivors aged younger than 65. SSI awardees who were first entitled to SSI payments prior to their 18th birthdays are not included in the sample cohort.
These findings are to be expected, given the imple-mentation practices that each of the policy regimes entail. The effect of automatic enrollment becomes even clearer when we consider what it means in an operational context. Automatic Medicaid enrollment takes effect only after an applicant is approved for
(equation 2). This approach provides relatively strong identification because there is no reason to assume a direct relationship between the exact timing of the first payment and state Medicaid policies or unobserved applicant characteristics. Of course, marginally quali-fied applicants tend to be denied initially and gain a reversal only in later stages of the disability determi-nation process, but there is no reason to anticipate an abrupt change associated with the timing of the first SSI payment.
Table 3 presents the relevant estimates from equa-tion 2 for nine cross-sections using logistic regres-sion. Our dependent variable is the relative odds of Medicaid coverage at selected time points before and after eligibility by the month of first payment rela-tive to SSI award. The reference category is first SSI payment during months 1–6. This corresponds to a lag period of 0–5 months because if first payment occurs during month 1 (month of award), the lag period is 0. In general, if first payment occurs for month z, the payment lag is z − 1. The paired cells of hypothesized discontinuity are outlined and the periods of actual SSI payments (k ≤ t) are shaded. Thus, in each row,
the progression from months with no payment yet to months with payment reads from right to left.8
For the 6th month to the 60th month cross-sections, we can observe situations when the awardee is SSI-eligible but has not received SSI payment, as well as situations when the eligible awardee has already been paid for 1 or more months. For the two preaward cross-sections, there can be no SSI eligibility or payment, by cohort definition. Therefore, the corre-sponding regressions serve a useful control function: For 12 months before eligibility, we should expect no effect of payment delay on Medicaid coverage; but for 3 months before eligibility, the situation is ambiguous because Medicaid can be awarded retroactively for up to 3 months prior to the first month of SSI eligibility.
The empirical results are overwhelmingly con-sistent with our hypothesis of a positive relationship between Medicaid coverage during month t and SSI cash payment during month k ≤ t. The pattern of coefficients clearly shows the discontinuity we hypoth-esized: A substantial drop in the odds ratios appears in the transition from payment to nonpayment status periods (from shaded to unshaded cell to the right
Chart 2. Medicaid coverage during selected months after month of first SSI award: 2000 SSI awardees aged 18–64 at award, by whether first SSI benefit has been paid as of the given month
SOURCE: Authors’ calculations based on SSA and CMS administrative records.
NOTE: Sample comprises SSI awardees who were aged 18–64 at award in 2000. Sample is limited to first-time awardees who were not DI beneficiaries before or within 72 months after SSI award; for a given cross-section, the sample is further limited to survivors aged younger than 65. SSI awardees who were first entitled to SSI payments prior to their 18th birthdays are not included in the sample cohort.
in each outlined pair). Values in those shaded SSI-payment cells range from 0.93 to 1.71; in the adjoining no-payment-yet cells, they drop to values ranging from 0.31 to 0.49. In effect, actual SSI payment is associated with at least a threefold increase in relative odds of Medicaid coverage, strongly supporting the hypothesis of a negative association of lags in the adjudication of SSI claims with Medicaid coverage.
For the two preeligibility time points, the adjusted relative odds are generally close to 1, differing sig-nificantly only in two lag periods for the 12-month
cross-section. This finding is largely consistent with our hypothesis that the lag between eligibility onset and first payment should have no effect on Medicaid coverage 1 year prior to the first month of SSI eligibil-ity. There is, however, a relatively small but statisti-cally significant drop in the relative odds of Medicaid coverage at 3 months before eligibility associated with a 6–11 month lag. This finding is consistent with the Medicaid program rule that allows eligibility to be granted retroactively for 3 months prior to first month of SSI eligibility.9
Table 3.Estimated regression-adjusted odds of Medicaid coverage at selected time points before and after SSI eligibility onset, by time period of first SSI payment relative to month of first-ever award: 2000 SSI awardees aged 18–64
36th month
60th month
SOURCE: Authors' calculations based on SSA and CMS administrative records.
NOTES: Sample comprises recipients of SSI payments who were aged 18–64 at award in 2000. Sample is limited to first-time awardees who were not DI beneficiaries before or within 72 months of SSI award; for a given cross-section, the sample is further limited to survivors aged younger than 65. SSI awardees who first received SSI payments prior to their 18th birthdays are not included in the sample cohort.
12 months prior
Cross-section (relative to SSI eligibility onset)
First payment during month (month 1 = first month of SSI eligibility)
3 months prior
6th month
12th month
18th month
24th month
72nd month
The dependent variable for each cross-section is defined as a 0–1 variable, with Medicaid coverage for a given month coded as 1 and the lack of Medicaid coverage coded as 0.
* = difference from odds of Medicaid enrollment for SSI awardees who experienced a 0–5 month lag in the SSI disability determination process is statistically significant at the 0.05 level (two-tailed test).
Statistics are estimated from logistic regressions. Models include demographic, diagnostic, and state dummy variables.
Table 3 provides strong evidence for a negative association of delays in the receipt of the first SSI pay-ment with Medicaid coverage overall. Next, we explore how those lags in the SSA disability determination process interact with the Medicaid policy regime.
Table 4 shows the estimated effect of state Medicaid policy regime on Medicaid coverage disaggregated by whether the first SSI monthly benefit has been paid as of a given time point. By definition, the proportion of new SSI awardees in paid status is zero during the preeligibility months, and increases as the eligibility period increases. Conversely, the proportion that has not been paid decreases over time. The null hypothesis
is that automatic enrollment should positively affect Medicaid coverage (relative to both separate-applica-tion policy regimes) for SSI awardees who have been paid (equation 3). For SSI awardees who have not been paid by the given observation period (equation 4), automatic enrollment should have no effect relative to the separate-application/nonrestrictive policy regime, and some effect relative to the separate-application/restrictive policy regime.
Consistent with expectations, the empirical results show clear automatic-enrollment effects among those whose first benefit has already been paid. For SSI recipients who have been paid, the low odds ratios
First SSI payment (status as of cross-section date)
Table 4.Estimated regression-adjusted odds of Medicaid coverage, by separate-application policy regime relative to automatic enrollment and SSI payment status as of selected time points before and after SSI eligibility onset for 2000 awardees aged 18–64
* = difference from odds of Medicaid enrollment in automatic enrollment states is statistically significant at the 0.05 level (two-tailed test).
NOTES: Sample comprises SSI awardees who were aged 18–64 at award in 2000. Sample is limited to first-time awardees who were not DI beneficiaries before or within 72 months after SSI award; for a given cross-section, the sample is further limited to survivors aged younger than 65. SSI awardees who were first entitled to SSI payments prior to their 18th birthdays are not included in the sample cohort.
Statistics are estimated from logistic regressions. Models include controls for demographic and diagnostic variables.
SOURCE: Authors' calculations based on SSA and CMS administrative records.
. . . = not applicable.
The dependent variable for each cross-section is defined as a 0–1 variable, with Medicaid coverage for a given month coded as 1 and the lack of Medicaid coverage coded as 0.
for separate-application/nonrestrictive states (ranging from 0.41 to 0.68) indicate automatic enrollment’s con-sistently large and comparatively positive effect. As expected, the contrast between automatic enrollment and separate-application/restrictive policy is even stronger, indicated by still lower odds ratios (ranging from 0.17 to 0.62). The patterns are consistent with the hypothesis that both the lack of automatic enrollment and restrictive state eligibility policies contribute to lower Medicaid coverage in the separate-application/restrictive states.
Results for SSI applicants whose first benefit has not been paid are also consistent with our null hypoth-eses. The separate-application/nonrestrictive regime shows no statistically significant results relative to automatic enrollment. If anything, odds ratios tend to exceed 1.00, suggesting that automatic enrollment may actually be counterproductive for those whose SSI eligibility status is still undecided. In automatic enrollment states, SSA apprises applicants that the SSI award notice will notify them of Medicaid eli-gibility. Under those circumstances, SSI applicants may simply wait to receive the SSI award notice, and initiate no contact with the state Medicaid agency. It is also possible that if an SSI applicant contacts the state Medicaid office, he or she will be told that further action must await the SSI initial award deci-sion. If an SSI applicant is initially denied, SSA refers the ineligible applicant to the state Medicaid agency, which may either find the applicant ineligible for Medicaid or grant coverage on state-level eligibility criteria. Both outcomes take time. By contrast, in separate-application states, SSA refers all SSI claim-ants (including those who concurrently apply for DI) to the state Medicaid office at the outset of the process. Thus, Medicaid coverage is not granted to those SSI applicants unless they actively apply; and because there is no forthcoming SSA action for which to wait, applicants have strong incentive to apply for Medicaid right away. Medicaid coverage is granted to some applicants even before categorical eligibility for SSI as disabled has been determined.
Not surprisingly, SSI awardees whose first SSI ben-efit has not been paid in separate-application/restricted states have lower odds ratios for Medicaid coverage relative to residents of automatic enrollment states 6 and 12 months prior to SSI award. The patterns suggest that the statistically significant coefficients for those who have not been paid SSI benefits may primar-ily or exclusively reflect the restrictiveness of Medicaid eligibility rules. Moreover, the pairwise comparison of
the point estimates in the “paid” and “unpaid” sub-groups is consistent with the expectation of differential Medicaid coverage effect by payment status.10
Other Potential Consequences of State Medicaid PolicyAlthough this article focuses on the effect of state Medicaid policy regime on Medicaid coverage, related factors are also of potential interest. The evidence presented so far strongly supports the notion that requiring a separate Medicaid application—and, in some states, also imposing restrictive state Medicaid eligibility criteria—has substantial negative effects on Medicaid coverage. We next address whether these policies also affect average Medicaid expenditures and whether there is distributional evidence of selective coverage effects for certain demographic or diag-nostic characteristics. Perhaps many people brought into Medicaid by automatic enrollment have access to private health insurance or health conditions that are less severe than those of other Medicaid benefi-ciaries, resulting in no or very little effect on average program expenditures. At the other extreme, perhaps automatic enrollment removes barriers to coverage that affect people with severe health conditions and high expected costs. To assess the tradeoffs implied by restricting Medicaid coverage, we present empiri-cal evidence on expenditure patterns and participant demographic characteristics by policy regime.
Expenditure patterns. Table 5 shows average Medicaid expenditures per SSI awardee for single years (2001–2006) along with the annual average for the entire period, with regression-adjusted differ-ences by policy regime. We focus on the 2001–2006 period because 2001 was the first year in which all awardees could have had a full year of SSI-related Medicaid expenditures. Neither the raw averages nor the regression-adjusted differences for the two separate-application policy regimes are statistically significant compared with the counterfactual of automatic enrollment for any single year or for the 6-year period combined. Yet, given the substantial variance of the expenditure data, one possible reason for rejecting the null hypothesis (no difference) might be Type 2 error. After all, even for the two combined-period regression-adjusted differences, large standard errors of $624 and $322 suggest possible failure to detect relatively meaningful magnitudes of difference. Alternatively, the average expenditures may mask important distributional differences, a consideration that also calls for more detailed analysis.
Table 6 provides logistic regression-adjusted relative odds of Medicaid expenditures exceeding selected percentile levels ranging from the 25th to the 99th for separate-application/nonrestrictive and separate-application/restrictive states relative to automatic enrollment states. In this instance, we first examine the separate-application/restrictive states in the table’s lower panel. The results are fairly straightforward: Restrictive eligibility is associated with statistically significant negative effects in each single year and for the period as a whole at the 25th and 50th percentiles. All of the estimated odds that Medicaid expenditures exceed the 90th percentile are
relatively high for the separate-application/restrictive policy regime, but the 2004 odds ratio is not statisti-cally significant. In no single year are the estimated odds that expenditures exceed the 99th percentile sta-tistically significant, and the point estimates show no clear pattern. The same is true for the entire period. Thus, there is some uncertainty about the presence of a positive relationship at the upper tail; the results are clearly inconsistent with policy concerns about Medicaid access among the severely disabled in restrictive-eligibility states that would imply the exact opposite of what we find.
a. Calculated as the sum of the annual Medicaid expenditures for each awardee divided by six. For individuals who exited the sample during a given year, a value of zero Medicaid expenditures is imputed for subsequent years.
2001–2006 (annual average) a
Table 5.Unadjusted and ordinary least square regression-adjusted mean Medicaid expenditures per SSI awardee by state Medicaid policy regime for 2000 SSI awardees aged 18–64, 2001–2006 (in 2012 dollars)
Unadjusted value Regression-adjusted difference from
automatic enrollment states
Year
2001
2006
2005
2004
2003
2002
A value of zero Medicaid expenditures is imputed for individuals who did not have Medicaid coverage in all 12 months of a given year.
Annual averages are calculated for survivors aged younger than 65 at the end of the calendar year.
SOURCE: Authors' calculations based on SSA and CMS administrative records.
NOTES: Sample comprises SSI awardees who were aged 18–64 at award in 2000. Sample is limited to first-time awardees who were not DI beneficiaries before or within 72 months after SSI award; for a given cross-section, the sample is further limited to survivors aged younger than 65. SSI awardees who were first entitled to SSI payments prior to their 18th birthdays are not included in the sample cohort.
In the upper panel of Table 6, we find no clear evidence of major distributional effects for separate-application/nonrestrictive states relative to automatic enrollment, but two patterns are notable. First, the fact that all but the 2004 estimated odds that expendi-tures will exceed the 25th percentile are smaller than 1 suggests a negative effect of that policy regime on Medicaid expenditures at the lower tail. Second, the estimates suggest statistically significant positive effects on Medicaid expenditures at the 50th, 75th, and 90th percentiles for the first full year, 2001. That finding is consistent with the previously discussed possibility that the separate processing of Medicaid applications may help people who are initially denied
SSI payments and who therefore do not begin receiv-ing payments until sometime later.
Chart 3A shows average cumulative Medicaid expenditures for the period 2001–2006 in separate-application/nonrestrictive and separate-application/restrictive states as percentages of the average expen-diture in automatic enrollment states, by expenditure decile. The percentages for the separate-application/nonrestrictive states are relatively low in the lower deciles, but the overall effects are unclear, suggesting that the scarcity of statistically significant differences seen in the upper panel of Table 6 may simply reflect the absence of meaningful overall effects and not a Type 2 statistical error.
Table 6.Estimated regression-adjusted odds that Medicaid expenditures will exceed selected percentile levels, by separate-application policy regime relative to automatic enrollment, for 2000 SSI awardees aged 18–64, 2001–2006
NOTES: Sample comprises SSI awardees who were aged 18–64 at award in 2000. Sample is limited to first-time awardees who were not DI beneficiaries before or within 72 months after SSI award; for a given cross-section, the sample is further limited to survivors aged younger than 65. SSI awardees who were first entitled to SSI payments prior to their 18th birthdays are not included in the sample cohort.
200420052006
2001–2006 (annual average) a
Year
20012002
90th percentile 99th percentile
2001200220032004
25th percentile 50th percentile 75th percentile
2003
Calculated for each component year in constant dollars, for all persons in the sample regardless of exit status. For individuals who exited the sample during a given year, a value of zero Medicaid expenditures is imputed for subsequent years.
* = difference from odds of Medicaid expenditures in automatic enrollment states is statistically significant at the 0.05 level (two-tailed test).
Separate-application/nonrestrictive
Separate-application/restrictive
-- = not available (insufficient sample size).
20052006
2001–2006 (annual average) a
SOURCE: Authors' calculations based on SSA and CMS administrative records.
Statistics are estimated from logistic regressions.
A value of zero Medicaid expenditures is imputed for individuals who did not have Medicaid coverage in all 12 months of a given year.
The results for separate-application/restrictive states in Chart 3A are more straightforward and pro-nounced. At every decile through the 7th, we observe a large negative effect relative to both the automatic enrollment states and the separate-application/nonrestrictive states. This finding is consistent with coverage differences by policy regime (larger nega-tive effects for separate-application/restrictive states than for separate-application/nonrestrictive regimes), up to and beyond the median. However, the pattern is reversed at the 9th and 10th deciles. The reversal at the upper tail may reflect statistical noise, unintended adverse effects of separate-application/restrictive policy, or one or more other factors. However, inter-preting the cause of that reversal is beyond the scope of the analysis our data set allows.
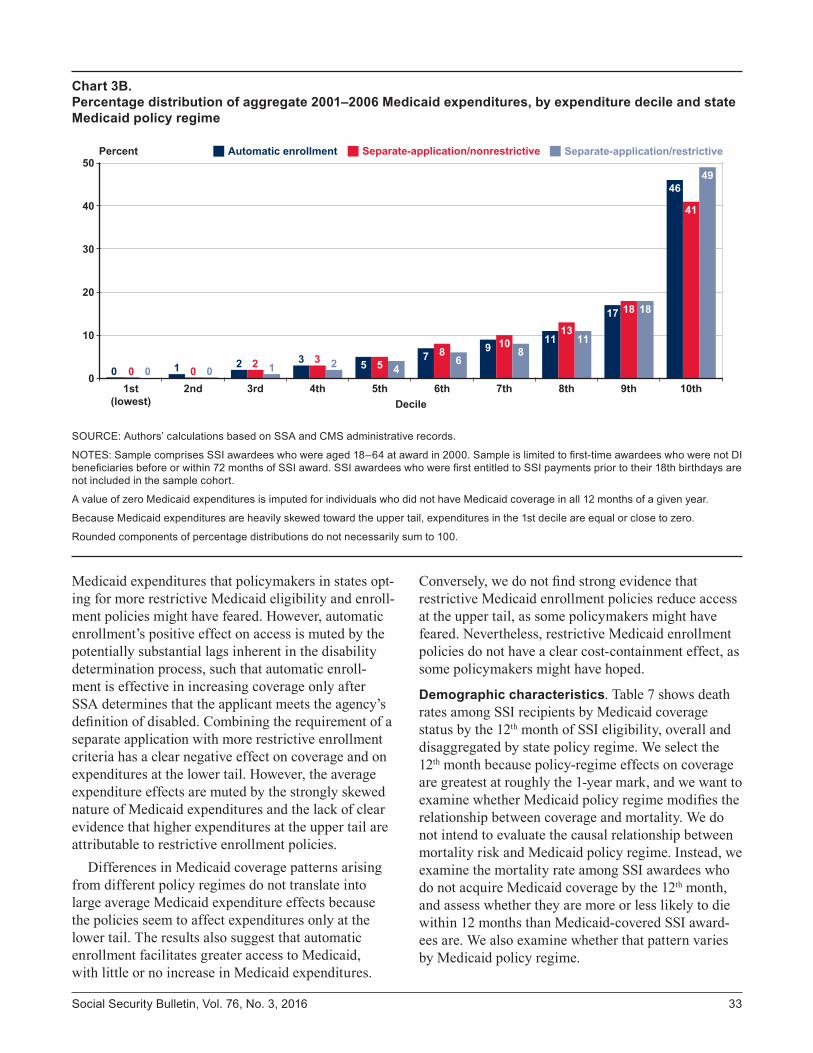
Chart 3A does not show unambiguously negative relative effects of separate-application policy regimes on overall Medicaid expenditures, and one reason why we cannot be more definitive is the variance of outcomes at the upper tail. However, there is another important reason. Riley and Rupp (2014a, 2014b) show that national aggregate expenditures are heav-ily skewed toward the upper tail of the distribution (such that expenditures in the lowest decile are equal
or close to zero). Chart 3B clearly shows the same pattern for each of the three policy regimes. Thus, any effect of more restrictive Medicaid eligibility and enrollment practices at the lower tail may not extend to aggregate expenditures.
Chart 3A does unambiguously show that barriers arising from Medicaid enrollment policies are associ-ated with lower expenditures at the bottom of the distribution. However, that result may not translate into a meaningful reduction in average Medicaid expenditures overall. An important implication of this finding is that enrollment policies requiring a separate application, especially in combination with more restrictive eligibility criteria, may not be effec-tive in containing Medicaid outlays. Conversely, automatic enrollment may have relatively little or no positive overall effect on Medicaid expenditures. This suggests that automatic enrollment and other policies facilitating Medicaid enrollment among SSI awardees may increase access for this target population without generating major increases in Medicaid outlays.
In summary, although automatic enrollment increases Medicaid coverage, this study does not find evidence of the substantial upward pressure on
Chart 3A. Average Medicaid expenditure per awardee in states with separate-application policies as a percentage of average expenditure per awardee in automatic enrollment states: By expenditure decile, 2001–2006
SOURCE: Authors’ calculations based on SSA and CMS administrative records.
NOTES: Sample comprises SSI awardees who were aged 18–64 at award in 2000. Sample is limited to first-time awardees who were not DI beneficiaries before or within 72 months of SSI award. SSI awardees who were first entitled to SSI payments prior to their 18th birthdays are not included in the sample cohort.
A value of zero Medicaid expenditures is imputed for individuals who did not have Medicaid coverage in all 12 months of a given year.
Medicaid expenditures that policymakers in states opt-ing for more restrictive Medicaid eligibility and enroll-ment policies might have feared. However, automatic enrollment’s positive effect on access is muted by the potentially substantial lags inherent in the disability determination process, such that automatic enroll-ment is effective in increasing coverage only after SSA determines that the applicant meets the agency’s definition of disabled. Combining the requirement of a separate application with more restrictive enrollment criteria has a clear negative effect on coverage and on expenditures at the lower tail. However, the average expenditure effects are muted by the strongly skewed nature of Medicaid expenditures and the lack of clear evidence that higher expenditures at the upper tail are attributable to restrictive enrollment policies.
Differences in Medicaid coverage patterns arising from different policy regimes do not translate into large average Medicaid expenditure effects because the policies seem to affect expenditures only at the lower tail. The results also suggest that automatic enrollment facilitates greater access to Medicaid, with little or no increase in Medicaid expenditures.
Conversely, we do not find strong evidence that restrictive Medicaid enrollment policies reduce access at the upper tail, as some policymakers might have feared. Nevertheless, restrictive Medicaid enrollment policies do not have a clear cost-containment effect, as some policymakers might have hoped.
Demographic characteristics. Table 7 shows death rates among SSI recipients by Medicaid coverage status by the 12th month of SSI eligibility, overall and disaggregated by state policy regime. We select the 12th month because policy-regime effects on coverage are greatest at roughly the 1-year mark, and we want to examine whether Medicaid policy regime modifies the relationship between coverage and mortality. We do not intend to evaluate the causal relationship between mortality risk and Medicaid policy regime. Instead, we examine the mortality rate among SSI awardees who do not acquire Medicaid coverage by the 12th month, and assess whether they are more or less likely to die within 12 months than Medicaid-covered SSI award-ees are. We also examine whether that pattern varies by Medicaid policy regime.
Chart 3B. Percentage distribution of aggregate 2001–2006 Medicaid expenditures, by expenditure decile and state Medicaid policy regime
SOURCE: Authors’ calculations based on SSA and CMS administrative records.
NOTES: Sample comprises SSI awardees who were aged 18–64 at award in 2000. Sample is limited to first-time awardees who were not DI beneficiaries before or within 72 months of SSI award. SSI awardees who were first entitled to SSI payments prior to their 18th birthdays are not included in the sample cohort.
A value of zero Medicaid expenditures is imputed for individuals who did not have Medicaid coverage in all 12 months of a given year.
Because Medicaid expenditures are heavily skewed toward the upper tail, expenditures in the 1st decile are equal or close to zero.
Rounded components of percentage distributions do not necessarily sum to 100.
The death rates among SSI awardees are higher for those with Medicaid coverage by the 12th month than they are for those without coverage, regardless of policy regime. This finding is not surprising, given the severity of medical conditions and the risk of death that are associated with eligibility for Medicaid cover-age. Indeed, SSA expedites initial award decisions in certain cases on those grounds. To analyze the effects of Medicaid policy regimes, we perform a difference-in-differences analysis. We observe a lower unadjusted death rate among all SSI awardees by the 12th month in separate-application/restrictive states (8.2 percent) than in automatic enrollment states (9.6 percent). However, the pattern is reversed for noncovered awardees, with rates of 8.0 percent in separate-application/restrictive states and 5.1 percent in automatic enrollment states. This finding is consistent with the hypothesis that delays in obtaining Medicaid coverage (as well as possible denials because of stricter eligibility criteria)
extend the period during which SSI awardees in separate-application/restrictive states are exposed to mortality risk. We find a net differential of 4.7 per-centage points associated with separate-application/restrictive policies versus automatic enrollment. This is an important finding, but it does not imply that lack of Medicaid coverage increases the risk of death.11 Although the relationship in death-rate patterns for separate-application/nonrestrictive states relative to automatic enrollment states is more complex, the net differential is likewise positive (1.8 percentage points). However, that differential is not statistically significant.
Table 8 describes the demographic and diagnostic characteristics of surviving SSI awardees by Medicaid coverage status. We consider awardees “covered” if they have any Medicaid coverage during their first 12 months of SSI eligibility. Overall, the age distri-bution of the noncovered group is similar to the age distribution of the Medicaid-covered group. However,
Table 7.Death rates within 12 months among 2000 SSI awardees aged 18–64, by Medicaid coverage status and state Medicaid policy regime
Medicaid policy regime
CoveredNot covered
Not covered Covered
Number
Death rate (%)
* = statistically significant at the 0.05 level (two-tailed test).
Not covered
Net difference by coverage status
SOURCE: Authors' calculations based on SSA and CMS administrative records.
Net difference by coverage status
Covered
Standard error
. . . = not applicable.
NOTES: Sample comprises SSI awardees who were aged 18–64 at award in 2000. Sample is limited to first-time awardees who were not DI beneficiaries before or within 72 months of SSI award. SSI awardees who were first entitled to SSI payments prior to their 18th birthdays are not included in the sample cohort.
Table 8. Percentage distributions of 2000 SSI awardees aged 18–64 who survived 12 months from award, by Medicaid coverage status during first year, state Medicaid policy regime, and selected characteristics
Characteristic
Overall
Medicaid policy regime
Automatic enrollment
Separate application/
nonrestrictive
Separate application/restrictive
Number
Percentage distributionsAge group
18–3031–45
No
SexWomenMen
SSA primary diagnosisMental impairments a
Nonmental impairmentsNeoplasmsDiseases of the—
Other nonmental impairmentsRetained SSI eligibility for 12 months
Yes
Neoplasms
Standard errorsAge group
18–3031–4546–64
SexWomenMen
SSA primary diagnosisMental impairments a
Nonmental impairments
NOTES: Sample comprises SSI awardees who were aged 18–64 at award in 2000 and who survived to month 12 of award. Sample is limited to first-time awardees who were not DI beneficiaries before or within 72 months of SSI award. SSI awardees who were first entitled to SSI payments prior to their 18th birthdays are not included in the sample cohort.
"Covered" indicates any Medicaid coverage during first 12 months, including the month of award.
Rounded components of percentage distributions do not necessarily sum to 100.0.
Includes intellectual disability.
Diseases of the—
Other nonmental impairmentsRetained SSI eligibility for 12 months
YesNo
SOURCE: Authors' calculations based on SSA and CMS administrative records.
the patterns by policy regime are different. Those who are covered in automatic enrollment states tend to be younger than the noncovered. In the two groups of states that require a separate Medicaid application, the covered tend to be relatively old.
For other characteristics, the distribution patterns of covered versus noncovered are similar among all three policy regimes and are also similar to the patterns observed for the overall national average. Women, people with mental impairments, and people who retained Medicaid eligibility for 12 months are overrepresented among the Medicaid covered com-pared to the noncovered. All of these differences are statistically significant overall. Although some of the differences disaggregated by policy regime are not statistically significant, all differ in the same direction. These findings are not surprising in light of Medicaid coverage patterns observed in previous work (Rupp and Riley 2011, 2012).
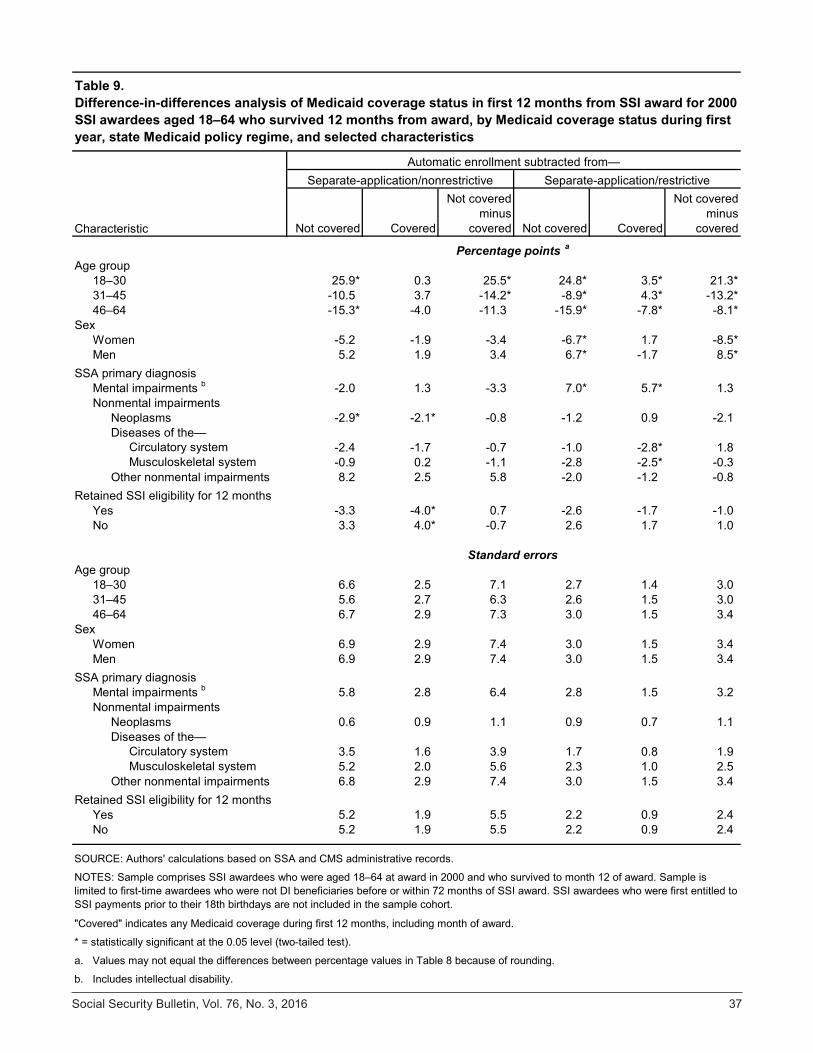
In Table 9, we use difference-in-differences methodology to analyze the relationship between policy regime and characteristics. Here we focus on the key results presented in two columns headed “not covered minus covered.” The pattern of net age differences (that is, the difference-in-differences results) is highly significant and similar for both of the separate-application regimes. The (rounded) differ-ence in differences (25.5 percentage points) reveals a much higher proportion of younger adults associated with no Medicaid coverage (compared with those with Medicaid coverage) in separate-application/nonrestrictive states relative to automatic enrollment states. The corresponding figure is 21.3 percentage points for separate-application/restrictive states rela-tive to automatic enrollment states. The only other statistically significant difference in differences is the comparatively high proportion of SSI recipients with no Medicaid coverage in separate-application/restrictive states who are men. Importantly, we find no significant differential associations between policy regimes according to SSA diagnosis and SSI retention status at month 12.
DiscussionSSI recipients face the double jeopardy of disability and limited financial resources. Recognizing the economic vulnerability of those individuals, Congress enabled states to make SSI awardees categorically eligible for Medicaid if they chose to do so. Yet the adoption of varying Medicaid eligibility rules may create some barriers to Medicaid enrollment in some
states. In this article, we hypothesized that three fac-tors reduce Medicaid enrollment: the requirement of separate SSI and Medicaid applications in some states, the imposition of stricter Medicaid eligibility require-ments in some of those states, and the processing time required for SSI disability applications.
Consistent with our hypotheses, we observed Medicaid participation rates among SSI recipients in separate-application/nonrestrictive states that were lower than those in automatic enrollment states. As expected, we also observed that SSI recipients in separate-application/restrictive states generally had even lower rates of Medicaid participation.
Also consistent with our expectations, we found that the timing of a key event in the processing of SSI awards—the actual receipt of the first SSI payment by successful SSI applicants—was strongly associ-ated with Medicaid enrollment. The time between first month of SSI eligibility and first month of actual payment reflects the time required to adjudicate an SSI claim. When a claim is approved, eligibility for SSI is typically established retroactively. We found that longer periods between initial eligibility and first pay-ment were associated with lower Medicaid coverage rates during those intervening times. Specifically, we found that the first month of SSI payments is associ-ated with a substantial, statistically significant, and abrupt increase in Medicaid enrollment. This finding suggests that, with other things being equal, the earlier the SSI award, the higher the probability of Medicaid enrollment. We found an important interaction effect between the timing of the first SSI payment and auto-matic enrollment. As expected, automatic enrollment generally affects Medicaid coverage positively, but this effect is exclusively attributable to higher Medicaid enrollment rates among those who have successfully completed their SSI eligibility determinations and have been paid their first SSI benefits. This result is not sur-prising, because automatic enrollment is triggered by a positive award decision and, prior to such a favorable decision, an applicant’s SSI eligibility status is uncer-tain; many applicants are denied at least once before a favorable award decision is reached. This finding is especially important because Medicaid coverage can be established in principle as of the date of SSI applica-tion (or even as much as 3 months before then if the date of disability onset precedes the application date). It also means that improving the timeliness of disability determination decisions could improve the effective-ness of automatic enrollment and result in increased Medicaid participation among SSI disability recipients.
Circulatory system 3.5 1.6 3.9 1.7 0.8 1.9Musculoskeletal system 5.2 2.0 5.6 2.3 1.0 2.5
6.8 2.9 7.4 3.0 1.5 3.4
5.2 1.9 5.5 2.2 0.9 2.45.2 1.9 5.5 2.2 0.9 2.4
a.
b.
Women
Table 9. Difference-in-differences analysis of Medicaid coverage status in first 12 months from SSI award for 2000 SSI awardees aged 18–64 who survived 12 months from award, by Medicaid coverage status during first year, state Medicaid policy regime, and selected characteristics
Other nonmental impairmentsRetained SSI eligibility for 12 months
YesNo
MenSSA primary diagnosis
Mental impairments b
Nonmental impairmentsNeoplasms
Standard errors
Other nonmental impairments
18–3031–4546–64
SexWomenMen
SSA primary diagnosisMental impairments b
Nonmental impairmentsNeoplasmsDiseases of the—
Age group
Values may not equal the differences between percentage values in Table 8 because of rounding.
Includes intellectual disability.
* = statistically significant at the 0.05 level (two-tailed test).
Retained SSI eligibility for 12 months YesNo
SOURCE: Authors' calculations based on SSA and CMS administrative records.
NOTES: Sample comprises SSI awardees who were aged 18–64 at award in 2000 and who survived to month 12 of award. Sample is limited to first-time awardees who were not DI beneficiaries before or within 72 months of SSI award. SSI awardees who were first entitled to SSI payments prior to their 18th birthdays are not included in the sample cohort.
"Covered" indicates any Medicaid coverage during first 12 months, including month of award.
Finally, we looked at two sets of possible indirect effects. Our results suggest that automatic enrollment is not associated with a substantial, if any, increase in average Medicaid expenditures. We also found no evidence of alarming associations of Medicaid enrollment policies with any particular demographic characteristics.
Because our analysis covers a period prior to ACA implementation, our results cannot be generalized to post-ACA conditions; yet they do have important implications. First, our study demonstrates that low-cost administrative procedures (such as automatic enrollment) can increase Medicaid enrollment among vulnerable population segments. Second, our study provides an important baseline for future studies of the relationship between the SSI and Medicaid pro-grams. Third, the ACA should bring opportunities to increase the effectiveness of automatic enrollment in states opting for Medicaid expansion. Specifically, Medicaid expansion under the ACA allows the admin-istrative decoupling of the SSI award decision and SSA’s automatic notification of state Medicaid offices. This is because the ACA eliminates the uncertainty about Medicaid eligibility among adults who meet the SSI income test in the Medicaid-expansion states; the ACA income screen is set at 135 percent of the family poverty threshold, while SSI uses a subpoverty-level income screen. Thus, categorical eligibility tied to meeting the SSA definition of disabled is no longer relevant for Medicaid eligibility. The Medicaid provi-sions of ACA potentially enable Medicaid enrollment of a huge segment of the adult population—including many individuals who do not meet the strict disability criteria required for categorical eligibility under SSI program rules—that comprised much of the uninsured prior to ACA implementation (Dorn 2008). Thus, one should expect a substantial increase in Medicaid eligi-bility among denied SSI applicants, and the pre-ACA reason why automatic enrollment was delayed until after the SSI award decision no longer applies.
A simple procedural modification of the automatic enrollment process could vastly improve Medicaid coverage rates among nonelderly SSI applicants. In Medicaid expansion states, SSA could simply notify the Medicaid authority shortly after SSI application; for example, when the field office establishes that the applicant meets the SSI means test. At that point in the current process, SSA automatically transfers the applicants’ records to the state Disability Determina-tion Service (DDS). Under ACA, the agency could simply transmit electronic records of those applicants
simultaneously to the DDS and the state Medicaid office. This change would improve targeting of poten-tial Medicaid enrollees in two ways. First, it would vastly increase the number of applicant records SSA could transfer to the state Medicaid authority, given that automatic enrollment currently omits roughly half of SSI disability applicants because their SSI applica-tions are ultimately denied. Second, it would greatly accelerate automatic enrollment for allowances as well, because even though roughly half of applicants are ultimately awarded SSI, only about one-third are awarded in the initial DDS decision. Under the pro-posed modification, SSA would have no reason to wait even for the initial DDS decision before notifying the Medicaid authority in the expansion states. Because SSI disability applicants (including those who are denied) are among the most vulnerable Americans, this simple process modification could increase Med-icaid enrollment, improve quality of care, and perhaps even reduce Medicaid expenditures for reasons similar to those discussed (in the context of churning) by Swartz and others (2015).
NotesAcknowledgments: Paul O’Leary provided invaluable assis-tance by creating extract files for this analysis from SSA’s Ticket Research File. We are indebted to David Baugh for providing expert advice on Medicaid rules, regulations, and state policies and procedures. Robert Simpson provided helpful information on the SSI claim and Medicaid auto-matic enrollment processes and other SSA interactions with Medicaid offices in Michigan. We appreciate the expert assistance of Francoise Becker in the creation and analysis of the data files. We also thank Nancy Early, Thuy Ho, and Charles Herboldsheimer for generating and processing data files. Numerous colleagues at SSA and CMS and at various conferences and presentations have been helpful with their review and comments. We are especially thankful for thoughtful suggestions on earlier versions to David Baugh, Richard Burkhauser, Paul Davies, Irena Dushi, Jeff Hem-meter, and Howard Iams. Eric French provided detailed and thoughtful discussant comments at the 2011 Annual Meetings of the Allied Social Sciences Association. Some results have been previously presented at a September 5, 2014 webinar organized by Mathematica Policy Research under the SSA-supported Disability Research Consortium. David Stapleton and others provided helpful advice in plan-ning that presentation.
1 These are sometimes called the “1634 states” because section 1634 of the Social Security Act authorizes states and SSA to enter into automatic-enrollment agreements.
2 These are sometimes called the “criteria states” because they use the SSI eligibility criteria for Medicaid.
3 These are sometimes called the “209b states” because section 209(b) of the 1972 Amendments to the Social Secu-rity Act enabled states to establish their own Medicaid eligi-bility criteria. The 209b states use at least one eligibility criterion that is more restrictive than SSI eligibility rules.
4 Awardees affected by such lags receive a lump-sum retroactive payment (in some cases, in several installments).
5 Burns and others (2012) note another potential com-plication. In some cases, the first episode of receiving Medicaid-covered services precedes rather than follows Medicaid application (in separate-application states) or the final determination of categorical Medicaid eligibility (in automatic enrollment states). This may occur upon an emergency room admission. In such a case, the hospital administrator initiates Medicaid application and, in some cases, SSI application as well. These instances may reduce the estimated effect of policy regime.
6 As noted earlier, those who are eventually approved will receive a lump-sum retroactive SSI payment (or several payments in installments) for the period between the first month of payment eligibility and the first month of payment receipt.
7 Of course, SSI applicants may apply separately for Medicaid in automatic enrollment states. Whether applicant self-referral is affected by the information SSA provides on automatic enrollment is not known. Any effect might be negative if applicants, not realizing that SSA’s notification of applicant eligibility to the state Medicaid office will not occur until after a long determination process, believe they do not have to (or cannot) do anything to affect Medicaid enrollment. It is also possible that special procedures that address the predicament of severely disabled SSI applicants are less likely to exist in automatic enrollment states than they are in separate-application states, where SSI applicants must apply for Medicaid on their own initiative. Unfortu-nately, there are no process-study data to provide direct evidence on the factors affecting SSI applicants whose final award status is yet unknown.
8 For example, in a recipient’s 12th month of eligibility, the independent variable takes the value 1 if the first pay-ment occurred after a lag of 11 or fewer months and takes the value 0 if it occurred after a lag of 12 or more months. Thus, discontinuity is represented by a hypothesized jump in the size of the odds ratio from right to left.
9 The Medicaid coverage results for 3 months before eligibility are also consistent with a reverse pattern of Medicaid and SSI application that may occur frequently; for example, the Medicaid-covered emergency room (ER) admission of a potentially SSI-eligible nonapplicant (see note 5). In such a case, the ER admission might result in a successful SSI application for two reasons. First, the provider has a financial interest in encouraging and facilitating SSI application. Second, the health shock resulting in ER admission may reveal a serious, perhaps
life-threatening, condition that may indicate categorical eligibility for SSI. In any event, the results are consistent with our main hypothesis.
10 For example, the point estimates for month 3 are 0.17 and 0.46 for “paid” and “unpaid,” respectively (versus 1, representing the counterfactual that would suggest no difference compared to automatic enrollment). Assume that the effect of restrictive SSI eligibility policies alone is 0.46 for both groups. A much smaller point estimate (0.17) represents the combined effect of the absence of automatic enrollment and the presence of restrictive SSI eligibility, which suggests a reduction in the relative odds that would be attributable to the absence of automatic enrollment alone. In other words, the drop in odds ratios from 1 (the counter-factual) to 0.17 can be seen as having two components, the first being represented by the drop from 1 to 0.46 and the second being represented by the further drop to 0.17.
11 The additional analysis required to make such a deter-mination is beyond the scope of this article.
ReferencesBaicker, Katherine, and Amy Finkelstein. 2011. “The
Effects of Medicaid Coverage—Learning from the Oregon Experiment.” The New England Journal of Medi-cine 365(8): 683–685.
Baicker, Katherine, Amy Finkelstein, Jae Song, and Sarah Taubman. 2013. “The Impact of Medicaid on Labor Force Activity and Program Participation: Evidence from the Oregon Health Insurance Experiment.” NBER Work-ing Paper No. 19547. Cambridge, MA: National Bureau of Economic Research.
Burns, Marguerite E., Brett J. O’Hara, Haiden A. Huskamp, and Stephen B. Soumerai. 2012. “Uninsurance and its Correlates among Poor Adults with Disabilities.” Journal of Health Care for the Poor and Underserved 23(4): 1630–1646.
[CMS] Centers for Medicare and Medicaid Services. 2016. “Chronic Conditions Data Warehouse.” https://www .ccwdata.org/web/guest/home.
Dorn, Stan. 2008. Millions of Low-Income Americans Can’t Get Medicaid: What Can Be Done? AARP Public Policy Institute Research Report No. 2008-13.
Dorn, Stan, John Holahan, Caitlin Carroll, and Megan McGrath. 2013. Medicaid Expansion Under the ACA: How States Analyze the Fiscal and Economic Trade-Offs. Washington, DC: Urban Institute.
Finkelstein, Amy, Sarah Taubman, Bill Wright, Mira Bernstein, Jonathan Gruber, Joseph P. Newhouse, Heidi Allen, Katherine Baicker, and the Oregon Health Study Group. 2012. “The Oregon Health Insurance Experi-ment: Evidence From the First Year.” Quarterly Journal of Economics 127(3): 1057–1106.
Flowers, Lynda. 2010. “Health Reform Provides New Fed-eral Money to Help States Expand Medicaid.” Fact Sheet 185. Washington, DC: AARP Public Policy Institute.
Knoll, Melissa A. Z. 2010. “The Role of Behavioral Eco-nomics and Behavioral Decision Making in Americans’ Retirement Savings Decisions.” Social Security Bulletin 70(4): 1–23.
Musumeci, MaryBeth. 2012. “Focus on Health Reform: A Guide to the Supreme Court’s Affordable Care Act Decision.” Publication No. 8332. Menlo Park, CA: The Henry J. Kaiser Family Foundation.
Riley, Gerald F., and Kalman Rupp. 2014a. “Cumulative Expenditures Under the DI, SSI, Medicare, and Med-icaid Programs for a Cohort of Disabled Working-Age Adults.” Health Services Research 50(2): 514–536.
———. 2014b. “Expenditure Patterns Under the Four Major Public Cash Benefit and Health Insurance Pro-grams for Working-Age Adults With Disabilities.” Journal of Disability Policy Studies 25(2): 71–80.
Rudowitz, Robin, Laura Snyder, Vernon K. Smith, Kath-leen Gifford, and Eileen Ellis. 2014. “Implementing the ACA: Medicaid Spending & Enrollment Growth for FY 2014 and FY 2015.” Washington, DC: Kaiser Com-mission on Medicaid and the Uninsured.
Rupp, Kalman, Paul Davies, and Alexander Strand. 2008. “Disability Benefit Coverage and Program Interactions in the Working-Age Population.” Social Security Bulletin 68(1): 1–30.
Rupp, Kalman, and Gerald F. Riley. 2011. “Longitudinal Patterns of Participation in the Social Security Disability Insurance and Supplemental Security Income Programs for People with Disabilities.” Social Security Bulletin 71(2): 25–51.
———. 2012. “Longitudinal Patterns of Medicaid and Medicare Coverage Among Disability Cash Benefit Awardees.” Social Security Bulletin 72(3): 19–35.
Sheedy, Kaitlin, and Katharine Witgert. 2013. “Tools and Policy Consideration for State Medicaid Expansion Anal-yses.” Issue Brief. Princeton, NJ: State Health Reform Assistance Network.
Social Security Administration. 2014. “Program Operations Manual System (POMS) Section SI 01715.010. Medicaid and the Supplemental Security Income (SSI) Program.” https://secure.ssa.gov/apps10/poms.nsf/lnx/0501715010.
Sommers, Benjamin D., Katherine Baicker, and Arnold M. Epstein. 2012. “Mortality and Access to Care among Adults after State Medicaid Expansions.” The New England Journal of Medicine 367(11): 1025–1034.
SSA. See Social Security Administration.Swartz, Katherine, Pamela Farley Short, Deborah Roempke
Graefe, and Namrata Uberoi. 2015. “Reducing Medicaid Churning: Extending Eligibility for Twelve Months or To End of Calendar Year Is Most Effective.” Health Affairs 34(7): 1180–1187.
Taubman, Sarah L., Heidi L. Allen, Bill J. Wright, Kath-erine Baicker, and Amy N. Finkelstein. 2014. “Medic-aid Increases Emergency-Department Use: Evidence from Oregon’s Health Insurance Experiment.” Science 343(6168): 263–268.
Ungaro, Ryan, and Alex D. Federman. 2009. “Restrictive-ness of Eligibility Determination and Medicaid Enroll-ment by Low-Income Seniors.” Journal of Aging & Social Policy 21(4): 338–351.
Weathers II, Robert R., and Michelle Stegman. 2012. “The Effect of Expanding Access to Health Insurance on the Health and Mortality of Social Security Disability Insur-ance Beneficiaries.” Journal of Health Economics 31(6): 863–875.