Page 1
T
I
I
..
-9
no
I
.I|."._‘.l".
.|‘.‘Q‘O...“o.on‘
‘o-I".
I'u-b
-O_a
no
—-.N.
..
,'.
-v.0
-...'o4.-.
uII
at:
..
.O
..
n,
.I
,,
..‘
'.
.‘
°P¢gjfraxva1wmv
3N2“)
''.’.'-.’~
'"3.29.:on}H
'~.I:'.".'.';°-''r."I
'..U
.'
-uoo,
O
.
‘.
‘i
.I
'"
'0
d'
-,
--
.o
.e.':§‘‘(l".’1!.""“.1..."‘.KO".‘.‘.\.I'II
’0‘}
1'.".‘...r'0.|.'0.\|0..'.'.'.','.‘.,.|gv'
..".'.'
.IO...|II-|‘\0|-||Q-o.
.."_.'....|A'."“..".
‘..
I.
H‘
~'co-fiw-~”'f°l~m"9‘ .— I-
,1
~----—....
‘
Q
a
-
GONZALO RCA
1969
Thesis for the Degree of M. S. .
MICHIGAN STATE UNIVERSITY
o
' I’.|‘.’.'
,
o
c
v
I
-‘tfi‘l
v0...
MOISTURE ABSORPTION
BY FREEZE - DRIED MEAT CUBES
‘.
up“ 50“;
0"
.
.
a
.
.
.
-
.
II; I
o
c...
a
~0~ub~.‘- a...
.
u
-
.
, -90o-o-
'"-O
.5.
0'" 'IOIOV“-.. *9“..”.'—“”
b
..
.n.9-
1‘9.
‘Atc.
'0
0-00v00.uo
(Q4Q‘n‘|0|l
4.on§o0‘§
.u.
IQ!
\-
v
..
3-,
c<n.
,.
'l...-.OO..
Page 2
LIBRARY *5
Michigan 53%“:
UnichS‘itY {an
Page 3
ABSTRACT
MOISTURE ABSORPTION BY FREEZE - DRIED MEAT CUBES
Freeze-dried beef cubes were rehydrated isothermally. A
mathematical model recently employed by Young (1968) was
used in conjunction with a non-linear estimator technique
to compute the diffusion coefficient as a function of
moisture content. The three-dimensional diffusion equa-
tion was solved numerically by an alternating direction
explicit procedure.
Approved ,
hajogrofessb /E_5: 57.
Department Chairman
Page 4
MOISTURE ADSORPTION BY FREEZE - DRIED MEAT CUBES
Gonzalo Roa
A THESIS
Submitted to
Michigan State University
in partial fulfillment of the requirements
for the degree of
MASTER.OF SCIENCE
Department of Agricultural Engineering
1969
Page 6
ACKNOWLEDGMENTS
Thanks to the members of the Drying Research Group of the Agricultural
Engineering Department, especially to Dr. Fred W. Bakker-Arkema,
David R. Thompson and John R. Rosenau.
The author also wants to express his acknowledgments to the Rookefeller
Foundation who sponsored his program.
Special recognition to Dr. Carl W. Hall, Chairman of the Agricultural
Engineering Department for his collaboration to the author's program
and his contributions to the development of the new Agricultural
Engineering Programs in Latin America.
This thesis is dedicated to my parents, Pedro and Zoila.
ii
Page 7
NOTE
This thesis has been written in the form of a technical paper. It
has been presented in its present form (minus the Appendix) as
ASAE Paper No. 69-893 at the 1969 Winter Meeting of the American
Society of Agricultural Engineers, Chicago, Illinois, December
9-12, 1969 by Gonzalo Roa.
F. W. BakkeroArkema
Major Professor
iii
Page 8
TABLE OF CONTENTS
ACKNOWLEDGMENTS.
NOTE . . . . . . . . . . . . . . . . .
LIST OF TABLES . . . . . . . . . . . . . . . . . . . .
LIST OF FIGURES.
LIST OF SYMBOLS. . . . . . . . . . . .
Chapter
I. INTRODUCTION.
II. EXPERIMENTAL PROCEDURES .
A. Preparation of Samples . . . . . .
B. Conditioning of Samples.
III. ANALYSIS. . . . . . . . . . . . . . . . . . .
A. Mass Transfer Equation . . . . . . . . . .
B. NUmerical Solution . . . . . . .
C. Estimation of Parameters .
IV. RESULTS . . . . . . . . . . . . . . . . . . . . .
1. Experimental . . . . . . . . . . . . . . . . .
A. Moisture Adsorption Curves and Temperature
History of the Cube . . . . . . . . . . .
B. External Resistance. . . . . . . . . . . .
C. Isotherm . . . . . . . . . . . . . . . . .
D. Input Parameters . . . .
2. Numerical. . . . . . . . . . . . . . . . . . .
A. External Resistance. . . . . . . . . .
B. Diffusion Coefficients . . . . . . . . . .
V. SUMMARY. . . . . . . . . . . . . . . . . . . . . .
BIBLIOGRAPHY . . . . . . . . . . . . . . . . .
APPENDIX Digital Computer Program
iv
page
ii
iii
vi
vii
UN
GUI-I5
41‘
10
10
ll
12
12
13
l4
l8
Page 9
Table
LIST OF TABLES
Numerical Results with Optimized Variable Diffusion Coefficient
ft"2= 2 - __
Deff 10.961 (M) 0.16621 0!) + 0.002011 hr ..
Numerical Results with Optimized Constant Diffusion Coefficient
ft?1.9535 hr .
Page 10
LIST OF FIGURES
Apparatus for equilibration of freeze-dried beef cubes.
Experimentally determined moisture adsorption curves
for freeze-dried beef cubes.
Experimentally determined temperature curves during
the adsorption process indicated in Figure 2.
Equilibrium moisture content versus relative humidity
(Isotherm) for freeze-dried beef cubes.
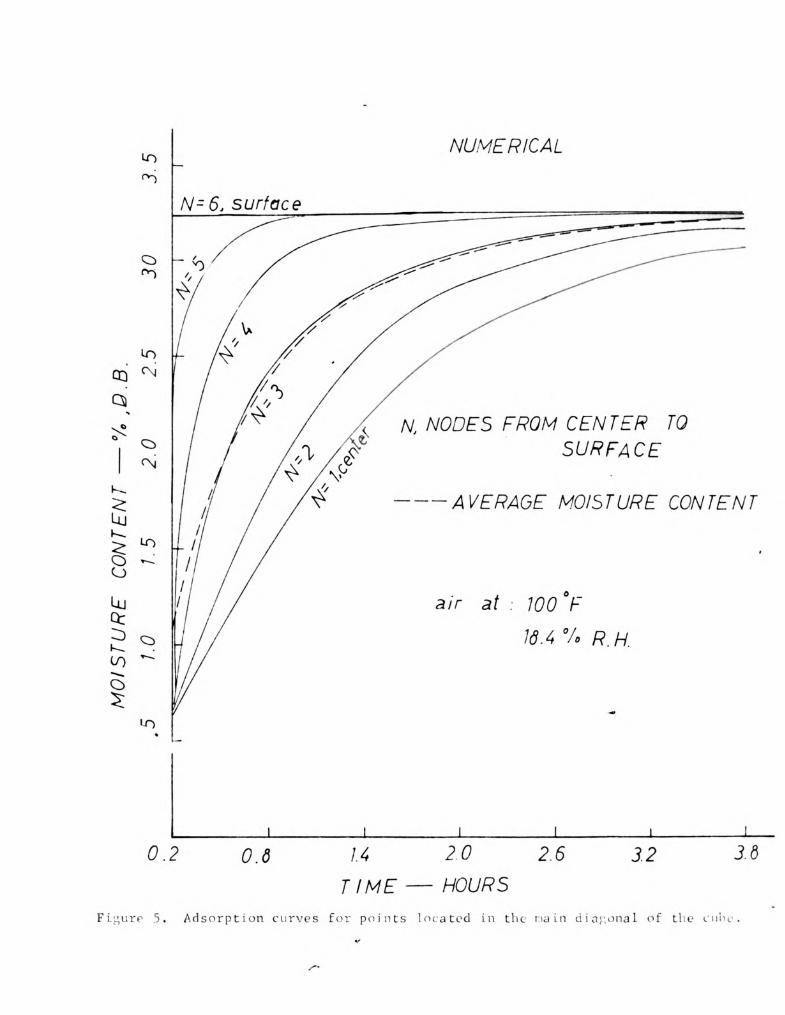
Adsorption curves for points located in the main dia-
gonal of the cube.
Moisture distribution within the cube at different
times.
Optimized polynomial for the diffusion coefficient as
function of moisture content.
Comparison between the numerical solution (with optimized
diffusion coefficient polynomial) and experimental
points.
vi
Page 11
3.11. .
x,y,z
At
AX:AY9A3
LIST OF SYMBOLS
diffusion polynomial coefficients.
isotherm polynomial coefficients.
Biot number
1b, m
vapor water concentration,'EE3
ft2diffusion coefficient, h;—
lbm
density, 2:3
porosity, decimal
grid spacing, ft
. . ftconvective mass transfer coeffic1ent, R;
space sub-indices
Colburn correlation factor
characteristic length of the cube, ft
_. lbm
m01sture content, dry b8618, If:
Molecular weight of water “ 18
lb
water vzpor partial pressure, IE5
lb
water vapor partial pressure at saturation, Egg
relative humidity, decimal
lpg'ft. Q ~ L '
universal gas constant, 1,545 lbmfmole -'R
time, hours
temperature, ”R
space coordinates
time step, hr
grid spacing, ft‘
Page 12
I . INTRODUCTION
It is well'known that dehydrated food products exhibit an optimum
moisture content for storage (Rockland, 1969). At moisture levels below
the optimum, autoxidstion type deterioration reactions decrease the
product stability. At higher levels, microbiological spoilage may occur.
During a study of the hygroscopic and textural behavior of freeze-dried
beef cubes dehydrated to 0.5 percent moisture content (Heldman and
Bakker-Arkema, 1969) it became necessary to find out how long the cubes
could be subjected to a certain temperature-humidity environment before they
had reached this optimum (or any other) moisture level. Although much
research has been conducted on the desorption rates of moisture by
foodstuffs (van Arsdel, 1963) relatively little has been published on the
rates of adsorption of water by foods. No information at all could be
found concerning the diffusion coefficients for water adsorption by freeze-
dried beef at very low moisture contents.
A number of new simulation models have recently been proposed for
moisture sorption and desorption in capillary porous systems (King, 1968;
Young, 1968; Harmathy, 1969). For each one of the models, it is assumed
that the mass transfer within the medium takes place in the gaseous phase.
Young's model was chosen in this study for analyzing the rate of water
adsorption within freeze-dried meat cubes, mainly because it does not
require knowledge of as many basic product properties as the King and
Harmathy simulation models.
' This study was partially supported by the U. S. Army Laboratories,
Natick, Massachusetts. Contract No. DAAGl7-67-C-Ol65.
Page 13
Young's model for simultaneous heat and mass transfer in porous,
hygroscopic solids (Young, 1968) is a modification of a model first pro-
posed by Henry (1939) for moisture flow in a textile package. Henry's
analytical solution of the model assumed a linear dependence between the
equilibrium moisture content and the vapor concentration and temperature of
the environment. Also, the moisture diffusion coefficient and the thermal
diffusivity were assumed to be constant during the mass transfer process.
The agreement between Henry's experimental and theoretical data was only
fair probably because of the simplifying assumptions which were necessary
to make an analytical solution possible.
Young's numerical solution of Henry's model did not require that
the moisture diffusion or theimal diffusivity coefficients remain constant.
Unfortunately, however, Young's model cannot be properly evaluated since
no experimental data was presented by the author. Also, Young's solution
is one-dimensional and was solved with forward and central difference
methods rather than with the more stable and faster alternate
direction type procedures (Allada and Quon, 1966).
II. EXPERIMENTAL PROCEDURES
A. Preparation of Samples
Commercial low fat beef was cooked at an oven temperature of 325° F
until the center of the roast attained a temperature of 160° F. The
cooked roast was wrapped in aluminum foil and frozen to -20° F within
48 hours.
Page 14
After freezing the beef roast was cut into approximately 2% inch
cubes and the samples were dried to about one percent moisture content
in a freeze-drier with "plate" temperature of 145° F and an absolute
pressure of 0.5 mm of Hg.
Conditioning of Samples
The freeze-dried beef cubes were conditioned at 100° F to differ-
ent moisture contents at four relative humidities (18.4, 40.0, 60.0,
and 80.0 percent). Nine cubes were arranged in a wire tray for each
conditioning process. Orientation of the meat fibers was randomized.
The tray was placed in an insulated chamber. Conditioned air was blown
through the chamber by a conditioning unit capable of controlling the
air dry-bulb temperature to within t 3/4 °F and the relative humidity
to within i 1/2 °F. The air velocity was controlled by a variable
speed fan; the stream was directed perpendicularly to the plane of
the trays. A laminar-flow element was used to measure the free stream
velocity (between 6 and 21 ft/sec.). The air and cube temperatures
were measured by 20 gage copper-constantan thermocouples. No tempera»
ture gradients within the cubes could be measured during any of the
experiments. An electronic hygrometer was used for measuring the
relative humidity of the air. A schematic of the experimental set-up
is given in Figure l.
The moisture adsorption history was determined by weighing the wire
trays at ten minute intervals. This procedure was continued until a
constant weight was achieved.. The initial and final moisture contents
were determined by measuring the weight of the final products after they
had been placed in a forced convection air oven at 170 'F for eighteen
Page 16
hours.
An additional experiment was conducted to investigate the differ-
ences in the convective mass transfer coefficient resulting from differ-
ent air flow patterns on the three different cube faces. All but one
of the faces of each cube were made impermeable by wrapping the
cube with aluminum foil. The cubes were positioned in three trays,
each tray containing nine cubes. The position of the permeable
face with respect to the air flow direction was different for each
tray; the top faces were permeable for tray number one, the side
faces for tray number two, and the bottom faces for the third tray.
III. ANALYSIS
Mass Transfer Equation
Henry's (1939) isothermal vapor diffusion equation in fibrous
material is of the following form (Young, 1968):
.9. 92.5.. 19.5.. fig :99. _ 9!
f [ ax (Deff ax ay (Deff by) 32 ( eff ea) 3 f at + (1 f) ds at
(1)
The left-hand side of the equation represents the moisture flow rate
to the differential volume; the right—hand side represents the moisture
sink composed of porous spaces and solid fibers.
The following assumptions were made in deriving the equation:
1) the material is isotropic;
2) mass transfer in meat cubes is isothermal at low relative
humidities (See Figure 2);
Page 17
3) porosity is a35umed not to change during the process. (This
is approximately correct for freeze-dried products.); and
4) tNere is instant local equilibrium between the condensed water
and the vapor phase.
The last assumption permits the use of the experimental isotherm
curve (Figure 3) for expressing the local moisture content as a func-
tion of the surrounding water vapor concentration. Five data points
were fitted to a polynomial of the form.
M = a 03 + B 02 + B c + B1 2 3 4
Equation (1) can then be rewritten as:
e. .2229. 92:2. 529,... -99-5x (Deff 5x + By (Deff ay) + 52 (Deff 62) (K1 c + K2 c + K3) 5: (2)
Wherf‘ (3.0) (B1) (l—f) (d5)
Klf- f
(2.0) (32) (l-f) (d8)
K' =2 f
K. = f + (B3) (1-f) :1S
3 f
Since the convective external resistance to mass transfer is
negligible (see next section) fixed concentrations on the cube faces
were used as the boundary conditions. It was assumed that the
initial moisture concentration within the cubes was uniform.
Numerical Solution
Equation (2) is a non-linear partial differential equation for which
no analytical solution is available. A numerical method developed by
Allada and Quon (1966) was selected to solve the problem. The tech-
nique called an alternating direction explicit procedure (ADEP) is
stable and accurate.
Page 18
Equation (2) was solved for each grid point assuming
1) D is a constant, and
eff
2) Deff is a function of the local moisture content.
In the second case, assuming equal grid spacing (5x = Ay = A2 = h),
the computational formulas are:
(n) 3 Y1 1 (n) (n) (n) (n-l)
Cum Y1 + 1 [175 (Ci-1.1.k + Ci.j-1,k + Ci.j.k-1 + Ci+1.j.k
(n-l) (n- 1) - (n- 1)
Ci.j+1.k +CC.j.k+1) + (i 3) Ci k] (3)
and
Y .C(n+1) g. 2 1__ (n+1) (n+1) (n+1) (n)
1,3,k YZ—IIT [he + c + c + c(C1+1.j.k 1.3+1.k i.j.k+1 1-1.j.k +
(n) c (n) )+ C__ _ 3) c (n) J
. . + . .
laJ'lak 1:3:k11::jk (4)
where:
Y = l1 (n- 1) (n 1) 3
K1 Ci,j,k +K2 Ci,j,k +K3 +—h2
Y = 12 (n) (n) 3
(K1 Ci,j,k K2 C1 ,,jk +K3 +h?
and
(3) (B) (1-f) (as)K = ‘
1 (f) (At) (Dff )
1.jk
(2) (B2) (l-f) (d )K a: S
2 (f) (At) (Deff >
i,j.k
f + (B3 ) (l-f) (d )K - s
3 ' (f) (At) (0ff )
i.j.k
Page 19
.
.. -, _,\
' l
I ' ‘,
.f
l “u
- - I? 1
.. .... ._.
.
. f.
...... - _.__ -'-
Page 20
D (M )9+A (M )+AA . . . .e£fi,j,k 1 1,3,k 2 1,3,k 3
(n-l) = (n-l) 3 +. (n-l) 2 + (n-l)_ +
Mi,j,k Bl (€1,333 B2 “1,3319 B3 (€1,313 B4
(n) = (n) 3 + (n) 2 + (n) +
“1,3,1. Bl “11.1.19 B2 “1.1.19 B3 “1.3.19 B4 (5)
Sub-indices refer to the three coordinates and super-indices to
two different time levels. At time level 5; (even time step) the
computation starts in one corner and continues through all the
grid points until the corner diagonally opposite the starting
point has been reached (Equation 3). Equation (4) applies for time
step ggj;l (odd time step). The starting point is the final
point of the previous time step.
The truncation errors are minimized in the ADEP Procedure.
The accuracy of the complete program was determined on the simple
case:
5x2 eye 322 at
with boundary conditions
C = 0 at x = y 3 x = 0
and initial condition:
C = 1.0 at t = 0
where:
Ax = Ay = A2 = h = .16 ft
At = .005 hr
_P-AL = 0.2
(AX)2
Page 21
Results were compared with tabulated values from Schneider (1955).
Differences were noted only in the third decimal point. Only
one-eighth of the cube was considered in order to save computer time.
Therefore, three insulated faces had to be considered as boundary
conditions. A minimum number of (6 x 6 x 6) grid points was required
to obtain results with a maximum error of less than one percent.
The computational speed of the model was 3,300 node evaluations
per second on a CDC 3600 computer and 5,300 on a CDC 6500.
Estimation of Parameters
Solution of the system will reproduce the experimental data, if
the assumptions in deriving the partial differential equation are
justified and if the correct values of the parameters are chosen.
For evaluating hD and De a Non-Linear Least Squares (GAUSHAUS)ff
estimator model which uses iterative linear approximations was
adopted (Meeter, 1965). The main computer program reads in the
experimental data and initializes the parameters. The Allada-Quon
model was written as a subroutine and generated the function
values (moisture content at each elapsed time.) GAUSHAUS was
then used to minimize the square differences between the computed
and experimental values.
It was necessary to fit the experimental data with polynomials of
sixth degree I .because of the time step requirements of the numerical
method, special attention was given to the initial parameter estimates.
In face, the linear approximation technique did not give the true
results of bad guesses are made.
Page 22
For the case where Deff was considered constant, a set of several
values of different orders of magnitude was considered as the initial
estimates. In this way, local minima of the sums of squares of the
differences between the numerical solution and the experimental data
were discarded. The global minima was selected as the one which
presented the minimum sum of squares. This constant value was used
as a guide to estimate the coefficients of the diffusion polynomial.
Similar procedures of elimination were used in this case.
IV. RESULTS
1. Experimental
Mgistpre Adsorption Curvgs and Temperature History of_the Cube
Figures (2) and (3) present the average moisture content and
the product temperature of meat cubes adsorbing moisture at four
different relative humidities at an air temperature of 100° F.
Moisture equilibrium is reached rapidly compared to other biological
products, due to the high void fraction of the freeze-dried beef.
Equilibrium times are larger for high relative humidities because
the amount of water transferred is larger.
The increase in temperature due to the heat of condensation is
noticeable only for the 40, 60 and 80 percent samples. Adsorption
at 18.4 percent relative humidity can be considered as an isothermal
process.
Page 23
B.
- 10 -
External Resistance
The experiments with impermeable faces simulate:
l. Ewo dimensional stagnation flow on the bottom face (when
this face is the only permeable one).
2. air flow over a plate for the lateral faces; and
3. turbulent flow on the top face.
In general, for each of these air patterns, different convective
mass transfer coefficients define different external resistances.
The experimental results showed that the rates of moisture adsorp-
tion were approximately the same for all three cases. Equal or
negligible convective resistances are deduced for each case.
Cubes subjected to different airflows, presented slightly
different rates of adsorption, but the differences were attributed
to heterogeneity of the product and not to differences in external
resistances.
Isotherm
Equilibrium moisture contents at different relative humidities
were fitted to a third degree polynomial:
= 3+ 2+ +M BlC BZC BBC B4
~1.9211 x 10’2an ll
3.2166 x 10‘1on H
-4.0934 x 10'3w
ll
4.5648 x 10‘5bi fl
Page 24
- 11 -
A linear least-square computer program was used for the fit. The
sum of squared differences was 2.38 x 10⁻⁶. The isotherm is shown
in Figure 4.
Ngoddy (1969) in his study of a general theory of moisture adsorp-
tion in biological products presented data for isotherms at the same
temperature for freeze-dried meat powder. Good agreement exists
between the two isotherms although Ngoddy's moisture values are
slightly lower. The differences are the result of different structures
of the meat.
Input Parameters
The product constants assigned to the computational formulas (3)
and (4) were obtained from a laboratory analysis:
Fiber density and porosity were determined by decomposing randomly
selected samples of lean beef. The known specific gravities of the
components (water, protein, fat and ash) were assigned to the partial
weights in order to obtain the partial volumes. Results of this
analysis were:
porosity (f) = 0.63
’ = .29.denSLty (d8) 84.0 ft3
Bulk density of the product was also obtained by direct weighing of
known volumes of meat product. The resulting bulk density was
lb lb
EZa.‘ This value correspondS to a fiber density Of 67°12 EEG
(assuming a porosity of 0.63). The average value taken for the
25.0
computations was d8 = 75.56 lb/fta.
Page 26
- 12 -
The vapor concentrations of the boundaries were calculated from
the known relative humidity and temperature of the air. It was
assumed that water vapor behaves as an ideal gas. Thus:
(pw) (MW)
C ' (Roi'kT>
.but, pw = (pw S) (R.H.)
(p ) (M )
“’8 w (R.H.)
so, C =
(80) (To)
Replacing values
c = 2.8448 x 10‘3 (R.H.)
Initial vapor concentrations were calculated from the known
initial moisture contents and the isotherm polynomial.
2. Numerical
External Resistance
The Allada-Quon model for moisture adsorption was initially
written to take into account different convective resistances over
each face. The equivalent convective mass transfer coefficients (hD)
along with the average diffusion coefficient were estimated by the
GAUSHAUS subroutine. Two different sources were used in making
the first estimate of hD:
1. by using the Reynolds analogh and the Colburn correlation factor
(jD) (Rohsenaw and Choi, 1961); and
2. from tabulated values from (Barker, 1965);
Page 27
Sets of different orders of magnitude (10.2 - 10—6) were given to
the first estimate of the diffusion coefficient. The result gave
a Biot number
hD L
D
eff
B. =i
> 400
where L is the characteristic length of the cube (L = .0416 ft).
Thus, the external resistance could be considered negligible and
a fixed concentration at the walls was used as a boundary condition.
Diffusion Coefficients
The following results refer to the adsorption process carried out
at 100° F and 18.4 percent relative humidity. The diffusion coeffi-
cient polynomial (5) was optimized by the non—linear GAUSHAUS esti-
mator to obtain the minimum sum of squares.
The final optimized polynomial was:
Deff = 10.961 (M)2 - 0.16621 On)-+ 0.002011
The results of the simulation are shown in Figures 5, 6, 7
and 8. Numerical values are also shown in Table 1. Figure 5 shows
the simulated adsorption moisture content for points located on the
main diagonal.
Figure 6 illustrates the distribution of the moisture for
each of the points on the main diagonal at different elapsed times.
Figure 7 presents the optimized diffusion coefficient. Fish (1958)
published similar curves for potatoes. King (1968) explains that
the increasing value of the coefficient is a logical behavior since
Page 28
- 14 -
in his adsorption model, it is proportional to the inverse of the
isotherm slope (Figure 4). At very low moisture contents the isOv
thermal slope decreases when the moisture content increases; this
causes the diffusion coefficient to increase.
In Figure 8 and Table l. the experimental points and the
simulated adsorption curve are compared. The sum of squares is
0.1371 and the confidence limits are shown in the table.
value was optimized using the same method.ff
, . -3 ft2The numerical value was 1.95 x 10 h;—
A constant De
; the sum of squares
was 0.138. The results are presented in Table 2.
The constant De value gives approximately the same results as
ff
these obtained by the polynomia1---compare the differences between
computed and experimental values in Tables 1 and 2. In general,
for larger ranges of relative humidity, a constant value for D is not
expected to fit the data as well as a polynomial. During the
optimization process, five interactions and twenty-seven evaluations
of the numerical programs were necessary. The execution time on the
computer (CDC 3600) was 5% minutes.
V. SUMMARY
A stable, fast and accurate nwmerical technique was employed for
solving a non-linear diffusion equation which describes the moisture
adsorption in a cube of freeze-dried beef. A non-linear leastosquare
estimator of parameters was used to determine the mass convective and
diffusion coefficients. The diffusion coefficient was assumed to be a
quadratic function of the moisture content. The method of solution is
Page 30
- 15 -
general. The use of the multi-dimensional method makes it useful in
solution of problems of irregular shapes.
The method can be employed to solve systems of simultaneous heat and
mass transfer without the computational difficulties of implicit
techniques.
Page 31
4.
’4"‘v.
.Ilnh
9‘4
Page 32
_ l6 -
TABLE 1
NMMERICAL RESULTS WITH OPTIMIZED
VARIABLE DIFFUSION COEFFICIENT 3
ft?8 2- -
Deff 10.961 08) 0.16621 (MJC) + 0.002011 hr
mm
. Numerical Average Difference Between Kpproximate Confidence
Time Moisture Content Experimental and Intervals for each
Numerical Values Numerical Value
hr %, d.b Z, d.b Z, d.b
O .684 .110 .684 .684
.1 1.515 - .247 1.600 1.429
.2 1.811 - .173 1.878 1.742
.3 2.004 - .086 2.056 1.951
.4 2.150 — .007 2.196 2.104
.5 2.271 .041 2.313 2.228
.6 2.375 .065 2.419 2.331
.7 2.469 .073 2.514 2.423
.8 2.552 .067 2.599 2.506
.9 2.627 .055 2.671 2.584
1.0 2.694 .041 2.731 2.658
1.1 2.753 .027 2.784 2.723
1.2 2.806 .016 2.833 2.778
1.3 2.851 .008 2.878 2.824
1.4 2.891 .003 2.919 2.863
1.5 2.926 .002 2.954 2.898
1.6 2.957 .003 2.985 2.929
1.7 2.984 .006 3.011 2.956
1.8 3.008 .010 3.035 2.980
1.9 3.029 .013 3.056 3.001
2.0 3.048 .017 3.076 3.020
2.1 3.064 .019 3.093 3.040
2.2 3.079 .019 3.108 3.050
2.3 3.092 .016 3.121 3.063
2.4 3.104 .013 3.134 3.074
2.5 3.114 .007 3.145 3.084
2.6 3.124 .000 3.155 3.093
2.7 3.133 - .006 3.164 3.102
2.8 3.141 - .013 3.172 3.109
2.9 3.147 ~ .020 3.180 3.116
3.0 3.154 - .025 3.185 3.122
3.1 3.159 - .027 3.191 3.128
3.2 3.164 - .027 3.196 3.133
3.3 3.169 - .025 3.200 3.138
3.4 3.173 - .020 3.204 3.142
3.5 3.177 - .015 3.207 3.147
3.6 3.181 - .011 3.210 3.151
Sum Squares: 0.137
Page 33
. .-o -‘.-v“... N....
[l
lu[l|linl‘
(IIII
Page 34
-17-
TABLE 2
WE
E*—
NUMERICAL RESULTS WITH OPTIMIZED CONSTANT
DIFFUSION COEFFICIENT = 1.9535 x 10‘3 35—52-
hr.
Numerical Average Difference Between Approximate Confidence
Time Moisture Content Experimental and Intervals for each
Numerical Values NUmerical Value
hr 2, d.b. %, d.b. Z, d.b.‘
.0 .684 .110 .684 - .684
.1 1.419 - .151 1.426 - 1.413
.2 1.783 - .145 1.794 - 1.768
.3 1.961 - .038 1.981 - 1.942
.4 2.107 .036 2.131 - 2.083
.5 2.233 .079 2.259 - 2.206
.6 2.345 .096 2.374 - 2.315
.7 2.447 .095 2.478 - 2.415
.8 2.539 .081 2.572 - 2.506
.9 2.622 .061 2.656 - 2.588
1.0 2.697 .038 2.731 - 2.663
1.1 2.764 .017 2.797 - 2.731
1.2 2.823 - .002 2.855 - 2.791
1.3 2.876 - .017 2.906 - 2.845
1.4 2.922 - .027 2.951 - 2.893
1.5 2.962 - .034 2.989 - 2.935
1.6 2.997 - .036 3.022 - 2.971
1.7 3.027 - .037 3.050 - 3.004
1.8 3.053 — .035 3.074 - 3.032
1.9 3.076 - .033 3.095 - 3.056
2.0 3.095 - .031 3.113 - 3.078
'2.1 3.112 - .029 3.128 - 3.096
2.2 3.126 - .029 3.141 - 3.112
2.3 3.139 - .030 3.152 - 3.126
2.4 3.150 - .033 3.162 - 3.138
2.5 3.159 - .037 3.170 - 3.149
2.6 3.167 - .042 3.177 - 3.158
2.7 3.174 - .048 3.183 - 3.166
2.8 3.180 - .053 3.188 - 3.173
2.9 3.185 - .058 3.192 - 3.179
3.0 3.190 - .061 3.196 - 3.184
3.1 3.194 - .062 3.199 - 3.188
3.2 3.197 - .060 3.202 - 3.192
3.3 3.200 - .056 3.204 - 3.196
3.4 3.202 - .049 3.206 - 3.198
3.5 3.204 - .042 3.207 - 3.201
3.6 3.206 - .036 3.209 - 3.203
Sum Squares: 0.138
Page 35
BIBLIOGRAPHY
Allada, S. R. and D. Quon (1966) A stable,_exp1icit numerical solution
2; the conduction equation for multi;ggmeg§ional nonhomggeneous
media. Heat Transfer, Los Angeles, Chemical Engineering Progress
Symposium Series, 26, 64, 151.
Barker, J. J. (1965) Heat transfer in pacggg beds. Industrial Engineer-
ing Chemistry. 57,34, P.4.
Fish, B. P. (1958) Diffusion and thermodynamics of water in_potato
starch gel. In Fundamental Aspects of the Dehydration of Foodstuffs.
Society of Chemical Industry, 143.
Harmathy, T. Z. (1967) Simultaneous moisture and heat transfer in
porous systems with particular reference to dgying. Industrial
Engineering Chemistry. Fundamentals, 8, 2, 92.
Heldman, D. R. and P.8W. BakkermArkema (1969) Investigatigg:of the
energegics of water binding in dehydrated foods at very710w moisture
levels in rglgtion to quglity pgggmeters. Departments of Agricul-
tural Engineering and Food Science, Michigan State University,
East Lansing (Unpublished mimeo).
Henry, P. S. H. (1939) Diffusion in absorbing media. The Royal Society of
London. 17LA, 215.
King, C. J. (1968) Rates of moisture sorption and desorption in
porous, dried foodstuffs. Food Technology, 22, 4, 165.
Meeter, D. A. (December, 1965) Non-Linear Least-Squares (GAUSHAUS).
Michigan State University, Computer Laboratory No. 0000087(Mimeo).
Nguddy, P. 0. (1969) A Generalized Theory of Sorption Phenomena in
Biological Materials. .Michigan State University Agricultural
Engineering Department. (Unpublished Ph.D Thesis) pp. 104.
neckland, L. B. (1969) Water activity and storage sigbility. Food
Technology, 23, 10, ll.
Rohsenaw, W. M. and H. Choi (1961) Heat, Masgg and Momentum Transfer.
Prentice-Hall, Englewood Cliffs, New Jersey, pp. 416.
Schneider, P. J. (1955) Conduction Heat Transfer. Addison-Wesley
Publishing Co., Inc. Cambridge, Mass:1 pp. 378.
Van Arsdel, w. B. (1963) Food_Dehydration. Principles. Vol. 1. The
AVI Publishing Co., Westport, Connecticut, pp. 66.
Young, J. H. (1968) Simultaneous heat and mass transfer in a porous,
hygroscopic solid. ASAE paper no. 68 353, presented at Utah
State University, July, 1968.
Page 36
7. 4/9 COND/T/ON/NG (AM/NCO) UN/T.
2. EQUILIBRA T/ON CHAMBER
3. LAM/NAP AIR FLOW METER
\
\\\\\\\\
@
Figure 1. Apparatus for equilibration
of i‘I'emct-(li‘ied beef L'ulus.
Page 37
—0/0’
0.8.
CONTENT
MOISTURE
A—-—————
Q
MS I-
'\ EXPERIMENTAL
A 60% RH.
OE h—
/ <:) 6’9. 56
C) o
S __ E] 40. /o
C) 76.4 ‘7.
Q
Q' _' o G JV} 0-N o a
air at .' 700 ”F
O - 0
Q5
A
O
O
Q I'—
‘0 11° W
I .
n
O on
\T‘
" , o -/H G
7 ¢"M'§'.
Q ,¢
(\i
C")
l L i I |
0.0 70 2.0 3.0 4.0 5.0
TIME - HOURS
Figure 2. Experimentallydetermined muisturo
adsznwvtiun claw CS
hi‘Cl: Clihtas_
F01? frnwnzy-(lrircl
Page 38
CUBE
TEMPERATURE—
°F
96
700
702
704
706
96
94
EXPERIMENTAL
——_‘ 00.0 °/o :9. H.
“.__ 60.0 O/a A) H.
———-—‘ 40,0 °/o R. H.
Jr\\ ————-‘ 70.4 .O/o RH.
I
I \\ \ air at: 700 °F
\\ \ \
\\\ \\ \\ \
'\.\‘\ \\“\~ ~\‘~““~
"If T‘“ “ \¥
I
l l I L J l
.0 .250 .500 .750 7.00 7.25 7 50
TIME — HOURS
Figure 3. Experimentalix d [LYHlHCd tomperntlie
tlirvcs chlrizn, tht aihstnqitiiut pr wqus Wldllzltvd
in FWHI‘L‘ 2.
Page 39
°/.,DB.
MOISTURE
CONTENT
——
Q»—
S
gh—
'53.
Q.S..—
Q—
03
me
to
9..(*3
Q
QI i 1 L l
0.0 20. 40. 60. 00 700.
RELATIVE HUMIDITY — °/o
[quililn'ilml lflulSLli'L‘L (‘K‘Hl‘x'llL (1.13.15 r(‘lilll\'( Till.niii"Lf
(.‘(j‘whvrl‘ll “‘1 Il‘rw:’.{"--(‘ll‘i€d 1111:, 1"..1‘».
Page 40
r.—
3.5
,QB.
°/o
N: 6, surface:
NUMERICAL
N, NODES FROM CENTER 70
a 35’“ 5URFA CE
K s \S’ -
2 e -—-—AVERAGE MOISTURE CONTENT
E
SU I
3:4 I, air at : 700 :F
U, L
5
2 0
Ln.
1 l l l i l
0.2 0,6 1.4 2.0 2.6 3.2 3.6
Figinx‘ 5. Adsorption curves
TIME -- HOURS
£01: ptdzits lfliiitCCI 111 thLJIJa hi tiiagu)nal. of thta clnit.
v
Page 41
MOISTURE
CONTENT
-—°/a,D.B.
3.5
3.0
2.5
2.0
7.0
7.5
0.5
0.0
NUMERICA L
M»3.2 H.
2.5H".
2. 0 HR.
7. 4 HR.
air 32‘ : 70007-—
76 ‘7. R. H.
02 HR.
I l l I l ___
2 3 4 5 6
NODES —FROM CENTER 70 SURFACE
Figlme 6. Hoistuie distribution within the
tube at d' i‘l‘erent times.
Page 42
X70
2
DIFFUSS/ON
COEFFICIENT—FT/HR
Q I—-
N 2
7254,4746) +Azx7M67+ A3
9 _ A, = 709670000
KO A2 =-0. 7662700
A3 = 0.0020770
Q ._ ,.
03
Q _\,'
Q —
I»,
077’ at: 7000 F
2* 04%RH-
Q L
l I l l l l
0.0 7.0 7.5 2.0 2.5 3.0 3.5
MOISTURE CONTENT - °/o,O.B.
Figure 7. Optimized polynomial for the
diffiasion coefficient as function
of moisture content.
Page 43
°/o
,D.B.
2.5
MOISTURE
CONTENT
3.5
3.0
/(r*’*’
T
T—
r' 4/
y7
——"NU/
\/IERI
CAL
SOLUTI
ON
0‘ EXPERI
MENTAL
DATA
_ AIR AT: 7170 ”F and
7’5 o/Io RH
1 1 1 1 1
0.0 7.0 2.0 3.0 4.0 50
TIME '“ HOURS
Figure 8. Comparison between the numerical solution
(with optimIZed difftsion coeifirient
pol}nhwnial) ainl cxpcxfltnnital [N31HES.
Page 44
IeIc_m1uZC
>320
ozmaun_uzcv
ZC_»CLG_C
tc<Cc
Itch
Z.
uuCCZ
no
uuCESZ
u*2
(Lkw§_eflc
uU
Ck
UCLFL1<C<C
uC
000222
nC<02
w70~e<33uoqc
acumeut:z
uIe
2_
ueZufuht?_
L$_»
uC
uuzszz
n.0u2_
ule
uG
MUO<FUIDSHP
C3»
urk
RC
Ipqt
03h
FC—PCGPZLCZCL
QCO<>
aubcs
umuo~u
Jd—ECZ>JCQ
1.11???
-3..:0u232
hIk
>0
ChFSLECC
fizuhZCC
“EZFU—CS.
hC<0u><
uu
J<_ECZ>JCC
q>8
Cues—u
PTLFZCC
haiku—Ci
J<k2u§_&uaxu
ubeen
UhCCZ
.2hh3FLC
CZ—LCOU
II
LUL'LL'U
rlchLi
0.0.5.16
.‘.;0.:J__.Ch
J<FCF
.1.Eu
c2_e
(nuacsu
J<e2u$_0ucxu
nbu
US<QCCQC
44<
Ck
i§_»
CuUC<_u
ZOZSCU
um2_ecu
pZuezcu
u&:e0_C$
r3_cc_3_:CL
e<e2u2~auaxm
uuzu
UL)L‘
LL»F
Chair—£5.10
-,_<F_.(.Ue._CL—CXLCKFLUQQCL
flFQQJU
LE—F
CKUQCJM
HJU
FIC—hL:
>CC
LJCICU
H:.C
t.rZ.u..<1.CL2~
ChPUIhI—F
Ih<thC
>F~UZUf
COLC~h
uLLC
IUZLC
uOZ+<GhG§bk
742CI>0C
C_<
1F00
._LCCS.
7C._C|<C<
.1_-..<
ULLYLL‘LUUUU
Inc—FSFPZCLZCL
CCC<>
Que/N...
uCECE
zchecceruuzcu
QCC<>ICurcz
J<_k~2~
ue_2_u
Vic—PCCErMLZCC
CCGccxlcuhcs
>0<CZSC$
uCZZCUU
ezuFZCt
easeu~ce
u6<cu><
n:C><
Econ
C_<
2<uoeu
uu<
2202.:
LZHFZCOKSU
Sikh—u
tie
>5
cuu:
unueuz<U<c
ucu.cc.0t.cc.0<
arc
.u._c._c._c.~<
>CCJCC$>U
.1—(2
«(<OCQCC
Co>od60CU.
LZCJ.C<.>C<CC_;.
L‘UUUUUU
CD.“(Cir
whee.
acetate
—o
wo.u\..(~)C/L»H(<on..(Uo
:CCUCCCOthCfCt
_cFTL—C
.L
X_CZLOC<
L
Page 45
UU U UUUULIU bUk‘UUUU
11
1
17
1
10
OF
THC
C119r
NTD
=TOTAL
NUMRF'D
0F“
MONT";
OF
ONF‘
r‘IGHTH
(‘F‘
NHM:
=NUVRFQ
OF
FXDFQIMFNTAL
ORGFQVATIONR
NUM?
=NUMRFR
0|:FUNCTION
VnLlIFS
(MOISTUFJF'
CONTFNT)
CW
THF
GAUQHAHQ
CUDDOUTIHC
DOD
=arr:
DODOCITV
PTWCPQPTMC!
=LOCAL
MOIQTUDF
CONTFNT
FOQ
THF
Two
STAGFS
OF
THE
NUMFDICAL
vnnFL
I
OH
=DFLATIVF
THI—
CURE TO
RF
COMPADf-TD
HUMIHITV
AF
THF
01"?
DT
:FDF‘F—‘7F—DDVFD
DLATF‘
TL-MDL'OATan
CICNQofivFF
=CAHCHAHC
QHDDOHTINF
OnonchFDQ
TH
:pAQAMFTFQQ
(DOLYNONIAL
COFFFICIFMTQ)
TO
Cunoourtmr
Tu:
=Tony
'.-IF1(‘,HT
X1111
:TOTAL
INITIAL
CAN-OUT
\UFIGHT
YMC
=FmIIL.H‘%r>117-4MnICTnDr
(‘ijTC'IT
W:2TOTAL
(ZAMDLF‘
\uryrzur
DIMFNSION
FT(7.")~W(70)qFL./\DT(70)
oA\I.‘/1(‘.(7O)oTHIR)oSIGN‘R(R).DIF‘F(8)
T'SF‘ODTIMI7FD
BY
THE
GAUHAUQ
nyupqunw
I")
I~11:an
1Arm
1')Y"ENCN‘N
F)
I“FMS;
I("M
F5T1MF17A).F0MF(761
01(716n1(7.7)-P1(’).n117.7)~F1(131
rch1=y
.ywrtfi)
Anth)~nn(a.4).c01n).nota.4).F01v)
ymrpcro
tr
COMMON
FOTIMFoCOMF.XMFoC‘ROHHDoCIMIToDODoDF‘NC-oNToAOo‘ROoCOoDOoF-‘O
COMMON
DFLTAT
F'YTPDNM
ALLOIV‘N
DrAD
DADAMFTFDQ
DEAD
1oDTQDGTQDHQAFOTWQXIW
FODMAT
1Fo.a.1F1n.a.ynx.?F1n.6)
1F
(0T6F061Co)
GO
TO
6”
DOINT
1].
PT.DGT.DH.AC.TW.
xxw
FODMAT
(1H1.*
0T
=s
.Ffi.1.
aDOT
:s
.F:,;,
8AF
:*
.Fq.3.
Fn,a.
#yyw
:4
.
DVAT‘
.9
e‘71.”
9h‘!’
FGDMAT
(OX.
9F1fi.n)
DOINT
19,?w
.hm
FODMAT(¥
FOUlquOIU”
F1060)
XI”C
=(
l“DINT
1“.
XIMC
FODMAT
(*
INITIAL
Fur
:(Fm
—
DOINT
1a.
FMC
FODN'AT
1atFOUILIQDIIJM
VflICTUDF
(ONTFMT
:a
.
DEAD
17p.
DFLTAT.DOD.DVAC
‘l'QH
=’1'
o
FO.(|)
Fag]
0
‘5‘”
T".
1‘.¥
.
‘IIFICHT
:¥
.F1fi.a.
1|.DQIED
V'FICHT
=*
.
YI‘.”
_Th!
_131.1
)/n‘,v
MO
I“JUDI-
mm
)/nm
CONTENT
=*
s138.“)
FR.“)
Page 46
RI:Z
o-b
FZ—OO
a0
<4
H".2
_+
zsn
nn?
fu
5
nI
«.232
M05.27.
a—EZZLQF2_
H05:2
F<FSUC\.~::ICFC<Ju
n~222t
3.1:...
_:15:00
«I—
H—§:Z
“Noun
.t
uHZUFZCC
haiku—C;
*.mouu.s
uu:_k
Choocsu
sequocu
“_.L2><
.Ahc»0<mu.rrr
FZFCO
.:..L\
A.._rL
I:3F
.I
a—v‘:
»N
A~VUSLIC
oC(\»».Fh*KCCo
HA“.
FC<JU
(a
CF
CG
a—CCH
6C0.
Aficku
.u—
xc.c~u
.C~
.ecsccu
x_.3
.xa.eu
.u
Ccuo
CC_.—
nw
CC,
CC
Amoc_um
.a
uUQCF<>_FUL
_<~k~2~
».
hcfccu
»C<CZ.~
u_.vajk
..cccn
kihco
Acocmuc
aF<20Ch
nC(CZ.~
n»
.A~QIP~
orrrn
CCLC
an~
.t
uuntruI<C<c
uC
CLUEZZ
to
kceccu
CcOZ
._nrn
FZHCQ
anu—
v.r<S.OC.u
CcOZ
oCfirfl
C<UC
”LH
.a
uCUF~CCZ
to
F<20Cu
k2
.man
kZ—OQ
Ame
.kczacu
82
.nm—
Ccuu
”Cu.C(.CC.O:.O<.t>x.CZCU
.EQmIFCu~
Jocu
at.U_uu
.a
uL5)
><00<
*ck<20Cu
.U.~
u_.:.t:x.
Len
tion
Abotpuuc
F<§OCu
TL.”
1;
..:.:t:
.5:
Cent
AUoUqu
.x
uZC~F<OkZLL2Ct
><02<
toPcchu
AU.”
u_
..~.t2Cu
..Cao
FZ_CO
nUoUHlU
QFCEOCU
.AU."
H~onthZCL.
90¢"
C(hfi
xu.r~u
.a
nFargo
4.6.62u
.x
uCzrtoux_
e<zncu
F_Z_U.CZ:CEU.Ct0
FZ~OO
AUoU—UO
wFCiOCk
.P_Z~L
.CZSCUU
oCF~
CCUC
Anoc_u
.*
uUZUC
*.e.c_u
.a
uCCQ
a.<.cmu
.a
nFakJuC
*chcéocu
626C
.CCC.F<»4uC
.Qtn
kzhcc
boot—us.
hczccu
(0
PF?
(C—
C000
.1?an
Penn
(<00
can
flaw
"an
we»
CPR
CP—
GPO
Gt—
Page 47
UUU
711
80"
111')
7":
FODMAT([O)
CALLS
FUDV
SHRQOUTIMF
(”N
TADF)
MIC“
FITQ
ASIX—DFGDFF
pOLYNOMIAL
TO
THF
cyDcOIMCMTAL
vnycruor
rhMTFNT
VALHPC
CALL.
CUDViNlW'l
0’499‘41cc'LADToAVMr‘oAl
9131of!
97314‘71)
DIWT
=_
DF‘LTAT
fin
fififi
y:
1,5umu:
FOVC11)
=(1(1)
HUMT
=QHMT
+nrlTAT
FOTIMF
(I)
=PM“?
'3.“800
L:
?9”]
tour-(I,
._.rnmr{[)
+P3([.)*(COTIMF(l)**(1."l))
fin
nave
K:
16MDAD
sycmc1w)
=n.0
DYFFIK)
rOoOl
CDC]
:CDC?
:y.r-c
DOINT
711.
r06}
cmnvnT(F1C.)C)
CAHQHAHQ
QUHDOHTIMC
(ON
TAD?)
ODTIVI7CC
THC
DIFUQION
DOLYNOMIAL
COEFFICIFNTQ
TO
"INIVI7C
THC
SHM
0F
THF
DIFFFQFNCF
FOUADFS
RFTwFFN
THF
FXPFQIMFNTAL
AND
NUVFDICAL
VALUrQ
9F
THF
AVFDAGF
MOISTUQF
CONTENT
CALL
GAHSHAUS
(1oLATFonMPoFQMC.NPAQoTHoDIFFoSIGNSonfiloFPC2.
lnq'or‘IlOlno)
DDINT
71G.
FOD‘V‘AT(
a.
CAN”:FDflM
GAIIQHA'IQQI)
an
TO
61
CnKITINQIF‘
QTGD
PM“
THC
THDCF
HIMCAJQIOKIAL
nyccuc1oM
EQUATION
{C
«OLA/rm
FIY
THF
ALOUON
NUMFDIC‘AL
QURDOUTIMF
ALLOHON
QURDOUTIHFINDDOQ0TH9F9NHMP6ND)
nyMrNQInN
T411).C(1)
(‘OK‘MON
C‘OTIVFM‘ONC.X‘M‘ornflutchINIT.DOD.DFN§.NT.AQ.RO.(“7.DO.FO
ChuvnN
hrlTAT
WY‘HWUCIDN
FA\N75(9A),A\mu-(9n)
fiyurmclnm
Fr‘TIMTFro)
“VHFNCICN(1113.13.12).
”9(1161261")
fit-nrhflllnhlITOKV‘1G)
.¥*V‘(C)
“IMFN‘ZION
A“7((1).D‘7(aod)o"-"(/1)of‘QI/HA)‘F°(7)
DIMFNQION
DT’-‘.F;>(1‘3.11.1'1)«DYMFI(13.13.11).PTVC(1.3.1.361?)
(fit-A"
V1.V_T‘.r"
Page 48
CC
CLUkZZ
.CH.Q~h
.e
n
ZUUZOU
“FoQL
J<_F~Z_
.rpznk
.J
nios.o—~r.\
rhfmt
u”5.1._.Ct
.27...“
I\.
U—
(r.
.L2.c
1a.”u_
CC
3.2....
u~
U,
(C
(ZZCCU
nn5.D._VRt
CZZCnC
nAil-._:.c
«._.(o—
H\_
F—
CC
1.2.
_u
a.
F.
CC
CileOk
H“Lowe—VOL
CZ:CCL
n“X."
o~
.Pt
.22.—
.7.V.
nu—
CC
:7...—
“»
0~
CC
CZLCCC
nAF.1._enL
(ZlCCh
Hapofio~vpb
.;L.~
ua,
H.
(C
lfop
h—
_—
CC
VI.
F7.
n7....
leZ
n12
FI
#2
nS?
—+
b2
n22
n+
F2
u22
CCuI\._
nCCtI>
71.1.1
HCCUI
kc..._hC\.w
.7.P<FLU>
AU»
.t
nUPI—CC
ockce
*.
r”
.e
uUkzhCC
LCCth22
4.FeSCCU
Ck2.k2
.CC
PZhCC
.(
kZHLC
6.
(11+?
1Del
”(Poo—u
.t
u<<
*
cc
#.C_.C—t
.n
uc<
a.(rough
.#
u<
C4.
FCIOCU
<<
.rc
.nc
.~<
.~(n
FZLCQ
AQVCU
H”C
$AFQCU
HCC
6“RVCL
nF<
$A~VCU
HCd
Auotfih
.e
uI
CXQF<ECCU
I.V~_
F2~CC
A».F1C2080eao<n.\.~
nI
k2
nCIC
1u
>e~62tc
t..r.nu
.r
n>v~ucocn
x.eczocu
CZLC
.CCC
.n-
h2»CO
Amouwb
.t
u2C~F<CFF
*.(.U~L
.s
uZC~F<QkZutZOL
>C<CZZCC
(*
vF<ZOCu
FHZHC
.CZTCKC
.FH.
k2_00
.21”
.bciccu
.c
k2~00
P—
FF
CC
”(0‘
rep
0»,
——~
(
Page 49
.kchmhfatQCxCCCQ\~<
#UTLC
t.thloQQ
ion
1pi
flrQIr
+H
A112:2.Q1772._IsixQLsf~3#A.uQIn.
+no¢#5.i1nii.fil<a..QlceaQefichfit._Qvik
n.uQC
42.»
uS
(U
CC
42."
u7
(U
CC
.2..
MQ
(U
CC
“1.5.FZQCL
u~1.fi.22QnL
F2.n
n5
PR
CC
F2.&
1D
to
C(
ALoFIowQOL
1..nioEZo—QPK
F.100
h\—
Cru
Cr;
r..c
MQ
as
(C
”._....o.owQOk
V“5.2.1than
#Z.n
u1
Co
(5
p2.n
u_
.68
CC
ACoCUC_
oa
HF2.“
UQ
.AQ.N.QQOKEFC
tQ
F<2OCU
APZ.~
MQ.RQ.Q.QQCt2hCQ.—CCUPZQCC
”UoUFL:
.s
nA3.i.&Qnt
*QF<20Cu
atzo—
.7.S.»\..\..\.QC.\,
Qo(((
.r_L_CC
.(c
~
€<
+AX.D._Q<.C*.P<
+O.$....\..T.QQRC..4ng
+Path...:...hQC.k4~<
uAiofio~anQSFQ
:n..7.QQ—ts.:Q.<_ct
+na_...v..7._:t
+»&._1.,._QQL.
+.\...1.—+Q
Q_.L+Q
“_1¥.a.»anc
+.i._11.QQnFC
+.1.n.~.._.OtQanFY2+,Qa<<:<m
“uxi.o.Qch
«Knoll/tor
I”1.2+
ai.7.QQFL*C.\.
+nn*»&....QQ~L
*my.
1£44ch
.CCol>x.r
+ry
+n¥.fi.QQ~t*Ci
4041,1.fi.QQPC$.¥Q\._
u<<$<C
neckJLCthQCxQCQQ\”CCC+c<bequAQCOI.pQQ
nVb
AFCFQLfifihQCtCCCQ\C<XLZLC:AZCCIopQ*onnti
AF<QHHquLmQanfihuQ\H.c
nviabt
4an?%ulo_
Qto”.
n,5
APQIF
+flofio~QikkfikafiQIhsgufitnbofioHQC..FO*A—QIF
HU~C
e7.&
ni
(n
(C
FZ.R
ua.CO
(C
FZ.R
u_
CC
CC
QL
nACUZQ
QEEQFCL
e<»_uc
+on
u3t
_+
at?»
nOtiQ
(.C
6Qt
cc
+LZICubwrc
+—
manZZCCLnn<
+V**(Z:CCis_<
u"_.w.~Q(t:kC
nAQ.H.FQFL:+C
anu
HAko1._QLS_FO
F2.R
u&
OFCU
CC
.Q.Z.R
Ha,RFCU
CC
ez.n
uHnmeu
CC
on
+»_ZQU*E<
+mask—Zchcc
+vase—ZQut—q
n”_Qu
C.C
unfiQuszcu
.u
CCZQ
p.10
C0
—\LU
(«arm
(0
CF..\U
Page 50
nUQLIX
o“HQCZCC
ZCHUZUSLC
.Ou.3C.O..Q.C.u.3<.CEX.LZCLQ
IDLIFCJQ
uz:..,.Cn_u:u
czu
ZCZFUC
CZZQFZCC
CCC
0Ch
CC
CCC
Ck
CC
an::Z.CC.CLZQQ
CQ
hoot—u
.a
np
.uezuzuuc.Q
4.aQ
.*
nuru<
FZueZCC
60:»62c5
Z<mz
*thzocu
,Ch
.CC7QQL.CCZM
.~Cp
kZQCO
C20\L.L_£..U
.7.AQCZQ
Qu
CS...£..U
+“3.5.SQUSFC
M055.20
(CU
00.\anv_o¥ov:nub§kfl
+n¥o\x.V.Q—.L.S_FSQ
HnioloVCUFPC
12."
n1
(AU
CC
0C
HC2530
n3...ot..‘ka
.1.”\JofiaoSm/AQFU
0.x
k2.c
L5
cc
CC
Plot.
.1.a.06
CC
A&.h.z.QQfiL
uA&.22._Q—L
GQ
FZ.R
ni
n:
CC
+2.m
uQ
06
CC
AFZ.T.QQ_U
nA52.D.~Q_p
QC
.rZonu
.7.D
:V
CC
.51....
.7.Q
we
CC
a<odh(_
.n
H#2."
nh
.nk.b.\Q
"CEFC
xQ
FCECCU
C(CU
.FZ.H
u1.7.4.5th~LIFCQ.CCCUFZQCC
nUoU—LO
on
H“fozoiQ—k
#QF<§CCU
FR?
nkzo—
nI
.5......1ka.
Q.FPP
FZQCC
cc
+A5122.DIEZ.QI§ZQWLtr<
m
+nsxailzz.DI>Z.Q122Q_Crc<
_
+r**.iILZ.WIEZ.MIZZQ~tx~<
nn.¥3;212152.Q1:ZQ_L§e0
(U
“551:2
.7157.
._...97.
Qat.
a1445er
+Anilkz
.o
0152
._152
QRb
+A9152
.DIFZ
._ISZ
QNb
+.51?2
.UI>Z
.QIFZ
Q0L
R
+Ai7122
.n.asz
._1.:2..
~.c
+xy7iar
._use.
.Q7.%z
Q“C
.+,
.xISZ.WISZ.QIZZQHCQ43CUI>Q4E<2<CH
hilt:
.1122
.QIZZ
Q_u
CCuI>
son
1ti
+.
.M122.n722.~152th*ni
+m**.XISZ.1127.QIIZQnL
sfii
nychru
ACCUI>xor
+F1
+_
AMISZ.WISZ.QIEZan»ni
+asaxx122.11§2.~152Q0L*_i
.\.~
uU<S<C
AFCFJUCxu~CeOCOQ\ACCC+F<*UZUC».OC016_QQ
uoi
AF<HJuC*uQCnfiCCQ\n«#U2h(thOCOIoPQtonu01
Page 51
(Pruaflr
~annn
upaonn
w—Gofifi
GCWQoRn
CCloOC.
CCCORC
T(C0nu(
FQCCOCF
bbCCaCf
(tic-CC
C(conn
UCChooo
CCKIOCC
loath-nun
”Cocoa
(UCPOCO
UC~i7ono
(b.0000
ruinoon
FQUPOOO
corpora
(00000..
QCCoOn
(r(.00
(llCo.
~1L(o—
qVVCJpo
UFECO
USUCO
run—.VCO
0|hCCC-P~
QlquFoQ_
OILCfiRoJ
rlLriiCoc
01
(1.0qu
PPR.
(CCoP
CPCUQP
Croup
CCCoR
.(C
oCF
oC(—
C((iFoCCo.
CZL
20:FUC
ACU.CCILL.CH..C.Q
.1..>.27.1..<.P.UQ>C:..Q
_Jct
nerPu.“_c.nQ~.C...~QCC.A.\.chtu.n.\QC<
_2C_m&4h2an
CoC
~+uC.C
utrnou
_.C
(Cauoo
oLC—
0.25C.


![Freeze Dried Liposome Delivery System Fo[1]](https://static.documents.pub/doc/80x56/577d25b31a28ab4e1e9f6898/freeze-dried-liposome-delivery-system-fo1.jpg)


