Earth Planets Space, 65, 725–730, 2013 S n velocity tomography beneath the Himalayan collision zone and surrounding regions Yan L¨ u 1,2 , Bin Liu 2 , Sidao Ni 3,2 , and Shunping Pei 4 1 Institute of Geology and Geophysics, Chinese Academy of Sciences, Beijing 100029, China 2 School of Earth and Space Sciences, University of Science and Technology of China, Hefei 230026, China 3 Key Laboratory of Dynamical Geodesy, Institute of Geodesy and Geophysics, Chinese Academy of Sciences, Wuhan 430077, China 4 Key Laboratory of Continental Collision and Plateau uplift, Institute of Tibetan Plateau Research, Chinese Academy of Sciences, Beijing 100085, China (Received June 11, 2012; Revised December 23, 2012; Accepted December 25, 2012; Online published August 23, 2013) We present a tomographic S n velocity model of the uppermost mantle beneath the Himalayan collision zone and surrounding regions. A total of 43,905 S n phases are used in the investigation. The average S n velocity in the study area is approximately 4.6 km/s, and the velocity perturbations reach 0.2 km/s. The S n velocity distribution is consistent with P n tomography results obtained previously. High velocities are found under the Indian plate, the Tarim Basin, and the Sichuan Basin, whereas low S n velocities are found beneath the Myanmar region, the Hindu–Kush region, and the Lhasa block and western Qiangtang block. These results support the idea that the lithosphere of the Indian plate is subducted into the mantle and causes the upwelling of hot material. The east– west variability of the S n velocity beneath the Indian plate and southern Tibet indicates that the underthrusting of the Indian continental lithosphere may be in a piecewise manner. The differences between the thermal structure of the crust and upper mantle in southern Tibet suggest that this region may be represented by a tectonic model of hot crust and cold mantle, supporting the idea that crustal material flow may occur in this region. Key words: S n , velocity, tomography, Indian plate. 1. Introduction The collision between the Indian and Eurasian plates is one of the most important global continent–continent plate collisions. This phenomenon has an extremely important impact on the tectonics of the Himalayan collision zone and the surrounding regions (Fig. 1). The tectonics of this area is active and has a complex structure, and is one of the hotspots of Earth science research (Molnar and Tapponnier, 1975; Teng et al., 1994, 1999; Zeng et al., 2000; Wang et al., 2001; Zhang and Klemperer, 2010; Zhang et al., 2010a, b, 2011). This subject was the focus of a number of previ- ous studies (Kind et al., 2002; Ding et al., 2003; Hearn et al., 2004; Liang et al., 2004; Zhao, 2004; Liang and Song, 2006; Pei et al., 2007, 2011a, b; Phillips et al., 2007; Xu et al., 2007; Ren and Shen, 2008; Sun et al., 2008; L¨ u et al., 2011; Yue et al., 2012). The P n velocity inversion indi- cates that the Indian plate has a relatively high P n velocity, whereas areas in Afghanistan, Myanmar, and the Tibetan Plateau are low P n velocity zones. The subduction of the In- dian plate lithosphere to the mantle of the Hindu–Kush and Myanmar regions is widely accepted (Zang et al., 1992), but the specific characteristics of the collision and move- ment under the Tibetan Plateau are still unclear. Ding et al. (2003) provided Cenozoic volcanism evidence for the tran- sition from oceanic to continental subduction in Tibet. The Copyright c The Society of Geomagnetism and Earth, Planetary and Space Sci- ences (SGEPSS); The Seismological Society of Japan; The Volcanological Society of Japan; The Geodetic Society of Japan; The Japanese Society for Planetary Sci- ences; TERRAPUB. doi:10.5047/eps.2012.12.012 INDEPTH-III study proposed that the lower lithosphere of the Indian plate subducts northward at a larger angle (Zhao et al., 2004). The model proposed by Liang and Song (2006) considers that the crust of the Indian plate subducts under the crust of the Eurasian plate and above the man- tle. Huang and Zhao (2006), as well as Zheng et al. (2007), proposed that the Indian plate lithosphere subducts 200–300 km deep into the mantle by teleseismic P -wave inversion. Using the receiver function method, Yue et al. (2012) in- terpreted either a piece of the Lhasa Terrane or a remnant oceanic slab underthrust below northern Tibet. However, the mechanism of subduction is still unclear and requires further examination. The S n velocity at the uppermost mantle is significantly influenced by the temperature, pressure, and material com- position. The effect of temperature change is more pro- nounced on the S wave velocity than on the P wave ve- locity. In high-temperature regions where partial melting is present, the S wave velocity decreases more significantly than the P wave velocity (Nolet and Ziehuis, 1994; Goes et al., 2000). Therefore, the S n velocity distribution can pro- vide more evidence of the thermal situation and plate move- ment characteristics of the study region. Previous studies using waveform records found S n wave propagation attenu- ation under the Tibetan plateau (Ni and Barazangi, 1983; Rapine et al., 1997). However, these previous S n wave studies were influenced by the amount of data, and there are fewer high-resolution inversion results. In the current work, we present an S n velocity tomographic model using a large number of S n travel-time data obtained from the Inter- 725
Transcript
Earth Planets Space, 65, 725–730, 2013
Sn velocity tomography beneath the Himalayan collision zoneand surrounding regions
Yan Lu1,2, Bin Liu2, Sidao Ni3,2, and Shunping Pei4
1Institute of Geology and Geophysics, Chinese Academy of Sciences, Beijing 100029, China2School of Earth and Space Sciences, University of Science and Technology of China, Hefei 230026, China
3Key Laboratory of Dynamical Geodesy, Institute of Geodesy and Geophysics, Chinese Academy of Sciences, Wuhan 430077, China4Key Laboratory of Continental Collision and Plateau uplift, Institute of Tibetan Plateau Research,
Chinese Academy of Sciences, Beijing 100085, China
(Received June 11, 2012; Revised December 23, 2012; Accepted December 25, 2012; Online published August 23, 2013)
We present a tomographic Sn velocity model of the uppermost mantle beneath the Himalayan collision zoneand surrounding regions. A total of 43,905 Sn phases are used in the investigation. The average Sn velocity in thestudy area is approximately 4.6 km/s, and the velocity perturbations reach 0.2 km/s. The Sn velocity distributionis consistent with Pn tomography results obtained previously. High velocities are found under the Indian plate,the Tarim Basin, and the Sichuan Basin, whereas low Sn velocities are found beneath the Myanmar region, theHindu–Kush region, and the Lhasa block and western Qiangtang block. These results support the idea that thelithosphere of the Indian plate is subducted into the mantle and causes the upwelling of hot material. The east–west variability of the Sn velocity beneath the Indian plate and southern Tibet indicates that the underthrusting ofthe Indian continental lithosphere may be in a piecewise manner. The differences between the thermal structureof the crust and upper mantle in southern Tibet suggest that this region may be represented by a tectonic modelof hot crust and cold mantle, supporting the idea that crustal material flow may occur in this region.Key words: Sn, velocity, tomography, Indian plate.
1. IntroductionThe collision between the Indian and Eurasian plates is
one of the most important global continent–continent platecollisions. This phenomenon has an extremely importantimpact on the tectonics of the Himalayan collision zoneand the surrounding regions (Fig. 1). The tectonics of thisarea is active and has a complex structure, and is one of thehotspots of Earth science research (Molnar and Tapponnier,1975; Teng et al., 1994, 1999; Zeng et al., 2000; Wang etal., 2001; Zhang and Klemperer, 2010; Zhang et al., 2010a,b, 2011). This subject was the focus of a number of previ-ous studies (Kind et al., 2002; Ding et al., 2003; Hearn etal., 2004; Liang et al., 2004; Zhao, 2004; Liang and Song,2006; Pei et al., 2007, 2011a, b; Phillips et al., 2007; Xuet al., 2007; Ren and Shen, 2008; Sun et al., 2008; Lu etal., 2011; Yue et al., 2012). The Pn velocity inversion indi-cates that the Indian plate has a relatively high Pn velocity,whereas areas in Afghanistan, Myanmar, and the TibetanPlateau are low Pn velocity zones. The subduction of the In-dian plate lithosphere to the mantle of the Hindu–Kush andMyanmar regions is widely accepted (Zang et al., 1992),but the specific characteristics of the collision and move-ment under the Tibetan Plateau are still unclear. Ding et al.(2003) provided Cenozoic volcanism evidence for the tran-sition from oceanic to continental subduction in Tibet. The
INDEPTH-III study proposed that the lower lithosphere ofthe Indian plate subducts northward at a larger angle (Zhaoet al., 2004). The model proposed by Liang and Song(2006) considers that the crust of the Indian plate subductsunder the crust of the Eurasian plate and above the man-tle. Huang and Zhao (2006), as well as Zheng et al. (2007),proposed that the Indian plate lithosphere subducts 200–300km deep into the mantle by teleseismic P-wave inversion.Using the receiver function method, Yue et al. (2012) in-terpreted either a piece of the Lhasa Terrane or a remnantoceanic slab underthrust below northern Tibet. However,the mechanism of subduction is still unclear and requiresfurther examination.
The Sn velocity at the uppermost mantle is significantlyinfluenced by the temperature, pressure, and material com-position. The effect of temperature change is more pro-nounced on the S wave velocity than on the P wave ve-locity. In high-temperature regions where partial meltingis present, the S wave velocity decreases more significantlythan the P wave velocity (Nolet and Ziehuis, 1994; Goes etal., 2000). Therefore, the Sn velocity distribution can pro-vide more evidence of the thermal situation and plate move-ment characteristics of the study region. Previous studiesusing waveform records found Sn wave propagation attenu-ation under the Tibetan plateau (Ni and Barazangi, 1983;Rapine et al., 1997). However, these previous Sn wavestudies were influenced by the amount of data, and thereare fewer high-resolution inversion results. In the currentwork, we present an Sn velocity tomographic model using alarge number of Sn travel-time data obtained from the Inter-
725
726 Y. LU et al.: Sn TOMOGRAPHY BENEATH HIMALAYA AND SURROUNDING REGIONS
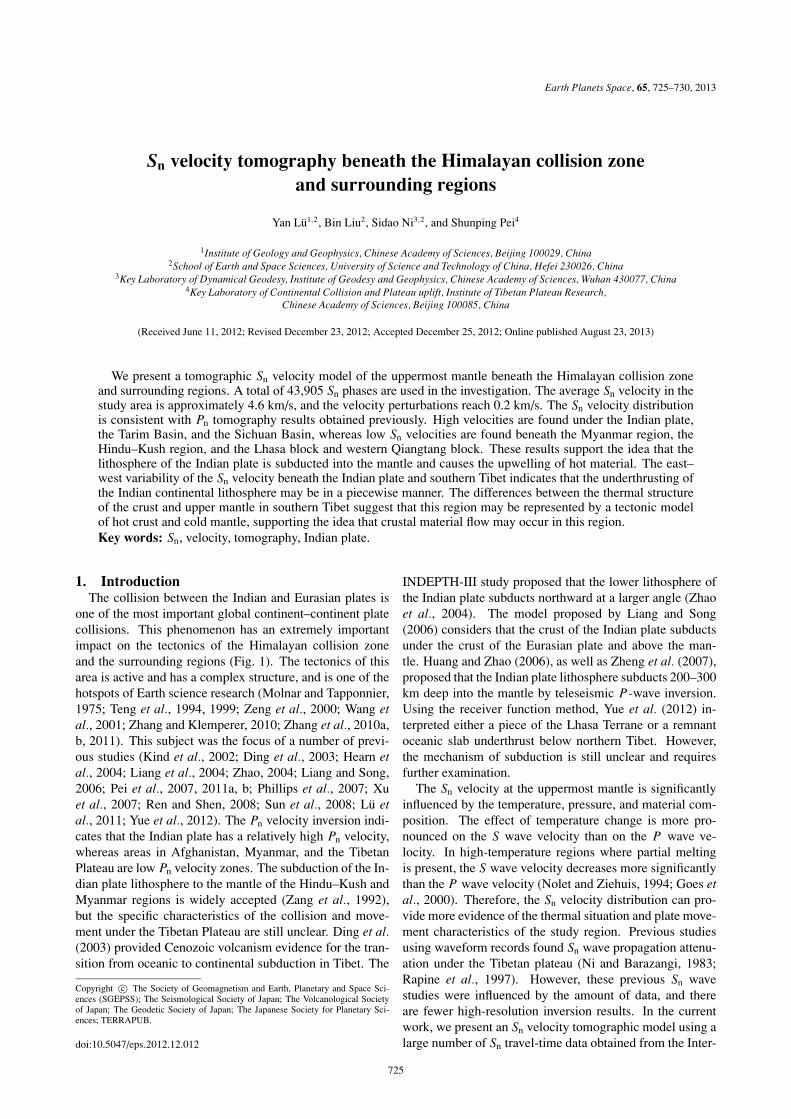
Fig. 1. Simplified tectonic map of the Himalayan collision zone andadjacent regions superimposed on topography from Lu et al. (2011).BNS, Bangong–Nujiang suture; IYS, Indus–Yarlung Zangbo suture; JS,Jinsha River suture; LB, Lhasa Block; QDB, Qaidam Basin; QTB,Qiangtang Block; SCB, Sichuan Basin; SGFB, Songpan–Ganzi foldbelt; TC, Tengchong volcano; YN, Yunnan. Triangles denote volcanoes;black lines represent the tectonic line.
Fig. 2. Ray paths for Sn travel times. From 9716 events recorded by 327stations, 43,905 Sn rays were obtained. Events are represented by blackcrosses and stations are indicated by red stars.
national Seismological Centre, the China Earthquake DataCenter, and the Annual Bulletin of Chinese Earthquakes.This Sn velocity model provides more insight into the platetectonic features of the study region.
2. Data and MethodOur study area is located at 20◦–40◦N and 65◦–105◦E.
Seismic data from 9716 events recorded by 327 stationslocated at 10◦–50◦N and 55◦–115◦E are used. These Sn
travel-time data are from three sources, namely, the Interna-tional Seismological Centre (1960–2007), the China Earth-quake Data Center (1990–2009), and the Annual Bulletin ofChinese Earthquakes (1985–2011). The arrival times fromthe China Earthquake Data Center and the Annual Bul-letin of Chinese Earthquakes are picked by the techniciansof China Earthquake Administration using a conventionalmethod, based on information of the seismic amplitude withaid from the forward arrival time. For the inversion, we usedSn data for which the epicenter distance ranged between 2◦
and 10◦. The initial models were obtained by a linear fitto the travel-time-distance curve. The average Sn velocityis 4.6 km/s. The crustal thickness of the initial model is50 km and the mean shear wave velocity of the crust is 3.6
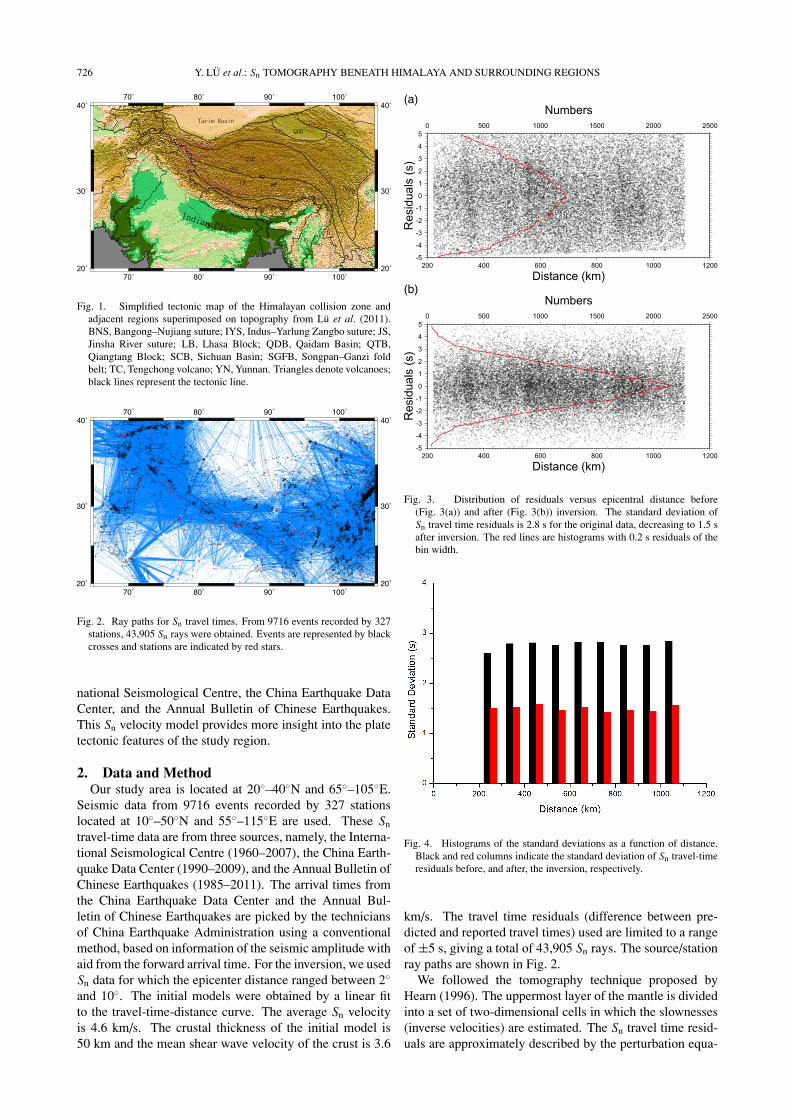
Fig. 3. Distribution of residuals versus epicentral distance before(Fig. 3(a)) and after (Fig. 3(b)) inversion. The standard deviation ofSn travel time residuals is 2.8 s for the original data, decreasing to 1.5 safter inversion. The red lines are histograms with 0.2 s residuals of thebin width.
Fig. 4. Histograms of the standard deviations as a function of distance.Black and red columns indicate the standard deviation of Sn travel-timeresiduals before, and after, the inversion, respectively.
km/s. The travel time residuals (difference between pre-dicted and reported travel times) used are limited to a rangeof ±5 s, giving a total of 43,905 Sn rays. The source/stationray paths are shown in Fig. 2.
We followed the tomography technique proposed byHearn (1996). The uppermost layer of the mantle is dividedinto a set of two-dimensional cells in which the slownesses(inverse velocities) are estimated. The Sn travel time resid-uals are approximately described by the perturbation equa-
Y. LU et al.: Sn TOMOGRAPHY BENEATH HIMALAYA AND SURROUNDING REGIONS 727
tion:ti j = ai + b j +
∑di jk Sk, (1)
where ti j is the travel-time residual for event j and stationi , ai is the static delay for station i , b j is the static delayfor event j , di jk is the travel distance of ray i j in man-tle cell k, and Sk is the slowness perturbation for cell k.The average velocity V is obtained by fitting the travel timeand epicentral distance. The velocity perturbation is givenby −V × V × Sk . The unknown quantities in Eq. (1) arethe mantle slowness perturbation Sk , the station delay ai ,and the event delay b j . The station and event delays ac-commodate variations in crustal velocity and thickness, aswell as source uncertainties. In solving the set of travel-time equations, we use a cell size of 30′ × 30′. The slow-ness values in each cell are resolved by the LSQR algorithm(Paige and Saunders, 1982; Yao et al., 1999). A dampingconstant of 600 is used to control the smoothness of thevelocity image by damping the slowness variations. Therms residuals of the Sn travel times decrease from 2.8 s to1.5 s after inversion (Figs. 3 and 4). Compared with Pn
anisotropy, the anisotropy of the Sn wave is more compli-cated due to the presence of shear-wave splitting, whichcannot be expressed by the Pn velocity and anisotropy in-version method. Only the Sn velocity tomographic modelis used in the present study. According to research into thePn velocity and anisotropy joint inversion (Lu et al., 2012),although the two velocity models are slightly different indetails depending on whether, or not, anisotropy is consid-ered, the major velocity pattern variations are similar.
3. Checkerboard TestCheckerboard tests were conducted to evaluate the effects
of ray coverage on the spatial resolution. A test checker-board velocity model was created by assigning sinusoidalSn velocity anomalies to the cells of the model. The av-erage amplitude (max �v/
√2) of the sinusoidal velocity is
0.2 km/s. Synthetic arrival times were calculated for the testmodel under different checkerboard sizes of velocity withthe same number of earthquakes, stations, and ray paths asthose used in the tomographic inversion of the real data.Gaussian noise with a standard deviation of 1.5 s (equal tothe rms residuals after inversion) was added to the synthetictravel times and noise with a standard deviation of 15 kmwas added to the event locations to perform the pick errors,source uncertainties, and other noises (Pei and Chen, 2012).Figure 5 shows the checkerboard test results. The tests in-dicate that, for most of the study area, 3◦ × 3◦ cells for Sn
velocity can be resolved well. The ray coverage is high atthe Himalayan collision zone, the eastern and western Hi-malayan syntaxis, and surrounding regions, and the spatialresolution there can reach 2.5◦ × 2.5◦, or even better. Ourspatial resolution is considered to be good for the focus ar-eas and better than a previous study (Pei et al., 2007).
4. Results and DiscussionFigure 6 shows the station delays after inversion using
real data. The station delay terms are related to crustalthickness, crustal velocity, and surface geology. However,the crustal thickness is the dominant factor that affects thestation delays. We can see that in areas with thick crusts,
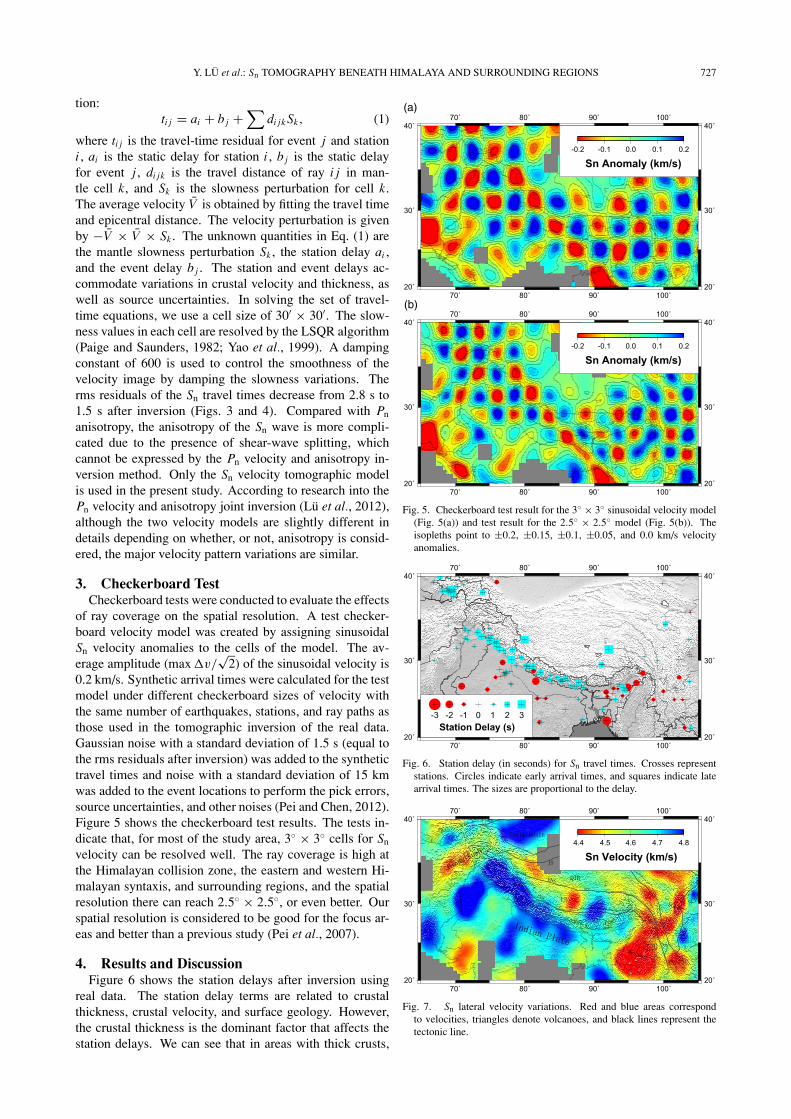
Fig. 5. Checkerboard test result for the 3◦ × 3◦ sinusoidal velocity model(Fig. 5(a)) and test result for the 2.5◦ × 2.5◦ model (Fig. 5(b)). Theisopleths point to ±0.2, ±0.15, ±0.1, ±0.05, and 0.0 km/s velocityanomalies.
Fig. 6. Station delay (in seconds) for Sn travel times. Crosses representstations. Circles indicate early arrival times, and squares indicate latearrival times. The sizes are proportional to the delay.
Fig. 7. Sn lateral velocity variations. Red and blue areas correspondto velocities, triangles denote volcanoes, and black lines represent thetectonic line.
728 Y. LU et al.: Sn TOMOGRAPHY BENEATH HIMALAYA AND SURROUNDING REGIONS
such as the Tibetan Plateau and Pamir, the station delaysare generally positive. In areas with thinner crusts, suchas the Ganges Plain, etc., the station delays are negative.The station and event delays accommodate variations incrustal velocity and thickness and source uncertainties inthe inversion.
Figure 7 shows the Sn velocity variations in the studyarea. The average Sn velocity in the region is about 4.6km/s. There are obvious variations in different areas: thevelocity in the Indian plate, Tarim Basin, and Sichuan Basincan reach 4.8 km/s, and that in the Hindu–Kush, Myanmar,Songpan–Ganzi fold belt (SGFB), and north of the Indus–Yarlung Zangbo suture (IYS), can reach 4.4 km/s.
The inversion result shows significant Sn velocity varia-tions around the Himalayan collision zone, the eastern andwestern Himalayan syntaxis, and surrounding regions. LowSn velocities are found in the Myanmar region. Consid-ering the high surface heat flow in this region, we inferthat these low-velocity anomalies are associated with thehigh temperatures or partial melting at the uppermost man-tle (Hearn and Ni, 1994; Hu et al., 2001). The hot materialbackarc upwelling may come from the lithosphere of the In-dian plate which subducted into the upper mantle or deeperpart. A similar situation is found in the Hindu–Kush region,in which the Indian plate subducts to the mantle of this areafrom the southeast (Zang et al., 1992). The low Sn velocityin this area provides more evidence of the subduction.
The collision between the Indian and Eurasian plates inthe Himalayan region is widely accepted, but there are stillmany different opinions regarding the mechanism of thecollision and the subduction. In the inversion result, thenorthward high-velocity area of the Indian plate roughlyreaches the northern part of the IYS, and there are low-Sn-velocity zones in the Lhasa and Qiangtang blocks. Thelow-velocity anomaly in the western Qiangtang block wasalso obtained by previous studies, but the velocity distribu-tion of the Lhasa block is different (Hearn et al., 2004; Peiet al., 2007). The ray coverage of the dataset of the pre-vious study is not good and the resolution is low. Betterray path coverage and spatial resolution suggest that our re-sult is plausible. The INDEPTH-III study proposed that theIndian lithosphere stretches northward, and that the lowerlithosphere subducts into the mantle under 32◦N by a largerangle (Zhao et al., 2004). The numerical calculation resultsof the two-dimensional thermal structure of the lithosphereshow that the temperature of the Moho in this area is high,and that the lithosphere reaches the temperature of partialmelting (Zhou, 2000). The INDEPTH-IV study interpretedeither a piece of Lhasa Terrane or remnant oceanic slab un-derthrust below northern Tibet (Yue et al., 2012). Our in-version results support the idea that the uppermost mantle ofthe Lhasa and western Qiangtang blocks has high temper-atures or partial melting, which causes the low Sn velocity.This phenomenon may be related to the hot material up-welling caused by the subduction of the Indian lithosphere.This result can explain the serious attenuation of the S wavein the Qiangtang block (Ni and Barazangi, 1983; Rapine etal., 1997). It is also consistent with Lg attenuation, lowP wave velocity, low Q value, low resistivity, and othergeophysical observations in this region (McNamara et al.,
1995; Wittlinger et al., 1996; Fan and Lay, 2002; Unsworthet al., 2005). The east–west variability of the Sn velocitybeneath southern Tibet indicates that the underthrusted In-dian continental lithosphere is not a homogeneous body butrather in a piecewise manner. This conjecture is consistentwith those of other researchers (Lu et al., 2011; Liang et al.,2012). A high Sn velocity is found in the Tarim and SichuanBasins, which have a cold lithosphere and stable tectonics.A significantly low Sn velocity is found at the Songpan-Ganzi orogenic belt. This finding is consistent with the re-sults of P-wave inversion in previous studies (Liang andSong, 2006; Liang et al., 2011). At the edge of the presentstudy area, the inversion resolution is limited by sparse raycoverage and the results are not discussed.
A comparison of the Sn velocity distribution withpreviously-obtained Pn tomography results (Lu et al., 2011)reveals that the high- and low-velocity anomaly areas of theSn and Pn waves are consistent. Tectonically stable areassuch as the Tarim Basin, the Sichuan Basin, and the Indianplate, have high Pn and Sn velocities. The Hindu-Kush andMyanmar regions, as well as the Songpan-Ganzi orogenicbelt, have low Pn and Sn velocities. Given that two indepen-dent data sets of the inversion of the Pn and Sn travel-timedata yield similar results which coincide with each other,the credibility of the inversion results is confirmed. In re-gions with low Pn velocities, a low Sn velocity is more obvi-ous, showing that the shear wave velocity is more sensitiveto the influence of temperature and pressure conditions. TheSn model of the China region obtained by Pei et al. (2007)showed low velocity anomalies at Yunnan, SGFB, and thewestern Qiangtang block, and a high velocity anomaly atSichuan Basin which are similar to our model. The velocityanomaly at the Lhasa block, and the high velocity of Indiaand low velocity of the Hindu–Kush region of our model,were not obtained by the previous study.
There is only minimal heat flow data observed in theTibetan Plateau region. In the compilation of heat flowdata in the China continental area (Wang and Huang, 1990),the measured value of the terrestrial heat flow within thevicinity of the Tibet 90◦E area is larger than the averagevalue in China. However, the Sn velocity of this area is high.We infer that this area can be represented with a tectonicmodel of a hot crust and a cold mantle. The surface heatflow may not come from the mantle but from the crust. Thedifference between the thermal tectonics of the crust andupper mantle suggests a potential decoupling between thecrust and upper mantle. It also supports the idea that crustalmaterial flow may occur in this region (Bai et al., 2010;Zhang et al., 2010b).
5. ConclusionsWe imaged Sn velocity variations beneath the Himalayan
collision zone and the surrounding regions using seismictravel-time data. The average Sn velocity in the study areais 4.6 km/s. The maximum velocity perturbation is approx-imately 0.2 km/s. High-velocity structures are found underthe Indian plate, Tarim Basin, and Sichuan Basin, whereaslow Sn velocities are found beneath the Myanmar region,the Hindu Kush region, and the Lhasa block and Qiang-tang block. A comparison of the Sn velocity distribution
Y. LU et al.: Sn TOMOGRAPHY BENEATH HIMALAYA AND SURROUNDING REGIONS 729
with previously obtained Pn tomography results reveals thatthe high- and low-velocity anomaly areas of the Sn and Pn
waves are consistent. The low Sn velocity anomalies aremore obvious than the Pn ones. Our results support theidea that the lithosphere of the Indian plate subducted intothe mantle and caused hot material upwelling. The low-velocity anomalies are due to the high temperature or par-tial melting at the uppermost mantle. The high Sn velocityanomalies of the Indian Plate and the low anomalies in theTibetan Plateau are discontinuous in the east–west direc-tion, indicating that the Indian plate probably subducts ina piecewise manner. The difference between the thermaltectonics of the crust and upper mantle in southern Tibetsupports the idea that crustal material flow may occur inthis region. The Sn velocity tomography result provides aseismological basis for the study of plate tectonics and geo-dynamic processes in this region.
Acknowledgments. We thank Professor Thomas Hearn for pro-viding the original tomographic codes. We appreciate the insight-ful suggestions by two reviewers and the associate editor. All fig-ures were prepared using the Generic Mapping Tolls (Wessel andSmith, 1998). This study was supported by the China Postdoc-toral Science Foundation 2012M510043 and 2013T60166, the Na-tional Nature Science Foundation of China (Grant Nos. 41074031,40940021, 41174036), the China Earthquake Program 200808078and the CAS/SAFEA International Partnership Program for Cre-ative Research Teams (Grant No. KZZD-EW-TZ-05).
ReferencesBai, D., M. Unsworth, M. Meju, X. Ma, J. Teng et al., Crustal deformation
of the eastern Tibetan plateau revealed by magnetotelluric imaging, Nat.Geosci., 3, 358–362, doi:10.1038/ngeo830, 2010.
Ding, L., P. Kapp, D. Zhong, and W. Deng, Cenozoic volcanism in Tibet:Evidence for a transition from oceanic to continental subduction, J.Petrol., 44(10), 1833–1865, doi:10.1093/petrology/egg061, 2003.
Fan, G. and T. Lay, Characteristics of Lg attenuation in the Tibetan Plateau,J. Geophys. Res., 107(B10), 2256, doi:10.1029/2001JB000804, 2002.
Goes, S., R. Govers, and P. Vacher, Shallow mantle temperatures underEurope from P and S wave tomography, J. Geophys. Res., 105(B5),11153–11169, 2000.
Hearn, T., Anisotropic Pn tomography in the western United States, J.Geophys. Res., 101, 8403–8414, 1996.
Hearn, T. and J. Ni, Pn velocities beneath continental collision zones, theTurkish-Iranian plateau, Geophys. J. Int., 117, 273–283, 1994.
Hearn, T., S. Wang, J. Ni, Z. Xu, Y. Yu, and X. Zhang, Uppermost mantlevelocities beneath China and surrounding regions, J. Geophys. Res.,109, B11301, doi:10.1029/2003JB002874, 2004.
Hu, S., L. He, and J. Wang, Compilation of heat flow data in the Chinacontinental area (3rd edition), Chinese J. Geophys., 44(5), 611–626,2001.
Huang, J. and D. Zhao, High-resolution mantle tomography ofChina and surrounding regions, J. Geophys. Res., 111, B09305,doi:10.1029/2005JB004066, 2006.
Kind, R., X. Yuan, J. Saul, D. Nelson, S. V. Sobolev, J. Mechie, W. Zhao,G. Kosarev, J. Ni, U. Achauer, and M. Jiang, Seismic images of crust andupper mantle beneath Tibet: Evidence for Eurasian plate subduction,Science, 298, 1219–1221, 2002.
Liang, C. and X. Song, A low velocity belt beneath northern and easternTibetan Plateau from Pn tomography, Geophys. Res. Lett., 33, L22306,doi:10.1029/2006GL027926, 2006.
Liang, C., X. Song, and J. Huang, Tomographic inversion of Pn travel timesin China, J. Geophys. Res., 109, B11304, doi:10.1029/2003JB002789,2004.
Liang, X., Y. Shen, Y. Chen, and Y. Ren, Crustal and mantle velocitymodels of southern Tibet from finite frequency tomography, J. Geophys.Res., 116, B02408, doi:10.1029/2009JB007159, 2011.
Liang, X., E. Sandvol, Y. Chen, T. Hearn, J. Ni, S. Klemperer, Y. Shen,and F. Tilmann, A complex Tibetan upper mantle: A fragmented Indianslab and no south-verging subduction, Earth Planet. Sci. Lett., 333–334,
101–111, 2012.Lu, Y., S. Ni, B. Liu, and Y. Sun, Pn tomographic velocity and anisotropy
beneath the Tibetan Plateau and the adjacent regions, Earth PlanetsSpace, 63(11), 1169–1173, doi:10.5047/eps.2011.07.013, 2011.
Lu, Y., B. Liu, S. Pei, Y. Sun, M. Toksoz, and X. Zeng, Pn tomographicvelocity and anisotropy beneath the Iran region, Bull. Seismol. Soc. Am.,102(1), 426–435, doi:10.1785/0120100141, 2012.
McNamara, D., T. Owens, and W. Walter, Observations of regional phasepropagation across the Tibetan plateau, J. Geophys. Res., 100, 22215–22229, 1995.
Molnar, P. and P. Tapponnier, Cenozoic tectonics of Asia: Effects of acontinental collision, Science, 189, 419–426, 1975.
Ni, J. and M. Barazangi, High-frequency seismic wave propagation be-neath the Indian Shield, Himalayan Arc, Tibetan Plateau and surround-ing regions: High uppermost mantle velocity and efficient Sn propaga-tion beneath Tibet, Geophys. J. R. Astron. Soc., 72, 665–689, 1983.
Nolet, G. and A. Ziehuis, Low S velocities under the Tomquist Teisseyrezone: Evidence for water injection into the transition zone by subduc-tion, J. Geophys. Res., 99, 15813–15820, 1994.
Paige, C. and M. Saunders, LSQR, An algorithm for sparse linear equa-tions and sparse linear system, ACM Trans. Math. Software, 8, 43–71,1982.
Pei, S. and Y. Chen, Link between seismic velocity structure and the 2010Ms 7.1 Yushu earthquake, Qinghai, China: Evidence from aftershocktomography, Bull. Seismol. Soc. Am., 102, 445–450, 2012.
Pei, S., J. Zhao, Y. Sun, Z. Xu, S. Wang, H. Liu, C. Rowe, M. Toksoz, andX. Gao, Upper mantle seismic velocities and anisotropy in China deter-mined through Pn and Sn tomography, J. Geophys. Res., 112, B05312,doi:10.1029/2006JB004409, 2007.
Pei, S., Y. Sun, M. Toksoz, Y. Chen, X. Gao, Z. Wang, J. Zhao, and H. Liu,Imaging poisson’s ratio of the uppermost mantle beneath China, Bull.Seismol. Soc. Am., 101, 1452–1461, 2011a.
Pei, S., Y. Sun, and M. Toksoz, Tomographic Pn and Sn Velocity beneathContinental Collision Zone from Alps to Himalaya, J. Geophys. Res.,116, B10311, doi:10.1029/2010JB007845, 2011b.
Phillips, W., M. Begnaud, C. Rowe, L. Steck, S. Myers, M. Pasyanos,and S. Ballard, Accounting for lateral variations of the upper mantlegradient in Pn tomography studies, Geophys. Res. Lett., 34, L14312,doi:10.1029/2007GL029338, 2007.
Rapine, R., J. Ni, and T. Hearn, Regional wave propagation in China andits surrounding regions, Bull. Seismol. Soc. Am., 87, 1622–1636, 1997.
Ren, Y. and Y. Shen, Finite frequency tomography in southern Tibet: Evi-dence for the causal relationship between mantle lithosphere delamina-tion and the north-south trending rifts, J. Geophys. Res., 113, B10316,doi:10.1029/2008JB005615, 2008.
Sun, Y., M. Toksoz, S. Pei, D. Zhao, F. Morgan, and A. Rosca, S-wavetomography of the crust and uppermost mantle in China, J. Geophys.Res., 113, B11307, doi:10.1029/2008JB005836, 2008.
Teng, J., Z. Yin, H. Liu, Z. Zhang, J. Hu, K. Sun, and J. Wei, The 2D and3D lithosphere structure and continental dynamics of Qinghai-XizangPlateau, Chinese J. Geophys., A02, 117–130, 1994.
Teng, J., Z. Zhang, G. Wang, H. Liu, J. Hu et al., The deep internaldynamical processes and new model of continental-continental collisionin Himalayan collision orogenic zone, Chinese J. Geophys., 42(4), 481–494, 1999.
Unsworth, M., A. Jones, W. Wei, G. Marquis, S. Gokarn, and J. Spratt,Crustal rheology of the Himalaya and southern Tibet inferred from mag-netotelluric data, Nature, 438, 78–81, doi:10.1038/nature04154, 2005.
Wang, J. and S. Huang, Compilation of heat flow data in the China conti-nental area (2nd edition), Seismol. Geol., 12(4), 351–366, 1990.
Wang, Q., P. Zhang, J. Freymueller, R. Bilham, K. Larson et al., Present-day crustal deformation in China constrained by global positioning sys-tem measurements, Science, 294, 574–577, 2001.
Wessel, P. and W. Smith, New, improved version of Generic MappingTools released, Eos Trans. AGU, 79(47), 579, 1998.
Wittlinger, G., F. Masson, G. Poupinet, P. Tapponnier, J. Mei et al., Seismictomography of northern Tibet and Kunlun: Evidence for crustal blocksand mantle velocity contrasts, Earth Planet. Sci. Lett., 139, 263–279,1996.
Xu, G., H. Yao, L. Zhu, and Y. Shen, Shear wave velocity structure of thecrust and upper mantle in western China and its adjacent area, ChineseJ. Geophys., 50(1), 193–208, 2007.
Yao, Z., R. Roberts, and A. Tryggvason, Calculating resolution and covari-ance matrices for seismic tomography with the LSQR method, Geophys.J. Int., 138, 886–894, 1999.
Yue, H., Y. Chen, E. Sandvol, J. Ni, T. Hearn et al., Lithospheric and upper
730 Y. LU et al.: Sn TOMOGRAPHY BENEATH HIMALAYA AND SURROUNDING REGIONS
mantle structure of the northeastern Tibetan Plateau, J. Geophys. Res.,117, B05307, doi:10.1029/2011JB008545, 2012.
Zang, S., Z. Wu, and J. Ning, The interaction of plates around China andits effect on the stress field in China, part II: The influence of IndianPlate, Chinese J. Geophys., 35(4), 428–440, 1992.
Zeng, R., Z. Ding, Q. Wu, and J. Wu, Seismological evidences for themultiple incomplete crustal subductions in Himalaya and southern Ti-bet, Chinese J. Geophys., 43(6), 780–797, 2000.
Zhang, Z. and S. Klemperer, Crustal structure of the Tethyan Himalaya,southern Tibet: New constraints from old wide-angle seismic data, Geo-phys. J. Int., 181, 1247–1260, doi:10.1111/j.1365-246X.2010.04578.x,2010.
Zhang, Z., Y. Deng, J. Teng, C. Wang, R. Gao, Y. Chen, and W. Fan,An overview of the crustal structure of the Tibetan plateau after 35years of deep seismic soundings, J. Asian Earth Sci., 40, 977–989,doi:10.1016/j.jseaes.2010.03.010, 2010a.
Zhang, Z., X. Yuan, Y. Chen, X. Tian, R. Kind, X. Li, and J. Teng,Seismic signature of the collision between the east Tibetan escapeflow and the Sichuan Basin, Earth Planet. Sci. Lett., 292, 254–264,doi:10.1016/j.epsl.2010.01.046, 2010b.
Zhang, Z., S. Klemperer, Z. Bai, Y. Chen, and J. Teng, Crustal structureof the Paleozoic Kunlun orogeny from an active-source seismic profilebetween Moba and Guide in East Tibet, China, Gondwana Res., 19(4),994–1007, 2011.
Zhao, D., Global tomographic images of mantle plumes and subductingslabs: Insight into deep Earth dynamics, Phys. Earth Planet. Inter., 146,3–34, 2004.
Zhao, W., G. Xue, Z. Wu, X. Zhao, K. Liu et al., Fine velocity structure ofthe upper mantle beneath the Xizang Plateau from tomography and itsgeological interpretations, Chinese J. Geophys., 47(3), 449–458, 2004.
Zheng, H., T. Li, R. Gao, D. Zhao, and R. He, Teleseismic P-wave tomog-raphy evidence for the Indian lithospheric mantle subducting northwardbeneath the Qiangtang terrane, Chinese J. Geophys., 50(5), 1418–1426,2007.
Zhou, H., Progress on studies of rheological dynamics of continental litho-sphere, Earth Sci. Frontiers, 7, 121–127, 2000.