s-wave superconductivity phase diagram in the inhomogeneous two-dimensional attractiveHubbard model
K. Aryanpour,1,2 T. Paiva,3 W. E. Pickett,1 and R. T. Scalettar1
1Department of Physics, University of California, Davis, California 95616, USA2Department of Physics, SUNY at Buffalo, Buffalo, New York, 14260, USA
3Departamento de Fisica dos Sólidos, Instituto de Física, Universidade Federal do Rio de Janeiro, Cx.P. 68528, 21945-970,Rio de Janeiro, RJ, Brazil
�Received 2 August 2007; published 30 November 2007�
We study s-wave superconductivity in the two-dimensional square-lattice attractive Hubbard Hamiltonianfor various inhomogeneous patterns of interacting sites. Using the Bogoliubov–de Gennes mean-field approxi-mation, we obtain the phase diagram for inhomogeneous patterns in which the on-site attractive interaction Ui
between the electrons takes on two values Ui=0 and −U / �1− f� �with f the concentration of noninteractingsites� as a function of average electron occupation per site, n, and study the evolution of the phase diagram asf varies. In certain regions of the phase diagram, inhomogeneity results in a larger zero-temperature averagepairing amplitude �order parameter� and also a higher superconducting critical temperature Tc, relative to auniform system with the same mean interaction strength �Ui=−U on all sites�. These effects are observed forstripes, checkerboard, and even random patterns of the attractive centers, suggesting that the pattern of inho-mogeneity is unimportant. The phase diagrams also include regions where superconductivity is obliterated dueto the formation of various charge-ordered phases. The enhancement of Tc due to inhomogeneity is robust aslong as the electron doping per site, n, is less than twice the fraction of interacting sites �2�1− f�� regardless ofthe pattern. We also show that for certain inhomogeneous patterns, when n=2�1− f�, increasing temperaturecan work against the stability of existing charge-ordered phases for large f and, as a result, enhance Tc.
Fascination with inhomogeneous superconducting �SC�phases extends back several decades, with many conferencesand monographs having been devoted to the subject.1–3 Forconventional superconductors, the inhomogeneities were ex-trinsic, arising from a granular nature of samples or due tothe deliberate synthesis of disordered-built materials or films.The high-temperature superconductors �HTSs� introducednew aspects into this area of study. First, inhomogeneousstates �normal and SC� seem to be intrinsic to HTSs, at leastin the underdoped regime, similar to quenched disorder inthe metal-insulator transition in two dimensions �2D�.4,5 Sec-ond, the inhomogeneity occurs on a smaller length scale ofjust a few lattice constants as evidenced by scanning tunnel-ing spectroscopy �STS� at the nanoscale.6–9
In addition, the strong electronic correlation in HTS cu-prates plays a major role in the elucidation of the inhomoge-neous SC state; indeed, the inhomogeneity is widely believedto arise from the strong intra-atomic interactions that tend tofrustrate bandlike conduction, to induce local magnetic mo-ments, and to drive charge and spin order on a few latticeconstant scale. The study of the doped Mott insulating phasehas been one of the most active areas of theoretical study ofHTSs, one that has proven to be unexpectedly complex andrich and which is still under intense exploration and debate.Surprisingly, holes doped into the high-temperature super-conductors tend to arrange themselves nonuniformly in theCuO2 planes in the form of stripes, checkerboard, or perhapseven more exotic structures.10–14 Moreover, spatially varyingdensity and spin structures have also been observed in thephysics of the manganites15–18 and cobaltites.19,20
A variety of physically relevant models such as the repul-sive Hubbard and t-J Hamiltonians have been extensivelystudied to understand the interplay between spatial inhomo-geneity, magnetism, and superconductivity.21–40 In the repul-sive Hubbard and t-J Hamiltonians in particular, inhomoge-neity has been introduced either through the hoppingamplitude t or magnetic coupling J or the local energy on thelattice sites. For the 2D square lattice these two models areknown to display antiferromagnetism at half-filling and, al-though it is less certain, perhaps also d-wave superconduc-tivity when doped. There is considerable evidence that theyalso might possess inhomogeneous stripe or checkerboardground states.24–28,30,31,33,34 Phenomenological d-wave BCSHamiltonians with spatially inhomogeneous pairingamplitude41–43 or lattice site energy43,44 have also been em-ployed mostly to reproduce the local density of states�LDOS� results obtained from scanning tunneling micros-copy �STM�.45 In addition, there have been theoretical stud-ies of the SC quantum phase fluctuations using the QED3effective theory of the HTSs in relation with the inhomoge-neous pattern formation in cuprates from the STM experi-mental results.46,47
While density matrix renormalization group �DMRG�treatments24 provide detailed information on the real-spacecharge, spin, and pairing orders, the precise nature of theinterplay, and whether the different orders compete or coop-erate, remains unclear. In addition, the enhancement of thesuperconducting transition temperature Tc by local inhomo-geneity has been demonstrated by Martin et al. in Ref. 48and also in Ref. 49. Recently, the XY model Hamiltonianwith certain types of inhomogeneous patterns for thecoupling constant between spins sitting on two nearest-
neighboring sites has also been shown to enhance Tc by Lohand Carlson in Ref. 50.
Many of the basic characteristics of this short-range-scaleinhomogeneous superconducting state can be addressed witha more tractable model, one which is well understood in thehomogeneous limit. This model is the attractive Hubbardmodel, which has been applied previously to address someaspects of the impact of inhomogeneity. Recently old sugges-tions based on “negative-U” superconductivity have beenrevived,49,51 which may provide additional applications forthe results we present in this paper. Tl-doped PbTe achievesa critical temperature up to 1.5 K, and more extensive heatcapacity and transport data52,53 have led to an analysis interms of a “charge Kondo effect” that could be linked to theobserved superconductivity.54 This system intrinsically in-volves both negative-U centers and inhomogeneity.
This article extends previous work49 to a more generalrange of noninteracting site concentration f values. We showthe presence of different conduction phases both in the phasediagram at T=0 and in the density of states �DOS�. We alsoshow the local occupation and SC order parameter for elec-trons on different lattice sites as the concentration f variesfor different inhomogeneity patterns. Finally, the Tc enhance-ment conditions are also extracted based on the relationshipbetween the average doping of electrons, n, on the lattice andinhomogeneity concentration f .
The paper is organized as follows: in the next section weintroduce our model and describe the method we have em-ployed. In Sec. III we present and discuss the phase diagramat zero temperature. Section IV contains our finite-temperature results, and Sec. V summarizes our findings.
II. MODEL AND METHODOLOGY
This article focuses on a general question: Under whatconditions is it more favorable to have an inhomogeneouspairing attraction, compared to the same average strengthspread homogeneously over the lattice? By “conditions” werefer to the average occupation number of electrons per site,
n; the average attraction strength per lattice site, U, whichremains constant in any comparison between systems withand without inhomogeneity; and the inhomogeneity concen-tration f . We address this question by comparing the average
zero-temperature pairing amplitude � over the entire latticeand the SC transition temperature Tc for a system in thepresence and absence of inhomogeneity.
For the cuprate superconductors, for example, such aquestion is complicated by the presence of other types oforder such as antiferromagnetism and exotic spin-gap phasesand by the nontrivial d-wave symmetry of the SC order pa-rameter. For these systems and phenomena, models like therepulsive Hubbard or t-J Hamiltonians are essential.21–38
Nevertheless, it is yet beneficial to study the problem first byemploying a more simple and phenomenological model.Here we will present a solution of the inhomogeneousBogoliubov–de Gennes �BdG� equations for the attractiveHubbard Hamiltonian,
H = − t ��ij�,�
�ci�† cj� + cj�
† ci�� − ��i�
ci�† ci� − �
i
�Ui�ni↑ni↓,
�1�
with t the hopping amplitude, � the chemical potential, andUi the local attractive interaction between the fermions ofopposite spins residing on the same lattice site i. We willstudy inhomogeneous patterns in the interaction Ui. The ori-gin of the attraction in this model can result from, for ex-ample, integrating out a local phonon mode.55 The two-dimensional uniform attractive Hubbard model is known toyield degenerate superconductivity and charge-density-wave�CDW� long-range order at half-filling and zerotemperature.56–58 However, away from half-filling, the CDWpairing symmetry is broken and superconductivity is morefavorable, and the SC phase transition is at finite tempera-ture.
The BdG mean-field decomposition bilinearizes theHamiltonian by replacing the local pairing amplitude andlocal density by their average values, �i= �ci↑ci↓� and �ni��= �ci�
† ci�� and yields the quadratic effective Hamiltonian
Hef f = − t ��ij�,�
�ci�† cj� + cj�
† ci,�� − �i�
�ici�† ci� − �
i
�Ui�
���ici↑† ci↓
† + �i*ci↓ci↑� , �2�
where �i=�+ �Ui��ni� /2 includes a site-dependent Hartreeshift with �ni�=���ni��. All energies will be referenced to t=1.
We adopt the criterion of comparing the tendency for su-perconductivity in the homogeneous system with the sameattraction −U on all lattice sites, with cases when sites withattraction are mixed with sites where the attraction isabsent—i.e., Ui=0.48,59,60 Specifically, we have studied sys-tems in which sites with attractive interaction are randomlydistributed59 or arranged in checkerboard and stripe patterns.The last two regular patterns have been purposely chosendue to their relevance to the experimentally observed patternformation in the HTS cuprates.
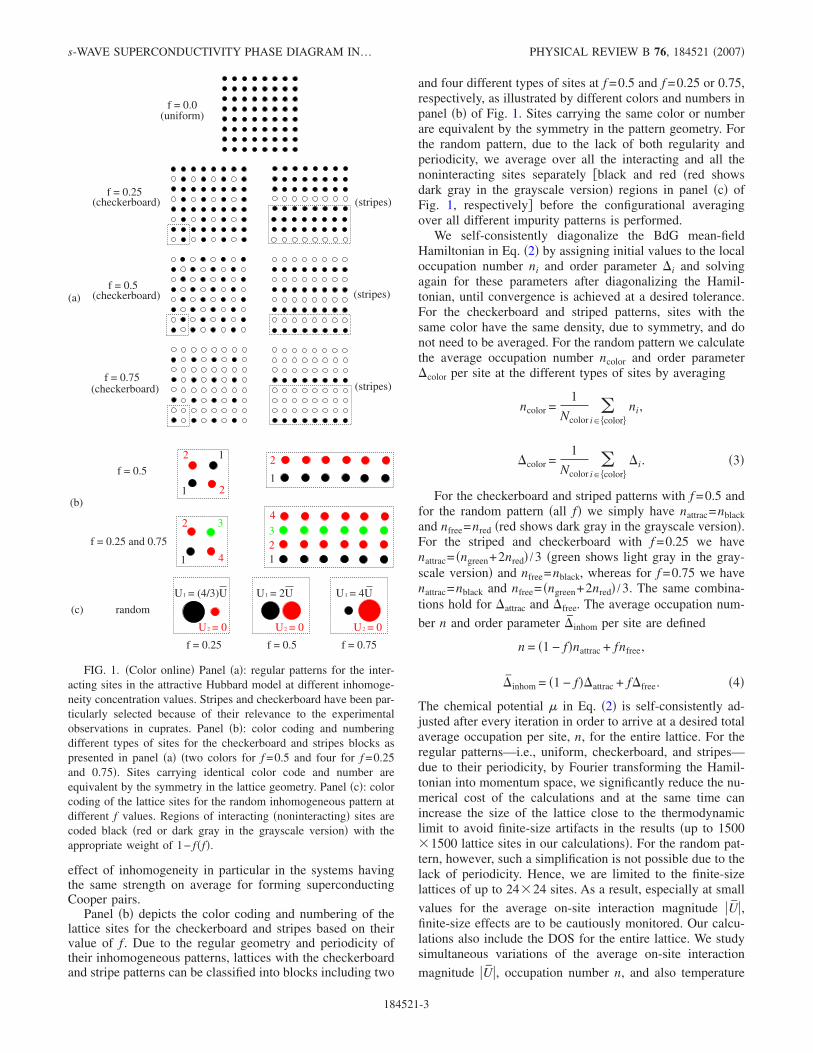
Figure 1, panel �a�, presents the patterns for the interact-ing lattice sites with four different values for the fraction ofnoninteracting sites, f . The uniform pattern corresponds to
f =0 with interaction Ui= U=−U on all lattice sites. Check-erboard, stripes, and random patterns with f =0.25 include
1− f =75% interacting sites with Ui=43U=− 4
3U and f =25%noninteracting sites with Ui=0. For f =0.5, half of the sitesare interacting with Ui=−2U and half noninteracting withUi=0. f =0.75 corresponds to 25% interacting sites with Ui=−4U and 75% noninteracting sites with Ui=0, once again
averaging to U=−U per site.For the random pattern we have averaged over typically
20 different disorder realizations. One may note that regard-less of the pattern and the impurity fraction, the average
attraction per site—i.e., U=−U—remains constant. We adoptthis criterion throughout the rest of this article for compari-son between uniform and inhomogeneous lattices. This cri-terion is believed to be most appropriate for exhibiting the
ARYANPOUR et al. PHYSICAL REVIEW B 76, 184521 �2007�
184521-2
effect of inhomogeneity in particular in the systems havingthe same strength on average for forming superconductingCooper pairs.
Panel �b� depicts the color coding and numbering of thelattice sites for the checkerboard and stripes based on theirvalue of f . Due to the regular geometry and periodicity oftheir inhomogeneous patterns, lattices with the checkerboardand stripe patterns can be classified into blocks including two
and four different types of sites at f =0.5 and f =0.25 or 0.75,respectively, as illustrated by different colors and numbers inpanel �b� of Fig. 1. Sites carrying the same color or numberare equivalent by the symmetry in the pattern geometry. Forthe random pattern, due to the lack of both regularity andperiodicity, we average over all the interacting and all thenoninteracting sites separately �black and red �red showsdark gray in the grayscale version� regions in panel �c� ofFig. 1, respectively� before the configurational averagingover all different impurity patterns is performed.
We self-consistently diagonalize the BdG mean-fieldHamiltonian in Eq. �2� by assigning initial values to the localoccupation number ni and order parameter �i and solvingagain for these parameters after diagonalizing the Hamil-tonian, until convergence is achieved at a desired tolerance.For the checkerboard and striped patterns, sites with thesame color have the same density, due to symmetry, and donot need to be averaged. For the random pattern we calculatethe average occupation number ncolor and order parameter�color per site at the different types of sites by averaging
ncolor =1
Ncolor�
i�colorni,
�color =1
Ncolor�
i�color�i. �3�
For the checkerboard and striped patterns with f =0.5 andfor the random pattern �all f� we simply have nattrac=nblackand nfree=nred �red shows dark gray in the grayscale version�.For the striped and checkerboard with f =0.25 we havenattrac= �ngreen+2nred� /3 �green shows light gray in the gray-scale version� and nfree=nblack, whereas for f =0.75 we havenattrac=nblack and nfree= �ngreen+2nred� /3. The same combina-tions hold for �attrac and �free. The average occupation num-
ber n and order parameter �inhom per site are defined
n = �1 − f�nattrac + fnfree,
�inhom = �1 − f��attrac + f�free. �4�
The chemical potential � in Eq. �2� is self-consistently ad-justed after every iteration in order to arrive at a desired totalaverage occupation per site, n, for the entire lattice. For theregular patterns—i.e., uniform, checkerboard, and stripes—due to their periodicity, by Fourier transforming the Hamil-tonian into momentum space, we significantly reduce the nu-merical cost of the calculations and at the same time canincrease the size of the lattice close to the thermodynamiclimit to avoid finite-size artifacts in the results �up to 1500�1500 lattice sites in our calculations�. For the random pat-tern, however, such a simplification is not possible due to thelack of periodicity. Hence, we are limited to the finite-sizelattices of up to 24�24 sites. As a result, especially at small
values for the average on-site interaction magnitude �U�,finite-size effects are to be cautiously monitored. Our calcu-lations also include the DOS for the entire lattice. We studysimultaneous variations of the average on-site interaction
magnitude �U�, occupation number n, and also temperature
2
1
234
1
(a)
(b)
12
21
32
1
f = 0.5
(uniform)
(checkerboard)
(checkerboard)
(checkerboard)f = 0.75
f = 0.5
f = 0.25
f = 0.0
(stripes)
(stripes)
(stripes)
random(c)
f = 0.75f = 0.5f = 0.25
4
f = 0.25 and 0.75
2U = 0 2
U = 4U1
U = 0 U = 02
U = (4/3)U1 U = 2U1
FIG. 1. �Color online� Panel �a�: regular patterns for the inter-acting sites in the attractive Hubbard model at different inhomoge-neity concentration values. Stripes and checkerboard have been par-ticularly selected because of their relevance to the experimentalobservations in cuprates. Panel �b�: color coding and numberingdifferent types of sites for the checkerboard and stripes blocks aspresented in panel �a� �two colors for f =0.5 and four for f =0.25and 0.75�. Sites carrying identical color code and number areequivalent by the symmetry in the lattice geometry. Panel �c�: colorcoding of the lattice sites for the random inhomogeneous pattern atdifferent f values. Regions of interacting �noninteracting� sites arecoded black �red or dark gray in the grayscale version� with theappropriate weight of 1− f�f�.
and their effects in the average order parameter �inhom andDOS. Our goal is to obtain the phase diagram for the effectof inhomogeneity in superconductivity and discuss the con-ditions under which inhomogeneity can result in enhance-ments in the average superconductivity order parameter orSC phase transition temperature Tc.
It is further realized that our conventional mean-field ap-proach does not capture the Kosterlitz-Thouless nature of thephase transition in two dimensions. Nevertheless, this weak-ness can be repaired61 upon regarding the local pairing am-plitudes as complex variables and performing a finite-temperature Monte Carlo integration over the associatedamplitude and phase degrees of freedom. Unlike BCS, thisMonte Carlo mean-field �MCMF� approach allows identifi-cation of the weak- and strong-coupling regimes via thephase correlation function. In an earlier work49 this MonteCarlo technique was employed as an independent examina-tion for the validity of our results and the agreement betweenthe two techniques was clearly confirmed.
III. PHASE DIAGRAM AT T=0
Figure 2 presents the phase diagram for the average inter-
action magnitude �U� and electron doping n per site at T=0for three different inhomogeneous patterns of checkerboard,stripes, and random and for f values of 0.25, 0.5, and 0.75.
We show isocontours of r= �inhom /�uniform—i.e., the ratio ofthe average inhomogeneous pattern order parameter over itsuniform pattern counterpart. Thus, whenever r�1, inhomo-geneity leads to a larger average order parameter at T=0compared to a homogeneous system and therefore is morefavorable for superconductivity over a uniform pattern of the
interacting sites. We also adopt the lower limit of �U�= t,
since for smaller values of �U�, r will be the ratio of two verysmall numbers and is subject to numerical uncertainty. Thefirst row of Fig. 2 �panels �a�–�c�� corresponds to the con-centration value of f =0.25 for the noninteracting sites. Atfirst glance, one can observe that regardless of the geometryfor the inhomogeneity, above n=1.5=2�1− f�, inhomogene-ity gradually �or abruptly for the checkerboard pattern inpanel �a�� results in the obliteration of superconductivityconsistent with the findings of Litak and Györffy59 We canunderstand how this obliteration takes place if we examinethe behavior of the system in strong coupling. When we startwith an empty system and add electrons they are placed onthe attractive sites first due to the strong attractive interac-tions. It is useful to define n*=2�1− f�, which for a given fcorresponds to the density for which all attractive sites aredoubly occupied and all free ones are empty. As we will seebelow, this density corresponds to an insulating charge-ordered state. Above this density, superconductivity is re-duced because the pairs cannot move within the attractivesublattice, since it is completely filled.
For the checkerboard pattern in panel �a�, there are twoinsulating regions within the phase diagram at n=1 and 1.5�hatched orange lines�, both corresponding to the formationof charge-ordered phases of electrons in the interacting sites.No superconductivity was observed for n=1 and 1.5 down to
the lower limit of �U�= t. Beyond n=1.5, the system becomesmetallic. For stripes as shown in panel �b�, similar features asin panel �a� are observed. One exception is the lack of thecharge-ordered insulating phase at n=1. This can be the re-sult of further overlap between the Cooper pairs, since forthe stripes, nearest-neighboring sites are interacting in onedimension. The charge-ordered insulating phase at n=1.5
also forms for rather higher �U� values compared to thecheckerboard pattern. The random pattern in panel �c� alsoshows features similar to the stripes.
The second row �panels �d�–�f�� corresponds to f =0.5with rather similar features to the first row. As anticipated,superconductivity gradually goes away above n=1=n* forall the patterns. For the checkerboard in panel �d� and n�1,superconductivity strictly goes away and the system turnsmetallic. For the striped and random patterns, however, su-perconductivity persists slightly above n=1 until it is totallyobliterated. At n=1, all three inhomogeneous patterns exhibita charge-ordered insulating phase for large enough values of
�U� �or the smallest value of �U� for the checkerboard�. Nev-ertheless, it can be readily seen that for f =0.5 compared tof =0.25, the enhancement of the average order parameter dueto inhomogeneity is considerably larger as the ratio r in-
creases for small �U� values.The third row �panels �g�–�i�� for f =0.75 shows ratios as
large as r=15 for small values of �U� and n values not muchlarger than 0.5=n*. For f =0.75, also, superconductivitygradually dies away when n�0.5=n* and a charge-ordered
phase sets in for large enough �U� values at n=0.5=n* analo-gous to f =0.25 and 0.5. The only difference is a slight rem-nance of superconductivity for the checkerboard pattern atn�0.5. Thus, by further diluting the interacting sites in thelattice and keeping the attractive pairing energy constant atthe same time, superconductivity is driven towards smaller nvalues; on the other hand, the average order parameter be-comes significantly more enhanced due to inhomogeneity.
Generally, regardless of the pattern, for large enough �U� val-ues, inhomogeneity weakens superconductivity for everyvalue of n due to the localization and compression of the
Cooper pairs in the interacting sites. For n�n*, �inhom in-
creases as a function of �U� and saturates for large �U� values.
For n�n*, �inhom reaches a maximum as a function of �U�and eventually vanishes for large enough �U� values. How-
ever, �uniform is a monotonically increasing function of �U�and is symmetric with respect to n=1. Therefore, for suffi-
ciently large �U�, the ratio r= �inhom /�uniform becomes lessthan 1 while n�n* and eventually 0 when n�n* as illus-trated in Fig. 2.
The obliteration of superconductivity is associated with
the vanishing of the average order parameter �inhom=0.Whether a non-SC state is a metal or insulator is determinedby the DOS results for that state. In Fig. 3, panel �a� presents
the DOS results for the checkerboard pattern at �U�=6t �thelargest in our calculations for f =0.25� and four different val-ues for the average electron doping n. There is a gap in the
ARYANPOUR et al. PHYSICAL REVIEW B 76, 184521 �2007�
184521-4
DOS around the Fermi energy at =0 at n=0.4. This gap
corresponds to a SC state as for n=0.4, �inhom�0. The gapsat n=1 and n=1.5 both correspond to insulating states as for
both these n values �inhom=0. At n=1.8, we also find
�inhom=0 according to Fig. 2, panel �a�. However, the DOSat n=1.8 has a finite value around the Fermi energy at =0 as shown in panel �a� of Fig. 3, indicating a metallicstate.
In panels �b� and �c� in Fig. 3 for striped and randompatterns, respectively, gaps at n=1 do not correspond to in-sulating phases as opposed to panel �a� whereas they do cor-
respond to insulators for n=1.5. In the second row of Fig. 3
�panels �d�–�f��, for all the patterns at f =0.5 and �U�=5t �thelargest in our calculations for f =0.5�, the system is supercon-ducting for n�1, insulating for n=1, and metallic for n�1in conjunction with the results of the second row in Fig. 2.
The third row of Fig. 3 �panels �g�–�i��, for f =0.75 and �U�=4t �the largest of our calculations for f =0.75�, confirms theresults presented in Fig. 2 �panels �g�–�i�, respectively�—namely, superconductivity for n�n*, insulator at n=0.5
=n* and large enough �U�, and metal for n=0.65�n* for allinhomogeneous patterns.
0 0.2 0.4 0.6 0.8 1 1.2 1.4 1.6 1.8 2n
0
1
2
3
4
5
6
U
1.75
1.5
1.25
1 0
2
stripes, f = 0.25
1
0.75 0.5
metallic
SC
charge ordered insulator
(b)
0 0.2 0.4 0.6 0.8 1 1.2 1.4 1.6 1.8 2n
0
1
2
3
4
5
6
U
1.751.5
1.25
1 0
random, f = 0.25
0.75 0.5
metallic
SC
(c)
charge ordered insulator
0 0.2 0.4 0.6 0.8 1 1.2 1.4 1.6 1.8 2n
0
1
2
3
4
5
6
U
3
2
1
0
4
random, f = 0.5
1.25
0.5 0.25
metallic
SC
0.75
1.5
(f)
charge ordered insulator
0 0.2 0.4 0.6 0.8 1 1.2 1.4 1.6 1.8 2n
0
1
2
3
4
5
6
U3
2
10
4
stripes, f = 0.5
1.25
0.75 0.5
metallic
SC charge ordered insulator
1.5
(e)
0 0.2 0.4 0.6 0.8 1 1.2 1.4 1.6 1.8 2n
0
1
2
3
4
5
6
U
3
2
1.5
1 0
4
checkerboard, f = 0.5
0.75
metallic
SC charge ordered insulator
0.5
1.25
(d)
0 0.2 0.4 0.6 0.8 1 1.2 1.4 1.6 1.8 2n
0
1
2
3
4
5
6
U
105
1.5
0
15
checkerboard, f = 0.75
1
metallic
SC charge ordered insulator0.75
2
0.5 (g)
0 0.2 0.4 0.6 0.8 1 1.2 1.4 1.6 1.8 2n
0
1
2
3
4
5
6
U
105
1.5
0
15
stripes, f = 0.75
1
metallic
SC charge ordered insulator
0.75
2
0.5 (h)
0 0.2 0.4 0.6 0.8 1 1.2 1.4 1.6 1.8 2n
0
1
2
3
4
5
6
U10
5
1.5
0
random, f = 0.75
1
metallic
SC
0.75
2
0.5
(i)
charge ordered insulator
metallic
0 0.2 0.4 0.6 0.8 1 1.2 1.4 1.6 1.8 2n
0
1
2
3
4
5
6
U
1.75
1.5
1.25
1 0 0
2
checkerboard, f = 0.25
0.75
1
1.51.25
0.75
0.5
metallicSC
SC
charge ordered insulator
(a)
FIG. 2. �Color online� Panel �a�: the contour plot phase diagram for the checkerboard pattern at f =0.25 and T=0. The horizontal axispresents the average occupation of electrons per site n and the vertical axis refers to the average interaction magnitude between two electrons
per site �U�. Lines with numbers next to them correspond to different ratios of r= �checkerboard /�uniform. Solid lines at r=1 determine the
enhancement boundary. Dashes along r=0 lines indicate charge-ordered insulating phase behavior. Dotted lines at �U�= t are lower limits for
the interaction as for too small �U� values, r is an ill-defined quantity. Panel �b�: the same results for stripes with r= �stripes /�uniform at f
=0.25 and T=0. r=0 line for stripes is diverted towards larger n values at smaller �U� and does not run down to arbitrarily small �U� valuesat n=1.5. Dashes along the r=0 line for stripes appear only at n=1.5, and beyond that, r=0 corresponds to a metallic phase. Panel �c�presents results for the random pattern. Similar to the stripes, for the random pattern, the r=0 line does not run down to arbitrarily small �U�values at n=1.5 either. Panels �d�, �e�, and �f� correspond to f =0.5. Note that the charge ordered phases for the striped and random patternsat f =0.5 again occur only at n=1 portion of the r=0 line and beyond that, r=0 yields a metal. Similarly in panels �g�, �h�, and �i�corresponding to f =0.75, all three different inhomogeneous patterns have a r=0 line portion above n=0.5 at which the systems become
metallic. Panel �i� also lacks the r=15 contour due to the finite-size-effect uncertainties at small �U� values.
The insulating state for the phase diagram in Fig. 1 at allvalues of f and n and all inhomogeneous patterns is alwaysassociated with the formation of a charge-ordered state. InFig. 4, panel �a�, for the checkerboard at f =0.25, for the
insulating phase at n=1, as �U� increases, electrons formpairs in the interacting sites with higher symmetry �sites 2and 4 in red �dark gray in the grayscale version��, leaving thenoninteracting and lower-symmetry interacting sites �sites 1and 3 in black and green �light gray in the grayscale version�,respectively� essentially empty. For the insulating phase inpanel �a� at n=1.5, the lower-symmetry interacting site �site3 in green �light gray in the grayscale version�� also obtainsa pair, leaving only the noninteracting site �site 1 in black�empty. In other words, charges rearrange themselves into or-dered pair configurations forming an insulating phase. Ac-cording to panel �b� in Fig. 1 for stripes, n=1 does not cor-respond to an insulating phase. Panel �b� in Fig. 4 confirmsthis finding as the local occupation of the interacting sites
�sites 2, 3, and 4 in red �dark gray in the grayscale version�,green �light gray in the grayscale version�, and red, respec-
tively� for large �U� at n=1 does not approach 2 while for thenoninteracting sites �sites 1 in black� it approaches zero.
For the random pattern in panel �c� of Fig. 4 at f =0.25,we plot nblack and nred �red shows dark gray in the grayscaleversion� as defined in Eq. �3�. The fact that nblack does not
approach 2 as �U� increases �no pair compression� is consis-tent with the lack of an insulating phase at n=1 for the ran-dom pattern at f =0.25 �Fig. 1, panel �c��. However, at n=1.5, both striped and random patterns turn insulating as aresult of charge-ordered phase formation as shown in panels�b� and �c� in Fig. 4, where their occupation numbers on the
interacting sites all approach 2 as �U� increases. Charge-ordered phase formation is more obvious in the second row�panels �d�–�f�� and third row �panels �g�–�i�� of Fig. 4 for
f =0.5 and f =0.75, respectively, at large enough �U� values.
-14 -12 -10 -8 -6 -4 -2 0 2 4 6 8
ω0
0.2
0.4
0.6
0.8
1
1.2
DO
S
n = 0.4n = 1n = 1.5n = 1.8
f = 0.25U = 6t (stripes)
(b)
-14 -12 -10 -8 -6 -4 -2 0 2 4 6 8 10 12
ω0
0.2
0.4
0.6
0.8
DO
S
n = 0.25n = 0.5n = 0.65
f = 0.75U = 4t (stripes)
(h)
-12 -10 -8 -6 -4 -2 0 2 4 6 8 10
ω0
1
2
3
4
5
DO
S
n = 0.25n = 0.5n = 0.65
f = 0.75U = 4t (checkerboard)
(g)
-12 -10 -8 -6 -4 -2 0 2 4 6 8 10
ω0
1
2
3
4
5
6
7
8
9
DO
S
n = 0.5n = 1n = 1.2
f = 0.5U = 5t (checkerboard)
(d)
-14 -12 -10 -8 -6 -4 -2 0 2 4 6 8 10
ω0
0.2
0.4
0.6
0.8
DO
S
n = 0.5n = 1n = 1.2
f = 0.5U = 5t (stripes)
(e)
-12 -10 -8 -6 -4 -2 0 2 4 6 8
ω0
1
2
3
4
5
6
DO
S
n = 0.4n = 1n = 1.5n = 1.8
f = 0.25U = 6t (checkerboard)
(a)
-14 -12 -10 -8 -6 -4 -2 0 2 4 6 8 10
ω0
0.2
0.4
0.6
0.8
DO
S
n = 0.5n = 1n = 1.2
f = 0.5U = 5t (random)
(f)
-14 -12 -10 -8 -6 -4 -2 0 2 4 6 8 10 12
ω0
0.2
0.4
0.6
0.8
1
1.2
DO
S
n = 0.25n = 0.5n = 0.65
f = 0.75U = 4t (random)
(i)
-14 -12 -10 -8 -6 -4 -2 0 2 4 6 8 10
ω0
0.2
0.4
0.6
0.8
1
1.2
DO
S
n = 0.4n = 1n = 1.5n = 1.8
f = 0.25U = 6t (random)
(c)
FIG. 3. �Color online� Panel �a�: density of states �DOS� for the checkerboard pattern at f =0.25 and �U�=6t �the largest in ourcalculations for f =0.25� for different values of the average electron occupation per site n. Panels �b� and �c�: the same results as in panel �a�for striped and random patterns respectively. Panel �d�: results of panel �a� at f =0.5 and �U�=5t �the largest in our calculations for f =0.5�.Panels �e� and �f�: the same results as in panels �b� and �c� for striped and random patterns, respectively. Panels �g�, �h�, and �i� correspond
to f =0.75 and �U�=4t �the largest in our calculations for f =0.75� for the checkerboard, striped, and random patterns, respectively. Theparticular selection of colors is for better visibility in both the color and grayscale versions.
ARYANPOUR et al. PHYSICAL REVIEW B 76, 184521 �2007�
184521-6
The proximity effect for the noninteracting sites neigh-bored by the interacting sites plays a key role in the magni-
tude of the average order parameter �inhom in the inhomoge-neous lattice. In Fig. 5, panel �a�, for the checkerboard at f=0.25 and n=0.25, the local order parameter on all the in-teracting sites �2, 3, and 4 in red �dark gray in the grayscaleversion�, green �light gray in the grayscale version�, and red,
respectively� increases as a function of �U�. The noninteract-ing site �1 in black� is also superconducting due to the prox-imity effect of its neighboring sites. However, its local order
parameter has a maximum at a critical �Uc� value beyondwhich it decreases as a result of the compression of the Coo-per pairs in the interacting sites and therefore their weaker
overlap around the noninteracting site. Thus, �inhom on allthese four sites will be larger than its uniform pattern coun-terpart due to this proximity effect as long as the noninter-acting site local order parameter ��1 in this case� does not
plummet too far down with respect to its maximum as afunction of �U�.
Panel �b� shows the same behavior for stripes. In panel�b�, there is an intersection between �2 and �3 near �U��3t, indicating that due to the particular symmetry of thestripes, sites 2 and 3 behave very closely. In panel �c�, wehave plotted �black and �red �red shows dark gray in the gray-scale version� as defined in Eq. �3� and it is clear that �red
eventually falls off at large �U� values. In the second row ofFig. 5 �panels �d�–�f�� corresponding to f =0.5 and n=0.5,there are only two different sites for each pattern and thelattice has a more dilute interacting pattern. As a result, com-pared to f =0.25 results, �inhom at f =0.5 tends to saturate forlarge �U� values for all the patterns. In the third row of Fig. 5�panels �g�–�i�� for f =0.75, the lattice is even more dilute interms of interacting energy. Therefore, �inhom shows even
faster saturation at smaller �U� values.
0 0.5 1 1.5 2 2.5 3 3.5 4 4.5 5 5.5 6
U
0
0.5
1
1.5
2
n n1
(n = 1.0)n
1(n = 1.5)
n2
(n = 1.0)n
2(n = 1.5)
n3
(n = 1.0)n
3(n = 1.5)
U4
= (4/3)UU
3= (4/3)U
U1
= 0 U2
= (4/3)U
(b)
(stripes, f = 0.25, T = 0)U = -U
0 0.5 1 1.5 2 2.5 3
U
0
0.5
1
1.5
2
n
n1
n2
n3
U3
= 0
U1
= 4UU
4= 0
U2
= 0
(stripes, n = 0.5, f = 0.75, T = 0)
(h)
U = -U
0 0.5 1 1.5 2 2.5 3
U
0
0.5
1
1.5
2
n
n1
n2
n3
U1
= 4U U4
= 0
U2
= 0 U3
= 0
(checkerboard, n = 0.5, f = 0.75, T = 0)
(g)
U = -U
0 0.5 1 1.5 2 2.5 3
U
0
0.5
1
1.5
2
n
n1
n2
U1
= 4U U2
= 0
(random, n = 0.5, f = 0.75, T = 0)
(i)
U = -U
0 0.5 1 1.5 2 2.5 3 3.5 4 4.5 5 5.5 6
U
0
0.5
1
1.5
2
n
n1
(n = 1.0)n
1(n = 1.5)
n2
(n = 1.0)n
2(n = 1.5)
n3
(n = 1.0)n
3(n = 1.5)
U1
= 0U
2= (4/3)U
U3
= (4/3)UU4
= (4/3)U
(checkerboard, f = 0.25, T = 0)
(a)
U = -U
0 0.5 1 1.5 2 2.5 3 3.5 4 4.5 5 5.5 6
U
0
0.5
1
1.5
2
n
n1
(n = 1.0)n
1(n = 1.5)
n2
(n = 1.0)n
2(n = 1.5)
U1
= (4/3)U U2
= 0
(random, f = 0.25, T = 0)
(c)
U = -U
0 0.5 1 1.5 2 2.5 3 3.5 4 4.5 5
U
0
0.5
1
1.5
2
n
n1
n2
U1
= 2UU
2= 0
(stripes, n = 1.0, f = 0.5, T = 0)
(e)
U = -U
0 0.5 1 1.5 2 2.5 3 3.5 4 4.5 5
U
0
0.5
1
1.5
2
n
n1
n2
U1
= 2U U2
= 0
(random, n = 1.0, f = 0.5, T = 0)
(f)
U = -U
0 0.5 1 1.5 2 2.5 3 3.5 4 4.5 5
U
0
0.5
1
1.5
2
n
n1
n2
U1
= 2U
U2
= 0 U1
= 2U
U2
= 0
(d)
(checkerboard, n = 1, f = 0.5, T = 0)U = -U
FIG. 4. �Color online� Panel �a�: the evolution of the local electron occupation number ni on different lattice sites �as color coded insidethe blocks in Fig. 1, panels �b� and �c�� for the checkerboard pattern at f =0.25 and n=1 and n=1.5 �referring to charge-ordered phases in
Fig. 2, panel �a�� as a function of �U�. Panels �b� and �c�: the same results as in panel �a� for the striped and random patterns, respectively.For the random pattern, data are taken by averaging the occupation number over the interacting and noninteracting sites. Panels �d�, �e�, and�f�: the same results at f =0.5 and n=1 �charge-ordered phases in Fig. 2, panels �d�, �e�, and �f��. Also panels �g�, �h�, and �i� at f =0.75 andn=0.5 �charge-ordered phases in Fig. 2, panels �g�, �h�, and �i��.
As mentioned earlier in this section, for n�n*, �inhom
increases as a function of �U� and saturates for large enough
�U� values while �uniform is a consistently increasing function
of �U� and is symmetric with respect to n=1. Therefore, for
n�n* as illustrated in Fig. 1 for r= �inhom /�uniform at a givenn,
U2 � U1 ⇒ r�U2� � r�U1� . �5�
Now since
�inhom�U2� � �inhom�U1� ⇒ �inhom„r�U2�…
� �inhom„r�U1�… for �n � n*� , �6�
and as a result
�inhom�r = 1� � �inhom�r � 1� for �n � n*� . �7�
Therefore, knowing that r=1 yields the largest magnitude of
�inhom that is still enhanced compared to �uniform when n�n*, the optimum effect due to inhomogeneity correspondsto a value of n along the r=1 contour in Fig. 1, for which
�inhom is maximized. Figure 6 demonstrates the variation of
�inhom�r=1� as a function of n for different f values. In panel�a� corresponding to f =0.25, all three different inhomoge-
neous patterns yield the maximum �inhom�r=1� within therange of n=0.5–0.75. In panel �b� for f =0.5, the maxima arecloser to n=0.5 while in panel �c� for f =0.75 they are aroundn=0.25. These results indicate that apparently the optimumvalue for the doping of electrons in these inhomogeneoussystems is nopt�1− f =n* /2. In strong coupling this densitycorresponds to leaving the free sites empty and singly occu-pying the attractive ones. By comparing this behavior with
0 0.5 1 1.5 2 2.5 3 3.5 4 4.5 5 5.5 6
U
0
0.1
0.2
0.3
0.4
0.5
0.6
∆ ∆1∆2 = ∆4∆3∆
stripes
U3
= (4/3)U
U1
= 0
U4
= (4/3)U
U2
= (4/3)U
(b)stripes (n = 0.5, f = 0.25, T = 0)
U = -U
0 0.5 1 1.5 2 2.5 3 3.5 4 4.5 5
U
0
0.1
0.2
0.3
0.4
0.5
0.6
∆∆1∆2∆
stripes
U1
= 2U
U2
= 0
stripes (n = 0.5, f = 0.5, T = 0) (e)
U = -U
0 0.5 1 1.5 2 2.5 3
U
0
0.1
0.2
0.3
0.4
0.5
0.6
∆ ∆1∆2∆
random
U2
= 0U1
= 4U
(i)random (n = 0.25, f = 0.75, T = 0)
U = -U
0 0.5 1 1.5 2 2.5 3
U
0
0.1
0.2
0.3
0.4
0.5
0.6
∆
∆1∆2 = ∆4∆3∆
stripes
U2
= 0
U4
= 0
U1
= 4U
U3
= 0
(h)stripes (n = 0.25, f = 0.75, T = 0)
U = -U
0 0.5 1 1.5 2 2.5 3 3.5 4 4.5 5
U
0
0.1
0.2
0.3
0.4
0.5
0.6
∆ ∆1∆2∆
random
U1
= 2U
random (n = 0.5, f = 0.5, T = 0) (f)
U2
= 0
U = -U
0 0.5 1 1.5 2 2.5 3 3.5 4 4.5 5 5.5 6
U
0
0.1
0.2
0.3
0.4
0.5
0.6
∆
∆1∆2∆
random
U2
= 0U1
= (4/3)U
(c)random (n = 0.5, f = 0.25, T = 0)
U = -U
0 0.5 1 1.5 2 2.5 3 3.5 4 4.5 5 5.5 6
U
0
0.1
0.2
0.3
0.4
0.5
0.6
∆
∆1∆2 = ∆4∆3∆
check
U1
= 0
U4
= (4/3)UU3
= (4/3)U
U2
= (4/3)U
(a)checkerboard (n = 0.5, f = 0.25, T = 0)
U = -U
0 0.5 1 1.5 2 2.5 3 3.5 4 4.5 5
U
0
0.1
0.2
0.3
0.4
0.5
0.6
∆
∆1∆2∆
check
U1
= 2U
U2
= 0
checkerboard (n = 0.5, f = 0.5, T = 0) (d)
U1
= 2U
U2
= 0
U = -U
0 0.5 1 1.5 2 2.5 3
U
0
0.1
0.2
0.3
0.4
0.5
0.6
∆
∆1∆2 = ∆4∆3∆
check
U1
= 4U
U4
= 0U3
= 0
U2
= 0
(g)checkerboard (n = 0.25, f = 0.75, T = 0)
U = -U
FIG. 5. �Color online� Panel �a�: the evolution of the local order parameter �i on different lattice sites �as color coded inside the blocks
in Fig. 1, panels �b� and �c�� for the checkerboard pattern at f =0.25 and n=0.5 as a function of �U�. The curve symbolized with stars refers
to the average order parameter �inhom. Panels �b� and �c�: the same results as in panel �a� for the striped and random patterns, respectively.
One notices that curves for �2 and �3 in panel �b� intersect around �U��3t. Panels �d�, �e�, and �f� present the same results at f =0.5 andn=0.5 for the checkerboard, striped, and random patterns, respectively. Also panels �g�, �h�, and �i� at f =0.75 and n=0.25.
ARYANPOUR et al. PHYSICAL REVIEW B 76, 184521 �2007�
184521-8
the uniform system for which, due to particle-hole symmetry,nopt=1 we can understand why nopt�n* /2. Also, one ob-serves in Fig. 6 that by further diluting the interacting sites in
a lattice, the magnitude of �inhom at nopt decreases.We conclude in this section that by further diluting the
density of interacting sites in a lattice while maintaining theaverage pairing energy per site constant at T=0, the average
order parameter �inhom may enhance. This enhancement re-sults from the proximity effect in the noninteracting sites dueto their interacting neighbors leading to a larger average or-der parameter compared to the uniform lattice and in manyrespects is independent of the particular inhomogeneous pat-tern. Superconductivity in an inhomogeneous lattice of inter-
acting sites gradually vanishes above n=n* and for large
enough �U� values at n=n* we have an insulating phase as aresult of a charge-ordered phase formation. For larger f val-
ues, the enhancement ratio r= �inhom /�uniform will be larger
for small values of �U� and n. However, the enhancement of
�inhom occurs at smaller values of n. We also find an opti-mum value of nopt�1− f =n* /2 for the largest enhanced
�inhom for a system in the presence of inhomogeneity.
IV. RESULTS AT FINITE T
The SC transition temperature Tc of a lattice with an in-homogeneous pattern of interacting sites can also be largercompared to a uniform interaction distribution on the samelattice. In this section, we investigate the conditions underwhich inhomogeneity in any form can lead to the enhance-
ment of Tc as a function of �U� and n at different concentra-tion values f . In Fig. 7, panel �a� presents the variation of the
0 0.2 0.4 0.6 0.8 1 1.2 1.4 1.6 1.8 2n
0
0.05
0.1
0.15
0.2
0.25
0.3
0.35
∆(r
=1)
checkerboardstripesrandom
(a)
f = 0.25
0 0.2 0.4 0.6 0.8 1 1.2 1.4 1.6 1.8 2n
0
0.05
0.1
0.15
0.2
0.25
0.3
0.35
∆(r
=1)
checkerboardstripesrandom
(b)
f = 0.5
0 0.2 0.4 0.6 0.8 1 1.2 1.4 1.6 1.8 2n
0
0.05
0.1
0.15
0.2
0.25
0.3
0.35
∆(r
=1)
checkerboardstripesrandom
(c)
f = 0.75
FIG. 6. �Color online� The magnitude of the averaged order
parameter � for the inhomogeneous patterns along the enhancementboundary �r=1� in Fig. 1 as a function of the average electronoccupation n for f =0.25 �panel �a��, f =0.5 �panel �b��, and f=0.75 �panel �c��.
0 0.5 1 1.5T
0
0.1
0.2
0.3
0.4
∆
0 0.5 1 1.5 2 2.5 3 3.5 4 4.5 5 5.5 6
U
0
0.1
0.2
0.3
0.4
0.5
0.6
∆
uniformcheckerboardstripesrandom
(n = 1.35, f = 0.25, T = 0)
U = 6t(a)
0 0.1 0.2 0.3 0.4 0.5 0.6T
0
0.1
0.2
0.3
∆
0 0.5 1 1.5 2 2.5 3 3.5 4 4.5 5 5.5 6
U
0
0.1
0.2
0.3
0.4
0.5
0.6
∆
uniformcheckerboardstripesrandom
(n = 1.5, f = 0.25, T = 0)
U = 2tU = 4t
(b)
FIG. 7. �Color online� Panel �a�: �main� the variation of the
averaged order parameter � for the uniform and three differentinhomogeneous patterns of checkerboard, stripes, and random at f
=0.25, n=1.35�n*, and T=0 as a function of �U�. The inset pre-sents the evolution of these order parameters as a function of tem-
perature for �U�=6t �the largest at T=0�. Panel �b�: �main� the sameresults as in panel �a� for n=1.5=n* and T=0. The inset shows theevolution of order parameters against temperature for two different
values of �U�=2t �solid line with solid symbols� and 4t �dashed linewith open symbols� as indicated in the T=0 results by the dashedlines.
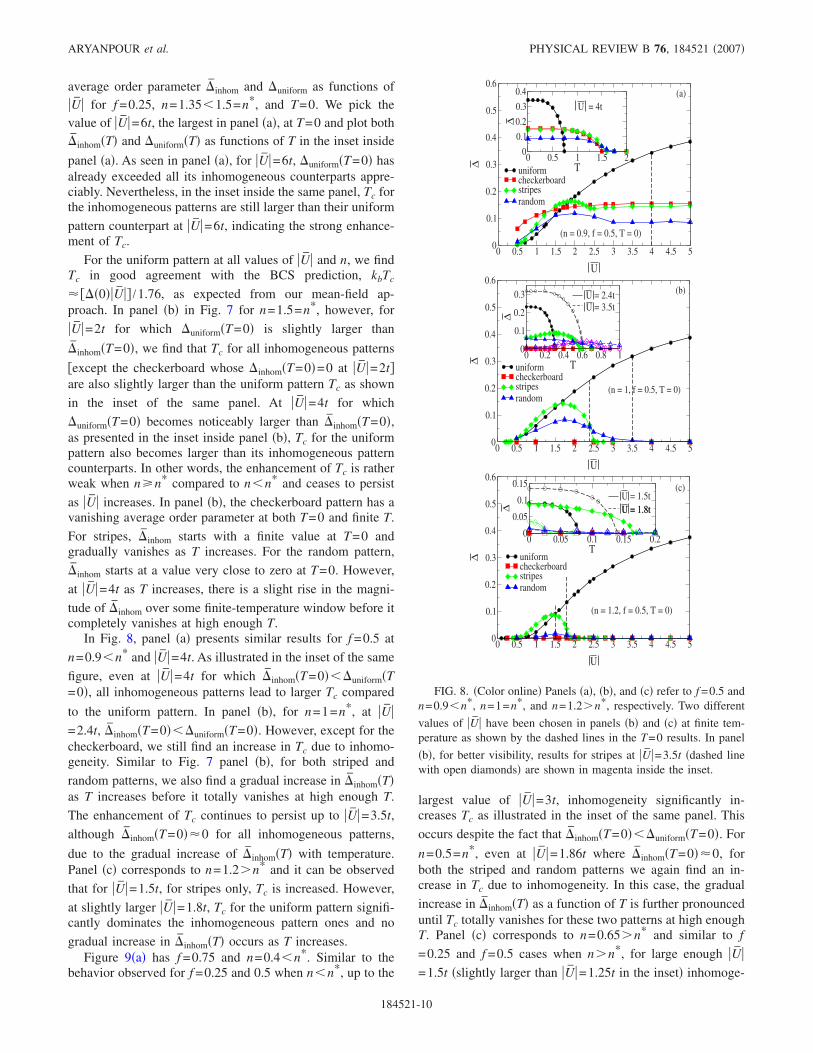
average order parameter �inhom and �uniform as functions of�U� for f =0.25, n=1.35�1.5=n*, and T=0. We pick thevalue of �U�=6t, the largest in panel �a�, at T=0 and plot both�inhom�T� and �uniform�T� as functions of T in the inset inside
panel �a�. As seen in panel �a�, for �U�=6t, �uniform�T=0� hasalready exceeded all its inhomogeneous counterparts appre-ciably. Nevertheless, in the inset inside the same panel, Tc forthe inhomogeneous patterns are still larger than their uniform
pattern counterpart at �U�=6t, indicating the strong enhance-ment of Tc.
For the uniform pattern at all values of �U� and n, we findTc in good agreement with the BCS prediction, kbTc
����0��U�� /1.76, as expected from our mean-field ap-proach. In panel �b� in Fig. 7 for n=1.5=n*, however, for
�U�=2t for which �uniform�T=0� is slightly larger than
�inhom�T=0�, we find that Tc for all inhomogeneous patterns
�except the checkerboard whose �inhom�T=0�=0 at �U�=2t�are also slightly larger than the uniform pattern Tc as shown
in the inset of the same panel. At �U�=4t for which
�uniform�T=0� becomes noticeably larger than �inhom�T=0�,as presented in the inset inside panel �b�, Tc for the uniformpattern also becomes larger than its inhomogeneous patterncounterparts. In other words, the enhancement of Tc is ratherweak when n�n* compared to n�n* and ceases to persist
as �U� increases. In panel �b�, the checkerboard pattern has avanishing average order parameter at both T=0 and finite T.
For stripes, �inhom starts with a finite value at T=0 andgradually vanishes as T increases. For the random pattern,
�inhom starts at a value very close to zero at T=0. However,
at �U�=4t as T increases, there is a slight rise in the magni-
tude of �inhom over some finite-temperature window before itcompletely vanishes at high enough T.
In Fig. 8, panel �a� presents similar results for f =0.5 at
n=0.9�n* and �U�=4t. As illustrated in the inset of the same
figure, even at �U�=4t for which �inhom�T=0���uniform�T=0�, all inhomogeneous patterns lead to larger Tc compared
to the uniform pattern. In panel �b�, for n=1=n*, at �U�=2.4t, �inhom�T=0���uniform�T=0�. However, except for thecheckerboard, we still find an increase in Tc due to inhomo-geneity. Similar to Fig. 7 panel �b�, for both striped and
random patterns, we also find a gradual increase in �inhom�T�as T increases before it totally vanishes at high enough T.
The enhancement of Tc continues to persist up to �U�=3.5t,
although �inhom�T=0��0 for all inhomogeneous patterns,
due to the gradual increase of �inhom�T� with temperature.Panel �c� corresponds to n=1.2�n* and it can be observed
that for �U�=1.5t, for stripes only, Tc is increased. However,
at slightly larger �U�=1.8t, Tc for the uniform pattern signifi-cantly dominates the inhomogeneous pattern ones and no
gradual increase in �inhom�T� occurs as T increases.Figure 9�a� has f =0.75 and n=0.4�n*. Similar to the
behavior observed for f =0.25 and 0.5 when n�n*, up to the
largest value of �U�=3t, inhomogeneity significantly in-creases Tc as illustrated in the inset of the same panel. This
occurs despite the fact that �inhom�T=0���uniform�T=0�. For
n=0.5=n*, even at �U�=1.86t where �inhom�T=0��0, forboth the striped and random patterns we again find an in-crease in Tc due to inhomogeneity. In this case, the gradual
increase in �inhom�T� as a function of T is further pronounceduntil Tc totally vanishes for these two patterns at high enoughT. Panel �c� corresponds to n=0.65�n* and similar to f
=0.25 and f =0.5 cases when n�n*, for large enough �U�=1.5t �slightly larger than �U�=1.25t in the inset� inhomoge-
0 0.5 1 1.5 2 2.5 3 3.5 4 4.5 5
U
0
0.1
0.2
0.3
0.4
0.5
0.6
∆
uniformcheckerboardstripesrandom
0 0.5 1 1.5 2T
0
0.1
0.2
0.3
0.4
∆
(n = 0.9, f = 0.5, T = 0)
U = 4t(a)
0 0.5 1 1.5 2 2.5 3 3.5 4 4.5 5
U
0
0.1
0.2
0.3
0.4
0.5
0.6
∆
uniformcheckerboardstripesrandom
0 0.2 0.4 0.6 0.8 1T
0
0.1
0.2
0.3
∆
(n = 1, f = 0.5, T = 0)
(b)U = 2.4tU = 3.5t
0 0.5 1 1.5 2 2.5 3 3.5 4 4.5 5
U
0
0.1
0.2
0.3
0.4
0.5
0.6∆ uniform
checkerboardstripesrandom
0 0.05 0.1 0.15 0.2T
0
0.05
0.1
0.15
∆
(n = 1.2, f = 0.5, T = 0)
(c)U = 1.5tU = 1.8tU = 1.8t
FIG. 8. �Color online� Panels �a�, �b�, and �c� refer to f =0.5 andn=0.9�n*, n=1=n*, and n=1.2�n*, respectively. Two different
values of �U� have been chosen in panels �b� and �c� at finite tem-perature as shown by the dashed lines in the T=0 results. In panel
�b�, for better visibility, results for stripes at �U�=3.5t �dashed linewith open diamonds� are shown in magenta inside the inset.
ARYANPOUR et al. PHYSICAL REVIEW B 76, 184521 �2007�
184521-10
neity no longer yields larger Tc compared to the uniform.�See inset.�
The anomalous increase of �inhom as a function of T atn=n* for f �0.5 is an actual feature and is believed to berelated to the gradual destruction of the charge-ordered phasedue to temperature, leading to an intermediate SC phase. InFig. 10 corresponding to Fig. 9, panel �b� for n=0.5, f
=0.75, and �U�=1.86t, panel �a� presents the DOS results atseveral T values within the temperature window of the insetin Fig. 9, panel �b�. At T=0, the gap in the DOS is barelynonzero at =0 �Fermi energy�, indicating a charge-orderedphase. By increasing T to 0.6t the gap widens towards super-
conductivity consistent with the behavior shown inside theinset in Fig. 9, panel �b�. By further increasing T, the gapbegins to shrink due to the destruction of superconductivityby temperature until it entirely vanishes at T=1.65t, in agree-ment with the results inside the inset in Fig. 9, panel �b�.
Panel �b� in Fig. 10 illustrates the variation of the localorder parameter on all four different types of sites for stripesat f =0.75. Only �1 along the line of interacting sites variesappreciably as T increases. Panel �c� of Fig. 10 shows the
0 0.5 1 1.5 2 2.5 3 3.5 4
U
0
0.1
0.2
0.3
0.4
0.5
0.6
∆
uniformcheckerboardstripesrandom
0 0.5 1 1.5T
0
0.02
0.04
0.06
0.08
∆
(n = 0.5, f = 0.75, T = 0)
U = 1.86t
(b)U = 1.84t
0 0.5 1 1.5 2 2.5 3 3.5 4
U
0
0.1
0.2
0.3
0.4
0.5
0.6
∆
uniformcheckerboardstripesrandom
0 0.5 1 1.5 2 2.5 3T
0
0.05
0.1
0.15
∆
(n = 0.4, f = 0.75, T = 0)
U = 2.5tU = 3t
(a)
0 0.5 1 1.5 2 2.5 3 3.5 4
U
0
0.1
0.2
0.3
0.4
0.5
0.6
∆
uniformcheckerboardstripesrandom
0 0.25 0.5 0.75T
0
0.02
0.04
0.06
∆
(n = 0.65, f = 0.75, T = 0)
U = 1.25tU = 1.5t
(c)
FIG. 9. �Color online� Panels �a�, �b�, and �c� refer to f =0.75and n=0.4�n*, n=0.5=n*, and n=0.65�n*, respectively. Two
different values of �U� have been chosen in all panels as shown bythe dashed lines in the T=0 results. In panel �c�, results for check-
erboard at �U�=1.5t �dashed line with open diamonds� are shown incyan inside the inset for better visibility.
0 0.25 0.5 0.75 1 1.25 1.5 1.75 2T
0
0.1
0.2
0.3
0.4
0.5
0.6
∆
∆1 ( U = 1.84t)∆1 ( U = 1.86t)∆2 ( U = 1.84t)∆2 ( U = 1.86t)∆3 ( U = 1.84t)∆3 ( U = 1.86t)
(stripes, n = 0.5, f = 0.75)
U2
= 0U
3= 0
U4
= 0
U1
= 4U
(b)
0 0.25 0.5 0.75 1 1.25 1.5 1.75 2T
0
0.25
0.5
0.75
1
1.25
1.5
1.75
2n
n1
( U = 1.84t)n
1( U = 1.86t)
n2
( U = 1.84t)n
2( U = 1.86t)
n3
( U = 1.84t)n
3( U = 1.86t)
U1
= 4UU
2= 0
U3
= 0U
4= 0
(stripes, n = 0.5, f = 0.75)(c)
-3 -2.5 -2 -1.5 -1 -0.5 0 0.5 1
ω
0
0.2
0.4
0.6
0.8
1
1.2
DO
S
T = 0T = 0.6tT = 1.1tT = 1.5tT = 1.65t
(a)stripes (n = 0.5, f = 0.75, U = 1.86t)
FIG. 10. �Color online� Anomalous behavior of the averaged
order parameter � as a function of temperature T at f =0.75 and n=0.5 as presented in Fig. 9, panel �b� �inset�, for stripes. Panel �a�illustrates the evolution of the DOS as a function of temperature for
�U�=1.86t. Panel �b� demonstrates how the local �i on any of theindividual four sites inside the block shown in Fig. 1, panel �b� varyas a function of temperature T. Panel �c�: the evolution of the localoccupation number ni on any of the individual four sites inside theblock shown in Fig. 1, panel �b�, as a function of temperature T.
local occupation numbers on all the four different types ofsites for stripes at f =0.75 �Fig. 1, panel �b��. By increasingT, while the occupation of the interacting sites graduallydrops from n=2 to n�1, an indication of the destruction ofthe charge-ordered phase, the occupation of the noninteract-ing sites grows, leading to additional mobility and overlap ofthe Cooper pairs and therefore enhancing Tc.
Figure 11, panel �a� shows the DOS results for the random
pattern for n=0.5, f =0.75, and �U�=1.86t depicted in Fig. 9,panel �b�. Similar to stripes, over the window of temperaturestudied in panel �a�, the gap in the DOS initially grows up toT� t and then gradually drops to zero slightly beyond T=1.6t to indicate the formation of a metallic phase as thetemperature destroys superconductivity. Panel �b� in Fig. 11also shows significant variation of the local order parameteronly on the interacting sites on average. Hence, similar to
stripes, temperature acts against the more localized charge-ordered phase, allowing for the Cooper pairs to move andoverlap more freely and consequently the enhancement of Tc.Panel �c� also confirms that the charge-ordered phase is in-deed destroyed by temperature, allowing the noninteractingsites to become more occupied, resulting in an intermediateSC phase. Metallic behavior is established at sufficientlyhigh temperature.
It is also noteworthy that this anomalous increase in
�inhom was not observed for the checkerboard pattern forwhich there is no superconductivity at any temperature whenn=n*. One possible explanation is that due to the particulargeometry for the checkerboard, localized Cooper pairs arefarther apart from one another compared to the striped andrandom patterns. As mentioned earlier, when n=n* we havetwo electrons per interacting site. For the checkerboard lat-tice, this leads to a pair localized in the interacting sites withempty nearest-neighboring sites. Therefore, the effect of tem-perature is minor in causing further overlap among the pairsbefore it totally destroys them �especially at f =0.5 and 0.75as shown in Fig. 1, panel �a��.
A similar increase in Tc upon introducing a checkerboardpattern is found in the MCMF calculations as well, arisingfrom the loss of long-range phase coherence. This is particu-larly significant because the MCMF approach incorporatesthe subtle nature of the SC transition in 2D discussed earlier.We have also independently confirmed that our conclusionsand arguments equally apply for a model with nearest-neighbor attraction, leading to a d-wave SC close to half-filling, which reflects the cuprates’ phenomenology moretruthfully.49,61
We have found that upon introducing inhomogeneity intothe pattern of interacting sites on a lattice. Tc can be in-
creased over a wide range of �U� as long as nn* even if
�inhom�T=0���uniform�T=0�. When n�n*, however, for suf-
ficiently large �U�, inhomogeneity acts against superconduc-tivity and therefore Tc becomes smaller compared to the uni-form pattern of interacting sites. The case of n=n* isanomalous. The charge-ordered phase established at large
enough �U� values at T=0 gradually vanishes as T increases.�inhom first increases with increasing T, leading to a SC phase�at least for large enough f values and lower-symmetricalinhomogeneity patterns�, and then vanishes, indicating a me-tallic state.
V. SUMMARY AND DISCUSSION
In summary, we have shown that for the attractive Hub-bard model on a square lattice, there is a significant range ofelectron doping and interaction strength over which the av-erage superconducting order parameter is larger for a latticewith inhomogeneous patterns of interacting sites than a uni-form distribution of these interacting sites at a constant in-teraction strength per site. We have presented the phase dia-grams for three different inhomogeneous patterns,checkerboard, stripes, and random, and also three differentvalues for the concentration of the noninteracting sites. Apartfrom a few particular features, the overall physics illustrated
0 0.25 0.5 0.75 1 1.25 1.5 1.75 2T
0
0.05
0.1
0.15
0.2
∆
∆1 ( U = 1.84t)∆1 ( U = 1.86t)∆2 ( U = 1.84t)∆2 ( U = 1.86t)
(random, n = 0.5, f = 0.75)
U2
= 0U1
= 4U
(b)
0 0.25 0.5 0.75 1 1.25 1.5 1.75 2T
0
0.25
0.5
0.75
1
1.25
1.5
1.75
2
n
n1
( U = 1.84t)n
1( U = 1.86t)
n2
( U = 1.84t)n
2( U = 1.86t)
U1
= 4U U2
= 0
(random, n = 0.5, f = 0.75)(c)
-3 -2.5 -2 -1.5 -1 -0.5 0 0.5 1
ω
0
0.1
0.2
0.3
0.4
0.5
0.6
DO
ST = 0T = 0.6tT = tT = 1.5tT = 1.6t
(a)random (n = 0.5, f = 0.75, U = 1.86t)
FIG. 11. �Color online� Same as Fig. 10, but for the randompattern.
ARYANPOUR et al. PHYSICAL REVIEW B 76, 184521 �2007�
184521-12
in the phase diagrams is pattern independent. As we vary themean interaction strength �U� and the doping level n at zerotemperature, we have verified the existence of at least threedifferent phases—namely, �i� superconducting, �ii� insulatingdue to the charge order phases, and �iii� metallic. Our find-ings and claims are strongly supported by studying the be-havior of a variety of quantities computed in this work allconsistently corroborating one another.
The enhancement of the average order parameter for theinhomogeneous interacting site patterns is due to the prox-imity effect—i.e., the tunneling effect of the Cooper pairsfrom the interacting sites, leading to finite order parametervalues on neighboring sites. This conclusion is supported bythe effect occurring at weak coupling, where the coherencelength is large, rather than in the strong-coupling regime ofpreformed pairs. Agreement between the BdG results and theMCMF calculations justifies the application and conclusions
of the BdG approach within the small-�U� regime. Our cal-culations also clearly confirm that an inhomogeneous inter-action potential can lead to the increase in the phase transi-
tion temperature Tc over a wide range of n and �U� forvarious f values. Counterintuitively, as long as n is less thanor equal to twice the fraction of interacting sites, this in-
crease in Tc continues even for values of �U� for which theorder parameter is larger for the uniform pattern than forinhomogeneous patterns at T=0.
One possible explanation takes into account that in thisweak-coupling parameter regime, Tc is a supralinearly in-creasing function of U. In such a case, it may be that in theinhomogeneous system the sites with larger U produce anonlinear enhancement relative to Tc of the uniform systemand, through the proximity effect, drag the noninteractingsites along with them. This trend changes when n exceedstwice the number of interacting sites �i.e., some electronsmust occupy noninteracting sites�, for which at large enough
�U� values inhomogeneity fails to increase Tc over that of theuniform pattern. The n=2�1− f�=n* case for sufficientlylarge f values and less symmetric inhomogeneous patterns�such as stripes and random as opposed to the checkerboard�is anomalous as it shows the enhancement of �inhom�T� astemperature increases.
It is even more surprising to find that a system which isnonsuperconducting �charge-ordered insulator� at T=0 canbecome superconducting upon increasing T for a finite win-dow of temperature before turning metallic. This anomalousbehavior was shown to be related to a crossover from a
charge-ordered insulating phase for n=n* at large enough �U�values to an intermediate SC phase upon increasing T beforeentering the metallic phase at sufficiently large T.
We wish to emphasize that in this article we have focusedon the enhancement �or not� of the pairing amplitude �our �defined in Sec. II�, rather than its product with the localinteraction strength-�Ui� which is more directly related to thegap but contains less information, and gives less insight, be-cause it automatically vanishes on any site without interac-tion. Thermodynamic measurements would probe quantitieswhich include the energy scale, such as the specific heat orsuperfluid rigidity which our results may not have direct im-
plications to. However, for an inhomogeneous system beinga mixture of different phases, defining an average SC gap isnot trivial. Thus, the thermodynamic properties of inhomo-geneous superconductors will not necessary exhibit the samebehavior as their homogeneous counterparts. It has beenshown that the rise of the specific heat in inhomogeneoussuperconductors obeys a power law behavior as opposed toexponential in homogeneous ones using the attractive Hub-bard model with random interacting sites.62 Also, the super-fluid density and stiffness in general decrease due to the pres-ence of disorder.63 Nevertheless, lower superfluid densitydoes not necessarily lead to lower Tc as according to theAnderson theorem, a nonmagnetic impurity should not affectthe Tc and therefore thermodynamic properties of an s-wavesuperconductor. We have presented clear evidence for theenhancement of Tc which does have a direct experimentalimplication. Thermodynamic properties of inhomogeneoussuperconductors are very rich in physics and a great deal ofcontributions and new ideas in this area are yet to appear.
While the attractive Hubbard Hamiltonian obviously doesnot incorporate many of the features of high-Tc supercon-ductors �notably the symmetry of the pairing�, the model hasbeen shown to provide useful insight into some of theirphenomenology—for example, the spin gap.64 It is thereforetempting to speculate that our results concerning inhomoge-neity may have similar connections. Specifically, earlierangle-resolved photoemission spectroscopy �ARPES� data65
suggest that the underdoped phase of LSCO �La2−xSrxCuO4�consists of SC clusters, embedded in the antiferromagnetichost. In such a system, inhomogeneous gaps appear naturallyand our results here indicate that the SC transition is in factdetermined by the largest gap values rather than the muchsmaller gaps found at phase boundaries, as one might naivelythink. This renders the SC phase more stable than it wouldotherwise be and also simplifies the description of these sys-tems.
It is worth emphasizing that in most situations, inhomo-geneities reduce values of order parameters51 and criticaltemperatures, even when comparisons are made, as they arein this article, to homogeneous systems with the same aver-age value of all parameters. This is true, for example, forclassical site-diluted Ising models, where the ferromagnetic Jis increased to compensate for absent sites, and quantummodels like the boson Hubbard model where random chemi-cal potentials monotonically decrease and ultimately destroysuperfluidity.66,67 An exception is the increase of TNéel byrandomness reported in density mean-field theory studies ofthe repulsive model68 and recently, the SC Tc in the XYmodel Hamiltonian with certain types of inhomogeneous pat-terns for the coupling constant between spins sitting onnearest-neighboring sites.50
ACKNOWLEDGMENTS
We acknowledge useful conversations with Jian-Xin Zhuand Wei Ku. This research was supported by National Sci-ence Foundation Grants Nos. DMR-0421810 and DMR-0426826, U.S. ONR, CNPq-Brazil, and FAPERJ-Brazil.
1 Inhomogeneous Superconductors—1979, AIP Conf. Proc. No. 58,edited by D. U. Gubser, T. L. Francavilla, J. R. Leibowitz, andS. A. Wolf �AIP, New York, 1979�.
2 Percolation, Localization, and Superconductivity, edited by A. M.Goldman and S. A. Wolf �Plenum, New York, 1984�.
3 E. Dagotto, Rev. Mod. Phys. 66, 763 �1994�.4 P. A. Lee and T. V. Ramakrishnan, Rev. Mod. Phys. 57, 287
�1985�.5 D. Belitz and T. R. Kirkpatrick, Rev. Mod. Phys. 66, 261 �1994�.6 T. Cren, D. Roditchev, W. Sacks, J. Klein, J.-B. Moussy, C.
Deville-Cavellin, and M. Laguës, Phys. Rev. Lett. 84, 147�2000�.
7 S.-H. Pan, J. P. O’Neal, R. L. Badzey, C. Chamon, H. Ding, J. R.Engelbrecht, Z. Wang, H. Eisaki, S. Uchida, A. K. Gupta, K.-W.Ng, E. W. Hudson, K. M. Lang, and J. C. Davis, Nature �Lon-don� 413, 282 �2001�.
8 C. Howald, P. Fournier, and A. Kapitulnik, Phys. Rev. B 64,100504�R� �2001�.
9 K. M. Lang, V. Madhavan, J. E. Hoffman, E. W. Hudson, H.Eisaki, S. Uchida, and J. C. Davis, Nature �London� 415, 412�2002�.
10 K. McElroy, D.-H. Lee, J. E. Hoffman, K. M. Lang, J. Lee, E. W.Hudson, H. Eisaki, S. Uchida, and J. C. Davis, Phys. Rev. Lett.94, 197005 �2005�.
11 T. Hanaguri, C. Lupien, Y. Kohsaka, D.-H. Lee, M. Azuma, M.Takano, H. Takagi, and J. C. Davis, Nature �London� 430, 1001�2004�.
12 M. Vershinin, S. Misra, S. Ono, Y. Abe, Y. Ando, and A. Yazdani,Science 303, 1995 �2004�.
13 H. A. Mook, P. Dai, and F. Dogan, Phys. Rev. Lett. 88, 097004�2002�.
14 J. M. Tranquada, J. D. Axe, N. Ichikawa, A. R. Moodenbaugh, Y.Nakamura, and S. Uchida, Phys. Rev. Lett. 78, 338 �1997�.
15 Ch. Renner, G. Aeppli, B.-G. Kim, Y.-A. Soh, and S.-W. Cheong,Nature �London� 416, 518 �2002�.
16 J. Burgy, A. Moreo, and E. Dagotto, Phys. Rev. Lett. 92, 097202�2004�.
17 A. Moreo, S. Yunoki, and E. Dagotto, Science 283, 2034 �1999�.18 E. Dagotto, T. Hotta, and A. Moreo, Phys. Rep. 344, 1 �2001�.19 M. L. Foo, Y. Wang, S. Watauchi, H. W. Zandbergen, T. He, R. J.
Cava, and N. P. Ong, Phys. Rev. Lett. 92, 247001 �2004�.20 K.-W. Lee, J. Kunes, P. Novak, and W. E. Pickett, Phys. Rev. Lett.
94, 026403 �2005�.21 J. Zaanen and O. Gunnarsson, Phys. Rev. B 40, R7391 �1989�.22 K. Machida, Physica C 158, 192 �1989�.23 M. Kato, K. Machida, H. Nakanishi, and M. Fujita, J. Phys. Soc.
Jpn. 59, 1047 �1990�.24 S. R. White and D. J. Scalapino, Phys. Rev. B 70, 220506�R�
�2004�.25 M. Vojta, Phys. Rev. B 66, 104505 �2002�.26 G. Seibold, C. Castellani, C. Di Castro, and M. Grilli, Phys. Rev.
B 58, 13506 �1998�.27 S. A. Kivelson and E. Fradkin, arXiv:cond-mat/0507459 �unpub-
lished�.28 H.-X. Huang, Y. Q. Li, J.-Y. Gan, Y. Chen, and F.-C. Zhang, Phys.
Rev. B 75, 184523 �2007�.29 M. M. Maśka, Ż. Śledź, K. Czajka, and M. Mierzejewski, Phys.
Rev. Lett. 99, 147006 �2007�.30 W.-F. Tsai and S. A. Kivelson, Phys. Rev. B 73, 214510 �2006�.31 G. Seibold, J. Lorenzana, and M. Grilli, Phys. Rev. B 75,
100505�R� �2007�.32 A. Garg, H. R. Krishnamurthy, and M. Randeria, Phys. Rev. Lett.
97, 046403 �2006�.33 D. Zhang, arXiv:cond-mat/0607762 �unpublished�.34 J. A. Robertson, S. A. Kivelson, E. Fradkin, A. C. Fang, and A.
Kapitulnik, Phys. Rev. B 74, 134507 �2006�.35 A. Ghosal, M. Randeria, and N. Trivedi, Phys. Rev. B 65, 014501
�2001�.36 V. Dobrosavljevic, T. R. Kirkpatrick, and G. Kotliar, Phys. Rev.
Lett. 69, 1113 �1992�.37 V. Dobrosavljevik and G. Kotliar, Phys. Rev. B 50, 1430 �1994�.38 V. Dobrosavljevic, A. A. Pastor, and B. K. Nikolic, Europhys.
Lett. 62, 76 �2003�.39 A. J. Coleman, E. P. Yukalova, and V. I. Yukalov, Physica C 243,
76 �1995�.40 V. I. Yukalov and E. P. Yukalova, Phys. Rev. B 70, 224516
�2004�.41 D. Valdez-Balderas and D. Stroud, Phys. Rev. B 74, 174506
�2006�.42 K. Seo, H.-D. Chen, and J. Hu, Phys. Rev. B 76, 020511�R�
�2007�.43 B. M. Andersen, A. Melikyan, T. S. Nunner, and P. J. Hirschfeld,
Phys. Rev. B 74, 060501�R� �2006�.44 E. S. Caixeiro, E. V. L. de Mello, and A. Troper, arXiv:cond-mat/
0508381 �unpublished�.45 R. Jamei, J. Robertson, E.-A. Kim, A. Fang, A. Kapitulnik, and S.
A. Kivelson, Phys. Rev. B 74, 174521 �2006�.46 A. Melikyan and Z. Tešanović, Phys. Rev. B 71, 214511 �2005�.47 Z. Tešanović, Phys. Rev. Lett. 93, 217004 �2004�.48 I. Martin, D. Podolsky, and S. A. Kivelson, Phys. Rev. B 72,
060502�R� �2005�.49 K. Aryanpour, E. R. Dagotto, M. Mayr, T. Paiva, W. E. Pickett,
and R. T. Scalettar, Phys. Rev. B 73, 104518 �2006�.50 Y. L. Loh and E. W. Carlson, Phys. Rev. B 75, 132506 �2007�.51 B. Chatterjee and A. Taraphder, arXiv:cond-mat/0702150 �unpub-
lished�.52 Y. Matsushita, H. Bluhm, T. H. Geballe, and I. R. Fisher, Phys.
Rev. Lett. 94, 157002 �2005�.53 Y. Matsushita, P. A. Wianecki, A. T. Sommer, T. H. Geballe, and
I. R. Fisher, Phys. Rev. B 74, 134512 �2006�.54 M. Dzero and J. Schmalian, Phys. Rev. Lett. 94, 157003 �2005�.55 R. Micnas, J. Ranninger, and S. Robaskiewicz, Rev. Mod. Phys.
62, 113 �1990� and references therein.56 S. Robaszkiewicz, R. Micnas, and K. A. Chao, Phys. Rev. B 23,
1447 �1981�.57 H. Shiba, Prog. Theor. Phys. 48, 2171 �1972�.58 V. J. Emery, Phys. Rev. B 14, 2989 �1972�.59 G. Litak and B. L. Györffy, Phys. Rev. B 62, 6629 �2000�.60 D. Hurt, E. Odabashian, W. E. Pickett, R. T. Scalettar, F. Mon-
daini, T. Paiva, and R. R. dos Santos, Phys. Rev. B 72, 144513�2005�.
61 M. Mayr, G. Alvarez, C. Şen, and E. Dagotto, Phys. Rev. Lett.94, 217001 �2005�.
62 G. Litak, J. Magn. Magn. Mater. 272-276, 966 �2004�.63 A. Paramekanti, N. Trivedi, and Mohit Randeria, Phys. Rev. B
57, 11639 �1998�.64 M. Randeria, in Bose Einstein Condensation, edited by A. Griffin,
D. Snoke, and S. Stringari �Cambridge University Press, Cam-bridge, England, 1994�, and references cited therein.
65 T. Yoshida, X. J. Zhou, T. Sasagawa, W. L. Yang, P. V. Bogdanov,
ARYANPOUR et al. PHYSICAL REVIEW B 76, 184521 �2007�
184521-14
A. Lanzara, Z. Hussain, T. Mizokawa, A. Fujimori, H. Eisaki,Z.-X. Shen, T. Kakeshita, and S. Uchida, Phys. Rev. Lett. 91,027001 �2003�.
66 M. P. A. Fisher, P. B. Weichman, G. Grinstein, and D. S. Fisher,Phys. Rev. B 40, 546 �1989�.
67 R. T. Scalettar, G. G. Batrouni, and G. T. Zimanyi, Phys. Rev.Lett. 66, 3144 �1991�.
68 M. Ulmke, V. Janis, and D. Vollhardt, Phys. Rev. B 51, 10411�1995�.