Modeling snowpack and soil temperature and moisture conditions in a jack pine, black spruce and aspen forest stand in central Saskatchewan (BOREAS SSA) Vincent Balland 1 , Jagtar Bhatti 2 , Ruth Errington 2 , Mark Castonguay 1 , and Paul A. Arp 1,3 1 Faculty of Forestry and Environmental Management, University of New Brunswick, Fredericton, New Brunswick, Canada E3B 6C2; and 2 Canadian Forest Service, Natural Resources Canada, Edmonton, Alberta, Canada T6H 3S5. Received 22 December 2004, accepted 19 September 2005. Balland, V., Bhatti, J., Errington, R., Castonguay, M. and Arp, P. A. 2006. Modeling snowpack and soil temperature and mois- ture conditions in a jack pine, black spruce and aspen forest stand in central Saskatchewan (BOREAS SSA). Can. J. Soil Sci. 86: 203–217. Impacts of climate change on above- and below-ground heat and moisture conditions were modeled so that other impacts on, e.g., local carbon (C) and C-based pools for nutrients and pollutants such as Hg can be predicted reliably. This paper shows how the 1998–2003 data for the jack pine (jp; Pinus banksiana Lamb.), black spruce (bs; Picea mariana) and aspen (ta; Populus tremuloides) sites of the Southern Study Area of the BOREAS project were used to estimate some of the hydrothermal soil responses at these locations to daily variations in precipitation and air temperature. This was done by initializing and cali- brating a forest hydrology model that has the capacity to simulate flow and retention of moisture and heat, as modified by canopy closure, ground cover, forest-floor depth, and soil composition. The calculations and data revealed strong but predictable site-spe- cific differences in soil temperature and frost penetration (jp: 1–2 m > ta: 0. 5–1 m > bs: 0–0.5 m), in soil moisture freezing (ta < bs < jp), and in moisture retention (jp < ta < bs). Apart from daily weather, these differences depended on soil texture (loamy/sandy texture impeded/encouraged soil freezing, respectively), and on the thermal insulation and moisture retention of the combined for- est floor, moss and lichen layers (ta < jp < bs). Key words: Jack pine, aspen, black spruce, soil moisture, soil temperature, frost penetration, snowpack, boreal conditions Balland, V., Bhatti, J., Errington, R., Castonguay, M. et Arp, P. A. 2006. Modélisation de la couche de neige et des conditions thermiques et hygrométriques du sol sous des forets de pin gris, épinette noire et tremble dans le centre de la Saskatchewan (BOREAS SSA). Can. J. Soil Sci. 86: 203–217. Les impacts du changement climatique sur les conditions thermiques et hygrométriques des sols ont été modélisés, afin que d’autres impacts puissent être correctement prédits, comme, e.g., des puits locaux de carbone(C), de nutriments et de polluants comme Hg. Cet article décrit comment les données de 1998 à 2003 pour les sites « jack pine» (jp; Pinus banksiana Lamb.) (pin gris), « black spruce » (bs; Picea mariana) (épinette noire), et « aspen » (ta; Populus tremuloides) (tremble) de la région sud du projet BOREAS ont été utilisées pour estimer les réactions hydrologiques et thermiques des sols à ces endroits dues aux variations journalières des précipitations et de la température de l’air. Ces résultats ont été obtenus grâce à l’initialisation et au calage d’un modèle d’hydrologie forestière capable de simuler les flux et accumulations d’eau et de chaleur, en fonction de la fermeture du couvert, l’épaisseur de la couverture morte, et la composition du sol. Les sim- ulations et les données ont révélé des différences fortes mais prévisibles entre sites concernant la température du sol et la pénétra- tion du gel (jp: 1–2 m > ta: 0. 5–1 m > bs: 0–0.5 m), la quantité d’eau gelée (ta < bs < jp), et la rétention d’eau (jp < ta < bs). Mis a part les variations climatiques journalières, ces différences étaient dues à la texture du sol (texture limoneuse/sableuse gênant/encourageant le gel, respectivement), et à l’isolation thermique et la rétention d’humidité des couches de couverture morte, mousse et lichen combinées. Mots clés: Pin gris, tremble, épinette noire, hygrométrie du sol, température du sol, pénétration du gel, couche de neige, conditions boréales For the context of evaluating potential impacts of climate change on ecosystem functioning, it has become important to evaluate mechanisms by which forest ecosystems retain and release CO 2 and other carbon-affected substances (dis- solved organic carbon, nutrients, Hg, etc.) at the soil-vege- tation-atmosphere interface, summer through winter (Pastor and Post 1988; Yu et al. 2002; Lal 2003; Grigal 2002, 2003). This importance is accentuated for the boreal region, where climate change is expected to have strong ecosystem impacts through a significant and persistent change in length of growing season, depth of dormancy, soil moisture avail- ability during summer, and frost-and thaw cycles during winter (McGuire et al. 2002). As such, dormancy, growth, drought, frost, CO 2 and methane production, and nutrient and Hg uptake and release are all in step with the annual progression of daily weather cycles, as expressed by incom- ing precipitation (rain, snow), air temperature, and the phe- nological responses of flora and fauna, and of the soil to these cycles. In general, higher temperatures coupled with adequate moisture supply stimulate growth as well as CO 2 uptake and release from the ecosystem (Winston et al. 1997; Rayment and Jarvis 2000). In contrast, a decrease in annual snowfall amounts could result in extended periods of soil frost. Thereafter, the occurrence of soil frost would diminish 203 3 To whom correspondence should be addressed.
Transcript
Modeling snowpack and soil temperature and moistureconditions in a jack pine, black spruce and aspen forest
stand in central Saskatchewan (BOREAS SSA)
Vincent Balland1, Jagtar Bhatti2, Ruth Errington2, Mark Castonguay1, and Paul A. Arp1,3
1Faculty of Forestry and Environmental Management, University of New Brunswick, Fredericton, New Brunswick,Canada E3B 6C2; and 2Canadian Forest Service, Natural Resources Canada, Edmonton, Alberta, Canada
T6H 3S5. Received 22 December 2004, accepted 19 September 2005.
Balland, V., Bhatti, J., Errington, R., Castonguay, M. and Arp, P. A. 2006. Modeling snowpack and soil temperature and mois-ture conditions in a jack pine, black spruce and aspen forest stand in central Saskatchewan (BOREAS SSA). Can. J. SoilSci. 86: 203–217. Impacts of climate change on above- and below-ground heat and moisture conditions were modeled so that otherimpacts on, e.g., local carbon (C) and C-based pools for nutrients and pollutants such as Hg can be predicted reliably. This papershows how the 1998–2003 data for the jack pine (jp; Pinus banksiana Lamb.), black spruce (bs; Picea mariana) and aspen (ta;Populus tremuloides) sites of the Southern Study Area of the BOREAS project were used to estimate some of the hydrothermalsoil responses at these locations to daily variations in precipitation and air temperature. This was done by initializing and cali-brating a forest hydrology model that has the capacity to simulate flow and retention of moisture and heat, as modified by canopyclosure, ground cover, forest-floor depth, and soil composition. The calculations and data revealed strong but predictable site-spe-cific differences in soil temperature and frost penetration (jp: 1–2 m > ta: 0. 5–1 m > bs: 0–0.5 m), in soil moisture freezing (ta <bs < jp), and in moisture retention (jp < ta < bs). Apart from daily weather, these differences depended on soil texture (loamy/sandytexture impeded/encouraged soil freezing, respectively), and on the thermal insulation and moisture retention of the combined for-est floor, moss and lichen layers (ta < jp < bs).
Key words: Jack pine, aspen, black spruce, soil moisture, soil temperature, frost penetration, snowpack, boreal conditions
Balland, V., Bhatti, J., Errington, R., Castonguay, M. et Arp, P. A. 2006. Modélisation de la couche de neige et des conditionsthermiques et hygrométriques du sol sous des forets de pin gris, épinette noire et tremble dans le centre de la Saskatchewan(BOREAS SSA). Can. J. Soil Sci. 86: 203–217. Les impacts du changement climatique sur les conditions thermiques ethygrométriques des sols ont été modélisés, afin que d’autres impacts puissent être correctement prédits, comme, e.g., des puitslocaux de carbone(C), de nutriments et de polluants comme Hg. Cet article décrit comment les données de 1998 à 2003 pour lessites « jack pine» (jp; Pinus banksiana Lamb.) (pin gris), « black spruce » (bs; Picea mariana) (épinette noire), et « aspen » (ta;Populus tremuloides) (tremble) de la région sud du projet BOREAS ont été utilisées pour estimer les réactions hydrologiques etthermiques des sols à ces endroits dues aux variations journalières des précipitations et de la température de l’air. Ces résultats ontété obtenus grâce à l’initialisation et au calage d’un modèle d’hydrologie forestière capable de simuler les flux et accumulationsd’eau et de chaleur, en fonction de la fermeture du couvert, l’épaisseur de la couverture morte, et la composition du sol. Les sim-ulations et les données ont révélé des différences fortes mais prévisibles entre sites concernant la température du sol et la pénétra-tion du gel (jp: 1–2 m > ta: 0. 5–1 m > bs: 0–0.5 m), la quantité d’eau gelée (ta < bs < jp), et la rétention d’eau (jp < ta < bs). Misa part les variations climatiques journalières, ces différences étaient dues à la texture du sol (texture limoneuse/sableusegênant/encourageant le gel, respectivement), et à l’isolation thermique et la rétention d’humidité des couches de couverture morte,mousse et lichen combinées.
Mots clés: Pin gris, tremble, épinette noire, hygrométrie du sol, température du sol, pénétration du gel, couche de neige, conditions boréales
For the context of evaluating potential impacts of climatechange on ecosystem functioning, it has become importantto evaluate mechanisms by which forest ecosystems retainand release CO2 and other carbon-affected substances (dis-solved organic carbon, nutrients, Hg, etc.) at the soil-vege-tation-atmosphere interface, summer through winter (Pastorand Post 1988; Yu et al. 2002; Lal 2003; Grigal 2002, 2003).This importance is accentuated for the boreal region, whereclimate change is expected to have strong ecosystemimpacts through a significant and persistent change in lengthof growing season, depth of dormancy, soil moisture avail-
ability during summer, and frost-and thaw cycles duringwinter (McGuire et al. 2002). As such, dormancy, growth,drought, frost, CO2 and methane production, and nutrientand Hg uptake and release are all in step with the annualprogression of daily weather cycles, as expressed by incom-ing precipitation (rain, snow), air temperature, and the phe-nological responses of flora and fauna, and of the soil tothese cycles. In general, higher temperatures coupled withadequate moisture supply stimulate growth as well as CO2uptake and release from the ecosystem (Winston et al. 1997;Rayment and Jarvis 2000). In contrast, a decrease in annualsnowfall amounts could result in extended periods of soilfrost. Thereafter, the occurrence of soil frost would diminish
203
3To whom correspondence should be addressed.
204 CANADIAN JOURNAL OF SOIL SCIENCE
again if air temperature were to rise closer and closer toabove-zero conditions during winter.
Within each ecosystem, local differences in hydrothermalproperties above and below ground modify the extent ofwater, heat retention and frost penetration for the same localweather conditions (Sparrman et al. 2004). In turn, soil bio-logical and chemical processes such as soil respiration, soilemission of trace gases, root growth, evapotranspiration, Hgmethylization, and nutrient availability and uptake would allbe affected by local differences in soil temperature andmoisture conditions (Cao and Woodward 1998). Changes insoil moisture and temperature regimes affect forest produc-tivity directly by limiting the availability of energy, watersupply, and nutrients, on a daily basis (Kimball et al. 1997).In turn, all of this affects the general health of the forest: bydefinition, healthier vegetation has greater disease, insect,and drought resistances, and would also be adapted to makethe required dormancy adjustments to cope with the recur-ring winter conditions (Yu et al. 2002).
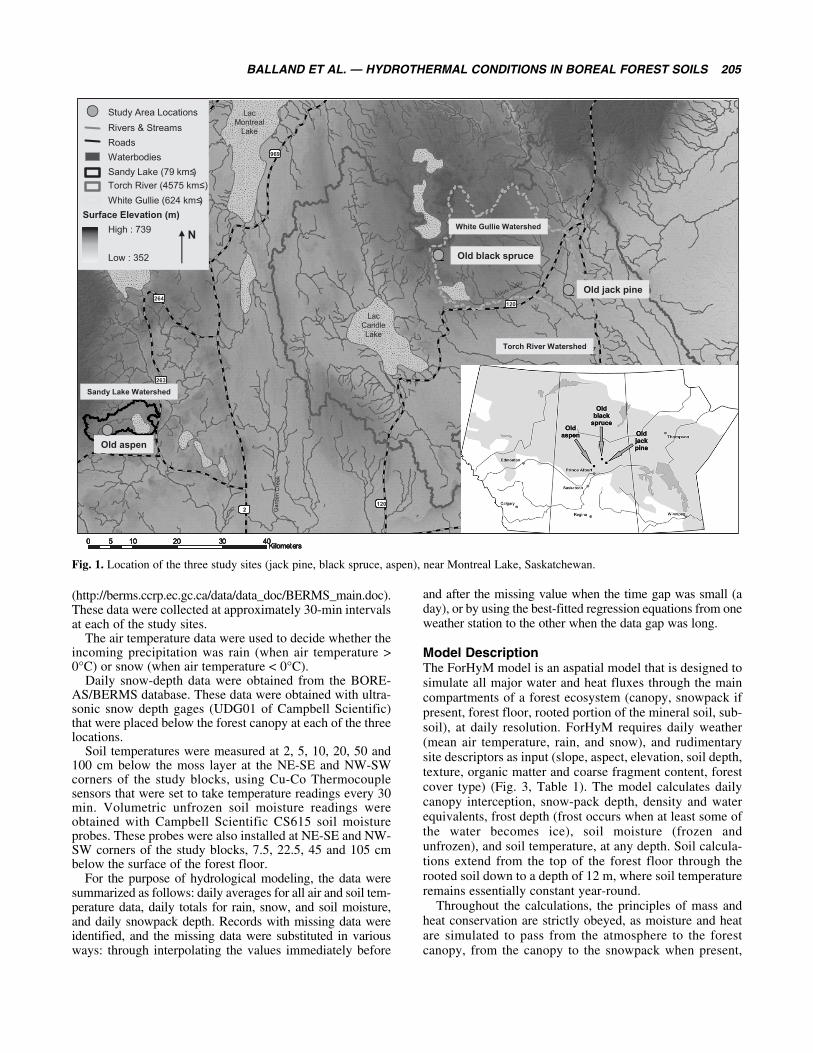
By way of the Boreal Ecosystem-Atmospheric Study(BOREAS; Hall 1999; Sellers et al. 1997) and the BorealExperimental Research and Monitoring Study (BERMS, seehttp://berms.ccrp.ec.gc.ca), data have become available thatcan be used to analyze the ecological effects of daily weath-er on soil temperature, moisture, snowpack and soil frost forselect cover types and soil combinations (Fig. 1).
The specific objective of the research summarized in thispaper was to analyze the snowpack and soil temperature andmoisture data from the three southern study site locations ofthe BOREAS Project (Figs. 1 and 2, Table 1). These datawere analyzed with the forest hydrology model ForHyM(Bhatti et al. 2000) as a theoretical and numerical guide toexplore and describe site-specific differences such as:1. the capacity of the forest canopies to retain snow, rain,
and heat, and to filter solar radiation before it reaches theground,
2. the hydrothermal properties (water retention, permeabil-ity, heat capacity, thermal conductivity) of the forestfloor, as affected by the changing soil moisture condi-tions and the type of vegetation immediately above theforest floor,
3. the pattern of lateral, downward and upward soil mois-ture flows, as affected by local topography (slope), depthto water table, and extent of soil moisture stress.The emphasis of this paper is placed on illustrating the
concepts involved, and on visually demonstrating the extentof model-data agreement that was achieved for each of thethree sites.
MATERIALS AND METHODS
Study Area and SitesThe BOREAS/BERMS study area is located in CentralSaskatchewan (Fig. 1). The terrain of this area is generallyflat to gently rolling, with mean elevation of 520 m. Thevegetation cover is predominantly coniferous, with lowspecies diversity. Understory vegetation is generally com-posed of sparse shrubs with extensive moss and lichencover. The growing season generally lasts from May to
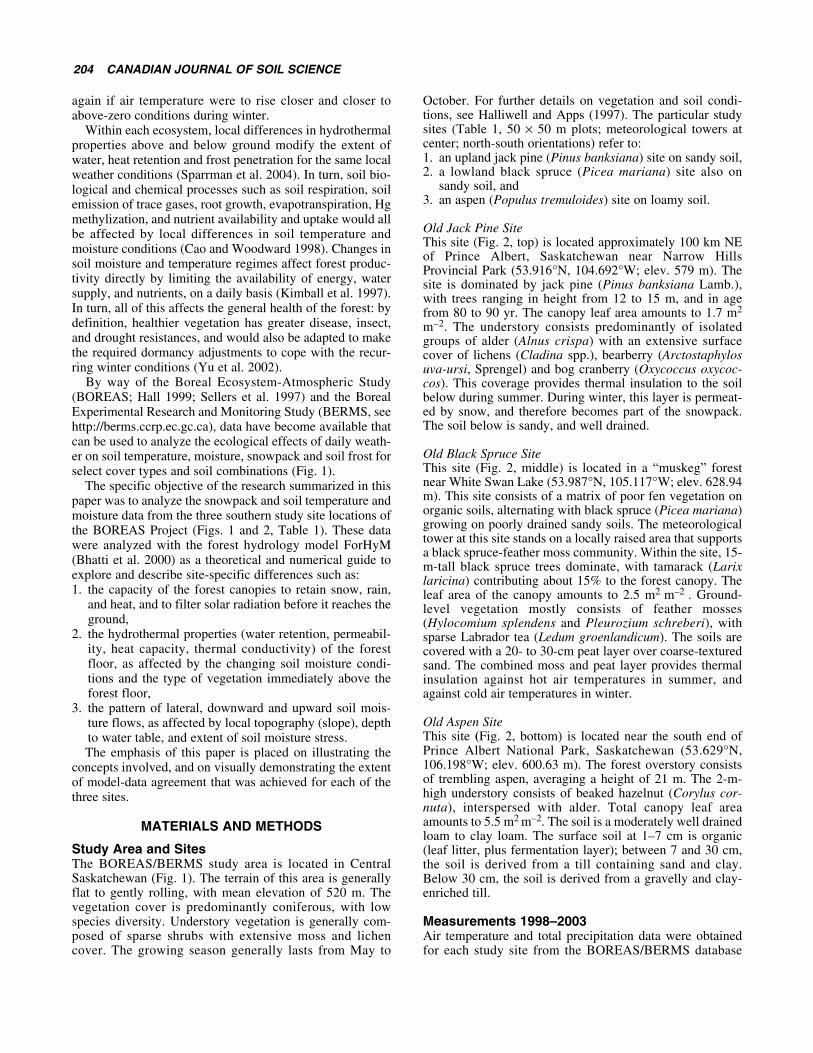
October. For further details on vegetation and soil condi-tions, see Halliwell and Apps (1997). The particular studysites (Table 1, 50 × 50 m plots; meteorological towers atcenter; north-south orientations) refer to: 1. an upland jack pine (Pinus banksiana) site on sandy soil, 2. a lowland black spruce (Picea mariana) site also on
sandy soil, and 3. an aspen (Populus tremuloides) site on loamy soil.
Old Jack Pine SiteThis site (Fig. 2, top) is located approximately 100 km NEof Prince Albert, Saskatchewan near Narrow HillsProvincial Park (53.916°N, 104.692°W; elev. 579 m). Thesite is dominated by jack pine (Pinus banksiana Lamb.),with trees ranging in height from 12 to 15 m, and in agefrom 80 to 90 yr. The canopy leaf area amounts to 1.7 m2
m–2. The understory consists predominantly of isolatedgroups of alder (Alnus crispa) with an extensive surfacecover of lichens (Cladina spp.), bearberry (Arctostaphylosuva-ursi, Sprengel) and bog cranberry (Oxycoccus oxycoc-cos). This coverage provides thermal insulation to the soilbelow during summer. During winter, this layer is permeat-ed by snow, and therefore becomes part of the snowpack.The soil below is sandy, and well drained.
Old Black Spruce SiteThis site (Fig. 2, middle) is located in a “muskeg” forestnear White Swan Lake (53.987°N, 105.117°W; elev. 628.94m). This site consists of a matrix of poor fen vegetation onorganic soils, alternating with black spruce (Picea mariana)growing on poorly drained sandy soils. The meteorologicaltower at this site stands on a locally raised area that supportsa black spruce-feather moss community. Within the site, 15-m-tall black spruce trees dominate, with tamarack (Larixlaricina) contributing about 15% to the forest canopy. Theleaf area of the canopy amounts to 2.5 m2 m–2 . Ground-level vegetation mostly consists of feather mosses(Hylocomium splendens and Pleurozium schreberi), withsparse Labrador tea (Ledum groenlandicum). The soils arecovered with a 20- to 30-cm peat layer over coarse-texturedsand. The combined moss and peat layer provides thermalinsulation against hot air temperatures in summer, andagainst cold air temperatures in winter.
Old Aspen Site This site (Fig. 2, bottom) is located near the south end ofPrince Albert National Park, Saskatchewan (53.629°N,106.198°W; elev. 600.63 m). The forest overstory consistsof trembling aspen, averaging a height of 21 m. The 2-m-high understory consists of beaked hazelnut (Corylus cor-nuta), interspersed with alder. Total canopy leaf areaamounts to 5.5 m2 m–2. The soil is a moderately well drainedloam to clay loam. The surface soil at 1–7 cm is organic(leaf litter, plus fermentation layer); between 7 and 30 cm,the soil is derived from a till containing sand and clay.Below 30 cm, the soil is derived from a gravelly and clay-enriched till.
Measurements 1998–2003Air temperature and total precipitation data were obtainedfor each study site from the BOREAS/BERMS database
BALLAND ET AL. — HYDROTHERMAL CONDITIONS IN BOREAL FOREST SOILS 205
(http://berms.ccrp.ec.gc.ca/data/data_doc/BERMS_main.doc).These data were collected at approximately 30-min intervalsat each of the study sites.
The air temperature data were used to decide whether theincoming precipitation was rain (when air temperature >0°C) or snow (when air temperature < 0°C).
Daily snow-depth data were obtained from the BORE-AS/BERMS database. These data were obtained with ultra-sonic snow depth gages (UDG01 of Campbell Scientific)that were placed below the forest canopy at each of the threelocations.
Soil temperatures were measured at 2, 5, 10, 20, 50 and100 cm below the moss layer at the NE-SE and NW-SWcorners of the study blocks, using Cu-Co Thermocouplesensors that were set to take temperature readings every 30min. Volumetric unfrozen soil moisture readings wereobtained with Campbell Scientific CS615 soil moistureprobes. These probes were also installed at NE-SE and NW-SW corners of the study blocks, 7.5, 22.5, 45 and 105 cmbelow the surface of the forest floor.
For the purpose of hydrological modeling, the data weresummarized as follows: daily averages for all air and soil tem-perature data, daily totals for rain, snow, and soil moisture,and daily snowpack depth. Records with missing data wereidentified, and the missing data were substituted in variousways: through interpolating the values immediately before
and after the missing value when the time gap was small (aday), or by using the best-fitted regression equations from oneweather station to the other when the data gap was long.
Model DescriptionThe ForHyM model is an aspatial model that is designed tosimulate all major water and heat fluxes through the maincompartments of a forest ecosystem (canopy, snowpack ifpresent, forest floor, rooted portion of the mineral soil, sub-soil), at daily resolution. ForHyM requires daily weather(mean air temperature, rain, and snow), and rudimentarysite descriptors as input (slope, aspect, elevation, soil depth,texture, organic matter and coarse fragment content, forestcover type) (Fig. 3, Table 1). The model calculates dailycanopy interception, snow-pack depth, density and waterequivalents, frost depth (frost occurs when at least some ofthe water becomes ice), soil moisture (frozen andunfrozen), and soil temperature, at any depth. Soil calcula-tions extend from the top of the forest floor through therooted soil down to a depth of 12 m, where soil temperatureremains essentially constant year-round.
Throughout the calculations, the principles of mass andheat conservation are strictly obeyed, as moisture and heatare simulated to pass from the atmosphere to the forestcanopy, from the canopy to the snowpack when present,
0 10 20 30 405Kilometers
Lac
Candle
Lake
Lac
Crean
Lake
Lac
Montreal
Lake
2
264
263
120
969
106
2
6
Ga
rde
n C
ree
k
Torch River
White Gullie
Torch River
Old aspen
Old black spruce
Old jack pine
120
55
Sandy Lake Watershed
Torch River Watershed
White Gullie Watershed
!Z Study Area Locations
Rivers & Streams
Roads
Waterbodies
Sandy Lake (79 km≤)
Torch River (4575 km≤)
White Gullie (624 km≤)
Surface Elevation (m)
High : 739
Low : 352
N
Fig. 1. Location of the three study sites (jack pine, black spruce, aspen), near Montreal Lake, Saskatchewan.
206 CANADIAN JOURNAL OF SOIL SCIENCE
from the snowpack when present to the forest floor, andfrom the forest floor to the soil and to the subsoil. The heatflow calculations for the snowpack and the underlying soillayers are based on determining the temperature at theground surface by considering the energy balance at thissurface. This balance is obtained by explicitly addressing allmajor incoming and outgoing heat fluxes. The transmissionof heat from one soil layer to the next is based on an implic-it difference formulation of the heat flow equation, and byaccounting for changes in heat capacity and thermal con-ductivity as these parameters change with texture, soil bulkdensity, organic matter and coarse fragment content, soilmoisture, and change of phase (Arp and Yin 1992; Yin andArp 1993). For a more recent update on theoretical andnumerical developments regarding hydrothermal flowthrough frozen and unfrozen soils, see Webb (1997), Peckand O’Neill (1997), and Albert et al. (2000).
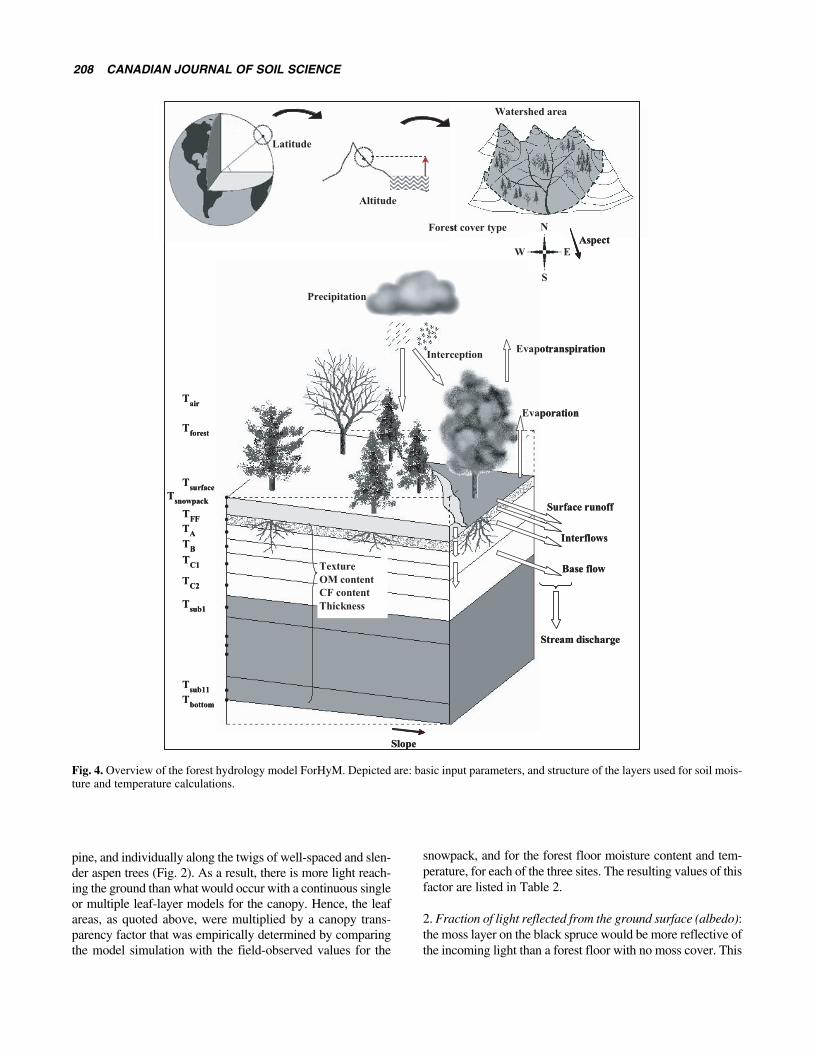
The application of ForHyM to each of the three study sitesis schematically represented in Fig. 4, in reference to the
hydrothermal summer and winter configurations of the min-eral soil, forest floor, snow, and other layers when present(i.e., moss, reindeer lichen, shrubs). Further details about thesoil conditions at each site as needed for the modeling pur-pose are presented in Tables 1 and 2.
Theoretical ConsiderationsPrior to this application, the model was calibrated for forestconditions at Kejimkujik National Park in Nova Scotia(Balland 2002), within the forest of the University of NewBrunswick in Fredericton (Balland 2002), within deciduousand coniferous forest conditions in Northern NewBrunswick (Steeves 2004), and within the Turkey Lakeswatershed in Ontario (Arp and Yin 1992; Yin and Arp1993). These calibrations led to a generalized means to ini-tialize the model, by starting with hydrothermally derived“default” values for the parameters that are used to calcu-late interception (precipitation, light), snow-pack density,
Fig. 2. Photographs of below (left) and above (right) forest canopy conditions of the jack pine (top), black spruce (middle) and aspen (bot-tom) sites of this study.
BALLAND ET AL. — HYDROTHERMAL CONDITIONS IN BOREAL FOREST SOILS 207
snowmelt, infiltration, interflow, percolation, moisture andheat retention, and thermal conduction. These values wereobtained from a semi-empirical analysis of local and glob-al soil data that relate:• soil bulk density to soil texture, organic matter content
and soil depth, • water retention and soil moisture flow to soil porosity,
texture and organic matter, and• soil thermal conductivity to texture, organic matter,
coarse fragment content, soil mineralogy and soil mois-ture (Balland 2002; Balland and Arp 2005).
Running the model for each site based on its local weath-er and soil information showed that the model performedwell, but also required a number of process-based adjust-ments to get the best possible data-model agreement forthe snowpack, the soil temperature, and the unfrozen soilmoisture content. These were the main adjustments:
1. Canopy transparency: foliage within boreal forest canopiesis generally not uniformly distributed across the entire area,but occurs: in the narrow crowns of well-spaced black sprucetrees, in bunches along branches and twigs of well-spaced jack
Table 1. ForHyM initialization: soil profile specifications for the jack pine, black spruce and aspen sites of the study area
Site Soil layers Thickness (cm) Texture OM fraction
Jack pine Forest floor 3–9z 0.515 A 30 Sand 0.003 B 30 Sand 0.001 C1 45 Sand 0.001 C2 45 Sand 0.001 Subsoil layers 100 Sand 0
zForest floor thickness = 3 cm; reindeer moss thickness = 6 cm in summer, permeated by snow in winter. yForest floor thickness = 10 cm; moss layer on top = 5 cm.
Sand
Lichens
Forest floor
Snowpack
Loam
Sandy loam
Sandy clay loam1m
Moss
1m1m
Sand
Lichens
Forest floor
Snowpack
Loam
Sandy loam
Sandy clay loam
1m
Loamy sand
Sandy loam
Sand
1m1m
Jack pine Black spruce Aspen
Sand
Lichens
Forest floor
Snowpack
Loam
Sandy loam
Sandy clay loam1m
Moss
1m1m
Sand
Lichens
Forest floor
Snowpack
Loam
Sandy loam
Sandy clay loam
1m
Loamy sand
Sandy loam
Sand
1m1m
Jack pine Black spruce Aspen
Fig. 3. Approximate locations of the temperature (circles) and soil moisture (squares) sensors within the soil profiles at the three study sites;results are shown for the solid symbols only.
208 CANADIAN JOURNAL OF SOIL SCIENCE
pine, and individually along the twigs of well-spaced and slen-der aspen trees (Fig. 2). As a result, there is more light reach-ing the ground than what would occur with a continuous singleor multiple leaf-layer models for the canopy. Hence, the leafareas, as quoted above, were multiplied by a canopy trans-parency factor that was empirically determined by comparingthe model simulation with the field-observed values for the
snowpack, and for the forest floor moisture content and tem-perature, for each of the three sites. The resulting values of thisfactor are listed in Table 2.
2. Fraction of light reflected from the ground surface (albedo):the moss layer on the black spruce would be more reflective ofthe incoming light than a forest floor with no moss cover. This
Base flow
Slope
TA
TB
TFF
TC1
Tsub1
Tsub11
Tsurface
Tforest
Tair
Interception
Evaporation
Surface runoff
Evapotranspiration
TC2
Tsnowpack
Tbottom
Stream discharge
Interflows
Precipitation
Texture
OM content
CF content
Thickness
Latitude
Altitude
Watershed area
S
N
Aspect
Forest cover type
Base flow
Slope
TA
TB
TFF
TC1
Tsub1
Tsub11
Tsurface
Tforest
Tair
Interception
Evaporation
Surface runoff
Evapotranspiration
TC2
Tsnowpack
Tbottom
Stream discharge
Interflows
Precipitation
Texture
OM content
CF content
Thickness
Latitude
Altitude
Watershed area
SAspect
Forest cover type N
S
W E
Fig. 4. Overview of the forest hydrology model ForHyM. Depicted are: basic input parameters, and structure of the layers used for soil mois-ture and temperature calculations.
BALLAND ET AL. — HYDROTHERMAL CONDITIONS IN BOREAL FOREST SOILS 209
consideration implied that an upward adjustment needed to bemade to the default value for the ground-surface albedo (itsdefault value represents the no-moss cover situation, midday,mid-summer). For the moss-covered ground surface of theblack spruce site, the best-fitted albedo value was found to be0.25. For the aspen and jack pine site, the albedo remained atits default value of 0.12.
3. Reducing the near-ground air temperatures of the blackspruce site by 1.6°C, year-round: the soil temperature sim-ulations for this site indicated that the air temperature nearthe ground level needed to be consistently cooler than whatwas suggested by the on-site air temperature measurements;this adjustment was not needed for the other two sites. Asomewhat cooler ground temperature than elsewhere is gen-erally obtained with moist-to-wet ground surface conditionsin depressions, especially under forest cover.
4. Adjusting snowfall amounts at the jack pine site: thesnowpack simulations required that the snow input for thesite be increased by a factor of 1.25. This increase could bedue to a slightly better snow-catch efficiency of the jackpine canopy than the other two sites. Greater snow-catchefficiency might be indicated by the differences in branch,twig and foliage architectures during winter.
5. Adjusting the default value for the hydrothermal parame-ters of the snow-pack and soil, by layer: the default values forsoil bulk density, field capacity, permanent wilting point,thermal conductivity, heat capacity, and soil permeability atsaturation were generated for the forest floor, the A, B and Clayers, and the subsoil layers, based on the information listed
in Table 1, as described by Balland (2002). These default val-ues remained untouched, except for the permeability and ther-mal conductivity adjustments noted in Table 2. Among these,the largest adjustments needed to be made for the downwardflow (infiltration) for the aspen site (a reduction of 500), thelateral flow (interflow) for the A and B layers of the jack pineand black spruce sites (a reduction by 200), and the lateralflow for the subsoil of the jack pine site (an increase by 20).The reasons for these changes vary: lateral and downwardflow of water can, in general, not be expected to be the same,even under the same hydraulic gradient. For example, in themore porous top soil, lateral flow would only occur when thesubsoil is saturated. In contrast, lateral flow would dominatein the more compacted subsoils, due to a gradually increasingsoil bulk density. Within ForHyM, it is assumed that down-ward percolation is restricted, on a daily basis, by the avail-ability of unsaturated pores, and by the permeability of eachsoil layer. Lateral flow is initiated once the soil moisture con-tent in any layer exceeds the field capacity of that layer, andwhen the layer below that layer is saturated, i.e., cannotaccommodate more water. The actual amount of “net lateralflow loss” from each soil layer is subject to calibration, toaccount for site-specific “obstacle” variations against lateralflow, especially in top soils (e.g., changes in terrain, slope,mounds and pits, soil density, and soil composition). Lateralas well as downward flows are assumed to follow Darcy’slaw, with the appropriate considerations made to defining theaverage length of the vertical and lateral flow-paths at eachsite, and to determining the associated hydraulic gradients.For lateral flows, flow-path length and gradients were relatedto the average ridge-to-valley length, and to the difference inelevation. For vertical flow, flow-path length and gradients
Table 2. Model calibrations for the jack pine, black spruce and aspen sites of the study area
Canopy Air Thermal Maximumtransparency Snowfall temperature Permeability adjustments conductivityz frost
Site adjustments adjustments adjustments Soil layers downward lateral adjustments fractiony
Subsoil (deeper) 0.002 0.2 0.74 –zAdjustments to default modeled thermal conductivities (multipliers).yLimit of the ice/(water + ice) fraction for each soil layer.
210 CANADIAN JOURNAL OF SOIL SCIENCE
were obtained from layer depth and depth of saturation abovethat layer.
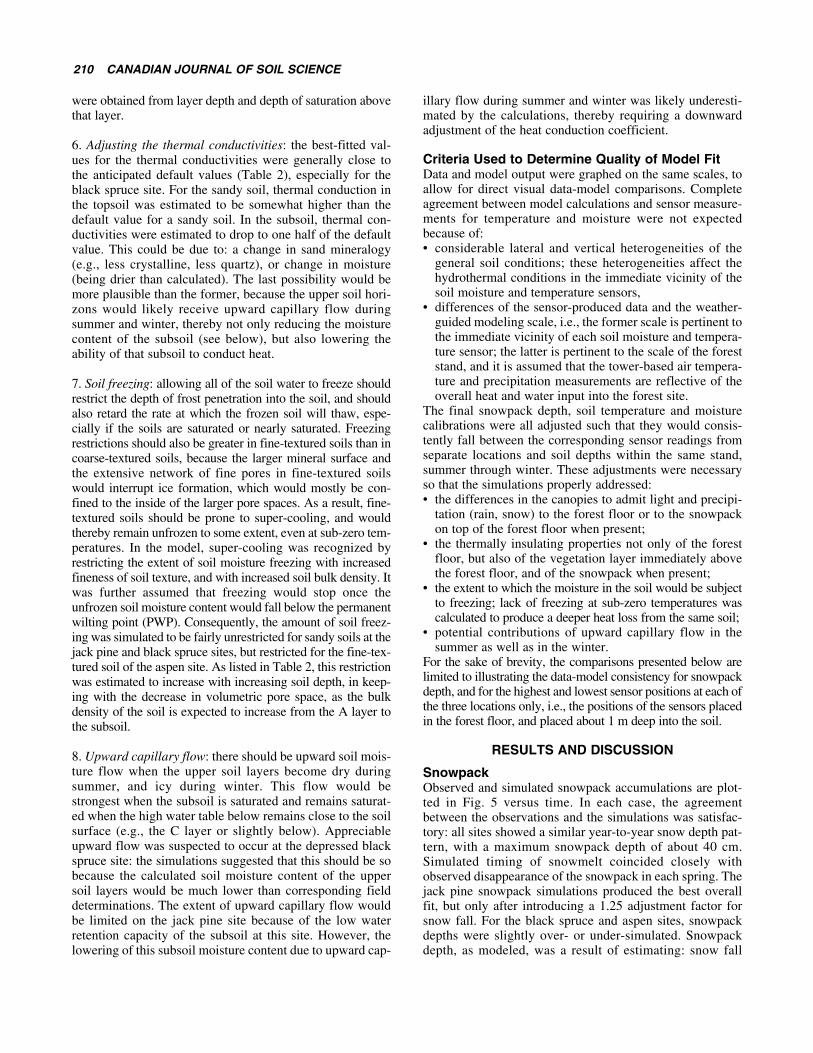
6. Adjusting the thermal conductivities: the best-fitted val-ues for the thermal conductivities were generally close tothe anticipated default values (Table 2), especially for theblack spruce site. For the sandy soil, thermal conduction inthe topsoil was estimated to be somewhat higher than thedefault value for a sandy soil. In the subsoil, thermal con-ductivities were estimated to drop to one half of the defaultvalue. This could be due to: a change in sand mineralogy(e.g., less crystalline, less quartz), or change in moisture(being drier than calculated). The last possibility would bemore plausible than the former, because the upper soil hori-zons would likely receive upward capillary flow duringsummer and winter, thereby not only reducing the moisturecontent of the subsoil (see below), but also lowering theability of that subsoil to conduct heat.
7. Soil freezing: allowing all of the soil water to freeze shouldrestrict the depth of frost penetration into the soil, and shouldalso retard the rate at which the frozen soil will thaw, espe-cially if the soils are saturated or nearly saturated. Freezingrestrictions should also be greater in fine-textured soils than incoarse-textured soils, because the larger mineral surface andthe extensive network of fine pores in fine-textured soilswould interrupt ice formation, which would mostly be con-fined to the inside of the larger pore spaces. As a result, fine-textured soils should be prone to super-cooling, and wouldthereby remain unfrozen to some extent, even at sub-zero tem-peratures. In the model, super-cooling was recognized byrestricting the extent of soil moisture freezing with increasedfineness of soil texture, and with increased soil bulk density. Itwas further assumed that freezing would stop once theunfrozen soil moisture content would fall below the permanentwilting point (PWP). Consequently, the amount of soil freez-ing was simulated to be fairly unrestricted for sandy soils at thejack pine and black spruce sites, but restricted for the fine-tex-tured soil of the aspen site. As listed in Table 2, this restrictionwas estimated to increase with increasing soil depth, in keep-ing with the decrease in volumetric pore space, as the bulkdensity of the soil is expected to increase from the A layer tothe subsoil.
8. Upward capillary flow: there should be upward soil mois-ture flow when the upper soil layers become dry duringsummer, and icy during winter. This flow would bestrongest when the subsoil is saturated and remains saturat-ed when the high water table below remains close to the soilsurface (e.g., the C layer or slightly below). Appreciableupward flow was suspected to occur at the depressed blackspruce site: the simulations suggested that this should be sobecause the calculated soil moisture content of the uppersoil layers would be much lower than corresponding fielddeterminations. The extent of upward capillary flow wouldbe limited on the jack pine site because of the low waterretention capacity of the subsoil at this site. However, thelowering of this subsoil moisture content due to upward cap-
illary flow during summer and winter was likely underesti-mated by the calculations, thereby requiring a downwardadjustment of the heat conduction coefficient.
Criteria Used to Determine Quality of Model FitData and model output were graphed on the same scales, toallow for direct visual data-model comparisons. Completeagreement between model calculations and sensor measure-ments for temperature and moisture were not expectedbecause of:• considerable lateral and vertical heterogeneities of the
general soil conditions; these heterogeneities affect thehydrothermal conditions in the immediate vicinity of thesoil moisture and temperature sensors,
• differences of the sensor-produced data and the weather-guided modeling scale, i.e., the former scale is pertinent tothe immediate vicinity of each soil moisture and tempera-ture sensor; the latter is pertinent to the scale of the foreststand, and it is assumed that the tower-based air tempera-ture and precipitation measurements are reflective of theoverall heat and water input into the forest site.
The final snowpack depth, soil temperature and moisturecalibrations were all adjusted such that they would consis-tently fall between the corresponding sensor readings fromseparate locations and soil depths within the same stand,summer through winter. These adjustments were necessaryso that the simulations properly addressed:• the differences in the canopies to admit light and precipi-
tation (rain, snow) to the forest floor or to the snowpackon top of the forest floor when present;
• the thermally insulating properties not only of the forestfloor, but also of the vegetation layer immediately abovethe forest floor, and of the snowpack when present;
• the extent to which the moisture in the soil would be subjectto freezing; lack of freezing at sub-zero temperatures wascalculated to produce a deeper heat loss from the same soil;
• potential contributions of upward capillary flow in thesummer as well as in the winter.
For the sake of brevity, the comparisons presented below arelimited to illustrating the data-model consistency for snowpackdepth, and for the highest and lowest sensor positions at each ofthe three locations only, i.e., the positions of the sensors placedin the forest floor, and placed about 1 m deep into the soil.
RESULTS AND DISCUSSION
SnowpackObserved and simulated snowpack accumulations are plot-ted in Fig. 5 versus time. In each case, the agreementbetween the observations and the simulations was satisfac-tory: all sites showed a similar year-to-year snow depth pat-tern, with a maximum snowpack depth of about 40 cm.Simulated timing of snowmelt coincided closely withobserved disappearance of the snowpack in each spring. Thejack pine snowpack simulations produced the best overallfit, but only after introducing a 1.25 adjustment factor forsnow fall. For the black spruce and aspen sites, snowpackdepths were slightly over- or under-simulated. Snowpackdepth, as modeled, was a result of estimating: snow fall
BALLAND ET AL. — HYDROTHERMAL CONDITIONS IN BOREAL FOREST SOILS 211
from total daily precipitation and air temperature, snowinterception, and snow pack density. Snow interception washighest for the black spruce site, intermediate for jack pinesite, and least for the aspen site, as to be expected from theactual amount of forest leaf area during winter. Initial snow-pack density (density of freshly fallen snow) was allowed tovary from 0.10 (aspen, black spruce) to 0.11 g cm–3 (jackpine). Variations in the field would likely be larger than this,and the numbers would also increase towards higher values(e.g., 0.15 g cm–3) in warmer winters. Overall, the snowpacksimulations produced a good correspondence between thesimulated and field-observed snowmelt season at each site.
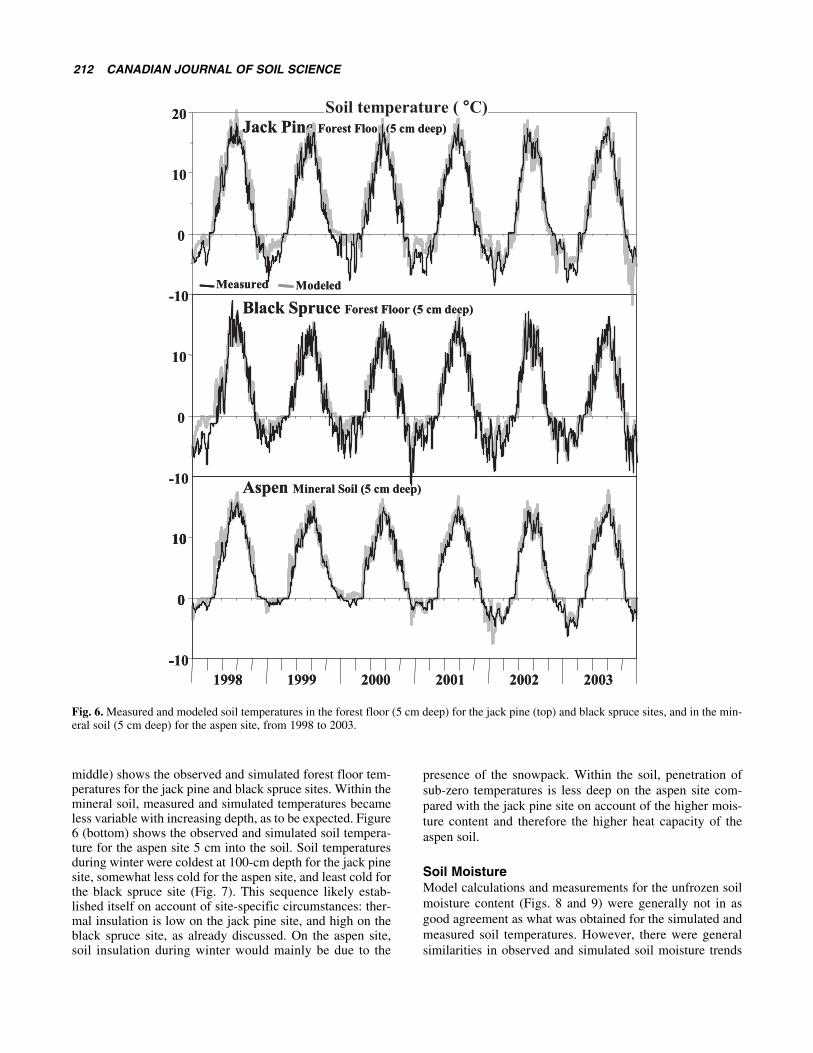
Soil Temperature Simulated and measured soil temperatures were also in goodagreement, as shown in Figs. 6 and 7 at 5 cm below the for-est floor (jack pine, black spruce) or 5 cm below the miner-al soil surface (aspen), and at 1 m depth for all three sites.The agreement at the other monitored soil depths was simi-lar across all sites. For the forest floor, measured and simu-lated temperatures were found to be warmer in summerunder jack pine than under black spruce. During summer,the forest floor was simulated to be warmer for the jack pinesite when the insulating effect of the reindeer lichen layerwas ignored. During winter, sub-zero forest floor tempera-tures were quite variable from day to day. Figure 6 (top,
0
20
40
60
1998 1999 2000 2001 2002 2003
0
20
40
60
Snow depth (cm)
0
20
40
60
80Measured
Modeled Jack Pine
Black Spruce
Aspen
60
Snow depth (cm)
0
20
40
60
1998 1999 2000 2001 2002 2003
0
20
40
60
Snow depth (cm)
0
20
40
60
80Measured
Modeled Jack Pine
Black Spruce
Aspen
60
Snow depth (cm)
Fig. 5. Measured and modeled snowpack accumulations at the three study sites, from 1998 to 2003.
212 CANADIAN JOURNAL OF SOIL SCIENCE
middle) shows the observed and simulated forest floor tem-peratures for the jack pine and black spruce sites. Within themineral soil, measured and simulated temperatures becameless variable with increasing depth, as to be expected. Figure6 (bottom) shows the observed and simulated soil tempera-ture for the aspen site 5 cm into the soil. Soil temperaturesduring winter were coldest at 100-cm depth for the jack pinesite, somewhat less cold for the aspen site, and least cold forthe black spruce site (Fig. 7). This sequence likely estab-lished itself on account of site-specific circumstances: ther-mal insulation is low on the jack pine site, and high on theblack spruce site, as already discussed. On the aspen site,soil insulation during winter would mainly be due to the
presence of the snowpack. Within the soil, penetration ofsub-zero temperatures is less deep on the aspen site com-pared with the jack pine site on account of the higher mois-ture content and therefore the higher heat capacity of theaspen soil.
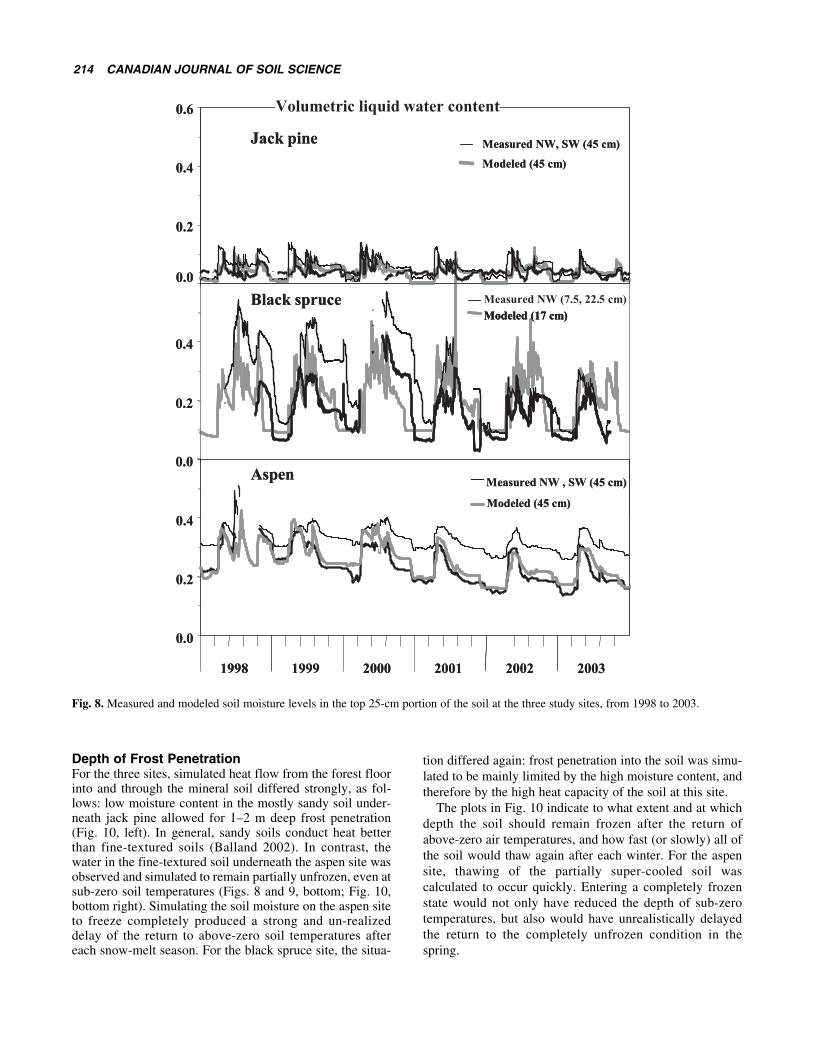
Soil MoistureModel calculations and measurements for the unfrozen soilmoisture content (Figs. 8 and 9) were generally not in asgood agreement as what was obtained for the simulated andmeasured soil temperatures. However, there were generalsimilarities in observed and simulated soil moisture trends
Jack Pine Forest Floor (5 cm deep)
Black Spruce Forest Floor (5 cm deep)
Aspen Mineral Soil (5 cm deep)
Soil temperature ( °C)
-10
0
10
20
Measured Modeled
-10
0
10
-10
0
10
-
0
10
1998 1999 2000 2001 2002 2003
Jack Pine Forest Floor (5 cm deep)
Black Spruce Forest Floor (5 cm deep)
Aspen Mineral Soil (5 cm deep)
Soil temperature ( °C)
-10
0
10
20
Measured Modeled
-10
0
10
-10
0
10
-
0
10
1998 1999 2000 2001 2002 2003
Fig. 6. Measured and modeled soil temperatures in the forest floor (5 cm deep) for the jack pine (top) and black spruce sites, and in the min-eral soil (5 cm deep) for the aspen site, from 1998 to 2003.
BALLAND ET AL. — HYDROTHERMAL CONDITIONS IN BOREAL FOREST SOILS 213
with regard to season, in spite of major differences in covertype and soil texture among the three sites. Variations with-in the data, and variations in the comparisons between thefield determinations and the simulations were likely due todifferences in local conditions (fine-scale mounds anddepressions), and actual sensor surroundings. Here, soilorganic matter, texture and coarse fragment content as wellas soil bulk density next to each sensor would determinewhat the actual soil moisture reading would be at thatlocation. In contrast, the model calculations correspond toaverage soil conditions only, based on the soil textureand organic matter estimates in Table 1. Since theseestimates were used to calculate soil pore space, soilsaturation point, field capacity, permanent wilting pointand soil permeability, it is therefore not surprising that
any two soil moisture probes, even when placed at the samedepth but at different locations within the stand, differfrom one another, and from the estimated model values aswell.
Simulated soil moisture levels were found to be driftingtowards lower values during extended periods of droughtand frost when no allowance was made for upward capillaryflow. During summer, upward capillary flow was set tooccur in proportion to the difference between the soil mois-ture content between the soil layers from top to bottom.During winter, upward capillary flow was set to be propor-tional to the extent of ice formation in the soil. This extrawater would not add to the general soil moisture level, butwould accumulate as ice in the soil layer with the freezingfront.
Fig. 7. Measured and modeled soil temperatures 100 cm below the soil surface at the three study sites, from 1998 to 2003.
214 CANADIAN JOURNAL OF SOIL SCIENCE
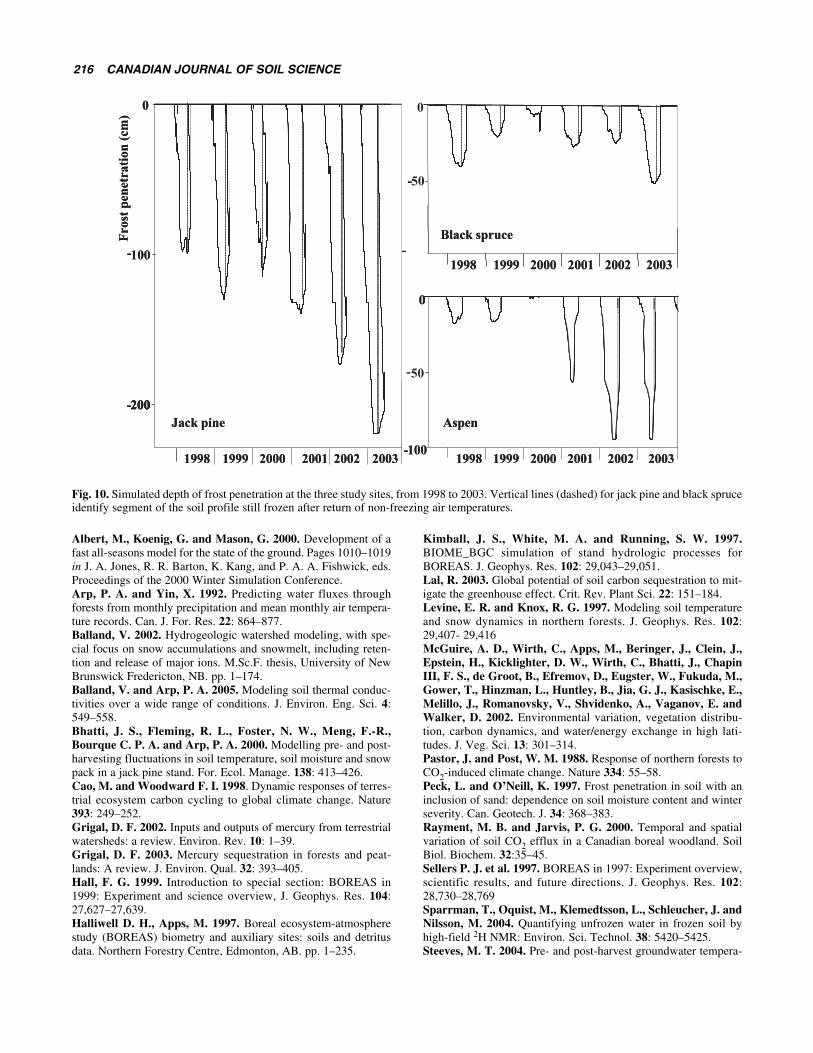
Depth of Frost PenetrationFor the three sites, simulated heat flow from the forest floorinto and through the mineral soil differed strongly, as fol-lows: low moisture content in the mostly sandy soil under-neath jack pine allowed for 1–2 m deep frost penetration(Fig. 10, left). In general, sandy soils conduct heat betterthan fine-textured soils (Balland 2002). In contrast, thewater in the fine-textured soil underneath the aspen site wasobserved and simulated to remain partially unfrozen, even atsub-zero soil temperatures (Figs. 8 and 9, bottom; Fig. 10,bottom right). Simulating the soil moisture on the aspen siteto freeze completely produced a strong and un-realizeddelay of the return to above-zero soil temperatures aftereach snow-melt season. For the black spruce site, the situa-
tion differed again: frost penetration into the soil was simu-lated to be mainly limited by the high moisture content, andtherefore by the high heat capacity of the soil at this site.
The plots in Fig. 10 indicate to what extent and at whichdepth the soil should remain frozen after the return ofabove-zero air temperatures, and how fast (or slowly) all ofthe soil would thaw again after each winter. For the aspensite, thawing of the partially super-cooled soil wascalculated to occur quickly. Entering a completely frozenstate would not only have reduced the depth of sub-zerotemperatures, but also would have unrealistically delayedthe return to the completely unfrozen condition in thespring.
0.0
0.2
0.4
1998 1999 2000 2001 2002 2003
Jack pine
Black spruce
Aspen0.0
0.2
0.4
Modeled (17 cm)
0.0
Volumetric liquid water content
0.2
0.4
0.6
Measured NW, SW (45 cm)
Modeled (45 cm)
Measured NW , SW (45 cm)
Modeled (45 cm)
Measured NW (7.5, 22.5 cm)
0.0
0.2
0.4
1998 1999 2000 2001 2002 2003
Jack pine
Black spruce
Aspen0.0
0.2
0.4
Modeled (17 cm)Modeled (17 cm)
0.0
Volumetric liquid water content
0.2
0.4
0.6
Measured NW, SW (45 cm)
Modeled (45 cm)
Measured NW , SW (45 cm)
Modeled (45 cm)
Measured NW (7.5, 22.5 cm)
Fig. 8. Measured and modeled soil moisture levels in the top 25-cm portion of the soil at the three study sites, from 1998 to 2003.
BALLAND ET AL. — HYDROTHERMAL CONDITIONS IN BOREAL FOREST SOILS 215
Thawing of the soil was calculated to occur more quicklyfrom the top downward, than from the bottom upwards. Thiswas a direct reflection of the difference in soil temperaturegradients: steep on the top as the surface soil adjusts to thequickly changing weather conditions above, and shallowbelow, on account of small temperature differences withincreasing soil depth. The time required for the jack pineand black spruce soil to thaw completely after the return ofabove-zero temperatures was calculated to vary from about2 wk to 2 mo: as to be expected, years with deep frost pen-etration also had a prolonged thawing period.
CONCLUSIONAltogether, the data and the model calculations of this studyrevealed a rich and site-dependent complexity of year-roundhydrothermal responses to changing weather conditions at
the three boreal forest sites. With ForHyM and other simi-larly designed forest hydrology models (e.g., Levine andKnox 1997), these complexities can now be addressed forthe purpose of further exploring hydrologically based C,nutrient and Hg responses to changing forest and climateconditions, summer-through-winter.
ACKNOWLEDGMENTSThis work was facilitated by the BOREAS/BERMS project.Certain components of the field research and related dataassembly were financed, in part, by CFS, Natural ResourcesCanada. Mapping information was supplied by Brent Joss,GIS Analyst SNP/NoFC/CFS. ForHyM model derivation andcalculations were executed at UNB, with support from anNSERC Discovery Grant to PAA, and the NSERC-supportedCollaborative Mercury Research Network (COMERN).
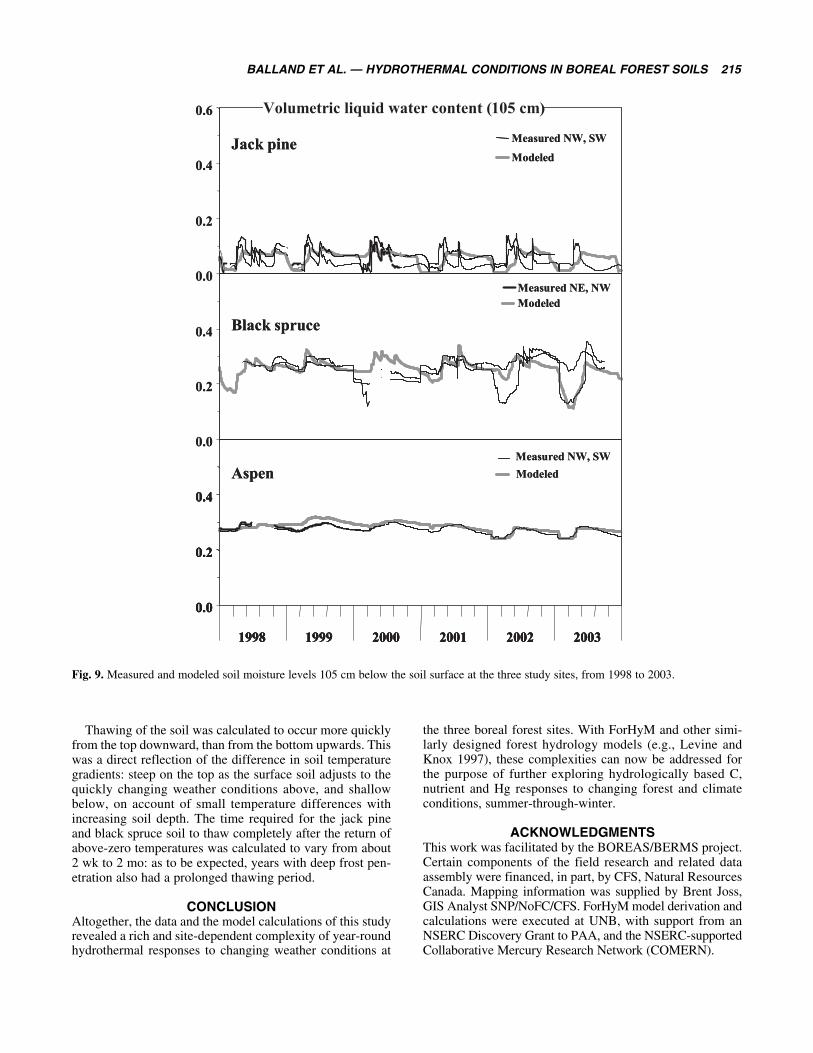
Fig. 9. Measured and modeled soil moisture levels 105 cm below the soil surface at the three study sites, from 1998 to 2003.
216 CANADIAN JOURNAL OF SOIL SCIENCE
Albert, M., Koenig, G. and Mason, G. 2000. Development of afast all-seasons model for the state of the ground. Pages 1010–1019in J. A. Jones, R. R. Barton, K. Kang, and P. A. A. Fishwick, eds.Proceedings of the 2000 Winter Simulation Conference. Arp, P. A. and Yin, X. 1992. Predicting water fluxes throughforests from monthly precipitation and mean monthly air tempera-ture records. Can. J. For. Res. 22: 864–877.Balland, V. 2002. Hydrogeologic watershed modeling, with spe-cial focus on snow accumulations and snowmelt, including reten-tion and release of major ions. M.Sc.F. thesis, University of NewBrunswick Fredericton, NB. pp. 1–174.Balland, V. and Arp, P. A. 2005. Modeling soil thermal conduc-tivities over a wide range of conditions. J. Environ. Eng. Sci. 4:549–558.Bhatti, J. S., Fleming, R. L., Foster, N. W., Meng, F.-R.,Bourque C. P. A. and Arp, P. A. 2000. Modelling pre- and post-harvesting fluctuations in soil temperature, soil moisture and snowpack in a jack pine stand. For. Ecol. Manage. 138: 413–426. Cao, M. and Woodward F. I. 1998. Dynamic responses of terres-trial ecosystem carbon cycling to global climate change. Nature393: 249–252.Grigal, D. F. 2002. Inputs and outputs of mercury from terrestrialwatersheds: a review. Environ. Rev. 10: 1–39.Grigal, D. F. 2003. Mercury sequestration in forests and peat-lands: A review. J. Environ. Qual. 32: 393–405.Hall, F. G. 1999. Introduction to special section: BOREAS in1999: Experiment and science overview, J. Geophys. Res. 104:27,627–27,639.Halliwell D. H., Apps, M. 1997. Boreal ecosystem-atmospherestudy (BOREAS) biometry and auxiliary sites: soils and detritusdata. Northern Forestry Centre, Edmonton, AB. pp. 1–235.
Kimball, J. S., White, M. A. and Running, S. W. 1997.BIOME_BGC simulation of stand hydrologic processes forBOREAS. J. Geophys. Res. 102: 29,043–29,051.Lal, R. 2003. Global potential of soil carbon sequestration to mit-igate the greenhouse effect. Crit. Rev. Plant Sci. 22: 151–184.Levine, E. R. and Knox, R. G. 1997. Modeling soil temperatureand snow dynamics in northern forests. J. Geophys. Res. 102:29,407- 29,416McGuire, A. D., Wirth, C., Apps, M., Beringer, J., Clein, J.,Epstein, H., Kicklighter, D. W., Wirth, C., Bhatti, J., ChapinIII, F. S., de Groot, B., Efremov, D., Eugster, W., Fukuda, M.,Gower, T., Hinzman, L., Huntley, B., Jia, G. J., Kasischke, E.,Melillo, J., Romanovsky, V., Shvidenko, A., Vaganov, E. andWalker, D. 2002. Environmental variation, vegetation distribu-tion, carbon dynamics, and water/energy exchange in high lati-tudes. J. Veg. Sci. 13: 301–314. Pastor, J. and Post, W. M. 1988. Response of northern forests toCO2-induced climate change. Nature 334: 55–58.Peck, L. and O’Neill, K. 1997. Frost penetration in soil with aninclusion of sand: dependence on soil moisture content and winterseverity. Can. Geotech. J. 34: 368–383.Rayment, M. B. and Jarvis, P. G. 2000. Temporal and spatialvariation of soil CO2 efflux in a Canadian boreal woodland. SoilBiol. Biochem. 32:35–45.Sellers P. J. et al. 1997. BOREAS in 1997: Experiment overview,scientific results, and future directions. J. Geophys. Res. 102:28,730–28,769Sparrman, T., Oquist, M., Klemedtsson, L., Schleucher, J. andNilsson, M. 2004. Quantifying unfrozen water in frozen soil byhigh-field 2H NMR: Environ. Sci. Technol. 38: 5420–5425.Steeves, M. T. 2004. Pre- and post-harvest groundwater tempera-
-100
-50
0
1999 2000 2002 200320011998
--100
0
-200
1999 2000 2002 200320011998
-50
0
Jack pine
1999 2000 2002 200320011998
Black spruceFro
st p
enet
rati
on
(cm
)
0
200
-
Aspen
-100
-50
0
1999 2000 2002 200320011998
--100
0
-200
1999 2000 2002 200320011998
-50
0
Jack pine
1999 2000 2002 200320011998
Black spruceFro
st p
enet
rati
on
(cm
)
0
200
-
Aspen
Fig. 10. Simulated depth of frost penetration at the three study sites, from 1998 to 2003. Vertical lines (dashed) for jack pine and black spruceidentify segment of the soil profile still frozen after return of non-freezing air temperatures.
BALLAND ET AL. — HYDROTHERMAL CONDITIONS IN BOREAL FOREST SOILS 217
tures, and levels, in upland forest catchments in Northern NewBrunswick. M.Sc.F. thesis, University of New BrunswickFredericton, NB.Webb, F. M., 1997. Computer modeling of temperature profiles infreezing ground. M.Sc. thesis. The University of British Columbia,Vancouver, BC. pp. 1–87.Winston, G., Sundquist, E. T., Stephen, B. B. and Trumbore, S.E. 1997. Winter CO2 fluxes in a boreal forest. JGR Atmosphere.102: 28,795–28,804
Yin, X. and Arp, P. A. 1993. Predicting forest soil temperaturesfrom monthly air temperature and precipitation records. Can. J.For. Res. 23: 2521–2536.Yu, Z. C., Apps, M. J. and Bhatti, J. S. 2002. Implications offloristic and environmental variation for carbon cycle dynamics inboreal forest ecosystems of central Canada. J. Veg. Sci. 13:327–340.