382
COMPUTING IN CARDIOLOGY September 9-12, 2012 Kraków, Poland

COMPUTING IN CARDIOLOGY
September 9-12, 2012 Kraków, Poland


Witajcie w Krakowie! Welcome to Krakow, Bienvenu a Cracovie, Willkommen in Krakau, Здравствуйте в Кракове, Bienvenidos en Cracovia, Bienvenuto a Cracovia, Välkomna till Krakow Vitejte v Krakovie
Table of Contents Sponsors ............................................................................................. ii Letter from the President .................................................................. viii Welcome to Krakow ............................................................................ x General information ........................................................................... xii Hotels and Conference Venue ......................................................... xv
Transportation ............................................................................... xv Registration ...................................................................................xvi Internet access .............................................................................xvi Program on-line .............................................................................xvi Meals ............................................................................................ xvii Accompanying Persons .............................................................. xviii Useful numbers: ............................................................................xix
For Authors and Speakers ................................................................xix Oral Presentations ........................................................................xix Speakers ready room .................................................................... xx Poster Presentations ..................................................................... xx Rosanna Degani Young Investigator Award ................................. xx PhysioNet / Computing in Cardiology Challenge 2012 ................. xx Manuscripts ...................................................................................xxi
Conference Overview ...................................................................... xxii Sunday Symposium ..................................................................... xxii Scientific Sessions ...................................................................... xxiii Monday Social Program .............................................................. xxiii Monday Social Program Schedule .............................................. xxiv Tuesday Evening Show ...............................................................xxv Post conference tours ..................................................................xxv
Learn your first words in Polish ...................................................... xxvi Scientific Sessions Program Overview ......................................... xxviii Scientific Program ........................................................................... xxix Abstracts ............................................................................................. 1

Sponsors We would like to thank our sponsors and those who have made generous donations:
ii Computing in Cardiology 2012, Kraków, Poland

Computing in Cardiology 2012, Kraków, Poland iii

The 39-th conference on Computing in Cardiology is hosted by:
under the honorary patronage of the Mayor of the City of Krakow, Jacek Majchrowski
The CinC 2012 scientific program is endorsed by:
Official Carrier of the Conference
iv Computing in Cardiology 2012, Kraków, Poland

Computing in Cardiology 2012, Kraków, Poland v

vi Computing in Cardiology 2012, Kraków, Poland

Board of Directors and Local Committee BOARD OF DIRECTORS
President Peter Macfarlane, DSc University of Glasgow, UK
Secretary Leif Sórnmo, Dsc Lund University Lund, Sweden
Treasurer Victor Mor-Avi, PhD University of Chicago Chicago, IL,USA
Past President Harold Ostrow, MSEE Gaithersburg, MD, USA
Willem Dassen, PhD Maastricht University Maastricht, The Netherlands
Paul Kligfield, MD Weill Cornell Medical School New York, NY, USA
Pablo Laguna, PhD University of Zaragosa Zaragosa, Spain
George Moody Massachusetts Institute of Technology Cambridge, MA, USA
Dewar Finlay University of Ulster Belfast, UK
Sheryl Prucka, MSEE Park City, UT, USA
Ex-Officio ESC Representative Marek Malik, MD, PhD University of London, England
Editor, Proceedings Alan Murray, PhD Freeman Hospital Newcastle upon Tyne, UK
LOCAL COMMITTEE Piotr Augustyniak, PhD, EE, Chair Ryszard Tadeusiewicz, Professor,
Honorary Chair Joanna Grabska-Chrząstowska, PhD Andrzej Izworski, PhD Paweł Wołoszyn, PhD Anna Broniec, MS Klaudia Czopek, MS Mirosława Długosz, MS Eliasz Kańtoch, MS Tomasz Kryjak, MS Anna Mermon, MS Tomasz Pięciak, MS Magdalena Smoleń, MS
CinC 2012 SECRETARIAT ADDRESS Multidisciplinary School of engineering In Biomedicine AGH-University of Science and Technology, 30, Mickiewicz Ave. 30-059 Krakow, Poland Web site: http://cinc2012.org
Computing in Cardiology 2012, Kraków, Poland vii

Letter from the President Dear Participant, Once again, Computing in Cardiology is being held in Europe and I am very pleased to be able to welcome you to the 39th Computing in Cardiology Conference, being held in the beautiful city of Krakow. As you will read and see elsewhere, the city itself is steeped in history and I am sure you will enjoy walking around the city and visiting its environs. Notwithstanding, the whole purpose of Computing in Cardiology is to allow you to share your scientific experiences with colleagues and enjoy the exchange of information (networking!) in the best scientific tradition. At the same time, of course, I am sure you will enjoy the social aspects of Computing in Cardiology, which are always a highlight of the meeting. This year will be no exception and an additional special social event is planned on the Sunday evening after the symposium. The host of this year’s meeting, Professor Piotr Augustyniak has, for some time, been extremely keen to hold the meeting in the AGH University of Science and Technology in Krakow. He has expended a great deal of effort in organising the meeting and is keen to ensure that every delegate extracts the maximum benefit from the conference. On this occasion, there are even two preconference workshops in areas that might not normally be associated with Computing in Cardiology, e.g. cardiac surgery and cardiotoxicity prediction. I hope they will prove popular. The Board of Directors of Computing in Cardiology would like to take this opportunity to thank Professor Augustyniak most sincerely for the tremendous amount of work which he has put in to organising the meeting. He has been supported by a team of young colleagues from AGH University of Science and Technology, who must also be thanked for their enthusiastic support of arrangements. The names of the Local Organising Committee can be found elsewhere in this booklet. The Board of Directors of Computing in Cardiology continue to work hard behind the scenes throughout the year, and I must thank them all very sincerely for doing so. For example, they continue to encourage individuals to host future meetings. Each September, there is what is known as a Future Sites Meeting where those interested in hosting Computing in Cardiology outline plans for holding the meeting in their own city. While we know that the 2013 meeting will be held in Zaragoza in Spain and the 2014 meeting will be held in the Boston area, Massachusetts, there are in addition 5 other Universities interested in hosting Computing in Cardiology. This is certainly pleasing to the Board and we hope it will be of encouragement to you to continue to support Computing in Cardiology in the knowledge that it remains an extremely popular conference which scientific colleagues vie with each other, in a friendly way, to host.
viii Computing in Cardiology 2012, Kraków, Poland

I hope that each one of you will truly enjoy participating in this year’s meeting and will wish to return on a future occasion. Best wishes Peter Macfarlane President, Computing in Cardiology
Computing in Cardiology 2012, Kraków, Poland ix

Welcome to Krakow Dear Colleague, It is with great pleasure and excitement that we welcome you to the 39th Annual Scientific Conference of Computing in Cardiology, being held in Krakow, Poland from Sunday, 9th to Wednesday, 12th September 2012.. Krakow, the historical capital of Poland, has witnessed several events of primary importance to Polish people and to the Mid-Eastern part of Europe. Here was the centre of power and trade of medieval Poland; here was the ambience beloved by artists and scientists in the Renaissance and the spirit of freedom during the periods of dependence in the 19th century and of Soviet domination in the 20th. Therefore we are particularly pleased that such a prestigious event as the Computing in Cardiology Conference, usually alternately hosted by Western European Countries and the United States, and very recently by China, takes place in our city for the first time in this part of Europe. As usual, the meeting will be an occasion for presentation and discussion of your most recent achievements. We are also hoping to share with you our love of this beautiful country and to create the opportunity for local young scientists to make friends and hopefully future professional relations in the society of computerized ECG. As the local organizer, the Multidisciplinary School of Engineering in Biomedicine, AGH University of Science and Technology, has the pleasure and honor to be the host of Computing in Cardiology 2012. We warmly welcome delegates from around the world and hope that you will enjoy your visit to Krakow. Nearly 30 volunteers and the Local Organizing Committee will be glad to assist you in meeting your expectations, because according to an old Polish proverb, "having a guest means receiving God under your roof". We look forward to seeing you in Krakow for a stimulating and enjoyable conference and genuinely hope that you will join us to make this endeavor a success. Thank you!
Sincerely,
Piotr Augustyniak, Chair of the Local Organizing Committee
x Computing in Cardiology 2012, Kraków, Poland

Map of the City Center
Map of the AGH-UST campus
Computing in Cardiology 2012, Kraków, Poland xi

Detailed maps of the conference rooms
General information Computing in Cardiology is one of the premier events focusing on computer applications in clinical cardiology and cardiovascular research. The annual meetings have been held for nearly four
xii Computing in Cardiology 2012, Kraków, Poland

decades and attract scientists and professionals from the fields of medicine, physics, engineering and computer science. This year’s meeting is hosted by the Multidisciplinary School of Engineering in Biomedicine, AGH University of Science and Technology. Krakow was first mentioned in the year 965 as a rich burg city, situated at the crossing of trade routes and surrounded by woods. In 1138, Krakow Castle became more important as the official home of the highest Duke. Since 1320, the Cathedral has been witness to coronation ceremonies occurring over the following five centuries. In 1364, Kazimierz the Great founded the Krakow Academy, which was the origin of the later Jagiellonian University. In the Jagiellonian epoch which lasted for the next 200 years, Krakow with Europe's biggest market square became the capital of a monarchy spreading over territories from the Baltic to the Black Sea. The royal court played an important role in supporting artistic and cultural life. Outstanding humanists, scientists and artists came to Krakow from Italy, Germany and other countries. Today, Krakow is Poland's second academic center with over 200,000 students, and a very dynamic scientific milieu. It houses the National Science Centre, which is a government executive agency set up to fund basic research. Krakow is home to many artists of worldwide reputation and hosts a vast number of artistic events. Having about 300 restaurants, pubs and cafes within the down town area, Krakow is known as the main destination of gourmet tourism in Poland. The social programme will include visits to some of these sites.
AGH University of Science and Technology established on 20th October 1919, until 1949 known as the Academy of Mining, founded after long-lasting endeavours which had started in 1782, the year when the Ore Commission was established, has been continuing the traditions of the Academy of Mining in Kielce (1816-1827), inaugurated by
Stanisław Staszic. The University, being a technical school, serves science and industry through educating students, by development of its academic staff, as well as through research and development. The University cherishes its traditions and educates its students to be honest and responsible people both at work, and as members of the society, according to its motto: "Labore creata, labori et scientiae servio" (Created in labour, I serve labour and science.) Currently the AGH-UST is listed as second Polish University on the list of the 500 World best universities. The supercomputer Zeus - Cluster Platform is listed as the first Polish high-performance
Computing in Cardiology 2012, Kraków, Poland xiii

computer on the list of the Top 500 Supercomputer Sites. The AGH-UST serves science, the economy and society through educating students and the development of scientific and research staff, as well as conducting scientific research. The number of branches of science is 50, in 200 separate specializations, The total number of students (as of 30th November, 2011) is 37 996, and the total number of staff is 4 052.
The Multidisciplinary School of Engineering in Biomedicine (MSIB) is located at the AGH University of Science and Technology and has been in operation since the academic year 2005-
2006. Although MSIB has been formed on the basis of the staff formally belonging to five faculties, it is treated as a separate part of the AGH University and has its own students. Formally, MSIB's structure is similar to that of other faculties. It is governed by a Board of 18 persons. This Board, approved by the University Senate, is made up of professors with not less than a DSc degree who are teaching at MSIB, as well as of an adequate representation of students. At present, the professors represent five faculties:
• Faculty of Electrical Engineering, Automatics, Computer Science and Electronics,
• Faculty of Materials Science and Ceramics, • Faculty of Mechanical Engineering and Robotics, • Faculty of Metals Engineering and Industrial Computer
Science, and • Faculty of Physics and Applied Computer Science.
One of the Board's tasks is to recommend, to the Rector, appointments for the Head and the Deputy Head of the School. The appointed Head is also President of the Board. The main responsibility of the Board is to supervise the education process, assure its highest quality, verify and, if necessary, correct academic curricula, prepare staff assignments and implement other objectives of the School. The Head also represents the MSIB in the University Board on a par with deans of other faculties. The current education program in biomedical engineering consists of:
• A single 7-semester track leading to the First (Undergraduate) Degree (Bachelor's/Engineer's, 150 candidates each year);
• Five domain-oriented 3 or 4-semester tracks leading to the Second (Master) Degree (5 x 30 candidates each year);
• A single 8-semester track leading to the Third Degree (Doctorate, 10 candidates each year).
xiv Computing in Cardiology 2012, Kraków, Poland

From the student's viewpoint, there is no organizational difference between the faculty and the Multidisciplinary School. Both have a Dean's Office, a staff of qualified teachers, a social support system and a student board. As far as education is concerned, the rights and responsibilities of the Head of the School are identical to those of a Dean, the only difference being that research is carried out in laboratories in various faculties run by individual professors rather than in the organizational framework of MSIB. Hotels and Conference Venue A variety of accommodation options, ranging from a hostel to 5* hotels and fitting to any budget, have been recommended to ensure your pleasant stay in Krakow. Please be informed, that Krakow hotels are very busy in September. The Local Organizing Committee recommend that you book your room as early as possible to avoid disappointment. The conference is being held in lecture rooms of the AGH-University of Science and Technology as outlined below:
Sunday Symposium building U2, Auditorium opening and closing ceremonies
building A0, Aula
regular oral sessions building B1, rooms 121 and H24 building B2, rooms 100 and 140
poster sessions Krakus restaurant Please refer to the map of the AGH-UST campus and to the detailed conference program to be sure you are on time at the session of your interest. The buildings and lecture rooms will be clearly marked with the Computing in Cardiology signs. Transportation During the conference, private bus transportation will be provided to and from the Cardiac Surgery Workshop and social events on Sunday and Monday. For journeys starting at AGH-University of Science and Technology, the meeting and embarkation point is in front of the U2 building. It is important that delegates are there at the correct times. This is outlined in the Social Program section of this booklet. By courtesy of the Krakow City Council, public transportation (trams and busses) in Krakow are free for Computing in Cardiology attendees and accompanying persons from 9th to 12th September (both days included). Delegates simply need to wear their conference badge and be prepared to show it along with their photo ID to the ticket-inspector.
Computing in Cardiology 2012, Kraków, Poland xv

Otherwise, from the variety of tickets proposed, we wish to recommend a 15 min single journey ticket (cost 2 zl) or 30 min single journey ticket (cost 3.20 zl). Both allow changes in transportation means within the specified time following the first validation. Tickets can also be purchased at newspaper stands and in vending machines on board. Alternatively, you may buy them directly from the driver with a surcharge of 0.50 zł. Hiring a taxi is easy everywhere and any driver will bring you to the AGH-UST campus. Before taking the taxi on the street, please be sure the taxi displays a price list and uses the meter. Most drivers accept credit cards for payment, but not foreign currency cash. It is a good idea to have your hotel name and address printed with you. Since there are over 20 universities in Krakow, to avoid confusion say "AGH" or show the AGH-UST logo on your badge. The address of U2 building is 7, Reymonta Str. Registration For the duration of the conference, the registration and information desk will be located in U2, A0 and B1, following the participants' flow. The registration desk will be labeled with the CinC sign and will be open at the following times: Sunday, 9th September 12:00 – 17:00 building U2 Monday, 10th September 7:30 – 9:30 building A0 10:00 – 13:00 building B1 Tuesday, 11th September 7:30 – 18:00 building B1 Wednesday, 12th September 7:30 – 15:00 building B1 Internet access Within the conference rooms in B1 and B2 buildings, a purpose-built wireless network will be available free of charge. The network name is ‘cinc2012’ and the password is ‘Poland’. Alternatively, in all AGH-UST buildings the network 'AGH-guest' is available free of charge without a password. The only device you need is a WiFi-enabled laptop or smartphone. Should you need any assistance in getting connected, please ask the nearest volunteer for help. Program on-line For the internet-connected participants a most recent conference program and announcements will be available on-line through a web page: http://home.agh.edu.pl/cinc/online optimized for mobile devices like smart phones and tablets. This page will also be
xvi Computing in Cardiology 2012, Kraków, Poland

continuously displayed on the screen above the registration desk in B1 building. Meals Since Krakow is known also as a gourmet destination, the delegates will not have to worry about meals.
• The Sunday symposium concludes with a visit to the Wieliczka Salt Mine where dinner will be served in a cave 180 meters under the ground level.
• Monday sit down lunch will be served after the S3* sessions in the Krakus Restaurant (first floor) from 13:00 to 14:00
• Monday social event concludes with a dinner in a rustic environment in a countryside restaurant close to Krakow,
• Tuesday sit down lunch will be served after the S6* sessions in the Krakus Restaurant (first floor) from 13:00 to 14:15.
• Tuesday poster session will be accompanied by a light reception in the Exhibition Room, before inviting you to a 1-hour show of traditional dances. For this evening, the participants are encouraged to explore some of the famous Krakow caves, pubs or restaurants on their own. Our recommendations with discount tickets are distributed in delegates' kits.
• Wednesday buffet lunch in the Krakus Restaurant (first floor) will start after the poster session at approximately 12:00.
In order to keep up the meeting timetable, the attendees are kindly asked to proceed quickly to the Krakus Restaurant immediately after the session finishes. Regular coffee breaks with tea, coffee, soft drinks, cakes and fruits are planned as follows: Sunday, Sep. 9th 14:30 - 15:00 lobby of U2 Auditorium Monday, Sep. 10th 11:15 - 11:30 underground B1-B2
junction Tuesday, Sep. 11th 9:45 - 10:15 underground B1-B2
junction 16:00 Krakus Exhibition
Room Wednesday, Sep. 12th 10:00 Krakus Exhibition
Room
Computing in Cardiology 2012, Kraków, Poland xvii

Accompanying Persons The accompanying person registration allows the guest to attend:
• the visit and reception on Sunday evening in Wieliczka Salt Mine (bus departure at 17:30 from the parking area in front of the U2 Auditorium),
• the Monday social event starting at 13:00 with lunch, participation as an activist or passivist in the activities and in the rustic dinner, which will be held at the Folwark Zalesie.
• the Tuesday accompanying Persons’ Programme (at their own cost),
Tuesday afternoon Guests are also welcome to attend at the conference poster sessions and the show of traditional dances. The Tuesday Accompanying Persons Programme starts at 9:00 at the conference registration desk in B1 building and lasts for 3 to 5 hours. Four optional guided tours are proposed: • The pearl of Wawel Hill - The tour will include a visit to the
Royal Castle and the Wawel Cathedral, which is the national temple, having witnessed most of the royal coronations, funerals, and celebrations. There are many little chapels and shrines throughout the cathedral, as well as towers and crypts. The highlight of Wawel Castle is a tour of a temporary exhibition: Leonardo da Vinci Lady with an Ermine. At the end of the tour, we can go down to the Royal Crypts and Sigismund’s tower. (minimum 10 participants, 160 zl).
• The traces of Jews in Kraków - This is a half day sightseeing tour of Kazimierz with a visit to the Temple synagogue in Szeroka street and the Jewish Ghetto area in Podgórze. During the tour, you will see and visit many of the locations that were used for the filming of Schindler's List including Otto Schindler's factory. (minimum 10 participants, 160 zl).
• The traces of Krakow Saints - The tour will include a visit to the Royal Wawel Cathedral where the former Cardinal Karol Wojtyła was the Archbishop of Krakow, before becoming Pope John Paul II. You will also visit the St. Mary's Church with its famous 15th century altar made by Wit Stwosz and the Skałka Church where the first polish martyr, bishop St. Stanisław Szczepanowski was murdered. Next you will go to the St. Anna’s Church where the famous polish professor was buried. At the end of the tour, you will be transferred to the Sanctuary of Divine Mercy in the Krakow- Łagiewniki quarter. (minimum 10 participants, 120 zl).
• Jagiellonian University quarter - The tour is a visit to one of the oldest Universities in Central Europe established in 1364 by King Kazimierz the Great. Among its students were Nicolaus
xviii Computing in Cardiology 2012, Kraków, Poland

Copernicus, King John III Sobieski and John Paul II. The tour includes: visit of Collegium Maius – the oldest of the University’s buildings, the Church of St. Anne whose history has been inextricably linked to that of the University, Collegium Novum and Nowodworski College. The tour ends with a visit to the Mariacki Church which is a witness to the culture of the city’s inhabitants. (minimum 10 participants, 80 zl).
In all cases, the reservation should be made 10 days in advance, but the tourist agency will accept last minute bookings depending upon availability of places. All fees include the services of an English speaking guide, entrance to all sites, as well as transportation. In case of doubts, contact the Tourist Agency VipTour: by phone: +48 602805548, or email: [email protected], Useful numbers: Emergency calls free of charge from mobile boxes: 112 Direct emergency numbers in Krakow: Police: +4812 997 Ambulance: +4812 999 Krakow public transportation information: +4812 9150 Computing in Cardiology Registration Desk: +48 603606285
For Authors and Speakers Oral Presentations The time allocated for each oral presentation is 10 minutes, followed by 5 minutes for discussion. Speakers are expected to adhere strictly to this schedule, which will be enforced by session chairs in order to finish sessions on time and to permit participants to move successfully from one parallel session to another. All conference rooms will be equipped with a computer projection system (LCD projector and PC with Windows 7, Microsoft Office 2007, PowerPoint 2010 Viewer, Windows Media Player and Adobe Acrobat reader). Speakers are required to allow adequate time prior to their sessions to load and check their presentations on the designated computer. A member of the Local Organizing Committee will be available in each parallel session to help. In addition, speakers are required to meet with their session chairpersons in the scheduled conference room at least 10 minutes before the beginning of the session. It is good idea to ensure that the chairperson knows how to correctly pronounce your name.
Computing in Cardiology 2012, Kraków, Poland xix

Speakers ready room For Authors' convenience, a speaker’s ready room is provided (room 111 in B2 building, 2-nd floor) and equipped with computers to check and upload presentations. Please ensure that your presentation correctly loaded before the start of your session.
Poster Presentations Poster sessions will take place in the Krakus building on Tuesday, 11th September from 16:00, and on Wednesday, 12th September, from 10:00. The Exhibition Room is located on the ground floor of the building, through the entrance lobby on the left hand side. Authors are required to be present at their posters during their assigned session in order to discuss their work with other conference attendees. Authors are welcome to visit the Exhibition Room (Krakus building, ground floor) at least 30 minutes prior to the poster session and hang their posters at the location designated with the correct number. Posters may be hung:
• between 15:30 and 16:00 for the Tuesday session, and • between 08:00 and 10:00 for the Wednesday session.
Subject areas for the poster sessions will be clearly marked and poster boards will be numbered with a card corresponding to the page number in this book. Mounting materials will be provided at the entrance. Authors are expected to remove their posters immediately after the end of the sessions to allow the timely cleaning of the Exhibition Room. Rosanna Degani Young Investigator Award Computing in Cardiology runs an annual competition to encourage young investigators and to provide a living memorial to Rosanna Degani. The competition for the 2012 Rosanna Degani Young Investigator Award was open to persons under 36 years of age and in "training status" at the submission deadline of May 1st, 2012. Finalists in the competition will present their work in session M1, at 8:15 on Monday, 10th September in the Aula in A0 building. The name of the winner will be announced during the closing plenary session on Wednesday. PhysioNet / Computing in Cardiology Challenge 2012 Since 2000, Computing in Cardiology has annually issued a PhysioNet Challenge in cooperation with PhysioNet, part of the NIH
xx Computing in Cardiology 2012, Kraków, Poland

sponsored Research Resource for Complex Physiologic Signals. The aim of this year's challenge is Predicting ICU Mortality. The challenge sessions are on Tuesday, September 11th:
• S51 10:15 - 11:45 in building B1 room 121, and • S71 14:15 - 15:45 in building B1 room 121
The winners will be announced during the closing plenary session on Wednesday. Manuscripts Computing in Cardiology will publish the conference proceedings containing the complete manuscripts of all presentations. A CD-ROM copy of the proceedings is usually available by the end of the year and will be mailed directly to all registrants. In addition, the complete proceedings will be freely available via the CinC web site (http://www.cinc.org). For any questions about manuscripts, consult the CinC web site or contact via email Alan Murray, the Editor of the proceedings: [email protected]
Computing in Cardiology 2012, Kraków, Poland xxi

Conference Overview The conference begins on the afternoon of Sunday 9th with a special symposium entitled "Virtual Reality in Cardiac Surgery". A guided tour with a reception in the Wieliczka Salt Mine starts immediately at the end of the symposium. The scientific sessions of the conference begin on Monday morning. In the afternoon, the traditional social program will take place. Sessions will continue on Tuesday and Wednesday, including both oral presentations and poster sessions. Sunday Symposium The Sunday Symposium will be held exclusively in U2 Auditorium. Part One: 13:00 - 13:30 Offcial Addresses 13:30 - 14:00 Invited lecture: Advances in long-term
monitoring of cardiac arrhythmias, W. Zareba 14:00 - 14:30 Invited lecture: Integrated, web-based solution
for comprehensive, ECG-related, processes management. J. Bulka
Coffee break 14:30 - 15:00 Silvermedia and Institute of Physics exhibitions in the lobby. Exhibition about Maria Sklodowska-Curie
Part Two: 15:00 - 15:45 Invited lecture: Considerations on modern computer graphics as a powerful & prospective tool for future medicine and medical technology, T. Szuba, M. Gajer
15:45 - 16:30 Invited lecture:The Robin Heart Story - from operation planning in virtual environment to real surgical robot experiments Z. Nawrat
16:30 - 17:15 Invited lecture: Surgical training procedures and original stands developed in FCSD and Robin Heart teleoperation show. J. Sliwka, Z. Nawrat, P. Kostka, K. Rohr, W. Sadowski, K. Krzysztofik
Bus departs 17:30 parking in front of U2 Auditorium 18:00 - 19:30 Guided tour at the Wieliczka Salt Mine 19:30 - 22:30 Reception in an underground chamber Bus returns 22:30 - 23:30 Remarks concerning the visit to the Wieliczka Salt Mine.
• The descent to the mine is on foot, although the lift service may be offered to participants as required.
• The exit from the mine is via a lift with a capacity of 30
xxii Computing in Cardiology 2012, Kraków, Poland

people going once per 6 minutes. The buses will leave to Krakow when fully occupied.
• The temperature in the mine is 16 degrees Celsius, so be prepared accordingly.
• Smoking is not permitted anywhere in the mine. • Permission for taking still pictures and video is subject to
extra charge. Accordingly to the opinions of several tourists, the Wieliczka Salt Mine is worth visiting more than Krakow itself. Even if you miss the Sunday visit and reception with Computing in Cardiology participants, we recommend to make an individual arrangement in a suitable time. Scientific Sessions The opening ceremony of the scientific sessions begins on Monday, 10th September at 08:10 in the main building A0, Aula (first floor) and is immediately followed by the Rosanna Degani Young Investigator Final beginning at 08:15. All regular sessions are held in lecture rooms in B1 and B2 buildings. The buildings and the rooms bear labels with the CinC sign. Please see the enclosed map of the AGH-UST campus. Monday Social Program Each year at CinC, Monday afternoon is set aside to facilitate a social event. This is an important part of the conference program as it allows delegates to network and relax in a more informal setting away from the scientific sessions. Please consider the following remarks:
• All participants of the Social Program are required to wear the T-shirts or the caps provided in a distinct colour for each group, as well as their CinC badges.
• As the Social Program starts immediately after the sessions, the participants should consider comfortable informal dress for the whole day.
• Adhesive labels with name will be provided for participants wishing to leave their delegate kits in a safe storage room at the University till Tuesday morning. Please do NOT leave money, credit cards, documents, hotel keys or cameras, since you may need them during the afternoon.
The social program will commence at 13:00 on Monday with lunch at the Krakus Restaurant. A longstanding tradition for the Computing in Cardiology social program is that delegates can choose between
Computing in Cardiology 2012, Kraków, Poland xxiii

Activist or Passivist activities. The activist program will start with identifying the teams by different T-shirt colours. A treasure hunt will consist of visits to several checkpoints where the team members will have to undertake a number of tests and demonstrate their manual skills, their understanding of Krakow and its history and exhibit basic technical and medical knowledge. But do not worry, you are not expected to be an engineer, surgeon or nurse. Some of you may have to operate medical devices, stretch the muscles, control your heartbeat, solve a technical problem or will make your first steps in a (very) foreign language. Your overall scores will be very important this afternoon in order to win a special prize for your team. The hunt will be also an excellent opportunity to see and take photos of the most important places in Krakow in autumn scenery and to have a short coffee break. After the treasure hunt, buses will take you to the rustic dinner planned at Folwark Zalesie. You will discover that this kind of team-building game could result in an interesting scientific cooperation The passivist program will begin with guided sightseeing around Krakow Old Town, leaving from AGH University of Science and Technology. Some groups will be able to obtain a quick glimpse of the picturesque Krakow streets, while others will have a chance to see the Main Square and the Wawel Castle. During this trip around the town, please pay close attention to what the tour guide will be saying! At the foot of the Wawel Castle, the tour will continue aboard a cruise ship with a calm journey up the Vistula river. As you travel along the river, many quizzes and games are scheduled, and there will be music played by a traditional wind instrument band. After about 1.5h the boat will reach its destination - the Medieval Benedictine Abbey in Tyniec. Nine centuries ago, Benedictines arrived at this place. On the rock by the Vistula river, they built a monastery, which emerges from the trees and reflects in the river. You will get a chance to see the Monastery's architecture up close, snap some photos as well as purchase locally produced Benedictine specialties from the gift shop. Finally, particpants will drive to the rustic dinner planned at Folwark Zalesie. Monday Social Program Schedule All participants 13:00 - 14:00 Sit down lunch served in Krakus Restaurant
(first floor) Activists 14:00 - 18:00 Treasure hunt in Krakow downtown 18:00 Bus departs to Folwark Zalesie Passivists 14:00 - 16:00 Guided tour of Krakow downtown 16:00 - 18:00 Cruise on Vistula River to Tyniec Benedictine
Abbey
xxiv Computing in Cardiology 2012, Kraków, Poland

18:00 Bus departs to Folwark Zalesie All participants 19:00 Rustic entertainment 19:30 Gala dinner 21:00 Folklore music and dances 22:30 Bus returns to Krakow Tuesday Evening Show Krakus, the name of restaurant, comes from Poland’s oldest student folkloristic ensemble with over 60 years of tradition and many spectacular successes in Poland and abroad. On Tuesday evening, all attendees, including accompanying guests, are invited to see a show of regional dances and music given by Krakus Ensemble. The regional dance show will commence at 18:30 at the Krakus Restaurant. It thus immediately follows the poster session and will last for approximately 1 hour. Post conference tours A variety of one-day and longer post conference tours are available to the CinC attendees and accompanying persons. Although advance reservation is required, the tourist agency will accept last minute bookings depending on the availability of places. For further information, please contact the Tourist Agency VipTour: by phone: +48 602805548, or email: [email protected],
Computing in Cardiology 2012, Kraków, Poland xxv

Learn your first words in Polish
Yours (probably) first words in Polish
English Polish phonetic transcription
good morning / good afternoon dzień dobry djyen' dobrii1
goodbye
do widzenia do vee-dzen'ya
hi Cześć chesh'tch'
please Proszę prrosheh
thank you dziękuję djyen’kooyeh
I’m sorry/ excuse me przepraszam pshe-prrasham
yes Tak tak
no Nie n’yeh
I don’t understand nie rozumiem n’yeh rro-zoom-yem
Polish po polsku po polskoo
to speak Mówić moovitch
to listen słuchać swoohatch
to help Pomóc pomoots
to buy Kupić koopeetch’
zloty Złoty zwoti
exchange money wymienić pieniądze vimy’enitch p-yen’yondzeh
cash machine bankomat bankomat
ticket billet beelet
taxi taksówka taksoofka
car samochód samo-hoot
bus autobus ahwtoboos
tram tramwaj trramvay
plane samolot samolot
train Pociąg potch’yonk
bicycle Rower rroverr
how to go to… jak iść do … ? yak ysh’ts do … ?
to the right w prawo f prravo
to the left w lewo f levo
straight Prosto prrosto
conference konferencja konferrents-ya
1 ref: Polish phrase book & dictionary, Berlitz
xxvi Computing in Cardiology 2012, Kraków, Poland

building budynek boodinek
proceedings Obrady obrradi
beginning początek potchontek
the end Koniec kon’iets
my name is… mam na imię... mam na eem’yeh …
good Dobrze dobzheh
badly / ill Źle zh’leh
very Bardzo barrdzo
a little / some Trochę trroheh
how much/ how many Ile eeleh
I’m from …. pochodzę z … pohodzeh s …
church Kościół kosh’tch’yoow
museum muzeum moo-ze-oom
university uniwersytet ooniversitet
shop Sklep s-klep
office Biuro b-yoorroo
place miejsce m’ieystse
market Rynek rrinek
street Ulica oolitsa
coffee shop / cafe kawiarnia kav-yarrn’a
restaurant restauracja rrestahw-rrats-ya
attention Uwaga oovaga
book książka k-sh’yonsh-ka
ballpen / ballpoint długopis dwoogopees
see you do zobaczenia do zobachen’ia
Computing in Cardiology 2012, Kraków, Poland xxvii

Scientific Sessions Program Overview Monday, Sep. 10th 8:10 Welcome addresses bldg. A0, Aula 8:15 M1 Rosanna Degani Young Investigator Finals bldg. A0, Aula 9:45 Break 10:15 S21 Electrocardiography I bldg. B1 room 121 S22 Modeling Technology bldg. B1 room H24 S23 ECG Technology bldg. B2 room 100 S24 Novel Techniques in Signal Proc. bldg. B2 room 140 11:15 Coffee break bldgs. B1-B2 junction 11:30 S31 Medical Informatics I bldg. B1 room 121 S32 Clinical Correlates of ECG bldg. B1 room H24 S33 Atrial Modeling bldg. B2 room 100 S34 Cardiac Ultrasound Imaging bldg. B2 room 140 13:00 Lunch and Social Event Krakus, first floor
Tuesday, Sep. 11th 8:15 S41 Physiological Variability bldg. B1 room 121 S42 Atrial Fibrillation I bldg. B1 room H24 S43 Medical Informatics II bldg. B2 room 100 S44 Ventricular Modeling: Ionic Basis bldg. B2 room 140 9:45 Coffee break bldgs. B1-B2 junction 10:15 S51 CinC Challenge I bldg. B1 room 121 S52 Novel Approaches to Heart Rate Variability bldg. B1 room H24 S53 Ventricular Modeling bldg. B2 room 100 S54 Mobile Healthcare in Cardiology bldg. B2 room 140 11:45 Break 12:00 S61 Ischemia and Infarction bldg. B1 room 121 S62 Electrophysiology bldg. B1 room H24 S63 MRI/CT for Perfusion, Viability, and Texture bldg. B2 room 100 S64 Electrocardiography II bldg. B2 room 140 13:00 Lunch Krakus, first floor 14:15 S71 CinC Challenge II bldg. B1 room 121 S72 Heart Rate Variability bldg. B1 room H24 S73 Cardiac Repolarization bldg. B2 room 100 S74 Modeling of Ischemia and Cardiac Electromech bldg. B2 room 140 15:45 Break 16:00 P8 Poster session Krakus, ground floor 18:30 Regional dance show, Krakus, first floor
Wednesday, Sep. 12th 8:15 S91 Cardiac MRI bldg. B1 room 121 S92 Atrial Fibrillation II bldg. B1 room H24 S93 Cardiac Mechanics bldg. B2 room 100 S94 Ventricular Modeling: Arrhythmia bldg. B2 room 140 9:45 Break 10:00 PA Poster session Krakus, ground floor 12:15 Light lunch (self service) Krakus, first floor 13:30 MC Closing plenary session, bldg. A0, Aula 14:30 CC Closing ceremony bldg. A0, Aula
xxviii Computing in Cardiology 2012, Kraków, Poland

Scientific Program


Monday, September 10, 2012, 08:15
Chair(s): Peter Macfarlane and Willem Dassen
M1: Rosanna Degani Young Investigator Finals
Room: Bldg. A0, Aula
Emilie Bollache*, Carine Defrance, Ludivine Perdrix, Alban Redheuil, Benoit Diebold, Elie Mousseaux and Nadjia Kachenoura
1 Automated Evaluation of Aortic Valve Stenosis from Phase‐Contrast Magnetic Resonance Data
Patrick M Boyle*, John C Williams, Emilia Entcheva and Natalia A Trayanova
2 A Computational Framework for Simulating Cardiac Optogenetics
Alex Skovsbo Jørgensen*, Samuel Emil Schmidt, Niels‐Henrik Staalsen and Lasse Riis Østergaard
3 Automatic Vessel Tracking and Segmentation Using Epicardial Ultrasound in Bypass Surgery
Andrius Petrėnas*, Vaidotas Marozas, Leif Sörnmo and Arūnas Lukoševičius
4 Reservoir Computing for Extraction of Low Amplitude Atrial Activity in Atrial Fibrillation
Computing in Cardiology 2012, Kraków, Poland xxxi

Monday, September 10, 2012, 10:15
Chair(s): Paul Kligfield
S21: Electrocardiography I
Room: Bldg. B1, Rm 121
John Wang*, John Sapp, James Warren and Milan Horáček
5 On Designing and Testing Transformations for Deriving Body Surface Potential Maps from 12‐lead ECG and Its Subsets
John L Sapp, Ahmed El‐Damaty, Paul J MacInnis, James W Warren and B Milan Horacek*
6 Automated Localization of Pacing Sites in Postinfarction Patients from the 12‐lead Electrocardiogram and Body Surface Potential Maps
Digna González‐Otero*, Sofía Ruiz de Gauna, Jesús Ruiz, Unai Ayala and Erik Alonso
7 Automatic Detection of Chest Compression Pauses Using the Transthoracic Impedance Signal
Unai Ayala*, Unai Irusta, Jesús Ruiz, Digna González‐Otero, Erik Alonso and Robertas Mazeika
8 A New Shock Advice Algorithm Designed to Classify ECG Signals During Cardiopulmonary Resuscitation
xxxii Computing in Cardiology 2012, Kraków, Poland

Monday, September 10, 2012, 10:15
Chair(s): Olaf Doessel
S22: Modeling Technology
Room: Bldg. B1, Rm H24
Danila Potyagaylo*, Walther HW Schulze and Olaf Doessel
9 A New Method for Choosing the Regularization Parameter in the Transmembrane Potential Based Inverse Problem of ECG
Mark Ulbrich*, Jens Muehlsteff, Marian Walter and Steffen Leonhardt
10 Simulation of Lung Edema in Impedance Cardiography
Andrés Mena and Jose F Rodriguez*
11 Using Graphic Processor Units for the Study of Electric Propagation in Heart Models
Yuji Akematsu, Kazunori Minetaki and Masatsugu Tsuji*
12 Does Telecare Reduce Medical Expenditures of Heart Failure Patients?
Computing in Cardiology 2012, Kraków, Poland xxxiii

Monday, September 10, 2012, 10:15
Chair(s): David Mortara
S23: ECG Technology
Room: Bldg. B2, Rm 100
Iñaki Romero*, Di Geng and Torfinn Berset
13 Adaptive Filtering in ECG Denoising: A Comparative Study
Antonio Fasano* and Valeria Villani
14 Joint Denoising and Narrowband Artifacts Rejection for ECG Signals
Shubhada Ardhapurkar Vaidya*
15 Interpretation of Normal and Pathological ECG beat us‐ing Multiresolution Wavelet Analysis
Wenfeng Duan*, Dingchang Zheng, Philip Langley and Alan Murray
16 Calculating Stable Reference Potentials for Measuring ECG Wave Amplitudes Across a Range of Heart Rates
xxxiv Computing in Cardiology 2012, Kraków, Poland
Monday, September 10, 2012, 10:15
Chair(s): Luca Mainardi
S24: Novel Techniques in Signal Processing
Room: Bldg. B2, Rm 140
Thanks Marisa*, Thomas Niederhauser, Andreas Haeberlin, Josef Goette, Marcel Jacomet and Rolf Vogel
17 Asynchronous ECG Time Sampling: Saving Bits with Golomb‐Rice Encoding
Danilo Pani, Alessia Dessì*, Barbara Cabras and Luigi Raffo
18 A Real‐Time Algorithm for Tracking of Foetal ECG Sources Obtained by Block‐on‐Line BSS Techniques
Roberto Sassi* and Luca T Mainardi
19 Quantification of Spatial Repolarization Heterogeneity: Testing the Robustness of a New Technique
Computing in Cardiology 2012, Kraków, Poland xxxv

Monday, September 10, 2012, 11:30
Chair(s): Jocelyne Fayn and Piotr Augustyniak
S31: Medical Informatics I
Room: Bldg. B1, Rm 121
Piotr Augustyniak*
20 Analysis of ECG Bandwidth Gap as a Possible Carrier for Supplementary Digital Data
Stelios Sfakianakis, Yildiray Kabak, Elif Eryilmaz, Yannis Petrakis, Gokce Banu Laleci Erturkmen, Catherine Chronaki* and Asuman Dogac
21 Empowered Patients with Cardiac Implantable Electronic Devices across Organizational & National borders
Óscar Jesús Rubio Martín*, Álvaro Alesanco Iglesias and José García Moros
22 A Security Extension for the Standard SCP‐ECG Based on Metadata
Swati Keskar*, Rahul Banerjee and Rajkiran Reddy
23 A Dual PSoC based Reconfigurable Wearable Computing Framework for ECG Monitoring
Cristina Soguero Ruiz*, Luis Lechuga, Inmaculada Mora Jiménez, Javier Ramos López, Óscar Barquero Pérez, Arcadi García Alberola and José Luis Rojo Álvarez
24 Ontology for Heart Rate Turbulence Domain Applying the Conceptual Model of SNOMED‐CT
Dieter Hayn*, Stefan Raschhofer, Markus Falgenhauer, Robert Modre‐Osprian, Friedrich Fruhwald and Günter Schreier
25 Edema Detection for Heart Failure Patients in Home Monitoring Scenarios
xxxvi Computing in Cardiology 2012, Kraków, Poland

Monday, September 10, 2012, 11:30
Chair(s): Steven Swiryn
S32: Clinical Corrolates of ECG
Room: Bldg. B1, Rm H24
Khairul Azami Sidek, Ibrahim Khalil and Magdalena Smolen*
26 ECG Biometric in Different Physiological Conditions Using Robust Normalized QRS Complex
Vito Starc*, Manja Leban, Petra Šinigoj, Miloš Vrhovec, Todd T Schlegel, Eva Fernlund and Petru Liuba
27 Can Functional Cardiac Age be Predicted from ECG in a Normal, Healthy Population?
Cristiana Corsi*, Johan De Bie, Carlo Napolitano, Silvia Priori, David Mortara and Stefano Severi
28 Validation of a Novel Method for Noninvasive Blood Potassium Quantification from ECG
Christoph Maier*, Heinrich Wenz and Hartmut Dickhaus
29 Estimation of the Apnea‐/Hypopnea Index from Epoch‐based Classification of the ECG using Modulations of QRS Amplitude and Respiratory Myogram Interference
Carolina Varon*, Katrien Jansen, Lieven Lagae and Sabine Van Huffel
30 Cardiorespiratory Analysis on Children Suffering from Absence and Complex Partial Seizures
Soroor Behbahani, Nader Jafarnia Dabanloo*, Ali Motie Nasrabadi, Cesar A Teixeira and Antonio Dourado
31 Epileptic Seizures Behaviors from the Perspective of Heart Rate Variability
Computing in Cardiology 2012, Kraków, Poland xxxvii

Monday, September 10, 2012, 11:30
Chair(s): Esther Pueyo
S33: Atrial Modeling
Room: Bldg. B2, Rm 100
Jussi T Koivumäki*, Torsten Christ, Gunnar Seemann, Mary M Maleckar
32 Divergent action potential morphology in human atrial cells vs. tissue: underlying ionic mechanisms
Nejib Zemzemi*, Simon Labarthe, Remi Dubois and Yves Coudiere
33 From Body Surface Potentials to Activation Maps on the Atrium: A Machine Learning Technique
Michael Colman*, Daniele Giacopelli, Philip Langley and Henggui Zhang
34 Elucidating the Body Surface P‐wave using a Detailed 3D Computer Model of Atrial Activation
Sanjay Kharche*, Irina Biktasheva, Gunnar Seemann, Henggui Zhang and Vadim Biktashev
35 Cardioversion Using Feedback Stimuli in Human Atria
Carlos Sánchez*, Martin Krueger, Gunnar Seeman, Olaf Dössel, Blanca Rodríguez and Esther Pueyo
36 Ionic Modulation of Atrial Fibrillation Dynamics in a Human 3D Atrial Model
Timothy Butters*, Jichao Zhao, Bruce Smaill and Henggui Zhang
37 A Novel Computational Sheep Atria Model for the Study of Atrial Fibrillation
xxxviii Computing in Cardiology 2012, Kraków, Poland

Monday, September 10, 2012, 11:30
Chair(s): Enrico Caiani and Nico Bruining
S34: Cardiac Ultrasound Imaging
Room: Bldg. B2, Rm 140
Miguel Sotaquira*, Laura Fusini, Roberto M Lang and Enrico G Caiani
38 Nearly‐Automated Quantification of Mitral Annulus and Leaflets Morphology from Transesophageal Real‐time 3D Echocardiography
Niels F Otani*, Rupinder Singh and Robert F Gilmour, Jr
39 An Ultrasound‐based Imaging Method for Visualizing Patterns of Action Potential Propagation in the Heart
Chattanong Yodwut, Lynn Weinert, Berthold Klas, Roberto Lang and Victor Mor‐Avi*
40 Effects of Frame Rate on 3D Speckle Tracking Based Measurements of Myocardial Deformation
Lyubov Ivanova*, Irina Philimonova, Olga Solovyova, Olga Kraeva, Pavel Tcivian and Vladimir Markhasin
41 Functional Geometry of Human Left Ventricle in Ontogenesis
François Tavard*, Antoine Simon, Alfredo Hernandez, Julian Betancur, Erwan Donal and Christophe Leclercq
42 Spatio‐temporal Registration of Electro‐anatomical Mappings with Functional Data for Cardiac Resynchronization Therapy Optimization
Slawomir Skonieczka*, Michal Strzelecki, Jaroslaw Kasprzak, Blazej Michalski and Piotr Lipiec
43 Classification of the Myocardial Damage Degree Based on Texture Parameters of Ultrasound Intravenous Contrast Agent Images
Computing in Cardiology 2012, Kraków, Poland xxxix

Tuesday, September 11, 2012, 08:15
Chair(s): José Luis Rojo Álvarez
S41: Physiological Variability
Room: Bldg. B1, Rm 121
Alejandra Guillén‐Mandujano* and Salvador Carrasco‐Sosa
44 Interactive Effects of Simultaneously Varying Respiratory Frequency and Tidal Volume on Respiratory Sinus Arrhythmia
Salvador Carrasco‐Sosa and Alejandra Guillén‐Mandujano*
45 Correlation between Spectral Measures of Systolic Blood Pressure Variability and Heart Rate Variability during Paced Breathing, Standing and Exercise
Óscar Barquero‐Pérez*, Carlos Figuera‐Pozuelo, Rebeca Goya‐Esteban, Inmaculada Mora‐Jiménez, José Luis Rojo‐Álvarez, Javier Gimeno‐Blanes and Arcadi García‐Alberola
46 Heart Rate Turbulence Modulation with Coupling Interval and Heart Rate
Rebeca Goya‐Esteban*, Óscar Barquero‐Pérez, Elena Sarabia‐Cachadiña, Blanca De la Cruz‐Torres, José Naranjo‐Orellana and José‐Luis Rojo‐Álvarez
47 Heart Rate Variability Non Linear Dynamics in Intense Exercise
Gianfranco Toninelli*, Chiara Vigo, Martino Vaglio, Fabio Badilini and Massimo Pagani
48 DynaScope: a Software Tool for the Analysis of Heart Rate Variability During Exercise
Jesús Lázaro*, Eduardo Gil and Pablo Laguna
49 OSAS Detection in Children by Using PPG Amplitude Fluctuations Decreases and Pulse Rate Variability
xl Computing in Cardiology 2012, Kraków, Poland

Tuesday, September 11, 2012, 08:15
Chair(s): JJ Rieta
S42: Atrial Fibrillation I
Room: Bldg. B1, Rm H24
Andrea Buttu*, Jérôme Van Zaen, Alain Viso, Andrei Forclaz, Patrizio Pascale, Sanjiv Narayan, Jean‐Marc Vesin and Etienne Pruvot
50 Termination of Atrial Fibrillation by Catheter Ablation can be Successfully Predicted from Baseline ECG.
Martin Stridh* and Mårten Rosenqvist
51 Automatic Screening of Atrial Fibrillation in Thumb‐ECG Recordings
M Julián*, R Alcaraz and JJ Rieta
52 Comparative Study of Nonlinear Metrics to Discriminate Atrial Fibrillation Events from the Surface ECG
Francisco Castells*, Dorian Stübner, Yan Huo, Edu Roses, Daniela Husser, José Millet and Andreas Bollmann
53 Eigenvalue Decomposition for P‐wave Analysis in Paroxysmal Atrial Fibrillation
Francisco Castells*, Raúl Llinares, Andreu Climent, Felipe Atienza, Jorge Igual, José Millet and Maria Salud Guillem
54 Non‐invasive Detection of Higher Frequency Atrial Sources during Atrial Fibrillation
Computing in Cardiology 2012, Kraków, Poland xli

Tuesday, September 11, 2012, 08:15
Chair(s): Enno van der Velde and Dewar Finlay
S43: Medical Informatics II
Room: Bldg. B2, Rm 100
Alessandro Taddei*, Umberto Paradossi, Emiliano Rocca, Elaine Laws, Marina Marchi, Stefano Dalmiani and Sergio Berti
55 Information System for Assessing Health Care in Acute Myocardial Infarction
Benedikt Baumgartner*, Kolja Rödel, Ulrich Schreiber and Alois Knoll
56 A Web‐Based Survey for Expert Review of Monitor Alarms
Sean McMillan*, Ilan Rubinfeld and Zeeshan Syed
57 Predicting Atrial Fibrillation from Intensive Care Unit Numerics Data
Fatemeh Safara, Shyamala Doraisamy*, Azreen Azman and Azrul Jantan
58 Heart Sound Clustering using a Combination of Temporal, Spectral and Geometric Features
Tanveer Syeda‐Mahmood and Ritwik Kumar*
59 Predictive Analytics for Coronary Artery Disease
xlii Computing in Cardiology 2012, Kraków, Poland

Tuesday, September 11, 2012, 08:15
Chair(s): Jose Maria Ferrero
S44: Ventricular Modeling: Ionic Basis
Room: Bldg. B2, Rm 140
Lydia Dux‐Santoy, Jose F Rodriguez*, Rafael Sebastian, Javier Saiz and Jose M Ferrero
60 Biophysical Modelling of Bundle Branch Reentry Initiation and Maintenance
Sanjay Kharche*, T Stary, G Callisesi, A Bracci and Stefano Severi
61 Simulating Effects of Serum Potassium on ECG
Mathias Wilhelms*, Jochen Schmid, Mathias J Krause, Niko Konrad, Julian Maier, Eberhard P Scholz, Vincent Heuveline, Olaf Dössel and Gunnar Seemann
62 Calibration of Human Cardiac Ion Current Models to Patch Clamp Measurement Data
Juan F Gómez*, Lucia Romero, Javier Saiz, Luiz Belardinelli, Sridharan Rajamani and Beatriz Trenor
63 Increase in Late Sodium Current and Cellular Uncoupling Exacerbates Transmural Dispersion of Repolarization in Heart Failure
Yunliang Zang*, Dongdong Deng, Heqing Zhan, Mingqi Qian and Ling Xia
64 Modeling the Mechanism of [Na+]i Elevation in Heart Failure by A Canine Ventricular Cell Model
Gunnar Seemann*, Alexander KE Kurz, Olaf Dössel, Martin Tristani‐Firouzi and Frank B Sachse
65 A 2‐State Markov Model of IKACh based on a Membrane Voltage Dependent Muscarinic M2 Receptor Approach
Computing in Cardiology 2012, Kraków, Poland xliii

Tuesday, September 11, 2012, 10:15
Chair(s): George Moody
S51: CinC Challenge I
Room: Bldg. B1, Rm 121
Ikaro Silva*, George B Moody, Daniel J Scott, Leo A Celi and Roger G Mark
66 Predicting Mortality of Patients in Intensive Care: The PhysioNet/Computing in Cardiology Challenge 2012
Alistair Johnson*, Nic Dunkley, Louis Mayaud, Athanasios Tsanas, Andrew Kramer and Gari Clifford
67 Patient‐specific Predictions in the ICU using a Bayesian Ensemble
Natalia M Arzeno*, Joyce C Ho, Cheng H Lee
68 An Imputation‐Enhanced Algorithm for ICU Mortality Prediction
Luca Citi* and Riccardo Barbieri
69 PhysioNet 2012 Challenge: Predicting Mortality of ICU Patients using a Cascaded SVM‐GLM Paradigm
Henian Xia, Adam Petrie and Xiaopeng Zhao*
70 A Neural Network Model for Mortality Prediction in ICU
Chih‐Chun Chia*, Gyemin Lee, Zahi Karam, Alexander Van Esbroeck, Sean McMillan and Zeeshan Syed
71 Using Support Vector Machine Classification with Temporal Features to Predict In‐Hospital Mortality
xliv Computing in Cardiology 2012, Kraków, Poland
Tuesday, September 11, 2012, 10:15
Chair(s): Riccardo Barbieri
S52: Novel Approaches to Heart Rate Variability
Room: Bldg. B1, Rm H24
Pieter Joosen, Wouter Aerts, Carolina Varon, Devy Widjaja*, Steven Vandeput, Andre E Aubert and Sabine Van Huffel
72 Effect of Posture on the Cardiorespiratory System using Canonical Correlation Analysis
Michele Orini*, Gaetano Valenza, Luca Citi and Riccardo Barbieri
73 Tetravariate point‐process model for the continuous characterization of cardiovascular‐respiratory dynamics during passive postural changes
Devy Widjaja*, Elke Vlemincx and Sabine Van Huffel
74 Multiscale Principal Component Analysis to Separate Respiratory Influences from the Tachogram: Application to Stress Monitoring
Sebastian Żurek*, Paolo Castiglioni, Marcin Kośmider, Gianfranco Parati, Przemysław Guzik and Jarosław Piskorski
75 A Characteristic Ridge in Entropy Surfaces of Cardiovascular Time Series Estimated by the Norm Component Matrix Algorithm
Georgios Karakonstantis*, Aviinaash Sankaranaryanan and Andreas Burg
76 Low Complexity Spectral Analysis of Heart‐Rate‐Variability through a Wavelet based FFT
Computing in Cardiology 2012, Kraków, Poland xlv
Tuesday, September 11, 2012, 10:15
Chair(s): Stefano Severi
S53: Ventricular Modeling
Room: Bldg. B2, Rm 100
Michelangelo Paci*, Jari Hyttinen and Stefano Severi
77 A Novel Model of the Action Potential of Ventricular‐like Human Induced Pluripote
Aleksander Mendyk*, Barbara Wiśniowska, Kamil Fijorek, Anna Glinka, Miłosz Polak and Sebastian Polak
78 Empirical modeling of the sodium channel inhibition caused by drugs
Angelina Peñaranda*, Enric Alvarez‐Lacalle, Inma R Cantalapiedra, Leif Hove‐Madsen and Blas Echebarria
79 Nonlinearities Due to Refractoriness in SR Ca Release
Chikako Okubo*, Hitomi Sano, Yasuhiro Naito and Masaru Tomita
80 Prediction of Potential Unstable Electrical Activity during Embryonic Development of Rodent Ventricular Myocyte
Matthias W Keller*, Gunnar Seemann and Olaf Dössel
81 Differences in Intracardiac Signals on a Realistic Catheter Geometry using Mono‐ and Bidomain Models
Inge H Gerrits*, Adriaan van Oosterom and Thom F Oostendorp
82 Improving the Accuracy of Forward Computations: Different Methods to Implement the Propagation of the Depolarization Wave Front
xlvi Computing in Cardiology 2012, Kraków, Poland

Tuesday, September 11, 2012, 10:15
Chair(s): Dewar Finlay
S54: Special Session: Mobile Healthcare in Cardiology
Room: Bldg. B2, Rm 140
Juha Kortelainen*, Mark van Gils and Juha Pärkkä
83 Multichannel Bed Pressure Sensor for Sleep Monitoring
José García*, Álvaro Alesanco and Eva Cavero
84 Cardiac Signals Coding and Transmission in Real‐Time Mobile Telecardiology Applications
Jonathan Daly, Violeta Monasterio* and Gari D Clifford
85 A Neonatal Apnoea Monitor for Resource‐constrained Environments
Eliasz Kańtoch* and Piotr Augustyniak
86 Human Activity Surveillance based on Wearable Body Sensor Network
Anda Baharav*, Shuli Eyal and Yoni Dagan
87 Sleep in the Cloud: On How to Use Available Heart Rate Monitors to Track Sleep and Improve Quality of Life
Computing in Cardiology 2012, Kraków, Poland xlvii

Tuesday, September 11, 2012, 12:00
Chair(s): Peter van Dam
S61: Ischemia and Infarction
Room: Bldg. B1, Rm 121
Nader Jafarnia Dabanloo*, Gholamreza Attarodi, Naser Safdarian and Yousef Jafarnia Dabanloo
88 A New Method for Detection and Localization of Myocardial Infarction Using T‐wave Integral and Total Integral in One Cycle of ECG
Peter van Dam*, Arnold Dijk, Niek van der Putten, Arie Maan and Mike de Jongste
89 Estimating Infarct Severity from the ECG using a realistic heart model
Arnold Dijk*, Peter van Dam, Niek van der Putten, Arie Maan and Mike de Jongste
90 Validation of Infarct Size and Location from the ECG by Inverse Body Surface Mapping
Cornelia C ter Haar*, Arie C Maan, Martin J Schalij and Cees A Swenne
91 ST and Ventricular Gradient Dynamics During PTCA
xlviii Computing in Cardiology 2012, Kraków, Poland

Tuesday, September 11, 2012, 12:00
Chair(s): Steven Swiryn and Adriaan van Oosterom
S62: Electrophysiology
Room: Bldg. B1, Rm H24
Jesús Requena Carrión*, Juho Väisänen and Ferney Alberto Beltrán Molina
92 Analysis of the Spatial Resolution of Body‐Surface Dominant‐Frequency Mapping Systems
Rémi Dubois*, Simon Labarthe, Coudière Yves, Meleze Hocini and Michel Haissaguerre
93 Global and Directional Activation Maps for cardiac mapping in electrophysiology
Salim Idriss, Wanda Krassowska Neu, Vivek Varadarajan, Todor Antonijevic, Syed Gilani and Joseph Starobin*
94 Feasibility of Non‐Invasive Determination of the Stability‐of‐Propagation Reserve in Patients
Margarita Sanromán‐Junquera*, Inmaculada Mora‐Jiménez, Javier Saiz, Catalina Tobón, Arcadi García‐Alberola and José Luis Rojo‐Álvarez
95 Quantitative Spectral Criteria for Cardiac Navigation Sampling Rate Using Manifold Harmonics Analysis
Computing in Cardiology 2012, Kraków, Poland xlix
Tuesday, September 11, 2012, 12:00
Chair(s): Victor Mor‐Avi
S63: MRI/CT for Perfusion, Viability, and Texture
Room: Bldg. B2, Rm 100
Nadjia Kachenoura*, Nicolas Baron, Philippe Cluzel, Frédérique Frouin, Alain Herment, Philippe Grenier, Gilles Montalescot and Farzin Beygui
96 Comparison of Methods for Quantification of Myocar‐dial Infarct Size from Delayed‐Enhancement MRI Data
Trygve Eftestøl*, Leik Woie, Kjersti Engan, Jan Terje Kvaløy, Dennis WT Nilsen and Stein Ørn
97 Texture Analysis to Assess Risk of Serious Arrhythmias after Myocardial Infarction
Tomasz Pieciak*
98 Bootstrap Uncertainty Estimation of Canine Cardiac Fibers Anisotropy and Diffusivity on DT‐MRI Data
Victor Mor‐Avi*, Nadjia Kachenoura, Joseph Lodato, Sonal Chandra, Benjamin Freed, Barbara Newby, Roberto Lang and Amit Patel
99 Quantitative 3D Evaluation of Myocardial Perfusion During Regadenoson Stress Using Multidetector Computed Tomography
l Computing in Cardiology 2012, Kraków, Poland

Tuesday, September 11, 2012, 12:00
S64: Electrocardiography II
Room: Bldg. B2, Rm 140
Alba Martín‐Yebra*, Violeta Monasterio, Alessandro Pellegrini, Pablo Laguna, Enrico Caiani and Juan Pablo Martínez
100 Effect of Simulated Microgravity by Head‐Down Bed Rest on T Wave Alternans
Joachim Behar*, Julien Oster, Qiao Li and Gari Clifford
101 A single channel ECG quality metric
Felipe Alonso‐Atienza*, Eduardo Morgado‐Reyes, Lorena Fernández‐Martínez, Arcadi García‐Alberola and José Luis Rojo‐Álvarez
102 Combination of ECG Parameters with Support Vector Machines for the Detection of Life‐Threatening Arrhythmias
Miguel Altuve*, Guy Carrault, Alain Beuchée, Cyril Flamand, Patrick Pladys and Alfredo I Hernández
103 Comparing Hidden Markov Model and Hidden Semi‐Markov Model Based Detectors of Apnea‐Bradycardia Episodes in Preterm Infants
Computing in Cardiology 2012, Kraków, Poland li

Tuesday, September 11, 2012, 14:15
Chair(s): Ikaro Silva and Mehmet Kayaalp
S71: CinC Challenge II
Room: Bldg. B1, Rm 121
Sharath Cholleti, Gabriel Najarro, Alistair Johnson*, Jeffrey Jopling and Timothy Buchman
104 Analytics Framework for Modeling Critical Care Data
Srinivasan Vairavan*, Abigail Flower and Syed Haider
105 Physionet/Cinc 2012 Challenge: Prediction of Mortality in the ICU
Chucai Yi, Yingli Tian* and Yi Sun
106 CinC Challenge: Predicting In‐hospital Mortality of Intensive Care Unit by Analyzing Histogram of Medical Variables under Cascaded Adaboost Model
Michael Krajnak*, Joel Xue, William Balloni and Willi Kaiser
107 Combining Machine Learning and Clinical Rules to Build an Algorithm for Predicting ICU Mortality Risk
Thanh Hai Dang*, Koen Smets, Walter Verbrugghe, Bart Goethals, Philippe Jorens and Tim Van den Bulcke
108 Predicting Mortality Risk of ICU Patients using a Random Forest Classifier
lii Computing in Cardiology 2012, Kraków, Poland
Tuesday, September 11, 2012, 14:15
Chair(s): Jose Luis Rojo
S72: Heart Rate Variability
Room: Bldg. B1, Rm H24
Mika Tarvainen*, Jukka Lipponen, Hayder Al‐Aubaidy and Herbert Jelinek
109 Effect of Hyperglycemia on Cardiac Autonomic Function in Type 2 Diabetes
Vincent Viengkhou, Tina Hinton, Slade Matthews, Graham A Johnston, Mika P Tarvainen* and Herbert F Jelinek
110 Effect of Oolong Tea on Reducing Heart Rate Variability in Acute Stress
Benjamin Eilebrecht*, Stefan Wolter, Jeroen Lem, Hans‐Joachim Lindner, Rainer Vogt, Marian Walter and Steffen Leonhardt
111 The Relevance of HRV Parameters for Drivers Workload Detection in Real World Driving
Laura Canga*, Augusto Navarro, Juan Bolea, Jose M Remartínez, Pablo Laguna and Raquel Bailón
112 Non‐linear Analysis of Heart Rate Variability and Its Application to Predict Hypotension during Spinal Anesthesia for Cesarean Delivery
Philip A Warrick* and Emily F Hamilton
113 Fetal Heart‐rate Variability Response to Uterine Contractions during Labour and Delivery
Computing in Cardiology 2012, Kraków, Poland liii

Tuesday, September 11, 2012, 14:15
Chair(s): Cees Swenne
S73: Cardiac Repolarization
Room: Bldg. B2, Rm 100
Corrado Giuliani and Laura Burattini*
114 A New T‐wave Frequency Based Index for Discrimination of Abnormal Repolarization
Olivier Meste, Darek Janusek* and Michal Kania
115 A New Robust T Wave Alternans Detector and its Threshold Optimization
Pedro Virgilio Rivera Farina*, Erika Severeyn, Sara Wong and Javier Pérez Turiel
116 Study of Cardiac Repolarization during Oral Glucose Tolerance Test in Metabolic Syndrome Patients
Taher Biala*, Fernando Schlindwein and Michael Wailoo
117 QT Analysis of Intrauterine growth retarded and Normal children at 10 years old
Dubois Rémi*, Extramiana Fabrice, Denjoy Isabelle, Maison‐Blanche Pierre, Vaglio Martino, Roussel Pierre, Badilini Fabio and Leenhardt Antoine
118 A Machine Learning Approach for LQT1 vs LQT2 Discrimination
Laura Burattini*, Sumche Man and Cees A Swenne
119 Exercise‐induced Repolarization Alternans Heterogeneity in Patients with an Implanted Cardiac Defibrillator
liv Computing in Cardiology 2012, Kraków, Poland

Tuesday, September 11, 2012, 14:15
Chair(s): Jose Felix Rodriguez
S74: Modeling of Ischemia and Cardiac Electromechanics
Room: Bldg. B2, Rm 140
Irina V Biktasheva*, Vadim N Biktashev and Narine A Sarvazyan
120 Dynamics of Scroll Waves of Excitation in a Mathematical Model of Ischaemic Border Zone.
Bjørn Fredrik Nielsen*, Marius Lysaker and Per Grøttum
121 On the Use of the Bidomain Model for Computing the Position and Size of Ischemic Regions; a Validation Study
Anastasia Vasilyeva* and Olga Solovyova
122 Modeling of Heterogeneity in Electrical and Mechanical Function of Guinea Pig Ventricular Myocytes
Heqing Zhan*, Yunliang Zang, Yinglan Gong and Ling Xia
123 Effects of fibroblast on cardiac electro‐mechanics: a cube modeling study
Josef Peter Barnes* and Peter Rex Johnston
124 The Effect of Ischaemic Region Shape on ST Potentials using a Half‐Ellipsoid Model of the Left Ventricle
Peter Johnston*
125 A Model of Anatomically Opposed Ischaemia
Computing in Cardiology 2012, Kraków, Poland lv

Tuesday, September 11, 2012, 16:00
P81: Challenge Posters
Room: Krakus, ground floor
Erika Severeyn, Miguel Altuve*, Francisco Ng, Carlos Lollett and Sara Wong
126 Towards the Prediction of Mortality in Intensive Care Units Patients: A Simple Correspondence Analysis Approach
Marc Lipoff* and Erez Cohen
127 Classification of ICU Patient Records Using Dynamic Bins and Support Vector Machine
Martin Macas, Michal Huptych and Jakub Kuzilek*
128 Linear Bayes Classification for Mortality Prediction
Luigi Di Marco*, Marjan Bojarnejad, Susan King, Wenfeng Duan, Costanzo di Maria, Dingchang Zheng, Alan Murray and Philip Langley
129 Robust Prediction of Patient Mortality from 48 Hour ICU Data
Tongbi Kang*, Yilun Su and Lianying Ji
130 An Unified Acute Physiology Score for Predicting Mortality of Patients in Intensive Care Unit Based on Machine Learning Technology
Antonio Bosnjak* and Guillermo Montilla
131 Predicting Mortality of ICU Patients Using Statistics of Physiological Variables and Support Vector Machines
Tom Pollard* and Demetrio Martinez
132 Incorporating Time Derivatives of Physiological Variables into the SAPS Model: The Physionet/Computing in Cardiology Challenge 2012
Steven L Hamilton* and James R Hamilton
133 Patient‐Specific Intensive Care Mortality Prediction
lvi Computing in Cardiology 2012, Kraków, Poland

Tuesday, September 11, 2012, 16:00
Mehmet Kayaalp*
134 Predictions of ICU Outcomes using Trends of Physiologic Measurements in the First Two Days
Deep Bera* and Mithun Manjnath Nayak
135 Mortality risk assessment for ICU patients using Logistic Regression
Sean McMillan*, Alexander Van Esbroeck, Chih‐Chun Chia, Ilan Rubinfeld and Zeeshan Syed
136 ICU Mortality Prediction with Time Series Motifs
Cong Liu, Wen Bao, Yuan Gao, Yu Gong, Yisha Pan and Minfeng Wu*
137 Patient‐specific Prediction of ICU Mortality Based on Compressed Sensing
Jianfeng Xu*, Dan Li, Yuanjian Zhang, Admir Djulovic, Yu Li and Youjie Zeng
138 CinC Challenge: Clustering of ICU Time‐series Data
Tadeas Odstrcilik*, Jakub Kuzilek, Vaclav Chudacek and Lenka Lhotska
139 Scoring system for 12 lead ECG quality assessment
Naser Safdarian and Nader Jafarnia Dabanloo*
140 New Detection Method Based on Features of ECG Signal for Determine Localization and Extent of Myocardial Infarction Using Body Surface Potential Map Data
Computing in Cardiology 2012, Kraków, Poland lvii

Tuesday, September 11, 2012, 16:00
P82: Medical Informatics
Room: Krakus, ground floor
Maurizio Mangione*, Gianna Alberini, Gavino Marras, Stefano Dalmiani and Mattia Glauber
141 A Management System for Adult Cardiac Surgery
Gianmarco Angius* and Luigi Raffo
142 Cardiovascular Disease and Sleep Apnoea: a Wearable Device for PPG Acquisition and Research Aims
Gianmarco Angius*, Doris Barcellona, Elisa Cauli, Luigi Meloni and Luigi Raffo
143 Myocardial Infarction and Antiphospholipid Syndrome: a first Study on Finger PPG Waveforms Effects
Giuseppe Andrea L'Abbate*, Martina Marinelli, Maurizio Mangione, Paolo Marcheschi, Vincenzo Positano, Stefano Puzzuoli, Natalia Esposito, Chiara Caselli and Danilo Neglia
144 EVINCI study: management, integration and commu‐nication of clinical and imaging data.
Marija Vukovic, Mario Drobics, Dieter Hayn*, Guenter Schreier and Hans Lohninger
145 Weather Influence on Alarm Occurrence in Home Telemonitoring of Heart Failure Patients
Miguel A Becerra*, Diana A Orrego, Cristian Mejía and Edilson Delgado‐Trejos
146 Stochastic Analysis and Classification of 4‐Area Cardiac Auscultation Signals Using Empirical Mode Decomposition and Acoustic Features
lviii Computing in Cardiology 2012, Kraków, Poland

Tuesday, September 11, 2012, 16:00
P83: Cardiovascualar Imaging
Room: Krakus, ground floor
Cristiana Corsi*, Dario Turco, Corrado Tomasi, Massimo Margheri, Claudio Lamberti and Stefano Severi
147 Prediction of Cardiac Resynchronization Theraphy Response by Means of 3D Trajectory Assessment of the Coronary Sinus Lead
Maria Chiara Carminati*, Francesco Maffessanti, Paola Gripari, Gianluca Pontone, Daniele Andreini, Mauro Pepi and Enrico Gianluca Caiani
148 A Framework for CT and MR Image Fusion in Cardiac Resynchronization Therapy
Karim Lekadir*, Corné Hoogendoorn and Alejandro F Frangi
149 The Construction of a Statistical Atlas of the Whole Heart from a Large 4D CT Database
Matheus Cardoso Moraes*, Diego Armando Cardona Cárdenas and Sérgio Shiguemi Furuie
150 Automatic IOCT Lumen Segmentation Using Wavelet and Mathematical Morphology
Ricardo Santiago‐Mozos, José Luís Rojo‐Álvarez*, J Carlos Antoranz, Daniel Rodríguez, Mar Desco, Alicia Barrio, Yolanda Benito, Raquel Yotti and Javier Bermejo
151 Improved Estimation of Reference Indices of Left Ventricular Chamber Function from Ecocardiographic Images with Multidimensional Nonlinear Kernel Methods
Klaudia Czopek*, Elżbieta Pociask, Jacek Jąkała and Paweł Zawora
152 Automatic Assessment of Differences in Atherosclerotic Plaques Using IVUS‐VH Images
Lixia Shu*, Yanni Guan, Deyong Long and Ronghui Yu
153 A Fully Automatic Registration Method for CARTO Electro‐anatomic Map and CT Surface
Computing in Cardiology 2012, Kraków, Poland lix

Tuesday, September 11, 2012, 16:00
Magdalena Jabłońska*, Urszula Tyrankiewicz, Anna Osiak, Henryk Figiel and Tomasz Skórka
154 Cardiac Time‐Area Curve Modeling Using Piecewise Linear Regression in Mice with Heart Failure
Monika Natalia Bugdol*, Joanna Czajkowska and Ewa Piętka
155 A Novel Model‐Based Approach to Left Ventricle Segmentation
Mourad Bensalah, Emilie Bollache*, Nadjia Kachenoura, Alain De Cesare, Muriel Lefort, Alban Redheuil and Elie Mousseaux
156 Aortic Backward Flow Indices Estimated from Phase‐Contrast Cardiovascular Magnetic Resonance Data
Murielle Hadad, Monica M S Matsumoto and Sergio Shiguemi Furuie*
157 Synchronizing IVUS images via Virtual Histology images.
Antonio Bosnjak*, Ricardo Villegas and Guillermo Montilla
158 Spatial and Temporal estimation of Left Ventricle Wall from Ultrasound Images using Optical Flow Algorithm
Weichih Hu*, Hsuan‐Ming Tsao and Liang‐Yu Shyu
159 Evaluation of Pulse Wave Velocity using 4D CT cardiogram
lx Computing in Cardiology 2012, Kraków, Poland

Tuesday, September 11, 2012, 16:00
P84: ECG Methods
Room: Krakus, ground floor
Raymond R Bond, Dewar D Finlay*, Cathal Breen, Kyle Boyd, Chris D Nugent, Norman D Black, Peter W Macfarlane and Daniel Guldenring
160 Eye tracking in the Assessment of ECG Interpretation Techniques
Sara Wong*, Gaëlle Kervio, Miguel Altuve, François Carré and Guy Carrault
161 Comparing six QT Correction Methods in an Athlete’s Population
Johannes W Krug*, Georg H Rose, Daniel Stucht, Gari D Clifford and Julien Oster
162 Filtering the Magnetohydrodynamic Effect from 12‐lead ECG Signals using Independent Component Analysis
Heriberto Zavala‐Fernandez*, Michal Kania, Roman Maniewski and Dariusz Janusek
163 Evaluation of blind source separation methods for noise reduction in BSPM recorded during exercise
Aline Cabasson*, Olivier Meste, Raquel Bailon and Pablo Laguna
164 Validation of the PR‐RR Hysteresis Phenomenon
Brian Devine*, Elaine Clark, Shen Luo and Peter Macfarlane
165 Critical Values in the Uni‐G program
Computing in Cardiology 2012, Kraków, Poland lxi

Tuesday, September 11, 2012, 16:00
P85: Clinical Correlates of ECG
Room: Krakus, ground floor
Alessandro Pellegrini*, Juan Bolea, Mariano Llamedo Soria, Miguel Sotaquira, Rute Almeida, Pablo Laguna, Pierre Vaida and Enrico G Caiani
166 Selective Beat Averaging to Evaluate Ventricular Repolarization Adaptation to Deconditioning After 5‐days of Head‐Down Bed‐Rest
Alexander Van Esbroeck* and Zeeshan Syed
167 Assessing Cardiac Health through Heart Rate Topics
Giovanni Bortolan*, Ivaylo Christov, Iana Simova, Tzvetana Katova, Irena Jekova and Vessela Krasteva
168 Clinical Characterization by Principal Component Analysis of ECG in Stress Test
Anna Vera Cuppone, Montserrat Vallverdú, Pedro Gomis*, Alberto Porta, Andreas Voss, Antonio Bayes de Luna and Pere Caminal
169 Symbolic Dynamics of QT Interval Series: Ischemic Cardiomyopathy
Ahsan Habib Khandoker*, Selwa Boularaoui, Noura Salem Obaid Almatroushi, Enas Azhari Ahmed Osman, Ghada Mohammed Alhussein, Namareq Salah Mohamed Widatalla, Kinda Khalaf and Herbert Jelinek
170 Screening ST Segments of ECG Signals in Patients with Cardiac Autonomic Neuropathy
Mikhail Matveev, Vessela Krasteva, Irena Jekova*, Georgi Georgiev, Stoyan Milanov, Rada Prokopova and Lyudmila Todorova
171 Profile of the Autonomic Cardiac Control in Patients Who Are not Considered Ready for Weaning from Mechanical Ventilation
lxii Computing in Cardiology 2012, Kraków, Poland

Tuesday, September 11, 2012, 16:00
Fátima MHSP da Silva*, Antônio Carlos da Silva Filho, Lourenço Gallo Jr and Júlio Cesar Crescêncio
172 Applying Lyapunov Exponents in Heart Rate Time Series to Identify the Anaerobic Threshold in Healthy Men
Romain Billois, Fabienne Poree, Alain Beuchee and Guy Carrault*
173 Interest of RR Deceleration for Diagnosis of Late Onset Sepsis
Klaudia Czopek*
174 Significance of Snoring Sounds and Other Sounds Appearing during the Night, based on ECG
Oto Janousek*, Jana Kolarova, Marina Ronzhina, Marie Novakova and Sridhar Krishnan
175 Independent Component Analysis Suppresses Motion Artefact in Optical Action Potential Records
Computing in Cardiology 2012, Kraków, Poland lxiii
Tuesday, September 11, 2012, 16:00
P86: ECG Ischemia & Infarction
Room: Krakus, ground floor
Seyyed Abbas Atyabi*, Hamid Ebrahimi Orimi and Rasa Jamshidi
176 The Intelligent Method to detect the Normal, Ischemia, Myocardial Infarction and Reperfusion phases in Rat, based on ECG and ABP Signals
Marina Ronzhina*, Tomas Potocnak, Oto Janousek, Jana Kolarova, Marie Novakova and Ivo Provaznik
177 Spectral and Higher‐Order Statistics Analysis of ECG: Application to Study of Ischemia in Isolated Rabbit Hearts
Raúl Correa, Pedro D Arini*, Max E Valentinuzzi and Eric Laciar
178 Study of QRS‐loop Parameters and Conventional ST‐T indexes for Identification of Ischemic and Healthy Subjects
Esteban R Valverde and Pedro D Arini*
179 Study of T‐wave Spectral Variance during Acute Myocardial Ischemia
Raphael Twerenbold, Tobias Reichlin, Roger Abächerli*, Stefan Osswald and Christian Müller
180 Early Diagnosis of Acute Myocardial Infarction by ST‐Segment Deviation Score
lxiv Computing in Cardiology 2012, Kraków, Poland

Tuesday, September 11, 2012, 16:00
P87: General Electrocardiography
Room: Krakus, ground floor
A Hernández*, R Alcaraz, F Hornero and JJ Rieta
181 Role of Fibrillatory Waves Amplitude as Predictors of Immediate Arrhythmia Termination After Maze Surgery of Atrial Fibrillation
Or Perlman*, Amos Katz, Noam Weissman and Yaniv Zigel
182 Atrial Electrical Activity Detection in 12‐Lead ECG Using Synthetic Atrial Activity Signal
Trygve Eftestøl*, Jan Terje Kvaløy, Dennis WT Nilsen and Leik Woie
183 Analysis of Intracardiac Electrogram Changes
Julia Ramírez*, Ana Mincholé, Pablo Laguna and Esther Pueyo
184 Characterization of Cardiac Repolarization Response to Heart Rate Changes Provoked by a Tilt Test
Jose Luis Rodriguez‐Sotelo, Diego Hernán Peluffo‐Ordóñez*, David Cuesta‐Frau and Cesar German Castellanos‐Dominguez
185 Generalized Distance Measure‐based WPCA for Unsupervised Analysis of ECG Signals
Erik Alonso*, Elisabete Aramendi, Jesús Ruiz, Unai Ayala and Digna González‐Otero
186 Suppression of the Respiration Artefact and Extraction of the Cardiac Component in the Transthoracic Impedance Recorded Through Defibrillation Pads
Computing in Cardiology 2012, Kraków, Poland lxv

Wednesday, September 12, 2012, 08:15
Chair(s): Mirelle Garreau
S91: Cardiac MRI
Room: Bldg. B1, Rm 121
Emilie Bollache, Alban Redheuil, Stephanie Clement‐Guinaudeau, Carine Defrance, Ludivine Perdrix, Magalie Ladouceur, Muriel Lefort, Alain De Cesare, Alain Herment, Benoit Diebold, Elie Mousseaux and Nadjia Kachenoura*
187 Automated Evaluation of Diastolic Function from Phase‐Contrast MRI in Healthy Subjects and Patients
Martino Alessandrini*, Hervé Liebgott, Adrian Basarab, Patrick Clarysse and Olivier Bernard
188 Monogenic signal for cardiac motion analysis from tagged magnetic resonance image sequences.
Maria Chiara Carminati*, Francesco Maffessanti and Enrico Gianluca Caiani
189 Automated Motion Artifacts Removal between Cardiac Long‐ and Short‐axis MR Images
Giacomo Tarroni*, Amit R Patel, Chattanong Yodwut, Roberto M Lang, Claudio Lamberti, Victor Mor‐Avi and Cristiana Corsi
190 Automated Tracking of Deformable Objects Based on Non‐Rigid Registration of Cardiac Images
Oskar MO Maier*, Daniel Jimenez‐Carretero, Andres Santos and María J Ledesma‐Carbayo
191 Segmentation of RV in 4D Cardiac MR Volumes Using Region‐merging Graph Cuts
Julián Betancur*, Antoine Simon, François Tavard, Bernard Langella, Christophe Leclerq and Mireille Garreau
192 Segmentation‐free MRI to CT 3D Registration for Cardiac Resynchronization Therapy Optimization
lxvi Computing in Cardiology 2012, Kraków, Poland

Wednesday, September 12, 2012, 08:15
Chair(s): Philip Langley
S92: Atrial Fibrillation II
Room: Bldg. B1, Rm H24
Miguel Rodrigo*, Maria de la Salud Guillem, Alejandro Liberos, José Millet, Omer Berenfeld and Andreu Climent
193 Identification of Fibrillatory Sources by Measuring Causal Relationships
Shu Meng*, Jichao Zhao, Nigel Lever, Ian LeGrice and Bruce Smaill
194 Accurate Endocardial Activation Representation of Atria by Noncontact Mapping
Marjan Bojarnejad*, James Blake, John P Bourke, Alan Murray and Philip Langley
195 Comparing Power Spectral Density of 64 Channel Surface ECG with Left Atrium Electrogram in Patients in Atrial Fibrillation
Alejandro Alcaine*, Fernando Simón, Ángel Arenal, Pablo Laguna and Juan Pablo Martínez
196 A Wavelet‐Based Activation Detector for Bipolar Electrogram Analysis During Atrial Fibrillation
Omar Jacinto Escalona*, Vivek Kodoth, Noel Camilo Castro, Soumya Xavier, Benedict Glover, Ernest Lau and Ganesh Manoharan
197 Dynamic Changes of Intracardiac Atrial Impedance During Cardioversion Using Very‐Low‐Tilt Rectilinear Defibrillation Waveforms and Energy Step Up Protocol
Oriol Pont*, Hussein Yahia, Rémi Dubois and Michel Haïssaguerre
198 A Singularity‐analysis Approach to characterize Epicardial Electric Potential
Computing in Cardiology 2012, Kraków, Poland lxvii

Wednesday, September 12, 2012, 08:15
Chair(s): Alan Murray
S93: Cardiac Mechanics
Room: Bldg. B2, Rm 100
Dingchang Zheng*, Luigi Y Di Marco and Alan Murray
199 Blood Pressure Difference between the Measurements Taken during Cuff Inflation and Deflation
Kouhyar Tavakolian*, Gonzalo Portacio, Geoff Houlton, Andrew Blaber and Guy Dumont
200 Analysis of Seismocardiogram Capability for Trending Stroke Volume Changes: A Lower Body Negative Pressure Study
Santiago Murillo Rendón, Jorge Iván Padilla Buriticá* and Germán Castellanos Domínguez
201 Automatic Murmur Detection with Optimized Sensibility for Screening Purpose
Marcin Marzencki*, Behrad Kajbafzadeh, Farzad Khosrow‐Khavar, Bozena Kaminska and Carlo Menon
202 Accelerating Reperfusion with Low Frequency Vessel Deformation during Myocardial Infarction
Samuel Emil Schmidt*, Henrik Zimmermann, John Hansen, Henrik Møller, Dorte Hammershøi and Johannes Jan Struijk
203 The Chest is a Significant Collector of Ambient Noise in Heart Sound Recordings
Luigi Yuri Di Marco*, Dingchang Zheng and Alan Murray
204 Effects of Deep Breathing on Blood Pressure Measurement in Healthy Subjects
lxviii Computing in Cardiology 2012, Kraków, Poland

Wednesday, September 12, 2012, 08:15
Chair(s): Ling Xia
S94: Ventricular Modeling: Arrhythmia
Room: Bldg. B2, Rm 140
Linwei Wang*, Fady Dawoud, Ken Wong, Albert Lardo and Pengcheng Shi
205 Transmural Imaging of Ventricular Electrophysiological Activity and Post‐Infarct Substrate in Porcine Hearts
Sándor M Szilágyi*, László Szilágyi, Constantin T Luca, Dragoş Cozma, Gabriel Ivănică and Călin Enăchescu
206 Spatial Modeling of the Wolff–Parkinson–White Syndrome Induced Ventricular Fibrillation
Tanveer A Bhuiyan*, Claus Graff, Morten B, Thomsen and Johannes J Struijk
207 Drug Effects on the Action Potential Manifest More Strongly as T‐wave Changes than QTc prolongation
Sebastian Polak*, Barbara Wiśniowska, Kamil Fijorek, Anna Glinka, Miłosz Polak and Aleksander Mendyk
208 Modeling and Simulation Approach for Assessing Proarrhythmic Potency of the Non‐cardiological Drugs
Computing in Cardiology 2012, Kraków, Poland lxix

Wednesday, September 12, 2012, 10:00
PA1: Arrhythmia Posters
Room: Krakus, ground floor
Carolyn Lall*, Zhe Zhang and Yu Chen
209 Performance Challenges in ECG Pacemaker Pulse Detection Systems
Ling Zheng, Carolyn Lall* and Yu Chen
210 Low‐Distortion Baseline Removal Algorithm for Electrocardiogram (ECG) Signal
Patricia Radon*, Gero von Wagner, Norbert Kraft and Uwe Steinhoff
211 Collection of Pediatric ECG Data for Testing Detection Algorithms in Automated External Defibrillators
Tamas Szuszai*, Sandor Khoor, Nandor Balogh, Istvan Kecskes, Katalin Fugedi, Ilona Kovacs, Ildiko Simon and Sandor Rubicsek
212 Telemedicine Application for Predicting Ventricular Arrhythmia and Sudden Cardiac Death by the Analysis of Phase Synchronization in Heart Failure Patients
Ivo Iliev, Bistra Nenova, Irena Jekova* and Vessela Krasteva
213 Algorithm for Real‐Time Pulse Wave Detection Dedicated to Non‐Invasive Pulse Sensing
Adolfo Fonseca Guzmán, Andreu M. Climent, José Millet*, Paola Berné, Josep Brugada, Rafael Ramos, Ramón Brugada and María S. Guillem
214 Diagnosis of Non‐Type I Brugada Syndrome Patients by Vectorcardiographic Measurements
Kania Michal*, Fereniec Malgorzata and Maniewski Roman
215 Evaluation of T‐wave morphology dispersion in high‐resolution ECG for risk stratification of sudden cardiac death
lxx Computing in Cardiology 2012, Kraków, Poland
Wednesday, September 12, 2012, 10:00
Hamid Ebrahimi Orimi*, Rasa Jamshidi, Amir Hosseini sabzevari and Seyyed Abbas Atyabi
216 Time and Frequency domain Analysis for Ventricular Late Potential detection based on Wavelet Packet method
Nandor Balogh*, Sandor Khoor, Tamas Szuszai, Istvan Kecskes, Katalin Fugedi, Ilona Kovacs, Ildiko Simon and Sandor Rubicsek
217 Recurrence Quantification Analysis, based on P‐P Intervals Measurement in Postinfarction Patients with Frequent Ventricular Ectopy
Sebastian Polak*, Barbara Wiśniowska, Kamil Fijorek, Anna Glinka, Miłosz Polak and Aleksander Mendyk
218 ToxComp ‐ in vitro – in vivo extrapolation system for the drugs proarrhythmic potency assessment
Computing in Cardiology 2012, Kraków, Poland lxxi
Wednesday, September 12, 2012, 10:00
PA2: Atrial Fibrillation Posters
Room: Krakus, ground floor
Valentina DA Corino*, Caterina Piazza, Federico Anzil, Stefano Benussi and Luca T Mainardi
219 Drastic Reduction of RR Variability and Irregularity after Surgical Treatment of Atrial Fibrillation: a Comparison between Two Ablation Devices
R Alcaraz*, F Hornero and JJ Rieta
220 Study on Atrial Fibrillation Recidivity After Electrical CardioversionThrough Fibrillatory Waves Time‐Frequency Analysis
A Martinez, R Alcaraz and JJ Rieta*
221 Optimal Cancellation Template Analysis for Ectopic Beats Removal in Atrial Fibrillation Recordings
Eva Cirugeda‐Roldan, Daniel Novak*, Vaclav Kremen, David Cuesta‐Frau, Christopher Schilling, Olaf Doessel, Armin Luik and Claus Schmitt
222 Complexity Level Differentiation of Complex Fractioned Atrial Electrograms by means of Sample Entropy
JJ Rieta* and R Alcaraz
223 Fibrillatory Waves Automatic Delineation in Atrial Fibrillation Surface Recordings Based on Mathematical Morphology
lxxii Computing in Cardiology 2012, Kraków, Poland
Wednesday, September 12, 2012, 10:00
PA3: Novel Techniques
Room: Krakus, ground floor
Kai Noponen*, Suvi Tiinanen and Tapio Seppänen
224 Deriving Respiration from Electrocardiogram by Serial Comparison with Statistical Mean Shape
Massimo W Rivolta*, Luca T Mainardi and Roberto Sassi
225 A Novel Measure of Atrial Fibrillation Organization based on Symbolic Analysis
Gabriel Garcia, Rachel Smith, Henian Xia and Xiaopeng Zhao*
226 Heart rate biometrics based on fingertip optical video using cell phones
Costanzo Di Maria, Emma Sharkey, Annette Klinge, Dingchang Zheng, Alan Murray*, John O'Sullivan and John Allen
227 Feasibility of Monitoring Vascular Ageing by Multi‐site Photoplethysmography
Thomas Hilbel*, Hartmut Surmann and Hugo Katus
228 The kinect sensor device as a natural user interface in the cardiac catheterization laboratory
Computing in Cardiology 2012, Kraków, Poland lxxiii

Wednesday, September 12, 2012, 10:00
PA4: Cardiac Mechanics
Room: Krakus, ground floor
Rodolfo González*, Alain Manzo, Juan Delgado, Julio Gomis‐Tena and Javier Saiz
229 Photoplethysmographic Augmentation Index Using the Signal Fourth Derivative
Hamid Ebrahimi Orimi*, Seyyed Abbas Atyabi and Rasa Jamshidi
230 Diagnosis of Cardioprotective Effect and Heart Tissue Damage, with Different Doses of Vasopressin (AVP), through Discrete Wavelet Analysis of Electrocardiogram and Atrial Blood Pressure Signals
lxxiv Computing in Cardiology 2012, Kraków, Poland

Wednesday, September 12, 2012, 10:00
PA5: Electrophysiology
Room: Krakus, ground floor
R Cervigon*, J Moreno, J Millet and F Castells
231 Predictive Value of Entropy Analysis for Atrial Fibrillation Recurrence after Ablation Procedures
A Guill, A Tormos, FJ Chorro, E Roses, F Castells, I Trapero, LM Such‐Miquel, L Brines, M Zarzoso and José Millet*
232 Effects of Local Epicardial Cooling/Warming on the Complexity of the Ventricular Fibrillatory Pattern
Ferney A Beltrán Molina*, Jesús Requena Carrión and Juho Väisänen
233 Analysis of the Effects of Lead Configuration on Cardiac Spectrum
Computing in Cardiology 2012, Kraków, Poland lxxv

Wednesday, September 12, 2012, 10:00
PA6: Modeling
Room: Krakus, ground floor
Yves Coudière* and Myriam Rioux
234 Virtual electrodes mechanisms predictions with a current‐lifted monodomain model
Jana Svehlikova*, Jana Lenkova and Milan Tysler
235 Modified Inverse Solution to One Dipole for Location of Lesions with Changed Repolarization
Lucia Romero, Beatriz Trenor, Jose Maria Ferrero, Javier Saiz* and Colleen E Clancy
236 Dofetilide unmasks occult congenital Long QT Syndrome Type 2: a simulation study
Ki Moo Lim*, Eun Bo Shim and Natalia Trayanova
237 Ventricular Assist Device Lowers Cardiac Electromechanical Delay: Simulation Study
Michael Colman*, Alexander Rabinovich, Shahab Saraee and Henggui Zhang
238 Properties of Four Human Atrial Cell Models: Action Potential, Memory and Ionic Channel Kinetics in Single Cells
Martin Corraine*, Sonia Lopez and Linwei Wang
239 GPU Acceleration of Transmsural Electrophysiological Imaging
Sándor M Szilágyi* and László Szilágyi
240 Study of Self Maintaining Spatial Spiral Waves in Ventricular Tissue
Sándor M Szilágyi*
241 A Cellular Energetic Extension Applied to the Luo‐Rudy II Ventricular Cell Model
lxxvi Computing in Cardiology 2012, Kraków, Poland
Wednesday, September 12, 2012, 10:00
Nejib Zemzemi*, Javier Saiz and Blanca Rodriguez
242 Role of L‐type Calcium in Modulating Pro‐arrhythmic Effects of Dofetilide in Humans
Rasa Jamshidi, Hamid Ebrahimi and Abbas Attyabi*
243 Electromechanical Cardiovascular System Identification and Modeling with ANFIS with ECG and ABP Signals
Rodolfo González*, Juan Delgado, Karen Cardona, Lucia Romero, Beatriz Trenor, Jose Maria Ferrero and Javier Saiz
244 Influence of Pore hERG Mutation on Dofetilide Proarrhythmic Risk
Esteban Ramírez*, Javier Sáiz and Beatriz Trénor
245 Role of Extracellular Potassium and Cellular Uncoupling on the Electrical Activity of the Purkinje‐Ventricle Subsystem: A Simulation Study
Elisa Passini* and Stefano Severi
246 Computational Analysis of Extracellular Calcium Effects on an Improved Human Ventricular Action Potential Model
Hitomi Sano*, Yasuhiro Naito and Masaru Tomita
247 Role of Na(+)‐Ca(2+) exchange in neonatal and adult ventricular cells: a simulation study
Simon Labarthe*, Yves Coudiere, Jacques Henry and Hubert Cochet
248 A Semi‐Automatic Method To Construct Atrial Fibre Structures : a Tool for Atrial Simulations.
Sándor M Szilágyi*, László Szilágyi and Călin Enăchescu
249 Hypoxia Modeling Using Luo‐Rudy II Cell Model
Sebastian Polak*, Barbara Wiśniowska, Kamil Fijorek, Anna Glinka, Miłosz Polak and Aleksander Mendyk
250 Is silico prediction of the drug overdose consequences at the heart electrophysiology level
Computing in Cardiology 2012, Kraków, Poland lxxvii

Wednesday, September 12, 2012, 10:00
Nicolas Navoret*, Sabir Jacquir, Gabriel Laurent and Stéphane Binczak
251 Relationship between complex fractionated atrial electrogram patterns and different heart substrate configuration
Ali Gharaviri*, Sander Verheule, Nico Kuijpers and Ulrich Schotten
252 Mutual Influence between Dyssynchrony and Transmural Conduction maintains Atrial Fibrillation
Jorge Pedron‐Torrecilla*, Andreu M. Climent, Alejandro Liberos, Esther Pérez‐David, José Millet, Felipe Atienza and Maria S Guillem
253 Noninvasive Estimation of the Activation Sequence in the Atria during Sinus Rhythm and Atrial Tachyarrhythmia
Beatriz Trenor, Julio Gomis‐Tena, Jose Ferrero*, Sridharan Rajamani, Luiz Belardinelli and Javier Saiz
254 A Simulation Tool to Assess the Pro‐arrhythmic Potential of Ion Channel Blockers
lxxviii Computing in Cardiology 2012, Kraków, Poland
Wednesday, September 12, 2012, 10:00
PA7: Heart Rate Variability
Room: Krakus, ground floor
Herbert Jelinek, Mika Tarvainen* and David Cornforth
255 Renyi Entropy in Identification of Cardiac Autonomic Neuropathy in Diabetes
Noelia Rodriguez‐Ibañez*, Miguel Angel Garcia‐Gonzalez, Maria Aurora Filigrana de la Cruz, Mireya Fernandez‐Chimeno and Juan Ramos‐Castro
256 Changes in Heart Rate Variability indexes due to drowsiness in professional drivers measured in a real environment
Jiří Spilka*, Václav Chudáček, Miroslav Burša, Lenka Lhotská, Petr Janků and Lukáš Hruban
257 Stability of Variability Features Computed from Fetal Heart Rate with Artificially Infused Missing Data
Krzysztof Kudryński* and Paweł Strumiłło
258 Real‐time Preprocessing and Estimation of the Spectral Parameters of Heart Rate Variability Series
Jan Gierałtowski, Jan Jacek Żebrowski, Ewa Orłowska‐Baranowska, Rafał Baranowski and Teodor Buchner*
259 Multifractal Properties Assessment at the Very Low Frequency Range in Subjects with Different Progress of Aortic Valve Stenosis Disease
Miguel Angel Garcia‐Gonzalez*, Juan Ramos‐Castro and Mireya Fernandez‐Chimeno
260 A Novel Index Based on Fractional Calculus to Assess the Dynamics of Heart Rate Variability: Changes due to Chi or Yoga Meditations
Gerard Cybulski*, Anna Strasz, Wiktor Niewiadomski, Dominika Życka, Marcin Konefał, Anna Gąsiorowska and Tadeusz Pałko
261 The Analysis of Transient Heart Rate Response to the Active Orthostatic Manoeuvre
Computing in Cardiology 2012, Kraków, Poland lxxix
Wednesday, September 12, 2012, 10:00
Gianni D'Addio*, Mario Cesarelli, Maria Romano, Giuseppe Furgi, Nicola Ferrara and Franco Rengo
262 Pre‐ectopic Vagal Tone Affects Heart Rate Turbulence Slope in Heart Failure
Gianni D'Addio*, Mario Cesarelli, Roberto Maestri, Giuseppe Furgi, Nicola Ferrara and Franco Rengo
263 Neurohormonal and functional correlates of linear and Poincarè plot indexes of heart rate variability in heart failure patients
Pouria Sarlak, Amir Homayoun Jafari, Nader Jafarnia Dabanloo*, Seyed Kamaledin Setarehdan and Gholamreza Attarodi
264 HRV Signal Dynamic Extraction in the Poincare Plot by analyzing the Extended U‐Sequences in order to Cardiac Arrhythmia Classification
Sadaf Moharreri, Nader Jafarnia Dabanloo*, Saman Parvaneh, Ali Moti Nasrabadi and Gholamreza Attarodi
265 Extended Triangle Phase Space Mapping (ETPSM): The novel method for representation of Heart Rate Va‐riability Signal
Chandan Karmakar*, Ahsan Khandoker and Marimuthu Palaniswami
266 Analysis of slope based heart rate asymmetry using Poincare plot
Chandan Karmakar*, Ahsan Khandoker, Mikko P Tulppo, Timo H Mäkikallio, Antti Kiviniemi, Arto Hautala, Heikki V Huikuri, Marimuthu Palaniswami and Herbert F Jelinek
267 Dynamics of Heart Rate Changes Following Moderate and High Volume Exercise Training
lxxx Computing in Cardiology 2012, Kraków, Poland

Wednesday, September 12, 2012, 10:00
PA8: Technology in Simulation
Room: Krakus, ground floor
Jiqian Zhang, Xiaoqin Si, Xiang Li, Fei Gao and Henggui Zhang*
268 Re‐pacemaking from Oscillation Cessation Induced by External Low Frequency Signals in an Aged Intact Sinoatrial Node Atrium Model
Azar Rahimi*, Hongda Mao, Ken CL Wong and Linwei Wang
269 Impact of Anatomical Variations in Ventricular Shape on Transmural Electrophysiological Imaging
Walther H W Schulze*, Danila Potyagaylo and Olaf Dössel
270 Activation Time Imaging in the Presence of Myocardial Ischemia: Choice of Initial Estimates for Iterative Solvers
Gholamreza Attarodi*, Nader Jafarnia Dabanloo, Samaneh Mahdinazar, Ali Moti Nasrabadi and Ali Javadirad
271 Modeling of ECG Signals with regard to the Location and Intensity of Myocardial Infarction
Nico Kuijpers, Willem Dassen*, Peter van Dam, Eelco van Dam, Evelien Hermeling, Joost Lumens, Theo Arts and Tammo Delhaas
272 CircAdapt: a User‐friendly Learning Environment for (Patho)physiology of Heart and Circulation
Frederique Vanheusden*, Joao Loures Salinet Jr., William Nicolson, Gerry McCann, André Ng and Fernando Schlindwein
273 Patient‐Specific Three‐Dimensional Torso Models for Analysing Cardiac Activity
Computing in Cardiology 2012, Kraków, Poland lxxxi
Wednesday, September 12, 2012, 13:15
Chair(s): Pablo Laguna and Piotr Augustinyak
MC: Plenary
Room: Bldg. A0, Aula
Jean‐Philippe Couderc*, Jean Xia, Wojciech Zareba, Arthur J Moss and Coeli M Lopes
274 Measurement of Instantaneous Response of QT intervals to RR Changes: its association to life‐threatening events in the type 1 long QT syndrome.
Fady Dawoud*, David Spragg, Karl H Schuleri, B Milan Horáček, Henry Halperin and Albert C Lardo
275 Inverse Electrocardiographic Imaging to Assess Electrical Dyssynchrony in CRT patients
Alexander Berkowitsch*, Sergei Zaltsberg, Harald Greiss, Ersan Akkaya, Malte Kuniss, Heinz‐Friedrich Pitschner, Christian Hamm and Thomas Neumann
276 New Score for Pre‐ablative Evaluation of the Success of Catheter Ablation of Atrial Ablation
Eva Cavero, Álvaro Alesanco* and José García
277 Real‐Time Transmission of 2D Echocardiograms over WiMAX networks
lxxxii Computing in Cardiology 2012, Kraków, Poland

Abstracts


Automated Evaluation of Aortic Valve Stenosis from Phase-Contrast Magnetic Resonance Data Emilie Bollache*, Carine Defrance, Ludivine Perdrix, Alban Redheuil, Benoit Diebold, Nadjia Kachenoura, Elie Mousseaux
INSERM U678/UPMC Univ Paris 6, Paris, France
Aims: Accurate evaluation of aortic valve stenosis (AVS) is crucial for
relevant patients management. Despite technical limitations, transthoracic
echocardiography (TTE) remains the gold standard for AVS evaluation,
which is achieved estimating aortic valve area (AVA) and hemodynamic pa-
rameters such as transvalvular aortic maximal velocity and mean pressure
gradient. Moreover, studies demonstrated the usefulness of phase-contrast
cardiovascular magnetic resonance (PC-CMR) in the non-invasive evaluation
of AVS. However, they were mostly based on manual data processing. Ac-
cordingly, our aims were to design an automated PC-CMR data analysis
method, which would allow the reproducible estimation of the aforemen-
tioned parameters, and to test its accuracy in comparison with TTE.
Methods: We studied 74 subjects (53 patients with AVS, 21 controls)
who had TTE and CMR on the same day. Left ventricular outflow tract
(LVOT) and aortic valve 2D PC-CMR data automated analysis comprised
dynamic segmentation of velocity images and extraction of hemodynamic
indices as well as AVA using 3 methods: AVACMR1, based on Hakki’s formu-
la; AVACMR2, based on continuity equation; AVACMR3, based on a modified
continuity equation, using LVOT flow-rate and aortic velocity peaks rather
than time integrals.
Results: This analysis was reproducible, as reflected by low inter-operator
variability in parameters measurements (<4.56±4.40%). Furthermore, strong
correlations (r>0.86, p<0.0001) were obtained for the comparison between
TTE and CMR for all indices and importantly, Bland-Altman analysis result-
ed in very low mean biases (<0.09±0.28cm²) for comparison of CMR conti-
nuity equation-based against TTE. Finally, the 3 CMR AVA estimates were
able to characterize severe AVS, as defined by TTE (accuracy>92%), with
again a slight superiority for AVACMR2 and AVACMR3.
Conclusion: The addition of our fast, reproducible and accurate PC-CMR
evaluation of aortic valve hemodynamic and AVA to the well established
CMR evaluation of LV hypertrophy, concentric remodeling, and fibrosis us-
ing gadolinium enhancement, might be clinically useful.
M1
Computing in Cardiology 2012, Kraków, Poland 1
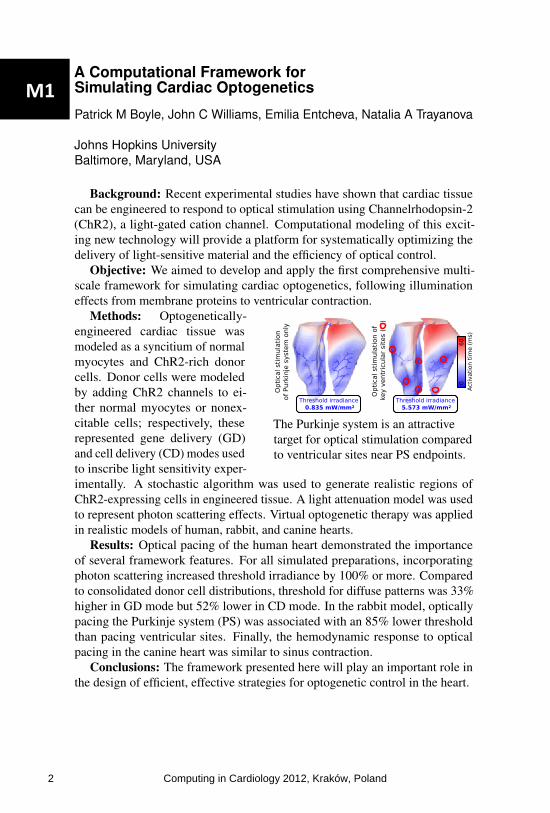
A Computational Framework forSimulating Cardiac Optogenetics
Patrick M Boyle, John C Williams, Emilia Entcheva, Natalia A Trayanova
Johns Hopkins UniversityBaltimore, Maryland, USA
Background: Recent experimental studies have shown that cardiac tissuecan be engineered to respond to optical stimulation using Channelrhodopsin-2(ChR2), a light-gated cation channel. Computational modeling of this excit-ing new technology will provide a platform for systematically optimizing thedelivery of light-sensitive material and the efficiency of optical control.
Objective: We aimed to develop and apply the first comprehensive multi-scale framework for simulating cardiac optogenetics, following illuminationeffects from membrane proteins to ventricular contraction.
The Purkinje system is an attractivetarget for optical stimulation comparedto ventricular sites near PS endpoints.
Methods: Optogenetically-engineered cardiac tissue wasmodeled as a syncitium of normalmyocytes and ChR2-rich donorcells. Donor cells were modeledby adding ChR2 channels to ei-ther normal myocytes or nonex-citable cells; respectively, theserepresented gene delivery (GD)and cell delivery (CD) modes usedto inscribe light sensitivity exper-imentally. A stochastic algorithm was used to generate realistic regions ofChR2-expressing cells in engineered tissue. A light attenuation model was usedto represent photon scattering effects. Virtual optogenetic therapy was appliedin realistic models of human, rabbit, and canine hearts.
Results: Optical pacing of the human heart demonstrated the importanceof several framework features. For all simulated preparations, incorporatingphoton scattering increased threshold irradiance by 100% or more. Comparedto consolidated donor cell distributions, threshold for diffuse patterns was 33%higher in GD mode but 52% lower in CD mode. In the rabbit model, opticallypacing the Purkinje system (PS) was associated with an 85% lower thresholdthan pacing ventricular sites. Finally, the hemodynamic response to opticalpacing in the canine heart was similar to sinus contraction.
Conclusions: The framework presented here will play an important role inthe design of efficient, effective strategies for optogenetic control in the heart.
M1
2 Computing in Cardiology 2012, Kraków, Poland
Automatic Vessel Tracking and Segmentation Using Epicardial Ultrasound in Bypass Surgery
Alex Skovsbo Jørgensen*, Samuel Emil Schmidt, Niels-Henrik Staalsen and Lasse Riis Østergaard
Aalborg University Aalborg, Denmark
Aim: The aim of the study was develop an image analysis based method to enable automatic stenosis quantification for quality assessment of coronary artery bypass graft (CABG) surgery using in vivo epicardial ultrasound sequences (EUSS). Tracking and Segmentation Framework: A vessel tracking and segmentation framework was developed that automatically can detect and segment vessels in EUSS. The vessel detection classifies extracted regions to determine if vessels are present in a frame in the beginning of EUSS or if tracking of a vessel is lost. An active contour approach is used to segment the vessel lumen of detected vessels through the EUSS. The framework is designed to handle vessel lumen translations in the scan plane in between frames due to cardiac motion and assess if the vessel lumen segmentation is correct or vessel information in a frame is insufficient. If segmentations are assessed as correct they are used to quantify the area of the vessel lumen otherwise the segmentation is discarded and the vessel detection is used in the next frame.
Test Setup: 10 independent EUSS were obtained of anastomotic sites from eight porcine CABG anastomoses. An eight-fold cross validation of the vessel detection classifier was used to assess the mean sensitivity, specificity and overall accuracy in detecting vessels. To assess the performance of the tracking and segmentation framework it was applied to three randomly selected vessels EUSS for each subject (24 in total). A manual visual validation was made of the vessel segmentations approved by the algorithm to determine the percentage of correct vessel segmentations outputted by the algorithm.
Results: The vessel detection classifier showed a mean sensitivity of 88%, specificity of 99%, and an overall accuracy of 93% in detecting vessels. 79% of the vessel segmentations approved by the algorithm were assessed as correct.
M1
Computing in Cardiology 2012, Kraków, Poland 3

Reservoir Computing for Extraction of Low Amplitude Atrial Activity in Atrial Fibrillation
Andrius Petrėnas*, Vaidotas Marozas, Leif Sörnmo and Arūnas Lukoševičius
Biomedical Engineering Institute, Kaunas University of Technology, Kaunas, Lithuania
A novel method for QRST cancellation during atrial fibrillation (AF) is
introduced for use in recordings with two or more leads. The method is based on an echo state neural network (ESN) which estimates the time-varying, nonlinear transfer function between two leads, one lead with atrial activity and another lead without, for the purpose of canceling ventricular activity. The performance is evaluated on ECG signals, with simulated f-waves of low amplitude added, by determining the root mean square error P between the true f-wave signal and the estimated signal, as well as by evaluating the dominant AF frequency. When compared to average beat subtraction (ABS), being the most widely used method for QRST cancellation, the performance is found to be significantly better with equal to mean and standard deviation of Pesn 24.8+/-7.3 and Pabs 34.2+/-17.9 uV (p<0.001). The novel method is particularly well-suited for implementation in mobile health systems where monitoring of AF during extended time periods is of interest.
M1
4 Computing in Cardiology 2012, Kraków, Poland

On Designing and Testing Transformations for Deriving Body Surface Potential Maps from 12-lead ECG and Its Subsets
John Wang*, John Sapp, James Warren and Milan Horáček
Philips Healthcare Andover, United States
The aim of this study was to develop and evaluate transformation
coefficients for deriving body surface potential maps (BSPMs) from the standard 12-lead ECG and from 15 reduced lead sets using 3 limb electrodes and 2 chest electrodes at precordial sites V1 to V6. As a study population, we used Dalhousie Superset (n = 892) including healthy subjects, postinfarction patients, and patients with a history of ventricular tachycardia. For each subject, 120-lead ECG recordings of 15-second duration were averaged, and all samples of the QRST complex for leads of interest were extracted; these data were used to derive—by regression analysis—general and patient-specific coefficients for lead transformations. These coefficients were then used to predict potential values at 120 BSPM electrode sites from the complete 12-lead ECG and from 15 reduced lead sets. The accuracy was assessed using correlation coefficient in percent (r) and RMS error (eRMS) in microvolts. Our results show that BSPMs can be predicted from the 12-lead ECG by using general coefficients with (mean ± SD) r = 94.6 ± 3.9 and eRMS = 46.5 ± 21.8; by using patient-specific coefficients, predictions considerably improved, with r = 99.5 ± 1.2 and eRMS = 8.6 ± 7.0. The best reduced leads set (I, II, V2, V4) can achieve goodness-of-fit values r = 92.8 ± 4.3 and eRMS = 57.6 ± 27.2 with general coefficients, and r = 98.2 ± 3.5 and eRMS = 17.7 ± 14.5 with patient-specific coefficients. In conclusion, BSPMs can be derived from the standard 12-lead ECG—and even from its subsets—with reasonable accuracy, especially with patient-specific coefficients. In some clinical applications, such as in catheter ablation of ventricular tachycardia, pre-procedure BSPMs can yield transformation coefficients that can be used during the ablation procedure to improve the localization accuracy of the 12-lead ECG.
S21
Computing in Cardiology 2012, Kraków, Poland 5

Automated Localization of Pacing Sites in Postinfarction Patients from the 12-lead Electrocardiogram and Body Surface Potential Maps
John L Sapp, Ahmed El-Damaty, Paul J MacInnis, James W Warren and B Milan Horacek*
Dalhousie University Halifax, Canada
Our aim was to develop a computational method for localizing the origin
of ventricular activation from the 12-lead ECG and/or from the body surface potential maps (BSPMs). For 18 patients who underwent catheter ablation of scar-related ventricular tachycardia, BSPM data (consisting of 120 ECG leads) were recorded during catheter pacing at 213 left-ventricular endocardial sites identified on 3D electroanatomical maps, and each site was associated with one of the 16 anatomical segments. BSPM data corresponding to these sites constituted a design set for generating characteristic ECG patterns (“templates”) for each segment, consisting of time-integrals of the entire QRS (∫QRS) or of the trimmed QRS (e.g. initial 120 ms, denoted as ∫QRS120), for either 12 or 120 leads. Localization method matched ECG pattern of a given activation sequence with pre-determined templates, using the correlation coefficient (CC) or mean absolute deviation (MAD) to seek segments with the best fit. The localization accuracy was measured by a percentage of correct hits by the first-ranked segment and by those ranked as first/second and first/second/third. The ∫QRS120 templates were the optimal ones, correctly ranking the pacing segment as the first, first/second, and first/second/third in 52%, 76%, and 87% of cases, respectively, for 12-lead templates. Corresponding localization accuracy of the 120-lead ∫QRS120 was significantly better at 61%, 83%, and 92% (p = .007, .002, .0003), respectively. The proposed localization method lends itself to implementation on any personal computer and/or tablet; our implementation is running on Android 3.2 tablet. In conclusion, electrocardiographic localization of the origin of ventricular activation to the vicinity of the endocardial segment of activation origin can be achieved with high accuracy by template-matching using the 12-lead ECG; significantly better accuracy can be achieved with 120-lead body surface potential maps. Real-time implementation of this method may facilitate pacemapping of ventricular tachycardia
.
S21
6 Computing in Cardiology 2012, Kraków, Poland

Automatic Detection of Chest Compression PausesUsing the Transthoracic Impedance Signal
Digna Gonzalez-Otero, Sofıa Ruiz de Gauna, Jesus Ruiz, Unai Ayala,Erik Alonso
University of the Basque Country UPV/EHUBilbao, Spain
Aims: A method for the automatic detection of chest compression pausesduring cardiopulmonary resuscitation (CPR) episodes using the transthoracicimpedance (TTI) signal is presented. The main application of this method isto enable artifact-free rhythm analysis during chest compression pauses forpatient ventilation, thus reducing hands-off time.
Methods: A database of 600 ECG records containing 3596 pauses with amean duration 7.0 ± 6.2 s was used. All records were extracted from out-of-hospital cardiac arrest episodes. Each record contained three signals: TTI,surface ECG and compression depth (CD). The CD was used to annotate theactual pauses. Chest compressions and ventilations induce variable amplitudefluctuations on the TTI signal. The proposed method preprocessed the TTI sig-nal to isolate the fluctuations induced by chest compressions. Then the squareof the slope was computed and smoothed. The resulting signal presented highamplitude during chest compression intervals and low amplitude during pauses.Chest compression pauses were detected using an adaptive threshold.
Results: The sensitivity and positive predictive value obtained for the testdatabase (1801 pauses) were 94% and 96%, respectively. The mean (stan-dard deviation) difference between the actual and the detected duration of thepauses was 0.24 (0.93) s. The mean duration of pauses fulfilling resuscitationguidelines (2 ventilations) was 5.2 (1.8) s, and its 5th percentile was 3.0 s.
Conclusions: The combination of a reliable detector of chest compressionpauses and a high temporal resolution shock advice algorithm would allow theanalysis of the cardiac rhythm during ventilation intervals.
S21
Computing in Cardiology 2012, Kraków, Poland 7

A New Shock Advice Algorithm Designed to ClassifyECG Signals During Cardiopulmonary Resuscitation
Unai Ayala, Unai Irusta, Jesus Ruiz, Digna Gonzalez-Otero, ErikAlonso and Robertas Mazeika
University of the Basque Country (UPV/EHU)Bilbao, Spain
Aims: In a resuscitation scenario, cardiopulmonary resuscitation (CPR) ar-tifacts must be filtered from the ECG before rhythm analysis. The rhythms arethen diagnosed using shock advice algorithms (SAA) designed using artifact-free ECGs. Following this scheme many studies report sensitivities above 90%,however the specificities are always well below the 95% figure recommendedby the American Heart Association (AHA). This study presents a new SAAdesigned specifically to diagnose the ECG during CPR.
Materials: The database used in this study consisted of out-of-hospitalrecords corrupted by CPR artifacts. The duration of the records was 15.5 s.There were 86 shockable and 290 nonshockable records, further divided in91 asystole (AS), 161 pulseless electrical activity (PEA) and 38 pulse-givingrhythms (PR).
Methods: The corrupted ECG was filtered using an LMS algorithm. Then,the ECG was classified using 3 s segments by a SAA consisted of three sub-algorithms. The algorithms are based on a set of time, slope and frequencydomain parameters obtained from the filtered and the corrupted ECG. Thefirst sub-algorithm identifies rhythms with low electrical activity (AS and slowPEA), by combining four parameters in a decision tree algorithm. Then, a sec-ond sub-algorithm identifies conducting rhythms with QRS complexes (PR).This sub-algorithm combines a slope and a time domain parameter in a logis-tic regression classifier. Finally, the last sub-algorithm discriminates shockablerhythms from PEA by using a single parameter.
Results: The sensitivity and specificity for the 3 s segments were 88% and93% respectively. When records were classified using a majority criterion ap-plied to their segment classifications the sensitivity and specificity were 90%and 95% respectively, close to the AHA recommendations.
Conclusions: This is the first approach to rhythm analysis during CPR pre-senting a specificity above 95% without compromising the sensitivity. The useof a high specificity algorithm would avoid unnecessary pauses in chest com-pressions during CPR.
S21
8 Computing in Cardiology 2012, Kraków, Poland

A New Method for Choosing the RegularizationParameter in the Transmembrane Potential BasedInverse Problem of ECG
Danila Potyagaylo, Walther HW Schulze, Olaf Doessel
Institute of Biomedical Engineering, Karlsruhe Institute of TechnologyKarlsruhe, Germany
Introduction: The inverse problem of ECG is aiming at the reconstruc-tion of cardiac sources from the body surface potential maps. The problemis proved to be mathematically ill-posed, i.e. in order to obtain a meaningfulsolution suitable regularization techniques should be applied.
Methods: The most common approach to solve the inverse problem of ECGis Tikhonov regularization with the L-curve method for choosing an optimalregularization parameter. In this work we propose an iterative Gauss-Newtonmethod to minimize Tikhonov’s functional and efficiently stop the iteration.The weighted sum of data misfit and penalty function with second order deriva-tive as cost term is iteratively established for a decreasing sequence of regular-ization parameters. Thus the method can bee seen as Tikhonov regularizationwith a variable parameter. The crucial point for the technique is an optimalchoice of the stopping criterion. From the statistical point of view the regular-ization parameter can be interpreted as the ratio of noise standard deviation indata to prior model standard deviation - smaller parameters lead to a broadersolution range. In our approach we make use of the knowledge about the trans-membrane potential distribution. Assuming values of -85 mV and 25 mV forlower and upper boundaries for potentials, we stop the iteration when the solu-tion achieves the mentioned difference between its smallest and largest values.
Results: For three simulation protocols the implemented algorithm outper-forms Tikhonov regularization based on L-curve for the first time instancesduring an ectopic heart activation sequence, then shows comparable results.
Conclusion: The proposed method for choosing the regularization param-eter in the ECG inverse problem for transmembrane potentials takes into ac-count the knowledge about basic electrophysiology of the solution, making itan attractive approach for further investigation.
S22
Computing in Cardiology 2012, Kraków, Poland 9
Simulation of lung edema in impedance cardiography
Mark Ulbrich, Jens Muhlsteff, Marian Walter, Steffen Leonhardt
RWTH Aachen UniversityAachen, Germany
Aims: This work aimed to identify the reasons for the inaccuracy of impe-dance cardiography (ICG) to assess the stroke volume (SV) for heart failurepatients. Therefore, the effect of lung edema on the impedance cardiogramwas analyzed by simulations using the finite element method (FEM).
Methods: A FEM model of the thorax was created based on MRI dataof a male human providing a high temporal resolution (125 Hz) and a heartfrequency of 70 bpm. It consists of the following static tissues: fat, muscle,bone, lung (end-tidal), abdominal tissue and blood vessels. Heart beat andaortic expansion were simulated by altering the geometry of these tissues overtime. In addition, lung perfusion and erythrocyte orientation were included bychanging the conductivity of lung tissue and blood dynamically. All changesare based on measured physiological data found in literature. Lung edema wassimulated in four steps by substituting lung tissue with body fluid by 14%,42%, 70% and 85%.An electroquasistatic solver has been chosen to simulate electromagnetic fieldsat 100 kHz to calculate the impedance. Using the temporal derivative of theimpedance, ICG waveforms were obtained. The baseline impedance (Z0) andits maximum temporal derivative (
∣∣dZdt
∣∣max
) were analyzed for calculating theSV.
Results: The model itself had excellent correlation (r = 0.94) with measuredsignals, showing its reliability in reflecting reality. We observed a decrease ofZ0 by 6.81% and a decrease of the peak-to-peak impedance by 53.95%. Thesimulated ICG showed no significant change in the left ventricular ejectiontime (LVET) but a decrease of
∣∣dZdt
∣∣max
by 35%.Conclusion: Since LVET remained constant and Z0 as well as
∣∣dZdt
∣∣max
de-creased, a decrease of the computed SV according to the standard algorithmsand models is the consequence. This is a possible explanation for the inaccu-racy of ICG concerning heart failure patients.
S22
10 Computing in Cardiology 2012, Kraków, Poland
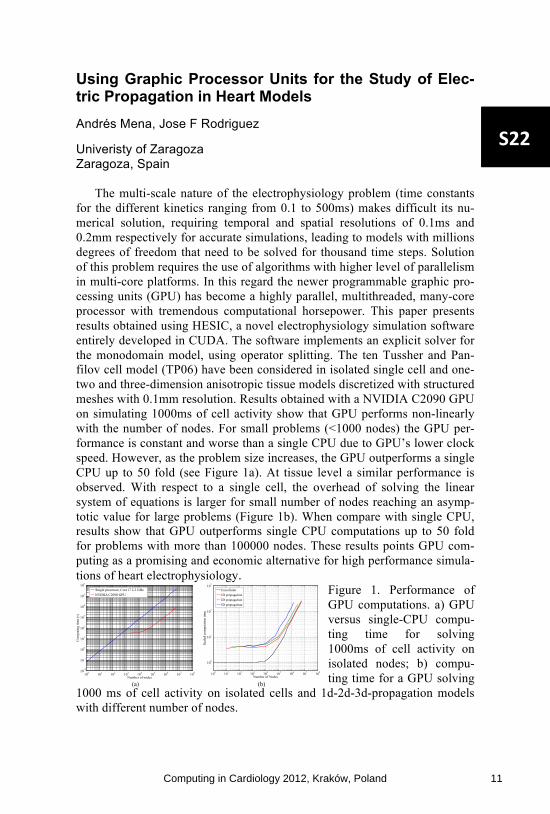
Using Graphic Processor Units for the Study of Elec-tric Propagation in Heart Models Andrés Mena, Jose F Rodriguez
Univeristy of Zaragoza Zaragoza, Spain
The multi-scale nature of the electrophysiology problem (time constants for the different kinetics ranging from 0.1 to 500ms) makes difficult its nu-merical solution, requiring temporal and spatial resolutions of 0.1ms and 0.2mm respectively for accurate simulations, leading to models with millions degrees of freedom that need to be solved for thousand time steps. Solution of this problem requires the use of algorithms with higher level of parallelism in multi-core platforms. In this regard the newer programmable graphic pro-cessing units (GPU) has become a highly parallel, multithreaded, many-core processor with tremendous computational horsepower. This paper presents results obtained using HESIC, a novel electrophysiology simulation software entirely developed in CUDA. The software implements an explicit solver for the monodomain model, using operator splitting. The ten Tussher and Pan-filov cell model (TP06) have been considered in isolated single cell and one-two and three-dimension anisotropic tissue models discretized with structured meshes with 0.1mm resolution. Results obtained with a NVIDIA C2090 GPU on simulating 1000ms of cell activity show that GPU performs non-linearly with the number of nodes. For small problems (<1000 nodes) the GPU per-formance is constant and worse than a single CPU due to GPU’s lower clock speed. However, as the problem size increases, the GPU outperforms a single CPU up to 50 fold (see Figure 1a). At tissue level a similar performance is observed. With respect to a single cell, the overhead of solving the linear system of equations is larger for small number of nodes reaching an asymp-totic value for large problems (Figure 1b). When compare with single CPU, results show that GPU outperforms single CPU computations up to 50 fold for problems with more than 100000 nodes. These results points GPU com-puting as a promising and economic alternative for high performance simula-tions of heart electrophysiology.
Figure 1. Performance of GPU computations. a) GPU versus single-CPU compu-ting time for solving 1000ms of cell activity on isolated nodes; b) compu-ting time for a GPU solving
1000 ms of cell activity on isolated cells and 1d-2d-3d-propagation models with different number of nodes.
100 101 102 103 104 105 106 107 108102
101
100
101
102
103
104
105
106
Number of nodes
Com
putin
g tim
e (s
)
Single processor, Core i7 2.2 GHzNVIDIA C2090 GPU
(a)
100 101 102 103 104 105 106 107 108
100
101
102
103
Number of Nodes
Scal
edco
mpu
tatio
ntim
e
Unicellular1D propagation2D propagation3D propagation
(b)
S22
Computing in Cardiology 2012, Kraków, Poland 11
Does Telecare Reduce Medical Expenditures of Heart Failure Patients? Yuji Akematsu, Norikazu Minetaki, Masatsugu Tsuji* Osaka University, Osaka, Japan
Aims: This paper examines the effect of telecare on medical expenditures of heart failure patients using survey data from Nishi-aizu Town, Fukushima Prefecture, Japan. In town’s telecare system, users at home transmit vital data such as ECG, blood pressure, and pulse to the town’s health center via the peripheral device, and nurses monitor the data.
Method: Medical expenditures obtained from the National Health Insurance scheme were used a dependent variable. Individual characteristics of the two groups, including age, sex, income, and health conditions, were obtained from replies to the questionnaire and receipts of the National Health Insurance and used for independent variables. Heart failure patients were identified by their record of related diseases having treated. We use system GMM, a rigorous estimation method aimed to solve the causality problem. The basic model fro estimation is denoted as follows:
TptXyy tii
n
lltii
pt
tjjijti ,...,1,,
1,,
1,, +=+++= ∑∑
=
−
−=
εαβγ
yi, t is the dependent variable (medical expenditure). Xi, t is the explanatory variable including age, sex, income, and dummy
variables such as telecare use, year and frequency of telecare use. αi is the patient’s specific fixed effect. εi, t is the error term.
Results: The estimated coefficient of heart failure patients with telecare use is negatively significant (p<0.005), while that of heart failure patients is positively significant (p<0.005).
Estimation result: system GMM Variable Coeff. S.E. z p>|z|
Heart failure patient with telecare use -192.22 6.79 -2.83 0.005 *** Heart failure patient 230.81 8.19 2.82 0.005 ***
Number of observations 1625 Number of groups 390
Wald χ square 871.94 Prob > χ square 0
Arellano-Bond for AR2: Prob. > z 0.182
Conclusion: This analysis demonstrates that telecare use, duration of, and frequency of telecare use reduce the medical expenditures of heart failure patients.
S22
12 Computing in Cardiology 2012, Kraków, Poland

Adaptive Filtering in ECG Denoising: A Comparative Study
Iñaki Romero, Di Geng, Torfinn Berset
Imec-NL, Eindhoven, the Netherlands
The performance of several adaptive filter (AdF) algorithm implementa-
tions was investigated in the context of cleaning ambulatory noisy ECGs.
Together with a noisy ECG signal, both body movement measured with acce-
lerometers and skin-electrode impedance (SEI) were considered as input sig-
nals to the AdF.
ECG with artificial motion
artifacts were generated by
combining 10 hours of clean 3-
channel ECG with 3-channel
noise signals recorded with
SNR values ranging from 10 to
-20 dB. In addition to biopoten-
tial signals, SEI and body
movement measured with acce-
lerometers were recorded. Sev-
eral implementations and com-
binations of AdFs, and two ref-
erence signals (accelerometers and SEI) were investigated. Performance was
measured by evaluating the output (sensitivity (Se) and positive predictivity
(+P).) of a beat detection (BD) algorithm.
Results are shown in the table. With unfiltered signals, BD gave a Se and
+P=100% for SNR down to -13 and -6 dB respectively. Using AdF algorithm
improved the performances of a BD algorithm as compared to non-filtering.
SEI used as reference signal outperformed accelerometers. A variant of LMS,
LMS sign-error, gave the best
performance from all imple-
mentations considered. Con-
strained LMS sign-error gave
similar performance. Other ap-
proaches such as non-linear
AdF, adaptive convex combina-
tion, a cascade set-up or stan-
dard LMS AdF gave a lower
performance in our dataset.
Applying AdF on noisy ECGs, improves the performance of a beat detec-
tion algorithm. However, distortion observed in the filtered signal is high and
therefore, these results cannot be extended to other features within the ECG.
Noisy ECG (input) with SNR= -10dB, together with
the output of 3different AdF implementations.
Minimum SNR values that yield Se=100% and +P=100%
Algorithm Se/+P=100%
Non-filtering -13 / -6
LMS (accelerometers) -13 / -6
LMS (impedance) -16 / -6
RLS -13 / -6
LMS sign error -16 / -11
LMS-constrained -16 / -11
LMS sign error convex -16 / -6
S23
Computing in Cardiology 2012, Kraków, Poland 13

Joint Denoising and Narrowband Artifacts Rejectionfor ECG Signals
Antonio Fasano, Valeria Villani
Universita Campus Bio-Medico di RomaRome, Italy
ECG signals are corrupted by several kinds of noise and artifacts. In par-ticular, narrowband artifacts include power-line interference and harmonic ar-tifacts. Customarily, noise reduction and artifacts rejection are tackled as twodistinct problems. In this paper, we propose a joint approach to denoising andnarrowband artifacts rejection that exploits the local structure of a noisy ECG.
The proposed approach is based on the observation that noise and artifactsintroduce additional “variability” into the measured ECG. The amount of ad-ditional “variability” is time-varying, since signal morphology changes overtime, and noise and artifacts can be persistent or transient. As a consequence,different portions of a noisy ECG exhibit different local SNRs.
Joint denoising and narrowband artifacts rejection is performed solving aconstrained convex optimization problem, where suitably defined measures of“variability” are exploited. The proposed approach jointly achieves denoisingand narrowband artifacts rejection combining two actions: locally smoothingdifferent segments of the ECG by an amount inversely related to the local SNR,and globally reducing the energy content of narrowband artifacts based on theirspectral localization.
0 0.5 1 1.5 2 2.5 3
−1
0
1
2
Time [s]
Am
plit
ud
e [
mV
]
0 0.5 1 1.5 2 2.5 3−0.5
0
0.5
1
Time [s]
Am
plit
ud
e [
mV
]
Top: Reference ECG (blue) corrupted (red) by white noiseplus harmonic artifacts at 60, 80, and 120 Hz. Bottom:smoothed ECG (red) superimposed on the reference (blue).
Performances of the pro-posed algorithm were investi-gated both on real and syntheticECG records. Measuring theperformance in terms of signal-to-noise-plus-interference ratio(SNIR), the proposed approachwas able to achieve, without pa-rameters optimization, an im-provement of about 27 dB onhighly corrupted ECG recordswith initial SNIR as low as −5 dB, as depicted in the figure.
The proposed algorithm behaves favorably also in terms of computationalcomplexity, which ranges from O(n) to O(n log n), in the size n of the recordto process. This makes it suitable for real-time applications. Eventually, theproposed algorithm can be applied to the broader class of bioelectrical signals.
S23
14 Computing in Cardiology 2012, Kraków, Poland
Interpretation of Normal and Pathological ECG beat us-ing Multiresolution Wavelet Analysis
Shubhada Ardhapurkar Vaidya*
International Center of Excellence in Engineering and Management Aurangabad, India
The discrete wavelet transform has great capability to analyse the
temporal and spectral properties of non stationary signals like ECG. The varying morphologies of abnormal cardiac patterns demand reliable and highly accurate ECG analysis In this paper, we developed and evaluated a robust algorithm using multiresolution analysis based on the discrete wavelet transform (DWT) for twelve-lead electrocardiogram (ECG) temporal feature extraction. ECG signal is denoised by dividing it into small excerpts of 5 seconds duration The study, with support of physiological knowledge, attempted to interpret variation in different patterns of ECG beats. Selection of appropriate group of wavelet coefficients alongwith decision rules is used to determine P, Q, R, S and T wave locations, amplitudes, onsets and offsets. We evaluated the algorithm on various manually annotated databases from physiobank with different sampling frequency. For R detection threshold is derived by experimentation over large number of ECG records. R peak detection worked successfully on normal QRS as well as on different morphologies. Lower threshold value causes detection of false positives and higher threshold value increases number of false negatives. The QRS detector obtained a sensitivity of 99.5% and a positive predictivity of 98.9% over the first lead of the MIT-BIH Arrhythmia Database. The various configurations detected are • QRS, QS, rSr’, RsR’, RS, rS, rSR’,QR, R. • absence of P wave, positive, negative, biphasic P wave and P wave fused with T wave • positive, negative, biphasic T wave The procedure was validated on various morphologies for pathological conditions like Left Bundle Branch Block (LBBB), Right Bundle Branch Block (RBBB), Premature Ventricular Contraction , Atrial premature beats, Supraventricular beats , first degree AV block, Fusion of normal beats with paced beats, Myo-cardial Infarction (MI), Hypertrophy . At the cost of com-putational efforts, multiresolution analysis catch intrabeat variability better
.
S23
Computing in Cardiology 2012, Kraków, Poland 15

Calculating Stable Reference Potentials for Measuring ECG Wave Amplitudes Across a Range of Heart Rates
Wenfeng Duan*, Dingchang Zheng, Philip Langley and Alan Murray
Newcastle University Newcastle upon Tyne, United Kingdom
With the overall aim of identifying methods to calculate stable reference
potentials for ECG wave amplitude measurements across a range of heart rates this study had two objectives: firstly, to quantify the stability of reference potentials measured from the above mentioned features, and secondly, to assess different methods of calculating the potentials to reduce measurement variability. 12-lead ECGs were recorded from 10 healthy subjects before and immediately following exercise. Amplitudes of the UP segment, Q wave, end of T wave (Tend) and zero voltage level, all relative to PQ level were measured from V3. The whole range of heart rate following exercise was divided into 7 recovery bands (>= 120, 110 - 120, 100 - 110, 90 - 100, 80 - 90, 70 - 80 b/min). Another band was used for data examined at resting (baseline band). The performances of beat waveform averaging (AvgBeat) and mathematical averaging of separate beat measurements (AvgVal) on reducing the influence of noise and measurement errors were compared. Due to merging of P and U waves at high heart rates, the UP segment amplitude was measureable in only approximately 71% within the band with highest heart rate. Both the UP segment amplitude and Tend amplitude tended to be overestimated at high heart rates. The mean value of UP segment level decreased from 0.112 to 0.006 mV with respect to the baseline during recovery. The standard deviations (SDs) were 0.02, 0.005, 0.021 and 0.016 mV for UP segment, Q wave, end of T wave (Tend) and zero voltage levels over the range of heart rates when using AvgVal. The SDs of amplitudes measured by AvgBeat and AvgVal methods were significantly lower than those measured from single beats (p < 0.05) for almost all features. Generally, these two methods achieved comparable performance on reducing measurement variability
.
S23
16 Computing in Cardiology 2012, Kraków, Poland
Asynchronous ECG Time Sampling: Saving Bits with Golomb-Rice Encoding
Thanks Marisa*, Thomas Niederhauser, Andreas Haeberlin, Josef Goette, Marcel Jacomet and Rolf Vogel
Bern University of Applied Sciences Biel/Bienne, Switzerland
Introduction Continuous long-term bioelectrical signal acquisition
devices have high energy and memory requirements, to capture and store data for a long period. To reduce both, memory and energy requirements and in turn the device volume, we present as a solution an adaptive time-encoder with a built-in differential Golomb-Rice encoder that captures and en-codes the times when pre-set signal changes occur, as opposed to either constant Nyquist-rate or asynchronous and adaptive signal amplitude sampling[1].
Methods Data sequences following a geometric distribution will be optimally encoded by Golomb-Rice encoding[2]. Thus Golomb-Rice coding is highly suitable for data where the occurrence of small values is significantly more likely than large values. The asynchronous time encoder enforces this requirement by ensuring that about 75% of the data is made up of small time change data generated during the rapid signal change portions (PQRS sections) of the esophageal and surface ECG signals since the encoder captures timer value when the signal makes a predefined change and restarts the timer guaranteeing that small timer values are significantly more likely than large values.
Results We developed a model of our time encoder incorporating a Golomb-Rice encoder and carried out simulations on esophageal ECG signals (INSEL EECG) collected from our clinical trials and surface ECG signals from the MITBH ar-rhythmia database (records 100 to 124)[3]. We also developed a custom reconstruction and decoding algorithms for our irregularly acquired time encoded data. Table 1 shows the results (in pdf): The percent of root-mean-square-difference (PRD) degradation is due to time approximation of the signals used in the simulation and not from the Golomb-Rice encoding which is lossless[2].
Conclusion The ADC achieves an overall compression of about 6 times on esophageal and surface ECGs compared to the classical Nyquist ADC architectures and needs no intensive computations for this compressed data acquisition
.
S24
Computing in Cardiology 2012, Kraków, Poland 17
A Real-Time Algorithm for Tracking of Foetal ECG Sources Obtained by Block-on-Line BSS Techniques
Danilo Pani, Alessia Dessì*, Barbara Cabras and Luigi Raffo
University of Cagliari Cagliari, Italy
Block-on-line Blind Source Separation (BSS) techniques allow to extract
the foetal electrocardiogram (FECG) from non-invasive multichannel recordings, potentially in real-time. However the permutation ambiguity in the estimated sources possibly scrambles them block-wise. An automatic tracking algorithm is then required to identify the FECG sources, allowing both to follow them on the screen and to perform on-line the Body Potential Surface Map related to those sources in order to improve the electrodes placement and consequently the SNR. In this paper, an automatic tracking algorithm has been developed composed of an FECG sources identification module and a morphological analyser. It works on 256xN frames of samples at 250Hz. The algorithm creates Feature Signals (FS) for the N estimated sources by means of a set of filters, expressly designed for the involved signals. The noise sources are identified by means of a turning point count on the FS first derivative. A single linkage hierarchical clustering is then applied on the remaining signals, adopting as metric a distance based on the Pearson’s correlation coefficient, in order to identify the clusters of FECG and maternal ECG signals. The clustering output is refined comparing the R-peaks position, and the RR distance is used to identify the FECG signals because of their highest rate. The morphological analyser, based on an unsupervised template matching on the FECG, checks the QRS balance allowing its correction in case of permutation, also providing an incrementally refined average FECG beat on which the characteristic waves can be more easily detected. The algorithm was successfully tested on both synthetic and real signals estimated using different BSS techniques. Its real-time capability has been assessed onto the OMAP L137 embedded processor, with the OL-JADE algorithm. It represents a valuable support tool in this specific application scenario for real-time implementations
.
S24
18 Computing in Cardiology 2012, Kraków, Poland

Quantification of Spatial Repolarization Heterogeneity: Testing the Robustness of a New Technique
Roberto Sassi* and Luca T Mainardi
Università degli Studi di Milano Crema, Italy
Spatial heterogeneity of ventricular repolarization is a key quantity for
the development of arrhythmias. We proposed a simple stochastic model of ventricular repolarization (IEEE TBME, 2011), which takes into account both repolarization heterogeneity across the myocardium and random beat-to-beat variations in cells’ activity. Using this model, we showed that temporal heterogeneity of repolarization times can be estimated by computing the "V-index", a metric derived from multi-leads ECG recordings. In this work, we investigated two properties of the V-index: i) the dependency on the lead system (Frank's orthogonal vs. 12 standard leads); ii) the influence of errors in the location of the T-end position. The first investigation was performed by simulations, using a forward ECG model (ECGSIM) re-implemented in MATLAB. In the lead system of interest, the V-index was computed varying the standard deviation of repolarization heterogeneity, s_theta, from 20 to 70 ms and the standard deviation of beat-to-beat variations from 0.5 to 5 ms. Broad-band noise (30 uV peak-to-peak) was added on leads before computing the V-index on 128 beats. The results showed that the average bias in the estimate of repolarization heterogeneity ranged from -23.0±3.6% (s_theta=20.6 ms) to -29.4±3.6% (s_theta=70.9 ms) for the Frank’s system and from -7.1±5.2% to -18.0±3.7% for the standard system. As expected, when using only three leads the quality of the estimates was reduced. However they were still consistent. Secondarily, 68 ECGs from the E-OTH-12-0068-010 THEW database were analyzed. After automatic detection of fiducial points, the JT interval was extracted from each beat and the V-index computed. To simulate mislocation, the T-end point was randomly moved (±20 ms) around its correct position and the V-index recomputed. The average differences in the V-index estimates across the population were always smaller than 1%. This is a desirable property, given the discrepancies across methods in locating T-end positions.
S24
Computing in Cardiology 2012, Kraków, Poland 19

Analysis of ECG Bandwidth Gap as a Possible Carrier for Supplementary Digital Data
Piotr Augustyniak
AGH University of Science and Technology Krakow, Poland
The bandwidth gap results from overesti-mation of the constant sampling frequency which is greater than the local bandwidth of cardiac components in large parts of the ECG record. This gap was previously explored for possible perceptual compression and denoising of the ECG, but it also has a con-siderable storage capacity. This data carrier may be used for embedding of supplementary digital data into the ECG record without changing its diagnostability.
The proposed algorithm starts with conventional beat detection and wave delineation procedures. Next the time-frequency representation is determined and a standard ECG bandwidth function is used to separate the area occupied by cardiac components. The remaining parts, roughly extending from QRS-end to QRS-ons in the 1-st scale and from T-end to P-ons in the 2-nd scale, contain noise and artifacts of given statistical properties. Analysis of these properties opens the opportunity to transform the supplementary digital data stream into variable-size sectors of values with similar statistical properties.
The proposed method was tested with use of files from CSE Multilead Dataset 3 recommended by IEC60601-2-51 for the repeata-bility of wavelength calculation in dependence of supplementary data density. For densities varying from 1 (i.e. c.a. 250bps @ 500Hz, 16 bit)
to 3 bits per time-frequency atom, the inaccuracy of measurements doesn't overpass the required limits of 10(30)ms. In case of larger densities, the sup-plementary data start changing the noise statistics and consequently (1) are more pronounced in statistical parameters and (2) systematically degrade the cardiac components.
The usability of the method is twofold: (1) for transmission (or storage) of multimodal data through an ECG channel and (2) for hiding sensitive data into the standard record. In the latter case, the record may be attributed (up to 78 characters per heartbeat) or not, depending only on reader's privileges.
Scheme of data embedding in ECG bandwidth gap.
ECG distortions from coded data
coding bits ∆ QRS length PRD
1 (250bps) 3 (750bps) 5 (1250bps)
0.61 ms 1.34 ms 5.33 ms
0.07 0.13 0.51
S31
20 Computing in Cardiology 2012, Kraków, Poland

Empowered Patients with Cardiac Implantable Electronic Devices across Organizational & National borders
Stelios Sfakianakis, Yildiray Kabak, Elif Eryilmaz, Yannis Petrakis, Gokce Banu Laleci Erturkmen, Catherine Chronaki* and Asuman Dogac
FORTH, Heraklion, Greece
Introduction: Recent Cardiac Implantable Electronic Device models are equipped with telemonitoring capabilities and clinical trials have confirmed the positive impact of telemonitoring on patient safety and quality care. Adaptive care plans in iCARDEA, provide decision support and save time by analyzing health-data from Home, Work, Leisure, etc., suggesting options for handling telemonitoring alerts.
Aim: Extend the iCARDEA Electronic Health Record Interoperability Framework (EHR-IF) beyond the hospital to enable use of medical records from primary care and patient summaries from the epSOS large scale pilot, to analyze technical and organizational interoperability challenges.
Methods: EHR-IF provides EHR adaptors to address identification, terminology and information exchange. Specialization of this adaptor for a primary care EHR system makes the system iCARDEA-compliant and facilitates registration to receive medication and examination results from care institutions managing patient data. Moreover, it provides updates following primary care patient encounters. Identification, terminology and clinical data exchange are addressed using integration profiles and shared iCARDEA components namely Healthcare Enterprise (IHE) Patient Identifier cross reference (PIX), HL7 Common Terminology Services (CTS), and IHE Care Management (CM). An epSOS adaptor was created and used to retrieve summary care information produced abroad using the national identifier of the patient in the target country. In this way, the iCARDEA adaptive care planner has readily available the information needed to make effective decisions.
Results: Implementation of the Primary Care EHR and epSOS adaptors has been completed and thoroughly tested and reviewed with physicians. In this way, patient management is based on comprehensive clinical data enabling patient care coordination in an informed way.
Discussion and Conclusions: Escalating care costs and novel care pathways challenge the traditional way of healthcare delivery calling for collaboration and sharing of information. Technical and organizational interoperability are keys in cultivating synergy and trust to support intuitive, simple, but effective decision-support systems.
S31
Computing in Cardiology 2012, Kraków, Poland 21

A Security Extension for the Standard SCP-ECG Based on Metadata
Óscar Jesús Rubio Martín*, Álvaro Alesanco Iglesias and José García Moros
Universidad de Zaragoza Zaragoza, Spain
Aims: This study aims at extending the standard SCP-ECG with security
to fulfill the requirements of current legal regulations (e.g. the Health Insurance Portability and Accountability Act, the Digital Signature laws). The protection policy must be consistent with those already implemented by major medical standards (e.g. DICOM and HL7), be perfectly adapted to the structure, contents and scope of the standard and maintain availability of the information at good levels, thus ensuring low file overhead and short protection-access delays.
Methods: The main measures implemented by major medical standards supporting ECG were investigated. The implementation of Role-Based Access Control (RBAC) policies by means of attribute-level encryption, the embedding of digital signatures and the use of secure communication channels were considered as essential, therefore our protection policy implements all of them. The contents of the SCP-ECG are separated into data about the patient (A, Section 1), ECG signal (B, Sections 2-6) and additional information (C, Sections 7-11). The privileges to access these contents are scaled by means of role-based profiles (e.g. teaching, research, diagnose) supported by cryptographic elements (ciphering, digital certificates and digital signatures). The syntax to retrieve the original contents is arranged as metadata in a new section tailored to the SCP-ECG, which extends the protocol and protects the remaining sections. The operations for protection of SCP-ECG files and access to their protected counterparts are carried out by a GUI that we provide.
Evaluation: A variety of SCP-ECG files from the Open ECG portal were used to evaluate this system. The overhead of protected files typically ranges from 0.7 to 2 KB, which corresponds to 1-10% of the typical SCP-ECG file size. The protection-access delays are 0.5-1 s each. This solution is compatible with any version of the protocol and can be easily integrated into e-Health platforms by using the GUI
.
S31
22 Computing in Cardiology 2012, Kraków, Poland

A Dual PSoC based Reconfigurable Wearable Computing Framework for ECG Monitoring
Swati Keskar*, Rahul Banerjee and Rajkiran Reddy
Birla Institute of Technology and Science Pilani, India
Cardiovascular diseases are one of the most life threatening diseases in
all over the world. The early detection of symptoms and warning may prevent the person from further high risk of heart diseases. We propose a reconfigurable framework using Dual PSoC for a wearable heart monitoring computing system Wearable Heart-Guard. Implementation: Considering the constraints of wearable computers, we chose to use vectorcardiographic leads to minimize the number of electrodes. It also helped to choose proper parameters to cover entire activity ie polarization/depolarization of atria and ventricles, instead of relying only on heart rate variability. Hidden Markov Model (HMM) combined with timed automata is used to model the ECG signal and to extract the features. Time-recurrent decision trees are used for classification of the input ECG signal. In all eight class models have been defined, Out of which seven are representing various heart diseases. Physikalisch-Technische Bundesanstalt Database (PTBDB) available on physionet is used for modeling. A database of HMM models and decision trees is stored as lookup table in PSoC memory. A belt based data acquisition unit is used which has electrodes wired to processing unit. PSoC (Programmable System-on-Chip) with wireless module is used for signal processing and further analysis. As the name suggests this is a programmable unit, which carries out all the functions such as analog to digital conversion, filtering and removal of baseline wandering on chip. Two PSoCs are used so that data acquition and data processing takes place simultaneously. If any abnormality is detected, three different intensity level alerts are generated. Conclusion: Analog circuitry is considerably reduced here. If any new component is to be added or there is any design change, simply reprogramming is to be done. Calibration is easy to achieve, which is very important since no two persons have exactly same physiological conditions
.
S31
Computing in Cardiology 2012, Kraków, Poland 23

Ontology for Heart Rate Turbulence Domain Applying the Conceptual Model of SNOMED-CT
Cristina Soguero Ruiz*, Luis Lechuga, Inmaculada Mora Jiménez, Javier Ramos López, Óscar Barquero Pérez, Arcadi García Alberola and José Luis Rojo Álvarez
Universidad Rey Juan Carlos Fuenlabrada, Spain
Although cardiovascular risk stratification (CVRS) based on ECG-
derived indices has been deeply studied, many current findings are not being widely used in the clinical practice. We hypothesized that, in addition to the necessary scientific evidence, also a clear and standardized connection among the current knowledge in the scientific literature, its availability for the cardiologist, and the actual patient data, is necessary for the practical implementation and refinement of these indices. For this purpose, we implemented a standardized framework for CVRS based on ECG-derived indices, focused on the actual knowledge of Heart Rate Turbulence (HRT) indices (with concise guidelines and clear procedures to parameter calculations). An ontology for HRT was built according to a set of logical and relational rules defining clinical, anatomical and electrophysiological features, yielding the class hierarchy model and its corresponding inferred model (Protegè-OWL, 4.1) for completeness. Different from other biomedical ontologies, ours was based on the international standard SNOMED-CT. The model of SNOMED-CT not only considers terminology, but also properties and relationships, what guaranteed the standardization and compatibility with current and emerging Electronic Health Records. Our HRT ontology consisted of 310 concepts (289 were taken from SNOMED-CT, and 19 were a local extension to model the main concepts of the HRT domain). As an application example, a database of 27 instances of patients with HRT from 24-Holter monitoring recordings was considered, with basic HRT indices and also conventional and emergent signal processing calculations. A consistence of 86% and 77% was achieved between averaged procedure for HRT index calculations given in the guidelines and two signal filtering procedures. For the first time, an ontology for the HRT domain with the international system SNOMED-CT has been built. The conceptual model of SNOMED-CT yields high standardization and interoperability with current cardiovascular health systems
.
S31
24 Computing in Cardiology 2012, Kraków, Poland
Edema Detection for Heart Failure Patients in Home Monitoring Scenarios
Dieter Hayn*, Stefan Raschhofer, Markus Falgenhauer, Robert Modre-Osprian, Friedrich Fruhwald and Günter Schreier
AIT Austrian Institute of Technology Graz, Austria
Introduction: Heart failure induces 27,000 inpatient hospital stays per
year in Austria and consumes 2% of its health budget. Re-hospitalization rates within 6 months after discharge are about 30% and earlier studies showed that even telemonitoring can only avoid up to 50% of these re-hospitalizations. Since leg-edema is a typical symptom especially for right-sided heart failure, it was our aim to further reduce this number, using new methods for edema detection
Methods: A well approved (>120 patients by April 2012) telemonitoring system consisting of blood pressure meter and body weight scales was extended by a 3D camera in order to geometrically detect and quantify leg-edema. 3D images were taken and several geometric parameters, such as instep height and leg curvature, were calculated. We present the results of the first evaluation step – a feasibility test, comparing relative intra-subject variation V_rel (as a measure of reproducibility), calculated as the standard deviation divided by the mean value of each parameter for a single subject. Results: A total of 87 measurements at different daytimes within four consecutive days were performed for five healthy subjects. Instep height and leg curvature right above the inner ankle were reliable parameters for the survey of legs. Relative intra-subject variation V_rel was 2.89±0.90% for instep height and 10.22±1.41% for leg curvature. Conclusion: Our results indicate that by 3D imaging, the geometry of a person’s foot can be measured with errors that are far lower than changes expected in case of. Future steps will be to analyze whether edema can be detected by our method. For this purpose, edema reduction during treatment in the hospital right after cardiac decompensation will be analyzed. Finally, our method should be evaluated in a real-life home monitoring scenario, analyzing its capability to detect cardiac compensation in an early stage
.
S31
Computing in Cardiology 2012, Kraków, Poland 25

ECG Biometric in Different Physiological Conditions Using Robust Normalized QRS Complex
Khairul Azami Sidek, Ibrahim Khalil and Magdalena Smolen*
RMIT University Melbourne, Australia
This paper demonstrates subject recognition using electrocardiogram
(ECG) signal in different physiological conditions. A total of 30 subjects used in this study were obtained from a non invasive measurement called the Revitus ECG module. Each subject performed six physiological activities which are walking, going upstairs, going downstairs, natural gait, lying with position changed and resting while watching TV. Unique features were extracted in these different physiological conditions from the same subject using normalized QRS complex technique. One physiological activity acts as the enrolment template while the remaining five activities represent the recognition data. Cross correlation was used to measure the similarity between activities. Later, Multilayer Perceptron classifier was applied to evaluate the distinctiveness between subjects. Results of the experiment shows that QRS complexes in different activities from the same subject were strongly correlated to each other by obtaining correlation values of more than 0.9. A classification accuracy of 96.1% when using the proposed normalized method as compared to 93.4% without using the normalized QRS complex proves to distinguish one subject as compared to the other. These results also suggest that the QRS complex alone can act as a biometric modality in different physiological conditions of the same subject
.
S32
26 Computing in Cardiology 2012, Kraków, Poland

Can functional cardiac age be predicted from ECG in a normal healthy population?
Vito Starc*, Manja Leban, Petra Šinigoj, Miloš Vrhovec, Eva Fernlund,Petru Liuba, Todd T Schlegel
University of Ljubljana, Faculty of Medicine, Ljubljana, Slovenia
It is known that changes in parameters such as HRV and QTc interval re-flect the effects of age and gender on the resting ECG. We hypothesized that in a normal healthy population changes in several ECG parameters together might reliably characterize the functional age of the heart.
An initial study population of 313 apparently healthy subjects was ult i-mately reduced to 166 subjects (84 men, 82 women, in the range from 10 to 75 years of age) after exclusion criteria that included positive medical his-tory, overt conventional ECG abnormality, smoking, regular rigorous athletic activity and/or extreme BMI. In all subjects, ECG recordings (resting 5-minute 12-lead high frequency ECG) were evaluated via custom software programs to calculate up to 85 different conventional and advanced ECG parameters. In univariate analysis, 5 parameters exhibited the highest linear correlations with age, and from these the prediction of functional age was evaluated by multiple linear regression analysis.
Ignoring small differences be-tween males and females, functional cardiac age was predicted (R2 of 0.69, P < 0.001) from a linear com-bination of the best 5 univariate pre-dictors: the repolarization parameter QTxc, QRS elevation in the frontal plane, mean high frequency QRS amplitude (for all p<0.001), the P-wave width (p=0.13), and rmsSD of RRV (p=0.33). Here, QTxc repre-sents the cross-correlation between the measured QT signal and the cal-culated QT signal that depends on the heart rate, QRST angle, and QRS amplitude using a dynamic model for QT changes.
In apparently healthy subjects, functional cardiac age can be estimated by multiple linear regression analysis of mostly advanced ECG parameters. Assome parameters in the regression formula also change with disease in the same direction as with increased age, increased functional age of the heart may reflect subtle age-related pathologies in cardiac electrical function.
Chronological Age [log(yr)]
1.0 1.2 1.4 1.6 1.8 2.0
Functional C
ard
iac A
ge [
log(y
r)]
1.0
1.2
1.4
1.6
1.8
2.0
Male
Female
Functional cardiac, as estimated by multiple linear regresssion analysis of the chronological age
S32
Computing in Cardiology 2012, Kraków, Poland 27

Validation of a Novel Method for Noninvasive Blood Potassium Quantification from ECG
Cristiana Corsi*, Johan De Bie, Carlo Napolitano, Silvia Priori, David Mortara and Stefano Severi
University of Bologna Bologna, Italy
Background: Blood potassium concentration [K+] has a strong influence
on ECG signal and particularly on T-wave morphology. We previously developed a method to quantify [K+] from ECG analysis in real-time on data from dialysis patients, in which [K+] varies significantly during the session. The aims of the study were to validate this method quantifying [K+] on hemodialysis (HD) and on congenital long-QT type 2 (LQT2) patients.
Methods: An ECG-based potassium estimator (KECG) based on the ratio between the T-wave descending slope and the T-wave amplitude (TS/A) was previously defined analyzing data from 39 HD sessions (13 patients, 77±12years, 3F, 3 sessions per patient for three weeks). This estimator was then tested on 69 HD sessions (23 patients, 67±13years, 14F, 3 sessions per patient for three weeks) and on 12 LQT2 patients (25±15years, 7F). Holter ECG recordings (H12+, Mortara Instrument Inc.) were acquired on these patients. Electrolytes values were obtained by six blood samples (KLAB) (RapidLab 855, Bayer) for each dialysis session and immediately before the ECG recordings for LQT2 patients. The estimates based on T-wave analysis were then compared with the reference potassium measurements by correlation and Bland-Altman analyses. Results: The ECG-based potassium estimator defined as KECG=0.17*TS/A^2-0.48*TS/A+patient bias was compared with KLAB. The agreement was good (p=0.79, absolute error: 0.43±0.28mM) for all the sessions. Bland-Altman analysis showed that the mean overall systematic error was very small (0.05mM) with standard deviation of 0.5mM. As expected in LQT2 patients, in which the potassium current Ikr is reduced in a way similar to that observed in hypokalemic conditions, our method underestimated [K+] (error: 1.15±0.68mM).
Conclusions: This method could be effectively applied to monitor patients at risk for hyper- and hypokalemia which are indicators for worsening heart and among the main risk factors for cardiac arrhythmias
.
S32
28 Computing in Cardiology 2012, Kraków, Poland
Estimation of the Apnea-/Hypopnea Index from Epoch-based Classification of the ECG using Modulations of QRS Amplitude and Respiratory Myogram Interference
Christoph Maier*, Heinrich Wenz and Hartmut Dickhaus
Heilbronn University Heilbronn, Germany
Background: Most approaches for ECG-based detection of sleep apnea
classify fixed-duration epochs for the presence of respiratory events. Only few provide an estimate of the apnea-/hypopnea index (AHI), the clinical standard. These often perform a regression of the number of apnea-positive epochs on the true AHI. This is physiologically unsatisfactory since a specific record’s AHI is strongly affected by the properties of the remaining records.
Methods: Ongoing apnea can be detected in the ECG from quasi-periodic oscillations in QRS-amplitude (QRSA) and respiratory myogram interference. We quantified the joint occurrence of such modulations using a single, sophisticated correlation feature. In a heterogeneous sample of 140 overnight recordings (simultaneous Holter-ECGs and polysomnograms) in 121 patients, this permits robust detection of apnea in 1min-epochs using ROC-analysis (sensitivity 85.5%, specificity 86%). Two different ROC-thresholds were considered, the first balancing sensitivity and specificity (bal), the second maximizing accuracy (acc). For AHI estimation, we determined the local period of modulations in the QRSA-series from its zero crossings. Epochs classified as apnea-positive were weighted with a factor 60s/period as an estimate of the number of respiratory events in that epoch. The sum of these weights, normalized for the duration of the record, provides a physiologically reasonable AHI estimate. A threshold of AHI ≥ 15 was used for screening. We implemented a ternary strategy where a rejection-class (‘borderline’) collected all records with differing decisions for the two thresholds bal and acc.
Results: 16% of the recordings were classified as ‘borderline’. The sensitivity for the remaining 84% (117 recordings) was 100% (specificity 91%, Kappa coefficient 0.91).
Conclusion: It is possible to provide a physiologically meaningful estimate of the AHI from epoch-based classifications of the ECG without explicit delineation of single respiratory events. Screening for AHI ≥ 15 achieves high sensitivity and accuracy on a large and representative sample
.
S32
Computing in Cardiology 2012, Kraków, Poland 29

Cardiorespiratory Analysis on Children Suffering from Absence and Complex Partial Seizures
Carolina Varon*, Katrien Jansen, Lieven Lagae and Sabine Van Huffel
Katholieke Universiteit Leuven Leuven-Heverlee, Belgium
Aims: Epilepsy has profound effects on autonomic control functions. For
example, autonomic dysfunction contributes to the morbidity and mortality in epilepsy. We investigated the effect of partial seizures originating from the temporal lobe and generalized absence seizures on heart rate and respiration. Acute respiratory compromise has already been documented during seizures. However, little is known about the long-term effects on respiratory control.
Methods: Single-lead ECGs from 30 subjects, aged 4 to 16, were recorded in the epilepsy clinic of UZ Leuven. Of those subjects, 10 are suffering from absence seizures, 10 from complex partial seizures and 10 make up the control group. First, the ECGs were segmented into minutes. Next, the RR interval series was computed for each segment, together with the ECG derived respiration (EDR), which was obtained by means of kernel principal component analysis. Furthermore, time and frequency parameters such as the mean, standard deviation and powers in the low (0.04-0.15Hz) and high (0.15-0.4Hz) frequency bands were computed from each RR interval series and EDR segments separately. In addition, the coherences between the RR interval series and the EDR signals were derived. Finally, a group comparison was performed using Kruskal-Wallis analysis.
Results: A trend in the mean RR intervals was observed, where patients have a lower value than the controls. We also found that several minutes in the absence group present a higher sympathovagal balance, which is a new finding for this type of patients. Furthermore the coherence between the RR interval time series and the EDR signals at high frequencies was significantly lower in the absence group (p=0.03).
Conclusions: These results indicate that in absence group there is more sympathetic modulation during certain events, which can be related to apneic episodes during seizures, or a long-term effect of epilepsy on the respiratory control
.
S32
30 Computing in Cardiology 2012, Kraków, Poland

Epileptic Seizures Behaviors from the Perspective of Heart Rate Variability
Soroor Behbahani, Nader Jafarnia Dabanloo*, Ali Motie Nasrabadi, Cesar A Teixeira and Antonio Dourado
Heart Rate Variability (HRV) analysis has gained much importance in recent years, as a technique to explore the activity of autonomic nervous system (ANS), and an important early marker for identifying different pathological conditions. Epilepsy is a disease which progressively involves cardiac autonomic activity. Our studies indicate that time domain, frequency domain and some nonlinear measures of HRV would be able to provide valuable information regarding the autonomic dysfunction due to epileptic seizures. In this paper, we investigate the extracted features of heart rate variability for epileptic seizure detection and anticipation
.
S32
Computing in Cardiology 2012, Kraków, Poland 31

Divergent action potential morphology in human atrial cells vs. tissue: underlying ionic mechanisms
Jussi T Koivumäki*, Torsten Christ, Gunnar Seemann, Mary M Maleckar
The Center for Biomedical Computing, Simula Research Laboratory and The Center for Cardiological Innovation, Oslo University Hospital, Norway
Lysaker, Norway
Aims: This study aimed to elucidate the mechanisms underlying the divergent action potential (AP) morphology observed in human atrial cells vs. tissue, with simulations employing computational models.
Methods: The platform for the study was a recently published human atrial cell model which incorporates a physiologically-based description of intracellular calcium dynamics. Two modifications were introduced to this cell model based on conditions inherent to in vitro AP measurements. Firstly, we accounted for the loss of hERG ion channels, which mediate the rapid delayed rectifier potassium current (IKr), due to the standard enzymatic cell isolation protocol. Secondly, the effect of a calcium buffer (EGTA), which is typically used in patch clamp measurements, was also considered. The effect of these two modifications was measured in silico during steady-state pacing at a basic cycle length of 1000 ms.
Results: The reduced IKr conductance slowed repolarization (AP phases 2 and 3) significantly, while initial repolarization (AP phase 1) remained unaffected. Increased AP duration (APD) enhanced also the amplitude of calcium transient (CaT) by 67%. Furthermore, addition of the EGTA buffer in silico increased APD at 30% repolarization (APD30) by 150%, and decreased APD90 by 22%, while APD75 was almost unchanged (-9%). The resulting triangulation of the AP morphology is in accordance with in vitro findings: AP shape is more triangular in isolated cells but assumes a spike-and-dome morphology in tissue measurements.
Conclusions: Both the use of EGTA calcium buffer in patch clamp measurements and loss of IKr due to enzymatic cell isolation appear to exert influence on measured human atrial AP morphologies. It is important to consider this divergence in electrophysiological properties when, for example, extrapolating pharmacological effects measured in isolated cells to cardiac tissue
.
S33
32 Computing in Cardiology 2012, Kraków, Poland

From Body Surface potentials to activation maps on the Atrium: A machine learning technique Nejib Zemzemi1, Simon Labarthe1, Remi Dubois2, Yves Coudiere1
1) INRIA Bordeaux Sud-Ouest, 33405 Talence, France 2) LYRIC, Université de Bordeaux, F33000, Bordeaux, France
Aims The treatment of atrial fibrillation (AF) has greatly changed in the past dec-ade. Ablation therapy, in particular pulmonary vein ablation, has quickly evolved. However, the trigger sites that drive the AF remain very difficult to localize. In this study we propose a machine-learning method able to non-invasively localize a single trigger site. Methods We built a data-set of 400 couples of extracellular and body surface potentials (BSP) using our ECG simulator, each element of the data base corresponds to a different stimulus site and the BSP is measured in 264 positions on the torso surface. Then, using a Reproducing Kernel Hilbert Space (RKHS) method we built a statistical model, by learning on the 400 couples. For a given new BSP (eventually not in the data-set), we reconstruct an estimation of the extracellu-lar potential on the atria, we compute the activation times following the maximum first derivative and we compare it to the exact activation map. Results We tested the method on various cases with different stimulus locations. In the figure we show an example of a statisti-cally estimated solution where the stimu-lus is located near the left appendage in the left atrium. The amplitude of the re-constructed extracellular potential is 50% less important than the exact solution. The maximal error in the activation map is 6 ms and the activation site is located with 0.5 cm of accuracy.
Estimated
trigger site
An example of a statistically constructed activation map
Conclusion Although, the statistical reconstruction didn’t provide a good accuracy in terms of amplitude of extra-cellular potential, the maximum error in the acti-vation map is relatively small and the site of the stimulus is located with a reasonable error of 0.5 cm, which may help to target the ablation procedure.
S33
Computing in Cardiology 2012, Kraków, Poland 33

Elucidating the Body Surface P-wave using a Detailed 3D Computer Model of Atrial Activation
Michael Colman*, Daniele Giacopelli, Philip Langley and Henggui Zhang
The University of Manchester Manchester, United Kingdom
Features of the ECG P-wave remain largely unexplained. P-wave
notching is thought to relate to distinct events of right and left atrial activations. Wandering pacemaker is known to give rise to distinct P wave morphologies. In this study, we develop a 3D computational model of the human atria that is incorporated into a 3D human torso model which can simulate realistic P-waves across the torso. The atrial model considered detailed anatomical structure and anisotropy of the human atria, modified from the imaging data of the visible human dataset. It also considered regional heterogeneity of the action potentials in the sinoatrial node (SAN), the left and right atrium, the pectinate muscles, crista terminalis, atrial septum, atrial appendage and Bachmann’s bundle. The positions of the electrodes on the body surface are modelled by selecting corresponding elements in the torso mesh that match with those used experimentally, allowing direct comparison between simulations and experiment. To qualitatively validate the model, the simulated spatio-temporal distribution of the body surface potential (BSP) as a result of normal conduction patterns during sinus rhythm was compared to 64-lead BSP maps of P-waves from 10 healthy subjects. There was strong agreement in overall dipole direction and presence of P-wave notches. Quantitatively, the positive and negative peak of averaged P-waves occurs at ~60+/-6ms experimentally, compared to ~59ms in simulations. We further used the model to investigate the possible mechanisms responsible for P-wave morphology changes observed experimentally in a single patient, concluding that it is likely due to a shift in the leading pacemaker site across the SAN. In conclusion, a computer model of 3D human atria-torso has been developed. The model has been validated against experimental recordings of BSP from 64-lead electrode vest, and can be used for analysing the spatio-temporal complexity of atrial excitation under normal and arrhythmic conditions
.
S33
34 Computing in Cardiology 2012, Kraków, Poland

Cardioversion Using Feedback Stimuli in Human Atria
S Kharche, I V Biktasheva, G Seemann, H Zhang, V N Biktashev
Universities of Liverpool, Manchester, and Karlsruhe
Low amplitude feedback induced stimulation has been proposed as a low energy atrial cardioversion method. Beatbox, a novel cardiac simulation environment, was used to study this method in the human atria.
The human atrial action potential (AP) cell model by Courtemanche et al. was adopted in this study. Chronic atrial fibrillation (CAF) was simulated by reducing ICaL current con-ductance by 50% and increasing IK1 current conductance by 100%. Single cell models for control and CAF were incorporated into spa-tial models using a reaction-diffusion formula-tion. In 2D sheet models and in the 3D model, re-entry was induced using the phase distribu-tion method. The feedback stimulation method to eliminate such CAF induced re-entry in-volved localized registration of electrical activity which induced application of global external defibrillating stimuli. In multiple parameter sweep simula-tions, the optimal registration electrode location and stimulus amplitude were explored. Using forward Euler integration methods, a time step of 0.05 ms and a space step of 0.33 mm were used in all simulations.
CAF reduced AP duration (APD90) from 306 ms (control) to 145 ms in agreement with experimental data. Under control conditions, re-entrant waves self-terminated in the 2D and 3D models. Re-entrant waves were highly localized and persistent under CAF conditions (see Figure). Under CAF conditions, a single threshold amplitude shock of 4.5 pA/pF eliminated the stable re-entry. However, with feedback stimulation of lower amplitude stimuli of 1 pA/pF, the re-entrant waves migrated out of the 2D tissue. In 3D CAF simulation, feedback control induced stimuli also caused the re-entrant wave to migrate to anatomical boundaries eventually eliminating the re-entry.
The mechanism and efficacy for eliminating re-entrant waves by the feed-back control method is affected by anatomical features in the 3D model. The optimization feedback control parameters in the 3D anatomy warrant further studies.
Meandering re-entrant wave in 3D under control (top). Stable re-entrant wave under CAF conditions (bottom).
S33
Computing in Cardiology 2012, Kraków, Poland 35

Ionic Modulation of Atrial Fibrillation Dynamics in a Human 3D Atrial Model C Sánchez*, MW Krueger, G Seemann, O Dössel, B Rodríguez, E Pueyo
University of Zaragoza, Zaragoza, Spain
Atrial fibrillation (AF) is the most common cardiac arrhythmia, and is mainly sustained by reentrant circuits and rapid ectopic activity. Our previous study identified Na+/K+ pump activity (INaK), the inward rectifier K+ current (IK1) and the fast Na+ current (INa) as the most important ionic mechanisms modulating reentrant dynamics in human 2D tissue models. However, the 3D structure and functional heterogeneity of the human atria are likely to play an important role in modulating the effects of ionic current block on AF man-agement. In the present study, we performed computer simulations using a 3D human atrial model including fibre orientation, electrophysiological het-erogeneities, tissue anisotropy and membrane kinetics as in the human atrial action potential model by Maleckar et al. including AF-induced ionic remod-eling. Reentrant activity was generated by applying one stimulus (S1) at the sinoatrial node followed by a train of 6 rapid ectopic stimuli (S2) every 150 ms near the right pulmonary veins (PV). The impact of ionic changes on reentrant activity was investigated by characterising arrhythmia stability, wavebreak likelihood and dominant frequency (DF). Regularity and organisa-tion of electrograms were also analysed.
Our simulations show that reentrant circuits tend to organize around either the right-PV or left-PV (see Figure). IK1, INa and INaK changes modulate atrial arrhythmogenecity, confirming previous 2D results. Simulated IK1 and INa block by 30% lead to slower DF in the whole atria from 5.7 Hz in control to 4.4 and 4.1 Hz, respectively, expanded wave meandering and reduction of secondary wavelets. INaK block slightly reduces DF to 5.2 Hz and does not notably change the propagation pattern. Regularity and organisation indices of electrograms were significantly higher in the right atrium (0.82-0.85) than in the left atrium (0.51-0.8), entailing a higher likelihood of arrhythmia gen-eration in the latter, as occurs in AF patients.
S33
36 Computing in Cardiology 2012, Kraków, Poland

A Novel Computational Sheep Atria Model for the Study of Atrial Fibrillation
Timothy Butters*, Jichao Zhao, Bruce Smaill and Henggui Zhang
The University of Manchester Manchester, United States
Atrial fibrillation (AF) is the most common sustained arrhythmia, and is
a leading cause of morbidity and mortality in the developed world. With the prevalence of AF increasing with age, its impact is set to triple by 2050 as the population lives longer. Although AF is common, the mechanisms underlying its pathogenesis remain poorly understood. It is clear that efforts to elucidate these mechanisms are paramount, as this would facilitate the development of better surgical and pharmacological treatments for the disease. Sheep is an animal model often used for experimental studies into the underlying mechanisms of cardiac arrhythmias such as AF. Previous studies have shown that biophysically detailed computer models of the heart provide a powerful alternative to experimental animal models for underpinning such mechanisms. In this study we have developed a family of mathematical models for the electrical action potentials of sheep atrial cells, including cells of the right atrial appendage, pectinate muscles, crista terminalis, Bachmann's bundle, left atrium and pulmonary veins. We have also developed a high resolution 3D model for the anatomical structure of the sheep atria using extended volume imaging. By incorporating the single cell models into the anatomical structure, a novel computational model for the sheep atria has been reconstructed. This model was then used to investigate the mechanisms by which rapid focal activity in the pulmonary veins can transit to atrial fibrillation. This was carried out both with and without consideration of the complex fibre structure of the tissue. It was found that the anisotropic property of the atria arising from the fibre structure plays an important role in facilitating fibrillatory atrial excitation waves, with more complex fibrillatory patterns being seen when the fibre structure was considered
.
S33
Computing in Cardiology 2012, Kraków, Poland 37
Nearly-Automated Quantification of Mitral Annulus and Leaflets Morphology from Transesophageal Real-time 3D Echocardiography
Miguel Sotaquira*, Laura Fusini, Roberto M Lang and Enrico G Caiani
Politecnico di Milano Milan, Italy
Aims: This study aimed at: (1) developing a nearly-automated algorithm
for the segmentation of mitral annulus (MA) from transesophageal real-time 3D echocardiography (T3DE) data, followed by a fully-automated mitral leaflets (ML) segmentation algorithm; (2) to extract morphological parameters from segmented annulus and leaflets; (3) to assess the accuracy and reproducibility of the proposed method.
Methods: Following the initialization of 8 MA points, located on the anterior (A), posterior (P), antero-lateral (Al) and postero-medial (Pm) regions, a stack of 36 rotational 2D cut-planes was obtained and analyzed by combining block matching, morphology operators and a Dijkstra minimum cost path algorithm, to detect two MA points in each cut-plane, thus delineating the 3D MA contour. Then, ML were segmented on each plane by considering the corresponding pairs of annular points and using Dijkstra algorithm to compute leaflets medial axes. Several MA and ML morphological parameters were computed: MA perimeter, height and 2D surface area, A-P and Al-Pm diameters, MA and ML 3D surface areas, ML local thickness, tenting volume and heights. The accuracy and reproducibility of the algorithm were tested on T3DE obtained in 12 patients by: a) comparing the computed parameters against ”gold standard” measures performed by a cardiologist using a manual approach (MVQ-QLAB, Philips) and b) by assessing intra- and inter-observer variability.
Results: Segmentation and quantification of MA and ML parameters required <2 min including user initialization. The algorithm reproducibility resulted high in all parameters (intra- and inter-observer variability around 10%), except for MA height and tenting (variability around 20%). Comparison with “”gold standard” showed optimal correlation (r2>.95), as well as small biases and narrow limits of agreement, except for MA height.
Conclusion: A fast, model-free, nearly-automated method for MA and ML quantification was developed and tested. The reported performance makes it promising for future applications in clinical settings
.
S34
38 Computing in Cardiology 2012, Kraków, Poland

An Ultrasound-based Imaging Method for Visualizing Patterns of Action Potential Propagation in the Heart
Niels F Otani*, Rupinder Singh and Robert F Gilmour, Jr
Cornell University Ithaca, United States
Background: An understanding of the patterns and characteristics of
action potential propagation in the heart is crucial for the development of advanced methods for treating dangerous and lethal cardiac rhythm disorders. Unfortunately, visualization of these action potentials with existing methods, especially deep with the walls of the heart, has been problematic. Consequently, we have been developing a new method whereby these patterns can be seen. The method calculates the locations of action potentials from the deformations they produce, as recorded in ultrasound images. Aim: An important step in developing an appropriate algorithm is to determine whether there exists a local function of the mechanical strains that marks the locations of the action potentials, or whether, instead, a fully three-dimensional inverse calculation must be performed. Method: To answer this question, we have developed a spatially one-dimensional theory of the stress-strain relationship, which we have extended into an axisymmetric 3D shell model of the heart. Both forward and inverse calculations were also performed using our fully 3D computer model of myocardial tissue in rectangular geometry. Functional forms of the strain, such as the incremental strain, were analyzed for positioning relative to the locations of the action potentials. Results: The theory and computer models all show that localization of the action potentials is possible when the action potential wave takes on the morphology of a plane wave. In contrast, higher dimensional structure in either the wave or the medium in which it travels produces an incremental strain field that extends out away from the wave. Conclusions: Determination of action potential locations without having to do a full 3D inverse calculation appears possible for simple locally-plane wave propagation. In contrast, visualization of complex wave patterns, such as are likely in ventricular fibrillation, may require solving the full inverse problem
.
S34
Computing in Cardiology 2012, Kraków, Poland 39

Effects of Frame Rate on 3D Speckle Tracking Based Measurements of Myocardial Deformation Chattanong Yodwut, Lynn Weinert, Berthold Klas, Roberto M. Lang, Victor Mor-Avi*
University of Chicago, Chicago, Illinois, U.S.A. Ramathibodi Hospital, Mahidol University, Bangkok, Thailand TomTec Imaging Systems, Unterschleissheim, Germany Objective. Myocardial strain has been shown useful in the evaluation of
left ventricular (LV) function using high frame rate two-dimensional (2D) speckle tracking echocardiography (STE). Three-dimensional (3D) STE al-lows 3D measurement of myocardial deformation, which is potentially more accurate, because it is not affected by through-plane motion. However, the relatively low frame rates of 3DSTE are a potential limitation, which has not been studied to date. While with 2DSTE, high frame rates are necessary be-cause speckles may move out of the imaging plane, we hypothesized that because they always remain within the scan volume, they should be tracked with 3DSTE, even if frame rates are considerably lower. Methods. We studied 16 normal volunteers who underwent 2D (short-axis
and apical views; frame rate: 62±9 fps) and 3D echocardiographic imaging (Philips iE33), which was performed at 4 different frame rates, achieved by varying the number of beats used for full-volume acquisition (6, 4, 2 and 1). The principal components of strain and the corresponding strain-rates were calculated in 16 myocardial segments and averaged. Both 2D and 3D images were analyzed using TomTec software to avoid analysis-related differences. Results. Strain and strain-rate values were the same for 3DSTE with 6-
and 4-beat full-volume datasets, corresponding to 25 and 18 fps, respectively. In contrast, 3DSTE with 1- and 2-beat datasets, corre-sponding to 5 and 10 fps, re-spectively, resulted in signifi-cantly lower values. Strains and strain-rates derived by 3DSTE from 6- and 4-beat datasets were not significantly lower than 2DSTE-derived values, indicating that there was no loss of information due to lower frame rates. Conclusions. 3DSTE assessment of myocardial deformation is not
compromised by low frame rates, when derived from 18 or 25 fps datasets, but are underestimated with lower frame rates.
-25%
-20%
-15%
-10%
-5%
0% 2D 6 4 2 1
Pea
k LS
Number of beats (3D)
*p<0.05
*
*
S34
40 Computing in Cardiology 2012, Kraków, Poland

Functional Geometry of Human Left Ventricle in Ontogenesis
Lyubov Ivanova*, Irina Philimonova, Olga Solovyova, Olga Kraeva, Pavel Tcivian and Vladimir Markhasin
Institute of Immunology and Physiology UB RAS Yekaterinburg, Russia Ekaterinburg, Russian Federation
Introduction: Significant structural and functional development of the
heart occurs during ontogenesis. Age-related features of the functional geometry (FG) of the left ventricle (LV), i.e. alterations in the LV shape during the cardiac contractile cycle, are insufficiently studied. Here we assess differences in quantitative characteristics of LVFG between healthy newborns and adults.
Methods and groups: in 37 healthy newborn infants of 1-5 days of life and 42 healthy adults (average age is 31 years), two-dimentional echocardiographic LV images were recorded during 2-3 contractile cycles and analyzed with self-developed software. The following quantitative characteristics of the LVFG were evaluated: spatial and temporal distributions of the two-dimensional estimate of the regional ejection fractions (REF) and respective indexes of heterogeneity of LV wall regional movements (Chumarnaia et al., 2008); dynamics of shape indexes (sphericity (SI), apical conicity (ACI), Gibbson (GI), and a shape-power index (FSPI, Kass et al., 1988) based on the Fourier analysis of LV contours). The quantitative data in groups were statistically compared.
Results: The dependence of the REF mean value along the LV contour, characterized for adults, was not found in infants. The average values of heterogeneity indexes were higher in newborns versus adults. SI, ACI and GI decreased from diastole to systole in both groups. Relative changes in the indexes during systole were significantly greater in adults. FSPI was found to be the most age sensitive index of shape dynamics. It increases significantly from diastole to systole in each group (reflecting an increase in the shape complexity during the cycle), and the relative changes in FSPI during systole were noticeably higher in adults.
Conclusion: LVFG evaluates during ontogenesis, particularly owing to heterogeneous development of longitudinal and circular fibers of the myocardium. This work is supported by RFBR (10-04-96075) and Presidium of UB RAS (12-П-4-1036)
.
S34
Computing in Cardiology 2012, Kraków, Poland 41

Spatio-Temporal Registration of Electro-AnatomicalMappings With Functional Data for CardiacResynchronization Therapy OptimizationFrancois Tavard, Antoine Simon, Alfredo I Hernandez, Julian Betancur,Erwan Donal, Christophe Leclercq, Mireille Garreau
INSERM U1099, LTSI, Universite de Rennes 1Rennes - F35000, FRANCE
Aim: The optimization of Cardiac Resynchronization Therapy (CRT) maybe achieved by a better selection of the pacing sites based on an enhancedelectromechanical regional characterization.
Method: We have proposed to register Electro-Anatomical Mappings (EAM)- providing the local electrical activity or electrograms (EGM) - and SpeckleTracking Echography (STE) images to a common geometrical reference basedon CT images. The registration of EAM and CT images is based on the auto-matic alignment of apex and great axis of surfaces extracted from both acqui-sitions, and on the manual rotation of the EAM surface around its great axis.The registration of STE images to CT images relies on a Fourier contour de-scription and on Dynamic Time Warping (DTW) to handle the non-linearitybetween both temporal bases. In order to synchronize EAM and STE data, theECG acquired during both acquisitions are considered. However, two maindifficulties are spotted and are dealt with through a two-step method proposedfor this temporal registration:(i) a cross-correlation is calculated between the ECG leads acquired during
EAM and the ECG lead acquired during STE, so as to select the most appro-priate registration signal couple,(ii) the two signals are non-linearly mapped, using DTW to handle the dif-
ferences in heart rate. The minimized metric is the absolute difference of thefirst derivate of both signals and the optimal path is computed by dynamic pro-gramming, considering classical constraints.
Results: Results are presented for three patients. STE to CT registrationhas been validated by a medical expert. EAM to CT registration is validated ontwo patients by checking the correspondence between the location of the firstelectrically-activated point and the stimulation site (located by X-Ray angiog-raphy and manually registered to CT using a coronary network segmentation)(cf. figure 1). The whole process enables to represent descriptors obtainedfrom EAM, STE and CT data in the same spatio-temporal reference system.
Figure 1. Registered data. Left : LV segmentation from CT (endocardium and veins); the posi-tion of the lead is encircled. Right : electrical delays resulting from the EAM to CT registration.The first activated point corresponds to the position of the stimulation lead.
S34
42 Computing in Cardiology 2012, Kraków, Poland

Classification of the Myocardial Damage Degree Based on Texture Parameters of Ultrasound Intravenous Contrast Agent Images
Slawomir Skonieczka*, Michal Strzelecki, Jaroslaw Kasprzak, Blazej Michalski and Piotr Lipiec
Technical University of Lodz Lodz, Poland
The aim of this research is to develop a classification method for
myocardial damage degree with the use of texture parameters estimated for static ultrasound image. Mterials & Methods: 222 heart echo images (monochrome and color ones obtained after application of intravenous contrast agent) from 24 different patients were analyzed with custom software. For defined regions of interest in each image 298 image features were calculated (based on image histogram, gradient matrix, Run length matrix, co-occurrence matrix and wavelet transform). Then, 30 features with the lowest standard deviation were estimated. For classification of heart tissues of different vitality degrees the multilayer perceptron and nonlinear discriminant analysis were applied after reduction of feature set to 12 most discriminant ones. The reduction was done based on selection of feature subsets (with two or three features) that provide the lowest classification error using 1-nearest neighbor classifier. The tissue vitality was evaluated based on MRI examination. Results: The best classification results were obtained for a red component of color echo images acquired after contrast agent application. 79% of correct classification was obtained regarding the absence of necrosis while 81% for images representing different levels of transmurality (=<50% or >50%). These results were obtained for 5-fold network cross-validation. A similar feature selection and classification procedure applied for native gray scale images yielded worse results (68% and 79% of correct classification). Advanced classification of segments into 3 classes: no necrosis/1-50% necrosis/>50% necrosis by MRI was 70% correct for color and 60% correct for native images. Conclusion: Texture features are able to discriminate diseased heart tissues in echo images. Myocardial contrast enhancement allowed a superior classification of necrotic tissue when compared to native gray scale images. Selected texture features, mainly related to entropy measures are thus useful for early post-MI detection of myocardial necrosis
.
S34
Computing in Cardiology 2012, Kraków, Poland 43

Interactive Effects of Simultaneously Varying Respiratory Frequency and Tidal Volume on Respiratory Sinus Arrhythmia
Alejandra Guillén-Mandujano* and Salvador Carrasco-Sosa
Universidad Autónoma Metropolitana-I Mexico City, D.F., Mexico
It is widely accepted that respiratory sinus arrhythmia (RSA) depends on
both respiratory frequency (RF) and tidal volume (TV), although the effects of each variable have usually been established keeping the other constant. Our aim was to assess the interactive effects of simultaneously varying RF and TV on high-frequency power of RR intervals (HFRR). ECG and TV were recorded from 25 healthy volunteers during three visually guided 30-s breathing maneuvers: linearly increasing RF (RFLI) from 0.15 to 0.5 Hz at constant TV of 1L; linearly increasing TV (TVLI) from 1 to 2.5L and decreasing (TVLD) from 2.5 to 1L at constant RF of 0.2Hz, and the combination of RFLI and TVLI-TVLD. Using the smoothed pseudo-Wigner-Ville distribution, time-frequency spectra of RR intervals and respiratory series were estimated to compute the high-frequency power of respiration and HFRR. Correlation coefficients between RFLI and HFRR in separated and combined conditions were -0.77±0.20 and -0.90±0.06 respectively. The RFLI-HFRR regression slope increased from -6.0±3.2 to -12.5±4.5 in combined condition (p<0.001). In 60% of the recordings the correlation between TVLI alone and HFRR was negative (-0.8±0.17), but positive (0.71±0.23) in the remaining 40%, with slopes of -1.0±0.7 and 0.6±0.4 respectively. In the combined maneuver this correlation was negative (-0.85±0.11) with a slope of -2.0±1.3, significantly different (p<0.001) from those obtained in the separated maneuver. Correlations between TVLD and HFRR in separated and combined conditions were 0.3±0.5 and 0.5±0.4 respectively. The slope of the TVLD-HFRR regression increased from 0.4±0.8 in separated to 1.2±1.3 in combined condition (p<0.001). Our fast, non-fatiguing and non-steady-state respiratory maneuvers allowed us to document that: 1) RFLI consistently attenuates RSA, whether applied alone or in combination; 2) the effects of TVLI-TVLD alone on RSA are ambiguous and present hysteresis and 3) RFLI and TVLI-TVLD combined induce greater attenuating effects on RSA than separately
.
S41
44 Computing in Cardiology 2012, Kraków, Poland

Correlation between Spectral Measures of Systolic Blood Pressure Variability and Heart Rate Variability during Paced Breathing, Standing and Exercise
Salvador Carrasco-Sosa and Alejandra Guillén-Mandujano*
Universidad Autónoma Metropolitana-I Mexico City, Mexico
The physiological correlates of spectral measures of systolic blood
pressure variability (SBPV) are sometimes controversial. To provide insight into this issue, we assessed the relationships between spectral indexes of SBPV and heart rate variability (HRV), during two sympathetic maneuvers and controlled breathing. Additionally, we evaluated the percentage of statistical differences among epochs (PSDE) of the spectral measures dynamics obtained in steady-state conditions. ECG, arterial pressure and respiration were recorded from 20 healthy volunteers during four 5-min steady-state maneuvers: lying (L), standing (S), controlled breathing (CB) with high tidal volume and dynamic exercise (E). From RR intervals (RRi), systolic pressure (SP) and respiratory series, auto- and cross-spectra were estimated with the smoothed pseudo-Wigner-Ville distribution to compute high-frequency power of RRi (HFRR), low-to-high-frequency ratio (LFRR/HFRR), low-frequency of SP (LFSP), high-frequency of SP (HFSP), high-frequency of respiration (HFRe) and time-frequency coherence between HFSP and HFRe. The indexes dynamics were segmented into 50-s epochs for statistical comparisons. With respect to L, HFRR and RRi decreased progressively (p<0.001) in S and E, while LFSP increased progressively (p<0.001). LFSP-lnHFRR, LFSP-RRi and LFSP-LFRR/HFRR correlations were -0.73±0.09, -0.77±0.06, and 0.66±0.13 respectively. During CB and E, HFSP was greater (p<0.001) than in L and S; its coherence with HFRe was greater than 0.80 in all maneuvers. Global PSDE of the spectral measures dynamics was 41±18%. As indicated by HRV spectral measures, S and E induced different levels of sympathetic activation. These indexes showed strong correlation with LFSP power, providing evidence that supports its appropriateness as a sympathetic index. Both the increase of HFSP in CB and E and its significant coherence with respiration document its mechanical respiratory origin. Given the high PSDE of spectral measures found in supposedly stationary recordings, a better strategy for the spectral estimation of cardiovascular signals would be the systematic use of a time-frequency distribution
.
S41
Computing in Cardiology 2012, Kraków, Poland 45
Heart Rate Turbulence Modulation with Coupling Interval and Heart Rate
Óscar Barquero-Pérez*, Carlos Figuera-Pozuelo, Rebeca Goya-Esteban, Inmaculada Mora-Jiménez, José Luis Rojo-Álvarez, Javier Gimeno-Blanes and Arcadi García-Alberola
University Rey Juan Carlos Fuenlabrada, Spain
Bakground. Heart Rate Turbulence (HRT) is a powerful risk
stratification criterion in patients with cardiac disorders. Several physiological factors affect HRT, e.g., previous heart rate (HR), and coupling interval (CI). However, classical HRT assessment use an average of the available individual tachograms that might blur relevant physiological relationships and it does not take into account their impacts on HRT
Objective. We hypothesized that quantifying the impact of CI and HR on individual tachograms, using robust signal processing techniques, would allow to compute local HRT measurements and provide a complete and meaningful HRT characterization.
Materials and Methods. We used a filtering method based in SVM regression. We studied 11 patients referred for electrophysiological(EP) studies. Sequences of 10 single ventricular extrastimuli were delivered. The study was subdivided in two protocols:Protocol-I 5 patients,varying the HR with isoproterenol. Protocol--II 6 patients, two stages, phase-I (without isoproterenol) phase-II(with isoproterenol), both with 10 VPC were delivered and different prematurity.
Results. Protocol-I: Every patient (except one) showed a decreasing HRT as quantified by TS and TO with increasing previous HR, pat1: HRlow=986.35(ms); TS: 26.75+-17.55; TO=-4.62+-4.8, HRhigh=676.91(ms); TS=14.64+-8.48; TO=-0.83+-4.37. Protocol-II: Every patient (except one) showed a decreasing HRT as with increasing normalized coupling interval. The slope of the relation was higher in modulus on phase-I (low HR) than on phase-II (high HR), pat5: HRph1=711.51(ms);slope(TSvsNCI)=-0.340;TS=17.29+-8.23; HRph2=609.62(ms); slope(TSvsNCI)=-0.069; TS=11.20+-5.49
Conclusions. Results on individual patient are in line with the baroreflex source of the HRT. The premature the VPC the stronger the HRT, and the higher the HR the stronger the HRT. Filtering isolated tachograms allowed to take into account the impact of the previous HR and the coupling interval. Further studies should investigate how to incorporate the information of thephysiological conditions in which a VPC occurs, e.g. by some standardization of the HRT to the HR and coupling interval
.
S41
46 Computing in Cardiology 2012, Kraków, Poland

Heart Rate Variability Non Linear Dynamics in Intense Exercise
Rebeca Goya-Esteban*, Óscar Barquero-Pérez, Elena Sarabia-Cachadiña, Blanca De la Cruz-Torres, José Naranjo-Orellana and José-Luis Rojo-Álvarez
Rey Juan Carlos University, Fuenlabrada, Spain Fuenlabrada, Spain
Introduction. Heart Rate Recovery (HRR) after exercise is commonly
used as a marker of physical condition. Moreover, decreased HRR has been associated to cardiovascular risk increase. Although a number of studies have addressed the clinical usefulness of Heart Rate Variability (HRV) as a marker of the autonomic activity, few works have studied the complex physiological responses during and after high intensity exercise by means of HRV nonlinear dynamics.
Methods. In the present study, we selected a set of nonlinear indices, measuring different aspects of the underlying physiological mechanisms, in order to assess the HRV evolution in an All Out Exercise Test in eight male amateur triathletes. Namely, Sample Entropy (SampEn), and alpha1 and alpha2 from Detrended Fluctuation Analysis were chosen. To compute alpha2 we took into consideration the minimum signal length recommended in the literature. We additionally proposed a measure to quantify HRV Recovery (HRVR) after exercising for any index.
Results. Our results showed that: (1) SampEn decreased drastically during exercise, it did not recover at all immediately after exercise and it slightly recovered within 5 minutes of rest; (2) alpha1 decreased during exercise, but its values were reestablished immediately after exercise. Moreover, populational alpha1 mean value within 5 minutes of rest was higher than populational alpha1 mean basal value; (3) Oppositely, alpha2 increased during exercise, following a slight recovery of its values in the rest time. No correlation was found between HRR and HRVR in this study.
Conclusion. The performance of nonlinear HRV indices during and after high intensity exercise suggests that they could be assessing relevant information about underlying physiological recovery. In this context, information provided by HRR may not be enough to evaluate the complex mechanisms behind these physiological changes. Therefore, HRV nonlinear indices should be also taken into account to assess physical condition or cardiovascular risk
.
S41
Computing in Cardiology 2012, Kraków, Poland 47

DynaScope: a Software Tool for the Analysis of Heart Rate Variability During Exercise G Toninelli1, C Vigo2, M Vaglio1, F Badilini1, M Pagani2
1 AMPS LLC, New York, NY, USA 2 CTNV, L. Sacco Hospital, University of Milan, Italy Aims: The aim of the study was to develop a software (DynaScope) to study the dynamics of Heart Rate(HR), estimating the HR changes both in exercise and recovery, where spectral analysis cannot be ap-plied. HR Variability reflects the regulation of the HR by the autonomic nerv-ous system and has a clinical relevance as a predictor of mortality.
Methods: The RR series were filtered automatically and the vari-ance(VarRR) of the tachogram was computed using a predefined win-dow, the same used for the filtering. The exercise-recovery episodes (which can be more than 1) were automatically detected, and each phase was divided in “exercise” and “recovery”. For both recovery and exercise the following measures were computed: VarRR, slope of RR and maximum RR speed. Areas of Poincaré plots of RR during rest phases between each exercise were also computed. These measures can quantify the HR dynamics during both exercise and recovery phases.
Results: For initial validation, we conducted a test conducted on 10 healthy subjects (mean age 23.1±2.5 years) undergoing three exer-cises on a supine-bicycle with different loads (50-100-150 W), sepa-rated by rest phases. The Maximum RR was significantly different (p<0.05) in the three loads (948±57,854±60 and 736±52 ms) and so were RR slope in recovery phase (4.9±0.7,3.5±0.5 and 2.5±0.5 ms/s), maximum RR speed in exercise (18±2,13±2 and 9±1 ms/s) and re-covery phases (13±1,10±1 and 7±2 ms/s), maximum VarRR and area of Poincaré plot. It was evident that all these values decrease with increasing load and successive bouts of exercises. Human heart has memory of the pre-ceding episodes of exercise and DynaScope can quantify them esti-mating HR changes between different episodes. Conclusions: The analysis can be useful both in healthy subjects, to evaluate exercise capacity end the efficiency of a training program, and in patients to monitor clinical condition and efficacy of therapy.
S41
48 Computing in Cardiology 2012, Kraków, Poland
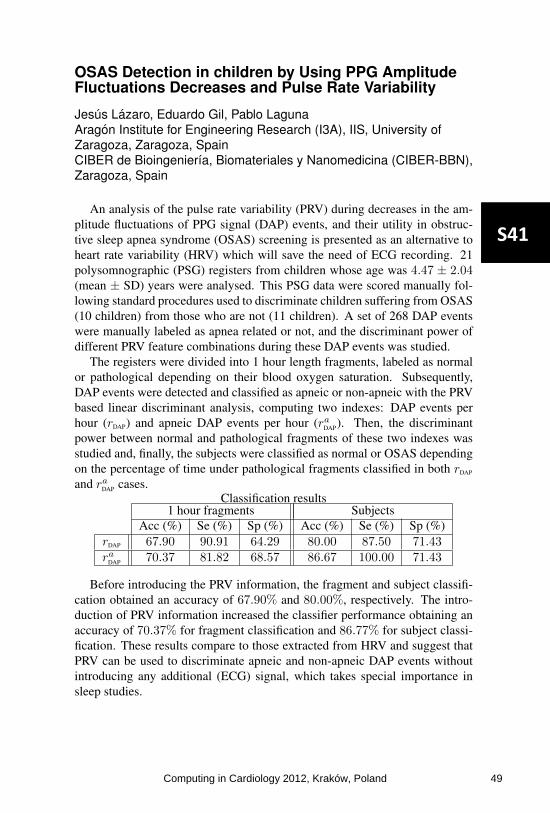
OSAS Detection in children by Using PPG AmplitudeFluctuations Decreases and Pulse Rate Variability
Jesus Lazaro, Eduardo Gil, Pablo LagunaAragon Institute for Engineering Research (I3A), IIS, University ofZaragoza, Zaragoza, SpainCIBER de Bioingenierıa, Biomateriales y Nanomedicina (CIBER-BBN),Zaragoza, Spain
An analysis of the pulse rate variability (PRV) during decreases in the am-plitude fluctuations of PPG signal (DAP) events, and their utility in obstruc-tive sleep apnea syndrome (OSAS) screening is presented as an alternative toheart rate variability (HRV) which will save the need of ECG recording. 21polysomnographic (PSG) registers from children whose age was 4.47 ± 2.04(mean ± SD) years were analysed. This PSG data were scored manually fol-lowing standard procedures used to discriminate children suffering from OSAS(10 children) from those who are not (11 children). A set of 268 DAP eventswere manually labeled as apnea related or not, and the discriminant power ofdifferent PRV feature combinations during these DAP events was studied.
The registers were divided into 1 hour length fragments, labeled as normalor pathological depending on their blood oxygen saturation. Subsequently,DAP events were detected and classified as apneic or non-apneic with the PRVbased linear discriminant analysis, computing two indexes: DAP events perhour (rDAP) and apneic DAP events per hour (raDAP). Then, the discriminantpower between normal and pathological fragments of these two indexes wasstudied and, finally, the subjects were classified as normal or OSAS dependingon the percentage of time under pathological fragments classified in both rDAP
and raDAP cases.Classification results
1 hour fragments SubjectsAcc (%) Se (%) Sp (%) Acc (%) Se (%) Sp (%)
rDAP 67.90 90.91 64.29 80.00 87.50 71.43raDAP 70.37 81.82 68.57 86.67 100.00 71.43
Before introducing the PRV information, the fragment and subject classifi-cation obtained an accuracy of 67.90% and 80.00%, respectively. The intro-duction of PRV information increased the classifier performance obtaining anaccuracy of 70.37% for fragment classification and 86.77% for subject classi-fication. These results compare to those extracted from HRV and suggest thatPRV can be used to discriminate apneic and non-apneic DAP events withoutintroducing any additional (ECG) signal, which takes special importance insleep studies.
S41
Computing in Cardiology 2012, Kraków, Poland 49

Termination of Atrial Fibrillation by Catheter Ablation can be Successfully Predicted from Baseline ECG
A Buttu, J Van Zaen, A Viso, A Forclaz, P Pascale, SM Narayan, JM Vesin, E Pruvot
EPFL, Swiss Federal Institute of Technology Lausanne, Switzerland Purpose: Multiple organization indices (OIs) have been used to predict
the outcome of stepwise catheter ablation (step-CA) in long-standing persis-
tent AF (pers-AF), however with limited success. Our study aims at predict-
ing the outcome of step-CA using innovative OIs from baseline (BL, before
ablation) ECG.
Methods: Seventeen consecutive patients (pts) (59±5 y, AF duration 21±9
m) underwent step-CA consisting in pulmonary veins isolation, left atrial
(LA) defragmentation and linear ablations, and right atrial (RA) ablations if
non terminated. Chest lead V6 was placed in the back (V6b). Two OIs were
computed to quantify the harmonic components of ECG atrial activity after
QRST cancellation from chest leads V1 to V6b: 1) phase difference (PD)
between harmonic components as a measure of AF regularity, and 2) adap-
tive OI (AOI) evaluating the time evolution of the AF harmonic components.
Both indices were compared to classical ones: a spectrum-based OI (SOI) and
ECG AF cycle length (AFCL).
Results: Pers-AF was terminated into sinus rhythm or atrial tachycardia in
13/17 pts during step-CA, 11 during LA (LT), 2 during RA (RT) ablation,
and 4 were non terminated (NT). The figure shows that LT was best separat-
ed from RT/NT before ablation by AOI computed on lead V1 (A) and PD
from lead V6b (B) as compared to SOI and ECG AFCL respectively.
Conclusion: Our results suggest that adaptive OIs computed at baseline
perform better than classical OIs for separating LT from RT/NT pts. These
findings are indicative of a higher baseline organization in LT pts that could
be used to select candidates for the restoration of sinus rhythm by step-CA.
S42
50 Computing in Cardiology 2012, Kraków, Poland

Automatic Screening of Atrial Fibrillation in Thumb-ECG Recordings
Martin Stridh* and Mårten Rosenqvist
Lund University, Sweden Lund, Sweden
Aims: This present study aimed at investigating the performance of a
novel automatic screening algorithm for identification of patients with atrial fibrillation in large thumb-ECG repositories. Repeated thumb-ECG measurements at home are presently starting to be tested in the search for atrial fibrillation for the long-term purpose to reduce the incidence of stroke. Such screening rapidly generates large databases waiting to be sorted and prioritized.
Methods: The thumb-ECGs were first preprocessed to remove baseline wander followed by beat detection and beat classification. A rhythm analysis stage was employed to perform RR interval analysis with negligible influence of ectopic beats and disturbances. RR interval information in combination with a waveform clustering procedure applied to the expected P wave intervals were used to sort the analyzed database into sinus rhythm, atrial fibrillation and poor quality. The outcome of the algorithm was compared to an annotated database containing 2837 thumb-ECG recordings from 103 patients. The data was recorded using Zenicor thumb-ECG devices and each recording was visually inspected by a physician and marked as either sinus rhythm (n=2542), atrial fibrillation (n=59), other arrhythmia (n=80), poor quality (n=76) or unknown (n=37). Results: The proposed method was able to detect 2342 (92.1%) of the sinus rhythm recordings with different degrees of certainty. For atrial fibrillation detection, 43 (72.9%) of the 59 recordings were identified by the algorithm together with 89 other recordings with similar signal properties. Five atrial fibrillation recordings out of 59 were detected in the sinus rhythm group. By evaluating the pattern of abnormal beats, 54 (71.1%) of the recordings marked with poor quality were identified.
Conclusion: Automatic analysis of thumb-ECG databases can quickly guide the physician to find recordings with high probability to contain atrial fibrillation and can automatically indicate if a recording needs to be remade due to quality problems
.
S42
Computing in Cardiology 2012, Kraków, Poland 51

Comparative Study of Nonlinear Metrics to Discriminate Atrial Fibrillation Events from the Surface ECG
M Julián*, R Alcaraz and JJ Rieta
Biomedical Synergy Valencia, Spain
Non-linear analysis of physiological signals is a practical tool to reveal
information about the underlying mechanisms of physiological processes like atrial fibrillation (AF). Previous studies have demonstrated the utility of Sample Entropy (SampEn) in the estimation of AF organization under a wide variety of scenarios. In the present work, the atrial activity (AA) of surface ECGs in AF has been studied to evaluate and compare the ability of several nonlinear metrics in the discrimination of AF events by estimating their organization. In order to use standardized data, the Physionet AF Termination Challenge Database was studied. It was composed of 80 recordings with the goal of distinguishing between N (non terminating AF), S (soon terminating AF) and T (immediately terminating AF). Lead V1 was selected and the AA signals were extracted by applying an adaptive QRST cancellation method. Next, the AA signals were used to generate the surrogate data and their analysis revealed the nonlinear behavior of AA. To compare organization results, the following nonlinear metrics were applied to the AA: SampEn, Spectral Entropy (SEn), Lempel-Ziv Complexity (LZC) and Hurst Exponents (HE). Other reference parameters were added to the study: Dominant Atrial Frequency (DAF) and AA average power (fWP). The Main Atrial Wave (MAW) was obtained applying a selective filtering to the AA signal centered on the DAF. Next, the MAW organization was estimated by the following parameters: SampEn, Fuzzy Entropy (FuzzEn), LZC and HE. Several nonlinear metrics yielded single classification accuracies above 85% in the discrimination N vs S and N vs T (see table in PDF abstract). Moreover, discrimination S vs T yielded accuracy values near 67%. As conclusion, the study of MAW organization improved results obtained from direct AA organization in all the analyzed nonlinear metrics. Furthermore, some of them achieved better results than SampEn, a widely used metric in the estimation of organization-related events in AF. Therefore, they could be considered as promising tools in the quantification of AF events from the surface ECG
.
S42
52 Computing in Cardiology 2012, Kraków, Poland

Eigenvalue Decomposition for P-wave Analysis in Paroxysmal Atrial Fibrillation
Francisco Castells*, Dorian Stübner, Yan Huo, Edu Roses, Daniela Husser, José Millet and Andreas Bollmann
Introduction: During paroxysmal atrial fibrillation (PAF), atrial fibrillation (AF) episodes go usually unnoticed during conventional ECG observation, since the patients may arrive in NSR. Nevertheless, some changes in the P wave morphology are expected, whose analysis would be essential for an early detection of PAF. Novel morphological indicators are proposed to measure P wave regularity and complexity.
Materials and Methods: standard surface ECGs (12-leads, 10s) of 38 control subjects and 160 consecutive PAF patients were acquired. In order to compute temporal regularity, 5 consecutive P waves within each lead are extracted. After eigenvalue decomposition, the ratio between the first eigenvalue and the sum of all eigenvalues is computed. P wave regularity is defined as the average for all leads. In order to compute spatial complexity, P waves within each lead were aligned and averaged. EVD is then applied to the resulting ensemble of P waves, considering only 8 eigenvalues. Complexity is defined as the ratio of sum of all eigenvalues but the first and the sum of all eigenvalues. The performances of these novel indicators are compared to classical parameters such as P wave duration (PWD).
Results: PWD was 141.74±26.54ms for the control group, which increased to 153.67±45.23 for the PAF group (p=0.011). Temporal regularity was 0.5939±0.1211 and 0.6327±0.0996 for control and PAF groups, respectively (p=0.040). Finally, spatial complexity was the most significant parameter, increasing from 0.2891±0.1183 (controls) to 0.3812±0.0866 (PAF), with p<1e-6.
Conclusion: The higher complexity of the P wave during PAF is well captured by the proposed spatial complexity parameter, providing much more significant results than classical parameters as P wave duration. In addition, since it does not require an accurate P-onset nor P-offset detection, this indicator becomes much more robust and can be computed in a fully automated manner without the need of supervision by experts
.
S42
Computing in Cardiology 2012, Kraków, Poland 53

Non-invasive Detection of Higher Frequency Atrial Sources during Atrial Fibrillation
Francisco Castells*, Raúl Llinares, Andreu Climent, Felipe Atienza, Jorge Igual, José Millet and Maria Salud Guillem
Introduction: radiofrequency ablation is one of the most frequent therapies for the management of atrial fibrillation (AF). Target ablation sites include high frequency drivers, which may be responsible for AF maintenance. The analysis of the surface ECG is able to estimate the dominant atrial cycle length, but detecting the existence of high frequency drivers is still challenging. This paper proposes a methodology to detect higher atrial frequencies from surface signals.
Materials: simultaneous intracardiac and 64-leads Body Surface Mapping Potential (BSPM) recordings from 14 patients were obtained during AF. Additionally, a short segment free from ventricular activity was obtained after adenosine administration. Both intracardiac recordings and surface atrial signals during adenosine served as gold standard.
Methods: the proposed algorithm extracts a signal from the BSPM recording as the linear combination that maximizes a cost function that measures periodicity within a given range. By applying iteratively this algorithm in 1.5Hz-width bands from 5Hz to 20Hz in steps of 0.25Hz, several candidates for AF signals with increasing frequency are obtained. These signals with high spectral concentration (>0.3), lower kurtosis (<2) and same frequency detection in 5 consecutive steps were considered compatible with AF. Among the signals that accomplished these 3 criteria, the one with the highest frequency was selected as candidate for AF driver. This frequency was compared with spectral analysis of intracardiac recordings and surface signals during adenosine.
Results: The higher atrial frequencies found by the proposed algorithm were 9.58±2.03Hz, ranging from 6.5 to 13.9Hz. All these frequencies, which were higher than the dominant atrial frequency, were observable in intracardiac recordings.
Conclusion: The detection of higher frequency atrial sources from non-invasive analysis could be a useful tool to detect the existence of higher frequency drivers, which could be considered as targets for radiofrequency ablation
.
S42
54 Computing in Cardiology 2012, Kraków, Poland
Information System for Assessing Health Care in Acute Myocardial Infarction
Alessandro Taddei*, Umberto Paradossi, Emiliano Rocca, Elaine Laws, Marina Marchi, Stefano Dalmiani and Sergio Berti
G.Monasterio CNR Tuscany Foundation Massa, Italy
BACKGROUND: The benefit of prompt, expertly performed primary
percutaneous coronary intervention for Acute ST elevation Myocardial Infarction (STEMI) is established. A network for care of STEMI patients in northwest of Tuscany, beginning in 2006, involved 5 Spoke and 1 Hub centers, 1 helicopter, 6 ambulances with ECG transmission. Aim of our project was to set up an information system to evaluate care delivery by analysis of door-to-balloon (DTB) time (i.e. since hospital call until angioplasty) versus mortality.
METHODS: According to “Matrix” model (previously reported at CinC) a clinical repository was set up by integration with Hospital Information System (HIS, Oracle RDBMS), applied in all health care activities at our hospital, from diagnostic, intervention and operation reports to medical records. The dataset consists of 219 parameters, concerning patient’s medical history, clinical conditions, diagnostic reports, coronary angioplasty as well as DTB times and patient’s follow-up. Each new patient, cared for STEMI, was enrolled into the repository, gathering DTB times and advising by email study team for regular data entry. Embedded SQL queries allowed to retrieve any information from HIS. Web secure access to on-line patient records and statistics was provided.
RESULTS: Up to 2011, 1177 STEMI patients were enrolled with average DTB of 95 min. Overall mortality was 4.3%. Gold standard of DTB≤90 min was reached in 45% of patients. Mortality was associated with longer DTB as compared to alive patients (115 vs 95 min, p<0.0001). Patients from coast had DTB lower than those from mountains and rate of mortality was significantly different. Risk of mortality was correlated with increase in DTB in all patients. An improvement in DTB since 2008 was evident.
CONCLUSIONS: The developed repository, HIS integrated, was useful for evaluating care pathways in STEMI patients, assessing correlation between DTB times and mortality and driving improvement of patient care delivery
.
S43
Computing in Cardiology 2012, Kraków, Poland 55

A Web-Based Survey for Expert Review of Monitor Alarms
Benedikt Baumgartner*, Kolja Rödel, Ulrich Schreiber and Alois Knoll
Motivation: Despite technological and methodological advances false alarms persist in patient monitoring systems. There is a lack of annotated alarm databases that would foster promising results on alarm rate reduction. Even more, alarm labels can be erroneous and rely on the knowledge of few domain experts. We present a web-based survey that allows access to a large number of reviewers and show first results.
Methods: We extracted triggered alarms from the MIMIC II database. 5 types of critical ECG alarms were included in the survey: asystole, bradycardia, tachycardia, ventricular tachycardia and ventricular fibrillation. ECG and blood pressure curves as well as related numerical data (heart rate, SpO2, mean, systolic and diastolic values) and patient age and sex were presented on a web page with the typical design of a patient monitor. Experts from the German Heart Center had to choose between 4 label categories: no intervention needed, intervention needed within 15min, immediate intervention and no comment. Each participant was asked to rate 100 alarm events leading to an overall survey time of approximately 20 minutes. 20 alarms had already been labeled by a second group of experts, 35 alarms were identical for all users and 5 monitor events were shown twice during the survey. Results: 30 experienced physicians (2-30 a.) participated in the survey with 23 reviewing more than 97% of the given alarms. On an individual level the average consistency of the ratings was 86% with experienced users being more consistent. Average confidence level of the ratings within the group of reviewers was 79%. Compared to the ratings of the second group a deviation of 31% was detected.
Conclusion: Access to domain experts on a large scale is useful to gain trustworthy alarm labels, to validate ratings by a larger group and to establish and extend annotated alarm databases
.
S43
56 Computing in Cardiology 2012, Kraków, Poland

Predicting Atrial Fibrillation from Intensive Care Unit Numerics Data
Sean McMillan*, Ilan Rubinfeld and Zeeshan Syed
University of Michigan Ann Arbor, United States
Aims: This study aimed to explore the feasibility of an intensive care
unit (ICU) numerics-based approach to stratify patients for atrial fibrillation (AF) using data that are available at the very start of an ICU admission.
Methods: A cohort of 1,531 ICU patients, from the Henry Ford Hospital in Detroit, each having a heart rate, respiratory rate, oxygen saturation and systolic, diastolic, and mean arterial blood pressures was analyzed for AF stratification. Patients with an ICU stay of fewer than 24 hours total or fewer than 24 hours before AF were excluded. Summaries representing the mean, standard deviation, range, max positive change, max negative change, and slope of numerics data for the first 8 hours of each ICU stay were combined in a feature vector. Patients were then stratified utilizing an area under receiver operating characteristic curve (AUROC)-maximizing support vector machine SVM.
Results: With the restrictions on the amount of data that was allowed to be missing, performance on a cohort of 1,531 ICU patients achieved an AUROC of 0.73 and a sensitivity of 71% in identifying patients who experienced AF based upon the first 8 hours following admission to the ICU.
Conclusions: Training an AUROC maximizing SVM on summary features for the first 8 hours of an ICU admission to predict subsequent AF yields promising results indicating this approach may have value in guiding monitoring and prophylaxis for AF
.
S43
Computing in Cardiology 2012, Kraków, Poland 57
Heart Sound Clustering using a Combination of Temporal, Spectral and Geometric Features
Fatemeh Safara, Shyamala Doraisamy*, Azreen Azman and Azrul Jantan
University Putra Malaysia Serdang, Malaysia
Aims: The purpose of this study is to address the problem of detecting
heart valve disorders via clustering the phonocardiogram (PCG) signals. The main objective is to evaluate a proposed combination of PCG features to distinguish four common heart murmurs. The added combination of geometric features has not been previously investigated in heart sound clustering.
Methods: a set of thirty six heart sounds was collected from online databases and training CDs. 8 normal heart sounds and four types of common murmurs- 11 aortic stenosis and 5 mitral stenosis, 7 aortic regurgitation and 5 mitral regurgitation- were included in the dataset. Heterogeneity of the PCG signals in the dataset was removed through frequency re-sampling, and then suitable finite response filter was applied to remove ambient noises. Spectral features based on short time Fourier transform and geometrical features based on discrete wavelet transform of each signal were extracted and stored in a vector. These feature vectors were stored as records in a single comma separated value file in order to be analyzed by a special data mining platform. Clustering of the feature vectors were performed using several data mining algorithms. Accuracy and entropy measures were calculated to quantify the clustering efficiency.
Results: first spectral and geometrical features were examined separately with five clustering techniques. Then combination of spectral and geometric features along with the temporal features was utilized for clustering with the same techniques. The best overall method based on the combined features was expectation maximization clustering technique with 91% average accuracy and 0.2 entropy.
Conclusions: Analysis shows that the proposed combination of temporal, spectral and geometric features exhibits a highly promising discriminatory power in phonocardiogram clustering. However the power of this feature set should be more elaborately examined in order to investigate its applicability in real cases
.
S43
58 Computing in Cardiology 2012, Kraków, Poland

Predictive Analytics for Coronary Artery Disease
Tanveer Syeda-Mahmood and Ritwik Kumar*
IBM Almaden Research Center
With the advent of electronic health records, it is now possible to use
data mining to automatically predict new risk factors for various diseases drawn from all available clinical measurements in addition to the standard risk factors such as age, smoking, diabetes, etc. In this paper, we explore the role of cardiac measurements derived from cardiac echo studies in the prediction of cardiac diseases, and in particular, coronary artery disease. Specifically, we studied a cohort of 1947 patients of which 947 patients were known to have coronary atherosclerosis of various kinds spanned by 19 ICD9 codes in the 414.0 range and the remaining were normal control group patients. In addition to standard risk factors such as age and weight, we collected cardiac echo measurements that were embedded in cardiac echo video images to form feature vectors for each of the patients. In particular, a total of 1630 feature vectors were formed of which 707 came from the patients with coronary atherosclerosis and 923 from the control group. Training with support vector machines allowed us to predict coronary artery disease for patients with an accuracy of 70% with only 60% of the data used for training. In addition, the strength of the support vectors were used to indicate the relative importance of the clinical measurements as predictors for coronary artery disease. Four measurements, specifically, Left-ventricular (LV) mass, LV volume, ejection fraction, and wall motion abnormalities that were predicted by the algorithm were also found to be validated from clinical findings in literature. The study indicated the importance of using clinical measurements in addition to standard risk factors in a data mining-driven approach to disease prediction, a new trend in healthcare informatics
.
S43
Computing in Cardiology 2012, Kraków, Poland 59

Biophysical modelling of Bundle Branch Reentry initi-ation and maintenance
Lydia Dux-Santoy *, Rafael Sebastian, Jose F. Rodriguez, Javier Saiz, Jose M. Ferrero
I3BH, Universitat Politècnica de València, València, Spain
Bundle branch reentry (BBR) is a complex mechanism of ventricular
tachycardia, which initiation and maintenance mechanisms are not well un-
derstood. We present a multi-scale functional model of the His bundle (HB)
and bundle branches coupled to a simplified representation of the septum to
study initiation and maintenance of BBR in-silico. Cellular electrophysiology
is modelled using the Stewart model for the HB and the Ten-Tusscher model
for the septum. Tissue electrical propagation is modelled by the monodomain
equation. A pathological region characterized by a lower IKr current and a
lower conductivity is included in the basal region of the left bundle branch
(LBB). The length of the pathological region is 1cm or 2cm depending on the
simulation. A smooth transitional region is used to couple normal and patho-
logical tissue. Conductivity in the HB is reduced to increase the effective path
length of the reentrant circuit. A unidirectional block was obtained within the
pathological region after stimulating the AV node with a basic cycle length
(BCL) of 400ms for a 40% IKr block. The length of the pathological region
affected the time at which the first block occurred, and was shorter for larger
pathological regions. The table summarizes the main results for each scenario
and for different levels of IKr blockage. After the block, the tissue was un-
paced for 10s to measure the natural frequency of the BBR circuit. A sudden
change in pacing frequency (BCL changes from 400 to 550ms) after the con-
duction block caused a BBR that perpetuated over time with a frequency that
increased from 1.92 up to 2.57Hz. We conclude that a pathological basal
region in a bundle branch, characterized by a larger APD and refractory peri-
od, can induce and perpetuate BBR when a short-to-long BCL change occurs
after the conduction block.
Table. BBR dependency with IKr blockage for a pathological region of 1
or 2cm long at BCL=400ms. NB: no block within the pathological region;
BB: bidirectional block within the pathological region.
IKr block
(%)
Time of first unidirectional block Steady state BBR frequency
1cm 2cm 1cm 2cm
20 NB NB NB NB
40 13600 ms 8400 ms 2.47 Hz 2.40 Hz
60 5200 ms 3600 ms 2.27 Hz BB
S44
60 Computing in Cardiology 2012, Kraków, Poland

Simulating Effects of Serum Potassium on ECG
S Kharche, T Stary, G Callisesi, A Bracci, S Severi
Universities of Liverpool and Bologna
Human ventricular 1D bidomain model was used to investigate the corre-lation between serum potassium ([K+]o) and ECG.
The human ventricular cell models by O’Hara et al. were adopted in this study. The cell models were used to quantify AP characteristics, AP duration (APD90) resti-tution, and alternans. They were incorporated into a heterogeneous 1D bi-domain strand model consisting of endocardial, mid-myocardial (M) and epicardial cell types where pseudo-ECG was computed. In multi-ple simulations, the effects of [K+]o on CV and ECG T wave were quantified. Further, heterogeneous inter-cellular coupling was simulated to elicit the augmented APD disper-sion in human ventricles observed experimen-tally. Inter-cellular gap junctional heterogene-ity was implemented by means of a step change function that reduced coupling in the M and epicardial regions of the strand. The effects of [K+]o on propagation behaviour in this heterogeneously coupled model were computed.
An increase of [K+]o reduced APD90. Dynamic APD90 restitution shows that reduced [K+]o caused an increase of cellular alternans amplitude. In 1D simulations, CV was reduced due to both increased and reduced [K+]o. T wave amplitude and absolute value of repolarization slope reduced with in-creasing [K+]o (see Figure). To simulate the experimentally observed large APD90 dispersion in ventricular preparations, heterogeneous inter-cellular gap junctional coupling was explored. It was found that the step change was effective when implemented in the M region of the strand. Alterations of [K+]o affected APD dispersion.
Altered [K+]o augmented APD alternans amplitude. It reduced ventricular CV. There is a close correlation between T wave features and [K+]o (see Fig-ure). Thus both, hypokalemia and hyperkalemia appear to be pro-arrythmogenic conditions. Gap junctional heterogeneity causes increase of APD dispersion and is also affected by [K+]o. This study confirms recent ex-perimental findings and warrants further studies in realistic 3D ventricular geometries.
Effects of [Ko]
+ on T wave A: amplitude and, B: and repolarization slope.
S44
Computing in Cardiology 2012, Kraków, Poland 61

Calibration of Human Cardiac Ion Current Models toPatch Clamp Measurement Data
Mathias Wilhelms, Jochen Schmid, Mathias J Krause, Niko Konrad,Julian Maier, Eberhard P Scholz, Vincent Heuveline, Olaf Dossel,Gunnar Seemann
Institute of Biomedical Engineering, Karlsruhe Institute of TechnologyKarlsruhe, Germany
Aims: Most of the models of cardiac electrophysiology describe physio-logic conditions in detail. However, other conditions, such as drug interactionsor mutations of ion channels are of interest for research. Therefore, the simu-lated ion currents have to be fitted to measured voltage or patch clamp data. Inthis work, three methods adjusting model parameters are investigated.
Methods: The rapid delayed potassium currents of two cardiac electrophys-iological models were adapted to whole-cell patch clamp data of the hERGchannel. In this work, three different methods for the model parametrizationwere compared: one based on Powell’s algorithm implemented in a modu-lar C++ framework and two optimization techniques realized in Matlab. Thelatter two approaches differed in solving the ordinary differential equationsdescribing the channel gating. In general, these equations are approximatednumerically in computational cardiology, which was used as the first method.The second option implemented in Matlab was the analytical solution. Sincethe transmembrane voltage is a piecewise constant function during the appliedclamp protocol, the exact solution can be computed for each voltage step.
-0.5
0
0.5
1
1.5
2
2.5
3
0 0.5 1 1.5 2 2.5 3 3.5 4
I Kr (µ
A)
time (ms)
I Kr (μA
)
time (ms)
Measured hERG current (dots) andfitted simulated current (solid line).
Results: All three methods werecompared regarding computing timeand quality of the fit using leastsquares. Ten different random startvectors were investigated. The mod-ular C++ framework was on average55 times slower than the numericalMatlab method, which took around841.8 times longer than the analyticalone. The quality of the fit was similarfor all analyzed methods.
Conclusion: The analytical meth-od grants a fast and reliable solutionfor the calibration of ion current models for applications with constant mem-brane voltage, as e.g. in case of voltage or patch clamp data.
S44
62 Computing in Cardiology 2012, Kraków, Poland

Increase in Late Sodium Current and Cellular Uncoupling Exacerbates Transmural Dispersion of Repolarization in Heart Failure
Juan F Gómez*, Lucia Romero, Javier Saiz, Luiz Belardinelli, Sridharan Rajamani and Beatriz Trenor
Universitat Politècnica de València Valencia, Spain
Introduction: Failing hearts undergo electrical and structural remodeling,
setting the stage for malignant arrhythmias. Specifically, failing hearts show enhanced late Na+ current (INaL) and cellular uncoupling. In the present study, the effects of these changes on transmural dispersion of repolarization (TDR), on action potential duration (APD) gradient and on the safety factor for conduction (SF) were simulated, setting the substrate for arrhythmogenesis.
Methods: The human ventricular action potential (AP) model formulated by O’Hara et al. was modified to simulate the electrical remodeling observed in human heart failure (HF). The electrical activity of 1D ventricular tissue was measured under several conditions, with enhanced and blocked INaL and homogeneous intercellular uncoupling. TDR and APD gradient were computed as the difference between maximum and minimum repolarization time (RT) and APD values, respectively, in the ventricular myocytes consisting of endocardial, M and epicardial cells. The SF was also computed following Romero et al. formulation, quantifying the source-sink relationship as an indicator for safety in conduction.
Results: Computer simulations showed that homogeneous electrical remodeling of failing ventricular tissue increased TDR in 169% from 29.2 ms under normal conditions (NC) to 49.3 ms and APD gradient in 136%. Increase in INaL (x2) and homogeneous uncoupling (Rx2) further increased TDR 274% and APD gradient 204% with respect to NC. 90% block of INaL reduced TDR and APD gradient values in all the conditions simulated. Finally, HF remodeling provoked a reduction of SF from 1.41 in NC to 1.36, indicating a less safe conduction under HF conditions.
Conclusions: The results of this study uncovers the importance of INaL and cellular uncoupling in modulating TDR, APD gradient and conduction safety in HF. INaL can be considered as a pharmacological target in HF to prevent arrhythmias
.
S44
Computing in Cardiology 2012, Kraków, Poland 63

Modeling the Mechanism of [Na+]i Elevation in Heart Failure by A Canine Ventricular Cell Model
Yunliang Zang*, Dongdong Deng, Heqing Zhan, Mingqi Qian and Ling Xia
Zhejiang University
Numerous studies have found the phenomenon of Na+ overload in
cardiac myocytes in heart failure (HF), which may influence cardiac action potential (AP) and intracellular calcium cycling to induce cardiac arrhythmias. As one of the most important regulators in the cardiac myocytes, Ca2+/Calmodulin-dependent protein kinase II (CaMKII), which could alter Na+ channel gating, was found to be over-expressed in HF. Thus, Na+ overload may be related with CaMKII over-expression (COE). For the purpose of this study, we developed a new canine epicardial cell model based on the framework of published Hund-Rudy dynamic (HRd) model. The effects of CaMKII regulation on fast Na+ current (INa) and late Na+ current (INaL) were incorporated according to the recent experimental data. COE shifted INa availability to the hyperpolarizing direction and slowed its recovery from inactivation. For the part of INaL, it was underestimated in the past experiments and simulations. We reformulated it according to the recent experimental data and validated it by clamping the intracellular Ca2+ concentrations to 1 μM. In the simulation, the magnitude of INaL was elevated and its decay was slowed by COE in HF. The simulation results suggested that the regulation role of CaMKII on INaL was mainly responsible for the elevation of [Na+]i. The effect of COE on INa had a function of lowering [Na+]i in fact. However, it could not offset the trend of Na+ upregulation by enhanced INaL. The magnitude of [Na+]i elevation was smaller than the values from experimental observations. We speculate that other regulatory pathways such as lowered Na+/K+ pump (INaK ) may happen in HF. Keywords: Na+ overload; CaMKII; Heart failur
e
S44
64 Computing in Cardiology 2012, Kraków, Poland

A 2-State Markov Model of IKACh based on a MembraneVoltage Dependent Muscarinic M2 Receptor Approach
Gunnar Seemann, Alexander KE Kurz, Olaf Dossel, MartinTristani-Firouzi, Frank B Sachse
Institute of Biomedical Engineering, Karlsruhe Institute of TechnologyKarlsruhe, Germany
Aims: The heart rate is mediated by the G protein-coupled muscarinic re-ceptor (M2R), which activates the acetylcholine (ACh)-dependent K+ current(IKACh). Here, a novel model for IKACh gating is presented based on therecent findings [1] suggesting that M2R agonist binding is voltage-sensitive.
10 2 10 1 100 1010
0.1
0.2
0.3
time (s)
OP1
OP2
OP3
OP4
Fig. 5.2. Exemplary solution of equation 5.1 for different exponents of the open propability OP: OP 1
OP 2, OP 3, OP 4 with f = 10, b = 1, OP (t = 0) = 0, and [Gβγ ] linearly increasing from 0 to 1.
5.2 The Combined Model
The linking element between the receptor model and the channel model is [Gβγ ]. This
concentration is the output of the receptor model whereas it is the input of the channel
model. [Gβγ ] is the result of the addition of the two ligand-binded state B1 and B2 of the
four-state receptor model (Fig. 5.3).
The independence of the channel model from the initial conditions to produce a sigmoidal
curve is important because the initial conditions change for any value of the time vector,
generated by the ode15s solver according to the necessary interpolation points. Because of
these continuously changing initial conditions, the simulation time of the combined model
takes much longer than for the receptor model. New simulations are needed, since the
Fig. 5.3. Combined model for IKACh: four-state receptor model whose output is the input for the two-statechannel model.
4-state Markov model of M2R(left) combined with 2-stateMarkov model of IKACh (right).
Methods: Moreno-Galindo et al.[1] reported that M2Rs are intrinsi-cally voltage-sensitive and that AChand pilocarpine (Pilo) manifest oppo-site voltage-dependent IKACh mod-ulation. A 4-state Markov modelof M2R reconstructing the voltage-dependent change in agonist affin-ity was proposed [1]. It comprised4 states with voltage and ligand-dependent rate coefficients. (Figure, left). States B1+B2 represent the fractionof dissociated Gβγ subunits that open IKACh channels.
Results: A 2-state Markov model of IKACh gating purely dependent on theGβγ concentration is proposed (Figure, right). IKACh is modeled based on thedescription of Zhang et al. [3]. Measurement data [1] are used to parametrizethe combined M2R and IKACh model for both ACh and Pilo using a mini-mization procedure [2]. The gating model has a linear Gβγ dependent forwardand a constant backward rate. The best fit to measured open probability wasachieved using OP 4 as the channel has four independent Gβγ binding subunits.For ACh and Pilo, optimal values of model parameters are found reconstructingthe measured opposite voltage-dependent change in agonist affinity.
Conclusions: The combined model is able to reconstruct the data of [1] re-garding the agonist and voltage-dependent properties of the M2R-IKACh chan-nel complex. In future studies, this channel will be integrated in a sinus nodemodel [3] to investigate the effect of the channel properties on heart rate.[1] Moreno-Galindo et al. 2011 JP 589(7);1755-1767[2] Abbruzzese et al. 2010 J Gen Physiol 136;203-224[3] Zhang et al. 2000 Am J Physiol 279;397–421
S44
Computing in Cardiology 2012, Kraków, Poland 65

Predicting Mortality of Patients in Intensive Care: ThePhysioNet/Computing in Cardiology Challenge 2012
Ikaro Silva, George B Moody, Daniel J Scott, Leo A Celi, Roger G Mark
Massachusetts Institute of TechnologyCambridge, MA, USA
Acuity scores such as APACHE, SAPS, MPM, and SOFA are widely used toaccount for population differences in studies aiming to compare how medica-tions, care guidelines, surgery, and other interventions impact mortality in In-tensive Care Unit (ICU) patients. By contrast, the focus of the PhysioNet/CinCChallenge 2012 is to develop methods for patient-specific prediction of in-hospital mortality.
The data used for the challenge consist of up to 41 general descriptors (age,gender, height, weight) and time series (hourly measurements of vital signsand laboratory test results) from the first 48 hours of the first available ICUstay of each of 12,000 patients chosen at random from a larger set. Patientsunder age 16 and those whose initial ICU stays were shorter than 48 hours(approximately the median) were excluded; there were no other exclusion cri-teria. We randomly divided the data into three sets (A, B, and C) of 4,000
0.0 0.1 0.2 0.3 0.4 0.5 0.6
Event 1 score
0
250
500
750
1000
Eve
nt 2
sco
re
SAPS-1
Results of 88 Phase 1 entries from39 participants (best at lower right).
patients each. Challenge participantswere provided data and outcomes forset A, and they submitted algorithmsto estimate risk and predict survivalor death for individual subjects. InPhase 1, submitted algorithms weretested using set B, which participantswere allowed to study although out-comes were withheld. Each entrywas scored in event 1 according toits utility for prediction (the lower ofsensitivity and positive predictivity),and in event 2 according to the accu-racy and utility of its risk estimates(using a range-normalized Hosmer-Lemeshow statistic). A baseline algorithm(SAPS-1) scored 0.316 in event 1 and 66.6 in event 2. Most participants sub-mitted Phase 1 entries that outperformed the baseline algorithm; scores wereas high as 0.577 in event 1 and as low as 13.9 in event 2. Participants maycontinue to refine their methods during Phase 2, which culminates in a blindedtest of the most successful methods using set C.
S51
66 Computing in Cardiology 2012, Kraków, Poland

Patient-specific Predictions in the ICU using a Bayesian Ensemble
Alistair Johnson*, Nic Dunkley, Louis Mayaud, Athanasios Tsanas, Andrew Kramer and Gari Clifford
Oxford University Oxford, United Kingdom
Introduction: An intensive care unit mortality prediction model for the
PhysioNet/Computing in Cardiology Challenge 2012 using a novel powerful Bayesian ensemble learning algorithm is described.
Methods: Data pre-processing was performed using domain knowledge to remove artefacts such as order of magnitude errors and unit conversion errors. A range of diverse features was extracted from the data set including the minimum, maximum, median, first and last values for each time series. A new Bayesian ensemble scheme comprising of 500 weak learners was then developed to classify the data samples. Each weak learner was a decision tree of depth two, which randomly assigned an intercept and gradient to a single feature. The parameters of the ensemble learner were determined using a custom MCMC sampler.
Results: The model was trained using all the data samples in the training set, and its evaluation on an unseen new dataset available to the organisers of the competition led to scores of 0.58 for event 1 and 17 for event 2. This corresponds to a minimum sensitivity and positive predictive value of 0.58 across all probability thresholds, and a range normalized Hosmer-Lemeshow of 17. Conclusion: The proposed prediction model performs favourably on both the provided and hidden data sets (set A and set B), and has the potential to be used effectively for patient-specific predictions
.
S51
Computing in Cardiology 2012, Kraków, Poland 67

An Imputation-Enhanced Algorithm for ICU Mortality Prediction
Natalia M Arzeno*, Joyce C Ho, Cheng H Lee
University of Texas at Austin
Background: ICU patients are among the most vulnerable to adverse
events such as in-hospital mortality; therefore, more accurate systems for identifying at-risk patients are needed for improving care. However, development of such systems is complicated by various factors, including the diversity and availability of data collected over the course of each ICU stay. The objective of the 2012 PhysioNet/Computing in Cardiology Challenge is to develop better algorithms for predicting in-hospital mortality, using data collected in the first 48 hours of a patient's ICU stay.
Methods: We constructed a set of predictive features for each ICU patient using general descriptors (gender, age at admission, and height), the last observed value for each of 37 time-varying variables, the total number of observations of each variable, and the number of observations of each variable in hours 47-48 of the stay. Since observation of every variable was not indicated in most cases, missing data were a common problem. Therefore, we imputed missing values using the mean value of the patients' gender and age group. After imputing the missing data, we trained an un-regularized logistic regression using the feature set described above. This model was evaluated using two metrics: the first measured accuracy as the minimum of sensitivity and positive predictive value (Event 1), and the second measured model calibration based on the Hosmer-Lemeshow H statistic (Event 2).
Results: This model obtained an Event 1 score of 0.500 and an Event 2 score of 14.141 on training set A, significantly outperforming the corresponding SAPS-I scores of 0.297 and 68.393. On test set B, this model obtained similar scores of 0.497 and 13.932 for Events 1 and 2, respectively. Thus, we demonstrate that our imputation-enhanced algorithm provides better estimates of in-hospital mortality risk than existing, widely-used methods
.
S51
68 Computing in Cardiology 2012, Kraków, Poland

PhysioNet 2012 Challenge: Predicting Mortality of ICU Patients using a Cascaded SVM-GLM Paradigm
Luca Citi* and Riccardo Barbieri
MGH / Harvard Medical School , United States
The focus of the PhysioNet/CinC Challenge 2012 is to develop methods
for patient-specific prediction of in-hospital mortality using general descriptors recorded at the time of admission to the ICU (age, gender, weight, and height) and up to 37 time-series variables (for example, the dyastolic/mean/systolic arterial blood pressure and lab tests) that may be observed (never, once, or more than once) during the first 48 hours after admission. In response to the challenge we developed an algorithm based on Support Vector Machines (SVM) that uses both general descriptors and time-series variables to predict the in-hospital death (IHD) of ICU patients in Event 1, and provide a probability estimate of IHD in Event 2. As first step, all the inputs were rescaled in order to have median 0 and inter-quartile range 1.349 in set A, i.e., the same as a standard normal distribution. Then, for each subject the time-series variables were aggregated in order to find the minimum, the mean and the maximum value within the first 24 hours and within the following second 24 hours. Both aggregated variables and general descriptors were used as features of quadratic SVM classifiers to predict individual IHD. Six SVMs were trained using, for each one, all the positive examples plus, in turn, one sixth of the negative examples in the training set. Finally, a Generalized Linear Model with probit link was used to predict the probability of IHD for Event 2 using the output of the six SVMs as regressors. A positive binary prediction of IHD for Event 1 was made when the probability estimate was higher than an optimized threshold. Our entry achieved an Event 1 score equal to 0.499 and an Event 2 score of 17.05. These results represent a significant improvement over the reference example of the SAP (Simplified Acute Physiology) score
.
S51
Computing in Cardiology 2012, Kraków, Poland 69

A Neural Network Model for Mortality Prediction in ICU
Henian Xia, Adam Petrie and Xiaopeng Zhao*
University of Tennessee
Objective: Scoring the severity of illness of ICU patients can provide
evaluation of a patient’s situation and thus help doctors make decisions on what treatment to take. The scores may allow doctors to compare different treatment methods. This study aimed to develop an artificial neural network model for patient-specific prediction of in-hospital mortality. Method: Data from PhysioNet Challenge 2012 is used. It consists of 12,000 ICU records. The records were collected during the first 48 hours after admission to the ICU and they include up to 41 variables. The 12,000 records were divided to a training set, a test set and a validation set, each of which contains 4000 records. Outcomes are provided for the training set. A neural network model was developed to predict the risk of in-hospital mortality using various physiological measurements from the ICU. Results: Two events are defined to evaluate the performance of the proposed method by PhysioNet/Computing in Cardiology Challenge 2012. The first event defines a score which is the minimum of the sensitivity (the fraction of in-hospital deaths that are predicted) and the positive predictivity (the fraction of correct predictions of in-hospital deaths). The second event defines a score base on a modification of the Hosmer-Lemeshow statistic and the lower this score, the better the algorithm. We partitioned the training data set into three subsets, respectively for training, validation and testing. Our model yielded an event 1 score 0.461165 and an event 2 score 59.7622 on the test data set
.
S51
70 Computing in Cardiology 2012, Kraków, Poland

Using Support Vector Machine Classification with Temporal Features to Predict In-Hospital Mortality
Chih-Chun Chia*, Gyemin Lee, Zahi Karam, Alexander Van Esbroeck, Sean McMillan and Zeeshan Syed
University of Michigan Ann Arbor, United States
In this study, we present a novel approach to predict in-hospital mortality
for the PhysioNet/CinC Challenge 2012 which is motivated by the need for models that can form the objective basis of comparing the efficacy of medications and surgeries for ICU care. We make use of data from 12,000 ICU stays lasting at least 48 hours and where as many as 41 variables (many of which are time-series) are available to evaluate patient state. While conventional approaches (e.g., acute scores such as APACHE and SAPS-II) can be applied to our problem formulation, these methods do not leverage the benefits of temporal information and are not ideally suited for high-dimensional data. Instead, we explore the use of a 1.5-class SVM algorithm, which we have developed in earlier work to model clinical complications that occur with low frequencies. Building off this basic approach, we incorporate periodogram- and trace segmentation-based features capturing the temporal structure of irregularly sampled time-series for model development and validation. When evaluated in a preliminary study on set B data, our approach obtained an event-1 score of 0.44 for the minimum of sensitivity and positive productivity, and resulted in an event-2 score of 78.09 based on the Hosmer-Lemeshow H statistic
.
S51
Computing in Cardiology 2012, Kraków, Poland 71
Effect of Posture on the Cardiorespiratory System using Canonical Correlation Analysis
Pieter Joosen, Wouter Aerts, Carolina Varon, Devy Widjaja*, Steven Vandeput, Andre E Aubert and Sabine Van Huffel
KU Leuven Leuven, Belgium
This research investigates the influence of body posture on
cardiorespiratory regulation. More specifically, the effect of blood pressure and respiration on the heart rate is studied by means of canonical correlation analysis (CCA). ECG and blood pressure were recorded on 6 healthy volunteers in supine, sitting and standing position during 4 periods of 120s. For each period, the tachogram, the systogram (subsequent systolic peaks from the blood pressure), the diastogram (subsequent diastolic peaks from the blood pressure) and an ECG-derived respiratory signal were computed. CCA was applied on this data set to investigate the influence of the systogram, diastogram and respiration (independent group) on the tachogram (dependent group). The correlation coefficient between the tachogram and the independent canonical variate was found to be significantly higher for standing position than for supine and sitting (p < 0.05). This means that the amount of shared variance between the dependent and independent canonical variates is higher in standing position than in other postures. The canonical cross loadings of the systogram show a positive influence on the tachogram for all three postures. An increase in blood pressure will thus result in an increase in the tachogram, which is in correspondence with the baroreceptor reflexes. This cross loading is larger (p < 0.05) in standing position compared to supine and sitting, meaning that the relation between systogram and tachogram is stronger in standing position. The canonical cross loadings of respiration are negative for all postures, which represents the Respiratory Sinus Arrhythmia (RSA) and is greater (p < 0.05) in absolute value for sitting than for supine. Application of CCA thus shows an increased importance of the baroreflex feedback loop in standing position than in other postures and stronger RSA in sitting against supine position
.
S52
72 Computing in Cardiology 2012, Kraków, Poland

Tetravariate point-process model for the continuous characterization of cardiovascular-respiratory dynamics during passive postural changes
Michele Orini*, Gaetano Valenza, Luca Citi and Riccardo Barbieri
In this study, we present a new methodology for time-varying characterization of cardiovascular (CV) control, which includes RR interval (RRI), systolic arterial pressure (SAP), respiration (RSP) and pulse transit time (PTT). Within a multivariate model, CV dynamics are represented as stochastic point processes whose means has a tetravariate autoregressive structure. Such framework provides the simultaneous time-frequency assessment of: (i) both arms of the SAP-RRI loop, along baroreflex and mechanical feedforward pathways; (ii) Respiratory sinus arrhythmia (RSA), through the direct evaluation of the interactions between RSP and the RRI; (iii) the coupling between cardio-respiratory activity and vascular tone through quantification of the interactions between PTT and the other CV variables. We validated the model by characterizing CV control in 16 healthy subjects during a tilt table test, and we were able to confirm a satisfactory model's goodness-of-fit. We further estimated transfer function gains, instantaneous powers and directed coherences, and observed that RESP strongly drove respiratory-related oscillations in all the other CV variables, and that PTT depended on RRI dynamics rather than blood pressure variations. During head-up tilt, baroreflex sensitivity and RSA decreased, while the gain from RRI to SAP increased, thus confirming previous physiological characterizations
.
S52
Computing in Cardiology 2012, Kraków, Poland 73

Multiscale Principal Component Analysis to Separate Respiratory Influences from the Tachogram: Application to Stress Monitoring
Devy Widjaja*, Elke Vlemincx and Sabine Van Huffel
KU Leuven Leuven, Belgium
Aim: The effects of mental stress on heart rate variability (HRV) have
been studied widely. However, the influence of respiration on short-term HRV is often ignored. Although stress affects respiration as well, breathing is under voluntary control and might not always be a good indicator of stress. Therefore, this study aims at separating the respiratory component of the tachogram from the rest during stress monitoring using multiscale principal component analysis (MSPCA).
Methods: MSPCA is proposed as a technique to estimate the component of the tachogram that is directly related to respiration. Removal of this respiratory component from the original tachogram results in the residual tachogram. This technique is applied on data of 40 subjects during a baseline condition, a mental stress task (MT) and an attention task (AT). The spectral components (LFpower, HFpower and LF/HF) of the tachograms during each condition are computed.
Results: The results based on the original tachogram show that LFpower and HFpower are significantly higher during baseline than during MT and AT (p < 0.001). These findings are also observed in the residual tachogram. In addition, the HFpower of the respiratory component is significantly lower during stress (p = 0.007), indicating that stress also influences the breathing pattern, which, in turn, affects the tachogram. The differences in HFpower in the original tachogram can, thus, be attributed to stress factors that influence the tachogram via the respiration, and stress factors that directly influence the functioning of the autonomic nervous system. In all tachograms, LF/HF shows no discriminative power between the different conditions. Conclusion: This study introduces MSPCA as a technique to take the influence of respiration in HRV analyses into account during stress monitoring. The results show that separation of the respiratory component of the tachogram can be avaluable tool to interpret the results
.
S52
74 Computing in Cardiology 2012, Kraków, Poland

A Characteristic Ridge in Entropy Surfaces of Cardiovascular Time Series Estimated by the Norm Component Matrix Algorithm
S Zurek1, P Castiglioni2, M Kosmider1, G Parati3, P Guzik4, J Piskorski1
1Institute of Physics, University of Zielona Góra, Zielona Góra, Poland2Biomedical Technology Dept, Don Gnocchi Foundation, Milan, Italy3Istituto Auxologico Italiano, Milan, Italy4Department of Cardiology - Intensive Therapy and Internal Diseases, Poznan University of Medical Sciences, Poznań, Poland
Introduction: Sample entropy (SampEn) is a popular complexity measure in HRV analysis. SampEn is estimated by fixing the values of the embedding dimension "m" and distance threshold "r" and traditionally SampEn is calculated with m=2 and r=0.2 times the standard deviation of the series. Attempts to extend the estimates to different (m,r) pairs are hampered by the high computational burden of the traditional algorithm. We recently proposed an extremely fast Norm Component Matrix (NCM) algorithm for SampEn calculation which allows analyzing whole ranges of (m,r) values leading to entropy surfaces. This paper is the first attempt to calculate these surfaces by NCM and to describe their properties for both synthetic and physiological time series.Methods: We produce SampEn(m,r)surfaces by NCM with m between 2 and 10 and 0.001<r=<5 for synthetic time series (the logistic equation and the Lorenz system) and cardiovascular beat-to-beat series (RR intervals from Holter recordings; pulse interval PI, systolic and diastolic blood pressure, SBP and DBP, from invasive BP recordings). 24-H Holter recordings were obtained from 20 healthy subjects; PI, SBP and DBP series were obtained from one normotensive subject continuously monitored for 5 hours both at night-time and day-time.Results: Entropy surfaces for cardiovascular series have a distinct shape with a characteristic ridge, clearly visible in most of the recordings. This ridge is absent from synthetic time series. The shape of the ridge appears to change from night to day. The SampEn(m,r) ridge has not been previously described and is absent in synthetic series. Ridge analysis may lead to new insights into cardiovascular complexity and may extend our understanding of sample entropy in physiological time series.
Fig. 1: Entropy surface with the entropy ridge marked in blue for a 5hour long invasive SBP recording taken at night from a normotensive subject.
S52
Computing in Cardiology 2012, Kraków, Poland 75

Low Complexity Spectral Analysis of Heart-Rate-Variability through a Wavelet based FFT
Georgios Karakonstantis*, Aviinaash Sankaranaryanan and Andreas Burg
EPFL Lausanne, Switzerland
Spectral analysis of heart-rate-variability (HRV) has become a
ubiquitous tool in the diagnosis, prediction and monitoring of various cardiac malfunctions by evaluating the total high/low-frequency powers (HFP/LFP) of heart spectra. However, the considerable complexity of traditional spectral analysis methods that require re-sampling and interpolation as well as of the most suitable method for unevenly spaced signals known as Lomb-periodogram prevented low-power realizations hindering the widespread use in real-time health monitoring systems. Recently, Fast-Lomb has offered an alternative, less-complex method by approximating the trigonometric-sums required for evaluating the HFP/LFP by using Fast-Fourier-Transform. However, there is still room for algorithmic improvements by utilizing the nature of processed heartbeats (RR-intervals) and the resilience of such applications to noisy-data in order to introduce approximations and improve the complexity and battery lifetime of corresponding systems. Classical pruning methods may help in reducing the complexity of power-hungry FFT, but they do not work well when the few non-zero inputs are randomly located as in the case of RR-intervals. To circumvent this issue, we propose to implement the core-kernel FFT using Wavelets that are the unconditional basis for many signal-spaces and have sparse coefficients. Interestingly, by experimenting with numerous cardiac samples from PhysioBank we observed that the first stage (DWT-decomposition) of our algorithm makes this type of signals sparse separating them into significant (high-values) and less-significant (low-values) which can ultimately be dropped. In addition since many of the wavelet twiddle-factors have inherently small magnitudes, further approximations can be made by pruning the small factors, in a second stage. The evaluation of our algorithm on an embedded-processor simulator (MPARM) with various sinus-arrhythmia samples indicated that it is possible to reduce clock-cycles on average by 40% and apply Dynamic-Voltage-Frequency-Scaling under iso-throughput with 75% power savings and only 3% error in LFP/HFP ratio compared to conventional-FFT based HRV system
.
S52
76 Computing in Cardiology 2012, Kraków, Poland

A Novel Model of the Action Potential of Ventricular-like Human Induced Pluripote
Michelangelo Paci*, Jari Hyttinen and Stefano Severi
Human pluripotent induced stem cells (hiPSCs) represent nowadays a promising opportunity for regenerative medicine and a valuable in-vitro model for drug development and testing, especially for patient-specific drugs developed on hiPSCs carrying the same mutations of the original patient. The use of in-silico models can integrate experimental practice being used as simulation platforms, providing new hints and helping defining new experiments and hypothesis. In this work we briefly present our new model of ventricular-like hiPSC-derived cardiomyocyte (hiPSC-CM) developed using recently published data. The model aims to provide a detailed description of the hiPSC-CM electrophysiology The experimental data describe the action potential (AP) shape as well as the Na+ current (INa), the L-type Ca++ current (ICaL), the hyperpolarization-activated cyclic nucleotide-gated current (If) and K+ currents such as the transient outward (Ito), the inward rectifying (IK1), and the delayed rectifying rapid (IKr) and slow (IKs) currents. Since currents were recorded from ensembles of atrial- and ventricular-like hiPSC-CMs, after finding suitable equations describing the original data, an additional tuning step was necessary to take into account differences between the ventricular and the atrial phenotypes reported in literature. Our simulations reproduced: (i) the spontaneous firing activity (rate=36.42 bpm); (ii) AP features typical of the ventricular-like phenotype such as maximum diastolic potential (MDP=-76.67 mV), AP duration (APD=404.05 ms) and amplitude (APA=104.80 mV) and maximum upstroke velocity (Vmax=27.76 V/s); (iii) effects of prototypical current blockers such as tetrodotoxin (upstroke shift, shorter Vmax), nifedipine (shorter APD and APA), E4031 (longer APD and APA) and 3R4S-Chromanol 293B (no significant effects), assessed during recordings on stimulated (rate=1 Hz) ventricular-like hiPSC-CMs. In conclusion our new hiPSC-CM model represents a detailed and validated description of the electrophysiology of ventricular-like hiPSC-CM. It could find application to further studies on patient- and disease-specific ion channels mutations in hiPS-CMs such as long QT syndromes
.
S53
Computing in Cardiology 2012, Kraków, Poland 77
Empirical modeling of the sodium channel inhibition caused by drugs
Aleksander Mendyk*, Barbara Wiśniowska, Kamil Fijorek, Anna Glinka, Miłosz Polak and Sebastian Polak
Department of Pharmaceutical Technology and Biopharmaceutics Kraków, Poland
Aims: The study was aimed to create predictive model taking into
account chemical structure of the particular compound and its ability to block the sodium channel in the cell membrane.
Methods: The data was based on the literature search. Final set contained 108 records describing 38 drugs. Initial number of inputs was 110. Drugs chemical structures were structurally optimized with use of Marvin Beans “molconvert” tool (ChemAxon, www.chemaxon.com). Resulting *.sdf files were the subject to descriptor calculations by “cxcalc” tool with selected 41 plugins. As modeling tools, multi-layer perceptrons (MLPs) and neuro-fuzzy ANNs (NFs) Mamdani type were trained with use of back-propagation algorithm with momentum, delta-bar-delta and jog-of-weights modifications. Various activation functions were tested: hyperbolic tangent, logarithmic, logistic and linear. MLPs architectures were varied from 1 to 6 hidden layers and up to 200 nodes in each layer. Sensitivity analysis was performed in order to reduce initial number of inputs to the crucial variables set. The generalization error estimated by means of enhanced 10-fold cross validation (10-cv), where whole drugs information was excluded from test sets in order to simulate the most difficult task for a model to perform: to predict unknown structure behavior. Ensemble ANNs systems were applied and combined by simple average of their outputs.
Results: Sensitivity analysis allowed to reduce inputs number to 20. The best predictive system found was an ensemble containing 3 MLP ANNs – two of them were complicated 4-layered ANNs based on tanh and logarithmic functions. The overall 10-cv generalization error of the ensemble was RMSE = 0.68, NRMSE = 20.7% and R2 = 0.35.
Conclusions: Regarding harsh testing conditions and the empirical nature of the models, their predictability was found to be acceptable, thus the above models are to be included into the ToxComp in silico carditoxicity prediction software (www.tox-portal.net)
.
S53
78 Computing in Cardiology 2012, Kraków, Poland

Nonlinearities Due to Refractoriness in SR Ca Release
Angelina Peñaranda*, Enric Alvarez-Lacalle, Inma R Cantalapiedra, Leif Hove-Madsen and Blas Echebarria
Universitat Politècnica de Catalunya Barcelona, Spain
Cardiac alternans is a well-known risk factor for cardiac arrhythmias.
This rhythm can be produced by beat-to-beat changes in the intracellular calcium response, but the originating mechanism is not well understood. The prevailing explanation is based on a steep relation between sarcoplasmic reticulum (SR) load and calcium release that makes regular calcium cycling unstable at high SR calcium load and/or fast pacing rates. However, some reports find cytosolic calcium alternans without appreciable change in SR calcium content, contradicting an obligatory role for oscillation of SR calcium load in cytosolic calcium alternans. This suggests that other mechanisms, such as SR-Ca release refractoriness, can play a role in cytosolic calcium alternans. Refractoriness could be due to a slow refilling of the SR, i.e. a slow SERCA pump, or to a slow recovery of the ryanodine receptor (RyR2). In this work, we use a numerical ventricular myocyte model to study the SR-Ca fractional release as a function of the activation, inactivation and recovery from inactivation of the RyR2. We show that it does not only depend on the SR-Ca load but that, under certain conditions, it can also depend strongly on the number of RyR2 ready to open, which in turn depends on the recovery of the RyR2 that have been inactivated. This gives rise to a steep nonlinear relation, so that a small change in the number of recovered RyR2 produces big changes in release. Then, alternans appears as an instability when the recovery time increases. This leads to an alternation mechanism that does not depend mainly on SR-Ca load but on a refractoriness of the SR-Ca release related with the lack of recovery from inactivation after one beat. A conclusion of this study is that RyR2 refractoriness can be the cause of alternans even when alternation in SR-Ca load is present
.
S53
Computing in Cardiology 2012, Kraków, Poland 79
Prediction of Potential Unstable Electrical Activity during Embryonic Development of Rodent Ventricular Myocyte
Chikako Okubo*, Hitomi Sano, Yasuhiro Naito and Masaru Tomita
Keio University Fujisawa, Japan
Aims: We aimed to identify potential unstable activities between early
embryonic (EE) and late embryonic (LE) stages of rodent ventricular myocytes, as well as the mechanism behind such activities and how membrane cease spontaneous firing of action potential (AP) and become passive cells which contract with external stimulus in order to overview the whole program of the heart development.
Methods: We have previously shown that developmental changes in APs are well represented by changing relative activities of the ionic currents, pumps, exchangers, and sarcoplasmic reticulum (SR) Ca(2+) kinetics, with common sets of mathematical equations, on the basis of the Kyoto model and the Luo-Rudy model. In this study, the relative activities were switched between EE and LE stages which yield 512 combinations, and profiles of membrane potentials and sarcomere lengths were observed.
Results: Out of these 512 combinations in Kyoto model, 208 combinations were predicted as quiescent cells with no spontaneous activity. Regular spontaneous APs were observed in 160 combinations, and 144 were predicted to be potentially unstable; combinations of relative activities of Na(+) current (INa), hyperpolarization-activated cation current (Iha), inward rectifier current (IK1), L-type Ca(2+) current (ICaL), sustained inward current (Ist) between EE and LE values were responsible for the predicted unstable patterns. In addition, external stimulus was applied to 208 quiescent models, and 56 models failed to make stronger shortening force at 2.5 Hz than at 1.0 Hz, when INa was not increased.
Conclusion: Our simulation results suggest that the sequential switches of INa, Iha, and IK1, in which INa increases by ten-fold at first, followed by disappearance of Iha and increase in IK1 enable the developing embryonic ventricular cells to avoid potential unstable electrical activities
.
S53
80 Computing in Cardiology 2012, Kraków, Poland

Differences in Intracardiac Signals on a RealisticCatheter Geometry using Mono- and Bidomain Models
Matthias W Keller, Gunnar Seemann, Olaf Dossel
Institute of Biomedical Engineering, Karlsruhe Institute of TechnologyKarlsruhe, Germany
Aims: In-silico studied intracardiac electrograms in most cases are forwardcalculations from solutions of the monodomain (MD) equations. Influences ofextracellular space on excitation spread are not taken into account. This studycompared in vivo data to signals measured by a virtual intracardiac geometri-cally accurate catheter using a MD and a bidomain (BD) approach.
0 0.01 0.02 0.03 0.04 0.05−1.5
−1
−0.5
0
0.5
1
time (s)
norm
aliz
ed A
mpl
itude
MD distMD proxBD distBD proxin vivo distin vivo prox
UE in silico and in vivo
Methods: A 3D cubic voxel basedsetup containing a rectangular piece ofmyocardium (40 mm x 30 mm x 4 mm,resolution: 0.2 mm) and a geometricalrepresentation of a 7F catheter was com-posed. This catheter with two highly con-ducting electrodes (7e3 S/m) separatedby insulating material was positioned per-pendicular with respect to the tissue sur-face. Extracellular potentials (EP) werecalculated using two different methodsbased on the Courtemanche model of an atrial cell. The MD equations weresolved to receive intracellular currents. These served as an input for forwardcalculations of EP. In the other case, EP were calculated directly by solving theBD equations for intra- and extracellular space. For comparison, electrogramsfor each approach were normalized to the amplitude of the positive deflectionof the distal unipolar electrogram (UE). Catheter signals were compared to in-vivo data.
Results: UE from both approaches showed a biphasic morphology with apositive deflection followed by a negative one. Amplitude ratio of proximaland distal UE was 0.95 for MD and 0.5 for BD, whereas for in-vivo data a ratioof 0.35 is reported. Resulting bipolar signals reached 12% (MD) and 57% (BD)of the distal UE amplitude compared to 56% for in-vivo data.
Discussion: Catheter signals received from BD simulations of EP closelymatched in-vivo data in terms of amplitude, shape and temporal developmentand should therefore be preferred for catheter simulations on a detailed scale.
S53
Computing in Cardiology 2012, Kraków, Poland 81

Improving the accuracy of forward computations: dif-ferent methods to implement the propagation of the depolarization wave front Inge H. Gerrits, Adriaan van Oosterom, Thom F. Oostendorp
Radboud University Nijmegen Medical Centre, Donders Institute for Brain, Cognition and Behaviour, Nijmegen, the Netherlands
This study addressed the problem of jitter in the body surface poten-
tials (BSPs) introduced by discrete nature of the cardiac source model. In
cardiac source imaging, switching on entire source elements at the time of
their assigned depolarization results in physiologically unrealistic jitter in the
BSPs. This study introduces and compares two methods that avoid this jitter
without the need of filtering.
A set of depolarization times, estimated by inverse computations us-
ing the equivalent double-layer source model from BSPs, were used in three
different methods to compute BSPs forwardly from these depolarization
times. The first one represents the traditional fast on/off method in which
triangular elements are switched on as a whole. A second method was devel-
oped in which only parts of elements are activated following the propagation
of the depolarization wave front over time. This method results in a more
physiologically realistic description of cardiac source activity and is referred
to as the gold standard. Since this method is computationally costly a third
method, the smooth on/off method, was developed to allow implementation
for efficient inverse modeling. In this third method the contribution of a
source element at a particular time is weighted with the fraction of the ele-
ment that is activated.
Both the gold standard and the smooth on/off method were able to
reduce the jitter that is generated by the fast on/off method. The relative
difference between the methods at V1-V6 indicated a reduction of 8.3% and
7.9% for the golden standard and smooth on-off method, respectively.
The physiological more accurate gold standard method eliminates
the jitter that is found in the fast on/off method, without the need of temporal
filtering. Furthermore, our study suggests that the smooth on/off method pro-
vides a useful approximation and fast implementation for inverse modeling.
Figure: QRS for the three methods at V1-V6. (left) Fast on/off method: jitter is present. (middle)
Gold standard. (right) Smooth on/off method.
S53
82 Computing in Cardiology 2012, Kraków, Poland

Multichannel Bed Pressure Sensor for Sleep Monitoring
Juha Kortelainen*, Mark van Gils and Juha Pärkkä
A bed sensor with multiple pressure sensitive non-contacting foil electrodes has been applied for unobtrusive monitoring during sleep. The novelty is on using multichannel algorithms to improve extraction of the heart beat and respiration signals from the recorded ballistocardiographic (BCG) data. Heart beat is extracted by using sliding Fourier Transform, and after averaging the sensor channels in the frequency domain, the attained resolution enables to detect individual heart beat intervals (HBI) and estimate the heart rate variability (HRV). The respiration signal is composed from the low pass filtered BCG signals with a linear model, by updating the coefficients with an adaptive PCA model. In comparison to the reference ECG R-R interval, the relative error of the HBI has been 0.40 % with 88 % measurement coverage for the healthy subjects during normal sleep. The error of the respiration cycle measurement has been 1.5 % in comparison with the respiratory inductive belt (RIP). For the group of patients having different kind of suspected sleep problems, the measurement coverage varied a lot between subjects due to increased movement artifacts. In this case, some examples of detecting respiratory disorders are shown by using the heart rate, respiration and movement activity signals from the bed sensor
.
S54
Computing in Cardiology 2012, Kraków, Poland 83
Cardiac Signals Coding and Transmission in Real-Time Mobile Telecardiology Applications
José García*, Álvaro Alesanco and Eva Cavero
University of Zaragoza
Cardiac signals must be efficiently coded (in order to save channel band-
width) and packetized using adapted application-level protocols (to guaranty monitoring quality) when transmitted in real-time operation. This study shows an overview of different approaches for electrocardiogram (ECG) and echocardiogram (ECO) coding and transmission over 3G networks. Various methods for ECG and ECO compression have been proposed in our group during last years. Monitoring process was also studied for trans-mission purposes since conventional transport protocols without modifica-tions may not be the most appropriate to send cardiac signals in real-time in wireless channels. Therefore new proposals for protocols adapted both to ECG and ECO have been developed. Moreover, specific Mean Opinion Score (MOS) tests have been proposed to clinically validate the solutions by cardiologists. Regarding the ECG, a compression method based on the SPIHT 1D algo-rithm, which works automatically (selection of the compression threshold based on the noise level of the signal) was developed and clinically validated through MOS tests. Moreover, an application-level protocol was developed to perform the retransmissions of erroneous packets, introducing a monitoring buffer that mitigates negative effects in monitoring. Regarding the ECO, a mode-dependent method for compression has been proposed: for 2D and Doppler modes, a SPIHT 3D video compression meth-od based on regions of interest; for sweeping modes (M and pulsed/continuous Doppler), an encoder by slices images based on SPIHT 2D. Moreover, a protocol that incorporates the capabilities of retransmission and error correction techniques, which is able to adapt to the presence of errors in transmission has been tested and clinically validated. The described proposals permit the transmission of ECG at rate of 0.5 kbps per ECG lead, and ECO at rates between 245 and 282 kbps. The use of these methods has enabled to significantly reduce the demanded bandwidth guaranteeing signal quality in the receiver
.
S54
84 Computing in Cardiology 2012, Kraków, Poland

A Neonatal Apnoea Monitor for Resource-constrained Environments
Jonathan Daly, Violeta Monasterio* and Gari D Clifford
University of Zaragoza Zaragoza, Spain
Introduction: Apnoea (cessation of breathing) is a common issue with
patients in the Neonatal Intensive Care Unit (NICU), particularly with premature neonates. However, whilst neonates in developed countries have access to abundant medical resources, those born in developing countries are far less likely to receive this level of care. The ability to detect and intervene with apnoea in a non-clinical environment would therefore be of great benefit to clinicians and non-clinicians in these regions.
Methods: A prototype Android application was designed for the purpose of detecting apnoeic events. The application takes inputs from a pulse oximeter connected to the phone, and uses machine learning techniques to detect apnoea. Distribution of the system requires only a current mid-range Android smartphone and a pulse oximeter. This work builds on previous research, but with a particular focus on effectively classifying desaturation events using a reduced set of information (given the non-clinical environment). This information consisted only of the photoplethysmogram (PPG) and a set of PPG-derived physiological variables including respiratory rate and heart rate.
Results: Various methods using support vector machines (SVM) were assessed using data from 27 NICU stays, and the best of these was found to be a combination of a feature selection method based on mutual information and an SVM with a radial basis function kernel, producing a classifier with a sensitivity of 98.7%, a specificity of 62.2% and an accuracy of 69.5% on a training set of 796 events, and a sensitivity of 76.9%, a specificity of 52.0% and an accuracy of 57.0% on a test set of 663 events. Conclusion: The PPG and its derived variables are insufficient for the accurate detection of neonatal apnoea, but still provide relevant information to detect apnoeic events. The addition of audio and actigraphy, provided by the smartphone, could improve classification results
.
S54
Computing in Cardiology 2012, Kraków, Poland 85

Human Activity Surveillance based on Wearable Body Sensor Network
Eliasz Kańtoch* and Piotr Augustyniak
AGH University of Sciece and Technology Kraków, Poland
With the rapid advancements of biomedical engineering and wireless
communication it is possible to develop body sensor networks (BSN) which support a range of applications including medical and healthcare systems. A body sensor network (BSN) is a special purpose network designed to operate autonomously to connect various medical sensors. The aim of the research is to propose a prototype of BSN-based wearable wireless monitoring system optimized to monitor patient’s activity and phys-iological signals. The system consists of a number of miniature sensors (two bipolar ECG, two accelerometers, tilt sensor, piezoelectric pressure sensor, pulse oximeter, temperature sensor), wireless modules(ZigBee and Bluetooth) and an Android based smartphone used as a gateway node to connect to the external database server. Developed algorithms process and analyze biomedical signals in real time in order to calculate proposed motion activity factor based on movement sensors(GPS, accelerometers, tilt sensor) and selected physiological parameters including (heart rate, temperature, SpO2). The main advantage of the system is the mobility of patients due to use of portable monitoring device. Second advantage is the location independent monitoring facility. Implemented system is not only a valuable monitoring tool but also is an wearable sensor experimenting platforms which allows to easily add and test new nodes and algorithms. However, there are several issues related to Quality of Service, security, automatic signal analysis in order to consider this system as an alternative healthcare delivery method. Introduction of BSN technology for medical monitoring and other applications will offer new possibilities and cost saving options to both health care professionals and patients. This emerging technology is able to deliver healthcare not only to patients in hospitals and medical centers but also in their homes and workplaces
.
S54
86 Computing in Cardiology 2012, Kraków, Poland

Sleep in the Cloud: On How to Use Available Heart Rate Monitors to Track Sleep and Improve Quality of Life
Anda Baharav*, Shuli Eyal and Yoni Dagan
Wingate Sports Institute Tel Aviv, Israel
As the modern society accumulates sleep debt that jeopardizes health,
performance and wellbeing, people become increasingly interested in self-assessment. We aim at enabling sleep self-evaluation using available Heart Rate (HR) monitors via mobile and cloud technology. Sleep evaluation was performed using an adaptation of an ECG-based validated sleep diagnostic software to HR data obtained from HR monitor belts (HRM) which are widely used to monitor HR during physical activity. The data was transmitted and stored on an IPhone, using a dedicated application. Two wireless communication channels are used for HRM: (P1) Wearlink+ (analog; short range; 5KHz) and (P2) ANT+ (digital; medium range; 2.4GHz). The stored information was uploaded to the cloud and automatically analyzed. Users could access results and daily changes on Web. We checked the functionality of the automated sleep analysis and monitoring using HRM with either P1 or P2 transmission, IPhone, and cloud based SleepRate software. 20 users, mean age 39(SD10) used the system 135 nights with P1, and 9 users of similar ages completed meanwhile 43 nights with P2. 2 hours good quality recorded HR represented a prerequisite to return meaningful results. P1: 21% of nights did not meet the threshold to get a report. 90% had 68% good quality HR for more than 50% of the measured time each night, 35% had good quality HR for more than 80% measured time each night. P2: All met the threshold, 98% had 97.6% good quality HR for more than 50% of the time each night, 90.5% for more than 80%. ANT+ technology proved to be more robust and also less intrusive allowing a higher adherence to nightly usage. Millions of people have their HR belts for training and now they can use them to evaluate and improve their sleep, thus improving their health, daytime wellbeing and performance
.
S54
Computing in Cardiology 2012, Kraków, Poland 87

A New Method for Detection and Localization of Myocardial Infarction Using T-wave Integral and Total Integral in One Cycle of ECG
Nader Jafarnia Dabanloo*, Gholamreza Attarodi, Naser Safdarian and Yousef Jafarnia Dabanloo
Science and Research Branch, Azad University, Tehran, IRAN Tehran, Iran (Islamic Republic of)
In this paper we used two new features i.e. T-wave integral and total
integral in one cycle of normal ECG to detect and localize myocardial infarction (MI) in left ventricle. In our previous work we used some features of body surface potential map data. But we know the standard ECG is more popular so we focused our detection and localization in standard ECG. We use the T-wave integral because of the important impression of T-wave in MI. The second feature was total integral of one ECG cycle because we believe that the MI affects the morphology of the ECG which leads to total integral changes. We used neural network (NN) to detect and localize the MI because of good nonlinearity support of NN. We used Radial Basis Function (RBF) because of its nonlinearity property. We used physionet data as our training and test data. We reached over 80 % for accuracy in test data for localization and over 95% for detection. In spite of simplicity our method has good accuracy which can be improved by adding more features. A simple NN based method using only two features which extracted from standard ECG is presented which has good accuracy in MI localization
.
S61
88 Computing in Cardiology 2012, Kraków, Poland

Estimating Infarct Severity from the ECG using a realistic heart model
Peter van Dam, Arnold Dijk, Niek van der Putten, Arie Maan, Mike de Jongste
Radboud University Medical Center, Nijmegen, the Netherlands
The early phase of myocardial infarction is accompanied by changes in the
ST segment of the ECG. This makes the ST segment the clinical marker for
the detection of acute myocardial infarction. The detection of the culprit ar-
tery from the ST segment ECG will support clinical decision making, i.e.
determine the infarct severity, location and size of the myocardial tissue at
risk.
We used the non-invasive imaging method based on a double layer at the
myocardial surface as the equivalent source of cardiac activity to determine
the myocardial tissue at risk. A realistic model of the ventricular myocardial
tissue is required to determine the ischemic zone, i.e. epicardial and endocar-
dial surfaces. For this study we used MRI data from a male (60 years) to re-
construct the myocardial surfaces, and those of the lungs and thorax. The
resting potential strength of the local double layer was estimated from the ST
amplitude of the ECG. The problem at hand is both ill-posed and non-linear,
requiring an initial estimate for the resting potential level and using a dedi-
cated Levenberg–Marquardt optimization algorithm.
The ECGs from patients with a single occlusion in one of the coronary
vessels was used to determine the amount of left ventricular tissue at risk.
The amount of left ventricular tissue at risk ranged from 15% (resting poten-
tial rise of more than 20mV) for the vessel supplying the posterior septum, 45
% a for a mid-LCx occlusion and up to 95% for an LCA occlusion.
Two examples in which the resting potential (double layer strength) is es-
timated from measured 12 lead ECG with a single vessel occlusion. Left pan-
el: a patient with a mid LCx occlusion, right panel: occlusion in the vessel
supplying the posterior septum. Colors indicate the resting potential in mV.
left free wall posterior septum
S61
Computing in Cardiology 2012, Kraków, Poland 89

Validation of Infarct Size and Location from the ECG by Inverse Body Surface Mapping
Arnold Dijk*, Peter van Dam, Niek van der Putten, Arie Maan and Mike de Jongste
University Medical Center Groningen Groningen, Netherlands
Many algorithms have been proposed to predict the culprit artery in
Acute Myocardial Infarction patients using the ECG. In our CinC 2011 paper we described a new prediction algorithm. We validated this method with a database containing ECG’s of 475 patients with a (angiographically proven) single occluded vessel. Although an improvement over other algorithms was shown, the results in terms of sensitivity and specificity were suboptimal; especially in the group with, according to the current definitions, non-STEMI ECG’s. In this study we took a different approach using a highly interactive ECG simulation package (ECGSIM) based on Inverse Body Surface Mapping Algorithms. The design was adapted by adding coronary vessels and the possibility to alter the individual cell action potentials in order to match the ST segment amplitudes in the simulated ECG with the ECG under investigation through a best-fit algorithm. ECGSIM keeps track of the number of ischemic or infarcted cells and their location and can calculate the size, location and shape of the area considered to be infarcted. The 3D display capability allows for visualization. Our proof of concept with 10 troublesome ECG’s from our database of 475 patients showed very promising results. These preliminary results stimulated us to validate this algorithm with cardiac MRI and (blood)laboratory data. We used a population of 180 patients with single vessel disease divided in 3 groups with a 100% occluded midRCA, midLAD or midLCX segment. Each group was split in a learning group and test group. The learning groups were used to match the MRI data about location and size of the infarction with the generated data from the model. Subsequently the validation took place with the test groups. The results of this validation will be presented at the CinC meeting
.
S61
90 Computing in Cardiology 2012, Kraków, Poland

ST and Ventricular Gradient Dynamics During PTCA Cornelia C. ter Haar, Arie C. Maan, Martin J. Schalij, Cees A. Swenne
Leiden University Medical Center Leiden, The Netherlands
Background. Diagnosis and triage in the hyperacute phase of the acute co-ronary syndrome is mainly based on the ECG. In addition to phase 4 injury current that causes ST vector (STV) alterations, ischemia also affects the action potential morphology in the area at risk. This often manifests as T-wave changes, and alters the spatial ventricular gradient (SVG, the spatial QRST integral). To investigate if extra information can be derived from joint STV and SVG interpretation, we currently study the STAFF-III database, a collection of 9-lead ECG recordings from 108 patients during elective PTCA, as a model of acute ischemia/reperfusion.
Methods. In a pilot study we processed the baseline and initial inflation ECG recordings of 29 patients with our VCG-oriented research program BEATS. First, VCGs were synthesized by using the Kors matrix. Then onset QRS, J point and end-of-T were interactively determined in every beat, and the STV (J+60 ms vector) and SVG were computed. The average baseline STV and SVG served as reference values for the beat-to-beat computation of differences ΔSTV and ΔSVG in the inflation ECG. Finally, scatter plots of the magnitudes of ΔSTV vs. ΔSVG were made.
Results: see Figure. Four types of scatter-patterns were observed: non-
responsive (|ΔSTV|<0.1mV and |ΔSVG|<50mV•ms; 3/29 patients, 10.4%), no initial SVG response (5/29, 17.2%; Panel A), proportional response (16/29, 55.2%; panel B), slanted-U response (5/29, 17.2%; Panel C).
Discussion. The most striking finding was the slanted-U response. In these 5 patients parts of the ECG showed predominantly STV changes while other parts showed predominantly SVG changes. This response is a manifestation of an ischemia-reperfusion effect in this subgroup.
Conclusion. Joint STV and SVG analysis assists in unmasking ischemia-reperfusion effects; this may improve interpretation of the hyperacute ECG in acute coronary syndrome.
0 1500
0.3
∆SVG (mV*ms)
∆ST
V (m
V) C
0 1500
0.3
∆SVG (mV*ms)
∆ST
V (m
V) A
0 1500
0.3
∆SVG (mV*ms)
∆ST
V (m
V) B
S61
Computing in Cardiology 2012, Kraków, Poland 91

Analysis of the Spatial Resolution of Body-SurfaceDominant-Frequency Mapping Systems
Jesús Requena-Carrión, Juho Väisänen, Ferney Beltrán-Molina
Rey Juan Carlos UniversityFuenlabrada, Madrid, Spain
Background: Endocardial dominant-frequency (DF) mapping has enhancedthe understanding of the mechanisms of cardiac fibrillation and has been usedas a guide for atrial fibrillation ablation therapies. Body-surface DF mappinghas also been proposed to investigate cardiac fibrillation noninvasively. How-ever, the relationship between endocardial DF maps and body-surface DF mapsis not well understood.
Aims: In this study we assess the ability of body-surface leads to resolvelocal DF values by quantifying the spatial resolution (SR) of a high-densitybody-surface lead system.
Methods: In a detailed numerical model of the human thorax based onthe Visible Human Man dataset, we calculate the measurement sensitivity ofthe 117 leads of a Dalhousie body-surface lead system, which include stan-dard ECG precordial leads V1, V2, V3 and V4. Based on the measurementsensitivity of each lead, we compute their lead equivalent volume (LEV) inthe myocardium, which corresponds to the relative size of the volume of themyocardium where the measurement sensitivity is concentrated, and their SR,which is defined as the inverse of the LEV.
Results: Leads positioned in colums 4-6 and rows 3-5 of the Dalhousiesystem have the highest SR (2.4% < LEV < 7%) and concentrate their mea-surement mostly in the right myocardium. Standard precordial leads V1, V2,V4 and V6 have respectively a LEV of 3.6%, 3.4%, 5.3% and 14%. LowestSR were achieved at the back, where all leads have a LEV > 11%.
Conclusion: Optimal surface lead positioning can increase the resolutionof local DF values. However, the estimation of local DF values in selectedmyocardial regions from signals measured by body-surface leads, is limited bythe intrinsic SR of body-surface leads. Our results suggest that further signalprocessing stages are needed to improve the resolution of body-surface DFmaps.
S62
92 Computing in Cardiology 2012, Kraków, Poland

Global and Directional Activation Maps for cardiac mapping in electrophysiology Rémi Dubois*, Simon Labarthe, Michel Haïssaguerre
LIRYC, Institut de Rythmologie et de Modélisation Cardiaque Université de Bordeaux, F33000, Bordeaux, France Background: Cardiac mapping is a necessary step for accurate diagnos-
tics in cardiology. It generates an activation map of the pathways followed by the electrical depolarization wavefront during the activity of the heart. This map is constructed by analyzing either the electrograms (EGM) recorded by an invasive procedure such as electrophysiology, or an estimate of these EGMs obtained by non-invasive surface mapping techniques. Standard meth-ods to obtain such maps are based on the delay between maximal negative derivatives of independently measured EGMs. In some cases, for example when the signals are too noisy or corrupted with far-field activities, this method may lead to inaccurate results. Method: We evaluated a novel Directional Activation Algorithm (DAA)
based on EGM analysis. The DAA calculates the time delay between adja-cent EGMs and assigns to each a localized propagation vector. Here, we propose a new visual representation of the depolarization wavefront as a field of arrows to facilitate comprehension of propagation pathways (figure right). In addition, we show resultant global activation map (figure Left) derived using the solutions of a linear system from each of these local delays. Results: The accuracy of the proposed methodology is compared with
known activities obtained from a monodomain, isotrope, Beeler-Reuter mod-el of the atria. Unipolar EGMs were estimated from several scenarios includ-ing: focal activity from a pulmonary vein, conduction block and scar tissues. For each sequence, the efficiency of DAA is demonstrated against the stand-ard method, as well as from Electrocardiographic Imaging recordings during atrial tachycardia.
Figure: Acti-vation from a focal source in LIPV. (left) Activation time and isochrones (5ms) computed with DAA; (right) local activation repre-sented by an arrow field map.
S62
Computing in Cardiology 2012, Kraków, Poland 93

Feasibility of Non-Invasive Determination of the Stability-of-Propagation Reserve in Patients
Salim Idriss, Wanda Krassowska Neu, Vivek Varadarajan, Todor Antonijevic, Syed Gilani and Joseph Starobin*
University of North Carolina at Greensboro Joint School of Nanoscience and Nanoengineering
Greensboro, United States
Non-invasive risk assessment for ventricular arrhythmias is critical to the prevention of sudden cardiac death. We developed a novel method to identify the existence of proarrhythmic substrates in patients. The method combines measurements of patient’s repolarization dynamics with a reaction-diffusion model of cardiac excitation to determine the “stability-of-propagation reserve (SoPR)”, a metric that measures patient’s susceptibility to conduction instability. This study assesses feasibility of computing SoPR non-invasively, from surface ECG measurements. Fifteen patients in the Duke Pediatric EP lab s/p ablation for SVT were studied (ages 13-17) after IRB consent. RV apical and septal unipolar endocardial electrograms with 12 lead surface ECG were recorded during steady-state and S1S2 pacing for measurement of repolarization dynamics. Patient’s activation/recovery intervals from endocardium and surface leads were used independently in the model to compute SoPR for each recording site. SoPR values computed from RV endocardial and from surface lead II data correlated and a direct transformational formula was developed that estimated endocardial SoPR from surface measurements. SoPR estimates from surface lead II were not significantly different from endocardial SoPR values (P>0.7). Endocardial and surface SoPR were linearly related to the diastolic interval (DI). SoPR decrease with shorter DI (P<0.001) toward the critical threshold will facilitate predicting the onset of conduction instability. Computation of SoPR from surface ECG is feasible and may lead to new non-invasive treadmill tests for sudden cardiac death risk
.
S62
94 Computing in Cardiology 2012, Kraków, Poland

Quantitative Spectral Criteria for Cardiac Navigation Sampling Rate Using Manifold Harmonics Analysis
Margarita Sanromán-Junquera*, Inmaculada Mora-Jiménez, Javier Saiz, Catalina Tobón, Arcadi García-Alberola and José Luis Rojo-Álvarez
Universidad Rey Juan Carlos Fuenlabrada, Spain
Background. The spatiotemporal sampling of representative
electrograms (EGM) yielding 3-D maps of relevant cardiac features (activation, organization, amplitude) in Cardiac Navigation System (CNS) for arrhythmia ablation, is currently driven by heuristic considerations. On the other hand, Manifold Harmonic Analysis (MHA) allows spectral analysis and filtering of multidimensional structures in computer graphics and visualization, however, its connection to Sampling Theory has not been fully established.
Aim. Our objective is to develop a systematic and quantitative procedure to support the spatial sampling of intracardiac EGMs during electrophysiological (EPS) procedures. We hypothesized that MHA can be adapted for establishing quantitative spectral criteria for 3-D and 4-D maps, in connection with conventional sampling theory, and used for supporting the EGM sampling during CNS assisted EPS. Methods. After automatic region growing method segmentation in 7 Computerized Tomography images of the left atria, a 3D mesh was generated for its inner face. MHA eigendirections and spectral coefficients were calculated, showing a clear low-pass structure. Reconstruction quality increased smoothly with the number of spectrally relevant components, and it was compared with the reconstruction error using mesh simplification method (Qlim) in terms of decay constant tau. Consistent tau were found when using the geometrical deviation (211.2+-89 points in MHA, 173.8+-19.7 points in Qlim, n.s.), but not when using mean squared error (70.5+-17 vs 392.6+-214.1, p<0.001). The EPS feature maps were simulated as smooth focal variations in a surrogated 4th dimension on the real atria grids, and showed a quantifiable trend to increase with the mechanism size (271-531 points for small, 135-413 for middle, 18-163 for wide size, for 85%-90% of total spectral energy).
Conclusion. MHA can be used to support the feature and spatial sampling rate in CNS-based EPS studies in connection with well-known sampling theory concepts
.
S62
Computing in Cardiology 2012, Kraków, Poland 95
Comparison of Methods for Quantification of Myocar-dial Infarct Size from Delayed-Enhancement MRI Data Nadjia Kachenoura*, Nicolas Baron, Philippe Cluzel, Frédérique Frouin, Alain Herment, Philippe Grenier, Gilles Montalescot, Farzin Beygui INSERM U678/UPMC Univ Paris 6, Paris, France
Introduction: Late gadolinium enhancement (LGE) cardiovascular mag-
netic resonance (CMR) enables the estimation of myocardial infarct (MI)
extent. Nevertheless, manual quantification is time consuming and subjective.
Accordingly, we sought to assess MI volume with different quantitative
methods in both acute (AMI) and chronic MI (CMI).
Methods: CMR was performed 50±21 hours after MI in 52 patients and
was repeated 100±21 days later in a subgroup of 34 patients. Then, necrosis
volumes were quantified using: 1) manual delineation by an experienced ra-
diologist, 2) automated fuzzy c-means clustering method, and 3) +2 to 6SD
thresholding approaches. Results were compared against peak values of se-
rum Troponin I (TnI), creatine kinase (CK) and left ventricular (LV) func-
tional parameters: LV ejection fraction (LVEF), indexed end-diastolic
(EDVi) and end-systolic volumes (ESVi) as well as the number of hypokinet-
ic segments (NbHk).
Results: For CMI, quantitative evaluation of infarct size using manual,
+2SD, +3SD and fuzzy c-means provided equivalent results in terms of cor-
relation coefficients for comparisons of MI volumes against LV function pa-
rameters (LVEF: r>0.79, p<0.0001; ESVi: r>0.82, p<0.0001, EDVi: r>0.67,
p<0.0001, NbHk: r>0.54, p<0.0009). For AMI, +2SD and fuzzy c-means
approaches provided higher correlations for comparisons of AMI volumes
against biochemical markers (+2SD: CK: r=0.79, p<0.0001,TnI: r=0.77,
p<0.0001; Fuzzy c-means: CK: r=0.83, p<0.0001,TnI: r=0.79, p<0.0001 )
and chronic LV function parameters (+2SD: LVEF: r=0.82, p<0.0001, NbHk:
r=0.59, p<0.0002; Fuzzy c-means: LVEF: r=0.83, p<0.0001, NbHk: r=0.59,
p<0.0002).
Conclusions: The fuzzy c-means and 2SD methods provided highest cor-
relations with biochemical MI quantification as well as LV function parame-
ters. The fuzzy c-means approach which does not require an arbitrary identi-
fication of the remote myocardium is fast and reproducible. It may be clini-
cally useful in the evaluation of patients with MI.
S63
96 Computing in Cardiology 2012, Kraków, Poland

Texture Analysis to Assess Risk of Arrhythmias afterMyocardial Infarction
Trygve Eftestøl, Leik Woie, Kjersti Engan, Jan Terje Kvaløy, DennisW.T. Nilsen, Stein Ørn
University of StavangerStavanger, Norway
Aims: Implantable cardioverter-defibrillator (ICD) prevents sudden cardiacdeath in patients with healed myocardial infarction (MI) at high risk of seriousarrhythmias. This study was designed to identify if texture analysis of cardiacmagnetic rensonance (CMR) images can be used to identify high-risk patientslikely to benefit from ICD implantation.
Methods: Two groups of patients with MI were compared: 1. 24 patientswith indication for ICD. 2. 37 patients with healed MI and no ICD indication.CMR was used to assess myocardial function, volumes, scar size and tissuecharcacteristics. Statistical and texture descriptors were based on calculatinggray-level co-occurrence matrix in segmented late gadolinium enhancementimages. ICD- and non-ICD patients were compared using pattern classificationmethods according to Bayes decision theory and ROC analysis. The specificityto discriminate ICD- and non-ICD-patients was calculated at a sensitivity of ≥90% by combining one, two or three features.
The classifier performance for the best 1D(a), 2D (b) and 3D (c) featurecombinations.
Results: The results for thebest 1D, 2D and 3D fea-ture combinations are shownin the figure with 95% confi-dence intervals. LVEF alonewas able to discriminate thetwo groups with a specificityof 70% (CI:57-81%). Com-bining LVEF with one texturedescriptor of the non-scarredmyocardium increased speci-ficity to 81% (CI:69-89%)and adding scar size as a thirddescriptor further increasedspecificity to 84% (CI: 72-91%).
Conclusion: The addition of myocardial texture analyses improves the abil-ity to distinguish between patients with high and low risk of serious ventriculararrhythmias.
S63
Computing in Cardiology 2012, Kraków, Poland 97

Bootstrap Uncertainty Estimation of Canine CardiacFibers Anisotropy and Diffusivity on DT-MRI Data
Tomasz Pieciak
AGH University of Science and TechnologyKrakow, Poland
Introduction: Diffusion tensor magnetic resonance imaging (DT-MRI) is anemerging technique, which permits one to probe the arrangement of fibroustissues noninvasively on a microstructural level. Due to the anisotropy natureof water movements in cardiac muscle, one is able to extract local fiber orien-tations. However, inherent cardiac cycle and respiratory system, significantlyaffect cardiac diffusion tensor imaging (DTI) data. As a consequence, consid-erable distortion of the DTI data leads to ambiguity in the eigenvalues of thediffusion tensors calculation and measures of anisotropy and diffusivity quan-tification.
Purpose: Our research focused on the investigation of estimation the uncer-tainty of anisotropy and diffusivity measures of the canine cardiac DTI data.The fractional anisotropy (FA) and mean diffusivity (MD) of the diffusion ten-sor images are considered depending on apical, mid-cavity and basal the Amer-ican Heart Association (AHA) segments.
Results: The research has been performed on six normal canine ex vivohearts imaged with DT-MRI modality. The non-parametric bootstrap method-ology has been used to estimate the uncertainty of FA and MD parameters withN = 1000 replications. The bootstrapped distributions and confidence inter-vals (CI) with the confidence level p = 0.95 for the FA and MD means havebeen determined. The sample findings from the research shows, that FA meanschanges between 0.345 (apical) and 0.387 (basal) and MD mean values arebetween 6.822 · 10−6 [cm2/s] (apical) and 7.097 · 10−6 [cm2/s] (mid-cavity)(Table). The uncertainty of FA means are similar in each segment, but the un-certainty of MD mean parameter is at the highest pitch at mid-cavity segment.
Conclusion: The bootstrap technique allows one to infer about FA, MD pa-rameters and estimate their uncertainties in canine heart based on small amountof DTI data depending on AHA segments.
Sample bootstrapped FA and MD means with confidence intervalsFA MD x10−6 [cm2/s]
Mean CI Mean CIBasal 0.387 (0.385, 0.389) 7.007 (6.982, 7.028)Mid-cavity 0.36 (0.358, 0.362) 7.097 (7.068, 7.122)Apical 0.345 (0.344, 0.348) 6.822 (6.797, 6.846)
S63
98 Computing in Cardiology 2012, Kraków, Poland

Quantitative 3D Evaluation of Myocardial Perfusion During Regadenoson Stress Using Multidetector Computed Tomography Victor Mor-Avi*, Nadjia Kachenoura, Joseph Lodato, Sonal Chandra, Benjamin H Freed, Barbara Newby, Roberto M Lang, Amit R Patel
University of Chicago, Chicago, Illinois, U.S.A. Objective. The ability of multidetector computed tomography (MDCT) to
detect stress-induced myocardial perfusion abnormalities is of great clinical interest as a potential tool for the combined evaluation of coronary stenosis and its hemodynamic significance. We tested the hypothesis that quantitative three-dimensional (3D) analysis of myocardial perfusion from MDCT images obtained during regadenoson stress would more accurately detect the pres-ence of significant coronary artery disease (CAD) than identical analysis when performed on resting MDCT images. Methods. We prospectively studied 50 consecutive patients referred for
CT coronary angiography (CTCA) who agreed to undergo additional imaging with regadenoson (0.4mg, Astellas). Images were acquired using prospective gating (256-channel, Philips). Custom analysis software was used to define 3D myocardial segments, and calculate for each segment an index of severity and extent of perfusion abnormality, Qh, which was compared to perfusion defects predicted by the presence and severity of coronary stenosis on CTCA. Results. Three patients were excluded because of image artifacts. In the
remaining 47 patients, CTCA depicted stenosis >50% in 23 patients in 37/141 coronary arteries. In segments supplied by obstructed arteries, myo-cardial attenuation was slightly reduced compared to normally perfused seg-ments at rest (91±21 vs. 93±26 HU, NS), and to a larger extent at peak stress (102±21 vs. 112±20 HU, p<0.05). In contrast, index Qh was significantly increased in these segments at rest (0.40±0.48 vs. 0.26±0.41, p<0.05) and reached a nearly 3-fold difference at peak stress (0.66±0.74 vs. 0.28±0.51, p<0.05). The addition of regadenoson improved the diagnosis of CAD, as reflected by an increase in sensitivity (from 0.57 to 0.91) and improvement in accuracy (0.65 to 0.77). Conclusions. Quantitative 3D analysis of MDCT images allows objective
detection of CAD, the accuracy of which is improved by regadenoson stress.
Res
t St
ress
S63
Computing in Cardiology 2012, Kraków, Poland 99

Effect of Simulated Microgravity by Head-Down Bed Rest on T Wave Alternans
Alba Martín-Yebra*, Violeta Monasterio, Alessandro Pellegrini, Pablo Laguna, Enrico Caiani and Juan Pablo Martínez
Universidad de Zaragoza Zaragoza, Spain
Aims: Reports of ventricular arrhythmias during spaceflights raise the
question of whether microgravity increases sudden cardiac death risk. Our aim was to study changes in T Wave Alternans (TWA) during VO2max stress tests before and after five days of -6º head-down bed rest (HDBR) simulating exposure to microgravity.
Methods: Two HDBR campaigns were organized by the European Space Agency in MEDES (Toulouse, France) and DLR (Köln, Germany). High-resolution (1000 Hz) 12-lead ECG was recorded in 19 male volunteers (age range 21-43 years) during VO2max tests by bicycle exercise stress, the day before the beginning of HDBR (PRE) and within 26 hours after the end of HDBR (POST). Based on max VO2 quantified during recruitment, workload was increased by 25% step each 5 min. After 15 min, additional 25W/min was applied until exhaustion. ECG was analyzed using the Laplacian Likelihood Method, together with Periodic Component Analysis, for multilead TWA detection and amplitude estimation.
Results: TWA was detected in 18 of 19 subjects at PRE, while all of them presented TWA at POST. No subject at PRE and 6 subjects at POST presented TWA with onset heart-rate<125bpm (p=0.031). Different TWA features were compared, but only the onset of TWA episodes from the beginning of the VO2max test resulted in significant differences between PRE and POST: (11.82±2.94 min vs 10.87±2.98 min respectively, p=0.024). Heart rate at onset of TWA episodes was 142±10 bpm before HDBR and 140±19 bpm after HDBR. Differences were more marked in the MEDES campaign (with VO2max test 5-6 h after end of HDBR) than in DLR (26 h after HDBR). Conclusion: Although results suggest that five-day exposure to microgravity is too short to observe significant changes in myocardial substrate, several subjects showed a reduction in the TWA onset HR, which may indicate a change in myocardial condition
.
S64
100 Computing in Cardiology 2012, Kraków, Poland

A single channel ECG quality metric
Joachim Behar*, Julien Oster, Qiao Li and Gari Clifford
University of Oxford
Aims: Physiological signals such as the electrocardiogram (ECG) are
often severely corrupted by noise and artefact. This study describes a framework for automated ECG quality assessment and test it on two databases. In particular we focus on how the accuracy changes as we reduce the window length on which our signal quality indices are computed and how the system performs on clinically relevant events such as arrhythmias.
Methods: The algorithm was designed for an arbitrary length and number of leads. 18,000 leads from the PhysioNet Computing in Cardiology 2011 Challenge Dataset were manually annotated as good or bad quality. Metrics were developed that quantify spectral energy distribution, robustness in QRS detection and other basic statistics and a Support Vector Machine was trained to classify the data. To balance the classes, data from the Noise Stress Test Database were added to clean ECGs. To analyse how our algorithm performs on clinically important events such as arrhythmias we also manually annotated 9452 10s segments of arrhythmias from the MIT-BIH arrhythmia database.
Results: We achieve 97.1% accuracy on the extended Challenge database for recording length of 10s. Approximately a 1% drop in performance was noted for each second shortening of the window. Retraining the classifier on all the challenge data, the classifier gave 93% accuracy on the arrhythmic data. Conclusion: The results are promising and indicate that our framework may be useful in a wide range of applications. Although further refinement is needed to handle arrhythmias more efficiently (perhaps by training on specific arrhythmias), it is expected that in an intensive care unit context the combination of these ECG indices together with information provided by other pulsatile waveforms may create a robust system for reducing false alarms and improving monitoring
.
S64
Computing in Cardiology 2012, Kraków, Poland 101

Combination of ECG Parameters with Support VectorMachines for the Detection of Life-ThreateningArrhythmias
Felipe Alonso-Atienza, Eduardo Morgado-Reyes, LorenaFernandez-Martınez, Arcadi Garcıa-Alberola, Jose Luis Rojo-Alvarez
Rey Juan Carlos University, Fuenlabrada, Madrid, Spain
Background. Early detection of ventricular fibrillation (VF) and rapid ven-tricular tachycardia (VT) is crucial for the success of the electric shock ther-apy provided by automatic external defibrillators. A wide variety of detectionalgorithms have been proposed based on temporal, spectral, or complexity pa-rameters extracted from the surface electrocardiogram (ECG). However, thesealgorithms are constructed by considering each parameter individually.
Aim. This study aimed to analyze the performance of combining previouslydefined ECG parameters for the detection of life-threatening arrhythmias us-ing support vector machines (SVM). We studied two different binary detectionscenarios: shockable (FV plus TV) vs non-shockable arrhythmias, and VF vsnon-VF rhythms.
Methods. We used the MIT-DB, the CU-DB, and the VF-DB to evalu-ate our algorithms. For each 8-seconds ECG recording, a set of 11 parameterswere obtained from the following existing methods: threshold crossing interval(TCI), standard exponential (STE), modified exponential (MEA), complexitymeasure (CM), VF filter (VFleak), spectral algorithm (M and A2), mediam fre-quency (FM), mean absolute value (MAV), phase space reconstruction (PSR)and Hilbert Transform (HILB). This set of parameters constitutes the inputspace of the SVM detector. A random subset of the input space (70%) wasused for training while the remaining data was used as test set. Given that thedataset was unbalanced, we used the balanced error rate as metric to set the freeparameters (C,σ) of the SVM by following a 5-fold cross validation strategy.
Results. The performance of the SVM detector was assessed using thetest set in terms of Sensitivity (SE), Specificity (SP) and Accuracy (AC), assummarized in the following table:
SE (%) SP (%) AC (%)Shock vs nonShock 94 97 97FV vs nonFV 79 94 93
Conclusions. The combination of ECG parameters using machine-learningtechniques can improve the efficiency for the detection of life-threatening ar-rhythmias.
S64
102 Computing in Cardiology 2012, Kraków, Poland

Comparing Hidden Markov Model and Hidden Semi-Markov Model Based Detectors of Apnea-Bradycardia Episodes in Preterm Infants
Miguel Altuve*, Guy Carrault, Alain Beuchée, Cyril Flamand, Patrick Pladys and Alfredo I Hernández
Grupo de Bioingeniería y Biofísica Aplicada, Universidad Simón Bolívar, Caracas 1080, Venezuela
Aims: In this paper, we propose, evaluate and compare two detectors of
apnea-bradycardia episodes, based on Hidden Markov Models (HMM) and Hidden semi-Markov Models (HSMM). Evaluation is performed on a database of 32 preterm infants, monitored in the Rennes neonatal intensive care unit. This database presents 233 apnea-bradycardia episodes, manually annotated by experts.
Methods: The acquired ECG signals are processed to obtain RR series. The proposed detectors, applied to these RR series, are composed of two HMM or HSMM models, each one representing two distinct physiopathological states: i) HMMr or HSMMr (reference models) to characterize the absence of apnea-bradycardia and ii) HMMb or HSMMb (bradycardia models) to characterize the presence of apnea-bradycardia. A learning phase, based on an expectation-maximization algorithm, is firstly applied to each model in order to estimate their parameters from a learning dataset. Then, using a sliding window, the models are applied to a set of new observations, to compute the log-likelihood of each model for each time instant: LL(HMMr,t), LL(HMMb,t), LL(HSMMr,t), LL(HSMMb,t). Detection of the events of interest is based on the comparison of log-likelihoods with respect to a threshold: LL(HMMr,t)-LL(HMMb,t)>THR1 or LL(HSMMr,t)-LL(HSMMb,t)>THR2. The optimal detection configuration was obtained in terms of sensitivity (SEN), specificity (SPC) and detection delay (DD).
Results: Results show that the HSMM detector provided a SEN, SPC, DD of 90.38%, 92.23%, 0.92±3.56s, while the HMM detector showed 88.42%, 89.67%, 1.60±3.72s. The performance obtained from both of these methods is higher than that obtained from traditional approaches, based on fixed (77.11%, 79.31%, 4.63±5.04s) or adaptive (73.35%, 87.36%, 4.16±8.79s) thresholds. Conclusion: The analysis of the dynamics of the time series, through the HSMM, allows for a significant improvement of sensitivity and specificity, with a reduction of the detection delay. Current work is directed towards the clinical evaluation of these methods in a prospective trial
.
S64
Computing in Cardiology 2012, Kraków, Poland 103

Analytics Framework for Modeling Critical Care Data
Sharath Cholleti, Gabriel Najarro, Alistair Johnson*, Jeffrey Jopling and Timothy Buchman
Emory University Atlanta, United States
A data analytics framework is useful in solving similar predictive
modeling problems with minimal changes while capturing clinical knowledge. We present a framework that is designed for predicting mortality of intensive care patients but that is useful for other tasks like early detection of sepsis. The main modules include denoising, clinically meaningful variable categorization, feature generation, feature selection, data subsetting, and ensemble learning with various machine learning algorithms. As the labeled data set is limited clinically meaningful categorization of lab results and vital signs like cholesterol, sodium, or heart rate into low, normal, and high is crucial. Multiple variable combination measures, system level metrics like cardiovascular or immunological measures, and acuity scores are important to capture the clinical knowledge of overall patient status. All these features are computed at multiple time points and their trends over time are derived. To capture the statistical information in the data set, we calculate combinations of multiple variables and their trends to construct a large number of features. Then feature selection is done by algorithm Winnow, which depends on log of irrelevant features, to efficiently select good features from an extremely large set of features. As the number of data elements for patients differ one model is not accurate for all patients. We group the patients by similarity of features available and their clinical state. Then for each subset ensemble learning is used to generate and combine numerous machine learning models to predict mortality. We use support vector machines, gradient boosting machines, and random forest algorithms. 10-fold Cross validation is used train and validate on different subsets. The framework allows for easy addition or replacement of algorithms for feature generation, selection and learning models. Our current event 1 score is 0.427817 and event 2 score is 75.5147
.
S71
104 Computing in Cardiology 2012, Kraków, Poland

Physionet/Cinc 2012 Challenge: Prediction of Mortality in the ICU
Srinivasan Vairavan*, Abigail Flower and Syed Haider
Philips Research North America Briarcliff Manor, United States
In the last decade, there has been an increasing development in intensive care medicine, where the goal is to provide the best outcome for critically-ill patients. Intensive care improvement comes with a price since resource limitation restricts intensive care to those in dire need. The current state-of-art in critical illness severity assessment is metrics such as SAPS I, APACHE, SOFA, and others. These scoring systems help clinicians prioritize resources and determine the appropriate diagnostic/therapeutic plan for each patient. Further, these scores are used for the prediction of mortality. We propose a linear discriminant analysis (LDA) model for the prediction of mortality in the intensive care unit (ICU). Our model uses demographics, vital signs and laboratory values such as urine output, age, shock-index, PaO2/FiO2 ratio, creatinine, albumin, BUN and creatinine clearance (estimated using the Cockroft –Gault formula), for the prediction of mortality. The model was trained on the 4000 ICU patient data provided by Physionet Challenge 2012. The performance of the model is assessed by two event scoring metrics, namely, minimum of sensitivity and PPV, to predict in-hospital mortality, as well as H-statistics, to assess the accuracy and utility of in-hospital mortality prediction. The model was validated on the unseen test data of 4000 ICU patients provided by Physionet. The model achieved a score of 0.33 for the first event and 445.23 for the second one. The results of the proposed model are encouraging especially because the features used are heavily dominated by renal dysfunction assessment only. In phase 2 of the challenge, additional features assessing other organ dysfunction will be used, and new data-mining techniques will be explored, in order to achieve better scores for the two events
.
S71
Computing in Cardiology 2012, Kraków, Poland 105

Predicting In-hospital Mortality of Intensive Care Unit by Analyzing Histogram of Medical Variables under Cascaded Adaboost Model
Chucai Yi, Yingli Tian, Yi Sun
City College of New York, City University of New York, New York, USA
Introduction: An effective method is developed to predict in-hospital mortality (IHM) during intensive care unit (ICU) stay based on specific med-ical variables. This work involves both binary mortality predictions and mor-tality risk estimates, corresponding to the two events of this challenge. 12,000 ICU records are released as CinC Challenge data, of which 4000 records at-tached with target outcomes are used as training set. Each record covers 41 medical variables during the first 48 hours of an ICU stay. The variables have difference frequencies of occurrences.
Methods: Step-1: For each patient record, firstly, we apply nearest neigh-boring interpolation to expand the medical variables at the interval of every minute. Secondly, we slice the range of 48-hour ICU stay into 48 time win-dows, and calculate the average values of each medical variable within each time window to obtain 1968 observations of the record. Step-2: For each ob-servation of all records in training set, normalized histograms are built from medical data of death and survival patients respectively. Step-3: The observa-tions are assigned to be differences of the normalized histograms (see the
Figure), which are transformed into feature vectors and input into a Cascaded Adaboost learning model for training and testing the scores of mortality pre-diction and risk estimate.
Results: In the testing set, the learned classifier is applied to each record to pre-dict death/survival and mortality risk. Score1, the minimum of sensitivity (Se) and positive predictivity (+P), evaluates the binary mortality prediction. Score2 from Hosmer-Lemeshow-H statistic evaluates the risk estimate. The table presents the results of our method and the benchmark method based on SAPS-1.
Figure: Histogram on Cholesterol. The shaded regions denote normal range.
Phase 1 Results of the Challenge
Score1 Score2
Our Method 0.378 223.236
SAPS-1 0.296 68.392
S71
106 Computing in Cardiology 2012, Kraków, Poland

Combining Machine Learning and Clinical Rules to Build an Algorithm for Predicting ICU Mortality Risk
Michael Krajnak*, Joel Xue, William Balloni and Willi Kaiser
GE Healthcare Milwaukee, United States
In this study we aim to develop a decision support application for
predicting ICU mortality that starts with a clinical analysis of the problem but that also leverages machine learning to help create an algorithm with good performance characteristics. By starting with a clear basis in clinical practice we hope to improve algorithm development and the transparency of the resulting system. We start with a general model structure for a fuzzy rule based system (FIS). The overall structure can be specified by clinicians who identify the inputs and the applicable rules. An optimizer based on a genetic algorithm generates the numerical coefficients for the membership functions and selects the outcomes categories for the final solution. Using the 2012 PhysioNet/CinC Challenge data set we constructed a phase 1 system using an engineering centric approach. We selected features using a Neural Network based feature perturbation analysis and took a single feature per rule naive approach to constructing the rules. Our initial FIS's achieved scores of 0.38 for event 1 and 93 for event 2. In phase 2 we made a more robust attempt to include clinical knowledge by interviewing clinicians who helped define a new rule base and then applying more signal processing and feature enhancement techniques. In the final phase we achieved TBD for event 1 and TBD for event 2. We believe this work shows that machine learning techniques that are modeled directly on the clinical understanding of a problem can be competitive with more abstract machine learning approaches but may be preferable because of their explainability and transparency
.
S71
Computing in Cardiology 2012, Kraków, Poland 107

Predicting mortality risk of ICU patients using aRandom Forest classifier
Thanh Hai Dang, Koen Smets, Walter Verbrugghe, Philippe G Jorens,Tim Van den Bulcke
Biomina - Biomedical Informatics Research Center Antwerp, UZAWilrijkstraat 10, 2650 Edegem (Antwerp), Belgium
Motivation: Intensive Care Units (ICUs) collect various essential data in-cluding lab results and monitoring measurements of physiological data. Thesize and heterogeneity of these datasets, however, hinders the development ofnovel predictive models and novel insights. This study aims at developing acomputational model for predicting in-hospital mortality risk of ICU patients.Assessing and predicting mortality in advance is an important task, which al-lows preventive actions w.r.t. treatment and medication schemes.
Method: The recorded data consists of 42 monitoring variables, for thefirst 48 hours after admission to ICU for 4,000 patient stays. Set A from thePhysioNet/CinC Challenge 2012 was used to build and validate a mortality riskprediction model. Our method first generates a large number of potentially use-ful derived features, such as min, max, mean and trend of time series variablevalues, from each variable and for different time windows. These derived fea-tures are subsequently used to train a Random Forest model. Model parametersettings were further optimized w.r.t. the CinC challenge metrics.
Results: The derived dataset with 1,120 features has been applied in a cross-validation setting to assess the in-hospital mortality prediction performance ofthe model. The optimal prediction model has a sensitivity of 69%, a specificityof 95% and a positive predictive value of 70%. Furthermore, after being evalu-ated by the CinC challenge organizer, the presented model received a score of0.34331 and 562.887 for the CinC challenge event 1 and 2, respectively.
Conclusion: The validated performance scores demonstrate the efficacy ofthe presented model in predicting in-hospital mortality risks for ICU patients.It is potentially meaningful to be implemented as a clinical decision supportsystem in ICUs. Furthermore, the presented model also estimates the individ-ual importance of each of the variables in the prediction, which is crucial forclinical insight and establishing trust.
S71
108 Computing in Cardiology 2012, Kraków, Poland

Effect of Hyperglycemia on Cardiac Autonomic Func-tion in Type 2 Diabetes Mika P. Tarvainen
1,2, Jukka A. Lipponen
1, Hayder Al-Aubaidy
3, Her-
bert F. Jelinek3
1University of Eastern Finland, Kuopio, Finland;
2 Kuopio University Hospital,
Kuopio, Finland; 3Charles Sturt University, Albury, Australia
Heart rate variability (HRV) is reduced in diabetes mellitus (DM) patients,
suggesting dysfunction of cardiac autonomic regulation which has been asso-
ciated with increased risk for cardiac events. The aim of the present study
was to examine the associations of blood glucose level (BGL) and duration of
diabetes with autonomic nervous system (ANS) function assessed by HRV
analysis.
Resting HRV and BGL measures of 33 healthy controls and 55 type 2 di-
abetes mellitus (T2DM) patients were analyzed. Some of the subjects were
measured more than once (1-5 visits per subject during 2002-2011, on aver-
age 2 visits per subject) resulting in 174 measurements. HRV data were ana-
lyzed using time-domain, frequency-domain and nonlinear methods.
The effect of glycemia on different HRV parameters was first evaluated.
Mean RR interval had a negative correlation with BGL (r = -0.34; p < 0.001)
and the long term fluctuations slope of detrended fluctuation analysis (DFA)
increased (r = 0.20; p < 0.05). In addition, there was a trend towards lower
HRV dominated by decrease in high frequency (HF) power.
Secondly, the effect of diabetes duration on different HRV parameters was
evaluated. Mean RR did not correlate with disease duration, but HRV was
decreased in long-term diabetics. This was shown by decreases in SDNN (r =
-0.476; p < 0.001), RMSSD (r = -0.364; p < 0.001), LF power (r = -0.511; p
< 0.001), HF power (r = -0.394; p < 0.001), and Poincare plot indices SD1 (r
= -0.361; p < 0.001) and
SD2 (r = -0.495; p <
0.001). Glycemic values
were not associated
with disease duration.
The results of this
study indicate that ele-
vated glycemic values
have an unfavorable
effect on cardiac auto-
nomic function and this
effect is pronounced in
long-term T2DM pa-
tients. Main HRV findings associated with glycemic level and disease duration (*p < 0.05; **p < 0.01; ***p < 0.001).
S72
Computing in Cardiology 2012, Kraków, Poland 109

Effect of Oolong Tea on Reducing Heart Rate Variability in Acute Stress
Vincent Viengkhou, Tina Hinton, Slade Matthews, Graham A Johnston, Mika P Tarvainen* and Herbert F Jelinek
Australia
GABA-containing tea such as oolong tea has gained popularity as an ac-
cessible intervention to reduce the impacts of chronic stress-induced auto-nomic imbalance as a risk factor for cardiovascular disease despite a lack of evidence concerning the GABA content in a cup of the tea and its effects on physiological and psychological stress. Reverse-phase HPLC was used to determine GABA content in a 200mL cup of each of these teas brewed to manufacturers instructions. We measured the effects of acute consumption of oolong tea (GABA content range: 0.07mg/200mL to1.1mg/200mL) on heart rate variability and acute stress in 30 participants aged 18-30. A self-assessment of acute stress levels was con-ducted before and after tea consumption by asking the participant to rate “how stressed you feel right now, at this exact moment in time” on a scale of 1 (“relaxed”) to 10 (“highly stressed”). Ten minute lead II ECG recordings (MacLab, ADInstruments) and pre-processed using Chart 5 software (ADInstruments) was recorded. Heart rate variability was measured pre and post tea consumption using time and fre-quency domain analysis (Kubios, University of Eastern Finland) including SDNN, RMSSD, TP, HF, LF and LF/HF. Statistical analysis was by two-way ANOVA for two-group comparison with time as an interaction and a significance level of p<0.05. Oolong tea consumption led to a significant main effect of time for the de-crease in acute stress score (0.547 ± 0.279 to 0.387 ± 0.256; F=34.422, p<0.001) and increase in TP (3.364 ± 0.276 to 3.519 ± 0.331; F=15.221, p<0.001), LF (2.726 ± 0.338 to 2.834 ± 0.374; F= 5.564, p<0.05) and HF (2.852 ± 0.385 to 3.022 ± 0.397; F=9.343, p<0.005). We conclude that autonomic imbalance and heart rate variability in people with acute stress is significantly reduced following a cup of oolong tea
.
S72
110 Computing in Cardiology 2012, Kraków, Poland

The relevance of HRV parameters for drivers workloaddetection in real world driving
Benjamin Eilebrecht, Stefan Wolter, Jeroen Lem, Hans-JoachimLindner, Rainer Vogt, Marian Walter, Steffen Leonhardt
RWTH Aachen UniversityAachen, Germany
Aims: Since a couple of years, a trend of the automotive industry towardssafety systems, considering the driver’s status, is observable. Many researchgroups already faced the question, which vital sign could be used for this pur-pose. Others concentrated on the feasibility of vital sign detection withoutreducing the mobility of the driver. The electrocardiogram allows extractingthe heart rate variability (HRV), which is known to be affected by mental stressand workload. Latest research results have shown that an ECG recording in acar is feasible without attaching adhesive electrodes. This paper addresses thequestion which HRV parameters are of interest for workload detection duringcar rides.
Methods: A case study with four subjects was performed driving fromAachen to Brussels and back to Aachen. During the drive a standard ECGwas recorded and stress level was assessed by means of a reduced NASA TLXquestionnaire. Different HRV parameter in the frequency and the time domainwere extracted from the ECG and evaluated concerning their correlation to theperceived stress level.
Results: The results of the study showed that both the parameterized andthe non-parameterized low frequency components, the mean heart rate and themean RR interval differed significantly between highway drives and city drivesin Brussels for all subjects, but only the percentaged low frequency componentsshowed meaningful correlations with the reference stress level.
Conclusion: The results show that some parameters might be useful forworkload monitoring of drivers. However, HRV parameters are error-pronetowards missing data. Before reliable application, first new approaches forreducing the sensitivity of HRV parameters towards missing RR intervals, e.g.by means of interpolation in case of motion artefact interference, need to befound.
S72
Computing in Cardiology 2012, Kraków, Poland 111

Non-linear Analysis of Heart Rate Variability and Its Application to Predict Hypotension during Spinal Anesthesia for Cesarean Delivery
Laura Canga*, Augusto Navarro, Juan Bolea, Jose M Remartínez, Pablo Laguna and Raquel Bailón
University of Zaragoza Zaragoza, Spain
Aims:Hypotension episodes occurred during cesarean delivery are one of
the main disadvantages of spinal anesthesia. Our hypothesis is that hypotension episodes may be caused by alterations in Autonomic Nervous System regulation due to the stress induced by the impending surgery. Analysis of Heart Rate Variability (HRV) is considered as a non-invasive measure of these alterations. The aim of this work is to evaluate the capability of four non-linear HRV measures (Correlation Dimension, Pointwise Correlation Dimension, Approximate Entropy and Sample Entropy) to predict hypotension during spinal anesthesia.
Methods: The ECG signal from 11 women with programed cesarean delivery was recorded at the University Hospital Miguel Servet of Zaragoza, Spain. Five women developed hypotension during surgery, while six did not. Two ECG recordings were available from each woman: one recorded the night before the surgery and another one recorded immediately before the cesarean. During both records, women adopt two positions: lateral decubitus and supine position. The four non-linear methods were applied to RR-interval series obtained using a wavelet-based ECG delineator.
Results: A statistically significant increase in Correlation Dimension and Pointwise Correlarion Dimension has been appreciated for women who developed hypotension, with respect to women who did not developed it, during the lateral decubitus position, while a statistically significant reduction has been observed during the supine position. Regarding to Approximate Entropy and Sample Entropy, a no statistically significant decrease has been observed for women who developed hypotension, with respect to women who did not developed it, in the supine position but not in the lateral decubitus. All these changes have been detected only in the recordings registered immediately before the surgery. Conclusion: Despite the reduced database, changes in the non-linear measures have been detected, which suggests the potentiality of non-linear HRV analysis in the prediction of hypotension during spinal anesthesia for cesarean delivery
.
S72
112 Computing in Cardiology 2012, Kraków, Poland

Fetal Heart-rate Variability Response to Uterine Contractions during Labour and Delivery
Philip A Warrick* and Emily F Hamilton
Perigen Inc. Montreal, Canada
Objectives The objective of this study was to decompose fetal-heart rate
variability (fHRV) into a quiescent component unrelated to contraction and a peak component response to contraction. We also wanted to compare these measures to averaged fHRV measures that we have used in the past. Methods The data consisted of 136 cardiotography (CTG) recordings of singleton, term pregnancies having no known congenital malformations, with at least three hours of tracing just prior to delivery. Each tracing was labelled by outcome information available after delivery (blood gases and neurological assessment). 66 of the cases were normal and 70 were severely pathological. Short-term (1 min) autoregressive models were constructed at one second increments. Power spectral density (PSD) estimates were computed from the autocorrelation and the spectrum was integrated over low frequency (LF, 30- 150 mHz) and movement frequency (MF, 150-500 mHz) bands to obtain two instantaneous components of fHRV. Using overlapping 20 min epochs, the quiescent and peak components of each band were computed from the 5th and 95thpercentiles of their probability distribution functions. We compared these short-time window fHRV estimates to those that we have used in previous studies based on a autocorrelation window equal to the 20 minute epoch length. Results Figure 1 shows that the MFp component had statistically significant di erences between N and P cases in 10 of 16 epochs, and were nearly contiguous from -150 to -50 min, including epochs -120 to -60 min where the MFm di erences were not significant. The LF di erences were greater in number (9 versus 6 epochs) for the LFm compared to the LFp components. Generally the peak components were more discriminating than the quiescent ones. Conclusions fHRV can be decomposed into quiescent and peak components and this provides complementary discrimination information to the single average
.
S72
Computing in Cardiology 2012, Kraków, Poland 113

A New T-wave Frequency Based Index for Discrimination of Abnormal Repolarization
Corrado Giuliani and Laura Burattini*
Polytechnic University of Marche Ancona, Italy
Abnormalities in the cardiac repolarization phase and, thus, in the
electrocardiographic (ECG) T wave, are known to be associated to an increased susceptibility to cardiac electrical instability. In the attempt to noninvasively discriminate pathological from healthy conditions, several T-wave indexes have been proposed in the literature, none of which, as far as we know, based on the T-wave frequency content. Thus, aim of the present study was the design of such innovative index, here defined as the T-wave cumulative normalized energy at 10 Hz (TCE10; in %). Performance of TCE10 in discriminating abnormal repolarization cases was tested by independently analyzing the three orthogonal (X,Y,Z) leads of ECG recordings from 23 control healthy (CH) subjects and 23 antero-septal acute myocardial infarction (ASAMI) patients. For each lead, an TCE10 threshold value, under which cases showing abnormal repolarization were identified, was defined as the 25th percentile of the TCE10 distribution relative to the CH population. Results indicate that the ASAMI population was consistently characterized by lower TCE10 values than the CH population (X: 93.9±5.9% vs. 98.2±1.2%, P<0.01; Y: 95.2±4.5% vs. 97.8±1.4%, P<0.01; Z: 97.4±1.6% vs. 99.1±1.5%, P<0.01). Moreover, the ASAMI patients were discriminated from the CH subjects with a sensibility and a specificity of 78% and 74% in lead X, 61% and 74% in lead Y, and 87% and 74% in lead Z, respectively. Thus, repolarization abnormalities in the ASAMI patients were better highlighted in lead Z than leads X and Y. In conclusion, our innovative TCE10 index appears as a promising tool to noninvasively discriminate cases characterized by T-wave abnormalities. Since abnormal repolarization can be a spatial phenomenon depending on the affecting disease, the optimum lead to be used for an TCE10-discrimination may also be disease dependent
.
S73
114 Computing in Cardiology 2012, Kraków, Poland

A New Robust T Wave Alternans Detector and its Threshold Optimization
Olivier Meste, Darek Janusek* and Michal Kania
UNS/CNRS Sophia Antipolis Cedex, France
Among the TWA detectors, the spectral method (SM) is a detector apart
from others because the data are projected onto a basis where the interferences are more efficiently processed. Indeed, this method is a typical interval confidence computation based on the norm of the normalized frequencies Fourier transform Ff at f = 0.5. In order to get a robust detector with respect to spikes due to cosines and to exploit the entire frequency band to reduce the variance, we propose to compute a new value called SMM (F 0.5/median(F ]0.5, 0[)). The second stage of this work is to optimize the threshold selection by using a full Monte-Carlo simulation where alternans/no-alternans episodes of length 16 with magnitude of 2 are corrupted by a gaussian noise with different powers and a sinus with different frequencies. All the combinations of noise and frequency, repeated 500 times, are selected in order to compute a mean probability of detection (Pd) and mean false alarm probability (Pfa) for different thresholds. Imposing Pfa=0.05, we get the Pd for the t-test, matched paire t-test, GLRT, SM, SMM equal to 0.65, 0.68, 0.63, 0.75, 0.8, respectively. The optimized threshold is 2.05 for SMM and 3.6 for SM. Study group consisted of 50 patients with ICD stimulation (ventricular) at 100bpm (age: 55.3 σ16.42; LVEF: 42.8 σ15.5). Two minutes recordings were analyzed. XYZ orthogonal lead system was used. The best performance was detected with use of SSM method in comparison to standard SM. Positive TWA was detected when median of time duration of all episodes above threshold was greater than 0.8 ms. As a criterion the correlation with occurrence of VF episodes in follow-up was chosen. SSM method has prediction factor of VF 25%, higher than SM method (11%)
.
S73
Computing in Cardiology 2012, Kraków, Poland 115

Study of Cardiac Repolarization during Oral Glucose Tolerance Test in Metabolic Syndrome Patients
Pedro Virgilio Rivera Farina*, Erika Severeyn, Sara Wong and Javier Pérez Turiel
Fundación CARTIF Boecillo, Spain
Aims: QT interval could be relevant for cardiopathy assessment in
metabolic syndrome (MS) because of the increased difficulty the cells have to metabolize glucose, thus possibly prolonging QT intervals. The aim of this paper is to explore whether QT interval is altered in MS patients during the Oral Glucose Tolerance Test (OGTT).
Methods: This database includes 10 healthy subjects and 15 MS patients undergoing OGTT. The ECG recordings were performed at sampling frequency of 1000 Hz, 16 bit resolution and 12-lead records. Each data set includes: 15 minutes ECG signal acquisition before the OGTT and before each blood samples extraction (30, 60, 90, 120 minutes). The wavelet transform method was used for delineating the ECG in this work. In order to find the end of T-wave, an alternative to threshold methods was used. This variation finds the extreme on the third derivative, which first appears ahead of the local maxima of a T-wave.
Results: The mean and the standard deviation (STD) of all QTc were calculated in each record. It was found a slight enlargement of the QT interval in MS respect to healthy subjects, however the difference doesn’t seem to be of statistical significance. Yet, MS patients show a significant decrease in their STD respect healthy subjects. According to Bazzet's correction 33ms in controls vs. 13 ms in MS; and according to Fridericia's formula 26ms in controls vs. 10ms in MS. This translates in intra-register reduced variations in SM patients respect to their healthy counterparts. This makes us think that metabolic syndrome patients might show reduced QT variability just as they show reduced heart rate variability. QTc, on the other hand, didn't seem to vary during the test
.
S73
116 Computing in Cardiology 2012, Kraków, Poland

QT Analysis of Intrauterine growth retarded and Normal children at 10 years old Taher A. Biala, Fernando S. Schlindwein & Michael Wailoo University of Leicester Leicester, UK
Introduction: Coronary heart diseases are one the major causes of death in
the world. Studies of Barker showed that intrauterine growth retarded chil-
dren (IUGR) are prone to coronary heart diseases and hypertension in their
adult-hood. A prolonged QT in the ECG indicates a myocardium at risk for
trig-gered activity, where the cardiac cell will rapidly and repeatedly depolar-
ize, and this is associated with dangerous Ventricular tachyarrhythmia. In this
work the QT for the IUGR and normal children are measured and compared
to check for any significant differences between the two groups.
Methods: The 24 hr ECG of 75
(9 to 10 yrs) normal and IUGR
children were resampled from 128
Hz to 512 Hz for better R detec-
tion, then an algorithm was devel-
oped to find the corrected QTc,
QRS interval, and ST interval by
means of detection and delineation
of Q, S, and T waves (figure 1).
Results: Normal children have QRS intervals during awake (73.96 ±13.65
ms) and asleep (78.75±14.76 ms), and IUGR has (73.94 ±12.85 ms day,
75.98±14.80 ms night), and IUGR children have a slightly higher corrected
QTc (418.25±28.92 ms Day, 437.22±20.17 ms night), compared to normal
(411.37 ±36.13 ms day, 431.79±20.12 ms night).
Conclusion: There is no significant difference between normal and IUGR
children with regard to the limits of the ECG. All measured intervals within
published Pediatric ECG limits. The algorithm needs improvements for vari-
ous ECG morphologies. A study of QT/RR can be analysed to look at
dynamicity.
Figure 1: ECG waves detection.
S73
Computing in Cardiology 2012, Kraków, Poland 117

A Machine Learning Approach for LQT1 vs LQT2 Dis-crimination Rémi Dubois1,4*, Fabrice Extramiana2, Isabelle Denjoy2, Pierre Maison-Blanche2, Martino Vaglio3, Pierre Roussel4, Fabio Babilini3, Antoine Leenhardt2 1LIRYC, Université de Bordeaux, F33000, Bordeaux, France 2Service de Cardiologie, AP-HP, Hôpital Bichat, F-75018, Paris, France 3Amps IIc, New-York, NY 4Sigma lab, ESPCI-ParisTech, F75005, Paris, France Background: Long QT syndrome (LQT) is a congenital disease character-
ized by an abnormal repolarization process that leads to a distortion and a prolongation of the T-wave, visualized on the body surface ECG. It is caused by mutation of several genes all of which encoding cardiac ion channels. Type 1 and type 2 LQT are the most common form of the disease; they are respectively related to the slow and to the fast components of the delayed rectifier potassium current. Genotype is important for clinical management of LQTS patients. However, the turnaround time might be long and T-wave morphology phenotyping remains critical at bedside to discriminate between LQTS types. Methods: We propose an algorithm to automatically discriminate patient
with type 1 and type 2 LQT. The core of the method is the modeling of the T-wave re-computed on its principal lead by a single parameterized function named Bi-Gaussian Function (BGF). BGFs are specifically designed to fit the T waves; each parameter of the BGF is associated with a morphological characteristic of the T wave: amplitude, position in time, ascending slope and descending slope. From all the available features, a statistical analysis was performed to select only the relevant ones for the LQT1 vs LQT2 discrimina-tion that was performed by a Linear Discriminant Analysis (LDA). Results: A database composed of 410 genotyped LQTS patients (LQT1,
n=266; LQT2, n=144) was used in this study. Half of the data (LQT1, n=124; LQT2, n=72) were used to search for the relevant features and to design the LDA classifier according to a cross-validation process. The other half was used to evaluate the performances. The results were compared to the blind analysis of two physicians: a cardiac electrophysiologist and an LQTS expert. The percentage of good classifica-tions obtained by the automated method, with respect to the database, was 81.0%, as compared to 70.0% for the cardiac electrophysiologist and to 81.5% for the LQTS expert.
S73
118 Computing in Cardiology 2012, Kraków, Poland

Exercise-induced Repolarization Alternans Heterogeneity in Patients with an Implanted Cardiac Defibrillator
Laura Burattini*, Sumche Man and Cees A Swenne
Polytechnic University of Marche Ancona, Italy
Repolarization alternans (RA), generally recognized as a promising
noninvasive index for risk stratification, is often measured under exercise conditions, since RA increases its amplitude with heart rate. Instead, the effect of exercise on the RA location along the JT interval is still unknown. Aim of the present study was to evaluate exercise-induced RA heterogeneity in terms of both amplitude and location. To this aim, we analyzed the ECG precordial leads (V1-V6) of 38 patients with an implanted cardiac defibrillator (ICD) who underwent a bicycle ergometer test during which the working load was increased from zero (NoWL) to the patient’s maximum capacity (MaxWL). RA was analyzed using our heart-rate adaptive match filter method, which provides an RA parameterization in terms of amplitude (RAA; µV) and location, the latter measured as time-delay with respect to the T-wave apex (RAD; ms). According to our results, RAA was higher during MaxWL (V1: 19±9 µV; V2: 30±20 µV; V3: 35±35 µV; V4: 35±30 µV; V5: 39±23 µV; V6: 37±28 µV) than NoWL (V1: 12±7 µV; V2: 19±15 µV; V3: 18±15 µV; V4: 17±13 µV; V5: 19±13 µV; V6: 17±13 µV; P<0.05 for all leads but V6). Moreover, RA occurred earlier along the repolarization segment during MaxWL than NoWL, being RAD smaller for the former (V1: 33±31 ms; V2: 29±34 ms; V3: 22±31 ms; V4: 21±28 ms; V5: 19±38 ms; V6: 6±27 ms) than the latter (V1: 80±54 ms; V2: 56±61 ms; V3: 70±52 ms; V4: 57±55 ms; V5: 77±40 ms; V6: 43±49 ms; P<0.05 for all leads). Thus, in our ICD population, RA generally occurred late in the repolarization segment (after the T-wave apex, as indicated by positive values of RAD) during both NoWL and MaxWL conditions. However, during MaxWL, beside increasing its amplitude, RA moved toward the T-wave apex
.
S73
Computing in Cardiology 2012, Kraków, Poland 119

Dynamics of Scroll Waves of Excitation in aMathematical Model of Ischaemic Border Zone.
Irina V. Biktasheva, Vadim N. Biktashev, Narine A. Sarvazyan
University of LiverpoolLiverpool, UK
Objectives: Abnormal electrical activity from boundary of ischaemic tissueis one of major causes of ischemia-reperfusion arrhythmias. Exact mechanismsof reperfusion arrhythmias remain poorly understood. Here we used asymp-totic theory of spiral waves drift based on response functions to model spa-tiotemporal changes occurring on the ischaemic border zone.
Vortex formation by themoving ischaemicborder.
Methods: We use Beeler- Reuter-Pumir cellmodel with explicit, albeit simplified, description ofindividual ionic currents. Model of ischaemic borderzone includes macroscopic gradients of cell-to-cellcoupling and of cell excitability and microscopic het-erogeneity of individual cells. We use the responsefunctions to compute specific forces acting on scrollwaves in the vicinity of recovering ischaemic border:the force caused by curvature of the vortex filament,the forces caused by gradients of diffusivity and ex-citability, and the force caused by heterogeneity ofcell excitability.
Results: The interplay between specific forces al-lows one to explain how vortices form, drift together with the moving bound-ary, get transiently pinned to local inhomogeneities, and finally penetrate intothe bulk of the well-coupled tissue where they reach macroscopic scale. Like-lihood of vortex escape into better coupled tissue depends on the speed is-chaemic border zone recovery. When and if scrolls escape into better coupledtissue, they might collapse due to positive filament tension. However, at cer-tain parameters of the medium, filament tension becomes negative, causingscroll filaments to expand and multiply leading to fibrillation-like state. Directnumerical simulations with deliberately arranged conditions confirmed the the-oretical predictions for the evolution of vortices.
Conclusions: Response function method allowed us to expand conclusionsfrom two dimensional cardiomyocyte cultures to three dimensions. The like-lihood of formation and expansion of 3D scrolls was linked to a number ofparameters including the speed of ischaemic border zone recovery.
S74
120 Computing in Cardiology 2012, Kraków, Poland

On the Use of the Bidomain Model for Computing the Position and Size of Ischemic Regions; a Validation Study
Bjørn Fredrik Nielsen*, Marius Lysaker and Per Grøttum
Norwegian University of Life Sciences, Norway Ås, Norway
We explore the possibilities for using body surface potential maps
(BSPM) and the bidomian model to estimate the geometrical properties of ischemic regions in the heart. If this inverse problem can be solved with sufficient accuracy, then one may introduce a new imaging device with significant clinical value. In our approach, the ischemic region is identified by minimizing an objective function measuring the difference between the recorded and simulated BSPMs. The associated forward problem is solved by applying the finite element method. Previous studies have been limited to synthetic data for which this method works very well. Since the associated mathematical problem is highly unstable, it is not obvious that results obtained in a pure in silico environment will hold in a clinical setting – the method must be validated. A (partial) validation study of the method has been performed by comparing inverse solutions with images taken with perfusion scintigraphy. Rather promising results for a number of patients are presented. Nevertheless, the original algorithm, which has been reported to work well for synthetic data, had to be modified. Our presentation will also contain some details about this latter issue
.
S74
Computing in Cardiology 2012, Kraków, Poland 121

Modeling of Heterogeneity in Electrical and Mechanical Function of Guinea Pig Ventricular Myocytes Anastasia Vasilyeva1, Olga Solovyova1,2 1Institute of Immunology and Physiology Ural Branch of Russian Academy of Sciences 2Ural Federal University, Ekaterinburg, Russia
Heterogeneity of cardiac tissue proved to be important for understanding heart physiology and pathophysiology. In contrast to a number of papers addressing the electrophysiological heterogeneity of cardiomyocytes, much less is known about heterogeneity of the mechanical function. As to our knowledge, there are no detailed models, which take into account specific features of the mechanical behavior of cardiomyocytes from different regions of the ventricular wall.
Aims: The aim of this study was to develop improved mathematical models of the electrical and mechanical function of cardiomyocytes from subEPI- and subENDOcardial ventricular layers that take into account specific features of intracellular mechanisms underlying pronounced regional differences in the functional properties of the cells in guinea pig.
Results: To develop EPI and ENDO models we used experimentally derived data on the differences in electrophysiological parameters (ionic currents, channel isoform expression, etc.) and in the intracellular mechanics (different rates of cross-bridge cycling, cooperativity of calcium activation of contractile proteins, etc.) in the cells to accurately reproduce respective differences in the shape and duration of action potential, Ca2+ transient and contraction. Our ENDO model produces longer action potential, bigger time to peak shortening, more slow decay of Ca2+ transient and higher passive tension as compared to the EPI model, while both amplitude of isometric force and Ca2+ transient being similar in the EDO and EPI virtual cells. These results adequately reproduce the respective experimental data.
S74
122 Computing in Cardiology 2012, Kraków, Poland
Effects of fibroblast on cardiac electro-mechanics: a cube modeling study
Heqing Zhan*, Yunliang Zang, Yinglan Gong and Ling Xia
Zhejiang University Hangzhou, China
Aims: Previous studies of cardiac electromechanical coupling have
largely focused on myocytes, while fibroblasts, which comprised the majority of nonmyocyte cells in the heart, have not been widely concerned. This study aimed to verify possible influences of fibroblasts on cardiac electro-mechanics with a real coupled cube model, which allowed the understanding of the performance of the simulation framework without the complex behaviour of varying fibre axes and anatomically based geometry.
Methods: The overall cube measures 16×16×16 mm, consisting of 125 unit cubes and 81×81×81 cells. Myocytes and fibroblasts were distributed in different regions. At the cellular level, the ten Tusscher mathematical model of the human ventricular myocyte and the passive fibroblast model were combined with the J. Jeremy Rice mathematical model of contraction and cooperativity mechanisms. At the tissue level, regions of myocytes and fibroblasts were considered to be elastic bodies with different elastic modulus. The gap junction conductance between a cell and its neighbor was also different. The pole-zero material constitutive law was used with the same parameter values in the fibre, sheet and sheet-normal directions. Numerically, the finite difference (FD) method solved derivatives in electrophysiological equations of myocytes and fibroblasts.
Results: The simulation results showed that at the cellular level, myocyte-fibroblast coupling prolonged APD; at the tissue level, inclusion of fibroblasts slowed down excitation wave propagation, resulting in increased mesh contraction. It also distorted wave-front. Conclusion: The identified effects demonstrated that fibroblasts were an important mechanism in electromechanical coupling and should be considered in future cardiac electromechanical modeling
.
S74
Computing in Cardiology 2012, Kraków, Poland 123

The Effect of Ischaemic Region Shape on ST Potentialsusing a Half-Ellipsoid Model of the Left Ventricle
Josef P Barnes, Peter R Johnston
Griffith UniversityNathan, Queensland, Australia
Aims: A previous study on the shape of ischaemic regions during the STsegment, using a simple slab of cardiac tissue, showed that using different is-chaemic geometries (rectangular, cylindrical and ellipsoidal) can significantlyaffect extracellular epicardial potentials. The present study aimed to comparethese results to those obtained from a more realistic half-ellipsoid model rep-resenting the left ventricle.
Methods: Epicardial extracellular potential distributions (EPDs) were ob-tained by numerically solving the transient bidomain equations using a finitevolume method for the spatial discretisation and a semi-implicit method for thetime integration. Anisotropic conductivities, based on measured values, alongwith linear fiber rotation, were used throughout the myocardium. Ischaemiawas included by taking into account three of the main physiological cellularconsequences including hyperkalaemia, acidosis and anoxia.
Results: Results for the half-ellipsoid model showed that, at low thick-nesses of ischaemia (<40%), a single depression was found on the EPDs forall three ischaemic geometries, located just outside the lateral border of theischaemic region. As the ischaemic thickness was increased beyond 40%, anarea of elevation appeared for the rectangular and cylindrical ischaemic geome-tries, which was located on the opposite side of the ischaemic region. Eleva-tion was not noticed for the ellipsoidal ischaemic geometry until the ischaemicthickness reached 60%. As the ischaemia became transmural, the EPDs for allthree ischaemic geometries were quite similar, with an area of elevation locateddirectly over the ischaemic region surrounded by depression.
Conclusion: The shape of the ischaemic region did not affect the EPDs forthe half-ellipsoidal model as significantly as with the slab model. There were,however, significant differences observed between the EPDs for the slab andhalf-ellipsoid models, using similar shaped ischaemic region.
S74
124 Computing in Cardiology 2012, Kraków, Poland

A Model of Anatomically Opposed Ischaemia
Peter Johnston*
Griffith University Nathan, Australia
Aims: This study aimed to gain an understanding of anatomically
opposed ischaemia, or ``ischaemic ST-segment counterpoise'', by determining epicardial potential distributions (EPDs) resulting from two regions of subendocardial ischaemia during the ST-segment.
Methods: The finite volume method was used to solve the passive bidomain equation in an isolated semi-ellipsoidal model of the left ventricle. Regions of ischaemia of varying size were placed in various positions in the posterior and anterior, inferior or left lateral regions of the ventricular wall. The ischaemia was set at 50% of the thickness of the ventricle wall. The four conductivity values used, for the intracellular and extracellular spaces in the longitudinal and transverse directions, were those obtained experimentally by Clerc. Cardiac fibres rotated through 120 degrees from the epicardium to the endocardium. The ST potential for the ischaemic region was set 30mV lower than that of the normal tissue.
Results: Simulations showed that a large anterior ischaemic region overshadowed a smaller posterior ischaemic region, regardless of the latter's position. The EPDs showed all positive potentials with very similar peak magnitudes and positions, regardless of the position of the posterior ischaemia. Similar EPDs were also obtained from very large single ischaemic regions. Two regions of similarly sized (but small) ischaemia showed EPDs with two peaks of potential which more closely reflected the positions of the ischaemic regions. Not surprisingly, symmetrically placed ischaemic regions gave rise to symmetrical EPDs. For a fixed posterior ischaemic region, moving the anterior ischaemic region towards the apex moved the anterior peak in the EPD more towards the inferior region of the epicardium.
Conclusions: With two ischaemic regions of markedly different size within the left ventricular wall, the larger region dominates the resulting EPD, making the smaller region difficult to observe. Two ischaemic regions of similar size are identifiable on the EPD
.
S74
Computing in Cardiology 2012, Kraków, Poland 125

Towards the Prediction of Mortality in Intensive Care Units Patients: A Simple Correspondence Analysis Approach
Erika Severeyn, Miguel Altuve*, Francisco Ng, Carlos Lollett and Sara Wong
Grupo de Bioingeniería y Biofísica Aplicada, Universidad Simón Bolívar, Caracas 1080, Venezuela
Aims: In the setting of the PhysioNet/CinC Challenge 2012 Event 1, a
new method to predict in hospital mortality in the Intensive Care Units (ICU) is proposed. A predictor, retrieved by Simple Correspondence Analysis (SCA) is based on a combination of clinical and laboratory data with more traditional scores such as APACHEII and SAPS-II.
Methods: Information from records out of 8000 ICU stays lasting more than 48h were divided in two sets: A and B, each one with 4000 records. Up to 41 variables were recorded at least once during the first 48h after admission to the ICU. Using Set A, SCA was applied to select the variables most related to patients who survive or do not survive their hospitalizations. The proposed predictor combines these variables using the more traditional APACHE II and SAPS-II scores. The output of the predictor is 0 if the patient survives and 1 if he does not survive. The predictor performance was evaluated using sensitivity (Se), positive predictivity (+P) and SCORE1=min(Se,+P). In the training phase, a Cutoff Point (CP) associated with the mortality event was titrated in order to obtain the best SCORE1.
Results: SCA results show that variables such as creatinine, urea, bilirubin and mechanical ventilation support were able to discriminate between patients who survive or do not survive their ICU stays. Using these variables, the predictor proposed with an optimal CP=24.25 provides: Se=41.15%, +P=41.01% using Set A, and a SCORE1=41.02% using Set B. Moreover, for a CP=24.15, the predictor shows: Se=41.87%, +P=40.84% using Set A, and SCORE1=41.90% using set B. Conclusion: In this work, the proposed method to predict in-hospital mortality improves SCORE1 in 12.3% when compared with traditional score such as SAPS-I (41.90% vs. 29.60%). Additionally, this predictor is highly reproducible as SCORE1 was comparable with both sets
.
P81
126 Computing in Cardiology 2012, Kraków, Poland

Classification of ICU Patient Records Using Dynamic Bins and Support Vector Machine
Marc Lipoff* and Erez Cohen
Columbia University
Motivation: The 2012 PhysioNet Challenge is to develop a model to
accurately predict survival in the intensive-care unit (ICU). Such models are helpful in comparing different types of ICUs, as well as determining driving forces in the mortality of ICU patients. Several metrics have been developed to date, but there still exists a substantial need for progress. Method: We examine the problem of classifying the mortality outcomes of ICU patients based on a collection medical tests reported as time series, and a training set of given mortality outcomes. The data is regularized with a collection of dynamic buckets that vary across and within the different tests. After cleaning inconsistencies and missing data points, classification is performed using a L1-norm support vector machine. The a priori probability of death is introduced into the model to correct for the imbalance of survivals in the dataset. To ascertain the probability of death, a simple logistic regression is performed based on the distance from the hyperplane. A main contribution and an area of further research is the introduction of group sparsity (across the medical tests) in an approach mirroring group-LASSO regression techniques. We use standard kernels throughout, but the introduction of kernels specialized for sequences and time series is ongoing and shows promising preliminary results. Results: We achieve a score 1 statistic (lower of sensitivity and positive predictivity) of 0.44, and a score 2 (Hosmer-Lemeshow H) statistic of 28.7. Conclusions: In comparison to existing methods, the classification technique presented here offers a much more complex and accurate method for ICU survival predictions
.
P81
Computing in Cardiology 2012, Kraków, Poland 127

Linear Bayes Classification for Mortality Prediction
Martin Macas, Michal Huptych and Jakub Kuzilek*
CTU in Prague Prague, Czech Republic
Aims: This study describes our preliminary solution for PhysioNet
challenge 2012. Its main aim is to predict mortality of ICU patients and obtain good sensitivity, positive predictivity and Hosmer-Lemeshow H statistic.
Methods: We employ a common feature-based approach. Each record consists of 37 time series of different lengths. For each variable, 12 features are extracted from the corresponding time serie (e.g. mean, standard deviation, first and final value, quartiles, lengths, etc). If the feature value is incalculable, it is replaced by not-a-number value. Further, we applied two-step feature selection. First, features with more than 200 NaN values were removed. The remaining NaNs were filled with the mean of their features and the data were scaled linearly to <0,1> interval. Finally, linear Bayes classifier was used for computation of class posteriors and final decision was made according to maximum a posteriori principle. The in-hospital mortality risk was predicted by the corresponding posterior multiplied by a pre-tuned constant.
Results: For set B, our best phase 1 entry received event 1 score = 0.40 and event 2 score = 29.97. Conclusion: Although the described results are preliminary, we can draw some interesting conclusions. In experimental part we compared many different classifiers (e.g. quadratic Bayes, naive Bayes, decision tree, perceptron, nearest neighbor classifiers) and the simple linear Bayes was the best one. The 3 of 10 features that we used were extracted from Temperature time series, 2 features from Creatinine and 2 from Glasgow Coma Score. In the second phase of the competition, we are going to focus mainly on extraction of more features and their more sophisticated selection
.
P81
128 Computing in Cardiology 2012, Kraków, Poland

Robust Prediction of Patient Mortality from 48 Hour ICU Data
Luigi Y Di Marco, Marjan Bojarnejad, Susan King, Wenfeng Duan, Dingchang Zheng, Alan Murray, Philip Langley
Newcastle University Newcastle upon Tyne UK
The aim of this study was to develop a new algorithm to predict individual
patient mortality with improved accuracy with respect to established methods
from data collected over the first 48 hours of admission to the ICU.
A binary classifier was developed to participate in the Physio-
Net/Computing in Cardiology Challenge 2012. The algorithm development
was undertaken using only prior knowledge from the training dataset (Set-A).
Suitable features were extracted for classification. An initial feature vector
(FV) containing 314 features was considered, where each feature was pre-
sented as the minimum, median and maximum of measurements contained in
each subject’s data record separately for the periods 0-24, 24-48 and 0-48
hours. Missing data were replaced by the median values of data obtained
from patients with similar age, weight and gender derived from Set-A only.
10 random partitions of Set-A into subsets which preserved the survivor/non-
survivor ratio were used for feature reduction and cross validation. Statistical
Feature Ranking (SFR) based on a correlation-weighted T-Test was used to
reduce the feature set to 104 features. Classification was based on Linear
Discriminant Analysis (LDA). The algorithm (SFR-LDA) was evaluated by
submission of code to the Challenge test framework and assessed on Set B
for event 1 of the Challenge. For comparison, predictions from an established
algorithm, SAPS-I, were also calculated. The Challenge score was calculated
as the lowest value between sensitivity (Se) and positive predictive value
(PPV) (table).
Set A Set B
Algorithm Se (%) PPV (%) Score
SAPS-1 31.23 29.57 31.60
SFR-LDA 71.84 39.60 39.50
Cross validation provides robust generalisation across databases with
similar results obtained on training and test data sets. Compared to SAPS-1,
the algorithm increased PPV by >10%, and Se by >40% on the training set
and achieved a score of 39.5 (Set B, event 1).
P81
Computing in Cardiology 2012, Kraków, Poland 129
An Unified Acute Physiology Score for Predicting Mortality of Patients in Intensive Care Unit Based on Machine Learning Technology
Tongbi Kang*, Yilun Su and Lianying Ji
Graduate University of Chinese Academy of Sciences Beijing, China
Acuity scores such as SAPS require specific set of physiology variables,
which make them not applicable when one or more of the variables are not provided. For PhysioNet/CinC 2012 Challenge, this is the case. Thus, our objective is to propose a unified acuity score generation framework based on machine learning technology, which can be adjusted according to the variables provided. The 41 general descriptors and time series provided in dataset A with 4000 samples are used to classify the samples independently, among which, 21 physiology variables (8 from SAPS I only; 6 from SPAS III only; 7 from both) with highest classification scores are chosen in our prototype algorithm. Principle component analysis is then applied to reduce the dimension of variables, which is necessary because the size of the dataset A is relative small compared with variable dimension of 21. With the new variable generated by principle component analysis, a non-linear classifier is trained, while the initial parameters are set according to weights in SAPS III. By calculating dataset B provided by the CinC Challenge organizer, the prototype algorithm scored 0. 327 in event 1 and 211.395 in event 2. Acuity scores generated using machine learning technology is scalable and regenerative when different variables are available, and performance is satisfactory when the training dataset is good enough
.
P81
130 Computing in Cardiology 2012, Kraków, Poland

Predicting Mortality of ICU Patients Using statistics of Physiological Variables and Support Vector Machines
Antonio Bosnjak, Guillermo Montilla
Universidad de Carabobo Valencia, Venezuela
We began using the same variables as SAPS-1 score, adding the rest of variables one by one as recommended by physicians, to observe whether the SVM classification improves. These variables include: Age, HR, SysABP, NISysABP, Temp, RespRate, MechVent, Urine, BUN, HCT, WBC, Glucose, K, Na, HCO3, GCS, and other variables were added for phase 1: DiasABP, NIDiasABP, Cholesterol, Creatinine, and SaO2. We found a 6.1% error in the Set-A files due to lack of measures such as: RespRate, Temp, and age. To solve for these errors on phase 1 we chose to input values within the normal range for these physiological variables. Methods: We calculated: mean, stan-dard deviation, and range of variation (max and min) for each one of the physiological variables. These values were placed in nodes corresponding to an index and a value of the variable, which were escalated between 0 and 1. We created a matrix where the columns corresponded to: means and standard deviations of the input variables, and rows corresponded to the individual patient’s records. We decided to use SVM. Five SVM machines were tested and scored. The best corresponds to ν classifier. The training parameters used on the last official entry were: 182.0=ν , 8.1=γ and 01.0=ε . The SVM by Vapnik, is the appropriate learning machine, that minimized the classification error while best finding the hyper-plane of maximum margin that separated the two classes in the featured space. These two classes corre-sponded in our case as: 0 = survivor or 1=died, in-hospital. The probability risk is calculated using the Gaussian distribution that derives from the dis-tance of ν classifier to the margin that separates the two classes. The results were evaluated using two score sets: Event 1 defined as the minimum be-tween the Sensitivity (Se) and positive predictivity (+P) and event 2 based on the Hosmer-Lemeshow statistic. Unofficial results for set-A and official re-sults for set-B are:
Set-A Entry 1 Entry 2 Entry 3 Event 1 0.709386 0.779783 0.815884 Event 2 991.398 1078.99 1055.77 Set-B Entry 1 Entry 2 Entry 3 Event 1 0.260563 0.278169 0.304577 Event 2 545.662 530.001 659.469
Conclusion: we observed an over-fitting of SVM to set-A because the score to event 1 is 0.8158 while the same evaluation using set-B is 0.3045. For phase 2 we are set to improve the training strategy of SVM; separating set-A by a random pattern, in order to correct over-fitting of SVM, and in-cluding different variables and scores.
P81
Computing in Cardiology 2012, Kraków, Poland 131

Incorporating Time Derivatives of Physiological Variables into the SAPS Model: The Physionet/Computing in Cardiology Challenge 2012
Tom Pollard* and Demetrio Martinez
University College London London, United Kingdom
Scoring systems such as Simplified Acute Physiology Score (SAPS) use
single-value chemical and physiological measurements taken during the first 24 hours of a patient's stay in the Intensive Care Unit (ICU). The measurements are weighted by deviations from a normal range and a numerical score is generated which relates to severity of disease and risk of mortality. With modern ICUs now having access to improved technology allowing physiological measurements to be collected at high time resolution, it becomes more straightforward to explore changes in a patient's state over time. Rates of change of physiological variables may be associated with patient instability and risk of mortality, so we are exploring whether modifying the SAPS model to include time derivatives of variables such as heart rate and blood pressure can improve accuracy for predicting mortality. A provisional algorithm was submitted for the Computing in Cardiology Challenge, which received an Event 1 score of 0.280 and an Event 2 score of 37.5 on Test Set B. In comparison the sample SAPS algorithm received an Event 1 score of 0.316 and an Event 2 score of 66.6 for the same dataset. Further work will therefore be undertaken to optimize the modified SAPS algorithm
.
P81
132 Computing in Cardiology 2012, Kraków, Poland
Patient-Specific Intensive Care Mortality Prediction by Data Analyses
Steven L. Hamilton1, James R. Hamilton
1University of Oklahoma Health Sciences Center - Dept of MedicineOklahoma City, OK, USA
Purpose: This research investigated four data evaluation approaches to the Physionet/ Computing in Cardiology Challenge 2012: Predicting Mortal-ity of Intensive Care Unit (ICU) Patients. Methods: The first approach was two group discriminant analysis using
the MATLAB Statistics Toolbox “classify” function. Predictor variables de-rived from Sequential Organ Failure Assessment (SOFA) scores using the set-a data and the set-a outcome data categorized the cases into the groups of interest (“In-hospital death” and “Survivor”). With this information, the two-group discriminant analysis algorithm categorized the set-b data according to a discriminant function specified in the MATLAB “classify” function call.
The second approach used logistic regression. The same predictor vari-ables from SOFA scores as described above, and the set-a outcomes (depen-dent variables) produced regression coefficients using the “mnrfit” MATLAB function. These regression coefficients operating on the SOFA data com-puted for the set-b data produced outcome predictions for the set-b data cases using the “mnrval” MATLAB function.
The third approach used a combination of stepwise linear regression and logistic regression. Instead of SOFA score derived predictor variables, this approach used predictor variables computed directly from the set-a input data. The role of stepwise linear regression was identifying variables for in-clusion in the final model. After identifying the final variables, logistic re-gression produced regression coefficients that operated on the set-b data, pro-ducing predictions for the set-b cases.
The fourth approach used Kolmogorov-Smirnov goodness of fit tests. The set-a data and set-a outcomes data provided the data to construct “In-hospital-death” and “Survivor” populations. The set-b data was then tested against the set-a using either of the MATLAB “kstest” or “kstest2” functions.Results: The second and third approaches produced the best results. The
second approach produced Score 1 of 0.420 and Score 2 of 28.5. The supe-rior third approach produced Score 1 of 0.496 and Score 2 of 22.0.
P81
Computing in Cardiology 2012, Kraków, Poland 133

Predictions of ICU Outcomes using Trends of Physiologic Measurements in the First Two Days
Mehmet Kayaalp U.S. National Library of Medicine, National Institutes of Health Bethesda, MD, USA
Aims: This study aimed to develop a Bayesian model to accurately predict patient mortality in the ICU with calibrated posterior probabilities. Given all physiologic measurements of a patient in the first 48 hours of the ICU stay, the model produces a discrete outcome prediction (i.e., survival or death) along with a probability measure of mortality. The problem and the datasets came from the PhysioNet/Computing in Cardiology Challenge 2012. Methods: This study modeled the outcome as a random variable
dependent on trends of daily physiologic measures of the patient, where trends were conditionally independent given the outcome. A (two-day) trend is composed of two values, one for each day. Each value (low, normal, high or unmeasured) is a function of the arithmetic mean of that measure on the corresponding day.
Parameters of the model were learned on a training dataset (Set-A) of 4000 patients with known outcomes. The parameterized model was tested on another dataset (Set-B) of 4000 different patients, whose outcomes were censored. Results: The first performance metric was the minimum score of
sensitivity and positive predictive values of the model. Although the early results (0.113 on Set-A and 0.136 on Set-B) were unimpressive, a later yet still preliminary result on Set-A (0.404) was more encouraging.
The second performance metric, Hosmer-Lemeshow H statistic, was about the calibration of prediction probabilities. The early result on Set-B and a later one on Set-A were 3573.2 and 145.4, respectively. Conclusion: SAPS-I, an established ICU scoring metric, scores 0.296
and 68.4 on Set-A for the first and second performance metrics of the Challenge, respectively. At this stage of the development, the Bayesian model of the study is not on par with SAPS-I metric in terms of calibration but it competes well against SAPS-I on the first performance metric of the Challenge.
P81
134 Computing in Cardiology 2012, Kraków, Poland
Mortality risk assessment for ICU patients using Logistic Regression
Deep Bera* and Mithun Manjnath Nayak
Philips Electronics India Ltd. Bangalore, India
Objective: To survey the feasibility of mortality risk assessment for ICU
patients. Another objective is to predict in-hospital mortality within each decile range with the greatest accuracy.
Method: This study used retrospective analysis of mixed medical/surgical intensive care patients in a hospital. The experiment was done using 4000 patients with 41 candidate variables (attributes) collected over 48 hrs and the same have been put into the training. The method comprises of three different steps: 1) filtering, 2) feature extraction and 3) the prediction. Some of the variables have been discarded as a part of filtering process due to their common absence in many patients' files. After filtering, 30 attributes have been chosen out of 41. As the attributes can be represented as time series, a feature extraction step on these is applied before prediction. A time series within a window can be best represented by three factors such as Maximum, Minimum and Mean. These feature triplets have been extracted for all the attributes selected in the earlier step. Note that these features are also used later for prediction. For prediction, Logistic regression was adopted. Using logistic regression, we could get the probability of mortality. Once the probabilities of mortality are available, classification is needed for a person into two classes, survival (0) or mortal (1). To define these two classes, certain threshold on the probabilities is determined to maximize the score for the training data. The proposed technique gives enhanced accuracy figures in terms of score for Event 1 and Event 2.
Results: The model used in this study yields significant accuracy for in-hospital mortality prediction on the test dataset. Mortality prediction using logistic regression got event 1 score: 0.443662, event 2 score: 45.4347
.
P81
Computing in Cardiology 2012, Kraków, Poland 135

ICU Mortality Prediction with Time Series Motifs
Sean McMillan*, Alexander Van Esbroeck, Chih-Chun Chia, Ilan Rubinfeld and Zeeshan Syed
University of Michigan Ann Arbor, United States
Aim Discovery of short characteristic patterns, or motifs, in time
series data has provided novel predictive information in a variety of application domains. These patterns capture short-term temporal activity that is lost using other approaches to feature extraction from time series. We present an approach that identifies predictive motifs in 48 hour multivariate ICU time series as part of an entry to the Physionet/CinC 2012 challenge on predicting in-hospital mortality. Proposed Approach For each variable with multiple recorded entries, we will identify motifs that are over- or under-represented in patients with in-hospital mortality. We will first discretize each variable into symbols corresponding to low through high values. All subsequences in these discretized time series will be counted for the patients in test set A, and subsequences whose occurrence is associated with mortality will be identified. The presence or absence of these motifs in new patients' time-series can be used as features, and will be combined with the mean, minimum, and maximum values of each variable in a predictive model. Results A baseline version of the method was submitted during Phase 1, using support vector machines trained with only the mean, minimum, and maximum variable values as features, and without including motif frequencies. This method achieved an event 1 score of 0.36, and an event 2 score of 80. Future submissions will utilize the motif-based features and more rigorous feature selection
.
P81
136 Computing in Cardiology 2012, Kraków, Poland
Patient-specific Prediction of ICU Mortality Based on Compressed Sensing
Cong Liu, Wen Bao, Yuan Gao, Yu Gong, Yisha Pan and Minfeng Wu*
Zhejiang University Hangzhou, China
Previous methods to predict ICU mortality rates have good performance
in risk stratification, but fail to give accurate patient-specific prediction. To address this problem, we develop a novel model within the framework of compresses sensing (CS), which has attracted considerable attention in areas such as signal processing and machine learning. By virtue of CS, physiological indices don’t have to be graded according to severity, all we need to know are their normal ranges. Therefore expertise and experience in medicine is no crucial in predictive model development. CS casts the binary classification problem as finding spare representation of test samples with respect to training samples. The sparse representation is computed by l1-regularized least square method, and the test sample is classified to the same group with the sample test that contributes most to the spare representation. The physiological indices cannot be treated as features without any transformation, since the superposition of a high BP (blood pressure, as an example) record and a low BP record may lead to a normal one. In other words, a low risk patient record might be represented by high risk ones. Therefore, in our work, the feature is zero if the corresponding variable is within normal range, otherwise it’s the deviation value from normal range. CS is a good candidate for overcoming the patient-specific challenge, although its current performance is not very satisfying. It’s Event 1 score is about 0.2 for test set-B, and very sensitive to the percentage of death cases in the samples. However, it can be improved by several efforts. Our current work employs the same variables with SAPS-I, and the feature generation method is simple and rough. A better feature selection method is the focus of our future work
.
P81
Computing in Cardiology 2012, Kraków, Poland 137
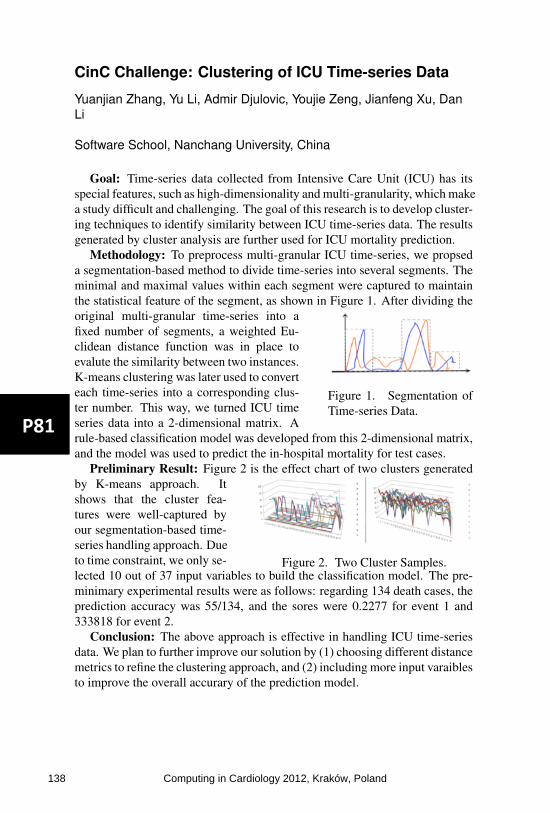
CinC Challenge: Clustering of ICU Time-series Data
Yuanjian Zhang, Yu Li, Admir Djulovic, Youjie Zeng, Jianfeng Xu, DanLi
Software School, Nanchang University, China
Goal: Time-series data collected from Intensive Care Unit (ICU) has itsspecial features, such as high-dimensionality and multi-granularity, which makea study difficult and challenging. The goal of this research is to develop cluster-ing techniques to identify similarity between ICU time-series data. The resultsgenerated by cluster analysis are further used for ICU mortality prediction.
Methodology: To preprocess multi-granular ICU time-series, we propseda segmentation-based method to divide time-series into several segments. Theminimal and maximal values within each segment were captured to maintainthe statistical feature of the segment, as shown in Figure 1. After dividing the
Figure 1. Segmentation ofTime-series Data.
original multi-granular time-series into afixed number of segments, a weighted Eu-clidean distance function was in place toevalute the similarity between two instances.K-means clustering was later used to converteach time-series into a corresponding clus-ter number. This way, we turned ICU timeseries data into a 2-dimensional matrix. Arule-based classification model was developed from this 2-dimensional matrix,and the model was used to predict the in-hospital mortality for test cases.
Preliminary Result: Figure 2 is the effect chart of two clusters generated
Figure 2. Two Cluster Samples.
by K-means approach. Itshows that the cluster fea-tures were well-captured byour segmentation-based time-series handling approach. Dueto time constraint, we only se-lected 10 out of 37 input variables to build the classification model. The pre-minimary experimental results were as follows: regarding 134 death cases, theprediction accuracy was 55/134, and the sores were 0.2277 for event 1 and333818 for event 2.
Conclusion: The above approach is effective in handling ICU time-seriesdata. We plan to further improve our solution by (1) choosing different distancemetrics to refine the clustering approach, and (2) including more input varaiblesto improve the overall accurary of the prediction model.
P81
138 Computing in Cardiology 2012, Kraków, Poland

Scoring system for 12 lead ECG quality assessment
Tadeas Odstrcilik*, Jakub Kuzilek, Vaclav Chudacek and Lenka Lhotska
FEE, CTU in Prague Prague, Czech Republic
We continue to work on the PhysioNet/CinC Challenge 2011: Improving
the quality of ECGs collected using mobile phones and we have developed a scoring system, which determines the quality of recorded ECG. Our motivation was to extent the applicability of simple decision rules to support quality assessment of electrocardiogram. However, it is difficult to achieve better classification results using our approach rather than simple rules (e.g., zero lead and high-amplitude artifacts) because of the inconsistency in training database. The scoring system works with standard 12 lead ECG. The signal from each lead is separated into 10 bins with fixed length of 1 second. Next, the algorithm applies four simple rules – zero signal, maximal value in a bin higher than threshold value, variance of differences in single bin greater than threshold and maximal value in a bin lower than threshold value. Then we combine the results of simple rules in each bin together into final ECG quality score. Each rule and ECG lead has its own weight, which is added to the final score. The weights of rules are based on their ability to separate good and poor signal and the weights of leads takes into account importance of each lead for ECG diagnostics. Finally, the score is mapped to classification scale from 1 to 10 representing the quality of the ECG where 1 represents clear signal and 10 stands for completely useless signal. In our experiments we have shown that if we accept the signals with classification from 1 to 5 and reject the signals with classification from 6 to 10 our method achieved the score of 0.898 on the test database and the specificity of our method was 89.3% on the training database. The combination of simple rules achieved the specificity of 84.4% on the training data
.
P81
Computing in Cardiology 2012, Kraków, Poland 139

New Detection Method Based on Features of ECG Signal for Determine Localization and Extent of Myocardial Infarction Using Body Surface Potential Map Data
Naser Safdarian and Nader Jafarnia Dabanloo*
Department of Biomedical Engineering, Science and Research Branch, Islamic Azad University, Tehran, Iran
In this study, a method for determining the location and extent of
myocardial infarction using BSPM data that was obtained from PhysioNet challenge 2007 database has been suggested. This data is related to the four patients with MI that we used from two patients as training set to determine rules, and from two other patients for testing set and the conclusion of the proposed model. At first, T-wave amplitude, R-wave amplitude and integration of T-wave as three features of ECG signals were extracted. Then with definition and applying several rules and threshold levels for those features, areas that are with MI and these extents were diagnosed. In this study to determine the precise location of MI, 17-segments standard model of left ven-tricle (LV) was used. Finally, overall accuracy of this method that expressed with SO parameter and EPD parameter for two patients in test set was obtained to 0.94 and 5.37, respectively. The main advantages of this method were its simplicity and high accuracy. Table 1) Proposed method results for patients of Case#3 and Case#4
.
P81
140 Computing in Cardiology 2012, Kraków, Poland

A management system for adult cardiac surgery
M. Mangione, G. Alberini, G. Marras, S. Dalmiani, M. Glauber
Tuscany “Gabriele Monasterio” Foundation - Region Tuscany & Na-tional Research Council Pisa, Italy
Aims: The system allows the management of waiting lists with data sheet history, operative planning and management of the team. Specific modules are designed to handle the different characteristics of the boards of several history departments, the inclusion on the wait-ing list and daily schedule of work is common to all. The system also allows you to manage the employ-
ment levels of operating rooms, allowing for dynamic configu-ration of the rooms in use at the various departments highlight-ing the possible collision of use of salt in the case of sharing be-tween departments.
Methods: It was developed using the Bio Medical Framework (BMF), thanks to the modularity, flexibility, re-liability is exportable in other institu-
tions, with appropriate adaptations and config-urations. The system is integrated with the central registry. Each entry on the waiting list is preceded by a search and/or insertion of the Regis-try patient in the system registry busi-ness. The system is also integrated with the
central database of the SIO for the recovery of its reports and consultation during the definition phase of the patient's medical history card.
Results: Has been in production since January 2009, managing the team operating the adult cardiac surgery, including a number of profes-sionals such as surgeons, anesthesiologists, administrative and information technology for the treatment of approximately 8,000 surgical patients. The use of this software has brought significant improvements in the management of the path of a surgical patient
from pre-admission visit to the planning of surgery. Conclusion: Its architecture allows us to evolve rapidly. The evolutionary
steps already taken are: integration with the folder of anesthesia and drugs the warehouse, for the evaluation of the cost for the patient and clinical risk man-agement. Its database is also designed for searching for real-time evaluation of the most important performance indicators.
P82
Computing in Cardiology 2012, Kraków, Poland 141

Cardiovascular Disease and Sleep Apnoea: a Weara-ble Device for PPG Acquisition and Research Aims
G Angius*, L Raffo
Department of Electrical and Electronic Engineering University of Cagliari, Cagliari, Italy
Introduction: many scientific research try to relate PPG signals to other physiological parameters, such as breathing rate, blood pressure, blood vessel elasticity, blood viscosity and other cardiovascular compliances and diseases. The aim of this work is to develop a platform composed of a wearable device and a digital framework for continuous and long time acquisiton, real-time and off-line processing, of photoplethysmography (PPG) signals for scientific researches on cardiovascular disease (CVD) and sleep apnoea (SA).
Methods: we developed a MATLAB-based framework for off-line algo-rithm research, a Windows GUI for real-time algorithm testing and remote patient monitoring, and a battery powered microcontroller-based, bluetooth enabled, wearable device for PPG signal acquisition. In order to develop the wearable device for PPG acquisition during daily life activities, sport activi-ties and during sleep, we had to satisfy some specific requirements such as usability, the reliability of the signals acquired and the reduction of motion artefacts. The first problem we had to face was the type of the PPG sensor to be used. The best solution we found was the use of the new Nellcor SpO2 forehead reflectance sensor, called Max-Fast. Moreover, we improve the Max-Fast sensor with a MEMS three-axis accelerometer for motion artefacts detection.
Results and Conclusions: In this work we present a digital framework with a microcontroller-based wearable device for real-time acquisition and signal processing of PPG signals for new algorithms research on automatic analysis in the field of CVD and SA. Thanks to the wireless communication link to a PC, the device can be used in different scenarios such as clinical en-vironments, dangerous situations, sport activity, during sleep, and also at home in telemedicine systems. In fact, the device is nowadays under test by a patient with no serious CVD and it is connected to the hospital through a simple pc-based telemedicine system.
P82
142 Computing in Cardiology 2012, Kraków, Poland

Myocardial Infarction and Antiphospholipid Syn-drome: a first Study on Finger PPG Waveforms Effects
G Angius*, D Barcellona, E Cauli, L Meloni, L Raffo
Department of Electrical and Electronic Engineering University of Cagliari, Cagliari, Italy
Aim: the aim of this study was to highlight the presence of cardiovascular disease (CVD) using a non-invasive low cost technique: the photoplethysmography (PPG). In particular, this work represents a prelimi-nary study in the time domain of finger PPG signals of patients with acute myocardial infarction (AMI), chronic myocardial infarction (CMI), and Antiphospholipid Syndrome (SAA).
Methods: PPG signals were taken from the index finger of the right hand using a commercial pulse oximeter. Twelve PPG waveforms were measured for each studied group (AMI, CMI and SAA) and for a group of healthy vol-unteers. Average ages for the 4 groups are: 62 years for patients with AMI and 67.7 for those with CMI; 46.8 years for patients with SAA and 28.2 for healthy subjects. Time domain PPG signal processing was done using a MATLAB implementation of an improved differential algorithm, in order to detect the characteristic parameter ‘relative crest time’ (T1/TPT), identified from the literature.
Results: the statistical distribution of PPG relative crest time of this pre-liminary study for healthy subjects, for the AMI, CMI and SAA patients, show that healthy subjects present a relative crest time in average below 0.2 and a very tight distribution. On the contrary, patients with AMI, CMI and SAA have a higher mean value of T1/TPT and a wide asymmetrical shape of distribution.
Conclusions: the obtained results suggest that a T1/TPT value above the 0.2 threshold is a dangerous value for healthy subjects. Moreover, the results extracted from PPG signal of patients with SAA seem particularly significant, because these subjects are generally younger than those with AMI and CMI.
P82
Computing in Cardiology 2012, Kraków, Poland 143

EVINCI study: management, integration and commu-nication of clinical and imaging data.
G.A.L’Abbate, M.Marinelli, M.Mangione, P.Marcheschi, V.Positano, S.Puzzuoli, N.Esposito, C.Caselli, D.Neglia Fondazione Toscana Gabriele Monasterio, Pisa, Italy The EVINCI European study (Evaluation of INtegrated Cardiac Imaging for the Detection, Characterization and Monitoring of Ischemic Heart Disease – number 222915) aims to evaluate the impact of a combined non-invasive anatomo-functional cardiac imaging strategy on the detection and manage-ment of ischemic heart disease (700 scheduled patients among 17 centers and 9 Countries). The technological task (Figure 1) of the project is focused on collecting and managing clinical and imaging data, providing new tools for integration and communication. Clinical data, including quality of life information and re-sults of non-invasive and invasive tests, were collected by a dedicated web-application (a) based on open source software BMF (Bio Medical Frame-work). Different account profiles have been created in order to set rules to access and manage data. In order to store and distribute medical images a Clinical Trial PACS system (b) based on open source software (dcm4chee) has been developed. This system is comparable with the most emblazoned systems in terms of network response and features. The integration module (c - Hybrid Image Tool: HIT) was developed with the purpose to accurately combine coronary arteries anatomy information with high resolution quanti-tative functional data such as regional myocardial perfusion and regional mo-tion and contractility. The multimodal report (d) development has the pur-pose to show and explain the diagnostic and therapeutic pathway, making easier the communication with physicians and patients. It is composed by clinical and imaging data supported by 3D integrated high and low resolution representations. Clinical and technical results grounded the development of a web-based educational tool (e – EduCAD) for training of young cardiolo-gist in the appropriate use of multimodal imaging technology for diagnosis of ischemic heart disease.
Figure 1
P82
144 Computing in Cardiology 2012, Kraków, Poland
Weather Influence on Alarm Occurrence in Home Telemonitoring of Heart Failure Patients
Marija Vukovic, Mario Drobics, Dieter Hayn*, Guenter Schreier and Hans Lohninger
Austrian Institute of Technology Vienna, Austria
INTRODUCTION Most cardiovascular diseases, including chronic heart
failure, correlate with meteorological conditions. Existing research reports increased hospitalization and death rates of patients in cold weather and periods of high environmental thermal stress. The effects are observed in temperate, continental, as well as tropical climates. Our study investigated weather influences on occurrence of alarm conditions among heart failure patients subject to home telemonitoring.
METHODS The telemonitoring study was conducted in Austria between 2003 and 2008. The study monitored physiological parameters of heart failure patients: blood pressure, heart rate and weight, as well as alarm indication when the monitored parameters exceeded manually adjustable threshold limits set by the physicians. Five different types of physician responses to the alarm situations were recorded, of which patient contact, medication adjustment and other actions were considered to indicate occurrence of true alarms, whereas threshold adjustment and no action indicated false alarms. The associated daily averaged environmental temperature, humidity and atmospheric pressure data was obtained from the Austrian Central Institute for Meteorology and Geodynamics. Using GNU-R statistical analyses software, correlations were calculated between the weather conditions and alarm occurrences corresponding to particular types of physician responses.
RESULTS A total of 8018 telemonitoring records of 52 patients over 1848 measurement days were identified and selected for analyzing correlations with the historical weather data. The results showed close association between the weather conditions and occurrence of patient health status alerts. Particularly, association between the alarm occurrences and cold days, thermal stress, was found to be of interest.
CONCLUSION The observed weather influence is important for explaining the occurrence of alarm conditions in heart failure patients. Including weather data within the models dealing with physiological status estimates of heart failure patients may increase reliability of the alarm generation systems and contribute to early detection of adverse patient conditions
.
P82
Computing in Cardiology 2012, Kraków, Poland 145

Stochastic Analysis and Classification of 4-Area Cardiac Auscultation Signals Using Empirical Mode Decomposition and Acoustic Features
Miguel A Becerra*, Diana A Orrego, Cristian Mejía and Edilson Delgado-Trejos
Institución Universitaria Salazar Herrera Medellin, Colombia
While automated classification approaches based on a single auscultation
area fail when a murmur is missing in any location, the classification of phonocardiographic (PCG) signals using the 4-Standard Auscultation Areas (SAA), one in each cardiac valve, can provide an objective and accurate mechanism for more reliable heart murmur diagnosis. This paper presents a computationally simple and effective methodology based on stochastic analysis of acoustic features estimated from signal components obtained by the Empirical Mode Decomposition (EMD) technique for cardiac murmur detection. The 4-SAA PCG recording database used in this study belongs to the National University of Colombia. 55 adult-subjects were labelled as normal, while 88 exhibit cardiac murmurs. Each recording lasts approximately 8 seconds. Specialist doctors chose 400 representative beats of the 4-SAA, 200 normal and 200 with evidence of cardiac murmur. The signals were acquired at 44.1 kHz and resampled to 4410 Hz by applying a FIR low-pass anti-aliasing filter. Next, the signals were normalized in [-1, 1]. The first 8 Mel-Frequency Cepstral Coefficients (MFCC) were estimated using a sliding window (50% overlap) over EMD components of the whole beat. Stochastic analysis of the feature space for PCG beat recognition was carried out by a classifier type ergodic HMM initialized randomly and trained using the expectation maximization algorithm with a convergence at 10e-6 and a maximum iteration number of 1000. By a 30-fold cross-validation procedure (70/30 split), the global classification result for the 4-SAA is around 98% with satisfactory sensitivity and specificity results. According to the experimental results, to capture the signal variability induced by the murmurs, it is better to directly characterize the cardiac mechanical behaviour from the 4-SAA. Additionally, the representation capability of the EMD technique applied to PCG signals and stochastic analysis of the acoustic parameters offer a high performance in heart murmur detection tasks
.
P82
146 Computing in Cardiology 2012, Kraków, Poland
Prediction of Cardiac Resynchronization Theraphy Response by Means of 3D Trajectory Assessment of the Coronary Sinus Lead
Cristiana Corsi*, Dario Turco, Corrado Tomasi, Massimo Margheri, Claudio Lamberti and Stefano Severi
University of Bologna Bologna, Italy
Aims: Cardiac resynchronization therapy (CRT) is an effective treatment
for chronic symptomatic systolic heart failure with cardiac dyssynchrony, but about one-third of patients do not respond favourably to the therapy. We hypothesized that acute modifications of the coronary sinus (CS) electrode tip movements, induced by the start of biventricular pacing, may be related to resynchronization process and consequently be predictive of CRT response.
Methods: In 13 patients submitted to CRT implant, a previously validated method for CS lead 3D tracking throughout cardiac cycles using fluoroscopic data was applied at the device implant, before (t-1) and immediately after (t0) the turning-on of pacing. Several parameters describing the 3D position of CS lead and its trajectory throughout the cardiac cycle at t-1 and t0, were computed and compared by Mann-Whitney U test between echo-responder patients (R) and non-responders (NR), defined at 6±3 months follow-up by echocardiographic examinations.
Results: No significant difference was found neither between R and NR groups at t-1 nor comparing the parameters values between t-1 and t0. Several significant differences were found between the two groups when comparing the variation of each parameter (median value [25%-75%]) from t-1 to t0. In particular, the variations of the ratio between the two main axes of the trajectories (R: -2.4 [-3.4 - -1.7]; NR: 0.47 [-0.23-3.24]; p=0.001), their percent difference (R: 55.8% [47.0%-69.4%]; NR: -15.7% [-66.8%-11.2%]; p=0.001), the changes in the eccentricity (R: -0.18 [-0.23 - -0.09]; NR: 0.01 [0-0.05]; p=0.001) and in the mean curvature (R: -0.12 [-0.2-0.06]; NR: 0.05[-0.06-0.09]; p=0.008) resulted statistically different.
Conclusion: Preliminary data showed a more circular and smooth trajectory as an immediate result of the CRT turning-on in the echo-responder group. Therefore, 3D trajectories could describe features of resynchronization start-up in CRT recipients and could help to understand the reasons of therapy failure in non-responder patients
.
P83
Computing in Cardiology 2012, Kraków, Poland 147

A Framework for CT and MR Image Fusion in Cardiac Resynchronization Therapy
Maria Chiara Carminati*, Francesco Maffessanti, Paola Gripari, Gianluca Pontone, Daniele Andreini, Mauro Pepi and Enrico Gianluca Caiani
Introduction: Fusion of information from two or more datasets acquired in the same patient with different modalities is becoming an important issue in cardiac imaging. Our aim was to define a framework for fusing computed tomography (CT) with magnetic resonance (MR) imaging data for potential application in cardiac resynchronization therapy (CRT).
Methods: Cardiac 3D CT and stack of short-axis (SAX), 2- and 4-chamber long-axis (LAX) and Gadolinium(Gd)-enhanced SAX MR datasets (GE, Healthcare) of a 72 years old man scheduled for CRT were considered as test bed. To ensure temporal correspondence, both 3D CT and SAX MR frames were chosen at 40% of cardiac cycle. The fusion procedure (ITK library) consisted of two steps: 1) datasets alignment, performed overlying the bounding box center of CT and MR SAX stack: this provided a good initial transformation to the subsequent optimization function, thus preventing local maxima solutions; 2) inter-modal voxel-based image registration between 3D CT (moving image) and MR SAX (fixed image) driven by normalized mutual information cost function: a multi-resolution two-level (subsampling grids of [4,4,4] and [2,2,2]) approach with gradient descent optimizer was adopted to improve the algorithm stability. The retrieved coordinates transformation was applied to LAX and Gd-enhanced MR images to perform data fusion with CT.
Results: For potential clinical feasibility, the grid finest resolution ([1,1,1]) was not considered, to keep computation time <1.5min (quad-core i7-670M CPU) for the entire procedure. Fused data was visually inspected and judged reliable for correspondence of cardiac structures.
Conclusions: The proposed approach constitutes the pre-processing step for multi-modality visualization of different information: coronary veins anatomy from CT, necrotic tissue from Gd-enhanced MR, dyssynchrony map from SAX and LAX MR. The applied registration procedure was fully automated with short computational time, thus resulting promising for easy integration in clinical practice CRT workflow
.
P83
148 Computing in Cardiology 2012, Kraków, Poland

The Construction of a Statistical Atlas of the Whole Heart from a Large 4D CT Database
Karim Lekadir*, Corné Hoogendoorn and Alejandro F Frangi
Universitat Pompeu Fabra Barcelona, Spain
Statistical cardiac atlases are efficient tools to characterize average
morphology and dynamics, as well as to encode the variability between groups of individuals and pathologies. However, the construction of comprehensive atlases is faced with several challenges in practice, in particular the need to handle large and highly variable 4D image datasets, the multi-region nature of the heart, and the presence of complex as well as small cardiovascular structures. In this work, we develop a robust framework for the construction of a high-resolution and spatio-temporal atlas of the whole heart from a database of 138 CT 4D images, the largest sample to be used for cardiac statistical modeling to date. The data is drawn from a variety of pathologies, which benefits its generalization to new subjects and physiological studies. In the proposed technique, spatial normalization based on non-rigid image registration is used to synthesize a population mean image from all CT images and establish the spatial relationships between the mean and the subjects in the population. Temporal image registration is then applied to resolve each subject-specific cardiac motion. The resulting transformations are used to warp a detailed 3D mesh representation of the atlas to fit the phase images in each subject. Additionally, a meshing algorithm is developed to obtain correct topological relationships between all the structures, as well as to maintain seamless transitions with a suitable mesh quality. Finally, a bilinear decomposition is applied to the obtained set of 3D meshes to suitably separate the inter-subject and dynamic sources of variation. With the obtained statistical atlas (Fig. 1), the level of detail (13 cardiac structures, Table 1) and the extendability of the atlas present an advantage over most cardiac models published previously. The main applications of the presented atlas include statistical-based image quantification and electro-mechanical simulation
.
P83
Computing in Cardiology 2012, Kraków, Poland 149

Automatic IOCT Lumen Segmentation Using Wavelet and Mathematical Morphology
Matheus Cardoso Moraes*, Diego Armando Cardona Cárdenas and Sérgio Shiguemi Furuie
School of Engineering, University of São Paulo São Paulo, Brazil
Coronary diseases cause approximately 1 death per minute in USA.
Intravascular Optical Coherence Tomography (IOCT) is one of the most used Medical Imaging Modality for coronary investigations. IOCT provides high resolution of coronary cross-section images by an infrared-light catheter. However, in order to obtain objective coronary structural information, segmentation is important. Accordingly, better diagnostics and evaluations will be provided, resulting in more precise therapies and interventions. Because it is a relatively new modality, few researches have focused on IOCT segmentation. This lack of methods is certainly one of the biggest modality drawbacks, since engineers will not have many choices to embed a method in a software or equipment. Therefore, to improve segmentation accuracy, and offer more choices to developers, new and alternative approaches are necessary. We present an automatic lumen segmentation approach, based on Wavelet and Mathematical Morphology. The methodology can be summarized as following. First, after preparing the image in a typical preprocessing stage, wavelet is performed to discriminate the tissue from the rest of the image. Next, a moving window Otsu binarization process is carried out. Finally, a Mathematical Morphology takes place to correct, polish and estimate the information previously provided, so that an accurate binary version of the lumen shape, and its contour could be obtained. The evaluation was carried out by computing the segmentation outcomes of 130 challenging images from human and pig coronaries, and rabbit’s iliac arteries. The proposed approach yielded high accuracy of True Positive (TP(%)) = 99.27±1.29, False Positive (FP(%)) = 3.43±1.51, False Negative (FN(%)) = 0.72±1.26, Max False Positive Distance (MaxFP(mm)) = 0.09±0.06, Max False Negative Distance (MaxFN(mm))” = 0.06±0.07. In conclusion, the proposed technique is robust, since the tested images are from different sources from human, rabbits and pigs arteries
.
P83
150 Computing in Cardiology 2012, Kraków, Poland

Improved Estimation of Reference Indices of Left Ventricular Chamber Function from Ecocardiographic Images with Multidimensional Nonlinear Kernel Methods
Ricardo Santiago-Mozos, José Luís Rojo-Álvarez*, J Carlos Antoranz, Daniel Rodríguez, Mar Desco, Alicia Barrio, Yolanda Benito, Raquel Yotti and Javier Bermejo
Universidad Rey Juan Carlos, Spain
Background. Some well-known indices of left ventricular (LV) function
can be qualitatively related to color-Doppler M-mode (CDMM) images, and estimated using robust linear regression methods. We hypothesized that advanced nonlinear estimation methods can readily improve the estimation quality of reference indices from CDMM images. Methods. We benchmarked several kernel methods for estimation: first, the conventional Support Vector Regression (SVR); and second, two methods accounting for implicit or explicit input space reduction, namely Partial Least Squares (PLS), and Principal Components Regression (PCR). All the kernel based methods were tested using linear and nonlinear (Gaussian) kernels. Two reference indices of LV function were estimated, namely, the peak-systolic elastance (Emax) and the time-constant of LV relaxation (tau). Results. Simultaneous invasive and Doppler tracings were obtained in 9 and 20 mini-pigs for Emax and tau, in a high-fidelity experimental setup (295 and 1517 cases of Emax and tau, respectively) of animals undergoing ischaemia as well as load and adrenergic modulation (dobutamine and esmolol infusion). Datasets were for simultaneous hameodynamical and CDDM images in each case (beat). CDDM images were time and space aligned and downsampled to 32x32 pixels. Leave One Individual Out mean absolute error (MAE) was used for benchmarking, together with Mann-Whitney-Wilcoxon paired test. For Emax parameter, the performance of linear SVR (1.15 +- 0.53) was significantly improved when using nonlinear SVR (0.95+-0.40). There was a trend to improved performance when using nonlinear PLS (0.94 +-0.48) and nonlinear KPCR (0.91+-0.44), though with no statistical significance with this test. For tau parameter, performance of linear SVR (17.19 +- 7.38) was significantly improved when using nonlinear SVR (8.55+-3.6), but there were no significant differences between this last and either nonlinear PLS (9.00+-3.5) or nonlinear KPCR (8.70+-3.77). Conclusion. CDMM image-based noninvasive estimates of haemodynamical indices of LV function can be significantly improved when using nonlinear machines
.
P83
Computing in Cardiology 2012, Kraków, Poland 151

Automatic Assessment of Differences in Atherosclerotic Plaques Using IVUS-VH Images K Czopek
1,2, E Pociask
2, J Jąkała
2, P Zawora
2
1 AGH University of Science and Technology
2 Krakow Cardiovascular Research Institute, Poland
Intravascular Ultrasonography-Virtual Histology modality is
a commercially available radiofrequency (RF) signal-based tissue
composition analysis tool. For IVUS-VH analysis, a number of parameters
are important in diagnosis of various medical conditions. Image analysis for
this modality is currently generally performed using commercially available
software designed by Volcano Medis and Indec, but neither of them measure
confluent Necrotic Core. The research project is aimed at performing
a complete analysis using custom software for quantification of individual
plaques and determination of methods for their differentiation based on
specific quantitative parameters.
Software system for analysis of atherosclerotic plaques was implemented
to perform qualitative measurement in repeatable and unambiguous way.
Software allows to clearly distinguish plaque’s Necrotic Core in contact with
lumen area (TCFA) (thin cap fibroatheroma) from other plaques as well as
classifying TCFA plaque types in subclasses depending on the value of
quantitative parameters. The process starts with exporting IVUS images. The
format of captured images can be JPG, TIFF, PNG, BMP etc. Then the
algorithm follows a series of image processing techniques that include image
conversion, filtering, enhancement and cropping.
Current reproducibility in the diagnosis of plaque types carried out by
experienced doctors is not satisfactory - kappa indicator ranges from 0.40 to
0.60. The goal of presented new tool was to maximize the automation of
measurements and classification of plaques, giving the analyst only the
information needed and presenting the final results in a way that is easy to
read and understand. Using the proposed analysis software we were able to
achieve kappa around 0.70, although we are convinced that with small
adjustments to our algorithms the use of strictly defined quantitative
parameters would increase the reproducibility in the evaluation of plaque
types so that the kappa index is greater than 0.90.
P83
152 Computing in Cardiology 2012, Kraków, Poland

A Fully Automatic Registration Method for CARTO Electro-anatomic Map and CT Surface
Lixia Shu, Yanni Guan, Deyong Long, Ronghui Yu
Beijing An Zhen Hospital, Capital Medical University, Beijing Institute of Heart Lung and Blood Vessel Disease, Beijing, China
Aims: Catheter navigation guided by the registration of CARTO electro-anatomical map (EAM) and CT surface is a hotspot for atrial fibrillation (AF) treatment. However, research on the registration algorithm is just at its start-ing stage. Physicians now extremely rely on Carto-Merge, a piece of software, to register EAM and CT surface during AF operations. Besides, only few studies have done on the algorithm. All these methods are semi-automatic or inaccurate for catheter navigation. Therefore, in this study, we proposed a principal axes based registration (PAR) method, which is automatic and accu-rate for AF operations.
Methods: Firstly, the inertia matrices, the normalize eigenvector matrices of the inertia matrices, and the centroids of both images were calculated. Secondly, the EAM was transformed to the CT surface using the following formula:
' * *( )TCT EAM EAM EAM CTEAM E E I C C
Here, E presents the normalize eigenvector matrix of the inertia matrix, and C denotes the centroid. Each vector of E defines a principal axis of an image. Consequently, there are totally 48 kinds of correspondence between the axes of the two images. Thirdly, for each of the 48 transformed EAMs, its average distance to the CT surface was estimated. The transformed EAM with the minimum distance is chosen as the registration result.
Results: We used Carto-Merge, stochastic approach and PAR to register three pairs of synthetic EAM and CT surface. Carto-Merge only successfully aligned one pair of images, which exhibited in the table. Furthermore, it is time-consuming and not accurate enough. Stochastic approach worked very fast, however, it was inaccurate and even failed once. PAR worked very well all the time. It was much more accurate than the other two methods, mean-while, it run fast. The experimental results indicated that PAR is valid and overwhelming.
Conclusion: Compared to the traditional methods, PAR is fully automatic, fast, and moreover, accurate enough for AF operations.
Registration of a pair of EAM and CT surface Carto-Merge Stochastic
approach PAR
mean ± std (mm) 1.4454±0.6364 1.4316±0.6182 0.6917±0.1835 time consuming(s) 284.2530 4.3675 25.9103
P83
Computing in Cardiology 2012, Kraków, Poland 153

Cardiac Time-Area Curve Modeling Using Piecewise Linear Regression in Mice with Heart Failure
Magdalena Jabłońska*, Urszula Tyrankiewicz, Anna Osiak, Henryk Figiel and Tomasz Skórka
The H. Niewodniczański Institute of Nuclear Physics PAN Kraków, Poland
Introduction: Cardiac time-volume or single-slice time-area curves
(TVC/TAC) depict left ventricle (LV) function at multiple time points throughout the cardiac cycle. Character and number of observed TAC phases depends on several factors related to heart condition and experimental procedure. The aim of this work was to assess piecewise linear regression modeling (PLR) as a tool for the TVC/TAC shape analysis leading to the curve sectioning with estimation of the segments lengths and dynamics allowing for TAC complex parameterization.
Methods: Cardiac Magnetic Resonance images of the atherosclerotic (ApoE/LDLR-/-) and control mice obtained at rest and under pharmacologically induced stress condition were considered. TAC from each mouse was estimated based on LV segmentation (single short-axis cross sections) then modeled by partitioning time into intervals and fitting using multiple lines, where position of intervals boundaries were optimized numerically. The best fit model was selected from several candidate models (with different numbers of segments) according to Akaike Information Criterion. Cardiac function was assessed as: Fractional Area Change, Ejection/Filling Rate, and Isovolumic Relaxation Time and then verified by experienced operator.
Results: PLR method (implemented in Matlab) allowed to assess cardiac changes unseen at rest in ApoE/LDLR-/- mice as compared to control group: decreased FR at low stimulation (1.9 vs 3.0 [EDA/RR]) and prolonged IVRT at high stimulation (18% vs 10% of RR; t-test, p<0.05). Obtained values of parameters are in good agreement with the corresponding values assessed manually. Conclusion: PLR has been validated as the promising method for tracing qualitative and quantitative changes in TAC shapes showing different paths of stress response. The method is time saving, gives possibly independent results, extends analysis protocol and allows semi-automatic assessment of the TAC individual systolic and diastolic phases. Additionally, a complete set of cardiac parameters available in this method can be further analyzed. Grant coordinated by JCET-UJ,NoWND-POIG.01.01.02-00-069/09-00
.
P83
154 Computing in Cardiology 2012, Kraków, Poland
A Novel Model-Based Approach to Left Ventricle Segmentation
Monika Natalia Bugdol*, Joanna Czajkowska and Ewa Piętka
Silesian University of Technology, Gliwice, Poland Gliwice, Poland
Introduction A frequent problem occurring in dynamic tests are hazy
outlines of individual structures. Popular segmentation algorithms tend to oversegment or undersegment cardiac magnetic resonance images. The solution to this problem can be a model of the left ventricle, whose task is to estimate the shape of the heart muscle where the segmentation algorithm incorrectly sketched the outline of the structure.
Methods In this paper a parametric model of the left ventricle is proposed. The presented model is based on Bezier curves and regression analysis. First, the correctly evaluated sections should be selected and they should serve as a basis for building the individual model of the left ventricle. Secondly, the improperly outlined sections should be replaced with ellipses calculated using the presented model. The proposed segmentation algorithm is based on the Kernelized Weighted C-Means clustering and is fully automatic. Nevertheless, the presented model of the left ventricle may work with other segmentation methods. Segmentation correctness coefficients have been proposed, which enable automatic selection of sections incorrectly delineated by the algorithm.
Results The haemodynamic parameters and the heart weight have been compared with the golden standard obtained from the expert delineations. The estimation of heart mass has significantly improved after the application of the model - the relative error has decreased from 28% to 10% and from 23% to 11%, respectively, for the two experts. In case of stroke volume estimation the average interobserver error was 8%, whereas the relative errors after using the model were 13.5% and 16% , respectively, for both experts. The interobserver ejection fraction error was 7% while the relative errors for both experts were 12.5% and 15.5%, respectively. Nevertheless, despite the fact that there has been noimprovement for all of the studies, the average relative error has been raised by no more than 0.1%
.
P83
Computing in Cardiology 2012, Kraków, Poland 155

Aortic Backward Flow Indices Estimated from Phase-Contrast Cardiovascular Magnetic Resonance Data Mourad Bensalah, Emilie Bollache*, Nadjia Kachenoura, Alain De Ce-sare, Muriel Lefort, Alban Redheuil, Elie Mousseaux
INSERM U678/UPMC Univ Paris 6, Paris, France
Aims: Aging is a major risk factor of cardiovascular disease and is associ-
ated with arterial stiffness. Presence of backward flow (BF) in the ascending
aorta (AA) was showed using Phase-Contrast Cardiovascular Magnetic Res-
onance (PC-CMR). We hypothesized that quantitative parameters derived
from BF could be relevant markers of arterial stiffness and aging. According-
ly, our aims were to estimate parameters related to BF and forward flow (FF)
in the AA in healthy subjects using 2D PC-CMR data, and to evaluate their
relationships with age and aortic arch geometry as well as with well estab-
lished arterial stiffness parameters including wave reflection indices.
Methods: 100 asymptomatic subjects (age: 40±15 years) underwent CMR
and carotid-femoral tonometry (CFT). Aortic stiffness (aortic arch pulse
wave velocity, AA distensibility) and geometry indices (AA diastolic diame-
ter and arch length) and parameters related to the AA global flow, FF and BF
(volumes, flow rate peaks, and appearance time) were automatically estimat-
ed from CMR data. Carotid-femoral pulse wave velocity and reflection pa-
rameters, such as carotid augmentation index (AIx) and time to return of the
reflected pressure wave, were assessed using CFT.
Results: BF increased in terms of volume and flow rate peak and appears
earlier with age (p<0.0001), while
aortic global flow and FF parame-
ters were stable. All BF parameters
correlated significantly with arterial
stiffness and geometry indices, as
well as wave reflection indices
(p<0.0001). BF to FF flow rate
peaks ratio was the most strongly
correlated to both age (Figure) and
arterial stiffness indices. Multivari-
able analysis showed that aortic
geometry is strongly associated to
BF parameters independent of age,
gender, blood pressure and body size.
Conclusion: PC-CMR BF parameters were significantly correlated with
age, arterial stiffness and aortic geometry indices and could be relevant
markers of vascular aging.
0
10
20
30
40
50
15 35 55 75Age (years)B
F to F
F flo
w rate
peaks
ratio (
%)
0
10
20
30
40
50
0 20 40 60 80
Correlation between BF to FF flow
rate peaks ratio and age.
P83
156 Computing in Cardiology 2012, Kraków, Poland

Synchronizing IVUS images via Virtual Histology im-ages.
Murielle Hadad*, Monica M S Matsumoto, Sergio Shiguemi Furuie,
University of São Paulo, Brazil
Cardiovascular disease is the most common cause of death in the world. Nowadays, Intravascular Ultrasound (IVUS), a catheter based system that provides detailed and accurate measurements of the arterial wall struc-tures, is the most used modality for coronary diagnostics.
However, during the acquisition of IVUS images, the contraction of the cardiac muscle provokes relative motion of the transducer with respect to the artery even for steady catheter. Consequently, the acquired sequences of im-ages are disordered in space. Ordered images are needed to construct vol-umes of coronaries for each cardiac phase and therefore enhance visualiza-tion and spatial analysis of the coronary artery.
Since IVUS images do not contain any ex-ternal indicator of phase, our solution is to use Virtual histolo-gy RF images as references, be-cause they are acquired simultaneously with IVUS images and are synchronized with the ECG signal. Therefore, this work presents a precise and adaptive IVUS and RF image synchronization process.
The material consists of up to 200 radio-frequency (RF) and 2000 IVUS images for each of the 40 examinations. The methodology is based on the correlation within a circular region of interest, which can be automatically optimized by choosing the most significant area in each examination. We evaluate our method by computing the distribution of periods, the number of IVUS frames that are unmatched between two consecutive pairs of RF-IVUS. The synchronization is considered acceptable if the standard deviation of the period is smaller than an estimated value that depends on the heartbeat.
Our results show error rates inferior to 3%, which is very good, consider-ing that IVUS and RF images have very different characteristics, and exami-nations can be quite different as well.
IVUS image (left) and RF image (right): size, brightness and sharpness are different.
P83
Computing in Cardiology 2012, Kraków, Poland 157

Spatial and Temporal estimation of Left Ventricle Wall from Ultrasound Images using Optical Flow Algorithm
Antonio Bosnjak, Ricardo Villegas, Guillermo Montilla
Universidad de Carabobo Valencia, Venezuela
This work proposes a new technique for 2D or 3D spatial and temporal motion estimation of the left ventricle from a sequence of Echocardiographic images. Accurate motion estimation of the movement of cardiac walls has been shown to be very important for studying the cardiovascular illnesses. This technique is based on the processing pipeline from the acquisition to the 3D segmentation. This pipe-line includes six modules: 1) Acquisition of 2,5D or 3D images (figure 1). 2) Pre-processing with a diffusion filter. 3) 2D Seg-mentation using Level Set method. 4) Com-puting of the Optical Flow. 5) 2D or 3D re-construction of the Left Ventricle. 6) Visuali-zation of the left ventricle area obtained from each image during the cardiac cycle. Within this processing pipeline, we focus on the modeling of cardiac dynamics. To achieve this goal, we propose a new technique for estimating 3D motion from cardiac sequence. In order to estimate the Left Ventricular
motion we have developed this soft-ware to calculate the optical flow from a sequence of ultrasound im-ages using the method proposed by Horn and Schunck. Figure 2, depicts the results of velocity fields of the segmented contour together with the velocity fields of the image without segmentation. In conclusion, our work has demonstrated the feasibil-ity of applying this method of analy-
sis to the cardiac sequences, and we obtained an error between 5% and 8% when comparing our work with the segmentation and motion analysis ob-tained manually by a cardiologist.
Fig. 1. (a) Echocardiographic image time: t-1.
Fig. 2. Results of the velocity fields.
P83
158 Computing in Cardiology 2012, Kraków, Poland

Evaluation of Pulse Wave Velocity using 4D CT cardiogram
Weichih Hu*, Hsuan-Ming Tsao and Liang-Yu Shyu
Chung Yuan Christian University Chung Li, Taiwan
Studies have shown that atherosclerosis would increase the risk of
cardiovascular disease directly or indirectly. The arterial stiffness will be deteriorated as the severity of atherosclerosis. Pulse wave velocity (PWV) is becoming a clinical index to assess the level of arterial stiffness. This abstract will be discussed the methodology of evaluation of PWV that will be correlating with total arterial Compliance (TAC) using 4D CT Cardiogram. A self developed image processing program will be reconstructing cardiac DICOM images into 10 frames of 3D heart models for data inspection. The region of interest (ROI) will be aligned to delineate the normal direction of area. The volume at ROI was calculated using data specified in the DICOM data set. Fifteen 4D CT cardiograms were using in this study. The aortic flows calculated 4D cardiac images were ranging from 68.91 ml to 97.54. The data was correlated with the cardio outputs from the Left Ventricular (LV) images with excellent correlation (Aortic Flow =0.88 * Cardio Output+8.6316 ml,R2=0.9402, R = 0.970, P <0.01). The PWV was calculated from difference of distance that divided to the time difference ( d/ s). That was to select the max distention from aortic slices and the distance between the slice with the time difference were calculated. The PWVs were ranging from 7.78 to 15.58 m/s. The data was positively correlated to the Total compliance calculated at the aortic root (R = 0.672, p < 0.01). And, the PWV was negatively correlated to the distention of aorta (R=-0.8549,P<0.01). Therefore, the derived methodology to calculate PWV from 4D CT cardiac images could be used as an index in evaluation of arterial stiffness
.
P83
Computing in Cardiology 2012, Kraków, Poland 159

Eye tracking in the Assessment of ECG Interpretation Techniques
Raymond R Bond, Dewar D Finlay*, Cathal Breen, Kyle Boyd, Chris D Nugent, Norman D Black, Peter W Macfarlane and Daniel Guldenring
University of Ulster Belfast, United Kingdom
Introduction: Human observers with varying degrees of expertise interpret the 12-lead Electrocardiogram (ECG) in different ways. Students adopt a strict protocol, whereas experts can identify abnormalities immediately. We investigate the use of eye tracking technology as a means of gaining insight into how a human observer interprets ECGs.
Methods: A clinical scientist interpreted 29 ECGs (10 Acute Myocardial Infarction [AMI], 10 Ventricular Hypertrophy [VH] and 9 Left Bundle Branch Block [LBBB]), whilst an eye tracking device was used to record eye movement patterns.
Results: The mean time for interpreting an ECG was 39.56 seconds (SD=11.56). No statistical significance was found between the duration of interpreting ECGs with different abnormalities - AMI ( =39.36, SD=13.49), VH ( =41.56, SD=9.67) and LBBB ( =37.56, SD=12.84). The time dedicated to looking at each lead across all 29 ECGs was determined. The subject fixated most on the rhythm strip (162 sec), followed by lead V1 (85 sec), V2 (71 sec), V6 (52 sec), V3 (50 sec), V5 (50 sec), II (37 sec), V4 (31 sec), I (26 sec), aVF (24 sec), aVL (21 sec), III (12 sec), and aVR (7 sec). Lead aVR was the least studied lead (t-test: p-value < 0.01). More time was given to studying the precordial leads compared to the limb leads (t-test: p-value=0.002). From visual analysis of the recorded data, it was possible to identify that the observer did use a systematic approach to interpretation. For e.g., in the majority of cases the rhythm strip was initially studied, even when prominent features such as ST segment elevation were present in a number of other leads.
Conclusion: Eye tracking can be used to gain insight into how observers interpret the ECG. This could be used for training purposes to provide tailored and objective feedback on an individual’s ECG interpretation technique
.
P84
160 Computing in Cardiology 2012, Kraków, Poland
Comparing six QT Correction Methods in an Athlete’s Population
Sara Wong*, Gaëlle Kervio, Miguel Altuve, François Carré and Guy Carrault
Universidad Simón Bolívar Baruta, Venezuela
Aims: Sinus bradycardia and prolonged QT interval duration are
frequently noted on resting ECG in athletes. Possible explanation for longer QT includes inaccuracies in the correction formula. This study aimed to compare six formulas commonly used to correct QT interval duration (QTc) by heart rate (HR): Bazett, Fridericia, Framingham, Hodges, linear and exponential regression.
Methods: Population included 2814 people (7 to 38 years, 953 women, 2415 athletes and 399 sedentary subjects). QTc were calculated using the six formulas specified as well as the correlation coefficients between QTc and HR. Additionally, QTc was determined for several thresholds of bradycardia (60-45 bpm).
Results: As expected, QTc is longer in women and in athletes (p<10^-5) for all correction formulas. RR interval duration was most correlated to QTc calculated using Bazett and Fridericia formulas (r=0.56 and r=0.39) whereas it was less correlated to QTc calculated using linear and exponential formulas (r=0.17 and r=0.01). QTc in bradycardia population were different from each formula: with Bazett formula, it is longer in non-bradycardia than in bradycardia group (404.10±24.6 ms vs. 384.70±24.37 ms, p<10^-4), with Fridericia formula, there was no difference between groups (394.12±24.60 ms vs. 394.71±23.89 ms, p N.S.), and with Hodges formula, it is longer in bradycardia group (393.35±22.78 ms vs. 400.35± 27.21 ms, p<10^-5). QTc is overcorrected with Bazett formula and is undercorrected with Hodges one. Finally, Fridericia formula seems to work better to overall thresholds of bradycardia.
Conclusion: Linear and exponential formula regressions are less correlated with HR but their parameters are dependent on the study population. Our results show that the Fridericia correction formula is the most suitable for athletes. As in this study the number of QT long remains unspecified, current work is directed towards the evaluation of these correction formulas on a large and annotated database
.
P84
Computing in Cardiology 2012, Kraków, Poland 161

Filtering the Magnetohydrodynamic Effect from 12-leadECG Signals using Independent Component Analysis
J W Krug, G Rose, D Stucht, G D Clifford, J Oster
Otto-von-Guericke University of Magdeburg, Germany
INTRODUCTION: Due to several distortions caused by the MR scanner’sstatic magnetic field ~B0 and the switched gradient magnetic fields, it is notpossible to record a diagnostic ECG inside an MR scanner. Hence, a detailedcardiac analysis, e.g. of the ST segment, is not possible. This work focalises onthe distortions from the magnetohydrodynamic (MHD) effect, which is causedby the flow of blood perpendicular to the static magnetic field.
METHODS: Two different ECG datasets were used for the experiments.In DataSet 1, the MHD effect was simulated using a signal which was de-rived from an MRI flow measurement in the aorta. The simulated MHD signalwas then superimposed on a clean 12-lead ECG signal using a linear mixingmodel (Fig. 1(a)). DataSet 2 consisted of a 12-lead ECG signal recorded insidea 3 T MR scanner. Independent Component Analysis (ICA) was applied to thetwo ECG datasets resulting in a set of Independent Components (ICs) for eachdataset. Non-ECG related ICs were identified and eliminated. The remainingICs were used to reconstruct a filtered, MHD-free ECG signal for each dataset.
RESULTS: The application of ICA to DataSet 1 leads to well distinguish-able ECG and MHD ICs as shown in Figs. 1(b), (c). The end of the T wavecould be detected with an error of less than 30 ms (Fig. 1(d)) but a reliable andreproducible analysis of the ST segment was not possible. For DataSet 2, ECGand MHD ICs were not clearly distinguishable since some ICs simultaneouslycontained ECG and MHD signal parts. Hence, the reconstructed ECGs lead todiagnostic errors in terms of ST segment and T wave analysis.
CONCLUSION: ICA was able to identify the MHD component in DataSet 1due to the linear mixing model. Since this simplified mixing model does nothold for DataSet 2, a proper filtering of the real MHD effect was not possible.
0 0.2 0.4 0.6 0.8−0.5
0
0.5
1
Time in [s]
Vol
tage
in [m
V]
(a)Clean ECG (grey)and with simulatedMHD effect (black)
0 0.2 0.4 0.6 0.8−5
0
5
10
15
Time in [s]
Vol
tage
in [m
V]
(b)ECG IC
0 0.2 0.4 0.6 0.8−3
−2
−1
0
1
2
Time in [s]
Vol
tage
in [m
V]
(c)MHD IC
0 0.2 0.4 0.6 0.8−1
0
1
2
3
Time in [s]
Vol
tage
in [m
V]
(d)Clean ECG (grey)compared to filteredECG (black)
Fig. 1. Results for the DataSet 1.
P84
162 Computing in Cardiology 2012, Kraków, Poland
Evaluation of blind source separation methods for noise reduction in BSPM recorded during exercise
Heriberto Zavala-Fernandez*, Michal Kania, Roman Maniewski and Dariusz Janusek
Nalesz Institute of Biocybernetics and Biomedical Engineering, PAS Warsaw, Poland
Aim: This study aimed on evaluation of blind source separation (BSS)
methods for noise reduction in body surface potential maps (BSPM) recorded during exercise. Two BSS algorithms were tested: one based on higher order statistics (FastICA) and the other on second order statistics (TDSEP).
Methods: The BSPM’s were acquired during exercise on supine ergometer using a 67-lead high-resolution ECG system with sampling frequency 4096 Hz. The study was carried out on 13 healthy volunteers. All subjects were asked to keep frequency of pedaling of around 60 cycles per minute during examination. The BSS methods were applied separately to 5 minutes recordings in each dataset.
Results: To assess high quality of denoising, the root-mean-square in each channel was computed before and after noisy component suppression and then signal-to-noise ratios (SNR) were calculated. The selection of the components to be removed was perform by looking at the time-series, the power spectra and the field distribution of the map. Channels located on the back and close to the extremities (mainly the legs) were more improved by the suppression of the noise components.
Conclusion: Obtained results show that BSS methods could reject most of the noisy components without loss of information related to the heart activity. The SNRs show a considerably improvement of about -4 to -10 dB in channels located on the back and close to the extremities. The gain observed in channels close to heart was about -0.5 dB. BSS methods are easy to implement and suitable to remove the pedaling artifact since this signal present a quasi-stationary behavior. It could be observed that artifact suppression by removal of selected components is an advised preprocessing step to enhance the SNR of multi-channel ECG recordings
.
P84
Computing in Cardiology 2012, Kraków, Poland 163
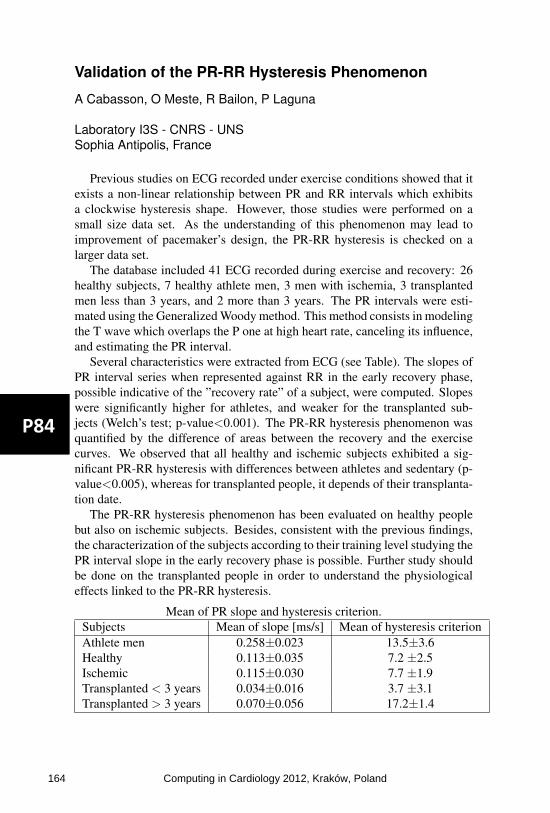
Validation of the PR-RR Hysteresis Phenomenon
A Cabasson, O Meste, R Bailon, P Laguna
Laboratory I3S - CNRS - UNSSophia Antipolis, France
Previous studies on ECG recorded under exercise conditions showed that itexists a non-linear relationship between PR and RR intervals which exhibitsa clockwise hysteresis shape. However, those studies were performed on asmall size data set. As the understanding of this phenomenon may lead toimprovement of pacemaker’s design, the PR-RR hysteresis is checked on alarger data set.
The database included 41 ECG recorded during exercise and recovery: 26healthy subjects, 7 healthy athlete men, 3 men with ischemia, 3 transplantedmen less than 3 years, and 2 more than 3 years. The PR intervals were esti-mated using the Generalized Woody method. This method consists in modelingthe T wave which overlaps the P one at high heart rate, canceling its influence,and estimating the PR interval.
Several characteristics were extracted from ECG (see Table). The slopes ofPR interval series when represented against RR in the early recovery phase,possible indicative of the ”recovery rate” of a subject, were computed. Slopeswere significantly higher for athletes, and weaker for the transplanted sub-jects (Welch’s test; p-value<0.001). The PR-RR hysteresis phenomenon wasquantified by the difference of areas between the recovery and the exercisecurves. We observed that all healthy and ischemic subjects exhibited a sig-nificant PR-RR hysteresis with differences between athletes and sedentary (p-value<0.005), whereas for transplanted people, it depends of their transplanta-tion date.
The PR-RR hysteresis phenomenon has been evaluated on healthy peoplebut also on ischemic subjects. Besides, consistent with the previous findings,the characterization of the subjects according to their training level studying thePR interval slope in the early recovery phase is possible. Further study shouldbe done on the transplanted people in order to understand the physiologicaleffects linked to the PR-RR hysteresis.
Mean of PR slope and hysteresis criterion.Subjects Mean of slope [ms/s] Mean of hysteresis criterionAthlete men 0.258±0.023 13.5±3.6Healthy 0.113±0.035 7.2 ±2.5Ischemic 0.115±0.030 7.7 ±1.9Transplanted < 3 years 0.034±0.016 3.7 ±3.1Transplanted > 3 years 0.070±0.056 17.2±1.4
P84
164 Computing in Cardiology 2012, Kraków, Poland
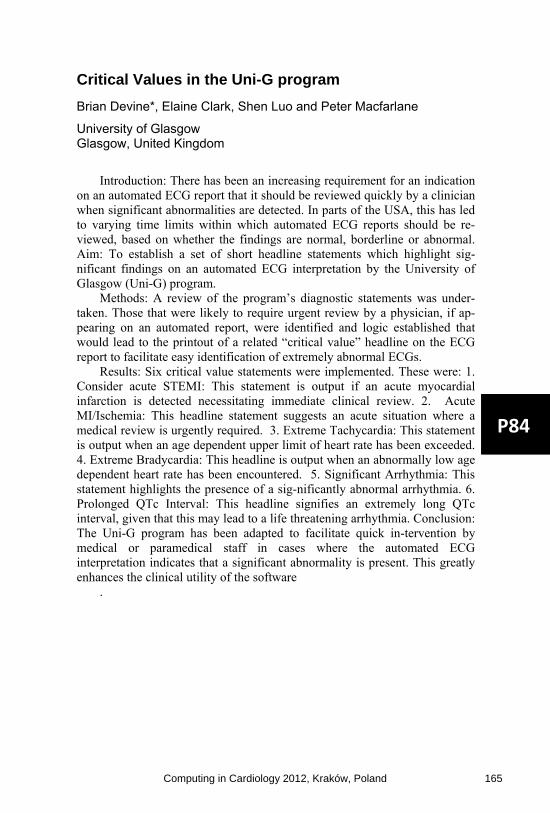
Critical Values in the Uni-G program
Brian Devine*, Elaine Clark, Shen Luo and Peter Macfarlane
University of Glasgow Glasgow, United Kingdom
Introduction: There has been an increasing requirement for an indication
on an automated ECG report that it should be reviewed quickly by a clinician when significant abnormalities are detected. In parts of the USA, this has led to varying time limits within which automated ECG reports should be re-viewed, based on whether the findings are normal, borderline or abnormal. Aim: To establish a set of short headline statements which highlight sig-nificant findings on an automated ECG interpretation by the University of Glasgow (Uni-G) program.
Methods: A review of the program’s diagnostic statements was under-taken. Those that were likely to require urgent review by a physician, if ap-pearing on an automated report, were identified and logic established that would lead to the printout of a related “critical value” headline on the ECG report to facilitate easy identification of extremely abnormal ECGs.
Results: Six critical value statements were implemented. These were: 1. Consider acute STEMI: This statement is output if an acute myocardial infarction is detected necessitating immediate clinical review. 2. Acute MI/Ischemia: This headline statement suggests an acute situation where a medical review is urgently required. 3. Extreme Tachycardia: This statement is output when an age dependent upper limit of heart rate has been exceeded. 4. Extreme Bradycardia: This headline is output when an abnormally low age dependent heart rate has been encountered. 5. Significant Arrhythmia: This statement highlights the presence of a sig-nificantly abnormal arrhythmia. 6. Prolonged QTc Interval: This headline signifies an extremely long QTc interval, given that this may lead to a life threatening arrhythmia. Conclusion: The Uni-G program has been adapted to facilitate quick in-tervention by medical or paramedical staff in cases where the automated ECG interpretation indicates that a significant abnormality is present. This greatly enhances the clinical utility of the software
.
P84
Computing in Cardiology 2012, Kraków, Poland 165

Selective Beat Averaging to Evaluate Ventricular Repolarization Adaptation to Deconditioning After 5-days of Head-Down Bed-Rest
Alessandro Pellegrini*, Juan Bolea, Mariano Llamedo Soria, Miguel Sotaquira, Rute Almeida, Pablo Laguna, Pierre Vaida and Enrico G Caiani
Politecnico di Milano Milan, Italy
Purpose. The study of QT/RR relationship is important for the clinical
evaluation of possible risk of acquired or congenital ventricular tachyarrhythmia, predisposing to life-threatening arrhythmias. As deconditioning is a risk factor for cardiovascular disease, our aim was to assess the effects of 5-days of strict head-down (-6 degrees) bed-rest (BR) on ventricular repolarization by advanced ECG processing.
Methods. 8 healthy men (mean age 35±3) were enrolled; the experiment was conducted at MEDES (Toulouse, France) as part of the European Space Agency BR studies. High fidelity (1000 Hz) Holter ECG (12-leads, Mortara Instrument) was acquired before (PRE), the last day of BR (HDT5), and four days after the BR conclusion (POST). The night period (23:00-06:30) was selected for the analysis. X,Y,Z leads were derived using inverse Dower matrix and vectorcardiogram computed. Selective beat averaging was used to obtain averages of P-QRS-T complexes that are preceded by the same stable heart rate (defined for each 10 msec bin amplitude, in the range 900-1200 msec). For each averaged waveform (i.e., one for each bin), T-wave maximum amplitude (Tmax), T wave area, R-Tapex and R-Tend were automatically extracted.
Results. Compared to PRE, at HDT5 both R-Tapex and R-Tend resulted significantly (Friedman’s test) shortened (-5% and -3%, respectively), together with a decrease in T-wave area (-7%), while Tmax was unchanged. At POST, duration parameters showed a trend towards their control values (-1.5% and -3%, respectively) while amplitude parameters resulted larger than PRE (Tmax:+20%, T-wave area: +5%).
Conclusions. Despite the short-term BR, cardiac adaptation to deconditioning affected ventricular repolarization during the night period. Selective beat averaging allowed quantification of these changes. This should be taken into account in patients with cardiovascular diseases, when immobilized in bed, to proper adjust the pharmacological therapy in order to avoid further complications
.
P85
166 Computing in Cardiology 2012, Kraków, Poland

Assessing Cardiac Health through Heart Rate Topics
Alexander Van Esbroeck* and Zeeshan Syed
University of Michigan Ann Arbor, United States
Aims Short-term variations in heart rate have been shown to provide
clinically useful information that goes beyond what aggregate heart rate variability metrics capture. This study proposes a novel approach to modeling these patterns in long-term ECG data, by learning latent structure among all patterns in a collection of recordings. Our method leverages topic models, traditionally used in text analysis to learn semantically related sets of words in a collection of documents. In contrast to existing methods that use only a small number of patterns, this method integrates information in large numbers of patterns for assessing cardiac health.
Methods Heart rate time series were extracted from day-long ECG recordings, and discretized into values reflecting low through high heart rate values. All heart rate subsequences of length 6 were counted in each discretized recording. Latent Dirichlet Allocation, a method for topic modeling, was used to learn a model using the pattern frequencies in each patient's recording across the entire collection. The method did not use patient outcomes, and estimated the associations between patients and each topic. Experiments A risk score based on this model was assessed for predicting cardiovascular death alongside the TIMI risk score and LVEF on 3,071 patients admitted to hospitals with non-ST-elevation acute coronary syndrome and year-long follow-ups. Patients were randomly divided into equally sized training and testing sets. Training patients were used to learn a topic-based risk score and two logistic regression models: one with TRS and LVEF, and another additionally including the topic-based score.
Results The AUC of the model with TRS and LVEF was 0.76, and after adding the topic-based score was 0.77. The net reclassification improvement after including the topic-based score was statistically significant (p=0.02).
Conclusion Utilizing all heart rate patterns present in ECG recordings can provide complementary information for cardiac risk stratification
.
P85
Computing in Cardiology 2012, Kraków, Poland 167

Clinical Characterization by Principal Component Analysis of ECG in Stress Test
G. Bortolan, I. Christov, I. Simova, T. Katova, I Jekova, V Krasteva
Institute of Biomedical Engineering, ISIB-CNR Padova, Italy
Goal: The aim of the study is to investigate the influence of different clini-cal parameters such as: presence of atrial hypertension (AH), diabetes melli-tus (DM), angina pectoris (AP), positive result during stress ECG test, history of myocardial infarction (MI), presence of angiographically significant coro-nary artery disease (AS-CAD) by Principal Component Analysis (PCA) of the electrocardiogram (ECG) in Stress Test.
ECG database: We studied 106 patients: age 63±10 years, 61 male, 39 with DM, 85 with AP, 34 with positive stress test, 18 with a history of MI, 48 with AS-CAD. Digital 12-lead electrocardiograms (ECG) were acquired dur-ing stress ECG test using veloergometer (GE Marquette Stress PC ECG Ap-plication) – 2-min stages 25W incremental workload.
Method: Two indices by PCA analysis have been used: complexity index PCA1: λ2/λ1, and non linear components PCA2: (λ4+λ5+…+λn)/sum(λi). PCA1 and PCA2 are applied to the QRS complex and to the T wave. Mean values, max values and standard deviation are the parameters examined in the study.
Results: Significant difference between the PCA of the QRS was found between subgroups of patients defined according to the presence or absence of AP (p<0.05 for PCA1) and AH (p<0.05 for PCA2). Significant difference between the PCA of the T-waves was present between subject with or with-out a history of MI (p<0.05 for PCA1), presence or absence of DM (p<0.01 for PCA2) and AS-CAD (p<0.05 for PCA1 and PCA2) and according to the result of a stress ECG test (p<0.05 for PCA2).
Conclusion: Different clinical parameters have a distinct influence on the two indices based on the Principal Component Analysis applied on the QRS complexes and T-waves during Stress ECG Test.
QRS complex T wave Presence vs absence of: PCA1 PCA2 PCA1 PCA2
MI AP AS-CAD AH DM positive Stress Test
- p<0.05
- - - -
- - -
p<0.05 - -
p<0.05
p<0.05 - - -
- -
p<0.05 -
p<0.01 p<0.05
P85
168 Computing in Cardiology 2012, Kraków, Poland

Symbolic Dynamics of QT Interval Series: Ischemic Cardiomyopathy
A Vera1, M Vallverdú1, P Gomis1, A Porta2, A Voss3, A Bayés de Lu-na4, P Caminal1
1Dept ESAII, Universitat Politècnica de Catalunya, Barcelona, Spain 2Dept TH, Galeazzi Orthopaedic Institute, University of Milan, Italy 3Dept MEB, University of Applied Sciences, Jena, Germany 4Catalan Institute of Cardiovascular Sciences, Barcelona, Spain
Repolarization dynamics may be of increasing interest in analyzing ECG-Holter for characterization of myocardial ischemic events related to sudden cardiac death. The quantification of the dynamics of the beat-to-beat QT interval fluctuations, representing changes in repolarization duration, may be another emerging marker of cardiac events. Based on these arguments, the present work analyses QT and RR series obtained from 24-hour ECG-Holter recordings, in order to obtained patterns able to stratify high (HRG) and low risk (LRG) of suffer cardiac mortality in patients with symptomatic myocar-dial ischemia.
A total of 146 patients were analyzed. Twenty-five patients who suffered cardiac death were considered as HRG and 121 survivor patients as LRG. All series were preprocessed by applying an adaptive filter, and windows of 300-samples without overlapping were considered for the analysis.
A symbolic dynamics methodology to study QT and RR variability was applied. In this regards, QT and RR series were transformed to a series of symbols according to six-equidistant amplitude-levels. Patterns of length L=3 were constructed. All possible patterns were grouped into 3 families referred to as: patterns with no variation (P0; all 3 symbols were equal); patterns with one variation (P1; 2 consequent symbols were equal and the remaining sym-bol was different); and patterns with 2 variations (P2; all symbols were dif-ferent from the previous one).
The results obtained by quantifying QT intervals showed that P0 values were higher in LRG compared with HRG (p-value<0.01). Quantifying RR intervals, the pattern P0 (p-value<0.05) followed similar behavior to that of QT intervals. However, the RR series could be also characterized by the pattern P2, which presented opposite behavior than P0 when LRG and HRG were compared.
These findings suggest a decreased cardiac vagal function with a relative increase in sympathetic cardiac modulation, and more complex pattern of ventricular repolarization in the HRG.
P85
Computing in Cardiology 2012, Kraków, Poland 169

Screening ST Segments of ECG Signals in Patients with Cardiac Autonomic Neuropathy
Ahsan Habib Khandoker*, Selwa Boularaoui, Noura Salem Obaid Almatroushi, Enas Azhari Ahmed Osman, Ghada Mohammed Alhussein, Namareq Salah Mohamed Widatalla, Kinda Khalaf and Herbert Jelinek
Given the elevated risk of cardiovascular events and the higher prevalence of silent ischaemia in diabetic patients, it is important to screen those patients for cardiac autonomic neuropathy (CAN). Early detection of CAN in diabetic patients, and hence timely intervention, are of critical importance towards preventing sudden cardiac death. The aim of this study is to assess whether myocardial ischaemia is common in diabetic patients with CAN by screening the ST heights of ECG signals. ST depression indicates myocardial ischaemia. The heights of ST segments of ECG signals (lead II) of 10 subjects without CAN (CAN-) [age: 61±16 years (4 males and 6 females)] and 10 subjects with CAN (CAN+) [age: 64±11 years (4 males and 6 females)] were extracted in LabChart7.3. None had clinical evidence of heart disease. Five cardiac autonomic nervous system function tests as described by Ewing were recorded. The criterion for CAN- was that all five cardiac autonomic nervous system function tests had to be within the normal range. Definite CAN+ was defined as two or more abnormal heart rate tests. Episodes of ST segment depression were seen in 6 CAN+ patients (60%) but were not more common in patients without CAN. The ST heights of CAN+ group (-0.0116±0.04 mV) were found to be significantly (p=0.02; t-test) lower than that of CAN- group (0.07±0.13 mV) [Figure 1]. The area under the receiver operating curve was found to be 0.83 for ST heights in classifying CAN+ from CAN- subjects. Based on the results, we speculate that CAN+ patients with ST depression are at increased risk of developing neurovascular dysfunction leading to acute myocardial ischaemia in subsequent years. The incidence and prognosis of silent myocardial ischaemia in diabetic patients with cardiac autonomic dysfunction need to be further studied
.
P85
170 Computing in Cardiology 2012, Kraków, Poland

Profile of the Autonomic Cardiac Control in Patients Who Are not Considered Ready for Weaning from Mechanical Ventilation
M Matveev, V Krasteva, I Jekova*, G Georgiev, S Milanov, R Prokopova, L Todorova
Institute of Biophysics and Biomedical Engineering, Sofia, Bulgaria
This study aims to assess the activity of the autonomic cardiac control in patients with unsuccessful trial for weaning from controlled mechanical ven-tilation (CMV). Time- and frequency-domain indices of the heart rate vari-ability (HRV) extracted from continuously recorded ECG during 5 phases of weaning are correlated to basic respiratory and hemodynamic parameters.
The data are collected from patients undergoing weaning with AVEA ven-tilator system (Cardinal Health, USA), following a study protocol with 5 phases: (1) CMV of sedated patient; (2) CMV of sedated-paralyzed patient; (3) pressure support ventilation (PSV) at zero back-up pressure; (4) PSV at 12-25 cmH2O; (5) spontaneous breathing trial (SBT) with PSV at 8 cmH2O. During each phase, measurements of blood pressure (SysBP, DiaBP), respira-tory rate (f), tidal volume (Vt), minute ventilation (VE), SpO2, PetCO2 are gathered. Using continuously recorded single-lead ECG, HRV analysis is applied on a stable 5-min episode on N-N intervals taken 5 min after the be-ginning of each phase. Time- and frequency-domain indices, listed in Table1, are calculated.
This preliminary study includes 25 measurement points from 5 unsuccess-ful patients who do not fulfill general weaning criteria at the 2nd hour of SBT. The found significant correlations between the respiratory parameters and the HRV indices (Table 1) show reduction of the activity of both sympathicus and parasympathicus parts of the autonomic cardiac balance.
Table 1. Correlations between basic HRV indices and weaning parameters in patients with weaning failure (25 measurement points).*: p<0.05. SysBP
(mmHg)DiaBP
(mmHg)f
(br/min)Vt
(mL) VE (L)
f/Vt ratio
SpO2 (%)
PetCO2(mmHg)
SDNN (ms) -0.06 -0.12 0.36 -0.50* -0.52* 0.53* -0.44* 0.52* HRV triangular index -0.16 0.06 0.44* -0.63* -0.47 0.56 -0.31 0.22 dSDNN (ms) 0.41* -0.10 -0.09 -0.04 -0.19 0.01 -0.58* 0.33 RMS (ms) 0.41* -0.09 -0.08 -0.07 -0.19 0.02 -0.58* 0.34 pNN50 (min-1) 0.30 -0.05 -0.08 -0.11 -0.18 0.04 -0.60* 0.32 TP <0.4Hz (ms2) -0.13 -0.12 0.41* -0.52* -0.54* 0.68 -0.62* 0.59*LF 0.04-0.15 Hz (ms2) -0.09 -0.13 0.15 -0.36 -0.43* 0.42 -0.72* 0.36 HF 0.15-0.4 Hz (ms2) 0.23 -0.02 0.04 -0.21 -0.28 0.24 -0.68* 0.51*LFP (%) -0.43* 0.45* 0.20 -0.30 -0.12 0.24 0.19 -0.25 HFP (%) 0.43* -0.45* -0.20 0.30 0.12 -0.24 -0.19 0.25 LF/HF -0.18 0.37 0.29 -0.35 0.01 0.27 0.23 -0.12
P85
Computing in Cardiology 2012, Kraków, Poland 171

Applying Lyapunov Exponents in Heart Rate Time Series to Identify the Anaerobic Threshold in Healthy Men
Fátima MHSP da Silva*, Antônio Carlos da Silva Filho, Lourenço Gallo Jr and Júlio Cesar Crescêncio
Universidade de São Paulo Ribeirão Preto, Brazil
During the last years a lot of papers have appeared dealing with the
applications to physiological time series of some parameters originally foun in Dynamical System In. In this work, we looked for the Largest Lyapunov Exponents (LLE) in heart rate time series of healthy men in order to ver ify if it was possible to find the Anaerobic Threshold (AT) in a non-invasive way using just the time series and the LLE extracted from them (the AT is one of the best parameters to quantify aerobic capacity at sub-maximal power levels in dynamic physical exercise). The work was undertaken in a group of 10 healthy individuals. This is the same database we used in previous works related to the same question. The data were obtained by way of a computerized system, allowing the identification of the R waves of the conventional electrocardiogram. The R-R intervals were, then, stored, using several different experimental protocols. The series of R-R intervals, lasting for twelve minutes, were obtained in rest (supine and seated positions) in a discontinuous protocol of dynamic exercise in seated position using a brake electromagnetic cycle ergometer. The protocol used progressively growing power steps with increments of 5 to 10 watts (W), starting from 25W. The LLE were computed using the Tisean system. The results were compared to those obtained by the measurement of AT using an autoregressive integrated moving-average model (ARIMA) and using the Kolmogorov-Sinai Entropy (KS). The Spearman test (rs) with α = 5% applied to these three methods gave: (a) for KS x Arima: p < 0.01, rs = 0,93; (b) LLE x KS: p < 0.01, rs = 0.94 and © LLE x Arima: p < 0.01, rs = 0.93. These results are very expressive concerning the use of LLE to find the AT
.
P85
172 Computing in Cardiology 2012, Kraków, Poland

Interest of RR Deceleration for Diagnosis of Late Onset Sepsis
Romain Billois, Fabienne Poree, Alain Beuchee and Guy Carrault*
Université de Rennes I Rennes, France
Aims: Diagnosis of late onset sepsis in premature infants remains
difficult because clinical signs are subtle and none of the laboratory tests, including CRP and blood culture, have high predictive accuracy. We reported that entropy and long-range fractal correlation of Heart Rate Variability (HRV) are decreased in premature infants with sepsis. In this study, we propose a simple signal processing algorithm to pre-detect late onset sepsis in real-time.
Methods: We estimated beat-to-beat decelerations heart rhythm. Deceleration Runs of n=1,15 cycles duration (DRn) were counted over periods of 30 minutes outside bradycardia episodes. The two hypotheses (Ho: Sepsis vs. H1: Non Sepsis) were confronted in a case control study including 16 infected premature infants who were matched (birth weight, postnatal and gestational age) with 16 non infected infants. Infants were recorded at the neonate intensive care unit of Rennes University Hospital. Both groups were compared using the Wilcoxon test and the Receiver Operating Characteristics (ROC) were plotted with i) DR1 and DR4 (the most significant runs) as a local decision statistic and ii) by combining the local decisions (logical OR and logical AND).
Results: Results are presented as the median-[25th-75th percentiles] of numbers of DRn over 30min. Both groups were significantly different for DR1 (892-[762-968] vs 1013-[892-1140], p=0.037) and for DR4 (14-[8-19] vs 8-[3-12], p=0.012). We also observed the benefit of the data fusion level. Area under the ROC curves grows up to 0.7906 with the OR fusion law rather than 0.7068 with DR4, the best local detector.
Conclusions: Lower DR1 and higher DR4 values were associated with the sepsis group and confirmed the interest of RR to reveal infection. Due to the simplicity of the deceleration algorithm, we should imagine an embedded real-time diagnosis using HRV where sepsis suspicion could be confirmed by our robust algorithms proposed in the past
.
P85
Computing in Cardiology 2012, Kraków, Poland 173

Significance of Snoring Sounds and Other Sounds Appearing during the Night, based on ECG
Klaudia Czopek*
AGH University of Science and Technology Krakow, Poland
Presented study demonstrates that there is a significant difference in
sound spectrum between snoring sound, normal breath sound and obstructive apneas sound which is correlated with ECG signal. It is possible to use sound spectrum analysis as a supplementary method to determine the obstruction site of a patient with obstructive sleep apnea syndrome (OSAS) or other disturbance during the night. Correlation between acoustic and ECG analysis might be one of the screening methods allowing early assessment of the severity of various sleep disorders. Several differences have been found between people showing typical snoring symptoms and subjects with some other common sleep disturbances during the night. The acoustic characteristics of snoring sounds and its variability can be shown; the snoring sound is fully described using the time domain, by sound intensity and pitch and the frequency domain, using representative formant frequencies, shape and energy ratio measurements. Feature classification of snoring sounds and ECG parameters allow classification according to the level of SAHS (sleep apnea-hypopnea syndrome) of people who have sleep disorders. Sounds appearing during night in conjunction with ECG monitoring allow convenient subject assignment to categories described with the level of snoring severity and could be able to help with further diagnosis and therefore future treatment
.
P85
174 Computing in Cardiology 2012, Kraków, Poland

Independent Component Analysis Suppresses Motion Artefact in Optical Action Potential Records
Oto Janousek*, Jana Kolarova, Marina Ronzhina, Marie Novakova and Sridhar Krishnan
Brno University of Technology Brno, Czech Republic
Aims: Optical signals reflect electrical phenomenon in the heart,
however presence of motion artefact (MA) complicates their evaluation. Novel approach of MA suppression based on independent component analysis (ICA) method is presented in this study. ICA efficiency and its limitations are considered as well, verified by comparison with state-of-the-art ratio-metric method.
Methods: Isolated rat heart was mounted in the Langendorff apparatus and stained with voltage-sensitive dye di-4-ANEPPS. Optical action potentials (APs) and three simultaneously recorded electrograms were recorded by touch-less methods with usage of the three-segment photodiode as a photo-detector. Simultaneous recording of optical signals from three different parts of spectra allows using ICA for separation of MA and AP without a priori knowledge of MA characteristic.
Results: ICA has been found successful technique for MA suppression: correlation coefficient between results obtained by ICA and results obtained by widespread ratio-metric method is 0.995. Correctness of ICA usage has been proved as well by (a) verification of equality of the joint probability density function of measured MA and Luo-Ruby modelled AP with product of its marginal densities and by (b) accepted hypothesis of non-Gaussian character of MA and AP confirmed by chi-square goodness-of-fit test (α = 0.05). Conclusion: ICA can be used for MA suppression in simultaneously recorded optical signals. ICA is superior over ratio-metric method in case of different amplification of input sensors due to transforming scales of input data in pre-processing step. The shape of AP is therefore independent on input sensors amplification
.
P85
Computing in Cardiology 2012, Kraków, Poland 175

The Intelligent Method to detect the Normal, Ischemia, Myocardial Infarction and Reperfusion phases in Rat, based on ECG and ABP Signals
Seyyed Abbas Atyabi*, Hamid Ebrahimi Orimi and Rasa Jamshidi
Department of Mechanical Engineering, K. N. Toosi University of Technology, Tehran, Iran
Aims: Today, many people with coronary congestion lose their lives,
now if we can get blocked out in the early stages, it can be prevented from mortality. There are ways to detect congestion, but these methods are usually time consuming and costly. The purpose of this paper is to provide the scientific method based on artificial intelligent methods for detection phase of normal, ischemia, myocardial infraction (MI) and reperfusion.
Methods: In this clinical study, electrocardiogram (ECG) and atrial blood pressure (ABP) signals of 15 wistar rats with an artificial complete blockage in the left anterior descending coronary artery (LAD), for intelligent pattern recognition, were collected (in this case the rats were 30 minutes in normal state, after LAD obstacle, 30 minutes in ischemia and MI state and finally With the elimination of congestion, 30 minutes in reperfusion state). After that by using discrete walsh-hadamard transform on detected PQRST and its corresponding pressure signal, Walsh function coefficients and their frequency band energies were extracted as feature vectors. Feature vector is processed by principle component analysis (PCA) to reduce its dimensionality. For classification of Features vector we train four multi-layer perceptron artificial neural networks (MLP-BP ANN) (by different structure) and K nearest neighbor (KNN) and voting criteria by using 12 rats (150000 beats) and other rats (37500 beats) were tested by above classifiers.
Results: in normal, ischemia, myocardial infarction and reperfusion phases, we attained total sensitivity (Se) 96%, Specificity (Sp) 91%, respectively
Conclusion: This method was compared with existing laboratory criteria, Finally In many cases the results were similar because it was very robust and adaptive, with each signals
.
P86
176 Computing in Cardiology 2012, Kraków, Poland
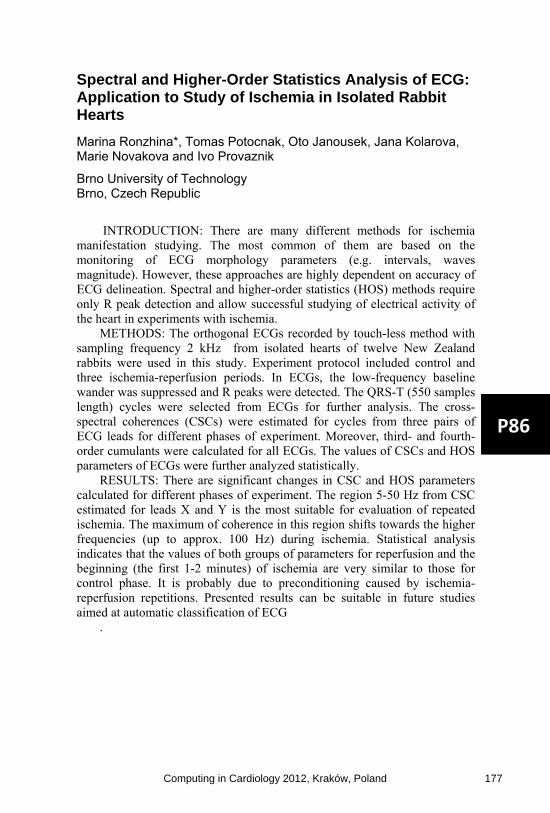
Spectral and Higher-Order Statistics Analysis of ECG: Application to Study of Ischemia in Isolated Rabbit Hearts
Marina Ronzhina*, Tomas Potocnak, Oto Janousek, Jana Kolarova, Marie Novakova and Ivo Provaznik
Brno University of Technology Brno, Czech Republic
INTRODUCTION: There are many different methods for ischemia
manifestation studying. The most common of them are based on the monitoring of ECG morphology parameters (e.g. intervals, waves magnitude). However, these approaches are highly dependent on accuracy of ECG delineation. Spectral and higher-order statistics (HOS) methods require only R peak detection and allow successful studying of electrical activity of the heart in experiments with ischemia.
METHODS: The orthogonal ECGs recorded by touch-less method with sampling frequency 2 kHz from isolated hearts of twelve New Zealand rabbits were used in this study. Experiment protocol included control and three ischemia-reperfusion periods. In ECGs, the low-frequency baseline wander was suppressed and R peaks were detected. The QRS-T (550 samples length) cycles were selected from ECGs for further analysis. The cross-spectral coherences (CSCs) were estimated for cycles from three pairs of ECG leads for different phases of experiment. Moreover, third- and fourth-order cumulants were calculated for all ECGs. The values of CSCs and HOS parameters of ECGs were further analyzed statistically.
RESULTS: There are significant changes in CSC and HOS parameters calculated for different phases of experiment. The region 5-50 Hz from CSC estimated for leads X and Y is the most suitable for evaluation of repeated ischemia. The maximum of coherence in this region shifts towards the higher frequencies (up to approx. 100 Hz) during ischemia. Statistical analysis indicates that the values of both groups of parameters for reperfusion and the beginning (the first 1-2 minutes) of ischemia are very similar to those for control phase. It is probably due to preconditioning caused by ischemia-reperfusion repetitions. Presented results can be suitable in future studies aimed at automatic classification of ECG
.
P86
Computing in Cardiology 2012, Kraków, Poland 177
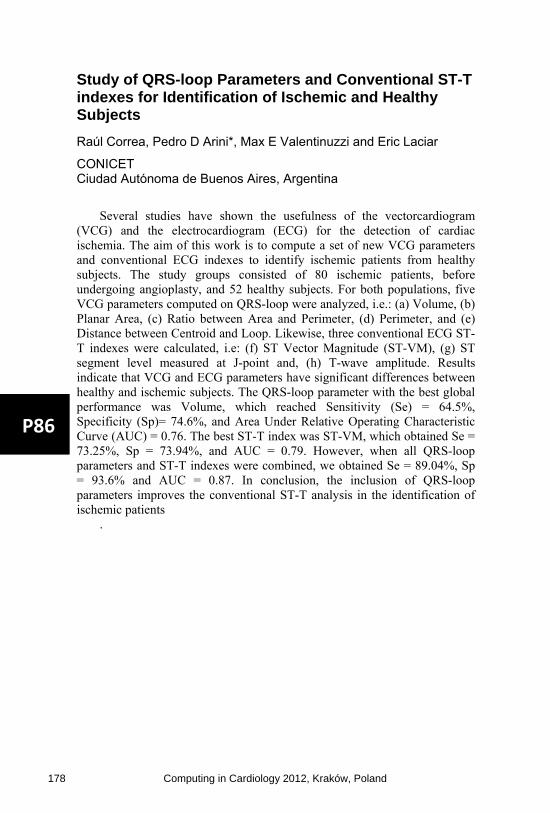
Study of QRS-loop Parameters and Conventional ST-T indexes for Identification of Ischemic and Healthy Subjects
Raúl Correa, Pedro D Arini*, Max E Valentinuzzi and Eric Laciar
CONICET Ciudad Autónoma de Buenos Aires, Argentina
Several studies have shown the usefulness of the vectorcardiogram
(VCG) and the electrocardiogram (ECG) for the detection of cardiac ischemia. The aim of this work is to compute a set of new VCG parameters and conventional ECG indexes to identify ischemic patients from healthy subjects. The study groups consisted of 80 ischemic patients, before undergoing angioplasty, and 52 healthy subjects. For both populations, five VCG parameters computed on QRS-loop were analyzed, i.e.: (a) Volume, (b) Planar Area, (c) Ratio between Area and Perimeter, (d) Perimeter, and (e) Distance between Centroid and Loop. Likewise, three conventional ECG ST-T indexes were calculated, i.e: (f) ST Vector Magnitude (ST-VM), (g) ST segment level measured at J-point and, (h) T-wave amplitude. Results indicate that VCG and ECG parameters have significant differences between healthy and ischemic subjects. The QRS-loop parameter with the best global performance was Volume, which reached Sensitivity (Se) = 64.5%, Specificity (Sp)= 74.6%, and Area Under Relative Operating Characteristic Curve (AUC) = 0.76. The best ST-T index was ST-VM, which obtained Se = 73.25%, Sp = 73.94%, and AUC = 0.79. However, when all QRS-loop parameters and ST-T indexes were combined, we obtained Se = 89.04%, Sp = 93.6% and AUC = 0.87. In conclusion, the inclusion of QRS-loop parameters improves the conventional ST-T analysis in the identification of ischemic patients
.
P86
178 Computing in Cardiology 2012, Kraków, Poland
Study of T-wave Spectral Variance during Acute Myocardial Ischemia
Esteban R Valverde and Pedro D Arini*
CONICET Ciudad Autónoma de Buenos Aires, Argentina
Experimental and clinical studies have shown that beat-to-beat
variability of repolarization morphology is associated with and increased risk for developing malignant ventricular arrhythmias. Beat-to-beat variability has been previously measured by T-wave spectral variance (TWSV) index based on the 2D Fourier transform in ECG recordings. However, there is not exist data on the relationship between TWSV index and acute myocardial ischemia. We have studied a modified version of TWSV index during percutaneous transluminal coronary artery (PTCA) procedure. Also, we analyze the intraindividual and interindividual variation of TWSV index recorded at control stages. The study group consisted of 55 patients. Two ECG control recordings (C1 and C2) and one ECG during PTCA were obtained by leads V1-V6, I and II. We evaluated TWSV index in the synthesized orthogonal X, Y and Z leads. The two-sided Mann-Whitney test was realized by comparing control versus PTCA. Results (mean±SEM) give significant differences: X-lead: 0.017±0.019 vs. 0.057±0.066, *p<0.0001; Y-lead: 0.021±0.023 vs. 0.101±0.090, *p<0.0001 and Z-lead: 0.018±0.024 vs. 0.081±0.083, *p<0.0001. The intraindividual and interindividual variability of TWSV index were evaluated from the Wilcoxon signed rank test applied to the difference between C1 and C2 and the difference between the SD of both controls respect to the SD of the whole population; respectively. The results (mean±SEM) are: X-lead: C1(0.024±0.027) vs. C2(0.017±0.019), high-intraindividual/high-interindividual variability; Y-lead: C1(0.022±0.024) vs. C2(0.021±0.023), low-intraindividual/ high-interindividual variability and Z-lead: C1(0.020±0.023) vs. C2(0.018±0.024), low-intraindividual/highinterindividual variability. Results indicate: 1) The TWSV have shown significant differences between control and PTCA 2) Low-intraindividual and high-interindividual variability of TWSV were observed. The TWSV confirms the presence of beat-to-beat variability during acute ischemia and increased risk for developing arrhythmias. Intraindividual analysis has shown that of TWSV present high-stability for each patient. While, the high-interindividual variability could decremented by TWSV normalization, in order to be independent of the patient
.
P86
Computing in Cardiology 2012, Kraków, Poland 179

Early Diagnosis of Acute Myocardial Infarction by ST-Segment Deviation Score
Raphael Twerenbold, Tobias Reichlin, Roger Abächerli*, Stefan Osswald and Christian Müller
SCHILLER AG Baar, Switzerland
Background: The ST-segment deviation score (STDS) has been invented
for the early detection of ischemic signs in a standard 12-lead-electrocardiography (ECG) in patients with symptoms suggestive of acute myocardial infarction (AMI). However, little is known about the optimal cutoff-values or the time of measurement in the repolarisation-phase.
Methods: We conducted a prospective study in 521 consecutive patients who presented with symptoms suggestive of AMI to the emergency department. Patients with left ventricular hypertrophy or bundle branch block were excluded. The STDS was defined as the sum in millimeters (1 mm = 1 mV) of the absolute value of ST-segment deviations in all 12 leads of the initially recorded ECG. The STDS was determined at several timepoints during the electrocardiographic phase of repolarisation.
Results: AMI was the adjudicated final diagnosis in 71 (14%) patients. The diagnostic accuracy of the STDS-measurements obtained at presentation, as quantified by the area under the receiver operating characteristic curve (AUC), was best at J-point (0.71; 95% confidence interval 0.65 to 0.77) and significantly higher as compared to measurements during later phases of repolarisation (p<0.05). E.g. a cutoff value of 8.3 mm in the STDS at J-Point resulted in a positive likelihood ratio of 4.07 for the diagnosis of an AMI. In the setting of a non-diagnostic ECG at presentation (n=401, 77%), the AUC of STDS-measurements at J-point remained superior to different sites. The optimal cutoff value for the STDS in this clinically important subgroup was 3.1 mm.
Conclusions: The STDS in acute chest pain patients for the early diagnosis of AMI is determined best at J-point and, in conjunction with clinical examination and biomarker findings, might be of particular help to select those patients without a diagnostic ECG but at higher risk of having an AMI
.
P86
180 Computing in Cardiology 2012, Kraków, Poland

Role of Fibrillatory Waves Amplitude as Predictors of Immediate Arrhythmia Termination After Maze Surgery of Atrial Fibrillation
A Hernández*, R Alcaraz, F Hornero and JJ Rieta
Biomedical Synergy Valencia, Spain
The Maze is an effective procedure to terminate atrial fibrillation (AF) in
patients requiring open-heart surgery associated to another heart disease. After the surgery, spontaneous reversion to normal sinus rhythm (NSR) occurs immediately in some patients, but a considerable number of them still remain in AF. For some of these latter cases, spontaneous AF reversion takes place after several hours or days but, in others, electrical cardioversion (ECV) is required when AF is present for more than one month after surgery. This work analyzes the preoperative AF ECG to predict which patients will revert spontaneously to NSR immediately after the Maze and which ones will not. This information is relevant for clinicians to anticipate antiarrhythmic treatment or ECV-related decisions. The database was composed of 23 twelve-lead preoperative ECGs in which an adaptive QRST cancellation method was applied to lead V1 in order to get a 20 seconds segment of atrial activity (AA). On these segments, the dominant atrial frequency (DAF), Sample Entropy (SampEn) of the main atrial wave and fibrillatory waves average power (fWP) were computed as potential predictors. Finally, the indices were combined through a decision tree to improve prediction capability. In order to avoid surgeon-dependent bias, the same doctor practiced all the Mazes. Obtained results for the DAF yielded a Sensitivity (Se), Specificity (Sp) and Accuracy (Acc) of 67%, 71% and 69%, respectively. For SampEn 78%, 71% and 75%, respectively and for fWP were 89%, 71% and 78%, respectively. Finally, the decision tree combining all the analyzed parameters improved prognosis capability with Se, Sp and Acc of 78%, 94% and 87%, respectively. Predicting spontaneous immediate AF termination after Maze surgery from the preoperative ECG is not an easy task due to the considerable transformation occurring on the atrial substrate. Moreover, the surgeon skill is a key aspect directly related with results. Anyway, fWP combined with DAF and SampEN have provided very auspicious results
.
P87
Computing in Cardiology 2012, Kraków, Poland 181

Atrial Electrical Activity Detection in 12-Lead ECG Using Synthetic Atrial Activity Signal Or Perlman*, Amos Katz, Noam Weissman, Yaniv Zigel
Ben Gurion University of the Negev, Israel
A significant key for the success of arrhythmias diagnosis using ECG, is
detecting the atrial electrical activity (AEA). Despite extensive research,
there is a diagnostic problem to detect AEA in some arrhythmias, especially
when the AEA-wave is hidden in other waves. Our proposed method utilized
the well-known linear combiner, usually used for noise reduction method,
and adapted it to AEA detection.
Methods: The physician/user marks one prominent AEA segment. Then,
a synthetic signal is created; it contains an isoelectric line, besides a Gaussian
in the delineated segment. The 6 precordial leads, lead I and II serve as
reference signals, so by finding the appropriate weight coefficients, their
linear combination is forced to converge to a signal that is similar to the AEA
signal. At the final stage, the resulting signal is band-pass filtered and the
peaks higher than a certain threshold are determined as AEA-waves.
Experiment setup: We used signals from the GE Cardiolab IT which
produces standard 12-lead ECG and intra-cardiac recordings of the AEA
from the high right atrium (HRA) used for performance evaluation. We used
126 10-seconds long signals, from 24 patients, containing the following
arrhythmias: atrial fibrillation, atrial flutter, AV node re-entry tachycardia,
AV re-entry tachycardia, sinus tachycardia, atrial tachycardia, premature
ventricular contraction, premature atrial contraction and sinus rhythm.
Results: sensitivity of 90% and precision of 88% were achieved in
detecting AEA from the standard 12-lead ECG.
Conclusions: The research shows that using a synthetic atrial activity
signal to find a linear combination of the 12-lead ECG that emphasizes the
atrial activity component is possible and can be used for AEA-wave
detection, even if it is hidden in other electrical activities during various types
of arrhythmias.
Fig 1.a. Atypical atrial flutter (lead V1), the two vertical lines mark the manually delineated segment. The arrows indicate the
true AEA-waves. b. The synthetic signal. c. Resulting output signal, the arrows indicate the detected AEA-waves.
P87
182 Computing in Cardiology 2012, Kraków, Poland
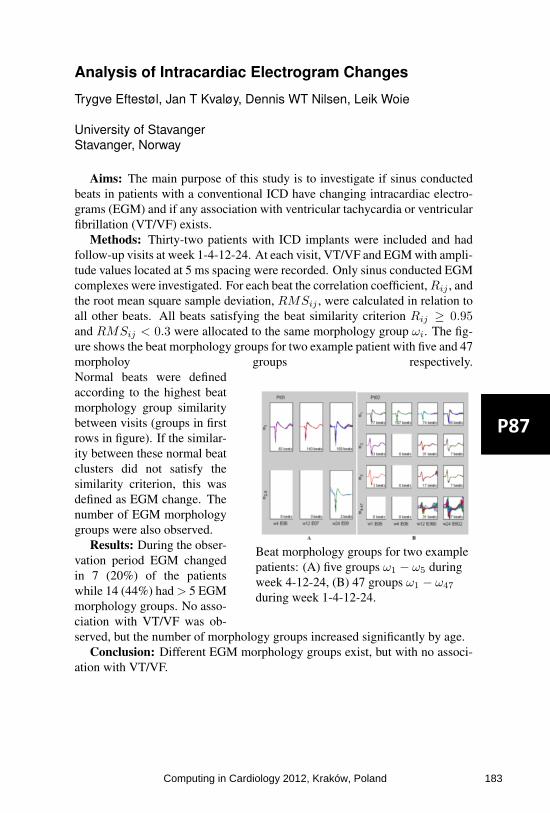
Analysis of Intracardiac Electrogram Changes
Trygve Eftestøl, Jan T Kvaløy, Dennis WT Nilsen, Leik Woie
University of StavangerStavanger, Norway
Aims: The main purpose of this study is to investigate if sinus conductedbeats in patients with a conventional ICD have changing intracardiac electro-grams (EGM) and if any association with ventricular tachycardia or ventricularfibrillation (VT/VF) exists.
Methods: Thirty-two patients with ICD implants were included and hadfollow-up visits at week 1-4-12-24. At each visit, VT/VF and EGM with ampli-tude values located at 5 ms spacing were recorded. Only sinus conducted EGMcomplexes were investigated. For each beat the correlation coefficient, Rij , andthe root mean square sample deviation, RMSij , were calculated in relation toall other beats. All beats satisfying the beat similarity criterion Rij ≥ 0.95and RMSij < 0.3 were allocated to the same morphology group ωi. The fig-ure shows the beat morphology groups for two example patient with five and 47morpholoy groups respectively.
Beat morphology groups for two examplepatients: (A) five groups ω1 − ω5 duringweek 4-12-24, (B) 47 groups ω1 − ω47
during week 1-4-12-24.
Normal beats were definedaccording to the highest beatmorphology group similaritybetween visits (groups in firstrows in figure). If the similar-ity between these normal beatclusters did not satisfy thesimilarity criterion, this wasdefined as EGM change. Thenumber of EGM morphologygroups were also observed.
Results: During the obser-vation period EGM changedin 7 (20%) of the patientswhile 14 (44%) had > 5 EGMmorphology groups. No asso-ciation with VT/VF was ob-served, but the number of morphology groups increased significantly by age.
Conclusion: Different EGM morphology groups exist, but with no associ-ation with VT/VF.
P87
Computing in Cardiology 2012, Kraków, Poland 183

Characterization of Cardiac Repolarization Response to Heart Rate Changes Provoked by a Tilt Test
Julia Ramírez*, Ana Mincholé, Pablo Laguna and Esther Pueyo
Spain
Background: In predicting the risk of suffering from ventricular
arrhythmias, the dynamics of QT and T-peak-to-T-end (Tpe) intervals after changes in heart rate (HR) have shown to provide richer information than their values themselves. The adaptation to these changes can be quantified by estimating the time constant required to converge to a new stationary state. In this study, QT/RR and Tpe/RR dynamics are analyzed during a tilt test protocol.
Methods: Electrocardiogram (ECG) recordings of 15 subjects were analyzed during a Head-up Tilt Test trial (4-min supine, 5-min at 70º, 4-min supine). ECGs were delineated using multi-lead (ML) and single-lead (SL) procedures. For each onset, peak or offset, ML projects the vectorcardiogram (VCG) over the direction with maximum SNR to obtain the best wave for delineation. QT and Tpe series were computed using SL and ML, and QT/RR and Tpe/RR dynamics were modeled using a nonlinear system with memory, from which the time constant t90 was derived.
Results: QT/RR dynamics are similar using SL or ML delineation, with adaptation times being: t90SL [s] = 74.1 +/- 25.4, t90ML [s] = 88.6 +/- 24.6. The Tpe interval responds more abruptly to HR calculated using SL as compared to ML. Consequently, Tpe/RR dynamics are characterized by different adaptation time constants using SL or ML: t90SL [s] = 23.5 +/- 29.7, t90ML [s] = 98.5 +/- 44.3.
Conclusions: QT dynamics can be invariantly characterized using either SL or ML delineation, while Tpe dynamics are highly sensitive to the delineation method. The difference lies on the determination of T wave peak. In the case of SL, the delineation is applied over a fixed lead and includes the effect of electrical heart axis changes due to the tilt. However, ML follows this axis movement on a beat-to-beat basis, therefore removing the effect of the postural change
.
P87
184 Computing in Cardiology 2012, Kraków, Poland

Generalized Distance Measure-based WPCA for Unsupervised Analysis of ECG Signals
Jose Luis Rodriguez-Sotelo, Diego Hernán Peluffo-Ordóñez*, David Cuesta-Frau and Cesar German Castellanos-Dominguez
Universidad Nacional de Colombia - Manizales Manizales, Colombia
Unsupervised analysis encompasses discriminative methods, which do
not require prior knowledge about classes. Instead, it employs data to be analyzed with some initial parameters. Therefore, such parameters are properly established and grouping performance only depends on data. In practical cases, initial data are not suitable to be used directly due to among other reasons: information redundancy, poor discrimination capability and noise. Relevance analysis takes place, being principal component analysis (PCA) a good alternative because of its non-parametric nature, easiness for implementation and versatility. Nevertheless, when data are not statistically independent, PCA could not be applied. For this reason, some variants of PCA have been introduced, focused on data separability. They are based on data weighted projection (WPCA), in such way, both projected data and relevant features can achieve a good classification performance even when the projection or selected features are not the best representation of data. There exist several approaches for WPCA typically related to a distance-based criterion. However the proper selection of weight factors according to nature of data and classification task is an open issue. In this work, we present a version of WPCA based on a generalized distance measure. First, a dimensional reduction problem is established that minimizes the error between original data and truncated data using a distance measure by means an affinity matrix. Secondly, from the optimization problem for dimensional reduction and by applying different affinity matrices, relevance vectors are deduced and incorporated in a WPCA scheme as weighting factors. Experiments are carried out over the entire MIT/BIH arrhythmia database. A Clustering procedure is used to assess the performance of method which is evaluated in terms of sensitivity, specificity and unsupervised performance measures. As a result, the sensitivity was 86% considering all the groups of arrhythmia recommended by the ANSI/AAMI EC57:1998 standard
.
P87
Computing in Cardiology 2012, Kraków, Poland 185

Suppression of the Respiration Artefact and Extractionof the Cardiac Component in the TransthoracicImpedance Recorded Through Defibrillation Pads
Erik Alonso, Elisabete Aramendi, Jesus Ruiz, Unai Ayala and DignaGonzalez-Otero
University of the Basque Country UPV/EHUBilbao, Spain
Aims: Confirmation of the presence or absence of circulation by checkingthe carotid pulse in cardiac arrest patients during cardiopulmonary resuscita-tion (CPR) has been reported inaccurate. Although transthoracic-impedance(TI) plethysmography has been used as a non-invasive measure of cardiac out-put, TI measured via the defibrillator pads has only recently been proposedfor the assessment of circulation during CPR. However, ventilation artefactsseverely corrupt and spectrally overlap the cardiac component of the TI, whichmakes the decomposition of the signal difficult. This study proposes an adap-tive scheme to suppress respiration artefacts and extract the circulation compo-nent from the TI recorded through the defibrillation pads.
Materials: The database consisted of 12 records from hemodynamicallystable volunteers including the TI and the ECG. Each record contained inter-vals without respiration and 5 intervals at different respiration rates around theventilation rates recommended by current resuscitation guidelines: 9, 12, 15,18 and 21 respirations/min.
Methods: R-R intervals detected in the ECG were used to estimate thecardiac component in the TI. First, low frequency ventilation artefacts werehigh-pass filtered using a cutoff adjusted to the cardiac frequency. Then, anLMS filter was used to adaptively estimate the first three harmonics of thecardiac component.
Results: The method was evaluated in terms of improvement in signal-to-noise ratio (SNR), and the normalized cross-correlation coefficient betweenthe circulation components obtained during respiration and artefact-free inter-vals. For each ventilation rate, the correlation coefficients were 0.41±0.13,0.35±0.14, 0.43±0.12, 0.40±0.14, 0.35±0.14 before filtering, and 0.81±0.14,0.79±0.18, 0.81±0.12, 0.80±0.13, 0.79±0.15 after filtering. The improve-ments in SNR were 19±4, 17±4, 15±3, 14±3 and 13±2 dB.
Conclusions: An effective method is proposed to extract the circulationcomponent in the TI recorded through the defibrillation pads. Satisfactory re-sults are reported with hemodynamically stable volunteers and the evidence forpulse detection in real cardiac arrest episodes.
P87
186 Computing in Cardiology 2012, Kraków, Poland

Automated Evaluation of Diastolic Function from Phase-Contrast MRI in Healthy Subjects and Patients Emilie Bollache, Alban Redheuil, Stéphanie Clément-Guinaudeau, Carine Defrance, Ludivine Perdrix, Magalie Ladouceur, Muriel Lefort, Alain De Cesare, Alain Herment, Benoît Diebold, Elie Mousseaux, Nadjia Kachenoura*
INSERM U678/UPMC Univ Paris 6, Paris, France
Introduction: Early detection of diastolic dysfunction is crucial for pa-
tients with incipient heart failure. Although this evaluation could be per-
formed from phase-contrast cardiovascular magnetic resonance (PC-CMR)
data, its usefulness in clinical routine is not yet established, mainly because
the interpretation of such data remains mostly based on manual post-
processing.
Aims: Our goal was to develop a robust process to automatically estimate
diastolic parameters from PC-CMR data and to test their ability to character-
ize left ventricular (LV) dysfunction, while comparing to echocardiography.
Methods: We studied 53 subjects (35 controls and 18 patients with a se-
vere aortic valve stenosis and a preserved ejection fraction (valve area/body
surface=0.51±0.15 cm²/m², CMR-EF=67±14%)) who had PC-CMR and
Doppler echocardiography on the same day. PC-CMR data were analyzed
using custom software to extract diastolic parameters. This analysis enabled a
semi-automated analysis of 1) mitral annulus velocity-encoding images using
algorithm based on velocity profiles clustering, and 2) transmitral flow veloc-
ity-encoding images using dynamic segmentation algorithm based on the
connectivity in terms of velocity sign. Inter-operators variability was as-
sessed.
Results: Our technique was reproducible, as reflected by a small variabil-
ity (<4.25 ± 5.89 %) in functional parameters measurements. The PC-CMR
diastolic parameters significantly (p<0.0002) varied in patients as opposed to
controls. Moreover, both velocity and flow-rate diastolic parameters were
consistent with echocardiographic values (r>0.71) and a ROC analysis re-
vealed their ability to separate patients from controls (sensitivity>0.80, speci-
ficity>0.80 and accuracy>0.85). Of note, a superiority in terms of correlation
(r=0.81) with echocardiography and accuracy to detect LV abnormalities
(accuracy>0.89) were found for flow-rate parameters.
Conclusions: A fast and reproducible technique for flow and myocardial
PC-CMR data analysis was proposed and was successfully used to extract
consistent velocity-related, and flow-rate-related diastolic parameters. This
technique provides a valuable addition to established CMR tools in evalua-
tion and management of patients with diastolic dysfunction.
S91
Computing in Cardiology 2012, Kraków, Poland 187

Monogenic signal for cardiac motion analysis fromtagged magnetic resonance image sequences.
M. Alessandrini, H. Liebgott, A. Basarab, P. Clarysse, and O. Bernard
CREATIS, Villeurbanne, France.IRIT, Toulouse, France.
Magnetic resonance image tagging (tMRI) has been extensively used to as-sess myocardial motion and contractibility. This technique generates sets oftagging lines or grids within the myocardium that deform with the underlyingtissue during the cardiac cycle.
In this paper, we propose an algorithm for myocardial motionestimationfrom tMRI images. The algorithm exploits the monogenic signal theory, re-cently introduced as a 2D generalization of the analytic signal. The monogenicsignal decomposes the image content into local amplitude, phase and orienta-tion. These features are computed by locally approximatingthe image as a 1Dmonochromatic wave propagating in the direction of maximumimage energyvariation. Interestingly, due to the periodic patterns, the monochromatic wavemodel provides a realistic representation for the structure of tMRI images. Thismakes the monogenic signal an excellent framework for developing techniquesdedicated to their analysis. To our knowledge this is the first study investigatingthis possibility.
AE = 4.32 ± 2.03 [°]
EE = 0.11 ± 0.05 [pix]
PROPOSED ALGORITHM
BENCHMARKOur algorithm computes the displace-ment locally by tracking variations in themonogenic phase. A local affine displace-ment model accounts for typical motionsas contraction/expansion and shearing. Acoarse-to-fine B-spline scheme allows arobust and effective computation of themodel parameters and a pyramidal refine-ment scheme helps in dealing with large motions.
The performance was evaluated on five synthetic sequences (112 framesin total) embedding realistic cardiac motion models [Clarysse et al., MedicalImage Analysis, 2000]. State-of-the-art SinMod algorithmwas considered forcomparison. Our algorithm produced an average error reduction of 35.4% forthe angular error (AE) and of 28.9% for the endpoint error (EE). See the Figurefor an example. Also, a decrease in the error variance of 29.1% (AE) and 15.5%(EE) proved our motion estimates to be more reliable. The independence ofthe monogenic phase on the image intensity made the estimated displacementscompletely insensitive to the typical loss of tags contrastover time.
S91
188 Computing in Cardiology 2012, Kraków, Poland

Automated motion artifacts removal between cardiac long- and short-axis MR images
Maria C Carminati*, Francesco Maffessanti, Enrico G Caiani
Biomedical Engineering Dpt., Politecnico di Milano, Milano, Italy
Aims: We aimed at developing and testing an automated method for mo-tion artifacts compensation, to eliminate misalignment between short-axis (SAX) and two- and four-chamber long-axis (2ch4chLAX) cardiac magnetic resonance (CMR) images, precluding correct advanced 3D volumetric analy-sis.
Methods: After 3D location of each slice was read from Dicom header, each SAX slice was shifted maximizing the normalized cross correlation of pixel intensities along SAX and 2ch4chLAX intersections. The algorithm ac-curacy was first tested in a dedicated phantom study based on two different datasets: a synthetic 3D binary cylinder and a cardiac computed tomographic 3D frame (GE Healthcare). From them, virtual slices reproducing SAX and 2ch4chLAX cut-planes were extracted, and simulated displacements im-posed. Also, end diastolic (ED) and end systolic (ES) CMR SAX (10–20 slices) and 2ch4chLAX frames ob-tained in 14 consecutive patients (GE Healthcare, 1.5T) were analyzed. The algorithm performance was evaluated on phantom datasets by calculating the residual displacement error, and in pa-tient data by visually comparing the re-sults with and without correction and computing the range of applied shifts.
Results: Processing time was about 1.5s per SAX slice (quad-core i7-670 M CPU). Results on phantom showed registration errors with magnitude of pixel resolution (mean value 0.6mm). Application to clinical data showed absolute value of displacement in the range of 0-10.33mm for ED and 0-12.17mm for ES images (median value 2.35mm, interquartile range 2.30mm for both ED and ES), with no noticeable differences among basal, mid and apical slices. By visual inspection, the ap-plication of the method produced a valuable improvement in all data.
Conclusions: The proposed automated method significantly reduced the misalignment between SAX and LAX slices in both simulated and real data, thus representing a feasible and necessary pre-processing step for volumetric analysis of CMR data in clinical setting.
CMR before (left) and after (right) correction
S91
Computing in Cardiology 2012, Kraków, Poland 189

Automated Tracking of Deformable Objects Based on Non-Rigid Registration of Cardiac Images G Tarroni1, AR Patel2, C Yodwut2, RM Lang2, C Lamberti1, V Mor-Avi2 and C Corsi1 1 University of Bologna, Italy; 2 University of Chicago, IL, USA
Object tracking in cardiac image sequences usually requires tedious and time-consuming manual tracing. We have recently developed an automated technique for non-rigid image registration as a basis for tracking the heart. The goal of the present work was to validate this technique against conventional manual analysis using contrast-enhanced cardiac magnetic resonance (CMR) image sequences as a reference. Our approach is based on a multi-scale extension of the normalized 2D cross-correlation algorithm in combination with level-set methods. For technique initialization, the contour of the object to be identified is required in the first frame. An initial template is defined as an image crop around the given contour. A number of additional templates are defined by resizing the initial one. Normalized cross-correlation is thus performed between the following frame and each template. Position and size of the contour in the new frame are determined by finding the largest cross-correlation peak among the different combinations. Finally, boundary refinement is performed using the edge-based Malladi-Sethian level-set model. This technique was tested on short-axis CMR (Philips 1.5T) image sequences obtained in 11 patients at the mid level of the left ventricle during first pass of a Gadolinium bolus. Myocardial identification required <5 s for a 50-frame sequence. To validate the technique, myocardial boundaries were manually traced on all frames by an experienced interpreter. Comparison between automatically registered and manually traced boundaries was performed by computing Hausdorff Distance (2.1±1.4px), Mean Absolute Distance (0.9±0.7px), Root Mean Square Distance (1.0±0.8px) and Rice Coefficient (0.8±0.1). These results indicate that the proposed technique allows fast and accurate non-rigid image registration, and may thus be successfully used for deformable object tracking in cardiac image sequences.
Figure: Comparison between automatically registered (cyan) and manually traced (red) contours in different frames of a perfusion CMR sequence.
S91
190 Computing in Cardiology 2012, Kraków, Poland

Segmentation of RV in 4D Cardiac MR Volumes Using Region-merging Graph Cuts
Oskar MO Maier*, Daniel Jimenez-Carretero, Andres Santos and María J Ledesma-Carbayo
E.T.S.I. de Telecomunicación, Universidad Politécnica de Madrid, Spain
Introduction: Right-sided heart failure leads to a decreased pumping
function, producing congestion. To avoid the need of cardiac catheterization, a non-invasive quantitative assessment of the right ventricle's (RV) parameters is strongly desirable to define the progress of the disease as well as the proper therapeutic approach. The study aimed to evaluate the suitability of region-merging graph cuts (rmGC) for RV segmentation, which noise, acquisition artefacts, insufficient local image evidence, a thin RV wall and low spatial resolution render a challenging task. Special attention was placed on overcoming the GC drawbacks of high memory and computational requirements, sensitivity to the manually defined markers and poor performance on low resolution images. Method: Out method consists of three phases: First the user manually defines a few rough stroke-markers in one slice of the temporal MR sequence and next a watershed transform is applied, resulting in an over-segmented region image. Finally, these regions are merged employing a rmGC using an intensity based boundary-term. Evaluation: Sixteen pathological cardiac cine-MR cases with endocardial and epicardial expert contours for the end-diastolic and the end-systolic phases were available as ground truth. One observers created two independent sets of markers. Utilized measures include average perpendicular distance (APD), dice metric (DM) and clinical parameters for quantitative evaluation (volumes, ejection fraction and mass). Results: Preliminary evaluation against the ground-truth achieves high ratings of 2.62mm/88% (APD/DM). The obtained intra-observer variance averages to 0.32mm/2%. Furthermore, the method shows a decreases in runtime/graph size of 52.96% resp. 95.65% compared to voxel-based GC without loss in quality. Conclusion: The low computational requirements allow a direct applications to 4D volumes. Simultaneously the marker sensitivity is lowered significantly. Furthermore, avoiding a-priori information renders the method resistant to anatomical variations. Our method proves to produce robust and reproducible segmentations of high quality, enabling quantitative assessment of the RV
.
S91
Computing in Cardiology 2012, Kraków, Poland 191
Segmentation-free MRI to CT 3D Registration for Cardiac Resynchronization Therapy Optimization
Julián Betancur*, Antoine Simon, François Tavard, Bernard Langella, Christophe Leclerq and Mireille Garreau
Université de Rennes 1 Rennes, France
This work is part of a project aiming to improve Cardiac
Resynchronization Therapy (CRT) by the fusion of multimodal images providing the clinician with valuable information to optimize the procedure. In previous works, we have proposed a registration framework including electro-anatomical mappings, speckle tracking US images and, as an anatomical reference, computed tomography (CT) images to characterize the electro-mechanical coupling. In this work, the goal is to perform a segmentation-free registration between cine/late-galodinium-enhanced cardiac-MR (cine/LGE-CMRI) and CT images, in order to include tissue and dynamic information. The 3D iconic registration of MRI to CT images was analyzed in two steps: (i) metrics study and (ii) metric integration to a registration process. In step (i), to select the most appropriate metric, the Left Ventricle endocardium extracted from CT (LV-CT) and the delineation of LV internal contour in MRI (LV-MRI) were aligned matching their centroids. Then, four classical metrics (mutual information (MI), normalized MI (NMI), Mattes-MI and normalized correlation) have been tested using the aligned original MR and CT images. NMI obtained the best results in terms of smoothness and robustness. At step (ii), NMI was included in a rigid multiresolution registration method using regular step gradient descent optimization. The method has been tested on five patients undergoing a CRT procedure, at end-diastolic phase. The obtained results were visually validated by comparing the position of mitral valve and of papillary muscles. Quantitative evaluation has been performed by comparing the dice scores between transformed LV-MRIs and LV-CT (applying resulting transformations to LV-MRI) and a reference dice score (from aligned LV-MRI and LV-CT (step (i)). An average error of 4.71% (std 4.58%) is obtained using geometrical-initialization and two levels of resolution. CT and MRI 3D rigid registration based on NMI shows to be suitable to integrate tissue and dynamic information in the proposed framework
.
S91
192 Computing in Cardiology 2012, Kraków, Poland
Identification of Fibrillatory Sources by Measuring Causal Relationships
Miguel Rodrigo*, Maria de la Salud Guillem, Alejandro Liberos, José Millet, Omer Berenfeld and Andreu Climent
Bio-ITACA, Universitat Politecnica de Valencia, Valencia, Spain Valencia, Spain
Aim: Recent studies have demonstrated that the isolation of specific
regions of the atria during atrial fibrillation (AF) can terminate the arrhythmia. Those results suggested a hierarchical organization since certain parts of the atrium are determining the electrical activity of the whole tissue. In this work, we present and validate a causal relation analysis able to identify atrial regions that govern the fibrillatory process
Methods: Fibrillatory processes were characterized by a recurrence map in which the influence of each recorded signal over its neighbours, computed from causality analysis, is represented. The performance of the presented technique has been illustrated by using mathematical models and real signals obtained with optical mapping under three different fibrillatory scenarios: (1) propagation pattern under sinus rhythm, (2) AF propagation pattern maintained by two stable rotors and (3) AF propagation pattern maintained by a single rotor. Detection of AF sources from RM was compared to singularity point detection.
Results: The analysis of RMs of simulated and real recordings allowed the discrimination between stable and spurious rotors. In scenarios at which two rotors were maintaining the fibrillation, RM showed significantly higher values at the location of the rotors (i.e. 0.096 and 0.075 for LA and RA) than at other regions of the tissue. In cases at which a mother rotor surrounded by fibrillatory conduction was maintaining the arrhythmia, the RM showed highest values in the position of the main rotor (i.e. 0.051), whereas secondary rotors presented lower values (i.e. 0.008).
Conclusion: The analysis of causal relations allows the detection of AF sources even under noise conditions and is more robust than singular point detection. Recurrence maps can be used to characterize AF mechanisms on each individual patient and may be useful as guidance for an ablation procedure
.
S92
Computing in Cardiology 2012, Kraków, Poland 193
Accurate Endocardial Activation Representation of Atria by Noncontact Mapping
Shu Meng*, Jichao Zhao, Nigel Lever, Ian LeGrice and Bruce Smaill
Auckland Bioengineering Institute Auckland, New Zealand
Atrial fibrillation (AF) is the most common heart rhythm disturbance. It
is prevalent in the elderly, and is associated with increased morbidity and mortality. Percutaneous catheter ablation has proved highly effective for treatment of paroxysmal AF (>80% success), but is much less so for persistent AF (PeAF) where success rates are ~50% even with optimally combined ablation approaches. There are a number of reasons for this. The structural substrates that sustain PeAF are complex and it is difficult to construct representative activation patterns during AF using sequential contact mapping techniques. We are developing a novel noncontact atrial mapping system that will enable electrical activation across the endocardial surfaces of the atria to be reconstructed for individual cycles of AF. Basket catheters (128 unipolar electrodes each) are positioned in both left and right atria, and unipolar extracellular potentials are acquired simultaneously from all electrodes. The 3D locations of electrodes and key atrial landmarks are determined using biplane cine-fluoroscopy and the atrial chambers are reconstructed in 3D using MR images acquired prior to the study. Separate bicubic finite-element meshes are fitted to atrial surface geometry identified in the MR images. Electrical activation is then mapped onto endocardial surfaces of the atria using a geometry-based forward transformation embedded in CMISS (finite-element modeling software developed by the Auckland Bioengineering Institute). Here, we present the results of preliminary studies, in which we have verified the forward mapping approach for the left atrium using electrical activation data acquired in sheep with a Constellation mapping catheter (Boston Scientific, Inc) and in humans with an EnSite noncontact array (St. Jude Medical, Inc). Our results demonstrate that the geometry-based forward transformation method provides robust real-time electro-anatomic mapping data during AF
.
S92
194 Computing in Cardiology 2012, Kraków, Poland

Comparing Power Spectral Density of 64 Channel Surface ECG with Left Atrium Electrogram in Patients in Atrial Fibrillation
Marjan Bojarnejad*, James Blake, John P Bourke, Alan Murray and Philip Langley
Newcastle University, UK Newcastle, United Kingdom
Study of the mechanisms behind AF is typically based on invasive
recording techniques. From a clinical point of view, it is highly desirable to have an alternative, noninvasive characterization of AF. Our aim was to investigate if the left atrium (LA) electrical activity can be seen preferentially in different sites on the surface ECG. Surface recordings of the ECG with 64 electrodes were obtained from 14 patients in atrial fibrillation (AF). After subtracting ventricular activity (QRST), power spectral density (PSD) of atrial activity was calculated using the Welch periodogram, sliding Hamming window (50% overlap). The dominant frequency (DF) was measured from the PSD in the frequency band of 4-8 Hz for each of the 64 channel surface ECG. Recordings from the LA were obtained simultaneously from pulmonary vein ablation catheter (PVAC). The DF of atrial activation was calculated from the PSD of PVAC electrode number 3 (PVAC3) in the same manner as the surface ECG. Baseline recordings of 2 minute duration were analysed.DF differences were calculated between each 64 channels surface ECG and PVAC3. The Pearson’s linear correlation was computed for PSD of each 64 channels surface ECG and PVAC3. Statistical difference between PSD of 32 front and 32 back channels surface ECG and PVAC3 was analyzed for both correlation and DF difference using paired t-test. There is a highly significant difference between surface ECG and PVAC3 (p=0.00)
.
S92
Computing in Cardiology 2012, Kraków, Poland 195

A Wavelet-Based Activation Detector for BipolarElectrogram Analysis During Atrial Fibrillation
Alejandro Alcaine, Fernando Simon, Angel Arenal, Pablo Laguna, JuanPablo Martınez
Communication Technologies Group, Universidad de ZaragozaZaragoza, Spain
Aims: It has been shown that computation of atrial fibrillation (AF) electro-gram (EGM) indices based on activation times is limited by the accuracy of theactivation detector. In this work, we propose and validate an automatic algo-rithm based on the Wavelet Transform (WT) for reliable location of activationtimes on bipolar EGMs.
Materials and methods: EGM signals were first non-linearly pre-processedto enhance activation energy. The detector works on the WT of the filteredEGM signals. As the prototype wavelet, we used the derivative of a quadraticspline. Thus, activations are represented through the WT scales as local maxi-mum-minimum pairs, where the zero-crossing is related to the activation peak.For comparison, an activation detection approach based on amplitude adapta-tive thresholding used in previous works, was also implemented and evaluated.
Due to the lack of standard databases with annotated activation locations,we validated our approach in two scenarios: First, white Gaussian noise atdifferent SNR from -5 to 15 dB was added to four 2-min length real clean EGMrecordings. For each combination, 200 realization were generated. Detectionperformance in terms of Sensitivity (Se) and Positive Predictivity (P+) wasevaluated with respect to manually annotated activations in the clean signals.Second, the inverse of the median activation cycle length (ACL) derived fromeach detector was compared with the average dominant frequency (DF) in adataset of bipolar EGM recordings from 20 patients obtained with 10 bipolarelectrodes circular Lasso R© catheter. F1-score value by SNR
SNR (dB) Wavelet (%) Threshold (%)15 97.7± 2.9 96.1± 4.310 96± 4.8 93.9± 7.55 92.9± 7 85.4± 10.80 87.7± 10 78± 11.7−5 77.2± 11.9 63.9± 10.2
Results: Table shows that theproposed detector has higher F1-score (the harmonic mean of Se andP+) at low SNR than the thresholdbased approach. The relative errorof deriving DF from the inverse of the median ACL is 2±4.66% with the WT-approach, in contrast with −9.85±19.51% for the threshold based approach.
Conclusions: The proposed detector is more accurate than the thresholdbased approach in the presence of noise, allowing a more reliable computationof activation-time-based AF clinical indices.
S92
196 Computing in Cardiology 2012, Kraków, Poland

Dynamic Changes of Intracardiac Atrial Impedance During Cardioversion Using Very-Low-Tilt Rectilinear Defibrillation Waveforms and Energy Step Up Protocol
Omar Jacinto Escalona*, Vivek Kodoth, Noel Camilo Castro, Soumya Xavier, Benedict Glover, Ernest Lau and Ganesh Manoharan
University of Ulster Newtownabbey, United Kingdom
Introduction The major determinants of success during internal
cardioversion of atrial fibrillation (AF) are voltage, current and intracardiac impedance (ICI). There is limited data regarding evidence of ICI changes during internal cardioversion of AF using advanced quasi-rectangular or very-low-tilt rectilinear (VLTR) waveforms and following a step up energy protocols.
Methods Patients with persistent AF with previous history of failed external cardioversion were randomised to 12-ms duration biphasic VLTR (B-VLTR) chronosymetric (6ms/6ms), amplitude asymmetric (negative phase at 50% amplitude) waveform; or monophasic VLTR (M-VLTR) waveform (12-ms), and internally cardioverted using a step up protocol (50V to 300V). ICI of patients, who had more than 4 shocks were retrospectively analysed from voltage and current waveforms recorded during cardioversion. In the case of B-VLTR, ICI for the positive phase-1 and the negative phase-2 were calculated separately.
Results Thirty patients were equally randomised to B-VLTR and M-VLTR. Four patients were excluded, as they cardioverted to sinus rhythm before the 4th shock. Significant reduction in ICI was noticed after the first shock using B-VLTR waveform (4.2Ω, p <0.00053). The difference between ICI of positive and negative phase of B-VLTR was not significant within the 1st shock (2.7Ω, p <0.057) and for subsequent shocks (0.9Ω, p <0.293). ICI reduction was not significant with M-VLTR waveforms. For both waveforms, ICI reduction after the 2nd shock was minimal and negligible after the 3rd shock, which was evidenced by smaller ICI standard deviations in the last 4 shocks.
Conclusions Significant ICI reduction was noted with B-VLTR waveforms after first shock at 50V level. ICI reduction with biphasic waveforms would correlate to higher cardioversion success rate when compared to monophasic waveforms. The non-significant effect on ICI by M-VLTR waveforms may suggest a significant dependence of these effects on the VLTR waveform duration and/or current reversal action upon the electrode-tissue interface
.
S92
Computing in Cardiology 2012, Kraków, Poland 197
A Singularity-analysis Approach to characterizeEpicardial Electric Potential
Oriol Pont, Hussein Yahia, Remi Dubois, Michel Haıssaguerre
INRIA Bordeaux Sud-Ouest, F-33405 Talence, FranceL’Institut de rythmologie et modelisation cardiaque LIRYC, Universitede Bordeaux, F-33000 Bordeaux, France
Specific nonlinear analysis methods are required to tackle all the complex-ity present in the dynamics of the electrical activity of the human heart. Thisis particularly crucial in complex arrhythmic regimes or at any level where lin-earizations deviate significantly from the described phenomena. In a context ofnoninvasive mapping of the epicardial potential, singularity analysis becomesan appropriate processing methodology that can provide robust and accuratecharacterizations of dynamical transition fronts. In this work, we derive fromfirst principles an effective cardiodynamical description where singularity ex-ponents sift a simple fast dynamics from its slow modulation. We characterizesingularity transitions in epicardial potential maps from a CardioInsight sys-tem from patients with atrial flutter and atrial fibrillation. Such local transitionanalysis can be incorporated to the inverse-problem regularization and improveinformation on anomalous activity areas to e.g., support diagnosis or guidecatheter ablation procedures.
Average SF of theepicardial electricpotential fromCardioInsight system ina case of atrial flutter(with the QRS removedin skin ECGs). We showthe mapping on the atriaand indicate the positionof the valves forreference.
Methods: The singularity degree of a pointin a signal is conceptually linked to how rare orunreconstructible is the value at that point fromthe rest of the signal. A reconstruction kernelthat is deterministic, linear, isotropic and trans-lational invariant is uniquely defined and itsform implies locally evaluated singularities andthus no need to assume any kind of stationarity.Orientation of singularities defines a fast andsimple dynamics which, for the case of heart-beat, is statistically compatible with a stochas-tic process without memory. Modulation onthis orientation of singularities defines a com-plex but slow dynamics called source field (SF),which is defined as the Radon-Nykodim deriva-tive between the measure on the signal and thaton the orientation, SF (~x, t) = dµV /dµo(~x, t)
Results & Conclusion: A noninvasive mapsequence of epicardial potential allows evalua-tion of spatio-temporal singularities. While theregular low-variation areas are more prone tobe affected by masking artefacts of the inverseprojections, the most singular points describingthe transitions are comparatively less perturbed.We have processed maps under atrial flutter andatrial fibrillation conditions, showing SF transitions connected to problem ar-eas on the anomalous atrial cardiac dynamics.
S92
198 Computing in Cardiology 2012, Kraków, Poland

Blood Pressure Difference between the Measurements Taken during Cuff Inflation and Deflation
Dingchang Zheng*, Luigi Y Di Marco and Alan Murray
Newcastle University Newcastle upon Tyne, United Kingdom
Blood pressures (BP) are often taken during cuff pressure deflation.
Some automatic devices measure BP during inflation. However, there is little quantitative clinical data available to support the measurement accuracy during inflation. This study aimed to provide these data. Fifteen healthy subjects (10 male and 5 female; age from 28 to 64 years) were studied. Manual auscultatory systolic and diastolic blood pressures (SBP and DBP) were obtained during cuff inflation and deflation by a trained observer. During the measurement, the oscillometric cuff pressure was inflated and deflated linearly at the same rate of 2-3 mmHg/s, and was recorded digitally for off-line analysis. Automated mean arterial pressures (MAPs) were then determined from both cuff inflation and deflation, corresponding to the cuff pressures at the peak of the 6th order polynomial model envelope fitted to the sequence of oscillometric pulse amplitudes. For each subject, three repeat measurement sessions were performed. The average manual SBP, manual DBP and automated MAP from the three repeat sessions were used as the reference values for that subject. The BP differences between the measurements from cuff inflation and deflation were finally quantified. The manual SBP measured during cuff inflation was significantly lower by 4.3 mmHg (mean±SD: 110.6±9.7 vs 114.9±9.0) than that measured during cuff deflation (P<0.001). However, the manual DBP from cuff inflation was significantly higher by 3.0 mmHg (76.7±7.8 vs 73.6±7.2) than that from cuff deflation (P<0.01), and the automated MAP from cuff inflation was also significantly higher by 4.5 mmHg (88.3±7.4 vs 83.9±8.7) (P<0.01). In conclusion, this study quantitatively showed that BPs measured during cuff inflation and deflation were different. When developing BP determination algorithms for devices measuring BP during cuff inflation, some correction should be considered to achieve clinical measurement consistency and accuracy
.
S93
Computing in Cardiology 2012, Kraków, Poland 199

Analysis of Seismocardiogram Capability for Trending Stroke Volume Changes: A Lower Body Negative Pressure Study
Kouhyar Tavakolian*, Gonzalo Portacio, Geoff Houlton, Andrew Blaber and Guy Dumont
Simon Fraser University Vancouver, Canada
Seimocardiogram (SCG) is recorded from the sternum and represents the
acceleration generated by the heart on the surface of the body in an axis perpendicular to it and in posterior-anterior direction. In the past, efforts have been put into estimation of stroke volume from SCG in normal conditions. In this novel approach, an orthostatic stress test of graded lower body negative pressure (LBNP) was used to change central blood volume and thereby reduce stroke volume similar to a hemorrhage. Six young and healthy adults were placed in a negative pressure chamber (as in Figure 1) and sealed at the iliac crest. Vacuum was applied to the chamber to gradually (steps of 10 mmHg) drop the pressure to -60 mmHg and the pressure was increased with the same pace to reach back normal pressure. The stroke volume was estimated using Portapres device (from Finapres Medical Systems) simultaneous with SCG and ECG signals. There were more than 900 heartbeats per subject. Sixteen features were extracted from the SCG signal in four different categories of timing, amplitude, slopes and root mean squares. These features were compared for every individual subject using the R-squared value. It was observed that features extracted from the amplitude of the SCG signal were not as robust when compared to timing features in three of the subjects (subjects 1, 5 and 6) and if only a few features are to be selected, timing features provide the better candidates. The timing feature that stood out was the period between the QRS of ECG to the aortic valve opening of SCG (AO point) which corresponds to Pre-Ejection Period (PEP). The R-squared value averaged over all six subjects for PEP was 0.84 (standard deviation of 0.11)
.
S93
200 Computing in Cardiology 2012, Kraków, Poland

Automatic Murmur Detection with Optimized Sensibility for Screening Purpose
Santiago Murillo Rendón, Jorge Iván Padilla Buriticá* and Germán Castellanos Domínguez
Universidad Nacional de Colombia Manizales, Colombia
Aims: The aim of this work is to improve the sensitivity (SE) in
automatic murmur detection system (AMDS) based on phonocardiographic (PCG) signal. In practice, it is common to obtain a high specificity (SP), but unacceptable low SE; therefore, PCG based murmur detection becomes, frequently, useless within screening framework, by example in telemedicine applications. So, there is a need for decreasing the false positive rate, but not affecting the accuracy throughput of the system.
Methods: The PCG signal is recorded from four focuses (aortic, pulmonary, tricuspid and mitral) in 14 patients with 1-15 years old, later a Cardiologic revision from Ecocardiogram, 7 were labeled as patients with cardiac murmur and 7 as normal patients, totally 20 seconds were recorded by each focus, then each cardiac cycle was segmented and for each patient a PCG specialized medical team chose the 5 most representative heart cycles by focus. A dynamic characterization is used grounded on Short Time Fourier Transform and Mel-Frecuency Cepstral Coefficients. 10 fold cross validation is used to measure SE and SP and the system accuracy. Then, classifier training including sensibility optimization is carried out, which in the concrete case is based on the Bayes risk criterion. Lastly, performed Se, SP and accuracy are recalculated.
Results: Using a k-nearest neighbor classifier, values of SE=87.77±2%, SP=92.52±2.2% and accuracy=90.14±1.5% are obtained for non-optimized evaluation. In turn when classifier is trained optimizing sensibility, a SE=94.34±1.5%, SP=89.87% and accuracy=93,13% are reached. As seen, achieved SP is a bit diminished, but SE remarkably increases, while accuracy also increases.
Conclusion: The optimized sensibility training classifier strategy allows developing reliably AMDS for the pathological patients identification devoted for screening purpose
.
S93
Computing in Cardiology 2012, Kraków, Poland 201

Accelerating Reperfusion with Low Frequency VesselDeformation during Myocardial Infarction
M Marzencki, B Kajbafzadeh, F Khosrow-khavar, B Kaminska, CMenon
Simon Fraser University, Burnaby, BC, Canada
Background The speed of intervention is the prime factor in reducing my-ocardial muscle death during myocardial occlusion. Therefore, adjunctive treat-ment methods that could be initiated prior to patient arrival to cathlab could beinstrumental in increasing patient survival rate.
Aims This work proposes an innovative reperfusion acceleration methodthat can be safely applied by minimally trained personnel in field as a stan-dalone treatment or in conjunction with thrombolytic drugs.
Methods We propose to apply low frequency mechanical actuation (20Hzto 50Hz) to induce deformation of a major artery, e.g. the aorta. Vessel de-formation creates pressure waves that reach the coronary arteries and create anon-uniform force distribution on the clot surface inducing shear stresses anddeforming it axially. Furthermore, a high degree of turbulence is initiated in theblood helping in drug delivery to the clot even in absence of flow. The externalactuation can be created using a simple mechanical massager device appliedin the abdominal region with a feedback high frequency pressure monitoringsystem to confirm correct device placement.
Results In-vitro results were obtained using a stenosed, partially occludedheparnized flow system subject to systolic pressure levels between 140 and220mmHg. A large vessel (ID = 9.5mm) was deformed with 3mm amplitudeat 20Hz, 60cm from the occlusion site. Within the actuated system, 36 out of 37stable occlusions perfused within 20 minutes of actuation versus no perfusionson 10 stable occlusions within the reference system.
0
20
40
60
80
100
0 300 600 900 1200
Per
fuse
d na
rrow
ings
[%]
Time [s]
Time to perfusion while applying vesseldeformation 60cm from the occlusion site.
Conclusion The presented re-sults confirm our hypothesis that lowfrequency mechanical deformationdrastically accelerates reperfusion ofarteries blocked by blood clots, evenif applied at a significant distancefrom the occlusion site. Thus, exter-nally induced aorta deformation is apotential adjunct method during thepre-hospitalization phase of heart at-tack treatment.
S93
202 Computing in Cardiology 2012, Kraków, Poland

The Chest is a Significant Collector of Ambient Noise in Heart Sound Recordings
Samuel Emil Schmidt*, Henrik Zimmermann, John Hansen, Henrik Møller, Dorte Hammershøi and Johannes Jan Struijk
Aalborg University Aalborg o, Denmark
Aims: Weak murmurs related to coronary artery disease have been
identified in heart sounds recorded in anechoic rooms, but in the clinic these murmurs might be submerged in ambient noise. The aim of the current study was to characterize the influx of ambient noise through the chest wall and through the coupler house in which the microphone is situated.
Methods: To estimate the transmission through the coupler house the coupler was placed in contact with a heavy block of metal in an anechoic chamber while 100 dB SPL pink noise was played as ambient noise. Next, the coupler was flipped so the microphone was facing the loudspeaker to record the noise field. The transfer function of the coupler house was then estimated as the ratio of the Fourier spectra of the two recordings. Three males and two females were included in the study to estimate the influx of ambient noise through the chest wall. 45 seconds of heart sounds were recorded in silence in the anechoic chamber and under the presence of 100 dB pink noise. The spectrum of the noise entering the recordings was estimated by subtracting the spectrum of the heart sounds recorded in silence from the spectrum of the heart sounds recorded under 100 dB noise. This noise influx was then compared to noise recorded with the coupler in the same position, but facing the loudspeaker.
Results: In the frequency band of interest (200-1000 Hz) the noise field was recorded as 96.8 dB, the noise with the coupler on the metal block was 43.3 dB (attenuation by the coupler house 53.5 dB). In the subjects the recorded noise on average was 103.4 dB (Std: 0.9). In conclusion the ambient noise is conducted via the chest wall to the microphone with a minor amplification
.
S93
Computing in Cardiology 2012, Kraków, Poland 203

Effects of Deep Breathing on Blood Pressure Measurement in Healthy Subjects
Luigi Yuri Di Marco*, Dingchang Zheng and Alan Murray
Newcastle University Newcastle upon Tyne, United Kingdom
Aim: To investigate the effects of deep breathing on blood pressure
parameters: systolic (SBP), diastolic (DBP) and pulse pressure, mean pulse rate, Korotkoff sounds and their amplitude.
Methods: Manual SBP and DBP were measured from 20 healthy subjects (age: 44±13 years) sitting quietly, during normal and deep breathing, with subjects breathing at their own comfortable rate. During the manual measurement, the oscillometric cuff pressure was deflated linearly at 2-3 mmHg/s and recorded digitally. A chest magnetometer was used to acquire the respiratory effort, and an electronic stethoscope for Korotkoff sounds. All data were sampled at 2 kHz. Mean pulse rate was derived from the oscillometric pulse waveform. For each oscillometric pulse, time-frequency analysis of the Korotkoff sounds located the time of the peak energy (Tp), and Korotkoff sounds amplitude was defined as the maximum peak-to-peak amplitude in the window Tp±50ms. The respiratory rate was calculated from both the magnetometer and Korotkoff amplitude series resampled at 4 Hz, for the period between the manually measured SBP and DBP, with a power spectral density resolution of 0.16 Hz between 0.1-0.5 Hz.
Results: Deep breathing in comparison with normal breathing increased respiratory depth by 9±10% (mean±SD, p<0.005), and decreased respiratory frequency from 0.24±0.06 to 0.20±0.05 Hz (p<0.0005). Mean SBP and pulse pressure also decreased significantly, from 116±12 to 113±11 mmHg (p<0.005) and 41±9 to 37±9 mmHg (p<0.01) respectively, and mean pulse rate significantly increased from 64±8 to 68±9 pulse/min (p<0.0005), suggesting a compensatory reaction to hyperventilation. The respiratory rate was estimated from all Korotkoff sounds recordings, and in 70% of recordings the estimated rate differed by 0.05 Hz or less from the reference rate derived from the magnetometer.
Conclusions: The results show an effect of deep breathing on blood pressure, and the presence of a modulating effect of respiration on the Korotkoff sounds
.
S93
204 Computing in Cardiology 2012, Kraków, Poland
Transmural Imaging of Ventricular ElectrophysiologicalActivity and Post-Infarct Substrate in Porcine Heart
Linwei Wang1, Fady Dawoud2, Ken CL Wong1, Albert C. Lardo2, andPengcheng Shi11 Rochester Institute of Technology, Rochester, NY, USA2 Johns Hopkins University Medical School, Baltimore, MD, USA
Introduction: The state-of-the-art electroanatomic mapping of myocardialsubstrates is performed point-by-point on heart surfaces, which may fail toidentify mid-wall fibrosis. The alternative of delayed contrast-enhanced imag-ing of transmural scars, on the other hand, will not reveal functional blocks instructurally normal myocardium. In light of this gap, we developed a novelmethod of transmural electrophysiological imaging (TEPI) that, from body-surface electrocardiograms, computes transmural EP activities and thereby lo-calizes EP substrates. In this paper, we present a new application of TEPI totake inputs from epicardial electrogram (EGM) recordings that are available incommon EP studies.
Method: We present an experimental study of TEPI on two porcine hearts,one healthy and the other with chronic infarction. On each animal, a com-prehensive dataset of in-vivo voltage maps (acquired by the CARTO-XP sys-tem) and high-resolution ex-vivo 3D diffusion-weighted MRI (DW-MRI) of theventricles were acquired. Here, the unipolar EGMs recorded via CARTO-XPsystems were used as input data to TEPI, together with the MRI-derived ven-tricular model and 3D fiber structures. On TEPI outputs, classification wasperformed to identify the post-infarct substrate.
Fig 1. Correlation of substrate detected by 3modalities
Results: On the struc-turally normal porcine heart,the computed AT has an av-erage error = 4.37 ± 3.29mson the epicardium and 7.03±4.29ms on the endocardium.On the infarcted porcine heart,the average error of com-puted AT is 7.32 ± 5.63mson the epicardium, and 8.12±6.08ms on the LV endo-cardium. Further, TEPI-detected substrate co-localize with the scar core with a high accuracy (sen-sitivity = 82%; specificity = 84%). As shown in Fig.1, TEPI-substrte shows ahigher correlation with DW-MR scar than CARTO voltage map, where corre-lation r = (S1 ∩ S2)/(S1 ∪ S2) between two substrates S1 and S2.
S94
Computing in Cardiology 2012, Kraków, Poland 205

Spatial Modeling of the Wolff–Parkinson–White Syn-drome Induced Ventricular Fibrillation Sándor M Szilágyi1, László Szilágyi2, Constantin T Luca3, Dragoş Cozma3, Gabriel Ivănică3, Călin Enăchescu1 1 Petru Maior University, Târgu Mureş, Romania 2 Sapientia University, Târgu Mureş, Romania 3 Cardiology Center, Timişoara, Romania
Aims: The goal of this study is to assess the influence of the accessory pathway’s (AcP) location and its repolarization period on the incidence of ventricular fibrillation (VF), in order to develop a non-invasive method able to select the most endangered patients that suffer from Wolff–Parkinson–White (WPW) syndrome.
Methods: 12-lead ECG was recorded from 79 patients suffering from WPW (aged between 9 and 71 years) at the Cardiology Center of Timişoara (Romania), and the insertion place of AcP-s were determined using Arruda localization method. We developed a spatio-temporal computerized model of the whole heart that handles half millimeter sized compartments using 1µs time step. Using this high spatio-temporal resolution we modeled the parox-ysm of atrial fibrillation (AF) that in the presence of an AcP caused a catas-trophically rapid ventricular response with degeneration to VF. In our simula-tion the upper chambers made 250 to 500 regular and irregular contractions per minute while the ventricles were stimulated 83 to 350 times. The AcP-s were placed in 14 different locations, having a 150-500 ms repolarization period and conducting the excitation wave 20-50 ms faster than the normal atrioventricular (AV) node – His bundle pathway.
Results: Irrespectively of the AcP location, in presence of low AcP repo-larization period (under 200 ms) the VF was developed for all 79 cases (aver-age simulation time of 2 minutes 17 seconds using five stimulations per sec-ond). In case of AcP connected to endocardium the VF appeared 15% faster than for AcP connected to epicardium or to intermediate ventricular tissue. Central AcP locations with average repolarization time (greater than 270 ms) reduced the occurrence of VF with 7%.
Conclusion: Low repolarization period is the most important danger to VF for patients suffering from WPW, while the connection place and the location of AcP has relatively reduced imperilment impact.
S94
206 Computing in Cardiology 2012, Kraków, Poland
Drug Effects on the Action Potential Manifest More Strongly as T-wave Changes than QTc prolongation Tanveer A. Bhuiyan*, Claus Graff, Morten B. Thomsen, Johannes J. Struijk
Aalborg University, Aalborg, Denmark
Introduction: QT-prolongation is a problem in drug development because of
the relation with arrhythmia. The QT interval has been used as an indicator
for proarrhythmic effects and more recently other measures, based on T-wave
shape have been used in clinical tests. Preclinically, action potentials (AP)
have been investigated and certain changes in their shape have also been used
as signs of proarrhythmia. Associations between AP shape and T-wave mor-
phology are to be expected, but have not been reported. We therefore investi-
gated the association between the electrophysiological effect of sertindole in
terms of the morphology of the monophasic action potential (MAP) as well
as the T-wave in dogs.
Methods: Sertindole was administered to five
dogs (29±4 kg) at cumulative doses of 0.05,
0.10, and 0.20 mg/kg. An 8-lead ECG was
recorded along with left and right ventricular
MAPs. For each dose, the MAPs (with ampli-
tude normalized plateaus) were aligned with the
baseline MAP at the 10% repolarization
Fig1. MAP and T-wave
alignment
point as shown in figure 1. Maximum difference between sertindole and the
baseline MAP was found in a window between the 10% point and 130 ms
earlier. In a similar manner, the maximum differences were obtained for T-
waves, aligned with the baseline ECG at T-end.
Results: The peak drug effect occurred 20 ms
before the 10% point of the MAPs and around 30
ms before T-end on the ECG. Peak effect chang-
es for the MAPs were 3.4%, 4.8%, and 5.5% of
the plateau height (figure 2 top) for the three
cumulative doses respectively, and 47%, 63%,
and 73% for the T-wave. The correlation coeffi-
cients for MAP changes and T-wave changes
were 0.63, 0.83 and 0.8 for each dose respective-
ly.The average prolongation of QTc was 1, 5 and
5 ms whereas MAP durations were prolonged by
2, 9, and 14 ms for the different doses.
Conclusion: Sertindole-induced T-wave changes
Fig 2. Sertindole-
induced changes in MAP
and T-wave morphology
are significantly more evident than QTc prolongation and morphological
changes in MAPs and T-waves are highly correlated.
MAP
ECG
S94
Computing in Cardiology 2012, Kraków, Poland 207
Modeling and Simulation Approach for Assessing Proarrhythmic Potency of the Non-cardiological Drugs
Sebastian Polak*, Barbara Wiśniowska, Kamil Fijorek, Anna Glinka, Miłosz Polak and Aleksander Mendyk
Jagiellonian University Medical College Kraków, Poland
Aims: The study aimed to assess the usefulness of the modeling and
simulation approach for the proarrhythmic potency of the non-cardiological drugs prediction. Ability to mimic population effect applied with use of the virtual population generator on the QTc value was tested.
Methods: ToxComp version 1.5 (www.tox-comp.net) with ten Tuscher human cardiomyocyte model (1D string - Epi/M/Endo - 20/30/50%) was used to mimic the clinical study and formoterol was chosen as a model drug (Lecaillon study - 8 males/4 females, mean age[SD] – 24[6]). As the in vitro inhibition data were not available, the extended QSAR models were used to predict the IKr/IKs currents inhibition for certain formoterol concentrations measured in various time of the day after single inhalation dose (time [hr:min]/concentration [µM] – 08:00/0.0; 08:30/0.000159; 09:00/0.000139; 10:00/0.000109; 11:00/0.000089; 12:00/0.000078; 14:00/0.000059; 16:00/0.000045; 20:00/0.000031). The IKr and IKs currents inhibition for the predicted IC50 values (25.83 and 23.31 respectively) was negligible in all cases. Adrenergic stimulation and following plasma potassium decrease were simulated by the formoterol concentration dependent potassium depletion. Previously developed heart rate circadian rhythm was applied. Sjögren model was used to simulate the age dependent heart wall thickness. All virtual individuals included to the simulation were randomly assigned with the above mentioned physiological paramaters. Simulation time was set to 10 seconds and the QTc [ms] value with Fridericia correction was chosen as an endpoint.
Results: The comparison of the observed(SD)/simulated(SD) QTcF values for subsequent time points/concentrations was as follows:391(21)/378(22); 382(21)/380/15; 392(19)/388(16); 389(22)/396(20); 392(18)/387(28); 385(15)/387(28); 391(18)/385(18); 385(22)/372(23). None of the differences between observed and predicted values were statistically significant (t-test).
Conclusions: Heart inactive drugs can express their cardiological effect by modifying the physiological parameters e.g. ions level and heart rate. Current study proves that such phenomena can be predicted with use of the mathematical models working on the population level
.
S94
208 Computing in Cardiology 2012, Kraków, Poland

Performance Challenges in ECG Pacemaker Pulse Detection Systems
Carolyn Lall*, Zhe Zhang and Yu Chen
Draeger Medical Systems Inc Andover, United States
Traditional ECG pacemaker pulse detection systems based on
AAMI/IEC standards do not always perform well with modern pacemaker and implantable cardioverter defibrillators(ICDs). Both devices are used with increased frequency, which makes reliably monitoring these patients by surface ECG a priority. Traditional methods are susceptible to not detecting small pace pulses and falsely detecting muscle artifact, noise spikes and narrow QRS complexes as pace pulses. This can result in inaccurate heart rates, false arrhythmia alarms and no alarms for true asystole. This study focuses on digital signal processing and algorithm techniques to improve pace detection performance in modern patient monitor designs. This study involved a patient monitor with state-of-art analog front end to allow acquisition of four channels of high speed (32kHz) data. The data included data from 43 patients in EP lab, ICU, and telemetry ward with external pacemaker or implanted pacemaker/ICD from various device manufacturers, many with bi-ventricular devices. A traditional slope based detection system was applied with two leads of data down-sampled to 16kHz and performance was compared to an advanced detection system (4 leads, 32kHz). Performance statistics, sensitivity (Se) and positive predictive value (PPV) were calculated for the data set. The advanced pace detection algorithm had Se of greater than 96% and PPV of greater than 98%. This performance is significantly better than the traditional method in terms of both detecting all pace pulses appropriately with fewer over detections especially in the presence of noise, muscle artifact and motion. Advances in patient monitor analog front end technology in combination with advanced signal processing and algorithm techniques can provide significant improvements in pacemaker pulse detection in surface ECG monitoring devices. This leads to improved cardiac monitoring of patients with pacemakers and ICDs in terms of pace detection and accurate heart rate, arrhythmia monitoring and alarm generation
.
PA1
Computing in Cardiology 2012, Kraków, Poland 209

Low-Distortion Baseline Removal Algorithm for Electrocardiogram (ECG) Signal
Ling Zheng, Carolyn Lall* and Yu Chen
Draeger Medical Systems Inc Andover, United States
Baseline variation is a major source of noise in ECG signals. It is related
to impedance variation between the recording electrode and skin and is often due to respiration or other body movement. The baseline level noise within the ECG is a low frequency signal from 0 – 0.8Hz. According to American Health Association (AHA), the frequency of the ECG signal of interest is above 0.05Hz. Since these frequency bands overlap, a simple high-pass filer is not an ideal baseline removal technique: the low cutoff frequency can not completely remove the baseline variation; while the high cutoff frequency usually causes ECG distortion, especially to the ST-segment. Tuning the cutoff frequency using the patient’s current heart rate can be used to improve the performance of a high pass filter for baseline removal. However, this adds additional complexity and margin for error that may not be ideal for patient monitoring systems. This paper presents a low distortion baseline removal algorithm that is derived based on the Savitzky-Golay (SG) filter, a time-domain smoothing filter. The SG filter derives the smoothed value for each data sample by performing a local polynomial fit in a data window. The window length and polynomial order determine the frequency response of the SG filter. The SG smoothed signal identifies the baseline in the ECG signal and can be subtracted from the original ECG signal to effectively remove the baseline variation. The results show that the time domain smoothing filter technique can successfully remove the baseline variation, introduces much less distortion to the ST-segment and requires no extra knowledge from the ECG, thus making it more suitable for ECG monitoring systems
.PA1
210 Computing in Cardiology 2012, Kraków, Poland

Collection of Pediatric ECG Data for Testing Detection Algorithms in Automated External Defibrillators
Patricia Radon*, Gero von Wagner, Norbert Kraft and Uwe Steinhoff
Physikalisch-Technische Bundesanstalt Berlin, Germany
Introduction: Arrhythmia detection algorithms in Automated External
De-fibrillators (AEDs) need a special approval for use in children younger than 8 years. A large collection of pediatric ECGs including a variety of non-shockable rhythms and shockable rhythms like ventricular fibrillation and ventricular tachycardia is necessary for developing and testing these algo-rithms. Currently such a public database does not exist. The aim of our work is to establish a pediatric ECG reference data set with rhythm annotations and automatically characterized signal quality.
Methods: The database will consist of a training set with a public interface for end-users to optimize their algorithms and an independent validation set that remains hidden. The 12 lead ECG data of at least 10 seconds duration are collected from children in a number of pediatric cardiology centers under informed consent of the parents. For ECG quality analysis a statistical as-sessment of noise level and power line interference is performed using mov-ing window methods. Quality indicators are annotated independently in each lead. Also QRS complexes and corresponding RR-intervals are automatically annotated.
Results: Currently we collected and analyzed 499 non-shockable pediatric ECGs. The most important lead for assessment of the AED algorithms is Einthoven II. The mean noise amplitude amounted here to 54 µV (± 65 µV) and the mean QRS amplitude was 776 µV (± 263 µV). The mean power line interference was 31µV peak-to-peak with a standard deviation of 21 µV. Based on the quality measures signal intervals for testing of the AED can be automatically selected.
Conclusion: In combination with additional clinical annotation the pediatric ECG dataset provides an instrument for the development and assessment of algorithms for arrhythmia detection in children younger than 8 years. The final database will be manufacturer independent and available for a wider community
.
PA1
Computing in Cardiology 2012, Kraków, Poland 211

Telemedicine Application for Predicting Ventricular Arrhythmia and Sudden Cardiac Death by the Analysis of Phase Synchronization in Heart Failure Patients
Tamas Szuszai*, Sandor Khoor, Nandor Balogh, Istvan Kecskes, Katalin Fugedi, Ilona Kovacs, Ildiko Simon and Sandor Rubicsek
Hungary
Aims: The aim of our study was to determine the coupling dynamics
between the heart rate(HR) and the ventricular premature beats(VPB) for predicting life-threatening episodes in heart failure patients.
Method: The approach consists of an application of the Hilbert-Huang transform to decompose an empirical time series into a number of intrinsic mode functions (IMFs), calculation of instantaneous phase of the resultant IMFs, and the statistics of the instantaneous phase for each IMF. It consists of the empirical mode decomposition (EMD) and Hilbert spectral analysis. The number of synchronization (NSy) and the average length of these episodes (ASy) were determined during 24 hours. Our telemedicine server collected the 24-hour ambulatory ECGs (RhythmPattern, SzivLeso) and analyzed the data. The study population (age 67.3±8.2) consists of 97 heart failure patients with EF < 0.35, where frequent (> 4000/24 hours) ventricular ectopic beats were found. The calculations were performed with the last 24 hour monitored episode before cardiac event on monthly ECG monitoring. The mean follow-up was 36.4 months.
Results: The number of synchronization (NSy), its length (ASy), were compared in patients with and without ventricular tachycardia (VT+: number of patients 21, VT-: 76); with and without sudden cardiac death (SCD+: 11, SCD-: 86). The dichotomization cutoff points that maximized the hazard ratio obtained from the Cox regression model were: NSy: 18.4/24hour; ASy: 69.3 minute; SI: 0.39. The univariable predictors of SCD: NSy: >18.4/24hour: relative risk 3.07, 95% CI: 1.77-5.46, p<0.0001; ASy: >69.3 minute: 1.77, 1.18-2.59, p<0.01. Using multivariate discriminant analysis, the separation of the groups was very good: VT+ vs. VT- : Wilks lambda: 0.236, p<0.001; SCD+ vs. SCD-: 0.319, p<0.001.
Conclusion: The analysis of the interaction of instantaneous heart rate rhythm and ventricular ectopy rate would be a powerful tool for the prediction of malignant ventricular arrhythmias and/or sudden cardiac death
.
PA1
212 Computing in Cardiology 2012, Kraków, Poland

Algorithm for Real-Time Pulse Wave Detection Dedicated to Non-Invasive Pulse Sensing
Ivo Iliev, Bistra Nenova, Irena Jekova* and Vessela Krasteva
Bulgarian Academy of Sciences Sofia, Bulgaria
Resuscitation guidelines recommend checking the carotid pulse by
palpation during <10 seconds for healthcare providers, however, the reliability of pulse palpation for confirming presence or absence of circulation is limited. This study presents an algorithm for automated pulse wave analysis with application to non-invasive photoplethysmographic (PPG) sensors for fast detection of carotid pulse in an emergency. An algorithm for real-time analysis of the pulse wave signal is presented, including specific techniques for high- and low-pass filtering (0.5-5.5Hz), identification of extrema and validation of pulse waveforms by time-amplitude criteria for similarity of rising edges within 2 seconds. The algorithm is learned on the publicly-available MGH/MF waveform database of PhysioNet from patients with various pathologic states, using the arterial pressure pulse wave and ECG-synchronized beat annotations. The testing is performed with own database collected from 10 volunteers with normal cardiac activity, including synchronous recordings of single-channel ECG and PPG acquired via specially designed non-invasive pulse wave photodetector placed above the neck region. The total duration of the learning database is 13h 59min. The pulse wave detection algorithm identifies 62363 heart beats. We achieved 95.7% coincidence between the detected pulse waves and the reference beat annotations. Besides, we tested the ability of the algorithm to detect "suspicious" rhythm based on dissimilar and prolonged pulse wave-to-wave intervals over 10 seconds. The procedure recognizes 1495 “suspicious” episodes: 976 episodes with missing signal, 113 episodes with large artifacts, 406 episodes with presence of pulse waves, corresponding to abnormal cardiac activity (<3 waves). The suspicious episodes are visually inspected and the correctness of classification is confirmed in 97% of the cases. The verification of the algorithm on PPG signals from normal subjects shows 100% accuracy for pulse wave detection. The results confirm that the presented method is a reliable tool for non-invasive pulse sensor in an emergency
.
PA1
Computing in Cardiology 2012, Kraków, Poland 213

Diagnosis of Non-Type I Brugada Syndrome Patients by Vectorcardiographic Measurements
Adolfo Fonseca Guzmán, Andreu M. Climent, José Millet*, Paola Berné, Josep Brugada, Rafael Ramos, Ramón Brugada and María S. Guillem
Universidad Politecnica de Valencia, Valencia, Spain Valencia, Spain
Aim: Brugada Syndrome (BrS) is diagnosed in basis of a characteristic
electrocardiogram (ECG) pattern displaying a coved-type ST segment (≥0.2mV) in right precordial leads (type I ECG), which is only present in 25% of ECGs of BrS patients. However, BrS patients often present terminal R waves in right leads, which are not specific for BrS. In this study we aim at the determination of temporal and spatial characteristics of terminal R waves of BrS patients that may allow discrimination from those appearing in non-BrS subjects.
Methods: Vectorcardiograms of 98 BrS patients, 61 of whom did not present a type I ECG at the time of the recording (22 symptomatic) and 59 control subjects (34 healthy, 25 RBBB) were included in the study. The orientation and duration of terminal R waves (>0.1mV) present in -X and/or –Y orthogonal leads were measured.
Results: Terminal R waves were present in 85% BrS patients without a type I ECG, 53% of control subjects and 96% of RBBB patients. Terminal R waves of BrS patients were longer than those of healthy subjects (166±107ms vs. 106±38ms, p<0.05) but had a similar duration than those of RBBB patients (154±76ms, p=NS). Orientation of terminal R waves of BrS patients and healthy subjects was similar (115±49º vs. 99±31º, p=NS) but differed in RBBB patients (-60±129º, p<0.001). Classification of BrS patients according to the presence of terminal R waves with duration >76ms and an orientation in the horizontal plane >0º allowed discrimination between BrS patients and control subjects with a sensitivity of 73% and a specificity of 75%.
Conclusion: Terminal R waves of BrS patients are longer than those appearing in healthy subjects and have a different orientation than those appearing in RBBB patients. Identification of non-type I BrS patients can be highly improved by measuring terminal R waves parameters
.
PA1
214 Computing in Cardiology 2012, Kraków, Poland

Evaluation of T-wave morphology dispersion in high-resolution ECG for risk stratification of sudden cardiac death
Kania Michal*, Fereniec Malgorzata and Maniewski Roman
Nalecz Institute of Biocybernetics and Biomedical Engineering Warsaw, Poland
Aim: Sudden cardiac death (SCD) risk stratification remains important
and challenging problem in modern medicine. The aim of study was to evaluate the prognostic value of T-wave morphology dispersion (TMD) in high resolution ECG for SCD risk assessment.
Methods: The high-resolution ECG signals were recorded at rest in a shielded room and averaged in time using cross-correlation method. In order to evaluate the dispersion of T-waves the measured signals were divided into three parts: whole T segment (TMD), ascending slope (TMDpre), and de-scending slope (TMDpost). The singular value decomposition was applied to the signal from standard ECG leads. Evaluated parameters were defined as the mean angle of all pairs of leads reconstruction base vectors. Each angle represents T-wave morphology similarities between two consecutive ECG leads. Sensitivity and specificity of T-wave morphology dispersion de-scriptors in detection of myocardial infarction patients at risk of ventricular tachycardia (VT) were tested on two groups: 30 pts. with documented VT and 13 pts. without VT.
Results: Mean values ±SD of TMD, TMDpre, and TMDpost parameters in VT /non VT pts. groups were 76.14 ± 20.12 /57.32 ± 23.06, 79.20 ± 19.34 /60.41 ± 26.52, and 73.33 ± 25.42 /54.17 ± 26.39 respectively. Calculated sensitivities in detection of VT pts. were 76.67 % (TMD), 73.33 % (TMDpre), and 66.67 % (TMDpost). Specificities of evaluated parameters were 76,92 % (TMD), 76,92 % (TMDpre), and 76,92 % (TMDpost).
Conclusion: Results of the study show significant differences in case of all evaluated parameters between VT pts and non VT pts groups. The highest sensitivity and specificity showed TMD parameter which could be sensitive marker of the risk of SCD. The presented results suggest that repolarization dispersion indicators could be used in qualification process to implantable cardioverter-defibrillator therapy
.
PA1
Computing in Cardiology 2012, Kraków, Poland 215

Time and Frequency domain Analysis for Ventricular Late Potential detection based on Wavelet Packet method
Hamid Ebrahimi Orimi*, Rasa Jamshidi, Amir Hosseini sabzevari and Seyyed Abbas Atyabi
Department of Mechanical Engineering, K. N. Toosi University of Technology, Tehran, Iran
Aims: Ventricular late potentials (VLPs) are low amplitude and high
frequency waveforms, appeared in the end of QRS complex in an electrocardiogram (ECG) signal. With recognition of existence of VLP from ECG signal in most cases, one can detect some ventricular diseases (such as ventricular tachycardia and ventricular fibrillation) and to prevent from growing of diseases. The purpose of this study is to identify VLP with the collected signals from holter and intelligent algorithms.
Methods: VLP can be detected using different ways, for feature extracting, wavelet packet transformation was applied on detected QRS, and then wavelet coefficient energy was determined in the eighth layer. Energies related to each frequency band that is in VLP frequency domain is in feature vector (from node-20 to node-101). By this criterion, probability of VLP existence in 50 patients consist of 20 persons with VLP positive and 30 persons with VLP negative, whose ECG signal is attained in DAY hospital, is studied. 50 persons consist of by using a reliable detecting algorithm, QRS complexes, J points and Fiducial of each complex is detected. A MLP_BP neural network and support vector machine are trained. 40 patients data used for training and other persons data used for testing. On the other hand, a device named PPG Hellige EK 56 was used to detect VLP and results were attained. The same 50 patients tested simultaneously at DAY hospital by this device and their VLP were checked in each case.
Results: we achieved sensitivity (Se) 98%, Specificity (Sp) 94%, for VLP positive and Se 93%, Sp 88%, for VLP negative. Conclusion: Results were compared with the other VLP detection techniques such as Simson’s method, by PWT method, VLP positive detection is better than other method but for VLP negative detection the results were the same
.
PA1
216 Computing in Cardiology 2012, Kraków, Poland

Recurrence Quantification Analysis, based on P-P Intervals Measurement in Postinfarction Patients with Frequent Ventricular Ectopy
Nandor Balogh*, Sandor Khoor, Tamas Szuszai, Istvan Kecskes, Katalin Fugedi, Ilona Kovacs, Ildiko Simon and Sandor Rubicsek
Medartintech Ltd Hungary
Background: Frequent ventricular ectopy results are great problems of
any heart rate variability analysis method, because the interpolation of the R-R intervals significantly disturbs the intrinsic rhythm’s features. Recurrence quantification analysis (RQA) is a valuable tool for predicting serious cardiovascular events. Our ambulatory ECG (AECG) telemedicine system (RhythmPattern, SzivLeso) processes the 1 kHz ECG recordings via Internet, calculates various non-linear heart rate parameters, and analyses the P- and R-waves separately.
Method: The study population (age 61.9±8.6) consists of 89 postinfarction, where frequent (> 4000/24 hours) ventricular ectopic beats were found. The ambulatory ECG monitoring was repeated in every month; the mean follow-up was 38.8 months. The patients were divided into two groups: Group A (died, 23 pts), and Group B (alive, 66 pts) at the end of the study. The signal analysis of the P-waves of the 24-hour AECGs was much more similar to the signal averaged ECG: p-wave detection in the ectopic QRS based on the matching of the ectopy-QRS waves, with the signal-averaging enhances the hidden P-waves. The standard parameters of RQA were calculated: recurrence rate (RR), determinism (DET), laminarity (LAM), the ratio between DET and RR (RATIO), averaged diagonal line length (L), trapping time (TT), the longest diagonal (Lmax) and vertical (Vmax), divergence (DIV), the entropy (ENTR), and the trend (TREND). Embedding dimension = 10, radius of 15%, time delay=4, window size=1024 were used.
Results: Significant (p<0.01) differences were found with RR (mean Group_A vs. Group_B): 2.21±0.34 vs. 4.28±0.55, DET 30.4±8.9 vs. 58.8±0,88, Lmax 426.2±89.7 vs. 299.4±104.6, (MW U-test p<0.01). There were no significant differences with the RQA parameters calculated by RR-intervals with interpolation if the frequency of ectopy was greater than 6500 beats/hour.
Conclusion: The telemedicine assisted ambulatory higher resolution ECG measurements would be useful monitoring higher risk patient for preventing a part of lethal events
.
PA1
Computing in Cardiology 2012, Kraków, Poland 217

ToxComp - in vitro – in vivo extrapolation system for the drugs proarrhythmic potency assessment
Sebastian Polak*, Barbara Wiśniowska, Kamil Fijorek, Anna Glinka, Miłosz Polak and Aleksander Mendyk
Jagiellonian University Medical College Kraków, Poland
Aims: The project aimed to develop the systems biology driven,
modeling and simulation based, easy to use for non-modelers platform for the drugs proarrhythmic potency assessment at the population level.
Methods: Project assumed combination of the systems biology models of the human cardiomyocyte electrophysiology with empirical models describing physiological parameters variability in population (namely cardiomyocyte volume, area, electric capacitance; sarcoplasmic reticulum volume; heart rate; left ventricle free wall thickness; plasma ions concentration; genetic factors), correlated with basic demographic information (age; gender). It allows for the inter-individual variability assessment. Platform realizes the in vitro – in vivo extrapolation approach thus the input data comes from the patch clamp in vitro ionic currents inhibition studies. Enhanced QSAR models predicting drugs in vitro effect for various ionic currents (IKr, IKs, ICa) were developed. Simulated output data includes AP/ECG (APD50/APD90/QTc analysed as the endpoints). System was implemented with use of the Java/JavaFX technology and is available on line/off line and distributed under the GPLv3 license.
Results: Fully functional, stable version 1.2 is currently available at the www.tox-comp.net webpage for download and live run. ToxComp system has been downloaded and used by the scientists and researchers from large pharmaceutical companies and leading academic groups around the world.
Conclusions: Cardiotoxic effect is one of the main reasons for the drug market withdrawals thus has to be closely investigated at various levels. Modeling and simulation approach utilized in the IVIVE platform ToxComp enables early screening of the chemicals proarrhythmic potency. Its main role include clinical trials optimization and waiving, helping with the go-no go decision making
.
PA1
218 Computing in Cardiology 2012, Kraków, Poland

Drastic Reduction of RR Variability and Irregularity after Surgical Treatment of Atrial Fibrillation: a Comparison between Two Ablation Devices
Valentina DA Corino*, Caterina Piazza, Federico Anzil, Stefano Benussi and Luca T Mainardi
Politecnico di Milano Milan, Italy
Surgical treatments of atrial fibrillation (AF) create ablation lesions
aiming at an electrical isolation that prevents AF initiation and maintenance. These lesions affect autonomic innervations of the atria, thus a reduction of RR variability is expected on a short and/or long period. The aim of this study is to assess the changes on variability and irregularity of RR series after ablation performed by an innovative high intensity focused ultrasound (HIFU) device, and by a classic bipolar radiofrequency (RF) device. Two groups of 4 patients, with paroxysmal AF, were enrolled. One group (Study Group, SG) underwent ablation with Epicor HIFU system, the other (Control Group, CG) with a bipolar RF device (Cardioblate BP2). 24-hour Holter recordings were performed before ablation and after 12 months. Variability was assessed in time domain (RR mean, SDNN, SDANN, SDNNindex, rMSSD and pNN50) and in frequency domain (total power, VLF, LF and HF power, LF/HF, and α-slope). Irregularity was evaluated using non-linear indexes derived from the Poincaré plot (SD1, SD2, Cup, Cdown) and approximate (ApEn) and sample (SampEn) entropy. Results, reported in Table 1 of the attached file, show that after ablation, a reduction of variability and irregularity can be observed in both groups, as expected. However, the comparison between the two groups highlights a much greater reduction (p<0.05) of variability and irregularity in the SG. From these preliminary results, we observed that both devices depressed post-ablation HRV on short term and long term (one year). HIFU lesions had a larger effect than bipolar RF device
.
PA2
Computing in Cardiology 2012, Kraków, Poland 219

Study on Atrial Fibrillation Recidivity After Electrical CardioversionThrough Fibrillatory Waves Time-Frequency Analysis
R Alcaraz*, F Hornero and JJ Rieta
Atrial fibrillation (AF) is the most common cardiac arrhythmia in clinical practice. One frequent effective alternative to revert AF back to normal sinus rhythm (NSR) is electrical cardioversion (ECV). However, conventional ECV protocols cannot study the atrial activity (AA) and its evolution along the procedure. This contribution analyzes the ability of the fibrillatory waves amplitude (fWA) and the dominant atrial frequency (DAF), extracted from the AA, to reveal noninvasively AF recurrence under successive attempts of ECV and to predict the effectiveness of every single shock in ECV protocols. We analyzed 10 second-length ECG segments preceding single shocks from 63 persistent AF patients, AA was extracted by using a QRST cancellation method and its fWA and DAF were computed with approaches previously published. Results showed that the effects of the first ineffective shock only were notably appreciated in the fWA. Thus, the percentage of patients, who needed several attempts, correctly classified into ECVs relapsing to AF, resulting in NSR and ineffective procedures was 64.29% for the fWA analyzed before the first shock, and increased up to 89.29% for the same analysis after the first shock. Additionally, by considering jointly patients who needed only one and several shocks, the discriminant ability increased when the values after the first ineffective attempt were used in the prediction. Thus, for the fWA, the accuracy increased from 79.37% up to 85.71%, for the DAF, from 65.08% up to 71.42% and, for their combination, from 82.54% up to 87.30%. As conclusion, the effect of the first unsuccessful shock is crucial to elucidate if NSR will be restored through successive cardioversion attempts and to predict AF recurrence in patients undergoing ECV protocols. Hence, fWA and DAF could provide valuable information to improve ECV protocols, in which the effect of unsuccessful shocks is not taken into account at present
.
PA2
220 Computing in Cardiology 2012, Kraków, Poland

Optimal Cancellation Template Analysis for Ectopic Beats Removal in Atrial Fibrillation Recordings
A Martinez, R Alcaraz and JJ Rieta*
Innovation in Bioengineering Research Group, University of Castilla-La Mancha, Spain
Ectopic beats are early heart beats notably different to the normal beat
morphology. These beats are very common in atrial fibrillation (AF) being the source of important residua when ventricular activity is intended to be removed. Recently, their detection and clustering to build an efficient cancellation template, via principal component analysis (PCA), allowed us to obtain ECG signals with notably reduced ectopic residua. However, only the first principal component (PC) of the clustered ectopics was considered to build up the cancellation template. The present work focuses on evaluating the effect of other PCs on cancellation performance. Twenty 10 hour-length segments extracted from Holter ECG recordings of 20 different AF patients with high percentage of ectopics were used. To evaluate cancellation performance with the different templates, an index able to quantify the ectopic residue (ER) was used. Thus, for a specific ectopic, its ER was obtained by computing the normalized difference between the 90-quantile of the resulting signal after cancellation within the interval corresponding to the beat and the 90-quantile corresponding to the TQ segment prior to the preceding normal beat. Results showed that cancellation in those cases where the first PC explained a variability of the clustered ectopics higher than 90% worsened when additional PCs were included into the template. However, for the abnormal beats in which the first PC explained a lower variability, a notable improvement in their cancellation was appreciated when the two first PCs were considered. In this respect, ER decreased from 0.537 ± 0.041 to 0.396 ± 0.041 when the second PC was considered together with the first one. Finally, considering the three first PCs also provided worse cancellation with respect to the previously analyzed cases. As a consequence, it could be considered that the second PC inclusion can improve cancellation of ectopics with rare morphologie
s
PA2
Computing in Cardiology 2012, Kraków, Poland 221
Complexity Level Differentiation of Complex Fractioned Atrial Electrograms by means of Sample Entropy
Eva Cirugeda-Roldan, Daniel Novak*, Vaclav Kremen, David Cuesta-Frau, Christopher Schilling, Olaf Doessel, Armin Luik and Claus Schmitt
UPV
Analysis of atrial electrograms (A-EGMs) recorded during
radiofrequency ablation (RFA) of Atrial Fibrillation (AF) has achieved a significant progress in the field of curative ablation of AF in recent years. Areas of A-EGMs with complex fractionated atrial electrograms (CFAEs) were shown to play a role in the maintenance of AF. In order to identify CFAEs sites, great effort has been made to describe patterns of activation in AF and to quantify general characteristics of A-EGMs either in time- or frequency-domain. CFAEs are characterized by a nonlinear behavior but also by nonstationarity trends; this makes traditional nonlinear system analysis methods not suitable, as they rely on an implicit assumption of stationarity. For the past 20 years, new methods for analyzing nonlinear, nonstationary, chaotic systems are being considered. This work proposes the use of Sample Entropy (SampEn) to discern between CFAEs levels of fractionation. This may allow a clinician to classify CFAEs in a more reliable way rather than just by means of visual inspection and consideration of time/amplitude of CFAEs only. For its evaluation, statistical significance tests were performed. The Shapiro-Wilks test is used to identify if the data comes from a normal distribution, if so, the student T-test is used for segmentation characterization, but if data is not normally distributed the Mann-Whitney U test is considered. For its validation, two different CFAEs databases have been considered, each recorded over different subjects and with different annotation protocols but presenting the same four classes of level of A-EGM fractionation. Databases were treated and evaluated individually and together as a single database. Results show that SampEn data in each group is normally distributed (pValue>0.05), and segmentation is performed with a statistical significance lower than 0.001 and nonoverlapping confidence intervals between the four groups simultaneously, either in both databases individually or jointly
.
PA2
222 Computing in Cardiology 2012, Kraków, Poland

Fibrillatory Waves Automatic Delineation in Atrial Fibrillation Surface Recordings Based on Mathematical Morphology
JJ Rieta* and R Alcaraz
Biomedical Synergy Gandia, Spain
The estimation of atrial activation times in atrial fibrillation (AF) has
become an established way to evaluate AF status through several indices like organization of the arrhythmia, atrial cycle length, etc. Classic fibrillatory (f) waves delineation uses atrial electrograms because larger f-waves are present in these recordings. This work introduces a new f-waves delineator based on mathematical morphology (MM) able to operate on surface AF recordings. A database of 30 AF segments of 10 seconds in length was selected to test the algorithm with different AF patterns. 10 AF-I, 10 AF-II and 10 AF-III recordings, following Wells’ criteria, were extracted. Lead V1 from the standard ECG was used. Next, ventricular activity was cancelled out and the remaining atrial activity (AA) was delineated through MM. A combination of erosion and dilation operations was applied to the AA with two structuring elements. The first one was adapted to the f-waves by an even triangular shape with length M1=DAF/3, being DAF the dominant atrial frequency. The second was designed as a rectangular shape of length M2=3*DAF/2 to suppress the drift between atrial cycles. Finally, the resulting impulsive signal was used to extract atrial activations by peak detection. To validate the strategy, all the f-waves were manually delineated and the location error between manual and automatic annotations was computed. The average location error between manual and automatic delineation was lower than 7 ms for the three AF types. More precisely, it was 3.2 ± 5.7 ms for AF-I, 4.4 ± 6.8 ms for AF-II and 6.9 ± 16.2 ms for AF-III. As conclusion, MM-based f-waves automatic delineation is able to provide reliable atrial activation times, thus allowing to quantify in a new way the AA signal pattern from surface AF recordings
.
PA2
Computing in Cardiology 2012, Kraków, Poland 223

Deriving Respiration from Electrocardiogram by Serial Comparison with Statistical Mean Shape
Kai Noponen*, Suvi Tiinanen and Tapio Seppänen
University of Oulu Oulu, Finland
A new algorithm to derive a surrogate respiration signal from a single-
channel electrocardiogram (ECG) was developed. First, a statistical mean shape estimate of the QRS-complex is calculated by aligning each beat to match each other optimally in both size and time in the least-squares sense. Second, for each beat, the relative size with respect to the mean shape is measured. Third, a continuous respiratory modulation signal is constructed by fitting a smoothing spline to the non-uniformly located size data. Finally, baseline modulation is reduced by differentiating the smoothed signal yielding the desired surrogate signal. ECGs together with spirometer and chest belt based reference respiration signals were measured from N = 12 healthy volunteers (32.2±3.6 years) of whom four were female. The measurement protocol included various controlled breathing rates (0.10, 0.15, 0.25, and 0.33 Hz) in a sitting posture, and free breathing rate in supine, sitting, and standing positions. The performance of the procedure was compared to that of three ECG-derived respiration (EDR) algorithms reported in the literature: a QRS-amplitude and two principal component analysis (PCA) based methods. Averaged over all the positions and breathing rates, the median correlation coefficients over all the volunteers were at least 14 percent units higher for the EDRs derived with the proposed method compared to the results of the reference methods. Similarly averaged, the median magnitude-squared coherences were also at least 8 percent units higher with the new method. According to the results, the new surrogate has overall better correlation and coherence to both the measured respiration signals compared to the surrogates obtained with the reference methods. What is more, the results of the presented method are more consistent across different breathing rates and postures. Furthermore, an additional benefit of the algorithm is the relatively low computational complexity
.
PA3
224 Computing in Cardiology 2012, Kraków, Poland

A Novel Measure of Atrial Fibrillation Organization based on Symbolic Analysis
Massimo W Rivolta*, Luca T Mainardi and Roberto Sassi
Università degli Studi di Milano Crema (CR), Italy
Recently, methods to assess the degree of organization of the electrical
activity during Atrial Fibrillation (AF) by means of the morphology of the local activation waves (LAW) have been proposed. We provide a novel approach to evaluate such organization using symbolic analysis. The method analyzes N endocavitary leads. Firstly, LAW are located on each lead and then clusterized according to their morphology into a certain number of groups. Groups are labeled and each LAW takes the label of its group. We termed "event" the concurrent presence of an activation wave in each lead, within a fixed temporal window. A word (composed by the N labels of each LAW) is associated to any event and, consequently, a sequence of words to each set of recordings. Finally, the degree of organization is measured by the normalized joint regularity of the series of words. The measure lies between 1 (a ordered series) to 0 (a random series). The study involved a single patient undergoing ablation for persistent AF. A 2-minutes trace was recorded in the coronary sinus (CS) before and after ablation. In the data analysis we set N=3. The results showed an increase regularity in the activity after each ablation procedure (mean values: 0.0945 vs 0.0892, before vs. after, p<0.05). Secondarily, the degree of organization estimated with the method was compared with a previously-proposed regularity morphology-based index (Faes and Ravelli 2007; N equals 2) and a correlation higher than 0.95 was obtained (p<0.05). The method needs further testing in a larger population of patients. However, reducing the level of detail, the use a symbolic representation of concurrent activation waves offers a promising technique to quantify atrial organization
.
PA3
Computing in Cardiology 2012, Kraków, Poland 225

Heart rate biometrics based on fingertip optical video using cell phones
Gabriel Garcia, Rachel Smith, Henian Xia and Xiaopeng Zhao*
University of Tennessee
Biometrics involves identifying people through physiological and
behavioral features that are unique to them. One promising biometric physiological feature is an ECG recording which is a measurement of the heart’s electrical signals. There are many methods of analyzing ECG to identify and authenticate a person. Some methods can rely on the morphology of the ECG waveform and compute quantities such as ST interval and QRS triangular area. Statistical analysis such as root-mean squared error approaches or hypothesis-testing models can then be applied on these features. Other methods can utilize image processing and the Radon transform on an ECG. Lastly, methods that do not rely on ECG waveform morphology can examine autocorrelations on an ECG. Various studies in the past several years have developed algorithms to estimate physiological parameters such as heart rate variation, respiration rate, oxygen saturation, and potentially atrial fibrillation and blood loss measurements using commercial mobile phones. The patient places their index finger over the standard camera of the smart phone and records around a twenty second video. In this work, we explore the potential of biometric identification using heart rate and other physiological signals estimated from optical videos of fingertip. The reliability of the data gathered is investigated and compared to ECG, pulse oximeter calculations, and respiration rate information. The smartphone camera, with its expanding number of uses, can propel telemedicine to places society has never experienced
.PA3
226 Computing in Cardiology 2012, Kraków, Poland

Feasibility of Monitoring Vascular Ageing by Multi-site Photoplethysmography
Costanzo Di Maria, Emma Sharkey, Annette Klinge, Dingchang Zheng, Alan Murray*, John O'Sullivan and John Allen
Freeman Hospital Newcastle upon Tyne, United Kingdom
Introduction: Multi-site photoplethysmography (PPG) is a non-invasive,
low-cost, and operator-independent technology which represents a novel and extremely attractive solution for monitoring the vascular system. Aims: The aim of this pilot study was to determine the expected normative values for two main features of PPG waveforms, namely the pulse transit times to foot (PTTf) and to peak (PTTp), and explore their overall trends with subject age. These measures reflect the presence of arterial stiffness and peripheral arterial disease, important factors in cardiovascular risk.
Methods: PPG waveforms were acquired from the right and left ear lobes, index fingers, and great toes in a sample of 31 healthy subjects (19 males and 12 females, age mean±SD 49.7±12.4 years old and range 30-70 years). The electrocardiogram (ECG) was also recorded to provide a cardiac timing reference. PTTf and PTTp were computed using off-line beat-to-beat automated analysis, and calculated using time delay between ECG R wave and corresponding pulse foot and peak landmarks, respectively. As the values from right and left sides were highly similar then their average was used for subsequent analysis. Possible linear regressions with age were investigated utilising Pearson’s correlation analysis.
Results: PTTf for ear, finger and toe sites were 139±10 ms, 192±14 ms, and 282±24 ms, respectively. For PTTp the values were 460±67 ms, 431±40 ms, and 510±29 ms, respectively. Toe PTTf significantly decreased with age (r=-0.59, p<0.001). In contrast, finger PTTp significantly increased with age (r=0.46, p<0.01).
Conclusions: Expected normative values for PTTf and PTTp have been quantified. PPG shows potential to assess the increase in cardiovascular risk linked to physiological or early vascular ageing. Further research is needed to quantify the ageing effects in relation to clinical variables and also to explore pulse rise time changes with subject age
.
PA3
Computing in Cardiology 2012, Kraków, Poland 227

The kinect sensor device as a natural user interface in the cardiac catheterization laboratory
Thomas Hilbel*, Hartmut Surmann and Hugo Katus
University of Heidelberg Heidelberg, Germany
Time-of-flight cameras are visual sensors used by autonomic robots to
detect and react on the spatial environment. In the past, these cameras were very expensive. But with the release of the Microsoft Kinect sensor device they became affordable. The Kinect sensor device can be programmed to react as a touch less human user interface. A touch less user interface can be very helpful in an environment like a cardiac catheterization laboratory where the operator has to be scrubbed and does need sterile covers or additional technical assistants to operate a medical modality like the hemodynamic blood pressure monitoring unit. In an exemplary scenario the Kinect sensor device was programmed to act as a touch less mouse. For programming a Microsoft Kinect SDK was used. With the developed Kinect application the scrubbed physician can activate the hemodynamic monitoring application without having a medical technician in the room. This has two advantages: First no additional person in the cathlab will be exposed to X-ray. Second it is also possible to save personal resources outside the cathlab operation theatre that does normally start the hemodynamic monitoring application form the control room area. Especially in cathlab procedures when interactions like the recording of the blood pressure are not needed to be repeated very often. Conclusion: The availability of reasonable priced time-of-flight camera sensors offers a wide range of possible new applications in the medical field were human interfaces are necessary. It can be imagined not only to start and to stop computer applications as a mouse replacement but also its usage for medical navigation procedures. But it also has to be clear that the additional use of a new sensor device like a time-of-flight camera requires appropriate medical certification of the product in the medical field were it will be applied
.
PA3
228 Computing in Cardiology 2012, Kraków, Poland

Photoplethysmographic Augmentation Index Using the Signal Fourth Derivative
Rodolfo González*, Alain Manzo, Juan Delgado, Julio Gomis-Tena and Javier Saiz
Instituo Tecnológico de Morelia Tarímbaro, Mexico
Photoplethysmography (PPG) is an optical technique, which typically
operates using infrared light, allowing the transcutaneous registration of venous and/or arterial blood volume changes in the skin vessels. The complex interaction between the heart and connective vasculature are the components of the mechanism that generates the PPG signal. Photoplethysmographic signals have been applied in many different settings including clinical physiological monitoring, vascular assessment and autonomic function. Features of the signal, such as the height of the inflection point relative to pulse height, have been used to quantify haemodynamic parameters as wave reflection. However, because of the smooth appearance of the signal due to damping, other features, such as early and late systolic inflections, cannot be detected readily. This work aimed to provide, that using the derivatives of photoplethysmographic signal enhance the location of inflection points. Evenmore, using the signal fourth derivative, it is possible to locate early and late systolic inflections points as photoplethysmographic augmentation index (PAI). A computing photoplethysmographic analyzer was developed. The first, second, third and fourth derivatives were obtained by mean square error interpolation method. The PAI was quantified by fourth derivative. PAI was calculated similar to augmentation index for pressure (AIx). The AIx is obtained as the difference between late and early systolic inflections expressed as a percentage of the pulse pressure . A study with 36 people, 18 healthy volunteers and 18 subjects with previously diagnosed cardiovascular disease was carried out. A t–tested distribution between healthy volunteers and patients showed a significant differences in calculated PAI (0.0231 vs 0.4678, p < 0.0001). In conclusion, PAI has shown to be a noninvasive indicator for vascular assessments. Using fourth derivative, the early and late systolic inflection points identification of the PPG signal is more accurate mainly in subjects with previously diagnosed cardiovascular disease
.
PA4
Computing in Cardiology 2012, Kraków, Poland 229

Diagnosis of Cardioprotective Effect and Heart Tissue Damage, with Different Doses of Vasopressin (AVP), through Discrete Wavelet Analysis of Electrocardiogram and Atrial Blood Pressure Signals
Hamid Ebrahimi Orimi*, Seyyed Abbas Atyabi and Rasa Jamshidi
Department of Mechanical Engineering, K. N. Toosi University of Technology, Tehran, Iran
Aims: Each year’s many people are at coronary congestion risk. the task
of coronary artery is to distribute the blood to the heart tissue, and any blockage in these arteries can cause that tissue to feed the oxygen and nutrients less than their needs (ischemic disease), This imbalance will continue until the first cell away (myocardial infarction). But it should be noted amount of ischemia and infarction tissue are not the same in each person by another ones.
Methods: in this paper, with simulated myocardial infarction in laboratory rats, we were looking for to determine the extent of tissue damage through electrocardiogram (ECG) atrial blood pressure (ABP) synchronic signals. Signals of 50 wistar rats, with a weight range 200-300 g, to which 30 minutes in normal case, 30 minutes in ischemia and myocardial infarction (artificial complete blockage was in the left anterior descending coronary artery (LAD)) case and 30 minutes in reperfusion case, were recorded. For a different injury in rat heart, we injected the AVP with different doses for 40 rats. After the data and images of heart sections were extracted, by using the discrete wavelet transform (DWT), on the ECG and ABP signals and to obtain the entropy of wavelet coefficients, the 50-dimensional vector was generated, and the extent of tissue damage on the images of the heart tissue was extracted by image processing. Finally, by using four artificial neural networks (ANN) (by different structure), support vector machine (SVM) and voting criteria, we estimate the amount of damaged tissue.
Results: our intelligent machine achieved average accuracy (Acc) 97%, sensitivity (Se) 98%, specificity (Sp) 95% for total AVP doses and control cases.
Conclusion: Given that, the tissue damage in various doses of AVP is different, this difference can be seen in the above method exactly
.
PA4
230 Computing in Cardiology 2012, Kraków, Poland

Predictive Value of Entropy Analysis for Atrial Fibrillation Recurrence after Ablation Procedures
R Cervigon*, J Moreno, J Millet and F Castells
UCLM Cuenca, Spain
In a follow-up after successful ablation of atrial fibrillation (AF) it comes
up that, after some months, while some patients still remain in sinus rhythm (SR), some other present AF recurrence. The prediction of AF recurrence before starting an ablation procedure is a challenging clinical problem. This study characterizes AF recurrence using entropy measurements of intracardiac recordings previous to ablation. The database includes intracardiac recordings from 22 AF patients submitted to an ablation procedure. Four dipoles were located at the right atrium (RA) and 4 more at the left atrium (LA). All patients were monitored after ablation, and were divided in 2 groups according to AF recurrence outcome: 11 of them remained in SR, whereas the other 11 turned back to AF. Sample entropy was applied to these signals, in order to characterize different non-linear AF dynamics at RA and LA independently. Results showed statistical significant differences along the atria between both groups. Considering the global information of both atria, entropy values were 0.868±0.132 in the non-recurrent AF group vs. 1.027±0.097 in the recurrent AF group (p=0.031). When analyzing regional results, these differences were emphasized at the RA. However, non-statistically significant results were obtained at the LA. In fact, at the RA, entropy values were 0.817±0.104 in the non-recurrent AF group vs. 1.042± 0.098 in the recurrent AF group (p=0.025), whereas at the LA, entropy was 0.919±0.151 in non-recurrent group vs. 1.013±0.108 in recurrent group (p=0.349). Moreover, regional differences were analyzed in both groups separately. In the recurrent group, non-statistically significant differences between both atria were found (LA 1.013±0.199 vs. RA 1.041±0.266, p=0.290), although in the non-recurrent group they were (LA 0.919±0.258 vs. RA 0.816±0.153, p=0.038). These findings show the potential of entropy measurements as useful predictors of AF recurrence after successful ablation of AF
.
PA5
Computing in Cardiology 2012, Kraków, Poland 231
Effects of Local Epicardial Cooling/Warming on the Complexity of the Ventricular Fibrillatory Pattern
A Guill, A Tormos, FJ Chorro, E Roses, F Castells, I Trapero, LM Such-Miquel, L Brines, M Zarzoso and José Millet*
Universitat Politècnica de València València, Spain
An epicardial mapping electrode with an integrated thermoelectric cooler
is used in an experimental model to analyze the effects of local hypo- and hyperthermia on the activation patterns during ventricular fibrillation (VF). In ten Langendorff-perfused rabbit hearts localized epicardial cooling/warming were induced by the specific device (128-unipolar) in a ventricular epicardium area (modified zone, MZ). A conventional electrode (103-unipolar) was situated in another area of the same ventricle (NMZ). Epicardial electrical activity was simultaneously registered in both MZ and NMZ, during basal temperature (37 ºC), induced hypothermia in MZ (32 ºC, 27 ºC, 22 ºC) and induced hyperthermia in MZ (42 ºC). The analyzed parameters were: 1) the median of the VF intervals (VV) at each temperature step, and 2) the type of the computed activation maps during VF (I = one wavelet without block lines, II = two simultaneous wavelets with block lines, III = three or more wavelets with block lines) at basal temperature, hypothermia-22 ºC and hyperthermia. In MZ, VF is decelerated by hypothermia (VV: 65 ± 16 vs 52 ± 10 ms, p< 0.05) and accelerated by hyperthermia (VV: 44 ± 7 vs 52 ± 7 ms, p< 0.05), in a reversible manner. VV changes with temperature in MZ fits to a lineal model (r=-0.52, p<0.0001). In NMZ, no significant differences were observed. Epicardial hypothermia induces a significant variation in the complexity of the VF activation maps in MZ respect NMZ, with type III increments and type II decrements (MZ-22 ºC: I = 7%, II = 31%, III = 62%; NMZ-22 ºC: I = 7%, II = 47%, III = 46%, p<0.01). We conclude that local myocardial warming accelerates VF, and local myocardial cooling decelerates VF and increases the complexity of the VF activation pattern
.
PA5
232 Computing in Cardiology 2012, Kraków, Poland

Analysis of the Effects of Lead Configuration onCardiac Spectrum
Ferney Beltrán-Molina, Jesús Requena-Carrión, Juho Väisänen
Rey Juan Carlos UniversityFuenlabrada, Madrid, Spain
Background: Dominant frequency (DF) mapping is a promising techniquein the diagnosis and management of atrial fibrillation. Currently, there are twointracardiac DF mapping approaches based on contact and noncontact leads,but the relationship between their DF values is not fully understood. Theoreti-cally, the spectrum of cardiac signals from different leads can be different, andtherefore their DF values could also be different.
Aim: In this study we investigate the effects of lead configuration (electrodetype and distance to cardiac tissue) on the spectrum of cardiac signals.
Methods: In a simulation environment we generate two spatiotemporal pat-terns of cardiac activation, namely plane wave and spiral wave. Then, cardiacsignals are synthesized by defining unipolar and bipolar electrodes located atdifferent heights over the cardiac tissue. We estimate the power spectrum ofevery signal by using Welch’s method. We analyze the relationship betweenthe DF and the spectral bandwidth (BW) of cardiac signals, and the configura-tion and spatial resolution (SR) of leads. The SR is defined as the inverse ofthe lead equivalent volume (LEV).
0 0.1 0.2 0.3 0.4 0.50
50
100
150
200
LEV
BW
[Hz]
Unipolar (P)Bipolar (P)Unipolar (S)Bipolar (S)
Relationship between BWand LEV during plane-wave(P) and spiral (S) dynamics.
Results: DF values are not affected bythe lead configuration. By contrast, the BWis affected by the lead configuration. Unipo-lar BW is narrower than bipolar BW. Also,the closer the leads to the tissue sample, thenarrower the BW. Irrespective of the leadconfiguration, the BW and the lead SR areinversely related (see Figure), so that thelower the SR (the larger the LEV) the nar-rower the BW.
Conclusion: The DF is a robust spec-tral feature and thus DF maps may not beaffected by leads. Leads can distort otherspectral features depending on the BW.
PA5
Computing in Cardiology 2012, Kraków, Poland 233

Virtual electrodes mechanisms predictions with acurrent-lifted monodomain model
Yves Coudiere, Myriam Rioux
Inria Carmen & Liryc, Universite de BordeauxBordeaux, France
Aims: The aim of this work is to prove the use of a new version of themonodomain model for numerical simulations of cardiac activation by currentsin order to investigate e.g. pacing mechanisms.
Methods and results: Taking advantage of the linearity of the electrostaticbalance of intra- and extracellular currents, we derive a lifting operator forany applied current. The lifted applied current is introduced back into theevolution equation for the transmembrane potential. After simplification ofthe diffusion operator, the final model is a monodomain equation with liftedcurrent, that we call current-lifted monodomain (CLM). It allows any contri-bution of the current to be solved separately, making possible to account forunequal anisotropy ratios, the excitation via the intracellular, the extracellu-lar, and the extracardiac media. As this extra part of the calculation is per-formed once before all time iterations, the CLM performs as well as the stan-dard monodomain model, i.e. about ten times faster than the bidomain model.
Transmembrane potential atthe endocardial surface(top) where anodal stimulusis applied, i.e. inside thewhite region at the center.
For proving the use of the CLM model,virtual electrode polarizations (VEP) aresimulated. VEP represents a whole classof phenomena strongly related to unequalanisotropy ratios, where the extracellularcardiac stimulation by an unipolar electrodeinduces characteristic regions of membranepolarization other than those in the vicinityof the electrode. See the figure for a CLMsimulation of a 3D myocardial slab illustrat-ing the “anode make” VEP phenomenon.
Conclusion: The important advance-ment of this work is the replacement of thebidomain model, which has always beenrecognized to be the only model suitable forthis specific modelling application. CLM model then becomes all indicatedfor long-duration simulations with current stimulation, e.g., investigations offibrillation mechanisms where current stimulations turn out to be an effectivetreatment.
PA6
234 Computing in Cardiology 2012, Kraków, Poland

Modified Inverse Solution to One Dipole for Location of Lesions with Changed Repolarization
Jana Svehlikova*, Jana Lenkova and Milan Tysler
Institute of Measurement Science, SAS Bratislava, Slovakia
Aim: The motivation of the study was to improve the method for
localization of lesions with changed repolarization by inverse solution to one dipole mainly for large and transmural lesions. In the simulation study 66 lesions were modeled: 30 small, 27 large and 9 transmural.
Method: First the direction of resulting dipole was predefined perpendicular to the epicardium. The inverse solution to one dipole was computed using the predefined points in the myocardium with the mean adjacent distance of 1cm as possible positions for the results. Second the inverse solution was computed to groups of neighboring dipoles consisting of 2 to 6 dipoles. The dipoles in the group had either the predefined direction or they had no constrictions. The geometrical center of the group of dipoles weighted by the dipole amplitude was considered as the representative of the position of the center of lesion. The localization error was computed as the distance between the geometrical centre of modeled lesion and the weighted center of the group of dipoles.
Results: The predefined direction of one resulting dipole did not improve the localization error comparing with the previous method with no constrictions, which was 0.8cm for small, 1.1cm for large and 2.8cm for transmural lesions. When the inverse solution was computed to the group of dipoles with predefined direction, the localization error dropped the most significantly for small lesions from 0.8 to 0.3cm, and for large lesions from 1.1 to 0.5cm. When the inverse solution was computed for the dipoles without constrictions, the localization error improved the most for transmural lesions from 2.8 to 1.0cm, while the error for small or large lesions improved slightly from 1.1 to 0.8cm or from 0.8 to 0.7cm respectively.
Conclusions: Computing the inverse solution to the group of neighboring dipoles improves the localization of transmural lesions
.
PA6
Computing in Cardiology 2012, Kraków, Poland 235

Dofetilide unmasks occult congenital Long QT Syndrome Type 2: a simulation study
Lucia Romero, Beatriz Trenor, Jose Maria Ferrero, Javier Saiz* and Colleen E Clancy
Universitat Politècnica de València Valencia, Spain
Accurate diagnosis of long QT syndrome is crucial for reducing the risk
of cardiac arrhythmias. In recent years, drug-induced provocative tests have been proposed to unmask some types of latent mutation carriers. Our goal is to investigate the potential use of dofetilide to unmask latent IKr mutation carriers. A modified version of the O´Hara et al. model, the most detailed human ventricular action potential (AP) model to date, was used to simulate the electrical activity of isolated cardiac cells. The original IKr formulation was replaced by the Fink et al. Markov model of the human IKr channels and our dynamic model of dofetilide was used to simulate drug administration. A sensitivity analysis was performed to study the effect of IKr transition rate alterations on AP duration (APD) prolongation in the absence and in the presence of dofetilide and on the electrophysiological characteristics of IKr. Our results show that acceleration of the rate transition from open to the last closed state (bb) produced the shortest prolongation of the APD in the absence of the drug. However, bb acceleration provoked the highest additional APD prolongation under dofetilide exposure related to the APD prolongation observed before the drug application. Indeed, the APD difference between endocardial WT cells and those affected by bb acceleration (3ms) was doubled (6 ms) and increased five-fold (15 ms) when 10 nM and 30 nM dofetilide was added, respectively. This APD prolongation was was markedly enhanced in mid-myocardial cells as the APD difference between WT cells and those affected by bb acceleration (4 ms) was increased seven-fold (28 ms) under 10 nM dofetilide. In addition, this IKr alteration was the transition rate modification that most increased the rate of deactivation
.
PA6
236 Computing in Cardiology 2012, Kraków, Poland
Ventricular Assist Device Lowers Cardiac Electromechanical Delay: Simulation Study
Ki Moo Lim*, Eun Bo Shim and Natalia Trayanova
Kangwon National University , Republic of Korea
High cardiac electromechanical delay (EMD) means low synchrony of
cardiac electromechanical activation and decreases the pumping efficiency. EMD is strongly related to the condition of electrical conduction pattern and mechanical load. Three-dimensional EMD distribution can not be exactly obtained due to limited measurement devices. Therefore, this study predicted the effect of the condition of electrical conduction pattern and mechanical load on the EMD by using multi-scale model of cardiac electromechanics. Cardiac electromechanical model includes electrical conduction through the cardiac tissue and mechanical contraction by the cross-bridge dynamics. In order to predict the effect of electrical conduction patterns on EMD, left bundle branch block (LBBB) and right bundle branch block (RBBB) were simulated. And, in order to predict the effect of mechanical loading condition on EMD, we simulated failed ventricle and the ventricle with left ventricular assist device implantation. For both condition, EMD distribution was computed. EMD under LBBB condition was higher than that under RBBB condition, and 2% higher than that of normal heart. Left ventricular assist device lowered EMD with 4%. The simulation results indicated that the later electrical activation induced higher EMD and the mechanical unloading induced lowered EMD. This simulation study will provide more information about cardiac electric and contraction coupling with the appropriate experimental studies
.PA6
Computing in Cardiology 2012, Kraków, Poland 237
Properties of Four Human Atrial Cell Models: Action Potential, Memory and Ionic Channel Kinetics in Single Cells
Michael Colman*, Alexander Rabinovich, Shahab Saraee and Henggui Zhang
The UNiversity of Manchester Manchester, United Kingdom
Mathematical models of cardiac cells have become important tools for
investigating the electrophysiological properties and dynamical behaviour of the heart. Recently, two new models for human atrial electrical action potentials (AP) have been published: the Maleckar et al. model (MAL) in 2009 and the Koivumaki et al. model (KKT) in 2011. These two models add to the two previous models published in 1998: the Courtemanche et al. (CRN) model and the Nygren et al. (NY). It is important to ascertain the similarities and differences between the four models. In this study we compare the four models of human atrial myocytes in terms of their dynamic behaviour, AP morphology (APM) and duration (APD), time courses and relative roles of the transmembrane currents, time courses of the intracellular Na+, K+ and Ca2+ concentrations, and restitution and memory effects. The MAL and KKT models are both based on the NY model, and hence exhibit a ‘triangular’ AP and a shorter APD as compared to the ‘spike and dome’ AP and longer APD of the CRN model. The CRN model is highly stable, however its intracellular Ca2+ handling system and the formulations for some membrane currents are out of date, the same as the NY model that is also unstable. The MAL has updated formulations for Ito and IKur based on recently published human data which improves repolarisation behaviour. The KKT model develops a new, atria specific, Ca2+ handling system accounting for spatial variability of Ca2+ concentration within the cell. It is highly stable but computationally expensive. In conclusion, the four models for human atrial cells show dramatic differences in their electrical properties, which may reflect the differences in the experimental data on the underlying ionic channels that were available when the models were developed. Further improvements are necessary when new data become available
.
PA6
238 Computing in Cardiology 2012, Kraków, Poland

GPU Acceleration of Transmsural Electrophysiological Imaging
Martin Corraine*, Sonia Lopez and Linwei Wang
Rochester Insitute of Technology Lockport, United States
Tranmural electrophysiological imaging (TEPI) is becoming a possibility
with the aid of 3D in silico cardiac EP models and the statistical estimation theory. By quasi Monte-Carlo (MC) simulation of the 3D EP models on the subject-specific anatomical model, complex and physiologically meaningful spatiotemporal priors are produced to achieve the 2D-to-3D transition of EP data, an inverse problem that otherwise has no unique solutions. While it is acknowledged that macroscopic phenomenological models are more suited for the purpose of inverse problems, the nature of these algorithms still incurs tremendous computational cost that hinders their clinical translation, particularly caused by the MC simulation of high-dimensional, nonlinear EP models and large-matrix operations involved in probabilistic estimation. In this paper, we explore the use of Graphic Processing Units (GPU) to accelerate TEPI because its high parallelism and large bandwidth, as well as its unique capacity of deployment on desktop and laptop computers in clinical settings which excludes the otherwise substantially more expensive and tedious needs to manage remote high performance computing resources.While initial steps have been taken towards GPU acceleration of whole-heart EP simulation using complex, ionic models, few effort is reported on GPU acceleration of subject-specific, data-driven EP imaging. In this study we will show how we take advantage of the high level of parallelism available in the hardware resources in GPUs and achieve a preliminary but important speedups compared to the most high-end CPU version of TEPI. We also present benchmarking on 3 different GPU devices, point out the bottle necks that limit the performance, and give guidelines on balancing the cost versus performance tradeoffs for clinical and researcher environments
.
PA6
Computing in Cardiology 2012, Kraków, Poland 239
Study of Self Maintaining Spatial Spiral Waves in Ven-tricular Tissue Sándor M Szilágyi1, László Szilágyi2 1 Petru Maior University, Târgu Mureş, Romania 2 Sapientia University, Târgu Mureş, Romania
Aims: This study focuses on the most important cardiac malfunction cases responsible for sudden cardiac death and on detailed visualization of all for-mation phases of the deadly self maintaining spiral waves (SW) that may occur in the ventricular tissue and develop ventricular fibrillation (VF).
Methods: We developed a spatio-temporal computerized model of the whole heart that handles half millimeter sized compartments using 1µs time step. For the case of healthy cardiac functioning we employed the effect of muscle fiber direction (the ratio between longitudinal and transversal conduc-tivity varies from 2 to 10), normal and minimal depolarization period (con-sidered 80-250 ms), laminar sheet effect (in-sheet transversal conduction 2-5 times faster than trans-sheet conduction), and cell inhomogeneity (using con-duction speed differences for base-apex gradient (5%-20%), transmural epicardial–endocardial gradient (5%-35%), left-right ventricular gradient (5%-15%)). In presence of ischemia, normal parameter values were no longer maintained. The disturbed or inhibited cell pumping functionality cannot maintain normal ionic concentration levels, so in our simulation the depolari-zation wave (DW) conduction speed of the injured–but still functioning–tissue was decreased by up to 20 times, while the chance of spontaneous ec-topic-firing (SEF) was increased by up to 1000 times.
Results: Under normal conditions the development probability of the SW was under 2% using 1-hour simulated period and had a 90% correlation with ventricular stimulation speed, and 75% with minimal depolarization period of the ventricular tissue. In presence of ischemia the low-conducting ventricular tissue deflected the DW and generated perturbations on the wave front di-rectly proportional with its size. If DW was maintained for at least half a re-polarization period, the SW appeared in few seconds. SEF promotes SW with 95% specificity.
Conclusion: The spacious size and low conducting speed of the injured ventricular tissue and the high probability of SEF are the main generating factors of SW.
PA6
240 Computing in Cardiology 2012, Kraków, Poland

A Cellular Energetic Extension Applied to the Luo-Rudy II Ventricular Cell Model Sándor M Szilágyi
Petru Maior University, Târgu Mureş, Romania
Aims: The goal of this study is to introduce a new ventricular cell ener-getic model extension that, in contrast to earlier presented dynamic cell mod-els, allows the simulation of long-term pathological events such as develop-ment of hypoxia and anoxia. The new energetic model may throw new light upon the development process of ischemia that can enforce various cardiac rhythm malfunctions such as ventricular fibrillation.
Methods: We created an energetic ventricular cell model extension that involves the adenosine triphosphate (ATP)-adenosine diphosphate (ADP) cycling mechanism. In our consideration a healthy ventricular cell stores enough ATP for 20-40 sec normal functioning. In presence of hypoxia the creation of ATP is obstructed and all pump functionality is decreased follow-ing a logarithmic relation between ATP concentration and pump functional-ity, so the ventricular cell can still work at relatively low ATP concentrations. We chose the well known Luo-Rudy II (LR) ventricular model and extended it with the developed energetic circulation system, so that we can easily vali-date the obtained results. To simulate non-pathologic cases we used Na+ 132-148 mmol/L, K+ 3.5-5 mmol/L, Ca2+ 2 mmol/L extra-cellular, and Na+ 8-11.4 mmol/L, K+ 130-175 mmol/L, Ca2+ 0.11-0.16 µmol/L intra-cellular ionic concentrations.
Results: The presence of hypoxia reduces the ATP concentration. In LR model a 10%/25%/50%/75% ATP concentration decrease subdued the ionic pumps efficiency by: 4%/14%/32%/55% for calcium pump of the sarcoplas-mic reticulum; 3%/11%/26%/45% for external membranous calcium pump; 3%/10%/22%/39% for calcium sodium exchanger; and 2%/8%/18%/33% for sodium potassium exchanger.
Conclusion: The malfunction of the calcium regulation mechanism is the principal danger factor in presence of hypoxia or anoxia and it is the most sensible element during ischemia. Although the altered sodium potassium pump functionality is not considered dangerous phenomena, it can disturb calcium regulation so indirectly favors cell necrosis.
PA6
Computing in Cardiology 2012, Kraków, Poland 241

Role of L-type Calcium in Modulating Pro-arrhythmic Effects of Dofetilide in Humans
Nejib Zemzemi*, Javier Saiz and Blanca Rodriguez
INRIA Bordeaux Sud-Ouest Talence, France
Aims Our goal is to investigate pro-arrhythmic mechanisms of dofetilide
administration in human using computer simulations. We will assess the effect of dofetilide on the APD dispersion and prolongation, EADs formation and the intracellular calcium concentration ([Cai]) for various drug doses and L-type calcium (ICaL) levels.
Methods A transmural human ventricular model was constructed including endocardial, midmyocardial and epicardial cells. We use the monodomain model to describe the electrical wave in the tissue and the Grandi et al to describe the membrane kinetics. Dofetilide-induced hERG-block formulation was included to the ionic model following the Hill equation. The computational domain was stimulated at 1Hz on the endocardium and the electrophysiological activity was simulated for various dofetilide doses [D] and for ICaL from fCaL=100 to 140% of control.
Results In control (fCaL=100%), hERG-blockers increase APD by 20% and APD dispersion by 20-30ms but no EADs are observed. EADs appearance depends on both parameters [D] and fCaL: Fixing one and increasing the other results in EADs appearance. Panel A (resp B) shows the role of the dose dofetilide (resp ICaL) on the EADs genesis. EADs result in long APD of up to 1200 ms and importantly, increased APD dispersion of up to 300 ms due to transmural differences in EADs durations. EADs are also observed in the pseudo-ECG for different dofetilide doses (panel C) and levels of fCaL (panel D). Their appearance is explained by a spontaneous calcium release: EADs appearance in panel A (resp B) is synchronized with an intra-cellular calcium release panel E (resp F).
Conclusions ICaL modulates dofetilide-induced EADs in human ventricular tissue. A combination of high dofetilide doses and L-type calcium current is responsible for the EADs appearance. Importantly, EADs cause a significant increase in APD dispersion, which might provide the substrate for the establishment of reentry and TdP
.
PA6
242 Computing in Cardiology 2012, Kraków, Poland

Electromechanical Cardiovascular System Identification and Modeling with ANFIS with ECG and ABP Signals
Rasa Jamshidi, Hamid Ebrahimi and Abbas Attyabi*
K.N.T. University, Iran
In the past decade modeling of human body systems has attracted scientist attentions in all over the world. By developing these models, dynamic function of human systems is determined correctly and abnormalities can be detected easily and more precisely. In this study cardiovascular electromechanical system identification and modeling with a neuro fuzzy method (ANFIS) is evaluated. Electrocardiography (ECG) signal is assumed input of cardiovascular system and Atrial Blood Pressure (ABP) signal is assumed output of system. Two databases are used in this research. Wistar rat’s data, which is experimented in three steps included Normal, Ischemia and Reperfusion is used which lead II ECGs and ABPs of them for approximately 4 hours is recorded simultaneously. For human data MGH/MF waveform database of Physionet is used. Input of ANFIS is ECG amount at three past moments and ABP amount at one past moment and the output is the amount of ABP at present moment. 10000 Normal phase beats of a rat are trained with this procedure and tested with normal, Ischemia and reperfusion beats and it resulted satisfying. Normalized root mean square (NRMS) of error is 7% and 8% for rat and human respectively. For modeling without past data’s of ABP, a new algorithm is developed. At first a couple of cycles is trained with past amount of ABP and then from one point the training is changed and it used the data’s of past estimated ANFIS output. Then this training is tested in rat data without use of past ABPs and it resulted accurately with 10% and 12 % error NRMS for rat and human respectively. So, electromechanical cardiovascular system is identified and this final method function of heart modeled which is showed that this method can function in three phases precisely and this model can be used in many applications
.
PA6
Computing in Cardiology 2012, Kraków, Poland 243
Influence of Pore hERG Mutation on Dofetilide Proarrhythmic Risk
Rodolfo González*, Juan Delgado, Karen Cardona, Lucia Romero, Beatriz Trenor, Jose Maria Ferrero and Javier Saiz
Instituto Tecnológico de Morelia Tarímbaro, Mexico
Several drugs have been withdrawn from the market or their approved
use was severely restricted when it was discovered that they caused arrhythmia or unexplained sudden death. However, some drugs will only cause complications in a subpopulation of sensitive patients. It is well known that genetic factors may underlie the susceptibility to drug-induce adverse reactions such as a long QT syndrome (LQTS) and Torsade de Pointes. Mutations involving the KCNH2 gene (hERG), which codes for the pore-forming α-subunit of a cardiac K+ channel, have been linked to the type 2 LQTS. KCNH2 mutations lead to a reduction in the rapid component of the delayed rectifier repolarising current (IKr). The aim of this work was to study the influence of pore KCNH2 mutation on the effects of dofetilide. Markovian models of G604S/WT mutation and dofetilide have been introduced in guinea pig ventricular cellular model. The effects of this pore mutation affecting this channel were analysed. The G604S/WT mutation accelerates the inactivation and recovery from inactivation. Using this mutated cellular model we have studied the effects of dofetilide concentrations (IKr blocker). The results showed that the reduction of GKr is the main factor in the APD prolongation in the case of G604S/WT mutation. The shift of the inactivation curve and the recovery from inactivation to the left accelerates the transition between the open and inactivated states. The action of dofetilide prolongs the APD in the G604S/WT epicardial and endocardial cells and even provokes EADs development in endocardial cells. In addition, exposure of G604S/WT to this drug amplifies the amplitude of the EADs generated in midmyocardial cells by the mutation alone. In conclusion, the heterozygous G604S hERG mutation increases the proarrhythmic risk of dofetilide prolonging the APD and enhancing the dispersion of repolarization
.
PA6
244 Computing in Cardiology 2012, Kraków, Poland

Role of Extracellular Potassium and Cellular Uncoupling on the Electrical Activity of the Purkinje-Ventricle Subsystem: A Simulation Study
Esteban Ramírez*, Javier Sáiz and Beatriz Trénor
Instituto Tecnológico de Cuautla Cuautla, Mexico
Arrhythmias induced by phase 1B ischemia are poorly understood. The
goal of the present work was to study through computer simulations the role of the increase of extracellular potassium concentration and changes in the cellular coupling provoked by 1B ischemia in ventricular tissue connected to Purkinje fibers. We developed a 2D model of a bundle of Purkinje fibers connected by two Purkinje-ventricle junctions (PVJ1 and PVJ2) to a ventricular ischemic zone. The Purkinje fiber bundle had a structure of 0.05 x 4.52 cm under normal physiological conditions. One of the Punkinje-ventricle junctions had an altered impedance induced by ischemia (PVJ1) an the other junction was normal (PVJ2). The ventricular ischemic zone was a tissue of 1.75 x 1.5 cm and was divided into three zones: a 1B central circular ischemic zone (1BCIZ), a border zone (BZ) ring-shaped and a normal zone (NZ). An increase of 100% in the impedance of PVJ1 (Rpvj1 = 32 ohms.cm2) caused conduction block from Purkinje to ventricle (P-V). If the resistance of the 1B central ischemic zone was increased in 60% (Rendo = 8 ohms.cm 2), the conduction block was maintained. If the Rendo resistance was increased in 80% (Rendo = 9 ohms.cm2), the conduction block disappeared and conduction from Purkinje to ventricle was observed. When the Rpvj1 was fixed in a 50% increase (Rpvj1 = 24 ohms.cm2) and the extracellular potassium concentration ([K+]o) was increased, unidirectional block (UDB) was observed for [K+]o greater than 14.2 mmol/L. A greater [K+]o than 14.2 mmol/L and the moderate increase of cellular uncoupling induced by ischemia in a ventricular zone could cause conduction block in P-V and conduction in V-P, thus generating unidirectional block and reentry. This phenomenon could be related to the increased probability of arrhythmias arising during phase 1B ischemia
.
PA6
Computing in Cardiology 2012, Kraków, Poland 245

Computational Analysis of Extracellular Calcium Effects on an Improved Human Ventricular Action Potential Model
Elisa Passini* and Stefano Severi
University of Bologna Sestola, Italy
Introduction: A decrease in extracellular calcium concentration ([Ca]o)
prolongs the action potential in ventricular cardiomyocytes, and viceversa. Although this phenomenon can be relevant to arrhythmogenesis in clinical settings, most of the commonly used ventricular cell models are not able to reproduce the inverse relationship between [Ca]o and action potential duration (APD). From earlier studies, it is well known that L-type calcium current is the mainly involved ionic mechanism: the change in driving force resulting from [Ca]o decrease, alone, should reduce calcium influx; nevertheless, a reduction in calcium dependent inactivation (CDI) plays the major role, thus prolonging APD. Aims: This study aimed to improve a recently published human ventricular cell model (O’Hara-Rudy, 2011, ORd), in order to better reproduce the effects of [Ca]o changes on APD.
Methods: The CDI gating variable has been modified in the ORd model, in order to increase its sensitivity to intracellular calcium, which is, in turn, directly affected by [Ca]o. Simulations were run with the original and modified models at variable [Ca]o in the clinically relevant range 1-3mM: results in term of APD vs [Ca]o were compared to experimental data available in literature, considering the consistency between QTc and APD changes. Other minor modifications have been introduced to guarantee that the modified model matches the same experimental data used in the O’Hara-Rudy paper. Results and
Conclusions: The modified ventricular cell model is able to correctly reproduce the inverse [Ca]o-APD relationship, without affecting the physiology of the whole ventricular cell. With reference to the APD at [Ca]o=1.8mM, the percentage variations at [Ca]o=1mM, 2mM and 3mM are respectively: +7%, -1% and -3% compared to -10%, +1% and +5% for the original model. Therefore the modified model can be used as a framework to explore the impact of electrolyte imbalances on the myocyte electrical activity in many different contexts
.
PA6
246 Computing in Cardiology 2012, Kraków, Poland
Role of Na(+)-Ca(2+) exchange in neonatal and adult ventricular cells: a simulation study
Hitomi Sano*, Yasuhiro Naito and Masaru Tomita
Keio University Fujisawa, Japan
Objective: The present paper expanded an integrated mathematical
model, which successfully simulated developmental changes in electrophysiological activities of rodent ventricular cells, to contrive models that reflect a hypothesis on the role of Na(+)-Ca(2+) exchange in neonatal ventricular cell: the Na(+)-Ca(2+) exchange assumes a relatively greater role in neonatal cells with a morphologically sparse sarcoplasmic reticulum (SR).
Results: Our simulation with the expanded model on the basis of the E-Cell Simulation Environment showed that neonatal ventricular cell consumed larger amount of adenosine triphosphate (ATP) than adult ventricular cell did, owing to long relaxation time. The amount of ATP consumed per beat was reduced to the amount equivalent to adult ventricular cell, as increasing the relative current density of Na(+)-Ca(2+) exchange (F_(NCX)) by 4-fold, which is consistent with the observed current density in neonatal rabbit ventricular cell. To further validate the hypothesis, the relative functional activity of SR (F_(SR)) was incrementally increased from neonatal to adult levels and subsequently increased F_(NCX), and found that increasing F_(NCX) had negative impact on sarcomere relaxation velocity in ventricular cell model with large F_(SR).
Conclusions: Simulation of neonatal and adult ventricular cells indicated that the role of large Na(+)-Ca(2+) exchange current density in neonatal ventricular cell is to accelerate the relaxation of sarcomere by increasing transsarcolemmal Ca(2+) efflux and shortening the Ca(2+) transient lasting time. The over-representation of Na(+)-Ca(2+) exchange in neonatal ventricular cell is thus suggested to play an important role as substitute for immature SR Ca(2+) ATPase (SERCA) that reuptakes Ca(2+), because over-representation of SERCA consequently results in larger amount of ATP consumed per beat
.
PA6
Computing in Cardiology 2012, Kraków, Poland 247

A Semi-Automatic Method To Construct Atrial FibreStructures : a Tool for Atrial Simulations.
Simon Labarthe, Yves Coudiere, Jacques Henry
Universite Bordeaux Segalen, IMB UMR 5251 - INRIA, Carmen - LIRYCTalence, France
Aims : Fibre structure and anisotropy is a determinant issue to provide ac-curate simulations of the electrical activity of atrial tissue. Though, atrial fibrearchitecture remains unreachable to standard imagery techniques on patients.A method to construct models of the fiber architecture on patient-specific ge-ometries is then a key for numerical simulations of atrial tissues. We devel-oped such a method and then derived pathological and non pathological pa-tient specific surface models of the left atria (LA), based on medical images.Hence, pathological scenarii were explored, like a mecanism of micro-reentryin the left superior pulmonary vein (LSPV) and their interaction with the sinusrhythm (SR).
Method : The construction method was based on two main ideas : (1) Aspectral analysis of an inertia tensor allowed to semi-automatically constructcircumferential fibres around cylinder-like geometrical structures; (2) An in-painting algorithm provided a continuous completion of fibre structure betweencylinder-like elements. This method was applied to a MRI-based anatomicalmesh where cylinder-like regions were previously manually isolated. A het-erogeneity in the fibre direction was defined in the LSPV. Monodomain sim-ulations were computed on this model, initiating the sinus wave in the maintransseptal conduction zones and an ectopic wave in the LSPV.
Anterior view of LA with fibresand heterogeneity in the LSPV.
Results : Applying our methodon medical images, we obtained apatient-specific surface model of theLA with the PVs including complexfibre structure qualitatively conform-ing to histological descriptions. It in-corporated an heterogeneity that trig-gered pathological patterns : microreentries in the LSPV that perturbedthe SR.
Conclusion : A priori models offibre orientations can be constructed on patient-specific LA geometries using asemi-automatic method. They are a key tool to define patient-specific protocolsfor numerical simulations.
PA6
248 Computing in Cardiology 2012, Kraków, Poland
Hypoxia Modeling Using Luo-Rudy II Cell Model Sándor M Szilágyi1, László Szilágyi2, Călin Enăchescu1 1 Petru Maior University, Târgu Mureş, Romania 2 Sapientia University, Târgu Mureş, Romania
Aims: This study is aimed to present the development phases of hypoxia and anoxia using the dynamic Luo-Rudy II (LR) ventricular cell model. This task involves the robustness analysis of the selected cell model in low oxygen level circumstances that alter the ionic conductance properties of the cellular membrane and partially or totally inhibit the ionic pump functionality.
Methods: We investigated hypoxia and its effect on activation potential, ionic currents, pumps, exchangers, and ionic concentrations involved in the LR model. To simulate non-pathologic cases we used Na+ 132-148 mmol/L, K+ 3.5-5 mmol/L, Ca2+ 2 mmol/L extra-cellular and Na+ 8-11.4 mmol/L, K+ 130-175 mmol/L, Ca2+ 0.11-0.16 µmol/L intra-cellular ionic concentrations. In presence of acute hypoxia all internal-external ionic concentration gradi-ents were reduced by up to 3 times. We considered that the aggravated exter-nal membranous ionic pump functionality was decreased by up to 10 times and the sarcoplasmic reticullum Ca2+ pump activity was reduced by up to 5 times. Cell temperature was set to 37°C and the maximal spontaneous ionic conductance was considered the double of the average value.
Results: The presence of hypoxia has reduced the ionic pump functional-ity. Decreasing ionic pump power for 2-minute duration by 10%, 25%, 40%, 60%, 75%, respectively, caused a reduction of sodium ionic gradients by 1%, 3%, 7%, 14%, 19%, potassium ionic gradients by 2%, 5%, 10%, 17%, 23%, and calcium ionic gradient by 6%, 14%, 22%, 32%, 46%, respectively. In case of 5-minute duration, the same ionic pump power reduction led to ionic gradient fall by 2%, 5%, 11%, 26%, 52% (Na+), 4%, 9%, 17%, 41%, 68% (K+), and 11%, 19%, 34%, 58%, 75%, respectively (Ca2+).
Conclusion: The calcium regulation mechanism is more sensitive to hy-poxia than the potassium regulation, while the sodium regulation is the most robust among the investigated pump functionalities.
PA6
Computing in Cardiology 2012, Kraków, Poland 249

Is silico prediction of the drug overdose consequences at the heart electrophysiology level
Sebastian Polak*, Barbara Wiśniowska, Kamil Fijorek, Anna Glinka, Miłosz Polak and Aleksander Mendyk
Jagiellonian University Medical College Kraków, Poland
Aims: The aim of the study was to simulate the possible clinical situation
of the drug overdose and to assess its electrophysiological consequences, and thus to move the M&S approach to the patients bedside level.
Methods: Cardiological citalopram overdose consequences were simulated with use of the ToxComp version 1.5 (www.tox-comp.net). Ten Tuscher human cardiomyocyte model (1D string - Epi/M/Endo - 20/30/50%) was used. Physiology of the 36-yo woman, 33 hours post suicidal ingestion, with high serum citalopram (477 ng/mL) and its metabolite desmethylcitalopram (123.2 ng/mL) concentration was simulated. Current inhibition data were either taken from the literature (citalopram IC50 IKr = 3.57 µM) or predicted with use of the extended QSAR models (citalopram IC50 IKs = 6.45 µM; desmethylcitalopram IC50 IKr = 1.75 µM, IC50 IKs = 5.36 µM). Total ionic currents inhibition was simulated as the sum of inhibitions. Plasma ions concentrations (K+= 3.1 mM, Ca2+= 2.3 mM, Na+= 133 mM) and heart rate rhythm (102-150 bpm) were taken from the clinical report (Tarabar 2008). Sjögren model was used to simulate the age dependent heart wall thickness. Simulation time was set to 10 seconds and the QTc [ms] value with Fridericia correction was the endpoint. Four scenarios were tested assuming that either IKr current only or IKr+IKs currents are affected with various heart rates (102/150).
Results: The comparison of the observed vs. simulated QTcF values for four tested scenarios was as follows: (1) IKr/102 bpm - 524/469; (2) IKr/150 bpm - 515/511; (3) IKr+IKs/102 bpm – 524/487; (4) IKr+IKs/150 bpm – 515/524.
Conclusions: ToxComp system predicted the electrophysiological consequences of citalopram overdose. Clinical effect of the two active substances was properly mimicked. Results indirectly suggest the role of the drug triggered multiple currents inhibition instead of dealing with hERG channel only
.
PA6
250 Computing in Cardiology 2012, Kraków, Poland

Relationship between complex fractionated atrial electrogram patterns and different heart substrate configuration
Nicolas Navoret*, Sabir Jacquir, Gabriel Laurent and Stéphane Binczak
Dijon, France
Complex Fractionated Atrial Electrograms (CFAE) are identified as
being symptomatic of reentrant activities. Signals recorded by an intracardiac catheter give an imprecise vision of the underlying phenomena that occurs in the proarrhythmic substrate. The large range of CFAE types may represent not only reentry mechanisms, but also a large variety of bystander electrical wave fronts. To better match the actual measurements made by the cardiologist during the procedure, numerical simulations are performed in order to take into account catheter particularities such as dimensions, shape and electrodes disposal. Some phenomenological and ionic models are used to simulate a small piece of the atrium substrate. Modifications are locally applied to this numerical substrate in order to reproduce disturbances in wave propagation as it can be observed in a diseased heart. This includes barriers to conduction, variations in cell density, or ectopic foci. Then stimulation scenari are applied to the numerical substrate such as planar waves, stable or meandering spirals. Preliminary results suggest that disturbed areas influence the shape of action potential, as a real substrate would do. This leads to wave propagation behaviors which are typical in case of heart pathologies such as flutter or atrial fibrillation. Scaled recordings from this study bring interesting information about the amount of cells involved in the patterns of CFAE signals. From the information of this scaling process comparisons are done with clinical recording from actual ablation procedures. CFAE patterns from clinical signals are compared with results of the numerical simulations in order to qualify the nature of the patient substrate
.
PA6
Computing in Cardiology 2012, Kraków, Poland 251

Mutual Influence mural Conduction
A Gharaviri
Maastricht UniversityMaastricht
multiple fibrillation waves randomly propagating through the complex ana
omy of the atrial wall. AF in itself and structural heart diseases cause stru
tural alterations in the atria favoring local heterogeneities of conduction
impedi
side
cardi
tion time
rimental studies have shown an enhancement of transmural conduction
(“breakthroughs”) during later stages of AF.
synchrony and breakthrough rate, a
was developed
brane behavior.
sites. To simulate the whole range between moderate and severe structural
disease, the number of connections
(severe).
synchrony between the two layers. In addition, a positive correlation was
found between transmural conduction and dyssynchrony throughout time in
all simulations.
to breakthroughs and enhances maintenance of AF.
Mutual Influence mural Conduction
A Gharaviri
Maastricht UniversityMaastricht
Atrial fibrillation
multiple fibrillation waves randomly propagating through the complex ana
omy of the atrial wall. AF in itself and structural heart diseases cause stru
tural alterations in the atria favoring local heterogeneities of conduction
impedi
side
cardi
tion time
rimental studies have shown an enhancement of transmural conduction
(“breakthroughs”) during later stages of AF.
In order to investigate the
synchrony and breakthrough rate, a
was developed
brane behavior.
sites. To simulate the whole range between moderate and severe structural
disease, the number of connections
(severe).
synchrony between the two layers. In addition, a positive correlation was
found between transmural conduction and dyssynchrony throughout time in
all simulations.
In conclusion, dyssynchrony between the endo
to breakthroughs and enhances maintenance of AF.
Mutual Influence mural Conduction
A Gharaviri
Maastricht UniversityMaastricht
Atrial fibrillation
multiple fibrillation waves randomly propagating through the complex ana
omy of the atrial wall. AF in itself and structural heart diseases cause stru
tural alterations in the atria favoring local heterogeneities of conduction
impedi
side-to
cardium
tion time
rimental studies have shown an enhancement of transmural conduction
(“breakthroughs”) during later stages of AF.
In order to investigate the
synchrony and breakthrough rate, a
was developed
brane behavior.
sites. To simulate the whole range between moderate and severe structural
disease, the number of connections
(severe).
synchrony between the two layers. In addition, a positive correlation was
found between transmural conduction and dyssynchrony throughout time in
all simulations.
In conclusion, dyssynchrony between the endo
to breakthroughs and enhances maintenance of AF.
Mutual Influence mural Conduction
A Gharaviri
Maastricht UniversityMaastricht
Atrial fibrillation
multiple fibrillation waves randomly propagating through the complex ana
omy of the atrial wall. AF in itself and structural heart diseases cause stru
tural alterations in the atria favoring local heterogeneities of conduction
impedi
to-
um
tion time
rimental studies have shown an enhancement of transmural conduction
(“breakthroughs”) during later stages of AF.
In order to investigate the
synchrony and breakthrough rate, a
was developed
brane behavior.
sites. To simulate the whole range between moderate and severe structural
disease, the number of connections
(severe).
synchrony between the two layers. In addition, a positive correlation was
found between transmural conduction and dyssynchrony throughout time in
all simulations.
In conclusion, dyssynchrony between the endo
to breakthroughs and enhances maintenance of AF.
Mutual Influence mural Conduction
A Gharaviri
Maastricht UniversityMaastricht
Atrial fibrillation
multiple fibrillation waves randomly propagating through the complex ana
omy of the atrial wall. AF in itself and structural heart diseases cause stru
tural alterations in the atria favoring local heterogeneities of conduction
impeding
-side connections between muscle bundles
um
tion time
rimental studies have shown an enhancement of transmural conduction
(“breakthroughs”) during later stages of AF.
In order to investigate the
synchrony and breakthrough rate, a
was developed
brane behavior.
sites. To simulate the whole range between moderate and severe structural
disease, the number of connections
(severe).
synchrony between the two layers. In addition, a positive correlation was
found between transmural conduction and dyssynchrony throughout time in
all simulations.
In conclusion, dyssynchrony between the endo
to breakthroughs and enhances maintenance of AF.
Mutual Influence mural Conduction
A Gharaviri
Maastricht UniversityMaastricht
Atrial fibrillation
multiple fibrillation waves randomly propagating through the complex ana
omy of the atrial wall. AF in itself and structural heart diseases cause stru
tural alterations in the atria favoring local heterogeneities of conduction
ng
side connections between muscle bundles
and
tion time between layers and
rimental studies have shown an enhancement of transmural conduction
(“breakthroughs”) during later stages of AF.
In order to investigate the
synchrony and breakthrough rate, a
was developed
brane behavior.
sites. To simulate the whole range between moderate and severe structural
disease, the number of connections
(severe). Reduction of the number of connections l
synchrony between the two layers. In addition, a positive correlation was
found between transmural conduction and dyssynchrony throughout time in
all simulations.
In conclusion, dyssynchrony between the endo
to breakthroughs and enhances maintenance of AF.
Mutual Influence mural Conduction
A Gharaviri
Maastricht UniversityMaastricht,
Atrial fibrillation
multiple fibrillation waves randomly propagating through the complex ana
omy of the atrial wall. AF in itself and structural heart diseases cause stru
tural alterations in the atria favoring local heterogeneities of conduction
ng conduction disturbances
side connections between muscle bundles
and
between layers and
rimental studies have shown an enhancement of transmural conduction
(“breakthroughs”) during later stages of AF.
In order to investigate the
synchrony and breakthrough rate, a
was developed
brane behavior.
sites. To simulate the whole range between moderate and severe structural
disease, the number of connections
Reduction of the number of connections l
synchrony between the two layers. In addition, a positive correlation was
found between transmural conduction and dyssynchrony throughout time in
all simulations.
In conclusion, dyssynchrony between the endo
to breakthroughs and enhances maintenance of AF.
Mutual Influence mural Conduction
A Gharaviri,
Maastricht University, The Netherlands
Atrial fibrillation
multiple fibrillation waves randomly propagating through the complex ana
omy of the atrial wall. AF in itself and structural heart diseases cause stru
tural alterations in the atria favoring local heterogeneities of conduction
conduction disturbances
side connections between muscle bundles
and
between layers and
rimental studies have shown an enhancement of transmural conduction
(“breakthroughs”) during later stages of AF.
In order to investigate the
synchrony and breakthrough rate, a
was developed
brane behavior.
sites. To simulate the whole range between moderate and severe structural
disease, the number of connections
Reduction of the number of connections l
synchrony between the two layers. In addition, a positive correlation was
found between transmural conduction and dyssynchrony throughout time in
all simulations.
In conclusion, dyssynchrony between the endo
to breakthroughs and enhances maintenance of AF.
Mutual Influence mural Conduction
, S Verheule
Maastricht UniversityThe Netherlands
Atrial fibrillation
multiple fibrillation waves randomly propagating through the complex ana
omy of the atrial wall. AF in itself and structural heart diseases cause stru
tural alterations in the atria favoring local heterogeneities of conduction
conduction disturbances
side connections between muscle bundles
and endocardial bundle network
between layers and
rimental studies have shown an enhancement of transmural conduction
(“breakthroughs”) during later stages of AF.
In order to investigate the
synchrony and breakthrough rate, a
was developed
brane behavior.
sites. To simulate the whole range between moderate and severe structural
disease, the number of connections
Reduction of the number of connections l
synchrony between the two layers. In addition, a positive correlation was
found between transmural conduction and dyssynchrony throughout time in
all simulations.
In conclusion, dyssynchrony between the endo
to breakthroughs and enhances maintenance of AF.
Mutual Influence mural Conduction
S Verheule
Maastricht UniversityThe Netherlands
Atrial fibrillation
multiple fibrillation waves randomly propagating through the complex ana
omy of the atrial wall. AF in itself and structural heart diseases cause stru
tural alterations in the atria favoring local heterogeneities of conduction
conduction disturbances
side connections between muscle bundles
ndocardial bundle network
between layers and
rimental studies have shown an enhancement of transmural conduction
(“breakthroughs”) during later stages of AF.
In order to investigate the
synchrony and breakthrough rate, a
was developed composed of 2
brane behavior. The layers were electrically connected at randomly chosen
sites. To simulate the whole range between moderate and severe structural
disease, the number of connections
Reduction of the number of connections l
synchrony between the two layers. In addition, a positive correlation was
found between transmural conduction and dyssynchrony throughout time in
In conclusion, dyssynchrony between the endo
to breakthroughs and enhances maintenance of AF.
Mutual Influence mural Conduction
S Verheule
Maastricht UniversityThe Netherlands
Atrial fibrillation
multiple fibrillation waves randomly propagating through the complex ana
omy of the atrial wall. AF in itself and structural heart diseases cause stru
tural alterations in the atria favoring local heterogeneities of conduction
conduction disturbances
side connections between muscle bundles
ndocardial bundle network
between layers and
rimental studies have shown an enhancement of transmural conduction
(“breakthroughs”) during later stages of AF.
In order to investigate the
synchrony and breakthrough rate, a
composed of 2
The layers were electrically connected at randomly chosen
sites. To simulate the whole range between moderate and severe structural
disease, the number of connections
Reduction of the number of connections l
synchrony between the two layers. In addition, a positive correlation was
found between transmural conduction and dyssynchrony throughout time in
In conclusion, dyssynchrony between the endo
to breakthroughs and enhances maintenance of AF.
Mutual Influence mural Conduction
S Verheule
Maastricht UniversityThe Netherlands
(AF)
multiple fibrillation waves randomly propagating through the complex ana
omy of the atrial wall. AF in itself and structural heart diseases cause stru
tural alterations in the atria favoring local heterogeneities of conduction
conduction disturbances
side connections between muscle bundles
ndocardial bundle network
between layers and
rimental studies have shown an enhancement of transmural conduction
(“breakthroughs”) during later stages of AF.
In order to investigate the
synchrony and breakthrough rate, a
composed of 2
The layers were electrically connected at randomly chosen
sites. To simulate the whole range between moderate and severe structural
disease, the number of connections
Reduction of the number of connections l
synchrony between the two layers. In addition, a positive correlation was
found between transmural conduction and dyssynchrony throughout time in
In conclusion, dyssynchrony between the endo
to breakthroughs and enhances maintenance of AF.
Mutual Influence mural Conduction
S Verheule
Maastricht University The Netherlands
(AF)
multiple fibrillation waves randomly propagating through the complex ana
omy of the atrial wall. AF in itself and structural heart diseases cause stru
tural alterations in the atria favoring local heterogeneities of conduction
conduction disturbances
side connections between muscle bundles
ndocardial bundle network
between layers and
rimental studies have shown an enhancement of transmural conduction
(“breakthroughs”) during later stages of AF.
In order to investigate the
synchrony and breakthrough rate, a
composed of 2
The layers were electrically connected at randomly chosen
sites. To simulate the whole range between moderate and severe structural
disease, the number of connections
Reduction of the number of connections l
synchrony between the two layers. In addition, a positive correlation was
found between transmural conduction and dyssynchrony throughout time in
In conclusion, dyssynchrony between the endo
to breakthroughs and enhances maintenance of AF.
Mutual Influence mural Conduction
S Verheule
The Netherlands
(AF)
multiple fibrillation waves randomly propagating through the complex ana
omy of the atrial wall. AF in itself and structural heart diseases cause stru
tural alterations in the atria favoring local heterogeneities of conduction
conduction disturbances
side connections between muscle bundles
ndocardial bundle network
between layers and
rimental studies have shown an enhancement of transmural conduction
(“breakthroughs”) during later stages of AF.
In order to investigate the
synchrony and breakthrough rate, a
composed of 2
The layers were electrically connected at randomly chosen
sites. To simulate the whole range between moderate and severe structural
disease, the number of connections
Reduction of the number of connections l
synchrony between the two layers. In addition, a positive correlation was
found between transmural conduction and dyssynchrony throughout time in
In conclusion, dyssynchrony between the endo
to breakthroughs and enhances maintenance of AF.
Mutual Influence between Dyssynchrony and Tranmural Conduction maintains
S Verheule,
The Netherlands
(AF) is a common arrhythmia and
multiple fibrillation waves randomly propagating through the complex ana
omy of the atrial wall. AF in itself and structural heart diseases cause stru
tural alterations in the atria favoring local heterogeneities of conduction
conduction disturbances
side connections between muscle bundles
ndocardial bundle network
between layers and
rimental studies have shown an enhancement of transmural conduction
(“breakthroughs”) during later stages of AF.
In order to investigate the
synchrony and breakthrough rate, a
composed of 2
The layers were electrically connected at randomly chosen
sites. To simulate the whole range between moderate and severe structural
disease, the number of connections
Reduction of the number of connections l
synchrony between the two layers. In addition, a positive correlation was
found between transmural conduction and dyssynchrony throughout time in
In conclusion, dyssynchrony between the endo
to breakthroughs and enhances maintenance of AF.
between Dyssynchrony and Tranmaintains
NHL Kuijpers, U Schotten
The Netherlands
is a common arrhythmia and
multiple fibrillation waves randomly propagating through the complex ana
omy of the atrial wall. AF in itself and structural heart diseases cause stru
tural alterations in the atria favoring local heterogeneities of conduction
conduction disturbances
side connections between muscle bundles
ndocardial bundle network
between layers and transmural con
rimental studies have shown an enhancement of transmural conduction
(“breakthroughs”) during later stages of AF.
In order to investigate the mutual influence
synchrony and breakthrough rate, a
composed of 2
The layers were electrically connected at randomly chosen
sites. To simulate the whole range between moderate and severe structural
disease, the number of connections
Reduction of the number of connections l
synchrony between the two layers. In addition, a positive correlation was
found between transmural conduction and dyssynchrony throughout time in
In conclusion, dyssynchrony between the endo
to breakthroughs and enhances maintenance of AF.
between Dyssynchrony and Tranmaintains
NHL Kuijpers, U Schotten
The Netherlands
is a common arrhythmia and
multiple fibrillation waves randomly propagating through the complex ana
omy of the atrial wall. AF in itself and structural heart diseases cause stru
tural alterations in the atria favoring local heterogeneities of conduction
conduction disturbances
side connections between muscle bundles
ndocardial bundle network
transmural con
rimental studies have shown an enhancement of transmural conduction
(“breakthroughs”) during later stages of AF.
mutual influence
synchrony and breakthrough rate, a
composed of 2
The layers were electrically connected at randomly chosen
sites. To simulate the whole range between moderate and severe structural
disease, the number of connections
Reduction of the number of connections l
synchrony between the two layers. In addition, a positive correlation was
found between transmural conduction and dyssynchrony throughout time in
In conclusion, dyssynchrony between the endo
to breakthroughs and enhances maintenance of AF.
between Dyssynchrony and Tranmaintains
NHL Kuijpers, U Schotten
is a common arrhythmia and
multiple fibrillation waves randomly propagating through the complex ana
omy of the atrial wall. AF in itself and structural heart diseases cause stru
tural alterations in the atria favoring local heterogeneities of conduction
conduction disturbances
side connections between muscle bundles
ndocardial bundle network
transmural con
rimental studies have shown an enhancement of transmural conduction
(“breakthroughs”) during later stages of AF.
mutual influence
synchrony and breakthrough rate, a
composed of 2 connected
The layers were electrically connected at randomly chosen
sites. To simulate the whole range between moderate and severe structural
disease, the number of connections
Reduction of the number of connections l
synchrony between the two layers. In addition, a positive correlation was
found between transmural conduction and dyssynchrony throughout time in
In conclusion, dyssynchrony between the endo
to breakthroughs and enhances maintenance of AF.
between Dyssynchrony and Tranmaintains
NHL Kuijpers, U Schotten
is a common arrhythmia and
multiple fibrillation waves randomly propagating through the complex ana
omy of the atrial wall. AF in itself and structural heart diseases cause stru
tural alterations in the atria favoring local heterogeneities of conduction
conduction disturbances
side connections between muscle bundles
ndocardial bundle network
transmural con
rimental studies have shown an enhancement of transmural conduction
(“breakthroughs”) during later stages of AF.
mutual influence
synchrony and breakthrough rate, a
connected
The layers were electrically connected at randomly chosen
sites. To simulate the whole range between moderate and severe structural
disease, the number of connections
Reduction of the number of connections l
synchrony between the two layers. In addition, a positive correlation was
found between transmural conduction and dyssynchrony throughout time in
In conclusion, dyssynchrony between the endo
to breakthroughs and enhances maintenance of AF.
between Dyssynchrony and Tranmaintains
NHL Kuijpers, U Schotten
is a common arrhythmia and
multiple fibrillation waves randomly propagating through the complex ana
omy of the atrial wall. AF in itself and structural heart diseases cause stru
tural alterations in the atria favoring local heterogeneities of conduction
conduction disturbances.
side connections between muscle bundles
ndocardial bundle network
transmural con
rimental studies have shown an enhancement of transmural conduction
(“breakthroughs”) during later stages of AF.
mutual influence
synchrony and breakthrough rate, a
connected
The layers were electrically connected at randomly chosen
sites. To simulate the whole range between moderate and severe structural
disease, the number of connections was varied
Reduction of the number of connections l
synchrony between the two layers. In addition, a positive correlation was
found between transmural conduction and dyssynchrony throughout time in
In conclusion, dyssynchrony between the endo
to breakthroughs and enhances maintenance of AF.
between Dyssynchrony and Tranmaintains
NHL Kuijpers, U Schotten
is a common arrhythmia and
multiple fibrillation waves randomly propagating through the complex ana
omy of the atrial wall. AF in itself and structural heart diseases cause stru
tural alterations in the atria favoring local heterogeneities of conduction
Conduction disturbances
side connections between muscle bundles
ndocardial bundle network
transmural con
rimental studies have shown an enhancement of transmural conduction
(“breakthroughs”) during later stages of AF.
mutual influence
synchrony and breakthrough rate, a mono
connected
The layers were electrically connected at randomly chosen
sites. To simulate the whole range between moderate and severe structural
was varied
Reduction of the number of connections l
synchrony between the two layers. In addition, a positive correlation was
found between transmural conduction and dyssynchrony throughout time in
In conclusion, dyssynchrony between the endo
to breakthroughs and enhances maintenance of AF.
between Dyssynchrony and Tranmaintains
NHL Kuijpers, U Schotten
is a common arrhythmia and
multiple fibrillation waves randomly propagating through the complex ana
omy of the atrial wall. AF in itself and structural heart diseases cause stru
tural alterations in the atria favoring local heterogeneities of conduction
Conduction disturbances
side connections between muscle bundles
ndocardial bundle network
transmural con
rimental studies have shown an enhancement of transmural conduction
(“breakthroughs”) during later stages of AF.
mutual influence
mono
connected
The layers were electrically connected at randomly chosen
sites. To simulate the whole range between moderate and severe structural
was varied
Reduction of the number of connections l
synchrony between the two layers. In addition, a positive correlation was
found between transmural conduction and dyssynchrony throughout time in
In conclusion, dyssynchrony between the endo
to breakthroughs and enhances maintenance of AF.
between Dyssynchrony and Tranmaintains Atrial Fibrillation
NHL Kuijpers, U Schotten
is a common arrhythmia and
multiple fibrillation waves randomly propagating through the complex ana
omy of the atrial wall. AF in itself and structural heart diseases cause stru
tural alterations in the atria favoring local heterogeneities of conduction
Conduction disturbances
side connections between muscle bundles
ndocardial bundle network. This
transmural con
rimental studies have shown an enhancement of transmural conduction
(“breakthroughs”) during later stages of AF.
mutual influence
mono
connected
The layers were electrically connected at randomly chosen
sites. To simulate the whole range between moderate and severe structural
was varied
Reduction of the number of connections l
synchrony between the two layers. In addition, a positive correlation was
found between transmural conduction and dyssynchrony throughout time in
In conclusion, dyssynchrony between the endo
to breakthroughs and enhances maintenance of AF.
between Dyssynchrony and TranAtrial Fibrillation
NHL Kuijpers, U Schotten
is a common arrhythmia and
multiple fibrillation waves randomly propagating through the complex ana
omy of the atrial wall. AF in itself and structural heart diseases cause stru
tural alterations in the atria favoring local heterogeneities of conduction
Conduction disturbances
side connections between muscle bundles
. This
transmural con
rimental studies have shown an enhancement of transmural conduction
(“breakthroughs”) during later stages of AF.
mutual influence
monodomain reaction
connected layers with realistic atrial me
The layers were electrically connected at randomly chosen
sites. To simulate the whole range between moderate and severe structural
was varied
Reduction of the number of connections l
synchrony between the two layers. In addition, a positive correlation was
found between transmural conduction and dyssynchrony throughout time in
In conclusion, dyssynchrony between the endo
to breakthroughs and enhances maintenance of AF.
between Dyssynchrony and TranAtrial Fibrillation
NHL Kuijpers, U Schotten
is a common arrhythmia and
multiple fibrillation waves randomly propagating through the complex ana
omy of the atrial wall. AF in itself and structural heart diseases cause stru
tural alterations in the atria favoring local heterogeneities of conduction
Conduction disturbances
side connections between muscle bundles
. This
transmural conduction
rimental studies have shown an enhancement of transmural conduction
mutual influence
domain reaction
layers with realistic atrial me
The layers were electrically connected at randomly chosen
sites. To simulate the whole range between moderate and severe structural
was varied
Reduction of the number of connections l
synchrony between the two layers. In addition, a positive correlation was
found between transmural conduction and dyssynchrony throughout time in
In conclusion, dyssynchrony between the endo
to breakthroughs and enhances maintenance of AF.
between Dyssynchrony and TranAtrial Fibrillation
NHL Kuijpers, U Schotten
is a common arrhythmia and
multiple fibrillation waves randomly propagating through the complex ana
omy of the atrial wall. AF in itself and structural heart diseases cause stru
tural alterations in the atria favoring local heterogeneities of conduction
Conduction disturbances
side connections between muscle bundles
. This
duction
rimental studies have shown an enhancement of transmural conduction
mutual influence
domain reaction
layers with realistic atrial me
The layers were electrically connected at randomly chosen
sites. To simulate the whole range between moderate and severe structural
was varied
Reduction of the number of connections l
synchrony between the two layers. In addition, a positive correlation was
found between transmural conduction and dyssynchrony throughout time in
In conclusion, dyssynchrony between the endo
to breakthroughs and enhances maintenance of AF.
between Dyssynchrony and TranAtrial Fibrillation
NHL Kuijpers, U Schotten
is a common arrhythmia and
multiple fibrillation waves randomly propagating through the complex ana
omy of the atrial wall. AF in itself and structural heart diseases cause stru
tural alterations in the atria favoring local heterogeneities of conduction
Conduction disturbances
side connections between muscle bundles
leads to
duction
rimental studies have shown an enhancement of transmural conduction
between
domain reaction
layers with realistic atrial me
The layers were electrically connected at randomly chosen
sites. To simulate the whole range between moderate and severe structural
between 48 (moderate) and 6
Reduction of the number of connections l
synchrony between the two layers. In addition, a positive correlation was
found between transmural conduction and dyssynchrony throughout time in
In conclusion, dyssynchrony between the endo
to breakthroughs and enhances maintenance of AF.
between Dyssynchrony and TranAtrial Fibrillation
NHL Kuijpers, U Schotten
is a common arrhythmia and
multiple fibrillation waves randomly propagating through the complex ana
omy of the atrial wall. AF in itself and structural heart diseases cause stru
tural alterations in the atria favoring local heterogeneities of conduction
Conduction disturbances
side connections between muscle bundles, but also
leads to
duction
rimental studies have shown an enhancement of transmural conduction
between
domain reaction
layers with realistic atrial me
The layers were electrically connected at randomly chosen
sites. To simulate the whole range between moderate and severe structural
between 48 (moderate) and 6
Reduction of the number of connections l
synchrony between the two layers. In addition, a positive correlation was
found between transmural conduction and dyssynchrony throughout time in
In conclusion, dyssynchrony between the endo-
to breakthroughs and enhances maintenance of AF.
between Dyssynchrony and TranAtrial Fibrillation
NHL Kuijpers, U Schotten
is a common arrhythmia and
multiple fibrillation waves randomly propagating through the complex ana
omy of the atrial wall. AF in itself and structural heart diseases cause stru
tural alterations in the atria favoring local heterogeneities of conduction
Conduction disturbances
, but also
leads to
duction
rimental studies have shown an enhancement of transmural conduction
between
domain reaction
layers with realistic atrial me
The layers were electrically connected at randomly chosen
sites. To simulate the whole range between moderate and severe structural
between 48 (moderate) and 6
Reduction of the number of connections led to an increase in dy
synchrony between the two layers. In addition, a positive correlation was
found between transmural conduction and dyssynchrony throughout time in
and epicardial layers
to breakthroughs and enhances maintenance of AF.
between Dyssynchrony and TranAtrial Fibrillation
NHL Kuijpers, U Schotten
is a common arrhythmia and
multiple fibrillation waves randomly propagating through the complex ana
omy of the atrial wall. AF in itself and structural heart diseases cause stru
tural alterations in the atria favoring local heterogeneities of conduction
Conduction disturbances
, but also
leads to
duction. B
rimental studies have shown an enhancement of transmural conduction
between
domain reaction
layers with realistic atrial me
The layers were electrically connected at randomly chosen
sites. To simulate the whole range between moderate and severe structural
between 48 (moderate) and 6
ed to an increase in dy
synchrony between the two layers. In addition, a positive correlation was
found between transmural conduction and dyssynchrony throughout time in
and epicardial layers
between Dyssynchrony and TranAtrial Fibrillation
NHL Kuijpers, U Schotten
is a common arrhythmia and
multiple fibrillation waves randomly propagating through the complex ana
omy of the atrial wall. AF in itself and structural heart diseases cause stru
tural alterations in the atria favoring local heterogeneities of conduction
Conduction disturbances
, but also
leads to
Both clinical and exp
rimental studies have shown an enhancement of transmural conduction
between
domain reaction
layers with realistic atrial me
The layers were electrically connected at randomly chosen
sites. To simulate the whole range between moderate and severe structural
between 48 (moderate) and 6
ed to an increase in dy
synchrony between the two layers. In addition, a positive correlation was
found between transmural conduction and dyssynchrony throughout time in
and epicardial layers
between Dyssynchrony and TranAtrial Fibrillation
NHL Kuijpers, U Schotten
is a common arrhythmia and
multiple fibrillation waves randomly propagating through the complex ana
omy of the atrial wall. AF in itself and structural heart diseases cause stru
tural alterations in the atria favoring local heterogeneities of conduction
Conduction disturbances
, but also
leads to differences in
oth clinical and exp
rimental studies have shown an enhancement of transmural conduction
between e
domain reaction
layers with realistic atrial me
The layers were electrically connected at randomly chosen
sites. To simulate the whole range between moderate and severe structural
between 48 (moderate) and 6
ed to an increase in dy
synchrony between the two layers. In addition, a positive correlation was
found between transmural conduction and dyssynchrony throughout time in
and epicardial layers
between Dyssynchrony and TranAtrial Fibrillation
is a common arrhythmia and is
multiple fibrillation waves randomly propagating through the complex ana
omy of the atrial wall. AF in itself and structural heart diseases cause stru
tural alterations in the atria favoring local heterogeneities of conduction
Conduction disturbances
, but also
differences in
oth clinical and exp
rimental studies have shown an enhancement of transmural conduction
endo
domain reaction
layers with realistic atrial me
The layers were electrically connected at randomly chosen
sites. To simulate the whole range between moderate and severe structural
between 48 (moderate) and 6
ed to an increase in dy
synchrony between the two layers. In addition, a positive correlation was
found between transmural conduction and dyssynchrony throughout time in
and epicardial layers
between Dyssynchrony and TranAtrial Fibrillation
is
multiple fibrillation waves randomly propagating through the complex ana
omy of the atrial wall. AF in itself and structural heart diseases cause stru
tural alterations in the atria favoring local heterogeneities of conduction
Conduction disturbances
, but also
differences in
oth clinical and exp
rimental studies have shown an enhancement of transmural conduction
ndo
domain reaction
layers with realistic atrial me
The layers were electrically connected at randomly chosen
sites. To simulate the whole range between moderate and severe structural
between 48 (moderate) and 6
ed to an increase in dy
synchrony between the two layers. In addition, a positive correlation was
found between transmural conduction and dyssynchrony throughout time in
and epicardial layers
between Dyssynchrony and TranAtrial Fibrillation
is characterized by
multiple fibrillation waves randomly propagating through the complex ana
omy of the atrial wall. AF in itself and structural heart diseases cause stru
tural alterations in the atria favoring local heterogeneities of conduction
Conduction disturbances
between
differences in
oth clinical and exp
rimental studies have shown an enhancement of transmural conduction
ndo-
domain reaction-diffusion
layers with realistic atrial me
The layers were electrically connected at randomly chosen
sites. To simulate the whole range between moderate and severe structural
between 48 (moderate) and 6
ed to an increase in dy
synchrony between the two layers. In addition, a positive correlation was
found between transmural conduction and dyssynchrony throughout time in
and epicardial layers
between Dyssynchrony and TranAtrial Fibrillation
characterized by
multiple fibrillation waves randomly propagating through the complex ana
omy of the atrial wall. AF in itself and structural heart diseases cause stru
tural alterations in the atria favoring local heterogeneities of conduction
Conduction disturbances
between
differences in
oth clinical and exp
rimental studies have shown an enhancement of transmural conduction
-epicardial dy
diffusion
layers with realistic atrial me
The layers were electrically connected at randomly chosen
sites. To simulate the whole range between moderate and severe structural
between 48 (moderate) and 6
ed to an increase in dy
synchrony between the two layers. In addition, a positive correlation was
found between transmural conduction and dyssynchrony throughout time in
and epicardial layers
between Dyssynchrony and TranAtrial Fibrillation
characterized by
multiple fibrillation waves randomly propagating through the complex ana
omy of the atrial wall. AF in itself and structural heart diseases cause stru
tural alterations in the atria favoring local heterogeneities of conduction
Conduction disturbances can occur in
between
differences in
oth clinical and exp
rimental studies have shown an enhancement of transmural conduction
epicardial dy
diffusion
layers with realistic atrial me
The layers were electrically connected at randomly chosen
sites. To simulate the whole range between moderate and severe structural
between 48 (moderate) and 6
ed to an increase in dy
synchrony between the two layers. In addition, a positive correlation was
found between transmural conduction and dyssynchrony throughout time in
and epicardial layers
between Dyssynchrony and Tran
characterized by
multiple fibrillation waves randomly propagating through the complex ana
omy of the atrial wall. AF in itself and structural heart diseases cause stru
tural alterations in the atria favoring local heterogeneities of conduction
can occur in
between the
differences in
oth clinical and exp
rimental studies have shown an enhancement of transmural conduction
epicardial dy
diffusion
layers with realistic atrial me
The layers were electrically connected at randomly chosen
sites. To simulate the whole range between moderate and severe structural
between 48 (moderate) and 6
ed to an increase in dy
synchrony between the two layers. In addition, a positive correlation was
found between transmural conduction and dyssynchrony throughout time in
and epicardial layers
between Dyssynchrony and Tran
characterized by
multiple fibrillation waves randomly propagating through the complex ana
omy of the atrial wall. AF in itself and structural heart diseases cause stru
tural alterations in the atria favoring local heterogeneities of conduction
can occur in
the
differences in activ
oth clinical and exp
rimental studies have shown an enhancement of transmural conduction
epicardial dy
diffusion model
layers with realistic atrial me
The layers were electrically connected at randomly chosen
sites. To simulate the whole range between moderate and severe structural
between 48 (moderate) and 6
ed to an increase in dy
synchrony between the two layers. In addition, a positive correlation was
found between transmural conduction and dyssynchrony throughout time in
and epicardial layers
between Dyssynchrony and Tran
characterized by
multiple fibrillation waves randomly propagating through the complex ana
omy of the atrial wall. AF in itself and structural heart diseases cause stru
tural alterations in the atria favoring local heterogeneities of conduction,
can occur in
the
activ
oth clinical and exp
rimental studies have shown an enhancement of transmural conduction
epicardial dy
model
layers with realistic atrial me
The layers were electrically connected at randomly chosen
sites. To simulate the whole range between moderate and severe structural
between 48 (moderate) and 6
ed to an increase in dy
synchrony between the two layers. In addition, a positive correlation was
found between transmural conduction and dyssynchrony throughout time in
and epicardial layers leads
between Dyssynchrony and Tran
characterized by
multiple fibrillation waves randomly propagating through the complex ana
omy of the atrial wall. AF in itself and structural heart diseases cause stru
thus
can occur in
the ep
activ
oth clinical and exp
rimental studies have shown an enhancement of transmural conduction
epicardial dy
model
layers with realistic atrial me
The layers were electrically connected at randomly chosen
sites. To simulate the whole range between moderate and severe structural
between 48 (moderate) and 6
ed to an increase in dy
synchrony between the two layers. In addition, a positive correlation was
found between transmural conduction and dyssynchrony throughout time in
leads
between Dyssynchrony and Trans-
characterized by
multiple fibrillation waves randomly propagating through the complex anat-
omy of the atrial wall. AF in itself and structural heart diseases cause struc-
thus
can occur in
epi-
activa-
oth clinical and expe-
rimental studies have shown an enhancement of transmural conduction
epicardial dys-
model
layers with realistic atrial mem-
The layers were electrically connected at randomly chosen
sites. To simulate the whole range between moderate and severe structural
between 48 (moderate) and 6
ed to an increase in dys-
synchrony between the two layers. In addition, a positive correlation was
found between transmural conduction and dyssynchrony throughout time in
leads
s-
characterized by
t-
c-
thus
can occur in
i-
a-
e-
rimental studies have shown an enhancement of transmural conduction
s-
model
m-
The layers were electrically connected at randomly chosen
sites. To simulate the whole range between moderate and severe structural
between 48 (moderate) and 6
s-
synchrony between the two layers. In addition, a positive correlation was
found between transmural conduction and dyssynchrony throughout time in
leads
characterized by
thus
can occur in
rimental studies have shown an enhancement of transmural conduction
model
The layers were electrically connected at randomly chosen
sites. To simulate the whole range between moderate and severe structural
between 48 (moderate) and 6
synchrony between the two layers. In addition, a positive correlation was
found between transmural conduction and dyssynchrony throughout time in
leads
PA6
252 Computing in Cardiology 2012, Kraków, Poland
Noninvasive Estimation of the Activation Sequence in the Atria during Sinus Rhythm and Atrial Tachyarrhythmia
Jorge Pedron-Torrecilla*, Andreu M. Climent, Alejandro Liberos, Esther Pérez-David, José Millet, Felipe Atienza and Maria S Guillem
Bio-ITACA, Universitat Politècnica de València Valencia, Spain
Aim: Ablation procedures have become one of the most efficient
treatments for termination of atrial arrhythmias. Prior knowledge of the region of the atria responsible of the maintenance of the arrhythmia may be useful for procedure planning. The aim of the present study is the evaluation of the potential use of noninvasive imaging as a clinical tool for the identification of atrial tachycardia origin prior to an ablation procedure.
Methods: Real recordings and mathematical simulations were used to solve the inverse problem of the electrocardiology during atrial pacing. Mathematical models were used to validate the presented methodology: 5697 simulated electrograms estimated from a realistic 3D atrial model were used to compute the forward problem and compared to the solution of the inverse problem. Additionally, noninvasive recordings were used to estimate the epicardial activity from a patient under (1) sinus rhythm and (2) atrial tachycardia by pacing from a left superior pulmonary vein. Simultaneous 67-lead body surface potential recordings and 15 intracardiac electrograms from both atria were recorded. Atria and torso geometry were reconstructed from computed axial tomography and used to estimate epicardial signals. Isochronal maps of epicardial propagation patterns were measured from computed electrograms and compared with intracardiac recordings.
Results: The validation of the inverse problem by using a realistic atrial model showed accurate results in the pacing site location, with an error of 7mm, and in the reconstruction of activation sequence, with an error of 2.19±10.58ms. Reconstructed activation sequences in real recordings were also consistent with recorded electrograms. Measured and estimated activation time differences between right and left atria were 93ms and 102ms during sinus rhythm respectively and 81ms and 72ms respectively during left atrial pacing.
Conclusion: Noninvasive imaging allows the location of pacing sites in the atria and may help in planning ablation procedures
.
PA6
Computing in Cardiology 2012, Kraków, Poland 253
A Simulation Tool to Assess the Pro-arrhythmic Potential of Ion Channel Blockers Beatriz Trenor , Julio Gomis-Tena, Jose M Ferrero*, Sridharan Rajamani, Luiz Belardinelli, Javier Saiz Universitat Politècnica de València,Valencia, Spain
Introduction: Under pathological conditions, such as LQT3, drugs that
selectively block late Na+ current (INaL) exert antiarrhythmic effects by
reducing action potential duration (APD). Some of these compounds also
block the delayed rectifier K+ current (IKr) which exert an opposite effect.
Using a computational model, this study was designed to determine the
preclinical safety assessment of ranolazine and two experimental compounds
with multi-ion channel blocking properties.
Methods: The effects of ranolazine and two experimental compounds (A
and B) blocking INaL and IKr in LQT3 (with enhanced INaL) on APD (Figure)
and QT interval were tested. The different degrees of drug selectivity were
given by its half maximal inhibitory concentration (IC50) relative to INaL and
IKr. Using the O’Hara et al. AP model for human ventricular myocytes, APDs
and QT intervals were calculated in cellular
and 1-D tissue simulation, respectively.
Results: Safety plots were represented
in a gray scale with respective APDs (see
figure) and QT intervals that correspond to
different combinations of IC50s for IKr and
INaL, for a concentration of 5 µM of
potential drugs. The reference APDs and
QT intervals (100%) corresponding to a
pathological condition (enhanced INaL),
were shortened or prolonged depending on
the IC50s of the drugs. APD safety plot
Drugs with increasing selectivity for INaL block: compound B (triangle) >
compound A (square) > ranolazine (circle) yielded 20, 10, or 0% (100% of
control) APD or QT interval shortening, respectively, that would be
considered safe. However, drugs positioned in the dark zones, where APD
and QT interval are prolonged would be potentially unsafe.
Conclusions: This in-silico model appears to be useful in predicting
proarrhythmic potential of drugs, and may be suitable for preliminary
screening and drug design.
PA6
254 Computing in Cardiology 2012, Kraków, Poland

Renyi Entropy in Identification of Cardiac Autonomic Neuropathy in Diabetes Herbert F. Jelinek
1, Mika P. Tarvainen
2,3, David J. Cornforth
4
1Charles Sturt University, Albury, Australia;
2University of Eastern Finland,
Kuopio, Finland; 3Kuopio University Hospital, Kuopio, Finland;
4University of
Newcastle, Newcastle, Australia
Heart rate variability (HRV) has been conventionally analysed with time-
and frequency-domain methods. More recent nonlinear analysis has shown an
increased sensitivity for identifying risk of future morbidity and mortality in
cardiac patients. Included in the domain of nonlinear analysis are the mul-
tiscale entropy measures. The Renyi entropy is a measure that does not take
the order of data points along the time axis but rather provides the probability
of certain values above or below a certain threshold occurring and describes
the complexity of the probability distribution of these points. One application
where the Renyi entropy has provided good results is the detection of abnor-
mal cardiac rhythms, such as atrial fibrillation.
Here we apply the multiscale Renyi entropy for identification of cardiac
autonomic neuropathy (CAN) in diabetes patients obtained at the Charles
Sturt University Diabetes Complications Screening Clinic, Australia. Partici-
pants with severe heart disease, presence of a pacemaker, kidney disease or
polypharmacy including multiple arrhythmic medications were excluded.
Fifteen participants were identified with CAN (dCAN) using the five-test
Ewing battery and 26 were control (nCAN). Lead II ECGs were recorded
using a Maclab Pro with Chart 5 software (ADInstruments) for 20 minutes
and beat-to-beat RR intervals were analysed. The multiscale Renyi entropy
was measured from -5<q<+5, where q=1 is the Shannon entropy and q=2 is
the squared entropy. The best results were obtained using the positive spec-
trum with q=5 being the best discriminator for dCAN versus nCAN (mean+/-
SD, 0.98+/-0.01 and 0.95+/-0.02, p=2.7E-8 respectively).
Many HRV measures have been suggested in the past, however different
pathologies have certain specific features in the ECG and HRV and therefore
no single HRV test should be expected to be ideal for all pathologies. The
multiscale Renyi Entropy performs at a high level of accuracy and should be
included as a neuroendocrine test for CAN.
PA7
Computing in Cardiology 2012, Kraków, Poland 255

Changes in Heart Rate Variability indexes due to drowsiness in professional drivers measured in a real environment
Noelia Rodriguez-Ibañez*, Miguel Angel Garcia-Gonzalez, Maria Aurora Filigrana de la Cruz, Mireya Fernandez-Chimeno and Juan Ramos-Castro
Universitat Politècnica de Catalunya (UPC) Barcelona, Spain
Aims: The study aimed to assess the changes in Heart Rate Variability
(HRV) indexes in healthy subjects while driving in a real environment in order to detect drowsiness.
Methods: The ECG of ten professional drivers was acquired while driving on routes familiar to the subjects. The drivers were free to stop to rest. RR time series were quantified using a sliding window of 300 beats. Mean (mRR), standard deviation (SDNN), standard deviation of the differentiated time series (rmsDD), power of the low (LF) and high (HF) frequency bands as well as the ratio LF/HF were computed. In addition, the median frequency of the power spectrum (MEDF), the bandwidth that contains the 50% of the power (BW50) and a measure of the asymmetry of the spectrum (AFS) were obtained. Moreover, the Hurst exponent estimated by fractional differintegration (HFDI) and the short scaling exponent obtained by detrended fluctuation analysis (alph1) were computed. Two observers classified the state of the drivers minute by minute by inspection of video recordings as alert or drowsy driver.
Results: A total of 37.2 hours of ECG were analyzed. Five subjects were alert for the whole recording while the others presented one or more periods of drowsiness in seven recordings between resting stops. Intersubject indexes variability make impossible to distinguish both groups. Nevertheless paired tests for the recordings with drowsy states comparing the difference (drowsy minus alert states) of the mean of each index for each state show significant differences (p<0.05) for some indexes. Mean differences in order of significance are: SDNN 10.0 ms, HFDI 0.11, mRR 38.4 ms, BW50 -0.039 Hz, AFS 8.25, alph1 0.07, LF/HF 1.14 and MEDF -0.016 Hz.
Conclusion: No analyzed index can predict which subject may present drowsiness although intrasubject comparisons between states show significant differences in several indexes
.
PA7
256 Computing in Cardiology 2012, Kraków, Poland

Stability of Variability Features Computed from Fetal Heart Rate with Artificially Infused Missing Data
Jiří Spilka*, Václav Chudáček, Miroslav Burša, Lenka Lhotská, Petr Janků and Lukáš Hruban
Czech Technical University in Prague Praha 6, Czech Republic
Fetal heart rate (FHR) is used together with uterine contractions in the
form of cardiotocography measurementfor fetal surveillance . FHR is the sole information channel available during the delivery for obstetricians ; therefore, any distortion to the FHR signal that subsequently distorts features used for the FHR description could be crucial for obstetricians decision making as well as for automatic evaluation. In this paper, we focused on FHR distortion, caused by variety of reasons, e.g. fetal or maternal movements, misplaced electrode etc.), leading to a missing signal. Even though the missing intrapartum FHR is common (0 - 40% missing for ultrasound measurement and 0 – 10% for the direct measurement), there are no guidelines stating when a signal is unusable . Usual empirical value given by clinicians is 50%, though there is no evidence of effect of such a distortion on the commonly used indices for FHR evaluation. In the presented paper we have evaluated several short term variability indices used for FHR assessment, including:.Arduni, Dalton, Sonicaid8000, Van Geijn, and Yeh. We computed the variability of the undistorted signal and then added artificial distortion (missing samples) in different patterns (up to 5000 combination, when possible) and percentage (0-50%). The stability of short term variability indicies were almost identical. Their values decreased almost linearly with growing percentage of missing data. With the modest distortion of 20 % indicies decreased up to 85% of their nominal value, and for 40% distortion up to 70%. It is necessary to point out that such results, although technically correct, does not have to imply clinical significance that would be based on the probability in which the otherwise considered normal pattern would skip (through the lack of the information) to the pathological group. Evaluation of this phenomenon is presented in the full paper
.
PA7
Computing in Cardiology 2012, Kraków, Poland 257
Real-time Preprocessing and Estimation of the Spec-tral Parameters of Heart Rate Variability Series K Kudryński, P Strumiłło
Institute of Electronics, Łódź University of Technology, Poland
Heart rate variability (HRV) analysis provides means to measure neural system responsiveness. Its usefulness in tracking of changes in sympathova-gal balance during the registration is conditioned on the availability of real-time methods. Adaptation of the algorithms for HRV preprocessing and spec-tral parameters estimation necessary for real-time analysis are presented.
The preprocessing steps required for proper establishment of the powers contained in low (LF) and high (HF) frequency of the HRV spectrum include prior artifact correction, interpolation and resampling. Offline analysis ena-bles usage of non-causal methods of preprocessing. In real-time analysis, there is no access to future samples. The suggested modification to tradition-al methods is a replacement of spline by Akima interpolation with artifacts eliminated and interpolated into the gap. The instantaneous LF and HF pa-rameters are established by applying a modified Hilbert Huang Transform (HHT) and a Short Time Fourier Transform (STFT). The results are verified on a set of simulated RR series generated from the IPFM model driven by changing parameters and on 40 recordings taken during exercise tests includ-ing body position changes, hand grip and deep breath.
HRV series interpolated using Akima method is continuous up to 2nd de-rivative. Such result is obtained with a delay of only 2 heart beat intervals, while in case of spline interpolation accepta-ble results are ob-tained with the delay of more than 5 heart beat intervals. A mod-ified HHT enables detection of simulated changes in LF and HF power in approxi-mately 11,5s and 8,5s correspondingly while STFT requires about 50% more time. For the both methods the relative root mean square error (RMSE) of the results with respect to the parameters driving the simulation is less than 3%.
Instantaneous frequencies and powers of LF and HF components established using the proposed method
PA7
258 Computing in Cardiology 2012, Kraków, Poland

Multifractal Properties Assessment at the Very Low Frequency Range in Subjects with Different Progress of Aortic Valve Stenosis Disease
Jan Gierałtowski, Jan Jacek Żebrowski, Ewa Orłowska-Baranowska, Rafał Baranowski and Teodor Buchner*
Warsaw University of Technology
Poland
Aortic valve stenosis is the third commonest heart disease in developed
countries. When the opening of the aortic valve is narrowed, the ability of the heart to pump blood is severely limited. This inhibits the ability of the circulation system to adapt to changing external requirements. This can drastically change state of the nonlinear system and therefore should be clearly visible in signals coming from it. Aortic valve replacement is connected with a high non-postoperative mortality. It would be interesting to predict the mortality risk based on pre-operative heart rate variability properties. We analyzed 418 heart rate variability recordings from subjects before the operation, who had different stages of aortic valve stenosis (age 22-82, male and female, ejection fraction 10-95%). In our analysis, besides classical linear heart rate variability measures and echocardiography, we applied Multiscale Multifractal Analysis (MMA) [1] – a method yielding the dependence of the local Hurst exponent as a function of the parameter q and of the scale (the Hurst surface). It is designed to analyze correlation properties of the signal at very low frequencies. We discuss characteristic patterns in the shape of the Hurst surface and abnormalities in heart rate variability of the patients and observe important changes in comparison with the Hurst surface obtained for a group of healthy subjects analyzed in our earlier studies. However, no well-defined correlation of the properties of the Hurst surface with the level of ejection fraction were obtained. [1] J. Gierałtowski, J. J. Żebrowski and R. Baranowski, Phys. Rev. E 85, 021915 (2012
)
PA7
Computing in Cardiology 2012, Kraków, Poland 259

A Novel Index Based on Fractional Calculus to Assess the Dynamics of Heart Rate Variability: Changes due to Chi or Yoga Meditations
Miguel Angel Garcia-Gonzalez*, Juan Ramos-Castro and Mireya Fernandez-Chimeno
Universitat Politècnica de Catalunya Barcelona, Spain
Aims: The study aimed to present and interpret a novel index based on
fractional calculus (ALPHC) and to assess differences in RR time series dynamics in subjects during meditation. Index proposal: Fractional differintegration (FDI) of a RR time series provides a new time series. ALPHC was defined as the order of the FDI that provides the time series with minimum variance. In self-similar time series, ALPHC is linearly related with the scaling exponent hence ALPHC can be regarded as a quantifier of self-similarity.
Methods: Time series were obtained from the Exaggerated Heart Rate Oscillations During Two Meditation Techniques database available at www.physionet.org. This database contains RR time series before and after Chi Meditation (8 subjects, CH group) and Kundalini Yoga (4 subjects,Y group). It also contains recordings of elite athletes while sleeping (9 subjects, I group), of healthy volunteers while sleeping (11 subjects, SL group) and during metronomic breathing at 0.25 Hz (14 subjects, PB group). Because recordings have different lengths, a Lagrange Multiplier statistic (LM) recognized segments of 1000 beats with maximum stability of the mean inside all the time series in CH, I and SL groups. ALPHC was computed for these segments and the whole recordings of Y and PB groups.
Results: Mean (Standard Deviation) of ALPHC was 0.71 (0.19) for CH before meditation and 1.14 (0.30) during meditation, 0.66 (0.16) for Y before meditation and 1.32 (0.25) during meditation, 0.44 (0.22) for I, 0.58 (0.39) for SL and 0.47 (0.26) for PB. Statistical tests show very significant changes in ALPHC when comparing before and during meditation recordings and when comparing during meditation and I, PB and SL groups.
Conclusion: ALPHC is significantly higher during Chi or Yoga meditation when compared with the recordings before the meditation starts or in subjects while sleeping or during metronomic breathing
.
PA7
260 Computing in Cardiology 2012, Kraków, Poland

The Analysis of Transient Heart Rate Response to the Active Orthostatic Manoeuvre
Gerard Cybulski*, Anna Strasz, Wiktor Niewiadomski, Dominika Życka, Marcin Konefał, Anna Gąsiorowska and Tadeusz Pałko
Department of Mechatronics, Warsaw University of Technology Warsaw, Poland
Aims: The analysis of transient phase of cardiovascular system response
to a physiological tests could bring diagnostic data on autonomic reflex and help to predict the occurrence of orthostatic syncope. This study aimed to find the new indices quantitatively characterizing the dynamics of heart rate changes following standing up from the supine position and assess their relationship with age.
Methods: The intervals between heart beats (RR) automatically obtained from continuous recording of ECG during the orthostatic manoeuvre were investigated in 41 healthy men aged 20-59 years, classified into three groups: (22-26 years, n = 14), (33-49 years, n = 13) and (51-59 years, n = 14). In literature, most of the indices describing immediate RR response are calculated as a function of the characteristic points related to the average length of the RR in supine position as a reference. We calculated the indices showing the RR oscillation just after standing up referring them to the value in 8th minute of standing. The indices describing static differences between steady states and dynamic phase of the response to standing up were analysed by checking their correlations with age.
Results: For the indices describing steady states - no correlation with age was found for RR value in supine position and the highest was noted for value in 8th minute of standing (r=0.533). In transient phase the strongest relationships with age was observed for index describing overshoot in RR occurring within 30 seconds, above the value of RR in 8th minute of standing (r= -0.614).
"Conclusion: Most of the indices characterizing the amplitude of RR changes following standing up showed a tendency towards attenuation with age. The stronger correlations with age presented indices related to the RR value in 8th minute of standing than those based on RR value in supine position
.
PA7
Computing in Cardiology 2012, Kraków, Poland 261

Pre-ectopic Vagal Tone Affects Heart Rate Turbulence Slope in Heart Failure
Gianni D'Addio*, Mario Cesarelli, Maria Romano, Giuseppe Furgi, Nicola Ferrara and Franco Rengo
S. Maugeri Foundation, IRCSS, Telese Terme, Italy Telese Terme, Italy
Heart rate turbulence (HRT) following spontaneous ventricular
premature complexes (VPC) are described by the turbulence onset (TO) and slope (TS). Since HRT is a baroreflex sensitivity marker, it can be hypothesized to be affected by the preceding VPC sympathovagal balance. No previous papers explored this hypothesis and this study investigate the relationship between HRT and pre-ectopic vagal tone in heart failure (HF). 25 ECG 24h Holter recordings of HF patients (62±9 years, NYHA II/III) were analyzed. For each VPC, pre-ectopic vagal tone has been assessed by spectral power in high-frequency band (0.15-0.4Hz) over 64 normal RR values preceding VPC (pHF). A Spearman correlation analysis was performed between TO, TS and pHF for each of the 3.890 VPC episodes detected. According to risk stratification standards, each post-VPC response was classified in low-risk 0-category, with TO<0% and TS≥2.5ms/RR; medium-risk 1-category, with either TO (1a) or TS (1b) abnormal and high-risk 2-category, with both abnormal TO and TS values. Results showed a 53%,27%,5%,6% of post-VPC respectively 0,1a,1b,2-category, and a remaining 9% unclassified T0=0 values. pHF showed a moderate to good significant (p<0.0001) positive correlation with TS, ranging from r=0.5 to 0.6 in 0- and 1a-category, reversing to week negative values (r=-0.2) in 1b and 2-category. Weaker correlations has been found between pHF and T0. Conclusions demonstrated that while the early HRT phase do not seem to depend on preceding VPC sympathovagal balance, pre-ectopic vagal tone affects HR late recovery slope in HF, with correlation patterns related to different post-VPC response type
.
PA7
262 Computing in Cardiology 2012, Kraków, Poland

Neurohormonal and functional correlates of linear and Poincarè plot indexes of heart rate variability in heart failure patients
Gianni D'Addio*, Mario Cesarelli, Roberto Maestri, Giuseppe Furgi, Nicola Ferrara and Franco Rengo
S. Maugeri Foundation, IRCSS, Telese Terme, Italy Telese Terme, Italy
Higher neurohormonal activation levels are known markers of severity in
heart failure (HF) patients. Classical linear indexes of heart rate variability (HRV) have been shown to be associated with neurohormonal activation. Whether and to what extent non linear Poincarè plot indexes (PPI) of HRV reflect similar relationship is not known. Purpose of the study was to assess the association of PPI with plasma norepinephrine (NPE) levels and functional parameters as compared to classical linear indexes of HRV. Ninety-nine HF patients (age: 51±8 years, NYHA class II-III 88%, LVEF 24±6 %, VO2max 14±4 mlxKg-1xmin-1) were studied. Each patient had a 24-hour Holter recording and a standard clinical and laboratory examinations included plasma NPE assay. The SDNN and the power in the low frequency band (LFP, 0.04-0.15 Hz) were computed on consecutive 5-min RR sequences. PPI were obtained by automated quantification of the bi-dimensional length, L and tri-dimensional (peak’s number Np, radii of the semi-ellipse of inertia Px,Py,Pz) morphological characteristics. Both SDNN and LFP showed a moderate but significant negative correlation with NPE levels (r=-0.37 and -0.44 respectively, p<0.0001); while a weaker association was found for L, Np and Py ranging from r=-0.33 to -0.25, p<0.0001). Linear indexes were significantly associated with VO2max (r=0.31 and 0.36 respectively, p<0.001), and between PPI similar correlation were found for L, Py and Pz (r= 0.33, 0.37 and 0.32 respectively, p<0.001). Similar relationships were found with EF (r=0.35, 0.34, 0.36, 0.33, 0.34) for SDNN, LFP, L, Np, Pz, respectively, p<0.001) with a negative correlation of r=-0.38 p<0.0001 for Px. These findings suggest that although the association of linear and PPI of HRV with functional parameters is similar, the former, particularly the power in the low frequency band, appear to reflect more closely the level of adrenergic activation of HF patients
.
PA7
Computing in Cardiology 2012, Kraków, Poland 263

HRV Signal Dynamic Extraction in the Poincare Plot by analyzing the Extended U-Sequences in order to Cardiac Arrhythmia Classification
Pouria Sarlak, Amir Homayoun Jafari, Nader Jafarnia Dabanloo*, Seyed Kamaledin Setarehdan and Gholamreza Attarodi
1Department of Biomedical Engineering, Science and Research Branch, Islamic Azad University, Tehran, Iran
This paper presents a new method for extracting the dynamic of heart
rate variability (HRV) signal by studding the position of the points in the Poincare plot with respect to the line of identity (LOI) for cardiac arrhythmia classification. In this method, at first step, each point in the Poincare plot is coded considering its position with respect to the LOI. Then, by putting the codes corresponding to successive points next to each other, a series of codes is formed. In next step, by placing a window with a specified length on the codes, a U-Sequence is generated. To generate next U-Sequences, each time the window is moved by a sample. At the end, by analyzing the manner of repetition and the continuance of these U-Sequences in different arrhythmia classes, their classification is performed. With consideration to coding process (first step), 3 algorithms are presented. In the first one, coding of the points is implemented in accordance to their position with respect to the LOI. In the second one, in addition to the position of the points, the distance between the points and LOI is stipulated. In the third one, more information regarding the distance between the points above the LOI and the line itself is taking into consideration, but the information related to the distance of the points belowthe LOI is omitted. The results of using this method on “MIT-BIH Arrhythmia Database”for some typical example of arrhythmia are 95% and 81% accuracy for classifying NSR, AFIB and NSR, LBBB respectively by applying only 10 RR-intervals for each segment. The results proved that by extracting the signaldynamic by proposed method, it can be classified and differentiated arrhythmia even such arrhythmia that don’t create specific changes in HRVsignal. Due to high speed in the classification,this methodis suitable for real time applications
.
PA7
264 Computing in Cardiology 2012, Kraków, Poland
Extended Triangle Phase Space Mapping (ETPSM): The novel method for representation of Heart Rate Va-riability Signal
Sadaf Moharreri, Nader Jafarnia Dabanloo*, Saman Parvaneh, Ali Moti Nasrabadi and Gholamreza Attarodi
Department of Biomedical Engineering, Science and Research Branch, Islamic Azad University, Tehran, Iran
A time series of RR interval is the time between successive R-waves and
the variation in the time series of consecutive heartbeats is referred as Heart Rate Variability (HRV). It has been proved that nonlinear analysis of HRV might provide more valuable information for the physiological interpretation of heart rate fluctuations. In this paper, we have introduce new features in the Extended Triangle Phase space mapping (ETPSM), a novel method for representation of heart rate which is obtaining by using RR interval time series signal to plot the Triangle mapping consist of all the ordered pairs: (〖RR〗_i, abs (¯RR-〖RR〗_(i+1))), i=1,…,N where ¯RR is the mean of RR intervals. We obtained a triangle from the distribution of these points and introduced three new features in this mapping by counting the points in, on and out of the triangle. These features were evaluated in distinguishing four groups of subjects (Arrhythmia, Congestive Heart Failure (CHF), Atrial Fibrillation (AF) and Normal Sinus Rhythm (NSR)) obtained of Physionet database. Kruskal-Wallis test which is a nonparametric version of ANOVA analysis distribution was used to define the level of significance of each feature for different groups of subjects to demonstrate the usefulness of the proposed geometric features in biomedical applications. The results show that these features discriminate arrhythmia from NSR subjects by p<1E-6; CHF from NSR by p<2E-3; AF from NSR by p<4E-4; CHF from arrhythmia by p<1E-2; CHF from AF by p<5E-4; and arrhythmia from AF by p<2E-3
.PA7
Computing in Cardiology 2012, Kraków, Poland 265

Analysis of slope based heart rate asymmetry usingPoincare plot
Chandan Karmakar, Marimuthu Palaniswami
The University of MelbourneMelbourne, Australia
In this study we investigate the asymmetry of heart rate control system andsuggest a simple index to quantify slope asymmetry using Poincare plot of RRinterval signal. We compare the performance of slope asymmetry index (SI)with popular heart rate asymmetry indexes such as Guzik’s index (GI) andPorta’s index (PI) in differentiating normal sinus rhythm (NSR) subjects fromcongestive heart failure (CHF) subjects.
SI is defined as the percentage of cumulative values of positive ∆slope(∆slope+) to the cumulative values of all ∆slope. The slope of i − th pointof Poincare plot Pi(RRi, RRi+1), ∆slope and SI is defined using followingequations:
∆slopei = SLI −RRi
RRi+1
SI(%) =∑N(∆slope+)
i=1 ∆slope+i∑N(∆slope)
i=1 ∆slopei
×100
Di =RRi −RRi+1√
2
GI(%) =∑N(P+
i)
i=1 (D+i )2∑N−1
i=1 (Di)2× 100
PI(%) =N(P+
i )N(Pi)
× 100
where SLI is the slope of lineof identity Li(RRi = RRi+1),P+
i represents point above Li
and Di is the distance of thepoint from Li. 54 subjects withNSR and 29 subjects with CHFhave been used in this studyfrom Physionet Normal SinusRhythm and Congestive HeartFailure database. Asymmetry in-dices are calculated using the first30 minutes of RR interval sig-nal for each subject. The dif-
ferences among NSR and CHF group is analyzed by non-parametricWilcoxon-Ranksum test and p < 0.01 is considered statistically significant.
Table 1. Mean± SD values of asymmetryindices for NSR and CHF subjects. ∗ index
values are significantly different between groups.NSR CHF ROC Area
GI 52.66 ± 3.91 53.59 ± 4.73 0.53PI 39.69 ± 3.48 37.50 ± 4.27 0.65SI 48.31 ± 1.56 46.13 ± 2.95 0.78∗
In conclusion, SI isa novel and simple mea-surement of heart rateasymmetry which per-forms better than GIand PI in differentiat-ing CHF subjects fromNSR.
PA7
266 Computing in Cardiology 2012, Kraków, Poland
Dynamics of Heart Rate Changes Following Moderate and High Volume Exercise Training
Chandan Karmakar*, Ahsan Khandoker, Mikko P Tulppo, Timo H Mäkikallio, Antti Kiviniemi, Arto Hautala, Heikki V Huikuri, Marimuthu Palaniswami and Herbert F Jelinek
University of Melbourne Melbourne, Australia
The effect of various exercise regimens on heart rate variability (HRV)
has been shown by a number of research groups. In this study, we use the complex correlation method derived from the Poincaré map along with stan-dard parameters to obtain a better understanding of the relationship between optimal autonomic control of the heart rate and the correlation to fitness and exercise. Fifty participants were randomized into a moderate-volume (6 x 30 min per week, n=19), high-volume (6 x 60 min per week, n=15) and control group (n=16) after exclusions due to ectopic beats and contraindications for a maximal exercise test. The subjects underwent 24h ambulatory recording of R-R intervals before and after the 8-weeks training intervention. In this study, we divided the duration of the signal into Day (9am-6pm), Night (12am -6am) and 24h groups. Standard Poincaré based HRV parameters SD1 (short-term variability), SD2 (long-term variability), their ratio SD1/SD2 and com-plex correlation measure (CCM) (change in temporal dynamics of the Poin-caré plot) was calculated for each subject and duration. Effect of training for each HRV parameter was measured as percentage change of the parameters. Nonparametric Mann-Whitney U test was used for statistical analysis and a p<0.05 considered significant. Effects of training compared to control indicated a significant difference using SD1 and SD1/SD2 for Day recordings and SD2 only for the Night re-cordings. Post hoc tests revealed significant differences between either mod-erate or high volume training to control (p<0.05) but no significant differ-ences between moderate and high volume training for these measures. The temporal dynamic changes measured with CCM indicated that there was a significantly greater change associated with moderate volume exercise compared to high volume exer-cise during the Day with both being significantly different to control (p<0.05) but no effect of exercise during the Night
.
PA7
Computing in Cardiology 2012, Kraków, Poland 267

Re-pacemaking from Oscillation Cessation Induced by External Low Frequency Signals in an Aged Intact Sinoatrial Node Atrium Model
Jiqian Zhang, Xiaoqin Si, Xiang Li, Fei Gao and Henggui Zhang*
Anhui Normal University
Background Senile cardiac rhythm may become slower or even
cessation, and it closely related to the conductance of sodium current in the Sinoatrial node(SAN) cell membrane channel, but whether it could be eliminated by external stimulus and the intrinsic mechanism is unclear.
Objeective The purpose aimed to test the hypothesis that in the defec-tive SAN system of aged heart, whether the abnormal pacemaking activ-ity could be restored and repacemaking.
Methods Using the intact SAN-atrium model of the aged rabbit heart, the aging effects were considered by adjusting the conductance of INa. To simulate the recover behavior from abnormal pacemaking, the conductance factor kg and acetycholine (Ach) were chosen as the controllable parame-ters, and the external lower frequency signals were introduced. Then, nu-merical simulation was performed on a two-dimensional (2D) lattice with zero-flux boundary condition using the finite difference method, the time series of action potentials are recorded and compared for the cells on the recoding line.
Results In the aging heart, when sodium current is removed from the SAN or decrease in active SAN cell population, or combination of both, abnormal pacemaking or even cessation will display. On the other hand, such abnormal pacemaking behavior could be eliminated and repacmaked by proper external lower frequency (f=2~5Hz) signal.
Conclusion Conductance of the sodium channel and intercellular cou-pling strength may play an important role in controlling the initiation and conduction of pacemaker activity. This study provides a possible new mechanism underlying cardiac repacemaking by proper external lower frequency signal in aged heart
.
PA8
268 Computing in Cardiology 2012, Kraków, Poland

Impact of Anatomical Variations in Ventricular Shape on Noninvasive Electrocardiographic ImagingAzar Rahimi, Hongda Mao, Ken Wong, Linwei Wang
Rochester Institute of Technology, Rochester, USA
Introduction_Noninvasive electrocardiographic imaging (ECGI) couples electrocardiographic data with anatomical data to estimate electrical dynamics of the heart on the surface or transmurally across the depth of the myocardium. ECGI relies on anatomically-detailed heart and torso models derived from high quality tomographic data, that not only imposes high demands on the image quality, it is also associated with uncertainty due to variations in image quality, user segmentation and the segmentation methods. Though the impact of global anatomical features such as size, position and orientation of the heart with respect to torso on ECGI is established, the role of variations in anatomical details remains unknown. We design an approach to statistically assess the effect of local variations in ventricular models on the diagnostic accuracy of ECGI by developing a set of ventricular models with different anatomical details from trained statistical shape models (SSM), followed by a statistical equivalence test on the ECGI outputs.
Methodology_Training SSM using a set of manually-segmented heart models, statistical model of the subject heart is obtained that describes each ventricular shape by a mean and shape parameters. Changing the shape parameters within the limits learnt from the training set, we can generate a set of heart models with the same shape statistics but different anatomical details for the same subject. On a population of multiple subjects, ECGI are performed on the SSM-generated ventricular models and the equivalence of the ECGI outputs are tested via hypothesis test of equivalence based on paired t-test.
Results_ Two existing epicardial and transmural ECGI methods are used in phantom and real-data experiments with 80 and 64 ventricular models of 4 subjects, respectively. The equivalence test reports equality of ECGI dia-gnostic accuracy on ventricular models with local variations, at the 5% level. This finding has the potential of facilitating the clinical translation of ECGI research.
Two different segmentations of one MRI slice at short axis. Estimated infarct locations are also marked with red and blue points.
PA8
Computing in Cardiology 2012, Kraków, Poland 269
Activation Time Imaging in the Presence of Myocardial Ischemia: Choice of Initial Estimates for Iterative Solvers
Walther H W Schulze*, Danila Potyagaylo and Olaf Dössel
Karlsruhe Institute of Technology (KIT)
Introduction: A non-invasive imaging of potentials in the cardiac muscle
tissue would allow for pre-interventional treatment planning of cardiac interventions and improved interventional guidance. In this work, a simulation study is performed that demonstrates how activation times of cardiac action potentials can be reconstructed from body surface potential maps (BSPMs), which is an inverse problem of ill-posed nature.
Methods: An extrasystole is simulated in the ventricles, which are affected by myocardial ischemia, and the related BSPM is calculated. Activation times of transmembrane voltages are reconstructed using an iterative solver proposed by Fischer et al. that solves the non-linear problem by imposition of a time-course model for the action potentials. A Laplace cost term is applied on the activation times. To start the iteration, an initial reconstruction is required which has significant impact on the final solution. This study explores different options: The critical times method by Greensite and Huiskamp, the Tikhonov method applied on the integral of potentials. Also, a combination of both methods is established that uses results of the critical times method as a reference where considered reliable (critical points). The integration of the reference requires no case-specific parameterization.
Results: All methods produce proper reconstructions of activation times. The combined method compensates for errors of the individual approaches, but still runs into local artifacts. These are affected by the ischemic tissue.
Conclusion: Although iterative solvers can solve the problem of activation time imaging very well, there is still a lack of a proper initial estimates. Since the critical times method does not always interpolate the activation times at critical points well enough, investigation is required on the integration of reliable results into methods that lead to a more physiological interpolation. With the combined method a possible and promising approach is demonstrated
.
PA8
270 Computing in Cardiology 2012, Kraków, Poland

Modeling of ECG Signals with regard to the Location and Intensity of Myocardial Infarction
Gholamreza Attarodi*, Nader Jafarnia Dabanloo, Samaneh Mahdinazar, Ali Moti Nasrabadi and Ali Javadirad
Science and Research Branch, Azad University, Tehran, IRAN Tehran, Iran (Islamic Republic of)
In this paper we used neural network (NN) to generate ECG signals with
regard to the location and intensity of myocardial infarction (MI) as input of the model. We can use this model in educational programs and assessment of diagnostic devices. We can also use the model in telemedicine applications. We used 50 samples of labeled ECG and used 70% of them for training and 30% for test. Addressing of MI location is the standard 17-segments for left ventricle. The measure of Mi intensity was the normalized under curve area of ECG in one cycle. For creating the proper shapes of ECG we used NN and for repeating the ECG cycles we used an Integral Pulse Frequency Modulator (IPFM) with a fixed threshold. However it is possible to use any Heart Rate Variability (HRV) model. We used two kind of NN. One was multi layer perceptron (MLP) with one hidden layer and the second was radial basis function (RBF) NN and compared the results. After evaluating both NN we realized that the performance of both were more or less the same. The result of evaluation of the model satisfied cardiologist. A new model for generating ECG signals related to the location and intensity of MI was presented
.
PA8
Computing in Cardiology 2012, Kraków, Poland 271

CircAdapt: a User-friendly Learning Environment for (Patho)physiology of Heart and Circulation
Nico Kuijpers, Willem Dassen*, Peter van Dam, Eelco van Dam, Evelien Hermeling, Joost Lumens, Theo Arts and Tammo Delhaas
Maastricht University Maastricht, Netherlands
To understand physiology and pathophysiology of the cardiovascular system, an interactive learning environment is required in which the student can manipulate parameters such as heart rate or circulating blood volume. Traditionally, this type of education was organized using phantom models. Although these models provide insight, they lack flexibility and can therefore be applied only for a limited number of applications. CircAdapt is a computer model simulating cardiac mechanics and hemodynamics. By configuring modules representing cardiac wall segments, valves, vessels, and peripheral resistance, a simulation of the heart and circulation can be created. The model incorporates mechanical and hemodynamical interaction between the left and right ventricle and simu-lates circulatory pressures, flows, and blood volumes over time. To teach various aspects of the cardiovascular system, a learning environment has been created on the basis of the CircAdapt framework. Parameters such as heart rate, contractility of the heart muscle, peripheral resistance, and circulating blood volume can be manipulated by adjusting sliders in the user-interface. By continuously running the model and showing output variables, the effect of such interventions on left ventricular (LV) pressure, aortic pressure, and LV volume is immediately visible to the user. This concept has been applied to teach cardiac (patho)physiology of exercise and hypovolumic as well as cardiogenic shock to first-year medical school students. By adjusting parameters describing opening area and leakage of the valves, the same concept will be applied to teach pathophysiology of aortic valve stenosis and mitral regurgitation to second-year medical school students. A preliminary version of the CircAdapt learning environment was used in the first year of the medical school curriculum at Maastricht University (400 participants). By consistent use of the same learning environment throughout the curriculum, students will not only enlarge their knowledge of the cardiovascular system but also get acquainted with interactive computer simulations
.
PA8
272 Computing in Cardiology 2012, Kraków, Poland

Patient-Specific Three-Dimensional Torso Models for Analysing Cardiac Activity
Frederique Vanheusden, Joao Loures Salinet Jr., William B Nicolson, Gerry P McCann, G André Ng, Fernando S Schlindwein University of Leicester Leicester, UK
Introduction: The aim of this project is to develop a non-invasive, multi-
electrode system for projecting body surface signals to the heart. To solve
this inverse problem, an accurate relationship between surface signals and
cardiac activity needs to be established. For this purpose, Finite Element (FE)
analysis can be performed on 3D torso models. Effects of internal organs
need to be taken into consideration for an accurate relationship. Our aim is to
develop patient-specific 3D whole-torso models for FE analysis. Here,
models including the heart and lungs are shown.
Methodology: Thirty transverse cardiovascular MRI slices (T1-weighted,
thickness: 8 mm) were taken from 4 healthy patients. Background noise was
removed using an intensity threshold (10% of maximum intensity). Two
schemes were developed for torso and organ detection, respectively. The tor-
so border was isolated using a ‘canny’ filter (SD = 1) applied on 3x3 voxel
areas. Detection was based on a polar coordinate system. Organ borders were
first intensified using a Laplacian of Gaussian filter (SD =1.5, 3x3 voxel
area). After manual specification of starting points, linear interpolation was
performed based on snake algorithms.
Individual slices were stacked to
develop the 3D model.
Results: Combining both schemes re-
sulted in sufficiently detailed torso mod-
els for all patients. Both schemes allow
immediate identification of
elements for future FE analysis to
project body signals to the heart. Torso
border points could be detected
automatically within 4 seconds for the
entire torso. Organ detection is dependent on the manual allocation of starting
points for the snake algorithm. Effects of reducing these points and
automated detection are currently under investigation.
A 3D torso model showing the
heart and right lung.
PA8
Computing in Cardiology 2012, Kraków, Poland 273

Measurement of Instantaneous Response of QT intervals to RR Changes: its association to life-threatening events in the type 1 long QT syndrome.
Jean-Philippe Couderc*, Jean Xia, Wojciech Zareba, Arthur J Moss and Coeli M Lopes
University of Rochester Medical Center Rochester, United States
Long QT syndrome type-1 patients (LQT-1) are prone to life-threatening
events triggered by an impaired adaptation of their ventricular repolarization to beta-adrenergic stimulation (exercise and arousal). Yet, there is no ECG-based diagnostic method currently available to identify this impairment. Consequently, we designed a method quantifying the fast adaptation of QT interval to preceding heart rate changes. We hypothesize that the instantaneous response of QT intervals measured from surface ECGs are more pronounced in LQT1 patients with than without cardiac events. The LQT-1 Holter recordings were extracted from the Telemetric and Holter ECG warehouse (E-HOL-03-0480-013). We extracted LQT1 patients with missense mutations, age >13 years, and off beta-blockers. We measured automatically the beat-to-beat QT and RR intervals in their 24-hour ambulatory recordings. We quantified the ratio of QT prolongation preceded by RR lengthening to the QT shortening preceded by RR prolongation (QTbal) for a heart-rate range between 60 and 50 bpm. The LQT1 patients with (n=43, 24f, 38±16yrs) and without event (n=24, 17f, 43±17yrs) had significant longer QTc interval (497±26 vs. 478±29 ms, p=<0.0001) in patients with events and larger QTbal (1.03±0.26 vs. 0.93±0.21, p=0.039). When limiting the analysis to LQT-1 patients with QTc<500ms, patients with (n=15) and without events (n=46) did not show statistically different QTc value (479±19 vs. 471±27 ms, p=0.15), yet QTbal remained significantly different (1.11±0.33 vs. 0.92±0.20, p=0.008). Multivariate analysis revealed that QTbal was associated with 37% increased chance to have an event for each 0.1 increment of QTbal after adjustment for RR, QTc, SDNN, RMSSD, age and gender (O=1.37,95% CI: 1.00-1.85, p=0.04). We develop a Holter-based technique to measure instantaneous response of QT interval revealing an impairment of QT adaption which appears to be preponderant in LQT1 patients with events and, remain abnormal in ECG of LQT1 patients with event and a QTc <500 msec
.
MC
274 Computing in Cardiology 2012, Kraków, Poland

Inverse Electrocardiographic Imaging to Assess Elec-trical Dyssynchrony in CRT patients
Fady Dawoud*, David Spragg, Karl H. Schuleri, B. Milan Horáček, Henry Halperin, and Albert C. Lardo School of Medicine, Johns Hopkins University, Baltimore, MD, USA
Electrical dyssynchrony is postulated to be one of the main factors con-tributing to non-response of patients to biventricular pacing in cardiac resyn-chronization therapy (CRT). We present a method based on reconstructed epicardial electrograms computed from patient-specific geometry and body-surface potential (BSP) recordings in order to assess global and regional elec-trical dyssynchrony.
Patients with indications for CRT were recruited from the cardiac electro-physiology service at Johns Hopkins Hospital to undergo BSP and cardiac magnetic resonance (CMR) imaging both pre (N=7) and 9 months post (N=10) device implantation, without and with pacing function (P-OFF and P-ON). A patient-specific mathematical model was used to reconstruct epicar-dial regional activation sequences. An electrical inter-ventricular dyssyn-chrony index was derived based on integral of computed electrograms (∆QRSi, range of -1 to 1 where negative values represent earlier/faster RV activation relative to the LV).
The reconstructed sequence of activation in the dyssynchronous left-bundle branch block (LBBB) rhythm agreed with published contact mapping activation maps with earliest activation starting on the RV free wall and slowly spreading to the LV in a U-shaped pattern. The ∆QRSi metric cap-tures pre-CRT dyssynchrony showing negative values (-0.32±0.10) with min-imal variation over subjects and multiple beats (coefficient of variation 10±3.6%) while post-CRT pacing indicated positive values (0.18±0.11). ∆QRSi cut-off value of 0.05 separates the pacing from the non-pacing groups (P-ON vs. P-OFF and P-ON vs. Pre-CRT, p<0.001).
In conclusion, the non-invasive regional imaging method is capable of re-constructing LBBB conduction and the global dyssynchrony metric can de-tect significant differences between the native rhythm pre-CRT and the biventricular pacing rhythm post CRT with minimal variation over multiple consecutive beats.
Polar plot of epicardial activation sequences pre-CRT. Earliest activation starts on the RV spreading slowly to the infero-basal LV.
MC
Computing in Cardiology 2012, Kraków, Poland 275
New Score for Pre-ablative Evaluation of the Success of Catheter Ablation of Atrial Ablation
Alexander Berkowitsch*, Sergei Zaltsberg, Harald Greiss, Ersan Akkaya, Malte Kuniss, Heinz-Friedrich Pitschner, Christian Hamm and Thomas Neumann
Kerckhoff Heart Centre Bad Nauheim, Germany
Background: Although catheter ablation (CA) has become widely used
therapy option for patients with atrial fibrillation observed recurrences following CA are still observed in up to 50% of patients. Aim of this study was construction of risk score (RS) predicting recurrence after the catheter ablation.
Methods: A total of 784 consecutive pts (age=58 y, history of AF = 5 y, male=552, PAF =460, CAD=68, hypertension=487, DM =50, metabolic syndrome (MetS) = 304, LVEF=60%, LA area=20.91 cm2, BSA=2.06 m2, GFR=88.85 mL/min) treated in our institution. A 7-day-Holter ECG was performed at each follow-up visit. Any episode of documented AF/LAT was considered as clinical endpoint. The cohort was randomized 1:1 to training sample for defining of predictors and validating sample for their testing. The cut-offs of continuous variables were found using ROC curve analysis. The RS was calculated based on the coefficients of independent predictors found in training sample and proven in the validating sample and entire group
Results: Out of 392 patients in training sample 197 (50.3%) reached clinical endpoint. Non PAF (B=.55), enlarged LA area (LA area/BSA >11.5) (B=.67), reduced GFR (<68 mL/min) (B=.481) and MetS (B=.412) were revealed to be independent predictors for recurrence. Ablation technique was not revealed in the multivariate analysis. The constructed score reached maximum value of 4 if all predictors were found. The proportion of maintained sinus rhythm within median follow up of 33 mo was 44/58 (76%), 62/111 (56%), 44/95 (46%), 40/111 (36%) and 5/17 (29%) for RS: 0,1,2,3, and 4, respectively. In the validating sample 205 (52.3%) pts. reached endpoint. The proportion of maintained sinus rhythm was similar to training sample: 45/61 (74%), 65/110 (59%), 43/84 (51%), 33/122 (27%), and 1/15 (7%) for RS: 0,1,2,3, and 4, respectively.
Conclusion: proposed RS based on non-invasive parameters allowed reliable pre-ablative evaluation of the recurrence risk
MC
276 Computing in Cardiology 2012, Kraków, Poland

Real-Time Transmission of 2D Echocardiograms overWiMAX networks
Eva Cavero, Alvaro Alesanco, Jose Garcıa
University of ZaragozaZaragoza, Spain
This study aimed to present a methodology to transmit 2D echocardiogramvideo over WiMAX networks in real-time. Before transmission the echocar-diogram has to be compressed. Both the compression and the channel errorsdistort the received echocardiogram, hence a minimum quality was required topermit to make an adequate diagnosis.
In order to compress the echocardiogram the 3D SPIHT algorithm was pro-posed because it was demonstrated its good compression results in echocar-diograms. To guarantee the clinical quality of the echocardiogram a clinicalevaluation of the compressed echocardiogram was carried out by three cardi-ologists who assessed the videos corresponding to 9 patients. The echocar-diograms were recorded with three different ultrasound devices, three patientseach device, with a resolution of 720x576 pixels and 25 frames per second.The evaluation yielded the minimum transmission rate necessary for an accu-rate diagnosis. In order to reduce the errors produced by the channel errors, areliable application protocol was proposed using a hybrid solution in which re-transmission was combined with Forward Error Correction (FEC) techniques.
Percentage of time withguaranteed clinical quality.
The clinical evaluation indicated that200 kbps were necessary to guarantee theclinical quality of the 2D echocardiogram.The transmission using the proposed solu-tion, and retransmission and FEC techniquesworking separately had been simulated inWiMAX networks for different channel con-ditions, mobile speed from 5 to 60 km/hand Fading Margin (F) from -30 to -10, thatcorrespond to Bit Error Rate (BER) from0.0006 to 0.0988. The proposed protocolachieved 100 % of time with guaranteed clinical quality (200 kbps) for BERup to 0.031 (mobile speed 20 km/h and F of -15), being this value lower for theother solutions.
This proposal guarantees the clinical quality for typical values of BER inWiMAX networks for 2D echocardiograms, improving results obtained usingother approaches.
MC
Computing in Cardiology 2012, Kraków, Poland 277

278 Computing in Cardiology 2012, Kraków, Poland

Author Index
Computing in Cardiology 2012, Kraków, Poland 279

280 Computing in Cardiology 2012, Kraków, Poland
Abächerli, Roger ...................180 Aerts, Wouter .........................72 Akematsu, Yuji .......................12 Akkaya, Ersan .......................276 Al-Aubaidy, Hayder ..............109 Alberini, Gianna....................141 Alcaine, Alejandro ................196 Alcaraz, R 52, 181, 220, 221, 223 Alesanco Iglesias, Álvaro ........22 Alesanco, Álvaro ............. 84, 277 Alessandrini, Martino ...........188 Alhussein, Ghada Mohammed
.........................................170 Allen, John ............................227 Almatroushi, Noura Salem
Obaid ................................170 Almeida, Rute .......................166 Alonso, Erik .................. 7, 8, 186 Alonso-Atienza, Felipe .........102 Altuve, Miguel ...... 103, 126, 161 Alvarez-Lacalle, Enric .............79 Andreini, Daniele..................148 Angius, Gianmarco ....... 142, 143 Antoine, Leenhardt ..............118 Antonijevic, Todor ..................94 Antoranz, J Carlos .................151 Anzil, Federico ......................219 Aramendi, Elisabete .............186 Ardhapurkar Vaidya, Shubhada
...........................................15 Arenal, Ángel ........................196 Arini, Pedro D ............... 178, 179 Arts, Theo .............................272 Arzeno, Natalia M ..................68 Atienza, Felipe ................ 54, 253 Attarodi, Gholamreza ....88, 264,
265, 271 Attyabi, Abbas ......................243
Atyabi, Seyyed Abbas .. 176, 216, 230
Aubert, Andre E ..................... 72 Augustyniak, Piotr ............ 20, 86 Ayala, Unai ................... 7, 8, 186 Azman, Azreen ....................... 58 Badilini, Fabio ......................... 48 Baharav, Anda ........................ 87 Bailon, Raquel ...................... 164 Bailón, Raquel ...................... 112 Balloni, William .................... 107 Balogh, Nandor ............ 212, 217 Banerjee, Rahul ...................... 23 Banu Laleci Erturkmen, Gokce
........................................... 21 Bao, Wen .............................. 137 Baranowski, Rafał ................ 259 Barbieri, Riccardo ............. 69, 73 Barcellona, Doris .................. 143 Barnes, Josef Peter .............. 124 Baron, Nicolas ........................ 96 Barquero Pérez, Óscar ........... 24 Barquero-Pérez, Óscar ..... 46, 47 Barrio, Alicia ......................... 151 Basarab, Adrian .................... 188 Baumgartner, Benedikt .......... 56 Bayes de Luna, Antonio ....... 169 Becerra, Miguel A ................ 146 Behar, Joachim ..................... 101 Behbahani, Soroor ................. 31 Belardinelli, Luiz ............. 63, 254 Beltrán Molina, Ferney A ..... 233 Beltrán Molina, Ferney Alberto
........................................... 92 Benito, Yolanda .................... 151 Bensalah, Mourad ................ 156 Benussi, Stefano................... 219 Bera, Deep ........................... 135
Computing in Cardiology 2012, Kraków, Poland 281

Berenfeld, Omer ...................193 Berkowitsch, Alexander .......276 Bermejo, Javier .....................151 Bernard, Olivier ....................188 Berné, Paola .........................214 Berset, Torfinn .......................13 Berti, Sergio ............................55 Betancur, Julian ......................42 Betancur, Julián ....................192 Beuchee, Alain .....................173 Beuchée, Alain .....................103 Beygui, Farzin .........................96 Bhuiyan, Tanveer A ..............207 Biala, Taher ..........................117 Biktashev, Vadim ....................35 Biktashev, Vadim N ..............120 Biktasheva, Irina .....................35 Biktasheva, Irina V ................120 Billois, Romain ......................173 Binczak, Stéphane ................251 Blaber, Andrew ....................200 Black, Norman D ..................160 Blake, James .........................195 Bojarnejad, Marjan ...... 129, 195 Bolea, Juan ................... 112, 166 Bollache, Emilie ........ 1, 156, 187 Bollmann, Andreas .................53 Bond, Raymond R .................160 Bortolan, Giovanni ...............168 Bosnjak, Antonio .......... 131, 158 Boularaoui, Selwa ................170 Bourke, John P......................195 Boyd, Kyle .............................160 Boyle, Patrick M ....................... 2 Bracci, A..................................61 Breen, Cathal ........................160 Brines, L ................................232 Brugada, Josep .....................214
Brugada, Ramón .................. 214 Buchman, Timothy ............... 104 Buchner, Teodor .................. 259 Bugdol, Monika Natalia........ 155 Burattini, Laura ............ 114, 119 Burg, Andreas......................... 76 Burša, Miroslav .................... 257 Butters, Timothy .................... 37 Buttu, Andrea ......................... 50 Cabasson, Aline .................... 164 Cabras, Barbara ...................... 18 Caiani, Enrico ....................... 100 Caiani, Enrico G .............. 38, 166 Caiani, Enrico Gianluca 148, 189 Callisesi, G .............................. 61 Caminal, Pere ....................... 169 Canga, Laura ........................ 112 Cantalapiedra, Inma R............ 79 Cardona Cárdenas, Diego
Armando .......................... 150 Cardona, Karen .................... 244 Cardoso Moraes, Matheus .. 150 Carminati, Maria Chiara ...... 148,
189 Carrasco-Sosa, Salvador ... 44, 45 Carrault, Guy ........ 103, 161, 173 Carré, François ..................... 161 Caselli, Chiara ....................... 144 Castellanos Domínguez,
Germán ............................ 201 Castellanos-Dominguez, Cesar
German ............................ 185 Castells, F ..................... 231, 232 Castells, Francisco ............ 53, 54 Castiglioni, Paolo .................... 75 Castro, Noel Camilo ............. 197 Cauli, Elisa ............................ 143 Cavero, Eva .................... 84, 277
282 Computing in Cardiology 2012, Kraków, Poland

Celi, Leo A ...............................66 Cervigon, R ...........................231 Cesarelli, Mario ............ 262, 263 Chandra, Sonal .......................99 Chen, Yu ....................... 209, 210 Chia, Chih-Chun .............. 71, 136 Cholleti, Sharath ...................104 Chorro, FJ .............................232 Christ, Torsten ........................32 Christov, Ivaylo .....................168 Chronaki, Catherine ...............21 Chudacek, Vaclav .................139 Chudáček, Václav .................257 Cirugeda-Roldan, Eva ...........222 Citi, Luca ........................... 69, 73 Clancy, Colleen E ..................236 Clark, Elaine ..........................165 Clarysse, Patrick ...................188 Clement-Guinaudeau,
Stephanie .........................187 Clifford, Gari ................... 67, 101 Clifford, Gari D................ 85, 162 Climent, Andreu ............. 54, 193 Climent, Andreu M. ...... 214, 253 Cluzel, Philippe .......................96 Cochet, Hubert .....................248 Cohen, Erez ..........................127 Colman, Michael ............ 34, 238 Corino, Valentina DA ............219 Cornforth, David ...................255 Corraine, Martin ...................239 Correa, Raúl ..........................178 Corsi, Cristiana ....... 28, 147, 190 Couderc, Jean-Philippe .........274 Coudiere, Yves ................ 33, 248 Coudière, Yves ......................234 Cozma, Dragoş .....................206 Crescêncio, Júlio Cesar .........172
Cuesta-Frau, David ....... 185, 222 Cuppone, Anna Vera ............ 169 Cybulski, Gerard ................... 261 Czajkowska, Joanna ............. 155 Czopek, Klaudia ............ 152, 174 da Silva Filho, Antônio Carlos
......................................... 172 da Silva, Fátima MHSP ......... 172 D'Addio, Gianni ............ 262, 263 Dagan, Yoni ............................ 87 Dalmiani, Stefano ........... 55, 141 Daly, Jonathan ....................... 85 Dang, Thanh Hai ................... 108 Dassen, Willem .................... 272 Dawoud, Fady .............. 205, 275 De Bie, Johan ......................... 28 De Cesare, Alain ........... 156, 187 de Jongste, Mike .............. 89, 90 De la Cruz-Torres, Blanca ....... 47 Defrance, Carine .............. 1, 187 Delgado, Juan ............... 229, 244 Delgado-Trejos, Edilson ....... 146 Delhaas, Tammo .................. 272 Deng, Dongdong .................... 64 Desco, Mar ........................... 151 Dessì, Alessia .......................... 18 Devine, Brian ........................ 165 Di Marco, Luigi ..................... 129 Di Marco, Luigi Y .................. 199 Di Marco, Luigi Yuri .............. 204 di Maria, Costanzo ............... 129 Di Maria, Costanzo ............... 227 Dickhaus, Hartmut ................. 29 Diebold, Benoit ................ 1, 187 Dijk, Arnold ...................... 89, 90 Djulovic, Admir ..................... 138 Doessel, Olaf .................... 9, 222 Dogac, Asuman ...................... 21
Computing in Cardiology 2012, Kraków, Poland 283
Donal, Erwan ..........................42 Doraisamy, Shyamala .............58 Dössel, Olaf .. 36, 62, 65, 81, 270 Dourado, Antonio ..................31 Drobics, Mario ......................145 Duan, Wenfeng .............. 16, 129 Dubois, Remi ..........................33 Dubois, Rémi .................. 93, 198 Dumont, Guy ........................200 Dunkley, Nic ...........................67 Dux-Santoy, Lydia ...................60 Ebrahimi Orimi, Hamid 176, 216,
230 Ebrahimi, Hamid ...................243 Echebarria, Blas ......................79 Eftestøl, Trygve .............. 97, 183 Eilebrecht, Benjamin ............111 El-Damaty, Ahmed ................... 6 Enăchescu, Călin ........... 206, 249 Engan, Kjersti .........................97 Entcheva, Emilia ....................... 2 Eryilmaz, Elif ...........................21 Escalona, Omar Jacinto ........197 Esposito, Natalia...................144 Eyal, Shuli ...............................87 Fabio, Badilini .......................118 Fabrice, Extramiana .............118 Falgenhauer, Markus .............25 Fasano, Antonio .....................14 Fernandez-Chimeno, Mireya
................................. 256, 260 Fernández-Martínez, Lorena 102 Fernlund, Eva .........................27 Ferrara, Nicola .............. 262, 263 Ferrero, Jose .........................254 Ferrero, Jose M ......................60 Ferrero, Jose Maria ...... 236, 244 Figiel, Henryk ........................154
Figuera-Pozuelo, Carlos ......... 46 Fijorek, Kamil . 78, 208, 218, 250 Filigrana de la Cruz, Maria
Aurora .............................. 256 Finlay, Dewar D .................... 160 Flamand, Cyril ...................... 103 Flower, Abigail ..................... 105 Fonseca Guzmán, Adolfo ..... 214 Forclaz, Andrei ....................... 50 Frangi, Alejandro F ............... 149 Fredrik Nielsen, Bjørn .......... 121 Freed, Benjamin ..................... 99 Frouin, Frédérique ................. 96 Fruhwald, Friedrich ................ 25 Fugedi, Katalin ............. 212, 217 Furgi, Giuseppe ............ 262, 263 Fusini, Laura ........................... 38 Gallo Jr, Lourenço ................ 172 Gao, Fei ................................ 268 Gao, Yuan ............................. 137 García Alberola, Arcadi .......... 24 García Moros, José ................. 22 Garcia, Gabriel ..................... 226 García, José .................... 84, 277 García-Alberola, Arcadi ... 46, 95,
102 Garcia-Gonzalez, Miguel Angel
................................. 256, 260 Garreau, Mireille .................. 192 Gąsiorowska, Anna .............. 261 Geng, Di.................................. 13 Georgiev, Georgi .................. 171 Gerrits, Inge H ........................ 82 Gharaviri, Ali ........................ 252 Giacopelli, Daniele ................. 34 Gierałtowski, Jan .................. 259 Gil, Eduardo ........................... 49 Gilani, Syed ............................ 94
284 Computing in Cardiology 2012, Kraków, Poland
Gilmour, Robert F ...................39 Gimeno-Blanes, Javier ............46 Giuliani, Corrado ..................114 Glauber, Mattia ....................141 Glinka, Anna ... 78, 208, 218, 250 Glover, Benedict ...................197 Goethals, Bart ......................108 Goette, Josef ..........................17 Gómez, Juan F ........................63 Gomis, Pedro ........................169 Gomis-Tena, Julio ......... 229, 254 Gong, Yinglan .......................123 Gong, Yu ...............................137 González, Rodolfo ........ 229, 244 González-Otero, Digna . 7, 8, 186 Goya-Esteban, Rebeca ..... 46, 47 Graff, Claus ...........................207 Greiss, Harald .......................276 Grenier, Philippe ....................96 Gripari, Paola ........................148 Grøttum, Per ........................121 Guan, Yanni ..........................153 Guill, A ..................................232 Guillem, Maria de la Salud ...193 Guillem, Maria S ...................253 Guillem, María S. ..................214 Guillem, Maria Salud ..............54 Guillén-Mandujano, Alejandra
..................................... 44, 45 Guldenring, Daniel ...............160 Guzik, Przemysław .................75 Hadad, Murielle ...................157 Haeberlin, Andreas ................17 Haider, Syed .........................105 Haissaguerre, Michel..............93 Haïssaguerre, Michel............198 Halperin, Henry ....................275 Hamilton, Emily F .................113
Hamilton, James R ............... 133 Hamilton, Steven L ............... 133 Hamm, Christian .................. 276 Hammershøi, Dorte ............. 203 Hansen, John ........................ 203 Hautala, Arto ........................ 267 Hayn, Dieter ................... 25, 145 Henry, Jacques ..................... 248 Hermeling, Evelien ............... 272 Herment, Alain ............... 96, 187 Hernández, A ....................... 181 Hernandez, Alfredo ................ 42 Hernández, Alfredo I ............ 103 Heuveline, Vincent ................. 62 Hilbel, Thomas ..................... 228 Hinton, Tina ......................... 110 Ho, Joyce C ............................. 68 Hocini, Meleze ....................... 93 Hoogendoorn, Corné ........... 149 Horacek, B Milan ...................... 6 Horáček, B Milan .................. 275 Horáček, Milan ......................... 5 Hornero, F .................... 181, 220 Hosseini sabzevari, Amir ...... 216 Houlton, Geoff ..................... 200 Hove-Madsen, Leif ................. 79 Hruban, Lukáš ...................... 257 Hu, Weichih .......................... 159 Huikuri, Heikki V ................... 267 Huo, Yan ................................. 53 Huptych, Michal ................... 128 Husser, Daniela ...................... 53 Hyttinen, Jari .......................... 77 Idriss, Salim ............................ 94 Igual, Jorge ............................. 54 Iliev, Ivo ................................ 213 Irusta, Unai ............................... 8 Isabelle, Denjoy .................... 118
Computing in Cardiology 2012, Kraków, Poland 285

Ivănică, Gabriel .....................206 Ivanova, Lyubov .....................41 Jabłońska, Magdalena ..........154 Jacomet, Marcel .....................17 Jacquir, Sabir ........................251 Jafari, Amir Homayoun.........264 Jafarnia Dabanloo, Nader 31, 88,
140, 264, 265, 271 Jafarnia Dabanloo, Yousef ......88 Jąkała, Jacek .........................152 Jamshidi, Rasa ..... 176, 216, 230,
243 Janků, Petr ............................257 Janousek, Oto ............... 175, 177 Jansen, Katrien .......................30 Jantan, Azrul ...........................58 Janusek, Darek .....................115 Janusek, Dariusz ...................163 Javadirad, Ali ........................271 Jekova, Irena ........ 168, 171, 213 Jelinek, Herbert .... 109, 170, 255 Jelinek, Herbert F ......... 110, 267 Ji, Lianying ............................130 Jimenez-Carretero, Daniel ...191 Johnson, Alistair ............. 67, 104 Johnston, Graham A .............110 Johnston, Peter ....................125 Johnston, Peter Rex .............124 Joosen, Pieter .........................72 Jopling, Jeffrey .....................104 Jorens, Philippe ....................108 Jørgensen, Alex Skovsbo .......... 3 Julián, M .................................52 Kabak, Yildiray ........................21 Kachenoura, Nadjia ..... 1, 96, 99,
156, 187 Kaiser, Willi ...........................107 Kajbafzadeh, Behrad ............202
Kaminska, Bozena ................ 202 Kang, Tongbi ........................ 130 Kania, Michal................ 115, 163 Kańtoch, Eliasz ....................... 86 Karakonstantis, Georgios ....... 76 Karam, Zahi ............................ 71 Karmakar, Chandan ..... 266, 267 Kasprzak, Jaroslaw ................. 43 Katova, Tzvetana .................. 168 Katus, Hugo .......................... 228 Katz, Amos ........................... 182 Kayaalp, Mehmet ................. 134 Kecskes, Istvan ............. 212, 217 Keller, Matthias W ................. 81 Kervio, Gaëlle ....................... 161 Keskar, Swati .......................... 23 Khalaf, Kinda ........................ 170 Khalil, Ibrahim ........................ 26 Khandoker, Ahsan ........ 266, 267 Khandoker, Ahsan Habib ..... 170 Kharche, Sanjay ................ 35, 61 Khoor, Sandor .............. 212, 217 Khosrow-Khavar, Farzad ...... 202 King, Susan ........................... 129 Kiviniemi, Antti ..................... 267 Klas, Berthold ......................... 40 Klinge, Annette .................... 227 Knoll, Alois ............................. 56 Kodoth, Vivek ....................... 197 Koivumäki, Jussi T .................. 32 Kolarova, Jana .............. 175, 177 Konefał, Marcin .................... 261 Konrad, Niko .......................... 62 Kortelainen, Juha ................... 83 Kośmider, Marcin ................... 75 Kovacs, Ilona ................ 212, 217 Kraeva, Olga ........................... 41 Kraft, Norbert ....................... 211
286 Computing in Cardiology 2012, Kraków, Poland

Krajnak, Michael...................107 Kramer, Andrew .....................67 Krassowska Neu, Wanda ........94 Krasteva, Vessela . 168, 171, 213 Krause, Mathias J ...................62 Kremen, Vaclav ....................222 Krishnan, Sridhar ..................175 Krueger, Martin ......................36 Krug, Johannes W .................162 Kudryński, Krzysztof .............258 Kuijpers, Nico ............... 252, 272 Kumar, Ritwik .........................59 Kuniss, Malte ........................276 Kurz, Alexander KE .................65 Kuzilek, Jakub ............... 128, 139 Kvaløy, Jan Terje ............. 97, 183 Labarthe, Simon ....... 33, 93, 248 L'Abbate, Giuseppe Andrea .144 Laciar, Eric ............................178 Ladouceur, Magalie ..............187 Lagae, Lieven ..........................30 Laguna, Pablo 49, 100, 112, 164,
166, 184, 196 Lall, Carolyn .................. 209, 210 Lamberti, Claudio ......... 147, 190 Lang, Roberto ................... 40, 99 Lang, Roberto M ............. 38, 190 Langella, Bernard .................192 Langley, Philip .. 16, 34, 129, 195 Lardo, Albert ........................205 Lardo, Albert C .....................275 Lau, Ernest ............................197 Laurent, Gabriel ...................251 Laws, Elaine ............................55 Lázaro, Jesús ...........................49 Leban, Manja ..........................27 Lechuga, Luis ..........................24 Leclercq, Christophe ..............42
Leclerq, Christophe .............. 192 Ledesma-Carbayo, María J ... 191 Lee, Cheng H .......................... 68 Lee, Gyemin ........................... 71 Lefort, Muriel ............... 156, 187 LeGrice, Ian .......................... 194 Lekadir, Karim ...................... 149 Lem, Jeroen .......................... 111 Lenkova, Jana ....................... 235 Leonhardt, Steffen ......... 10, 111 Lever, Nigel .......................... 194 Lhotska, Lenka ..................... 139 Lhotská, Lenka ..................... 257 Li, Dan .................................. 138 Li, Qiao ................................. 101 Li, Xiang ................................ 268 Li, Yu ..................................... 138 Liberos, Alejandro ........ 193, 253 Liebgott, Hervé .................... 188 Lim, Ki Moo .......................... 237 Lindner, Hans-Joachim ......... 111 Lipiec, Piotr ............................ 43 Lipoff, Marc .......................... 127 Lipponen, Jukka ................... 109 Liu, Cong .............................. 137 Liuba, Petru ............................ 27 Llamedo Soria, Mariano ....... 166 Llinares, Raúl .......................... 54 Lodato, Joseph ....................... 99 Lohninger, Hans ................... 145 Lollett, Carlos ....................... 126 Long, Deyong ....................... 153 Lopes, Coeli M ...................... 274 Lopez, Sonia ......................... 239 Loures Salinet Jr., Joao ......... 273 Luca, Constantin T ................ 206 Luik, Armin ........................... 222 Lukoševičius, Arūnas ................ 4
Computing in Cardiology 2012, Kraków, Poland 287

Lumens, Joost .......................272 Luo, Shen ..............................165 Lysaker, Marius ....................121 Maan, Arie ........................ 89, 90 Maan, Arie C ...........................91 Macas, Martin ......................128 Macfarlane, Peter ................165 Macfarlane, Peter W ............160 MacInnis, Paul J ........................ 6 Maestri, Roberto ..................263 Maffessanti, Francesco 148, 189 Mahdinazar, Samaneh .........271 Maier, Christoph ....................29 Maier, Julian ...........................62 Maier, Oskar MO ..................191 Mainardi, Luca T ..... 19, 219, 225 Mäkikallio, Timo H ...............267 Maleckar, Mary M ..................32 Malgorzata, Fereniec ...........215 Man, Sumche .......................119 Mangione, Maurizio ..... 141, 144 Maniewski, Roman ...............163 Manjnath Nayak, Mithun .....135 Manoharan, Ganesh.............197 Manzo, Alain ........................229 Mao, Hongda ........................269 Marcheschi, Paolo ................144 Marchi, Marina .......................55 Margheri, Massimo ..............147 Marinelli, Martina ................144 Marisa, Thanks .......................17 Mark, Roger G ........................66 Markhasin, Vladimir ...............41 Marozas, Vaidotas .................... 4 Marras, Gavino .....................141 Martinez, A ...........................221 Martinez, Demetrio ..............132 Martínez, Juan Pablo .... 100, 196
Martino, Vaglio .................... 118 Martín-Yebra, Alba ............... 100 Marzencki, Marcin ............... 202 Matsumoto, Monica MS ...... 157 Matthews, Slade .................. 110 Matveev, Mikhail ................. 171 Mayaud, Louis ........................ 67 Mazeika, Robertas ................... 8 McCann, Gerry ..................... 273 McMillan, Sean ........ 57, 71, 136 Mejía, Cristian ...................... 146 Meloni, Luigi ........................ 143 Mena, Andrés ......................... 11 Mendyk, Aleksander ..... 78, 208,
218, 250 Meng, Shu ............................ 194 Menon, Carlo ....................... 202 Meste, Olivier............... 115, 164 Michal, Kania........................ 215 Michalski, Blazej ..................... 43 Milanov, Stoyan ................... 171 Millet, J ................................. 231 Millet, José ...... 53, 54, 193, 214,
232, 253 Mincholé, Ana ...................... 184 Minetaki, Kazunori ................. 12 Modre-Osprian, Robert.......... 25 Moharreri, Sadaf .................. 265 Møller, Henrik ...................... 203 Monasterio, Violeta ....... 85, 100 Montalescot, Gilles ................ 96 Montilla, Guillermo ...... 131, 158 Moody, George B ................... 66 Mora Jiménez, Inmaculada .... 24 Mora-Jiménez, Inmaculada... 46,
95 Mor-Avi, Victor......... 40, 99, 190 Moreno, J ............................. 231
288 Computing in Cardiology 2012, Kraków, Poland
Morgado-Reyes, Eduardo ....102 Mortara, David .......................28 Moss, Arthur J ......................274 Moti Nasrabadi, Ali ...... 265, 271 Motie Nasrabadi, Ali ..............31 Mousseaux, Elie ....... 1, 156, 187 Muehlsteff, Jens .....................10 Müller, Christian...................180 Murillo Rendón, Santiago ....201 Murray, Alan . 16, 129, 195, 199,
204, 227 Naito, Yasuhiro ............... 80, 247 Najarro, Gabriel ....................104 Napolitano, Carlo ...................28 Naranjo-Orellana, José ...........47 Narayan, Sanjiv ......................50 Navarro, Augusto .................112 Navoret, Nicolas ...................251 Neglia, Danilo .......................144 Nenova, Bistra ......................213 Neumann, Thomas ...............276 Newby, Barbara......................99 Ng, André .............................273 Ng, Francisco ........................126 Nicolson, William .................273 Niederhauser, Thomas ...........17 Niewiadomski, Wiktor ..........261 Nilsen, Dennis WT .......... 97, 183 Noponen, Kai ........................224 Novak, Daniel .......................222 Novakova, Marie .......... 175, 177 Nugent, Chris D ....................160 Odstrcilik, Tadeas .................139 Okubo, Chikako ......................80 Oostendorp, Thom F ..............82 Orini, Michele .........................73 Orłowska-Baranowska, Ewa .259 Ørn, Stein ...............................97
Orrego, Diana A ................... 146 Osiak, Anna .......................... 154 Osman, Enas Azhari Ahmed . 170 Osswald, Stefan ................... 180 Oster, Julien ................. 101, 162 Østergaard, Lasse Riis .............. 3 O'Sullivan, John .................... 227 Otani, Niels F .......................... 39 Paci, Michelangelo ................. 77 Padilla Buriticá, Jorge Iván ... 201 Pagani, Massimo .................... 48 Palaniswami, Marimuthu .... 266,
267 Pałko, Tadeusz ..................... 261 Pan, Yisha ............................. 137 Pani, Danilo ............................ 18 Paradossi, Umberto ............... 55 Parati, Gianfranco .................. 75 Pärkkä, Juha ........................... 83 Parvaneh, Saman ................. 265 Pascale, Patrizio ..................... 50 Passini, Elisa ......................... 246 Patel, Amit ............................. 99 Patel, Amit R ........................ 190 Pedron-Torrecilla, Jorge ....... 253 Pellegrini, Alessandro .. 100, 166 Peluffo-Ordóñez, Diego Hernán
......................................... 185 Peñaranda, Angelina .............. 79 Pepi, Mauro ......................... 148 Perdrix, Ludivine .............. 1, 187 Pérez Turiel, Javier ............... 116 Pérez-David, Esther .............. 253 Perlman, Or .......................... 182 Petrakis, Yannis ...................... 21 Petrėnas, Andrius ..................... 4 Petrie, Adam .......................... 70 Philimonova, Irina .................. 41
Computing in Cardiology 2012, Kraków, Poland 289

Piazza, Caterina ....................219 Pieciak, Tomasz ......................98 Pierre, Maison-Blanche ........118 Pierre, Roussel .....................118 Piętka, Ewa ...........................155 Piskorski, Jarosław .................75 Pitschner, Heinz-Friedrich ....276 Pladys, Patrick ......................103 Pociask, Elżbieta ...................152 Polak, Miłosz .. 78, 208, 218, 250 Polak, Sebastian .... 78, 208, 218,
250 Pollard, Tom .........................132 Pont, Oriol ............................198 Pontone, Gianluca ................148 Poree, Fabienne ...................173 Porta, Alberto .......................169 Portacio, Gonzalo .................200 Positano, Vincenzo ...............144 Potocnak, Tomas ..................177 Potyagaylo, Danila ............ 9, 270 Priori, Silvia.............................28 Prokopova, Rada ..................171 Provaznik, Ivo .......................177 Pruvot, Etienne ......................50 Pueyo, Esther ................. 36, 184 Puzzuoli, Stefano ..................144 Qian, Mingqi ...........................64 Rabinovich, Alexander .........238 Radon, Patricia .....................211 Raffo, Luigi ............. 18, 142, 143 Rahimi, Azar .........................269 Rajamani, Sridharan ....... 63, 254 Ramírez, Esteban..................245 Ramírez, Julia .......................184 Ramos López, Javier ...............24 Ramos, Rafael .......................214 Ramos-Castro, Juan ...... 256, 260
Raschhofer, Stefan ................. 25 Reddy, Rajkiran ...................... 23 Redheuil, Alban ........ 1, 156, 187 Reichlin, Tobias .................... 180 Remartínez, Jose M .............. 112 Rémi, Dubois ........................ 118 Rengo, Franco .............. 262, 263 Requena Carrión, Jesús .. 92, 233 Rieta, JJ... 52, 181, 220, 221, 223 Rioux, Myriam ...................... 234 Rivera Farina, Pedro Virgilio 116 Rivolta, Massimo W ............. 225 Rocca, Emiliano ...................... 55 Rödel, Kolja ............................ 56 Rodrigo, Miguel.................... 193 Rodriguez, Blanca ................ 242 Rodríguez, Blanca .................. 36 Rodríguez, Daniel ................. 151 Rodriguez, Jose F.............. 11, 60 Rodriguez-Ibañez, Noelia ..... 256 Rodriguez-Sotelo, Jose Luis .. 185 Rojo Álvarez, José Luis ........... 24 Rojo-Álvarez, José Luis .... 46, 95,
102 Rojo-Álvarez, José Luís ......... 151 Rojo-Álvarez, José-Luis ........... 47 Roman, Maniewski .............. 215 Romano, Maria .................... 262 Romero, Iñaki ......................... 13 Romero, Lucia ........ 63, 236, 244 Ronzhina, Marina ......... 175, 177 Rose, Georg H ...................... 162 Rosenqvist, Mårten ................ 51 Roses, E ................................ 232 Roses, Edu .............................. 53 Rubicsek, Sandor .......... 212, 217 Rubinfeld, Ilan ................ 57, 136 Rubio Martín, Óscar Jesús ..... 22
290 Computing in Cardiology 2012, Kraków, Poland

Ruiz de Gauna, Sofía ................ 7 Ruiz, Jesús .................... 7, 8, 186 Sachse, Frank B ......................65 Safara, Fatemeh .....................58 Safdarian, Naser ............. 88, 140 Saiz, Javier . 60, 63, 95, 229, 236,
242, 244, 254 Sáiz, Javier ............................245 Sánchez, Carlos ......................36 Sankaranaryanan, Aviinaash ..76 Sano, Hitomi ................... 80, 247 Sanromán-Junquera, Margarita
...........................................95 Santiago-Mozos, Ricardo .....151 Santos, Andres .....................191 Sapp, John ................................ 5 Sapp, John L.............................. 6 Sarabia-Cachadiña, Elena .......47 Saraee, Shahab .....................238 Sarlak, Pouria .......................264 Sarvazyan, Narine A .............120 Sassi, Roberto ................. 19, 225 Schalij, Martin J ......................91 Schilling, Christopher ...........222 Schlegel, Todd T .....................27 Schlindwein, Fernando . 117, 273 Schmid, Jochen .......................62 Schmidt, Samuel Emil ....... 3, 203 Schmitt, Claus .......................222 Scholz, Eberhard P..................62 Schotten, Ulrich ....................252 Schreiber, Ulrich .....................56 Schreier, Guenter .................145 Schreier, Günter .....................25 Schuleri, Karl H .....................275 Schulze, Walther HW ....... 9, 270 Scott, Daniel J .........................66 Sebastian, Rafael ....................60
Seeman, Gunnar .................... 36 Seemann, Gunnar 32, 35, 62, 65,
81 Seppänen, Tapio .................. 224 Setarehdan, Seyed Kamaledin
......................................... 264 Severeyn, Erika............. 116, 126 Severi, Stefano .. 28, 61, 77, 147,
246 Sfakianakis, Stelios ................. 21 Sharkey, Emma .................... 227 Shi, Pengcheng ..................... 205 Shiguemi Furuie, Sergio ....... 157 Shiguemi Furuie, Sérgio ....... 150 Shim, Eun Bo ........................ 237 Shu, Lixia .............................. 153 Shyu, Liang-Yu ...................... 159 Si, Xiaoqin............................. 268 Sidek, Khairul Azami ............... 26 Silva, Ikaro .............................. 66 Simon, Antoine .............. 42, 192 Simón, Fernando .................. 196 Simon, Ildiko ................ 212, 217 Simova, Iana ......................... 168 Singh, Rupinder ...................... 39 Šinigoj, Petra .......................... 27 Skonieczka, Slawomir ............. 43 Skórka, Tomasz .................... 154 Smaill, Bruce .................. 37, 194 Smets, Koen ......................... 108 Smith, Rachel ....................... 226 Smolen, Magdalena ............... 26 Soguero Ruiz, Cristina ............ 24 Solovyova, Olga .............. 41, 122 Sörnmo, Leif ............................. 4 Sotaquira, Miguel ........... 38, 166 Spilka, Jiří ............................. 257 Spragg, David ....................... 275
Computing in Cardiology 2012, Kraków, Poland 291

Staalsen, Niels-Henrik .............. 3 Starc, Vito ...............................27 Starobin, Joseph .....................94 Stary, T ...................................61 Steinhoff, Uwe .....................211 Strasz, Anna ..........................261 Stridh, Martin .........................51 Struijk, Johannes J ................207 Struijk, Johannes Jan ............203 Strumiłło, Paweł ...................258 Strzelecki, Michal ...................43 Stübner, Dorian ......................53 Stucht, Daniel .......................162 Su, Yilun ................................130 Such-Miquel, LM ..................232 Sun, Yi ...................................106 Surmann, Hartmut ...............228 Svehlikova, Jana ...................235 Swenne, Cees A .............. 91, 119 Syed, Zeeshan .. 57, 71, 136, 167 Syeda-Mahmood, Tanveer .....59 Szilágyi, László ...... 206, 240, 249 Szilágyi, Sándor M .......206, 240,
241, 249 Szuszai, Tamas .............. 212, 217 Taddei, Alessandro .................55 Tarroni, Giacomo .................190 Tarvainen, Mika............ 109, 255 Tarvainen, Mika P.................110 Tavakolian, Kouhyar .............200 Tavard, François ............. 42, 192 Tcivian, Pavel ..........................41 Teixeira, Cesar A .....................31 ter Haar, Cornelia C ................91 Thomsen, Morten B .............207 Tian, Yingli ............................106 Tiinanen, Suvi .......................224 Tobón, Catalina ......................95
Todorova, Lyudmila ............. 171 Tomasi, Corrado ................... 147 Tomita, Masaru .............. 80, 247 Toninelli, Gianfranco .............. 48 Tormos, A ............................. 232 Trapero, I .............................. 232 Trayanova, Natalia ............... 237 Trayanova, Natalia A ................ 2 Trenor, Beatriz63, 236, 244, 254 Trénor, Beatriz ..................... 245 Tristani-Firouzi, Martin .......... 65 Tsanas, Athanasios ................. 67 Tsao, Hsuan-Ming ................ 159 Tsuji, Masatsugu .................... 12 Tulppo, Mikko P ................... 267 Turco, Dario ......................... 147 Twerenbold, Raphael ........... 180 Tyrankiewicz, Urszula .......... 154 Tysler, Milan......................... 235 Ulbrich, Mark ......................... 10 Vaglio, Martino ...................... 48 Vaida, Pierre ......................... 166 Vairavan, Srinivasan ............. 105 Väisänen, Juho ............... 92, 233 Valentinuzzi, Max E .............. 178 Valenza, Gaetano ................... 73 Vallverdú, Montserrat ......... 169 Valverde, Esteban R ............. 179 van Dam, Eelco .................... 272 van Dam, Peter ........ 89, 90, 272 Van den Bulcke, Tim ............ 108 van der Putten, Niek ........ 89, 90 Van Esbroeck, Alexander ...... 71,
136, 167 van Gils, Mark ........................ 83 Van Huffel, Sabine ..... 30, 72, 74 van Oosterom, Adriaan .......... 82 Van Zaen, Jérôme .................. 50
292 Computing in Cardiology 2012, Kraków, Poland
Vandeput, Steven ...................72 Vanheusden, Frederique ......273 Varadarajan, Vivek .................94 Varon, Carolina ................ 30, 72 Vasilyeva, Anastasia .............122 Verbrugghe, Walter .............108 Verheule, Sander ..................252 Vesin, Jean-Marc ....................50 Viengkhou, Vincent ..............110 Vigo, Chiara ............................48 Villani, Valeria ........................14 Villegas, Ricardo ...................158 Viso, Alain ...............................50 Vlemincx, Elke ........................74 Vogel, Rolf ..............................17 Vogt, Rainer ..........................111 von Wagner, Gero ................211 Voss, Andreas .......................169 Vrhovec, Miloš .......................27 Vukovic, Marija ....................145 Wailoo, Michael ...................117 Walter, Marian ............... 10, 111 Wang, John ............................... 5 Wang, Linwei ........ 205, 239, 269 Warren, James ......................... 5 Warren, James W ..................... 6 Warrick, Philip A ...................113 Weinert, Lynn .........................40 Weissman, Noam .................182 Wenz, Heinrich .......................29 Widatalla, Namareq Salah
Mohamed .........................170 Widjaja, Devy ................... 72, 74 Wilhelms, Mathias .................62 Williams, John C ....................... 2 Wiśniowska, Barbara .....78, 208,
218, 250 Woie, Leik ....................... 97, 183
Wolter, Stefan ...................... 111 Wong, Ken ............................ 205 Wong, Ken CL ....................... 269 Wong, Sara ........... 116, 126, 161 Wu, Minfeng ........................ 137 Xavier, Soumya .................... 197 Xia, Henian ..................... 70, 226 Xia, Jean ............................... 274 Xia, Ling .......................... 64, 123 Xu, Jianfeng .......................... 138 Xue, Joel ............................... 107 Yahia, Hussein ...................... 198 Yi, Chucai .............................. 106 Yodwut, Chattanong ...... 40, 190 Yotti, Raquel ......................... 151 Yu, Ronghui .......................... 153 Yves, Coudière ....................... 93 Zaltsberg, Sergei .................. 276 Zang, Yunliang ................ 64, 123 Zareba, Wojciech ................. 274 Zarzoso, M ........................... 232 Zavala-Fernandez, Heriberto163 Zawora, Paweł ...................... 152 Żebrowski, Jan Jacek ............ 259 Zemzemi, Nejib .............. 33, 242 Zeng, Youjie .......................... 138 Zhan, Heqing .................. 64, 123 Zhang, Henggui . 34, 35, 37, 238,
268 Zhang, Jiqian ........................ 268 Zhang, Yuanjian .................... 138 Zhang, Zhe ............................ 209 Zhao, Jichao ................... 37, 194 Zhao, Xiaopeng .............. 70, 226 Zheng, Dingchang . 16, 129, 199,
204, 227 Zheng, Ling ........................... 210 Zigel, Yaniv ........................... 182
Computing in Cardiology 2012, Kraków, Poland 293

Zimmermann, Henrik ...........203 Żurek, Sebastian .....................75
Życka, Dominika ................... 261
294 Computing in Cardiology 2012, Kraków, Poland


