2. CALCULATION METHOD OF GATE INCLUDING SEISMIC LOADSConventional approach
More realistic approach (including dynamic response of gate)
3. DYNAMIC BEHAVIOR OF GATE – QUALIFICATION OF THE NUMERICAL APPROACHFEM modal analysis including Fluid Structure Interaction
On-field measurements
4. SUMMARY OF MAIN RESULTS OF MODAL-SPECTRUM ANALYSIS with FSI calculation
5. CONCLUSION AND FURTHER WORKS
2Gate Modal Analysis – comparison between FEM coupled FSI analysis and on-field measurements
1. Introduction
� This work is an extension of the work
presented in 2014 and 2015 on the
“Spillway Gates at Top of Dam :
Evaluation of Mechanical Resistance to
Earthquakes”
� Focus on study case “segment gate H72”
� Checking the integrity of structure
� Earthquake = accidental load case
(SES spectra)
� Analysis criteria
� Ultimate limit state analysis
� Rules : DIN 19704
(Hydraulic Steel Structures
Design Analysis)
3Gate Modal Analysis – comparison between FEM coupled FSI analysis and on-field measurements
2. Calculation Method including Seismic Loads
� CONVENTIONAL APPROACH (STATIC EVALUATION)
Considered Loads :
� Self weight (P)
� Hydrostatic pressure (Q1)
� Hydrodynamic pressure (A1)-> using Westergaard’s formula (hydrodynamic pressure acting on gates due to dams behavior – gates considered as a rigid body)
� MORE REALISTIC APPROACH (INCLUDING DYNAMIC RESPONSE OF DAM & GATE)
Considered Loads :
� Self weight (P)
� Hydrostatic pressure (Q1)
� Hydrodynamic pressure (A1) -> using Westergaard’s formula (hydrodynamic pressure acting on gates due to dams behavior)
� Dynamic response of immerged gates (A2) – spectrum analysis with FSI analysis
� LOADS COMBINATION (ACCIDENTAL LOAD CASE):
4
∑ +×+× )(8.035.135.1 AiQiPGate Modal Analysis – comparison between FEM coupled FSI analysis and on-field measurements
3. Dynamic Behavior of Gate : Qualification of the
Numerical Approach
� FEM modal analysis including Fluid Structure Interaction calculation
Gate Modal Analysis – comparison between FEM coupled FSI analysis and on-field measurements
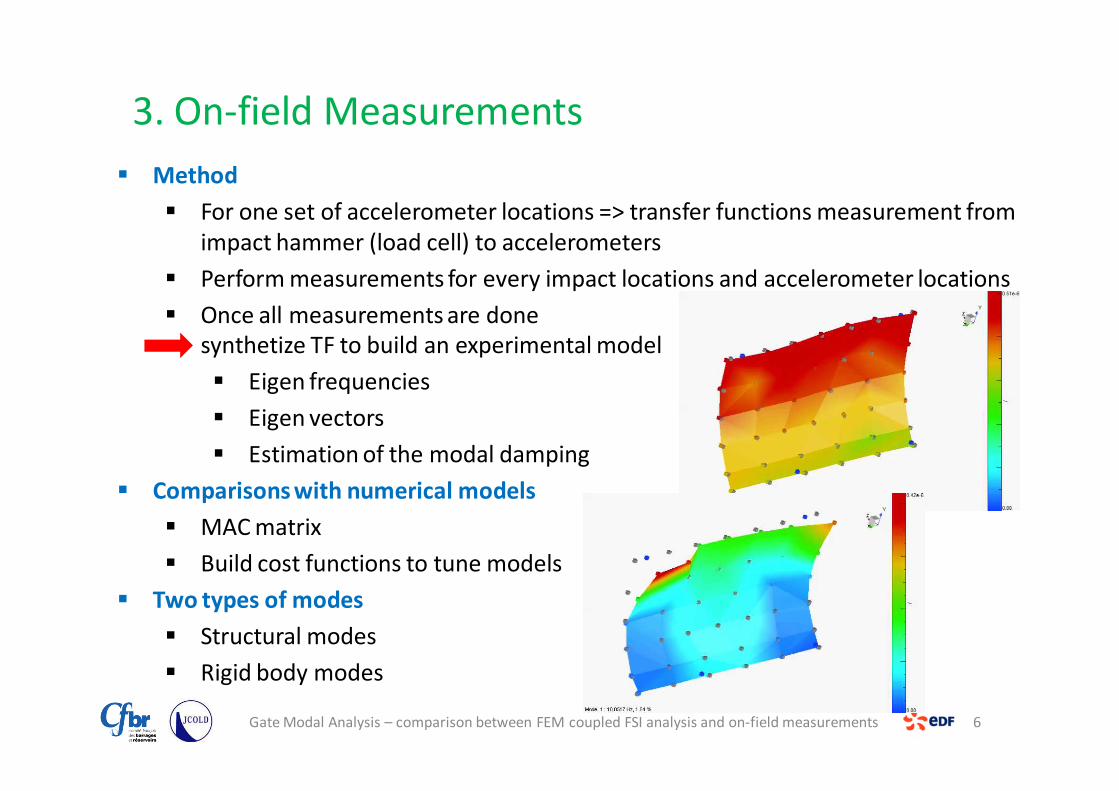
3. On-field Measurements
16
� Conclusions experiments
� 1-week experiment
� 4 configurations tested
� Comparison model vs experiments
� Gate closed – no water: need to improve the boundary conditions at the lateral and lower edges of the gate (seals and preload)
� Gate closed – high water level:
� Westegaard approach overestimates the added mass
� Fluid-structure interaction model gives eigen frequencies in good agreements with measurements
Tuning the model might be necessary
� Damping ratios
� From 1 to 3% when gate « in air »
� From 1,5% to 4,5% when gate is « in water ». Modal damping seems to depend on mode shapes
� Above 10% for suspension modes
Gate Modal Analysis – comparison between FEM coupled FSI analysis and on-field measurements
4. Summary of the Main Results of FEM Modal-
Spectrum analysis with FSI Calculation
� Seismic load
� Soil spectra : Earthquake Safety Assessment
� Floor spectra : calculated at the dam-gate interfaces
17
Floor
Spectra
« H72 »
X
Peak
(f)5.31 g
(8.0 Hz)
Rigid
(f)
1.30 g
(30.0 Hz)
Y
Peak
(f)
1.85 g
(7.0 Hz)
Rigid
(f)
0.49 g
(30.0 Hz)
Z
Peak
(f)
2.12 g
(7.0 Hz)
Rigid
(f)
0.48 g
(30.0 Hz)
Gate Modal Analysis – comparison between FEM coupled FSI analysis and on-field measurements
4. Summary of the Main Results of FEM Modal-
Spectrum Analysis with FSI Calculation� Reaction forces
� Structural strain – Stress
� « Classical Elastic criteria » are not respected,
� Local plastifications
� Buckling criteria are not respected (gate arms)
⇒ Need to conduct an elastoplastic analysis to conclude on the mechanical strength of the gate (rate of plastic deformation seems acceptable)
⇒ Need to determine which mode of instability has to be considered : buckling or excess of plastic deformation
18
« H72 »
ReactionForces
PP (P) 91 kN
Pstat (Q1) 1 053 kN
P hydrodyn. (A1) 927 kN
Spectrum analysis (A2) ± 2 620 kN
r (*) = ≈≈≈≈ 3.5(*) : r = ratio (accidentalsituation / normal situation) for weighted values
Gate Modal Analysis – comparison between FEM coupled FSI analysis and on-field measurements
5. Conclusion and Further Works
19
� MODAL ANALYSIS
� Gate does not have a rigid behavior within the bandwidth of an earthquakefgate in air ≈ 24 Hz fgate in water ≈ 10 Hz (≈ peak of floor spectra)
� FSI analysis is better suited than analysis with added masses : mass of water and distribution must be adjusted (as fair as possible) for each natural frequencies
� Fluid-structure interaction model gives eigen frequencies in good agreements with measurements.
� STRESS ANALYSIS
� Complexity of stress analysis (elastic vs elastoplastic) and design criteria must be adapted to the amplitude of the considered earthquake.
� For the studied gate, seismic stresses (SES spectra) do not seem acceptable. Some mechanical reinforcements should be considered.
� This study was conducted on a unit case. It must be extended toother test cases to qualify the proposed calculation method.
� Some ways have to be still studied as the use of the “set back” (cf publication of Y. NAKAYAMA)
Gate Modal Analysis – comparison between FEM coupled FSI analysis and on-field measurements