19
S-72.3320 Advanced Digital Communication (4 cr) Fiber-optic Communications - Supplementary

S-72.3320 Advanced Digital Communication (4 cr)
Fiber-optic Communications - Supplementary

Timo O. Korhonen, HUT Communication LaboratoryG. Keiser: Optical Fiber Communications, McGraw-Hill, 2nd Ed.

Timo O. Korhonen, HUT Communication LaboratoryG. Keiser: Optical Fiber Communications, McGraw-Hill, 2nd Ed.
Timo O. Korhonen, HUT Communication LaboratoryG. Keiser: Optical Fiber Communications, McGraw-Hill, 2nd Ed.
Timo O. Korhonen, HUT Communication LaboratoryG. Keiser: Optical Fiber Communications, McGraw-Hill, 2nd Ed.

Timo O. Korhonen, HUT Communication LaboratoryG. Keiser: Optical Fiber Communications, McGraw-Hill, 2nd Ed.

Timo O. Korhonen, HUT Communication LaboratoryG. Keiser: Optical Fiber Communications, McGraw-Hill, 2nd Ed.
Timo O. Korhonen, HUT Communication LaboratoryG. Keiser: Optical Fiber Communications, McGraw-Hill, 2nd Ed.

Timo O. Korhonen, HUT Communication LaboratoryG. Keiser: Optical Fiber Communications, McGraw-Hill, 2nd Ed.

Timo O. Korhonen, HUT Communication Laboratory
EDFA - energy level diagram
Pump power injected at 980 nm causes spontaneous emission from E1 to E3 and there back to E2
Due to the indicated spontaneous emission lifetimes population inversion (PI) obtained between E1 and E2
The higher the PI to lower the amplified spontaneous emission (ASE) Thermalization (distribution of Er3+ atoms) and Stark splitting cause each
level to be splitted in class (not a crystal substance) -> a wide band of amplified wavelengths
Practical amplification range 1525 nm - 1570 nm, peak around 1530 nm
Er3+ levels
E1
E2
E3
E4
1530 nm 1480 nm980 nm
980 nm
Fluoride class level(EDFFA)
32 1 s
21 10ms
excited state absorption
Timo O. Korhonen, HUT Communication Laboratory
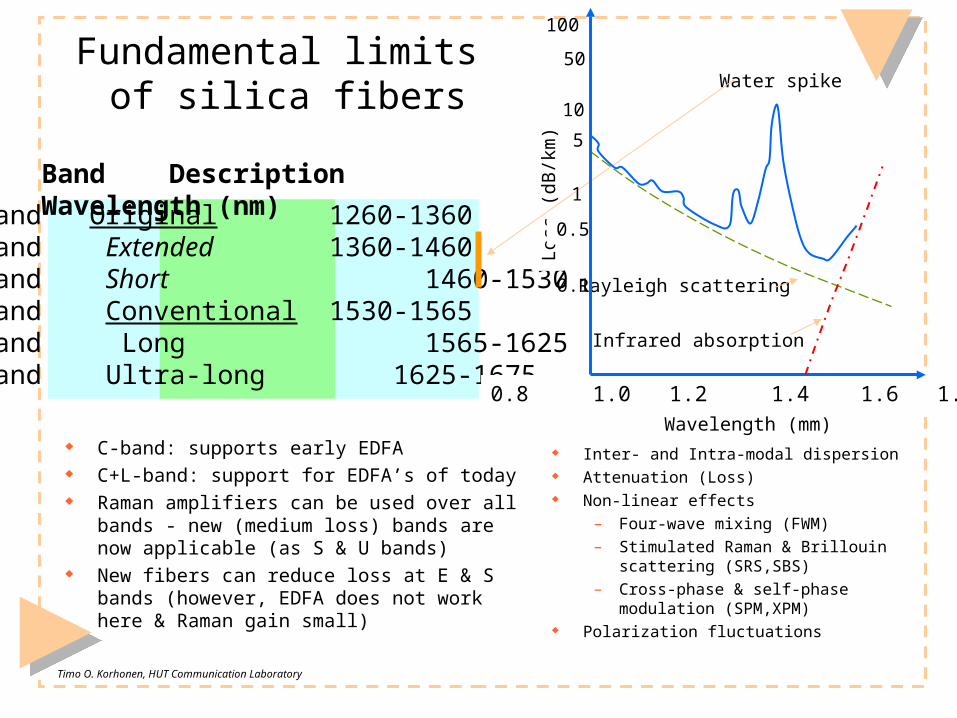
Fundamental limits of silica fibers
C-band: supports early EDFA C+L-band: support for EDFA’s of today Raman amplifiers can be used over all bands - new
(medium loss) bands are now applicable (as S & U bands)
New fibers can reduce loss at E & S bands (however, EDFA does not work here & Raman gain small)
O-band Original 1260-1360E-band Extended 1360-1460S-band Short 1460-1530C-band Conventional 1530-1565L-band Long 1565-1625U-band Ultra-long 1625-1675
Band Description Wavelength (nm)
0.8 1.0 1.2 1.4 1.6 1.8Wavelength (mm)
Water spike
Rayleigh scattering
Infrared absorption
Loss
(dB
/km
)
Inter- and Intra-modal dispersion Attenuation (Loss) Non-linear effects
– Four-wave mixing (FWM)– Stimulated Raman & Brillouin scattering
(SRS,SBS)– Cross-phase & self-phase modulation
(SPM,XPM) Polarization fluctuations
100
50
10
1
0.5
0.1
5
Timo O. Korhonen, HUT Communication Laboratory
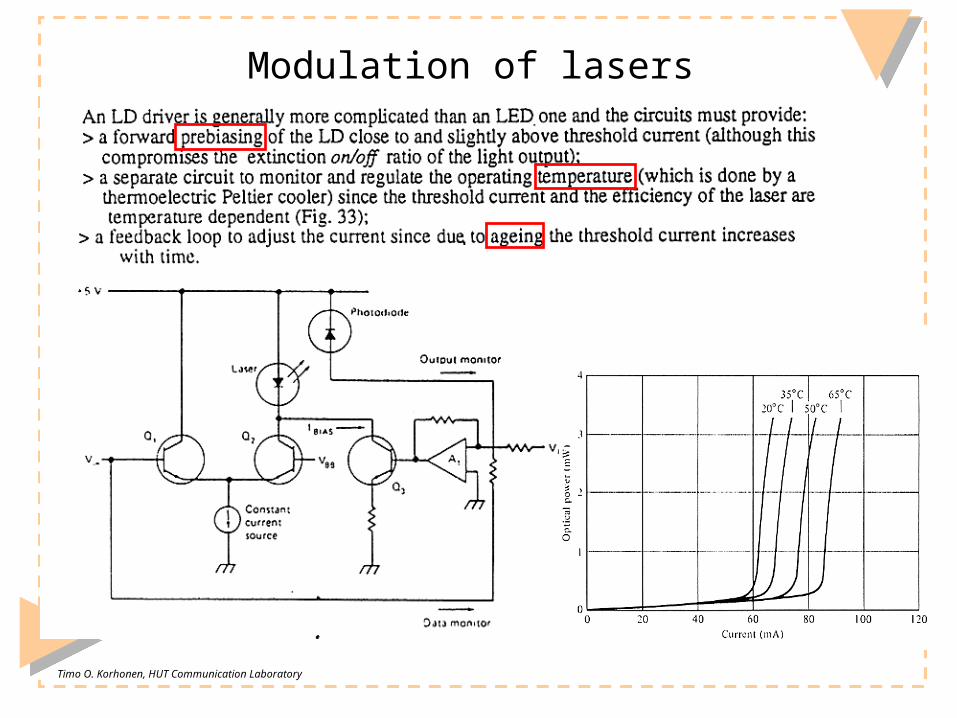
Modulation of lasers

Timo O. Korhonen, HUT Communication Laboratory
LD distortion coefficients Let us assume that an LD transfer curve distortion can be described by
where x(t) is the modulation current and y(t) is the optical power n:the order harmonic distortion is described by the distortion
coefficient
and
For the applied signal we assume and therefore
2 31 2 3( ) ( ) ( ) ( )y t a x t a x t a x t
101
20log nn
AHA
0 1 2 3( ) cos cos2 cos3 ...y t A A t A t A t
( ) cosx t t
1 1
2 22 2
33 3
( ) cos
( ) cos ( ) ( / 2)(1 cos2 )
( ) ( / 4)(3cos cos3 )
a x t a t
a x t t a t
a x t a t t
2
1
3 32 21
3( ) cos cos2 cos32 4 2 4
AA
a aa ay t a t t t
2 22 10 10
1 3 1
3 33 2 10
1 3 1
220log 20log3 4
20log 20log3 4
A aHA a a
A aHA a a

Timo O. Korhonen, HUT Communication Laboratory
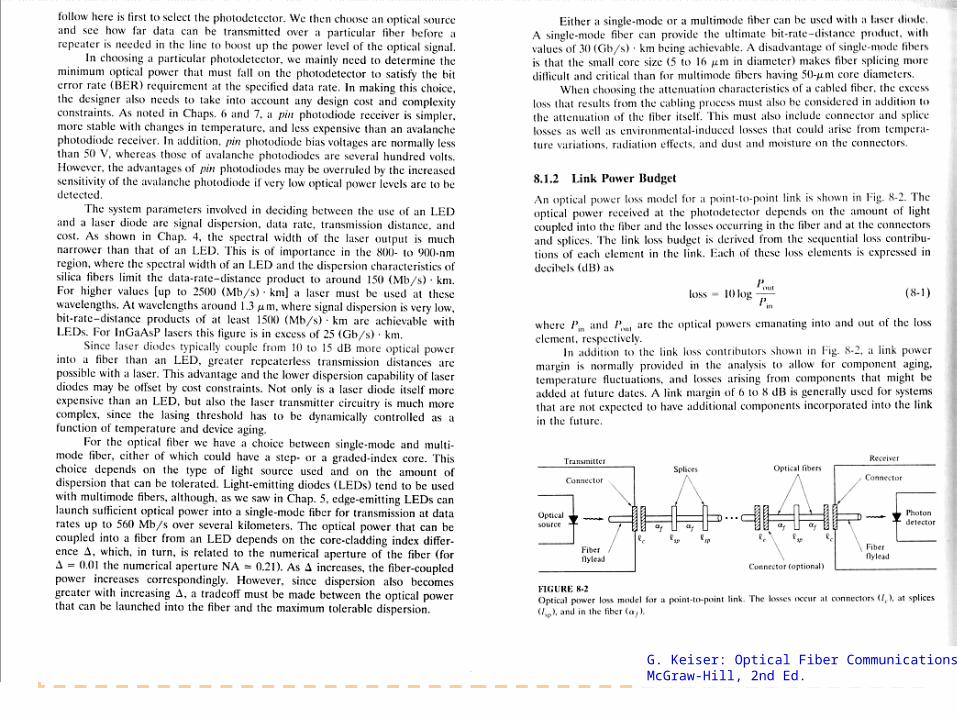
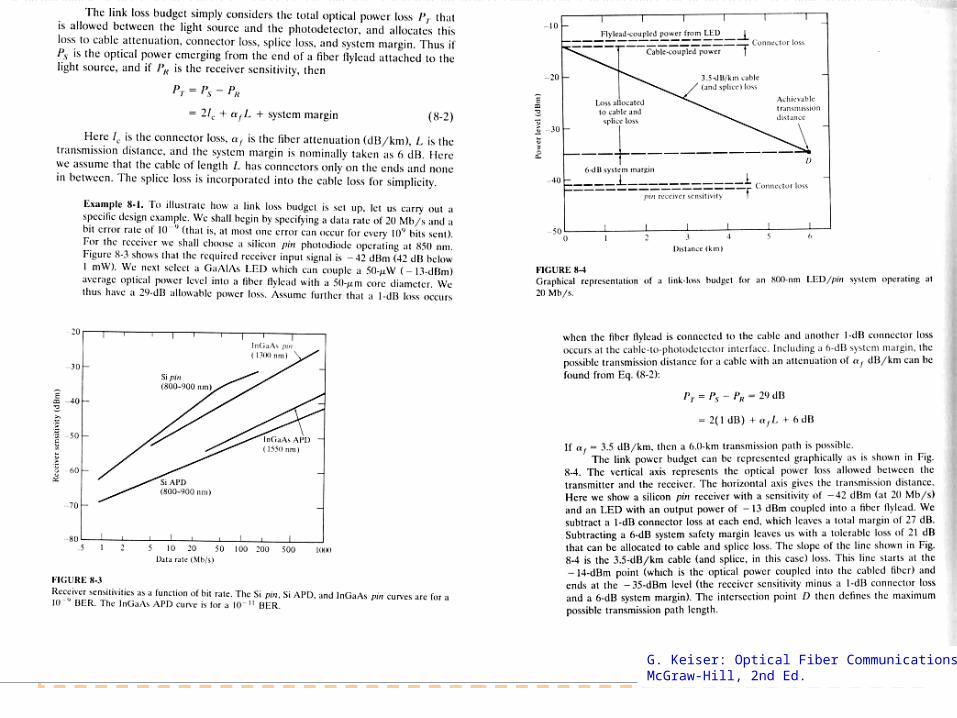
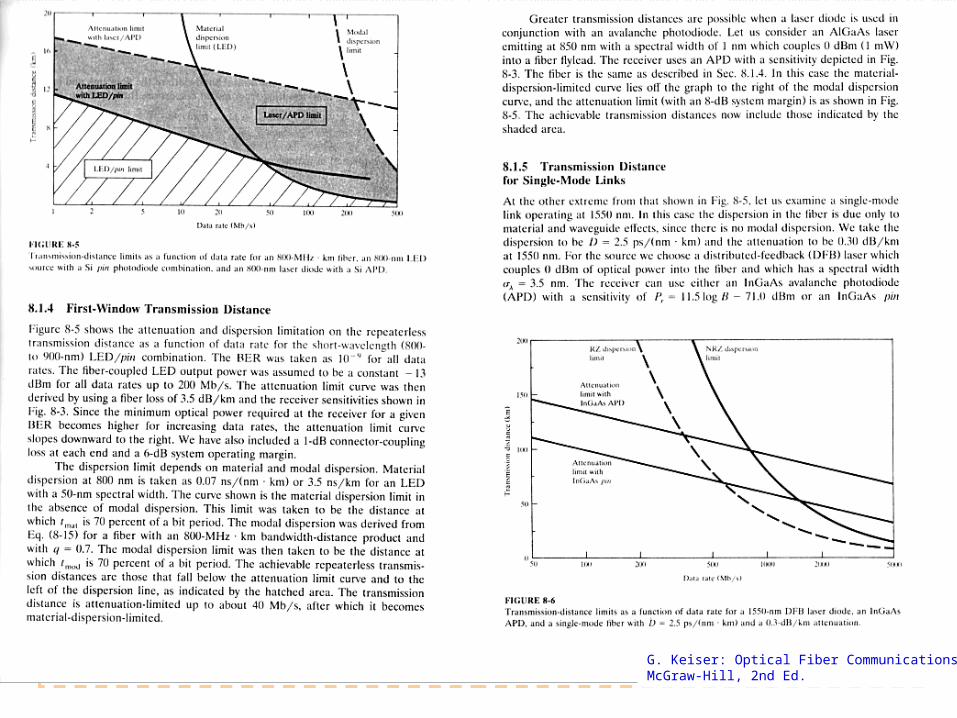
Link calculations In order to determine repeater spacing on should calculate
– power budget– rise-time budget
Optical power loss due to junctions, connectors and fiber One should be able to estimate required margins with respect of
temperature, aging and stability For rise-time budget one should take into account all the rise times in
the link (tx, fiber, rx) If the link does not fit into specifications
– more repeaters– change components– change specifications
Often several design iteration turns are required

Timo O. Korhonen, HUT Communication Laboratory
Link calculations (cont.) Specifications: transmission distance, data rate (BW), BER Objectives is then to select
– Multimode or single mode fiber: core size, refractive index profile, bandwidth or dispersion, attenuation, numerical aperture or mode-field diameter
– LED or laser diode optical source: emission wavelength, spectral line width, output power, effective radiating area, emission pattern, number of emitting modes
– PIN or avalanche photodiode: responsivity, operating wavelength, rise time, sensitivity
FIBER:
SOURCE:
DETECTOR/RECEIVER:

Timo O. Korhonen, HUT Communication Laboratory
The bitrate-transmission length grid1-10 m 10-100 m 100-1000 m 1-3 km 3-10 km 10-50 km 50-100 km >100 km
<10 Kb/s10-100 Kb/s100-1000 Kb/s1-10 Mb/s10-50 Mb/s50-500 Mb/s500-1000 Mb/s>1 Gb/s
I
II
III IV
VV
VI
VII
I Region: BL 100 Mb/s SLED with SI MMFII Region: 100 Mb/s BL 5 Gb/s LED or LD with SI or GI MMFIII Region: BL 100 Mb/s ELE
D or LD with SI MMFIV Region: 5 Mb/s BL 4 Gb/s ELED or LD with GI MMFV Region: 10 Mb/s BL 1 Gb/s LD with GI MMFVI Region: 100 Mb/s BL
100 Gb/s LD with SMF
VII Region: 5 Mb/s BL 100 Mb/s LD with SI or GI MMF
SI: step index, GI: graded index, MMF: multimode fiber, SMF: single mode fiber

Timo O. Korhonen, HUT Communication Laboratory
Using Mathcad to derive connection between fiber bandwidth and rise time
g t( )
exp t2
2 2
2 G f( ) exp 2 2 f2 2
2 g 0( ) 1
22
exp
t h2
2 2
2
14
2
0
t h 2 ln 2( )
2 ln 2( )
t h
2 ln 2( )
G 0( ) 12
2
exp 2 2 f 3dB2 2
2
14
2
0 f 3dB
12 ( )( )
2 ln 2( )
1
2 ( )( )2 ln 2( )
1
2 ( )( )2 ln 2( ) substitute
t h
2 ln 2( ) yeilds 1
t hln 2( )
f 3dBln 2( )
t hln 2( )
0.221 t FWHM 2 t h

Timo O. Korhonen, HUT Communication Laboratory Ref: A.B.Carlson: Communication Systems, 3rd ed

Timo O. Korhonen, HUT Communication Laboratory Ref: A.B.Carlson: Communication Systems, 3rd ed


