Saccadic eye movements and executive function in children with fetal alcohol spectrum
disorders (FASD): Results from a multi-centered study. Ph.D. Thesis, Queen’s
University, Kingston, Ontario, Canada, August 2008.
A serious consequence of maternal consumption of alcohol during pregnancy is the fetal
alcohol syndrome (FAS): characterized by growth deficiency (both pre- and post-natal),
craniofacial dysmorphology and central nervous system (CNS) dysfunction. However, in
the absence of the characteristic facial features, and without confirmed history of alcohol
exposure, clinical diagnosis remains a significant challenge. Recently, the term fetal
alcohol spectrum disorders (FASD) has been adopted to encompass all diagnoses relating
to a history of prenatal alcohol exposure. The purpose of this study was to test the
following three general hypotheses: Children with FASD 1) demonstrate specific deficits
in oculomotor control that can be measured using saccadic eye movement tasks, 2)
display specific deficiencies in multiple domains of executive function that can be
determined using standardized neuropsychological tasks, and 3) reveal deficits in
oculomotor control that correlate with deficiencies in executive function as measured
using standardized neuropsychological tasks. A preliminary study revealed significant
deficits in saccadic eye movement tasks and provided the foundation for a large, multi-
centered study assessing oculomotor control and neuropsychological function in children
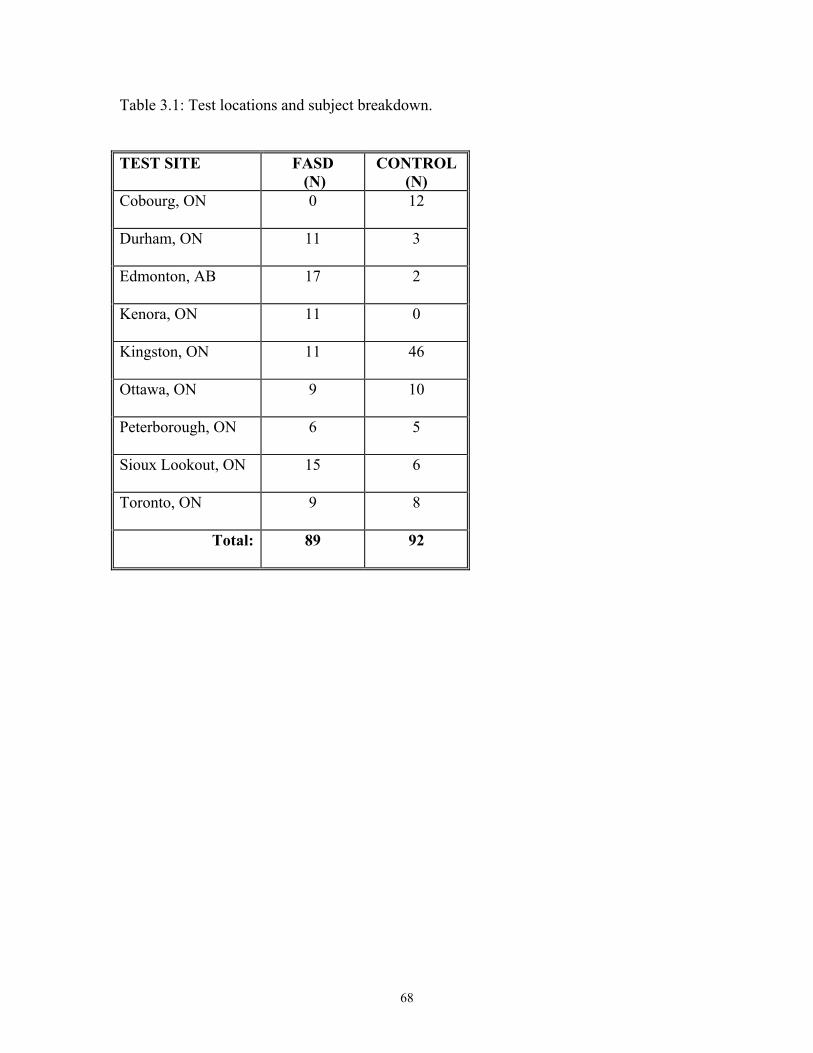
with FASD. A mobile laboratory was created, which facilitated recruitment of 92 control
subjects and 89 subjects with FASD. We found significant evidence for oculomotor
deficits across multiple outcome measures following the saccadic eye movement
ii
experiments, especially for oculomotor tasks that probe aspects of executive function.
Additionally, children with FASD exhibited performance deficits in neuropsychological
tasks that assess planning, attention, spatial working memory and strategy; cognitive
skills also included within the domain of executive function. Finally, significant
correlations between these two objective measures were found for children with FASD,
which were not evident in the control sample. These findings are consistent with
significant frontal lobe dysfunction. This is an exciting area of research that may hold
promise in developing effective screening tools that can assist in the diagnosis of
individuals with a history of prenatal alcohol exposure.
iii
CO-AUTHORSHIP
The research described in this thesis was conducted by Courtney Green in collaboration
with Alanna Mihic under the supervision of Dr. James Reynolds and Dr. Douglas Munoz,
who conceived the studies described herein. Courtney Green conducted and analyzed all
eye movement experiments described in Chapters 2 and 3; conducted neuropsychological
testing and analyzed all data described in Chapter 4; performed all data analysis
described in Chapter 5; collected all Demographic, Connors’ Rating Scale and
Questionnaire information and performed analyses where relevant (see Appendix F), and
wrote the first draft of each Chapter in the thesis. Alanna Mihic assisted with the
collection of CANTAB data.
iv
ACKNOWLEDGEMENTS
I would like to express my sincere gratitude and thanks for the countless hours of
assistance and support provided by my two exceptional supervisors Dr. James N.
Reynolds and Dr. Douglas P. Munoz. This has been an incredibly exciting adventure and
I am both thrilled and indebted to have been brought on board.
I would also like to thank my committee member Dr. James F. Brien, whose advice and
guidance I cherish. There are few words to describe his support throughout this process.
I wish to thank the members of both laboratories (past and present) for their help
throughout the years; and in particular: Alanna Mihic, Amy Hewitt, Kayla Shea,
Stephanie Bell, Susan Kobus, Margo Poklweska-Koziell, Alicia Peltsch, Rebecca
Hakvoort-Schwerdtfeger, Ian Cameron, Nadia Alayhan, Don Brien, Irene Armstrong and
Susan Boenke for their friendship.
I would like to thank my family for their unconditional love and support over the many,
many years. Dad, Mom, Cameron, Jessica and Shirlei: I wish there was another word for
“thank you”. And to my extended family, who have made me feel so special: Gary,
Mary, Geoff, Sara Jo, Genevieve, Samuel and Gabrielle.
To the newest love of my life, Jakeson I cannot wait to see what you become. And last,
but definitely not least, I would like extend a most heartfelt thank you to my husband
Doug, who has stuck by me as I pursued a career as a professional student. This has been
v
a long journey and one that I would not have survived without his love and support. To
the two most important men in my life, this is dedicated to you.
This research was financed by operating grants and a New Emerging Team on Fetal
Alcohol Syndrome grant from the Canadian Institutes of Health Research, and the
Botterell Foundation of Queen’s University. The Centre for Neuroscience Studies
provided personal funding, and I was the recipient of an Ontario Graduate Scholarship for
the duration of my doctoral studies.
vi
TABLE OF CONTENTS
Abstract ii-iii
Statement of Co-Authorship iv
Acknowledgements v-vi
Table of Contents vii-x
List of Tables xi
List of Figures xii-xiii
List of Abbreviations and Symbols xiv-xv
Chapter 1: General Introduction 1
1.1 Statement of the Research Problem 1 1.2 Diagnostic Systems, Guidelines and Codes 2 1.2.1 Early Diagnostic Guidelines 3 1.2.2 Current Diagnostic Guidelines 8 1.3 Diagnostic Approaches to FASD 16
1.3.1 Assessing Neurological Function: Tools and Techniques 17 1.3.2 Assessing Craniofacial Dysmorphology: Tools and Techniques 21 1.3.3 Assessing Visual and Oculomotor Impairments: Tools and Techniques 26 1.4 Eye Movement Experiments: Saccades 28
1.4.1 Neurophysiology of Saccadic Eye Movements 31
1.5 Research Rationale, Hypothesis and Objectives 34
Chapter 2: Deficits in Eye Movement Control in Children with Fetal Alcohol Spectrum Disorders 36 2.1 Introduction 36 2.2 Materials and Methods 40 2.2.1 Participants 40 2.2.2 Saccade Task 42 2.2.3 Recording and Analysis of Eye Movements 43
vii
2.2.4 Data Analysis 44 2.3 Results 45 2.3.1 SRT 45 2.3.2 Coefficient of Variation 49 2.3.3 Express Saccades 50 2.3.4 Direction Errors 51 2.3.5 Metrics 51 2.4 Discussion 54 2.4.1 Eye Movement Abnormalities and Developmental Disorders 54 2.4.2 Neural Circuitry 56 2.4.3 The Accumulator Model 58 2.4.4 Study Limitations 62 2.4.5 Conclusion 62 Chapter 3: Executive function deficits in children with Fetal Alcohol Spectrum Disorders assessed using a mobile eye tracking Laboratory 64 3.1 Introduction 64 3.2 Materials and Methods 67 3.2.1 Participants 67 3.2.2 Saccade Task 69 3.2.3 Recording and Analysis of Eye Movement 70 3.2.4 Inclusion/Exclusion criteria 71 3.2.5 Data Analysis 72 3.3 Results 74 3.3.1 Saccadic Reaction Time 74 3.3.2 Coefficient of Variation in SRT 79 3.3.3 Express Saccades 80 3.3.4 Direction Errors 80 3.3.5 Age 82 3.4 Discussion 84 3.4.1 Oculomotor Circuitry 84 3.4.2 Developmental Delay and FASD Subgroups 87 3.4.3 Conclusion 88
viii
Chapter 4: Executive function deficits in children with fetal alcohol spectrum disorders (FASD) measured using the Cambridge Neuro- psychological Tests Automated Battery (CANTAB) 90 4.1 Introduction 90 4.2 Materials and Methods 95 4.2.1 Participants 95 4.2.2 Neuropsychological Battery: CANTAB® 98
4.2.2.1 Reaction Time (RTI) 99 4.2.2.2 Stockings of Cambridge (SOC) 99 4.2.2.3 Match to Sample Visual Search (MTS) 100 4.2.2.4 Spatial Working Memory (SWM) 100 4.2.3 Data Analysis 101 4.3 Results 102 4.3.1 Reaction Time (RTI) 102 4.3.2 Stockings of Cambridge (SOC) 104 4.3.3 Match to Sample Visual Search (MTS) 106 4.3.4 Spatial Working Memory (SWM) 108 4.3.5 Effect Size 108 4.3.6 Diagnostic Subgroups 111 4.4 Discussion 113 Chapter 5: Deficits in oculomotor control are correlated with performance in executive function tasks in children with Fetal Alcohol Spectrum Disorders (FASD) 118 5.1 Introduction 118 5.2 Materials and Methods 121 5.2.1 Participants 121 5.2.2 Volitional Antisaccade Task 121 5.2.3 Neuropsychological Tasks 122 5.2.4 Data Analysis 123 5.3 Results 124 5.4 Discussion 128 5.4.1 The antisaccade 128 5.4.2 Neuropsychological outcome measures 130 5.4.3 Conclusion 132
Appendix A: Institute of Medicine: Diagnostic Criteria for Fetal Alcohol Syndrome (FAS) and Alcohol-Related Effects 152 Appendix B: 4-digit diagnostic code 155 Appendix C: Centers for Disease Control and Prevention. Brief Outline of Diagnostic criteria for Fetal Alcohol Syndrome 158 Appendix D: Canadian diagnostic guidelines for FASD 160 Appendix E: Clarification of the 1996 IOM Criteria for Diagnosis of FASD 161 Appendix F: Demographics, Connors Rating Scale and Questionnaire 164 F.1 Demographics 164 F.2 Connors Rating Scale 164 F.3 Questionnaire 164 Table F.1 Demographic data for subjects 165 Figure F.1 Connors Rating Scale T-scores 166
x
LIST OF TABLES
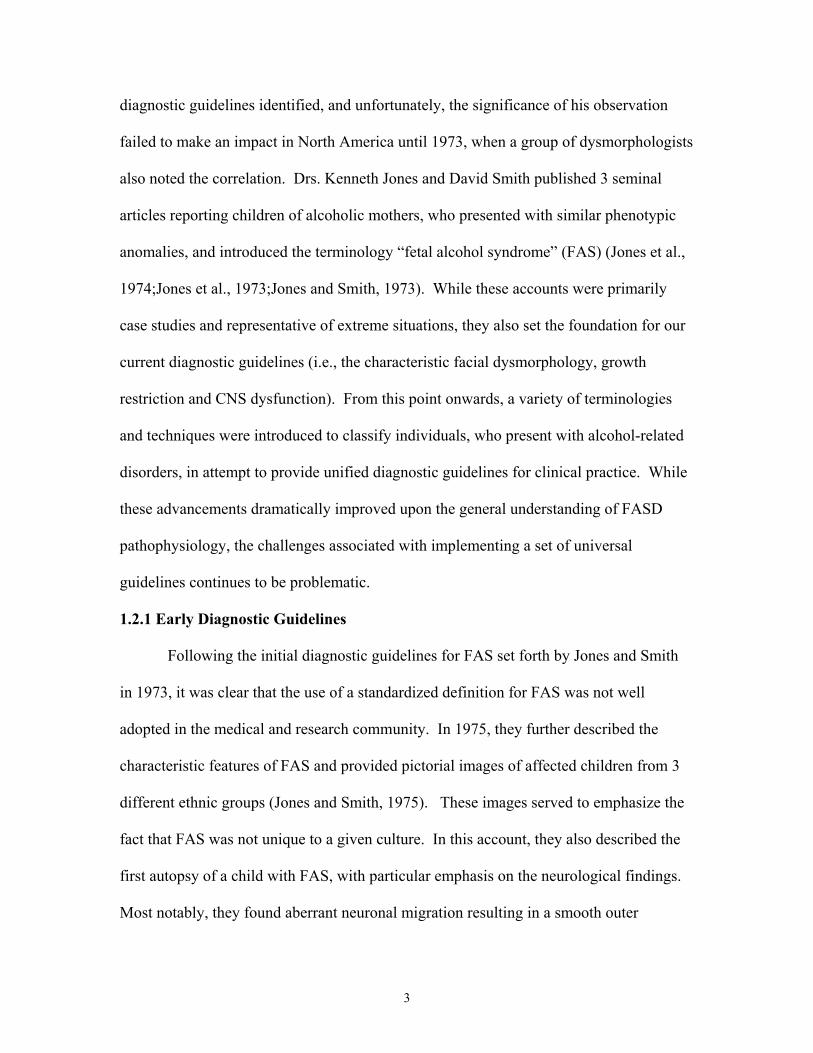
1.1 Syndromes with similar phenotypic features to FAS. 10-11
2.1 FASD subject information. 41
2.2 Saccade metrics from the prosaccade task. 52
3.1 Test locations and subject breakdown. 68
3.2 Subject performance breakdown by task and condition for children with FASD and controls. 73 4.1 Medication history for subjects. 96 4.2 Comorbidity history for subjects. 97
4.3 Effect Size. 110
xi
LIST OF FIGURES
1.1 The pro- and antisaccade task. 30
1.2 Brain areas involved in saccade control. 32
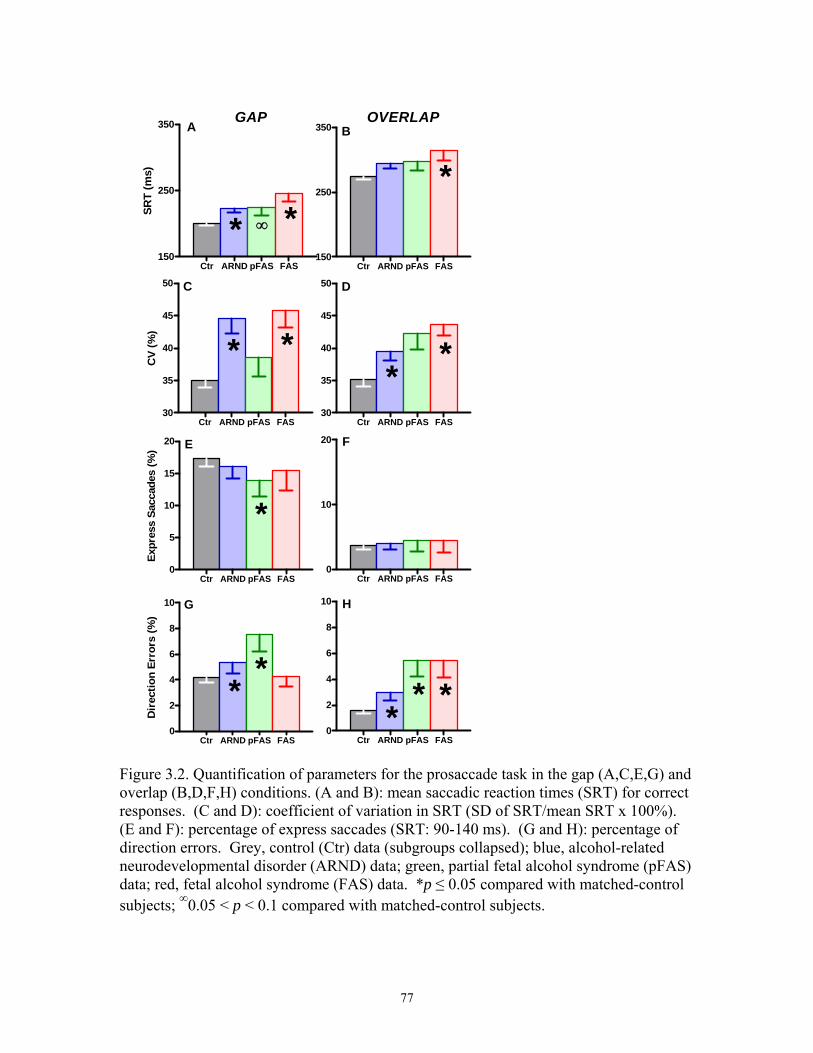
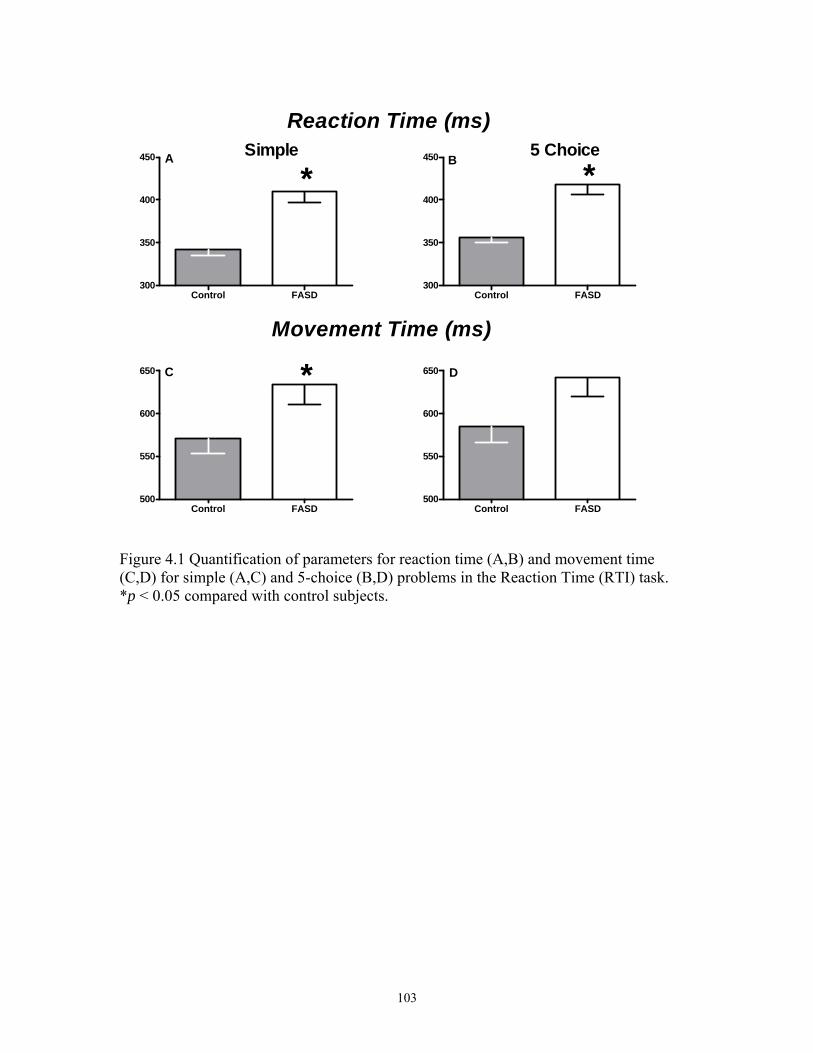
2.1 Cumulative distribution of saccadic reaction times for correct responses and direction for prosaccade and antisaccade trials in the gap and overlap conditions. 46 2.2 Quantification of parameters in the gap and overlap conditions for the prosaccade task. 47 2.3 Quantification of parameters in the gap and overlap conditions for the antisaccade task. 48 2.4 Accumulator model to describe eye movement abnormalities in FASD. 60 3.1 Cumulative distribution of saccadic reaction times for correct responses and direction for prosaccade and antisaccade trials in the gap and overlap conditions across FASD subgroups versus controls. 75 3.2 Quantification of parameters in the gap and overlap conditions for the prosaccade task across FASD subgroups versus controls. 77 3.3 Quantification of parameters in the gap and overlap conditions for the antisaccade task across FASD subgroups versus controls. 78 3.4 Mean saccadic reaction times and direction errors versus age for the antisaccade task in the gap and overlap conditions. 83 4.1 Quantification of parameters for reaction time and movement time for simple and 5-choice problems in the Reaction Time (RTI) task. 103
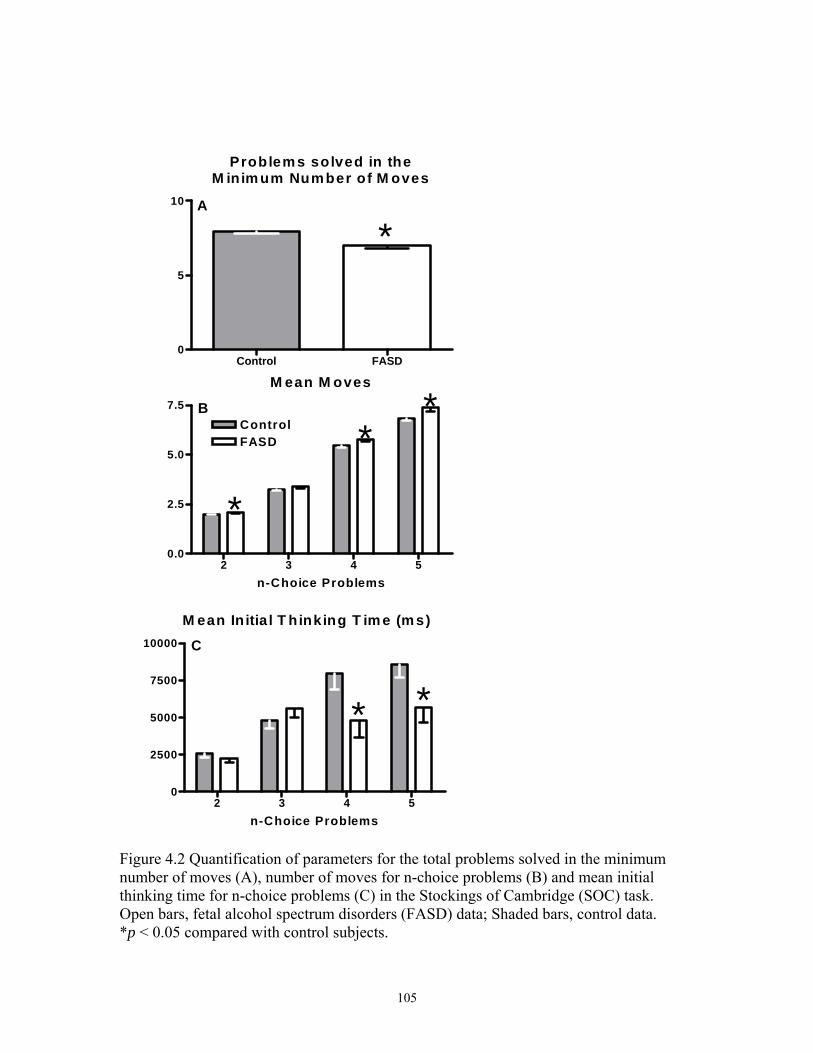
4.2 Quantification of parameters for the total problems solved in the minimum number of moves, number of moves for n-choice problems and mean initial thinking time for n-choice problems in the Stockings of Cambridge (SOC) task. 105
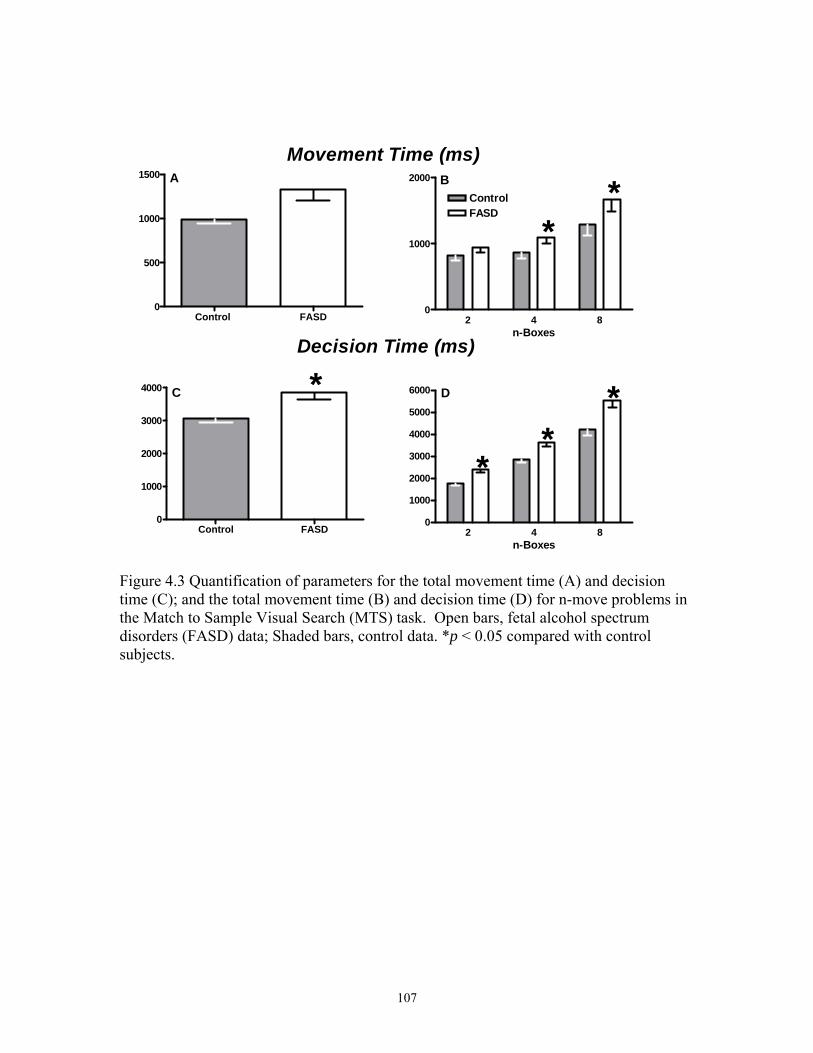
4.3 Quantification of parameters for the total movement time and decision time; and the total movement time and decision time for n-move problems in the Match to Sample Visual Search (MTS) task. 107
xii
4.4 Quantification of parameters for the total between errors and between errors for n-box problems; and the strategy score in the Spatial Working Memory (SWM) task. 109
4.5 Quantification of the total problems solved in the minimum number of moves in the Stockings of Cambridge (SOC) task across diagnostic subgroups. 112
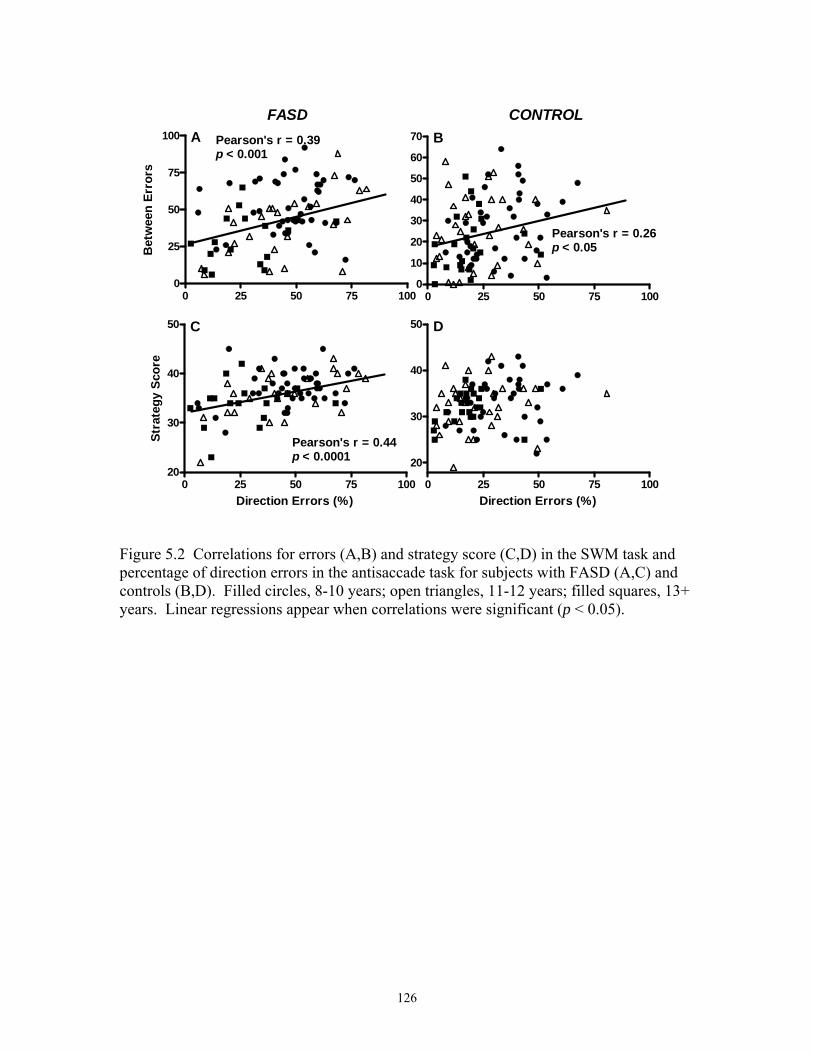
5.1 Correlations for the initial thinking time for 4-choice and 5-choice problems in the SOC task and percentage of direction errors in the antisaccade task for subjects with FASD and controls. 125 5.2 Correlations for between errors and strategy in the SWM task and percentage of direction errors in the antisaccade task for subjects with FASD and controls. 126
xiii
LIST OF ABBREVIATIONS AND SYMBOLS
ADHD Attention-deficit hyperactivity disorder ANOVA analysis of Variance ARBD Alcohol-related birth defects ARND Alcohol-related neurodevelopmental disorder BOLD blood-oxygen-level dependent CANTAB® Cambridge Neuropsychological Test Automated Battery CDC Centers for Disease Control and Prevention cd/m2 one candelas per square meter CNS central nervous system CV coefficient of variation dlPFC dorsolateral prefrontal cortex EOG Electrooculography FAE (Possible/Suspected) Fetal alcohol effects FAS Fetal alcohol syndrome FASD Fetal alcohol spectrum disorders FEF frontal eye fields FP fixation point GABAA γ-aminobutyric acid receptor type A Hz hertz IOM Institute of Medicine IQ intelligence quotient in utero in the uterus LED light-emitting diode MRI magnetic resonance imaging ms millisecond MTS match to sample visual search PEF parietal eye fields pFAS partial fetal alcohol syndrome PPC poster parietal cortex RTI reaction time s second SC superior colliculus SCi intermediate layers of the superior colliculus SEF supplementary eye fields SEM standard error of the mean SOC stockings of Cambridge SRT saccadic reaction time SWM spatial working memory T target TMS transcranial magnetic stimulation TS Tourette syndrome vs versus % percentage $ dollar
xiv
/ per < less than ~ approximately ± plus or minus ® registered trademark ° degree = equal α alpha
xv
Chapter 1 GENERAL INTRODUCTION
Fetal Alcohol Syndrome is 100% preventable. Then why does it still continue?
1.1 Statement of the Research Problem
A serious consequence to maternal ingestion of alcohol during pregnancy is the
fetal alcohol syndrome (FAS), which is characterized by growth deficiencies, cranio-
facial dysmorphology and central nervous system (CNS) dysfunction (Clarren and Smith,
1978). In the absence of all three diagnostic features, individuals affected by prenatal
exposure to alcohol receive different diagnoses based on the symptoms they manifest.
Over the years, a variety of diagnostic guidelines have been established that demonstrate
the adverse effects of prenatal alcohol exposure on fetal development. Despite these
collective efforts aimed at improving public awareness, alcohol consumption during
pregnancy continues to play a major role in the prevalence of mental retardation in North
America. In 2005, the term fetal alcohol spectrum disorders (FASD) was adopted as an
umbrella term and is used to identify individuals with a history of prenatal alcohol
exposure, but who may or may not present with all three diagnostic sequelae (Chudley et
al., 2005). This term is intended as identification, but does not serve as a definitive
diagnosis, though this point is often confused. Although exhaustive attempts at
simplifying and unifying the diagnostic processes available to researchers and clinicians
have been made early identification still remains a significant challenge. This current
limitation served as the foundation for the research project.
The following sections examine the evolution in diagnostic approaches for FASD,
with a particular focus on the current systems most widely adopted today in clinical and
research practice. Following these guidelines, selected studies that propose techniques
1
for assessing the CNS dysfunction and craniofacial dysmorphology will then be
reviewed. In order to conduct a comprehensive review the search engine PubMed was
used in conjunction with the following search criteria within the field “Title/Abstract”
and limited to “Humans, English”: “fetal alcohol” and “diagnosis”; “fetal alcohol” and
“diagnoses” and “fetal alcohol” and “diagnostic”. Collectively these searches retrieved
approximately 300 publications. Articles were then selected that provided insight into
two broad categories: 1) Diagnostic systems, guidelines and codes; and 2) Diagnostic
approaches to FASD. Additional publications were included based on their applicability
to these categories.
1.2 Diagnostic Systems, Guidelines and Codes
Although fetal alcohol syndrome is often considered a relatively “new” diagnostic
term, the association between prenatal alcohol exposure and adverse postnatal outcomes
has been well documented in early writings dating back to Aristotle, the Old Testament
and ancient Greece [see reviews (Manning and Eugene, 2007;Calhoun and Warren,
2007)]. Fortunately, over the last 40 years, the role of alcohol as a teratogen has been
widely studied and significant advancements have been made to our understanding of
alcohol teratogenicity. Though the exact quantity, duration and frequency of exposure
that gives rise to birth defects is not known and cannot be determined, alcohol is now a
widely recognized teratogen.
While early literature makes reference to FASD, it is a French pediatrician by the
name of Dr. Paul Lemoine, who is credited with the first clinical documentation
correlating prenatal alcohol exposure to birth defects [French version: (Lemoine et al.,
1968); English version: (Lemoine et al., 2003)]. In this publication, there were no
2
diagnostic guidelines identified, and unfortunately, the significance of his observation
failed to make an impact in North America until 1973, when a group of dysmorphologists
also noted the correlation. Drs. Kenneth Jones and David Smith published 3 seminal
articles reporting children of alcoholic mothers, who presented with similar phenotypic
anomalies, and introduced the terminology “fetal alcohol syndrome” (FAS) (Jones et al.,
1974;Jones et al., 1973;Jones and Smith, 1973). While these accounts were primarily
case studies and representative of extreme situations, they also set the foundation for our
current diagnostic guidelines (i.e., the characteristic facial dysmorphology, growth
restriction and CNS dysfunction). From this point onwards, a variety of terminologies
and techniques were introduced to classify individuals, who present with alcohol-related
disorders, in attempt to provide unified diagnostic guidelines for clinical practice. While
these advancements dramatically improved upon the general understanding of FASD
pathophysiology, the challenges associated with implementing a set of universal
guidelines continues to be problematic.
1.2.1 Early Diagnostic Guidelines
Following the initial diagnostic guidelines for FAS set forth by Jones and Smith
in 1973, it was clear that the use of a standardized definition for FAS was not well
adopted in the medical and research community. In 1975, they further described the
characteristic features of FAS and provided pictorial images of affected children from 3
different ethnic groups (Jones and Smith, 1975). These images served to emphasize the
fact that FAS was not unique to a given culture. In this account, they also described the
first autopsy of a child with FAS, with particular emphasis on the neurological findings.
Most notably, they found aberrant neuronal migration resulting in a smooth outer
3
appearance due to sheets of neuronal and glial cell misplacement over the surface of the
cerebrum. Cellular disorganization was also found and incomplete development was
evidenced by the enlarged lateral ventricles. Agenesis of the corpus callosum was also
noted. Interestingly, prenatal growth deficiency was more pronounced with respect to
length than weight; which was in direct contrast to generalized maternal under-nutrition,
in which newborns are underweight for their length. It was concluded that while
malnutrition may exacerbate the situation, it was not the major contributor to these
postnatal symptoms. These early accounts also make reference to a continuum of adverse
effects resulting from prenatal alcohol exposure, and suggested considerable variability in
the severity of malformation and dysfunction in the offspring of alcoholic women. The
similarity in pattern of anomalies suggested a single etiology: ethanol.
In 1978, Clarren and Smith provided further insight into the distinguishing
features associated with FAS (Clarren and Smith, 1978). From extensive animal and
human studies, the teratogenic effects associated with alcohol consumption during
pregnancy were appreciated, and the common variant in the ingestion histories of women
known to produce affected offspring was alcohol. In their account, Clarren and Smith
also make reference to the variability in severity, and based on the cases at that time, a
wide spectrum of adverse effects to the developing fetus were noted. The abnormalities
associated with alcohol teratogenicity were grouped into four major categories: central
nervous system dysfunction; growth deficiencies; characteristic facial dysmorphology;
and variable major and minor malformations. A diagnosis of FAS was given only when
individuals presented with the three former abnormalities, recognizing that further
knowledge was required for less complete expressions. In these situations, individuals
4
were given the identification “suspected fetal alcohol effects” (FAE). Of the given
diagnostic criteria, it was the ‘FAS face’ that most distinguished these individuals; and in
its absence, it was significantly harder to make an alcohol-related diagnosis.
While these guidelines added to the existing diagnostic foundation, a need for
further clarification was warranted. To address this issue, the Fetal Alcohol Study Group
at the Research Society on Alcoholism meeting in 1980 developed a standardized set of
diagnostic guidelines for FAS (Rosett, 1980). After reviewing the 245 cases studies
reported by Clarren and Smith (Clarren and Smith, 1978), the study group recommended
that a diagnosis of FAS be made when a patient demonstrated signs in each of the
following three categories: (A) prenatal and/or postnatal growth retardation (weight,
length, and/or head circumference below the 10th percentile when corrected for age); (B)
central nervous system dysfunction (signs of neurological abnormality, developmental
delay, or intellectual impairment); and (C) characteristic facial dysmorphology with at
least two of 3 signs: microcephaly (head circumference blow the 3rd percentile),
microophthalmia and/or short palpebral fissures, or poorly developed philtrums, thin
upper lip, and flattening of the maxillary area. Although the FAS facial phenotype is
specific to alcohol teratogenicity, it was apparent that not all individuals presented with
craniofacial dysmorphology. In recognizing the wide spectrum of effects, it was
suggested that FAS should reside at the far (most severe) end of the continuum, and that
in the absence of all 3 diagnostic features, the term FAE should be used.
In 1984, a Hungarian group devised a semiquantitative scoring system for the
evaluation of symptoms associated with FAS (Vitez et al., 1984). The total study
population was comprised of 587 children of 409 alcoholic women, of which 549
5
children were recruited into the study. These children were assessed in their local
pediatric clinic, and these complex examinations were further evaluated using a
“diagnostic scheme of FAS”. The schemata included the assessment of symptoms related
to brain damage, particularly motor dysfunction, as well as observations of the child’s
behaviour, psychological status (intelligence quotient), social maturity and personality.
Anthropological examinations were also conducted and included measurements of head
circumference, weight and stature; and two portrait photographs were assessed for 7
facial characteristics (including palpebral fissure). In total, they studied 60 traits
associated with FAS, which fell under 5 major categories: central nervous system, pre-
and postnatal growth, face, minor anomalies and major anomalies. A score ranging from
-15 to +15 was associated with each unit of measure for each trait, such that negative
scores were indicative of children with a more probable diagnosis of FAS. Based on their
analysis, the following two points of discriminative value emerged: 1) the diagnosis of
FAS should be suspected for scores below -10; and 2) FAS was established for scores
below -30. Scores above -10 precluded the diagnosis of FAS. The authors defined
established FAS as “typical” and suspected as “atypical”. Finally, the authors were able
to differentiate the subjects based on their prenatal exposure to alcohol as follows: 1)
Drinkers: mothers who consumed alcohol during pregnancy; 2) Abstinent: mothers who
drank before or after pregnancy, or both before and after pregnancy; and 3) Control:
matched offspring who had randomly chosen mothers. Of the offspring in the “drinkers”
cohort, 25 were diagnosed with typical FAS and 168 with atypical FAS. Interestingly,
one-third of these children had scores above -10 precluding a FAS diagnosis. This latter
point serves to further illustrate the difficulty in generating a set of guidelines that are
6
appropriate for all situations in which there is a known history of prenatal alcohol
exposure.
In 1987, the Fetal Alcohol Study Group once again met at the annual Research
Society on Alcoholism meeting and decided that the existing guidelines set-out in 1980
required re-evaluation and the need for related diagnosis was warranted; especially, given
the growing body of literature and research under investigation at that time (Sokol and
Clarren, 1989). It was necessary to recognize that diagnostic terminology had to evolve
with the increased knowledge arising in the field. It was recommended that the newest
guidelines supersede the existing criteria published in 1980 and address the following
goals:
• Provide a set of guidelines for use by investigators, care providers and
others.
• Adherence to guidelines should contribute to clarification in the literature
and facilitate the understanding of mechanisms related to alcohol
teratogenicity.
Under these new guidelines, the FAS criteria were retained, requiring the existence of
abnormalities in each of the three categories (i.e., growth, CNS dysfunction and facial
dysmorphology). Clinicians and investigators were instructed to make detailed notes
related to each category, as well as any additional anomalies that would add precision and
provide a means for comparisons in the literature. The second term that was introduced
was Alcohol-Related Birth Defects (ARBD) and was suggested to describe situations in
which an individual presented with anatomical or functional outcomes related to prenatal
alcohol exposure, but who did not meet the criteria for FAS. Finally, the term Possible
7
Fetal Alcohol Effects (FAE) was revisited, and found to be significantly problematic in
its use. The committee felt that FAE was ambiguous, and no acceptable definition could
be found. Thus, under the implementation of these guidelines, its usage in publication
and practice was strongly discouraged.
In 1989, another set of revised diagnostic criteria for FAS appeared in the
literature, also recognizing the need for further clarification (Burd and Martsolf, 1989).
This criterion has been termed the “Fetal Alcohol Syndrome Checklist”. In noting the
artificial dichotomy in the usage of FAE and FAS, the authors suggested one inclusive
categorization system for FAS, where the full range of associated symptoms attributed to
alcohol ingestion during pregnancy were described and scored. In this system, the
diagnostic features were divided into major and minor criteria and given scores according
to the prevalence of each feature. Cognitive abilities, growth and facial features were
considered major criteria, and had weighted scores of 0-3. Minor criteria included a
variety of associated abnormalities (i.e., cardiovascular, renal, respiratory, dermatologic
or connective tissue) and, if present, were given a score of 1. A total score of 10 points
from the major category plus any 2 features under the minor category satisfied their
criterion for a FAS diagnosis. It was felt that this system could more appropriately
accommodate new symptoms as they emerged into their existing schemata. However, the
existence of other alcohol-related diagnoses was not included in situations when the
criteria for FAS were not met.
1.2.2 Current Diagnostic Guidelines
Since the first reported cases of alcohol teratogenicity, the evolution in diagnostic
guidelines has been appreciated. Today, many of the older methodologies have been
8
further explored and currently there are 5 sets of guidelines that are most readily adopted
for clinical and research purposes. They include: the Institute of Medicine (IOM) FASD
guidelines in 1996 (Stratton et al., 1996), the FASD 4-digit Diagnostic Code in 2000
(Astley and Clarren, 2000), the Centers for Disease Control and Prevention (CDC) FAS
guidelines in 2004 (Centers for Disease Control and Prevention, 2004), the Canadian
FASD guidelines in 2005 (Chudley et al., 2005) and the Hoyme FASD guidelines –
Revised IOM criteria in 2005 (Hoyme et al., 2005). As mentioned previously, it is the
facial dysmorphology that is most unique to FASD, as growth restriction and
neurological damage are associated with other pathologies. However, as seen in Table
1.1, a number of dysmorphic syndromes display similar features, providing further
confusion for the appropriate clinical diagnosis. This observation also serves to further
emphasize the need for a comprehensive set of diagnostic guidelines that can be easily
adopted into the clinical practice and for research purposes.
After the term FAS was introduced (Jones and Smith, 1973), a number of cases
arose in which children born to alcohol-abusing mothers did not present with the classic
three features. While the continuum of effects was appreciated in early reports, definitive
diagnostic criteria for these cases were not identified. As the mechanisms for alcohol
teratogenicity remain to be fully elucidated, it has been demonstrated that alcohol can
exert its effects through multiple pathways and processes (Cohen-Kerem and Koren,
2003;Goodlett and Horn, 2001); and the timing, dose and frequency of alcohol
consumption are all known to contribute to the final manifestations (Riley and McGee,
2005). Although the term ‘Suspected Fetal Alcohol Effects’ was proposed in 1975, it
9
Table 1.1 Syndromes with similar phenotypic features to FAS [modified from (Chudley et al., 2005;Manning and Eugene, 2007;Centers for Disease Control and Prevention, 2004;Hoyme et al., 2005)]. Syndrome Overlapping Features with
FAS Features that are distinct from FAS
Aarskog syndrome
Widely spaced eyes, small nose with anteverted nares, broad philtrum and midface hypoplasia
Round face, downslanted palpebral fissures, widow’s peak, prominent “lop” ears, and specific contracture of digits on extension. Inherited as an X-linked train. Molecular defect identified
Blepharophimosis syndrome (BPES)
Short palpebral fissure and ptosis (droopy eyes)
Epicanthus inversus (skin arising from the lower eyelid and running inwards and upwards), telecanthus (lateral displacement of the inner canthi with normal interpupillary distance) and variable female infertiliy. Inherited as autosomal dominant trait. Molecular defect.
DeLange syndrome
Long smooth philtrum, thin vermilion border of upper lip, depressed nasal bridge, anteverted nares and microcephaly
Single eyebrow across eyes and forehead, long eyelashes, downturned corners of mouth, short upper limb (particularly ulnar side), and very short stature. Molecular defect identified.
Dubowitz syndrome
Short palpebral fissures, widely-spaced eyes, epicanthal folds, variable ptosis and blepharophimosis, microcephaly
Wide mouth with full lips and pouting lower lip, stellate pattern of iris, periorbital fullness, connective tissue dysplasia, specific cardiac defect of supravalvar aortic stenosis in many. Chromosome deletion on FISH (fluorescence in situ hybridization) probe analysis of 7q11.23
Other chromosome duplication/deletion syndromes
Many have short palpebral fissures, midface hypoplasia and smooth philtrum
Chromosomal analysis by standard analsysis and some select syndromes by specific FISH probe analysis
11
was not intended as a definitive diagnosis. Despite this, it was however adopted as such
and in 1996 the IOM attempted to further define the term “effects” (Stratton et al., 1996).
In this system 5 diagnostic categories were introduced: FAS with (category 1) and
without (category 2) a confirmed history of alcohol exposure, partial FAS (category 3),
alcohol-related birth defects (ARBD) (category 4) and alcohol-related
neurodevelopmental disorder (ARND) (category 5) (Appendix A) in attempt to answer
the following 6 questions:
• Is prenatal alcohol exposure required for a diagnosis of FAS?
• Which physical features should be used to define the disorder?
• Can behavioural or cognitive features be used to define the disorder?
• Is there a role for ancillary measures (i.e., MRI) in diagnosis?
• Can the criteria be applied across the lifespan?
• What is the relationship between FAE and FAS?
With the exception of category 2, all diagnoses required a confirmed history of prenatal
alcohol exposure. However, further research was suggested to assess the reliability of
these categories and to determine whether confirmed prenatal alcohol history was in fact
necessary for a diagnosis of ARBD or ARND. The diagnostic terminology set forth by
the IOM provided a means for clinician to clinician communications and for clinician to
patient communications. Furthermore, there was a mechanism to further assess the
etiology and pathophysiology of alcohol teratogenicity, and to select the appropriate
treatment strategies.
From a clinical research perspective, misdiagnosis reduces the power to identify
meaningful differences between groups; and non-standardized diagnostic tools preclude
12
valid comparisons across studies. In 2000, Astley and Clarren developed a set of
guidelines using a 4-digit diagnostic code after identifying the following five primary
limitations to current systems (Astley and Clarren, 2000):
• Current guidelines are not sufficiently specific to assure diagnostic accuracy
• Lack of objective, quantitative scales to measure and report the magnitude of
each diagnostic feature
• FAE is broadly used and poorly defined
• FAE, ARBD and ARND inappropriately imply a causal link between exposure and
outcome
• FAS and FAE fail to convey the diversity of disability in these individuals
The 4-digit diagnostic code was established to reflect the magnitude of the four key
diagnostic features of FAS in the following order: 1) growth deficiency; 2) FAS facial
phenotype; 3) brain damage/dysfunction and 4) gestational alcohol exposure (Appendix
B). The magnitude of each feature is reported based on a 4-point Likert scale with 1
reflecting complete absence and 4 reflecting a strong presence of the FAS feature. There
are 256 possible diagnostic codes ranging from 1111 to 4444, with each falling into one
of 22 unique clinical diagnostic categories labelled A to V. However, only 9 unique
diagnostic outcome categories exist, as the other categories only differ by alcohol
exposure. These 9 range from ‘no cognitive/behavioural or sentinel physical findings
detected’ to ‘FAS’. This coding system was successfully adapted for use in all
Washington State FAS Diagnostic and Prevention Networks, and appears to be one of the
most widely used diagnostic tools today.
13
In 2004, the CDC released their set of FAS diagnostic guidelines (Appendix C)
with the primary goal of providing a standardized system for physicians, scientists and
researchers (Centers for Disease Control and Prevention, 2004). These guidelines
reflected a harmonization of existing diagnostic guidelines, and which attempted to adopt
a balance between overly conservative guidelines and inclusive diagnostic practices. The
structure that was implemented for the task group included information on all facets of
the diagnostic process:
• General framework for referral and diagnosis
• Development of guidelines for physical features and exposure
• Development of guidelines for potential CNS abnormalities
The guidelines outlined by the CDC refer only to FAS, as continued work and research
were needed before delineating the diagnostic criteria for individuals with a known
history of prenatal alcohol exposure, but who did not met all criteria for FAS. As with
the IOM and 4-digit diagnostic code guidelines, in the presence of growth restriction,
craniofacial dysmorphology and CNS dysfunction, confirmed prenatal alcohol history is
not required for a FAS diagnosis.
In 2005, a subcommittee of the Public Health Agency of Canada’s National
Advisory Committee on FASD reviewed, analyzed and integrated the current approaches
for diagnoses to propose a set of universal guidelines for Canada (Appendix D) (Chudley
et al., 2005). At this point multiple systems had been introduced for diagnostic purposes,
and from these reviews, the major recommendation from this subcommittee was the
necessity for a multidisciplinary approach to assessment. Due to the complexity and
range of expression of dysfunction, the subcommittee felt a multidisciplinary approach
14
was critical for accurate and comprehensive diagnosis and treatment recommendations.
The suggested team consisted of the following professionals: coordinator for case
management, physician, psychologist, occupational therapist and speech-language
pathologist, with additional members included based on the need for specific areas of
expertise (i.e., addiction counsellors). The Canadian guidelines set forth by the
subcommittee reflected a harmonization of the IOM guidelines and the 4-digit diagnostic
code. This translated into the implementation of the 4-digit diagnostic code to describe,
assess and measure objectively alcohol exposure, growth, facial features and brain
damage; while adopting the terminology introduced in the IOM criteria, with one
exception. The ARBD category was removed, as the authors’ felt its diagnostic utility
was limited, as in the absence of other features of FAS or neurological deficits, it is
difficult to attribute alcohol causation (see Table 1.1).
Finally, also in 2005 the Hoyme diagnostic criteria were published, which was
described as a clarification of the 1996 IOM criteria (Appendix E) (Hoyme et al., 2005).
The authors report 3 major problems with the existing IOM guidelines:
• Vague, with no specific parameters for diagnosis in each category (related to the
facial dysmorphology and behavioural/cognitive phenotypes)
• Assessment of the family and genetic history of each child is not addressed
• ARBD and ARND are not practically defined in a clinical sense
The improvements proposed by Hoyme et al. (2005) were an attempt to add specificity
and make the IOM guidelines clinically applicable to the general paediatric practice. The
revisions improved upon the vagueness of the original IOM criteria by defining the
degree of growth deficiency and specifying the minor physical anomalies. In addition,
15
pFAS without confirmed maternal alcohol exposure was added. ARBD and ARND were
defined with greater specificity, where the former referred to children presenting with
specific structural anomalies (i.e., ARBD), and the latter denoting children with a pattern
of behavioural or cognitive abnormalities that could not be explained by family or
environmental influences alone (i.e., ARND). The method described focused not solely
on prenatal alcohol history, but also on the exclusion of known genetic and metabolic
syndromes in order to make the appropriate diagnosis (see Table 1.1). As with the
Canadian guidelines, the authors also suggested a multidisciplinary approach, involving
the participation of physicians, psychologists and skilled maternal interviewers.
1.3 Diagnostic Approaches to FASD
A number of studies have evaluated the use of various objective and subjective
tools to assess their utility as diagnostic techniques that could be used to quantify the
brain and behaviour dysfunction and facial phenotype associated with FASD. As many
adults and children with FASD do not always receive an early and/or accurate diagnosis,
they are precluded from accessing the necessary services and supports they need. In
terms of the existing FAS diagnostic criteria (growth restriction, craniofacial
dysmorphology and CNS dysfunction), generally it is the facial characteristics that have
provided the most valuable and distinguishing feature associated with prenatal alcohol
exposure. Many research groups have exploited this observation in an attempt to develop
quantitative measures for assessing the FASD face. Traditionally, neurological deficits
have appeared too broad to serve any diagnostic purpose alone, especially as not all
children with FAS demonstrate recognizable mental retardation. However, tools that can
objectively quantify the neurological damage associated with a history of prenatal alcohol
16
exposure could have added clinical and research benefits, as many individuals do not
present with the craniofacial dysmorphology. Additionally, these tools may provide
greater diagnostic potential, especially measures that are insensitive to cultural
differences, as it is the CNS dysfunction that is more common and most debilitating.
Selected tools and techniques for assessing neurological function and craniofacial
dysmorphology are discussed.
1.3.1 Assessing Neurological Function: Tools and Techniques
In 1998, the behavioural phenotype associated with fetal alcohol exposure was
assessed, recognizing that individuals with FAS and FAE often share similar behavioural
profiles (Streissguth et al., 1998). Caregivers and parents were asked to depict these
individuals using language that described their characteristic behaviours. The most
frequently reported behavioural descriptors were assembled into a list called the
“Personal Behaviours Checklist”. Of the 68 descriptors included, 36 were chosen and
this battery was referred to as the “Fetal Alcohol Behaviour Scale”, and comprised a
simple count of ‘yes’ responses completed by a primary caregiver (i.e., parent). The
battery was demonstrated to have adequate test-retest reliability, and was uncorrelated
with age, sex, race and IQ. Most importantly, the battery correlated with maternal
alcohol problems, thus it was reflective of the behavioural phenotype associated with a
history of prenatal alcohol exposure, with a good degree of specificity. Paternal
alcoholism was also evaluated, and the authors demonstrated no correlation with the
battery scores, further supporting its specificity for prenatal alcohol exposure, and not the
behavioural consequences of residing in an alcoholic family. The authors concluded that
17
while more research was necessary, the battery may have utility in screening individuals
at risk for a diagnosis within the FASD continuum.
Further studies have recognized the need for tools to assess the CNS dysfunction,
as full FAS only represents a small fraction of affected children (Koren et al., 2003). In
the majority of cases where prenatal alcohol exposure is known, individuals present with
marked cognitive and behavioural abnormalities that are irrespective of facial
dysmorphology. These cases are typically classified as alcohol-related
neurodevelopmental disorder (ARND). A set of criteria for characterizing the
neuropsychological profile of children with ARND has been explored (Greenbaum et al.,
2002). Based on literature reviews and information from their support centre, 21 areas of
weakness or ‘deficits’ and 6 areas of strengths or ‘assets’ were identified as relating
specifically to an ARND diagnosis. They comprised the ‘ARND Diagnostic Criteria
Checklist’. Children in the study were administered a comprehensive battery of age-
appropriate neuropsychological tests, after which, the examiner and supervising clinical
psychologist independently completed the ‘Checklist’. Children were assigned to the
ARND group if they achieved a minimum of 60% for ‘deficits’ and 50% for ‘assets’.
Interestingly, regardless of other ‘physical’ signs of prenatal alcohol exposure, there were
no differences in the number of problems children with ARND maintained according to
the ‘Checklist’. This provides support for the fact that children with ARND are adversely
affected with respect to brain injury, and this is regardless of the degree of physical
dysmorphology. This profile approach was based solely on neuropsychological
problems, and not behavioural domains, which requires further investigation.
18
To address this limitation, and the fact that many children with FASD are co-
morbid for attention-deficit hyperactivity disorder (ADHD), Nash et al. (2006) conducted
a study to distinguish the behavioural phenotype of children with FASD from typically
developing children and children with ADHD (Nash et al., 2006). Co-morbidities often
lead to improper diagnosis, as well as prescribed treatment regimens that may not be
sufficient to ameliorate all aspects of FASD (Coles et al., 1997). In this study, the Child
Behaviour Checklist (Achenbach and Rescorla, 2001) was administered to
parents/caregivers, which assesses social competencies and behavioural problems.
Previous work by this group, in which children with ARND and controls were compared,
demonstrated that 62 of 113 behavioural descriptors showed significant differences
between the two groups; and 12 of which differed beyond p<0.001. Thus, these 12 items
were selected for further analysis, and it was found that children with FASD were
strongly differentiated from both typically developing children and children with ADHD.
Most notably, while children with FASD exhibited attention deficits and hyperactivity, as
did the children with ADHD; the FASD group also displayed a lack of guilt after
misbehaving, cruelty and tendency to act young for their age, which was unlike the
ADHD group. In addition, children with FASD were more likely to lie and steal than
children with ADHD. (Children with FASD were significantly different in all 12 items
compared to controls). From these findings the authors proposed a 2-step screening tool,
in which Step 1 served to identify the behaviours associated with FASD; and in Step 2
children with FASD were differentiated from children with ADHD. This type of
screening tool may provide an appropriate early intervention for families, who have
limited access to broad diagnostic services, and/or who reside in remote communities.
19
Recently, the utility of using a narrative analysis (chronologically told story) for
identifying children with FASD has been evaluated (Thorne et al., 2007). Narrative
analyses may identify children with communicative impairments that would otherwise be
missed using conventional assessment instruments. Typically, the context in which these
individuals are tested involves the use of discrete responses at or below the level of
single-sentence utterances, which gives rise to variable performances and results.
However, children with FASD may have difficulty producing integrated speech that
requires them to balance linguistic and social-cognitive task demands (Coggins et al.,
2003). The Semantic Elaboration Coding System developed by the author (JCT)
implements a framework for narrative analysis based upon cognitive linguistics. The
coding system has two functions: (1) employs a linguistic reference to ensure that the
concepts are explicitly and uniquely identified; and (2) determines the degree to which
semantic concepts are elaborated or well specified in the text. In this study, school-aged
children perused a wordless picture book, and then were asked to recount the best story
possible while using the picture book as a visual prompt. Transcripts were coded based
on the Semantic Elaboration Coding System, which assigns codes for ambiguity
(inappropriate reference strategies) and elaboration of concepts. Ten mutually exclusive
scoring codes were assigned based on these two parameters, plus a null code, which was
given when a word did not fit any of the 10 categories. Children with FASD were more
likely to use a picture-bound reference strategy during story-telling compared to controls,
which was identified using the ambiguity code: ‘ambiguous nominal reference’ (code 3).
This code describes situations, in which the child ambiguously used a name when
attempting to introduce, maintain or reintroduce a concept. This code was easy to
20
compute and had excellent reliability making it a practical approach for assessing
children, who perform well on standardized language tasks, but who demonstrate poor
performance during social communication in their daily lives.
1.3.2 Assessing Craniofacial Dysmorphology: Tools and Techniques
In recognizing that the craniofacial features represent the most distinguishing
characteristic for a FAS diagnosis, various research and clinical groups have devised
intricate systems to quantitatively assess these anomalies. The frequency of 60
measurements were assessed in children with a history of prenatal alcohol (FAS and
FAE) and compared to controls, in order to determine the occurrence of these
manifestations (Autti-Ramo et al., 1992). In the first assessment during the first year of
life, 10 children were identified with typical FAS and 19 with possible FAE. Of these 29
children, 22 demonstrated signs of central nervous system dysfunction at 27 months,
suggesting the utility of quantifying minor physical anomalies in early infancy to
accurately discriminate children at risk for FAS or FAE. Furthermore, this study
demonstrated that recognizing the discriminate facial features associated with a history of
prenatal alcohol exposure is critical when diagnosing children with disorders of the
central nervous system or growth retardation when the etiology is unknown.
Additionally, it has been proposed that the facial features associated with a history
of prenatal alcohol exposure may occur on a continuum, and are not always
representative of discrete traits. When individuals manifest the characteristic facial
phenotype, this criterion is most useful for diagnosing FAS. However, the use of the
facial component is more elusive in less severe cases. Thus, the use of craniofacial
anthropometry has been used to assess the phenotype associated with prenatal alcohol
21
exposure in children, with and without FAS (Moore et al., 2002). Craniofacial
anthropometry could provide additional discriminating power such that the face may
“predict” the brain in these children. Twenty-one craniofacial measurements were used
in the analyses of 100 subjects with prenatal alcohol exposure (41 with FAS; 59 with
pFAS) and 31 controls. Of the 21 measurements, 19 were significantly different between
the FAS and pFAS groups; and also between the FAS and controls. In contrast, only 7 of
the 21 measurements successfully discriminated between the pFAS and control groups.
These measurements were not confounded by race or age. Using standardized z-scores
enabled the comparison between the study population and a reference population. The
results from the FAS group demonstrated that their craniofacial measurements were
smaller than both the reference population and the pFAS group; while the pFAS group
were intermediate between the reference population and FAS. Thus, these data support
the implementation of craniofacial anthropometry as a potential screening tool that can be
used to identify individuals at risk for FAS and other alcohol-related diagnoses.
In order to reduce costs and the need for pediatric dysmorphologists, the use of a
stereo-photogrammetric method was used to compare FAS facial features in the Western
Cape province of South Africa (Meintjes et al., 2002). Forty-four children were
photographed and their facial features were measured using the proposed stereo-
photogrammetric technique. It was found that facial measurements could be performed
with greater consistency from a pair of stereo-photographs than from direct
measurements of live subjects. Further, this technique was reproducible and non-
specialists achieved consistent results providing further support for the utility of such a
tool. The benefits of using computerized anthropometry include decreasing the time
22
required for assessment for both patient and examiner; and can also provide objective
measures of the angles, surface areas, volumes and linear distances pertaining to the
craniofacial features of FAS, which can then be used to further improve their diagnostic
potential.
Although stereo-photogrammetrics have been used in various studies to assess
their sensitivity (percent of FAS subjects correctly classified) and selectivity (percent of
control participants correctly classified), only recently have these techniques been applied
to differentiate patients with FAS from controls across wide age ranges and across
ethnically disparate populations (Moore et al., 2007). Subjects were recruited from 4
distinct regions: North American Caucasian, African American, Finnish Caucasian or
Cape Coloured (of mixed ancestry) to determine the unique set of anthropometric
features that could be identified in each of the study populations. The facial features that
most effectively discriminated FAS and controls differed across the populations, although
in each of the 4 study groups, at least one eye measurement (shortened palpebral fissure,
reduced outer canthal width or reduced inner canthal width) was included in the model.
These findings were consistent with clinical descriptions where the orbital region and
midface were the most highly distinguishable features associated with FAS. This study
further supports the applicability of anthropometry for identifying individuals with FAS
among different ages and ethnicities.
FAS-related disabilities are often compounded by secondary emotional and
behavioural disabilities and criminality when the syndrome fails to be diagnosed
(Streissguth et al., 2004;Streissguth et al., 1991;Streissguth et al., 1985). With early
identification, many of these secondary manifestations can be prevented, or at least their
23
severity can be reduced. Unfortunately, the lack of efficient and effective surveillance,
screening and diagnostic tools significantly compromise the early diagnosis of FAS.
Recognizing this clinical limitation, the FAS facial phenotype has been further assessed
using facial photographs in attempt to develop a highly efficient, accurate and precise
screening, surveillance and diagnostic aide (Astley and Clarren, 1996). Although the
facial features associated with FAS have been previously described (i.e., small palpebral
fissure, smooth philtrums and thin upper lip (Clarren and Smith, 1978), criteria that
clarifies how small, smooth or thin these features are had yet to be defined in the
literature. In comparing frontal facial photographs from subjects with FAS and controls,
stepwise discriminant analysis revealed a cluster of 3 facial features that best
differentiated patients with and without FAS; namely, palpebral fissure length/inner
canthal distance ratio, philtrum smoothness (measured on a Likert scale), and upper lip
thinness (measured on the continuous scale of circularity). Using facial photographs and
computer software provided an objective means for differentiating subjects, as this
approach maximized accuracy, precision and efficiency; all of which are important in
developing effective screening, diagnostic and surveillance tools. Furthermore, this
cluster of 3 facial features appeared to be the minimum number required for defining the
phenotype and for differentiating individuals with the highest accuracy. This tool
provides a standardized technique for reporting the facial anomalies associated with a
history of prenatal alcohol, and holds further benefits for comparisons across study
populations.
Using the FAS facial phenotype screening tool, the prevalence of FAS in a foster
care population has been assessed (Astley et al., 2002). After screening 600 children, it
24
was confirmed that foster care is a high-risk population for FAS and that assessments
using this tool can be performed accurately, efficiently and with direct benefit to the child
and family. This study served to highlight the utility of screening in terms of increasing
primary and secondary intervention/prevention strategies once a child has been identified.
With the successful identification of these children using this screening tool, the child’s
disability can be documented and service workers can place them in families that are
willing to support their needs. Increased awareness and understanding among caregivers
and social workers improved their ability to recognize children at risk and seek out
diagnostic services on their behalf. Because this tool can be easily implemented in
different healthcare centres, families were not required to travel significant distances to
obtain diagnostic services. This alleviated significant costs and improved the efficiency
with which these children obtained access to the services and supports they required.
Current diagnostic criteria for FAS have been problematic in the identification of
newborns, due to the difficulty in assessing neurodevelopmental, cognitive and
behavioural patterns. This issue is further compounded by women, who under-report
their alcohol use, and many physicians, who are unfamiliar with the characteristic
features. In a prospective study, 4 maternal blood markers of alcohol use were compared
to self-reporting measures on screening interviews and questionnaires in pregnant
women; and together these results were compared to the effects on their infants (Stoler
and Holmes, 2004). Affected infants, who presented with evidence of growth retardation
and a positive facial score (presence of 4 characteristic features) were considered FAS;
while those with either growth retardation or positive face were considered pFAS or
FAE. Facial scoring systems may prove to be significantly helpful in assessing babies
25
with prenatal alcohol exposure, and at the very least, assist in identifying those children at
risk for further cognitive deficits so they may be followed more closely.
1.3.3 Assessing Visual and Oculomotor Impairments: Tools and Techniques
The characteristic craniofacial dysmorphology associated with prenatal alcohol
exposure has now been well characterized. Interestingly, the orbital cavity and visual
system appear to be particularly sensitive to the adverse effects of alcohol. In particular,
the eye is a sensitive indicator of harmful prenatal events, and has been useful in the
investigation of teratogens, and these opthalmological landmarks may assist in the
diagnosis of FAS (Stromland and Pinazo-Duran, 2002;Stromland, 2004). The early
development of the eye is known in detail, which means that critical time periods for the
developmental of ocular abnormalities can therefore be set using developmental
timetables.
In particular, a variety of eye abnormalities have been noted in individuals with
FAS [reviews (Stromland and Pinazo-Duran, 2002;Stromland, 2004)]. Refraction varies
among children with FAS and ranges from severe myopia (near-sightedness) to moderate
hyperopia (far-sightedness). Poor vision in children should be treated as early as possible
to achieve good results, and eye examinations are critical for children with FAS.
Although strabismus has been associated with FAS, it is a common non-specific finding
in ophthalmology. However, in association with other features of FAS it may prove to be
a valuable distinguishing feature. Intraocular malformations include asymmetry of the
eyes, and can range from subtle, minor isolated lesions of the retina to severe
malformations involving more than one structure. It is not surprising that retinal and
optic nerve deficits occur in individuals with FASD, as these structures are associated
26
with developing brain tissue. The most frequent eye abnormality is incomplete
development of the optic nerve, which is characterized by subnormal vision and
subnormal optic nerve axons. As eye pathology is closely associated with FAS,
ophthalmological examinations may assist in the identification of individuals with a
history of prenatal alcohol exposure.
Among the FAS facial features, several regions near the orbits can be evaluated
quantitatively using distance measurements. Anthropometric analysis is now an area of
active research and adaptation of this methodology using photographs that specifically
measure the distances around the eye may reduce the time of clinical examinations and
improve reliability. Recently, an algorithm that automatically extracts the eye and iris
contours in facial photographs has been developed and may be adapted for wide-scale
surveillance projects (Douglas et al., 2003). Using this methodology, palpebral fissure
length, interpupillary distance and inner and outer canthal distances were assessed to
determine the suitability of reference values for diagnosing FAS in children from South
Africa (Douglas and Viljoen, 2006). These values were compared with other
measurements taken from published reports of different ethnic populations. Interestingly,
significant differences in eye distance measurements in black South African children
were found when compared to these reports, suggesting that normative data sets must be
generated based on the study population. Thus, while eye measurements may assist in
the screening of individuals at risk for FASD, there is a need to establish standard
reference values for these four measurements that are specific to different ethnic
populations. Still, taken together with the visual impairments common to the FASD
27
population, these measurements may have further utility as a cost-effective screening
tool.
1.4 Eye Movement Experiments: Saccades
Eye movement experiments have been a source of valuable information to both
clinicians and basic scientists. The study of the eye presents a unique opportunity to
understand the workings of the brain, and eye movement control holds several
advantages to studying axial and limb movements. These include the fact that several
different classes of eye movements exist, which can be distinguished based on their
physiological properties, and anatomical substrates. Also, many abnormalities associated
with eye movements are distinctive and can provide insight into the particular
pathophysiology that may accompany such an abnormality. Additionally, the motor
neurons that govern eye movement behaviours are located within the cranium, thus
enabling the study of motor function without using body movements. Of the different
classes of eye movements, saccades are the fastest type of eye movements and are used
to redirect the line of sight. Saccadic eye movements represent a superb model system to
investigate the ability to selectively control behavioural responses.
A saccade has the main function of bringing images of interest onto the fovea
(Leigh and Zee, 1999), and includes both the voluntary and involuntary changes of
fixation. A number of different types of saccades exist and are useful for neuro-
ophthalmologic examination and research purposes. Of these different saccades, three
are most relevant to this research project. Automatic saccades (i.e., prosaccades) are
externally triggered by the sudden appearance of a target on the peripheral part of the
retina that occurs unexpectedly within the environment. A unique type of reflexive
28
saccades is the express saccades, which are very short latency saccades that occur
following the presentation of a novel stimulus. Volitional saccades are internally
triggered, elective saccades made as part of purposeful behaviour; and one type is the
antisaccade, which occurs when saccades are generated in the opposite direction to the
sudden appearance of a target (following such instructions).
In the anti/pro task, a fixation point (FP) appears in the middle of a visual display
and subjects are instructed to either look towards (prosaccade) or away from
(antisaccade) an eccentric visual target (T) that appears in the right or left visual field
(Fig. 1.1). Successful performance in the antisaccade tasks requires two sequences of
events: 1) suppression of the automatic prosaccade towards the peripheral target; and 2)
volitional generation of saccade in the opposite direction. Thus, prosaccades probe the
ability of participants to initiate automatic, visually triggered saccades; and antisaccades
assess voluntary control and the ability to suppress reflexive saccades. Visually triggered
saccades are mediated by the intermediate layers of the superior colliculus (SCi), with
important inputs from the visual and posterior parietal cortices (Munoz and Everling,
2004;Schiller et al., 1987); while volitional saccades rely on circuitry that includes higher
brain centres such as the frontal cortex and basal ganglia (Hikosaka et al., 2000;Dias and
Segraves, 1999;Gaymard et al., 1998;Pierrot-Deseilligny et al., 1991). One’s ability to
perform the antisaccade task develops during the transition between childhood to
adolescence, and adult performance is obtained at approximately 18 years of age (Munoz
et al., 1998); and peak performance is noted in the early 20’s, after which latency
increases with age. Cerebral lesions, particularly involving the frontal lobes, lead to
disturbances in antisaccades.
29
Saccade Task
Express
Eye
FP
Stimulus
Overlap
200 ms Gap
FP Pro Anti
Prosaccade
Antisaccade
Fig. 1.1. The pro- and antisaccade task. In the prosaccade task the subject was instructed to look from the central fixation point (FP) towards the eccentric target. In the anti-saccade task the subject was instructed to look away from the eccentric target to the opposite side. In both tasks, the state of fixation prior to the saccade was manipulated. In the overlap condition, the FP remained illuminated while the target appeared. In the gap condition, the FP disappeared for 200 ms before the target appeared. In both conditions, the SRT was measured from the time of target appearance to the initiation of the first saccade.
30
1.4.1 Neurophysiology of Saccadic Eye Movements
There are six extra-ocular motoneurons (MN) that encode the characteristics of
the saccade in terms of their temporal discharge. They discharge a burst of action
potentials to move the eyes and a tonic discharge to keep the eyes in a fixed position
(Leigh and Zee, 1999). The size of the saccade is proportional to the total number of
discharge spikes. The MN lie in the third, fourth, and sixth cranial nerve nuclei and
cause the extra-ocular muscles to move the eyes with respect to the head, in craniotopic
coordinates. Thus, the brain must transform the stimulus in terms of the location of
active neurons within the visual cortex into the saccadic command on ocular MN. MN
are innervated by excitatory and inhibitory burst neurons originating from the brainstem
reticular formation. In addition to these two classes of neurons, there are the long-lead
burst neurons and the omnipause neurons, which are also located in the brainstem
reticular formation. The long-lead burst neurons project to the excitatory and inhibitory
burst neurons causing them to discharge; while the omnipause neurons lead to their
inhibition. In order for a saccade to occur, the omnipause neurons must be silenced and
the long-lead burst neurons must activate either the excitatory or inhibitory burst neuron
pools to generate a saccade command to the MN. Once the saccade is complete, the
omnipause neurons are reactivated and the excitatory or inhibitory burst neurons are
inhibited once more.
The frontal cortex plays a major role in controlling saccadic eye movement, as it
receives direct projections from the visual cortex (Fig. 1.2). The frontal eye fields (FEF)
interconnect with the parietal visual areas and it has been postulated that this area acts as
a central “hub” connecting the supplementary eye fields (SEF), dorsalateral prefrontal
31
Inhibitory
Fig. 1.2 Brain areas involved in saccade control. Visually-triggered saccades (i.e., prosaccades) occur following the sudden appearance of a visual stimulus, and are governed by the SCi, with inputs from the visual and posterior cortices. Volitional saccades (i.e., antisaccades) are generated by internal goals and rely on higher brain centres that include the frontal cortex and basal ganglia [Reproduced with permission (Munoz et al., 2007)]. CD: caudate nucleus; DLPFC: dorsalateral prefrontal cortex; FEF: frontal eye fields; GPe: external segment of the globus pallidus; LGN: lateral geniculate nucleus; SEF: supplementary eye fields; SNr: substantia nigra pars reticulata; SCi: intermediate layers of superior colliculus; SCs: superficial layers of superior colliculus; STN: subthalamic nucleus.
Excitatory
32
cortex (dlPFC), parietal cortex, SCi and basal ganglia (Munoz et al., 2007;Thompson et
al., 1997;Schall and Thompson, 1999). The FEF, parietal lobe and SCi have numerous
connections between them, and contain neurons with similar firing patterns. The FEF,
SEF and DLPFC all project directly to the SCi; and the FEF and SEF also project to the
cerebellum and reticular formation. The frontal cortex also connects to the basal ganglia
and participates in presaccadic activity via either a direct or indirect pathway (Munoz et
al., 2007;Hikosaka et al., 2000;Munoz and Everling, 2004). In the direct pathway,
projections to caudate nucleus lead to the inhibition of the substantia nigra pars reticulata
via GABAergic projections. The substantia nigra pars reticulata is the major output
centre for the basal ganglia and sends GABAergic projections to both the thalamus and
SCi, which in turn project back to the frontal and parietal cortices. As there are two
inhibitory synapses involved in the direct pathway, this results in disinhibition of the SCi
and thalamus. In the indirect pathway, the caudate sends separate GABAergic
projections to the external globus pallidus, which in turn sends inhibitory projections to
the subthalamic nucleus. The subthalamic nucleus projects to the substantia nigra pars
reticulata, which forms synapses with the thalamus and SCi (as in the direct pathway).
Unlike in the direct pathway, the addition of a third GABAergic projection leads to the
inhibition of the SCi and thalamus. This, in turn sends the appropriate motor command
resulting in saccade generation. Thus, dysfunction or immaturity of the frontal cortex
and/or basal ganglia may influence the successful execution of saccades, and this can be
tested experimentally.
33
1.5 Research Rationale, Hypothesis and Objectives
This thesis research represents a multifaceted approach to investigating the
concordance between deficits in the control of saccadic eye movements and standard
neuropsychological tests in children with a diagnosis within the FASD continuum.
Importantly, this study reflects the involvement of multiple centres across Canada and the
results reflect the participation of over 200 volunteer subjects, families, caregivers and
support workers. The aim of this study was to develop a novel and objective approach
for further assessing the brain injury associated with a history of prenatal alcohol
exposure; with the long-term goal of developing a screening and research tool that could
aid in the diagnosis of these conditions, and to evaluate the efficacy of therapeutic
interventions. Because saccadic eye movements are easy to assess in children and
provide an objective measure of brain function, they are well suited for studying the
FASD population. Additionally, the use of standard neuropsychological testing tools that
can further quantify the deficits in executive function can be assessed and correlated with
distinct outcome measures in oculomotor performance, to give insight into the particular
brain regions that are most compromised.
The purpose of this study was to test the following general hypotheses: Children
with FASD:
• Demonstrate specific deficits in oculomotor control that can be measured using
saccadic eye movement tasks.
• Display specific deficiencies in multiple domains of executive function that can be
determined using standardized neuropsychological tasks.
34
• Reveal deficits in oculomotor control that correlate with deficiencies in executive
function as measured using standardized neuropsychological tasks.
The general objectives of this research project were as follows:
• Assess the feasibility of eye movement testing in children with FASD.
• Adapt the oculomotor laboratory for mobile use across different community
settings to enable testing across multiple test sites.
35
Chapter 2 DEFICITS IN EYE MOVEMENT CONTROL IN CHILDREN WITH FETAL ALCOHOL SPECTRUM DISORDERS 2.1 Introduction
The major consequence of prenatal ethanol exposure is fetal alcohol syndrome
(FAS) (Astley and Clarren, 2000;Clarren and Smith, 1978;Chudley et al., 2005). FAS is
characterized by growth restriction (both pre- and post-natal), craniofacial
dysmorphology (i.e., indistinct philtrum, short palpebral fissure) and central nervous
systems dysfunction. Recently, the term fetal alcohol spectrum disorders (FASD) has
been introduced and widely adopted as an umbrella term, which includes all disorders
relating to prenatal alcohol exposure (Koren et al., 2003). Although the terminology has
been clarified, an accurate diagnosis still remains a significant clinical challenge due
largely to the absence of objective diagnostic tools; and particularly in cases where the
craniofacial dysmorphology is absent, but the cognitive deficits are still prevalent.
Executive functions consist of those capacities that enable a person to engage
successfully in independent, purposive, self-serving behaviors (Lezak, 1995;Funahashi,
2001), and deficits in these functions are now recognized as a hallmark of prenatal
ethanol exposure. Individuals with FASD exhibit a range of deficits in executive
function, including problems with flexibility of thought, planning, impulsivity, verbal
reasoning, task switching, and working memory (Rasmussen, 2005). Indeed, several
studies have documented deficits in executive function in children with a history of
prenatal ethanol exposure, but without the facial dysmorphology of FAS (Mattson et al.,
1999;Schonfeld et al., 2001;Connor et al., 2000). This finding reinforces the view that of
the three key diagnostic features, it is the deficits in brain function that are of primary
importance (Chudley et al., 2005). Thus, further research into the specific pattern of
36
executive function deficits in the FASD population, using objective and consistent
measurement tools, is needed (Rasmussen, 2005).
One tool that has been used extensively to study deficits in motor control,
working memory, and executive function associated with various neurodevelopmental
and neurodegenerative disorders is saccadic eye movements (Munoz et al., 2007;Leigh
and Zee, 1999;Leigh and Kennard, 2004;Munoz and Everling, 2004). The underlying
neural circuitry that controls saccadic eye movements is now understood to an extent that
higher cognitive function can be probed using saccade paradigms, and these tests may be
used to assess specific deficits in executive function in patients with FASD. Thus,
oculomotor tasks provide a unique opportunity to probe the effects of prenatal alcohol
exposure on brain and behavior relationships in a way that other cognitive tasks cannot.
There is considerable overlap in the structures that are responsible for producing a
saccade (Leigh and Zee, 1999), and those that are damaged by prenatal alcohol exposure,
including the frontal lobes, thalamus, basal ganglia, and cerebellum (Sowell et al.,
2002;Mattson et al., 2001;Rasmussen, 2005). Damage to these structures can affect
saccade production and these deficits are measurable and quantifiable.
An important feature of human behavior is the ability to respond flexibly to
different environmental stimuli. These attributes can be investigated in specific
oculomotor paradigms. Subjects can be instructed to look toward a visual stimulus (Fig.
1.1, prosaccade task, requires automatic response) or suppress this automatic response
and look away from the stimulus (Fig. 1.1, antisaccade task, requires volitional response)
37
(Munoz and Everling, 2004;Hallett, 1978). The prosaccade task assesses basic
sensorimotor reflexes, as well as the ability to maintain visual fixation, while the anti-
saccade assesses voluntary motor control because subjects must suppress the automatic
response towards the peripheral stimulus before planning the volitional response (Munoz
and Everling, 2004). In addition, to further probe response inhibition, two fixation
conditions are frequently used. In the gap condition, a central fixation point is
extinguished prior to the onset of the peripheral stimulus. Subjects experience greater
difficulty inhibiting the prepotent response under the gap condition. In the overlap
condition, the central fixation point remains illuminated while the peripheral target
appears, making it easier for subjects to suppress the unwanted movement toward the
stimulus. Because cognitive function includes the ability to voluntarily inhibit prepotent
responses, guide goal-directed behavior and use working memory, oculomotor tasks can
thus be used to dissociate these different cognitive abilities.
Saccadic eye movement experiments have been performed over a wide range of
ages, including children (Munoz et al., 1998;Salman et al., 2006;Fischer et al., 1997).
This technique is non-invasive and easy to administer making it highly suitable to assess
executive function in the FASD population. Furthermore, saccadic eye movement
experiments have been used to characterize a variety of neuropsychological and
neurodegenerative diseases (Ramat et al., 2007;Munoz et al., 2007), including
schizophrenia (Currie et al., 1993;Zanelli et al., 2005), attention-deficit hyperactivity
disorder (ADHD) (Munoz et al., 2003;Armstrong and Munoz, 2003;O'Driscoll et al.,
2005;Klein et al., 2003), Parkinson’s disease (Chan et al., 2005;Le Heron et al.,
2005;Crawford et al., 1989;Kimmig et al., 2002), Tourette’s syndrome (LeVasseur et al.,
38
2001) and Alzheimer’s disease (Crawford et al., 2005). The existing knowledge from
these groups may assist with the identification of traits that are unique to FASD.
The aim of this study was two-fold. The first objective was to determine if
saccades could be measured in children with FASD using pro- and antisaccade tasks, as
these experiments have not been previously conducted in this clinical population. The
second objective was to quantify the control of automatic and volitional responses using
pro- and antisaccade tasks. It was hypothesized that subjects with FASD would have no
trouble performing saccadic eye movement experiments; however, based on the known
deficits in frontal lobe function, these children were expected to produce saccades with
increased saccadic reaction times and make more direction errors in the anti-saccade task
compared to control children. In addition, because of known brainstem and cerebellar
dysfunction, children with FASD were expected to produce significant deficits in saccade
metrics (amplitude, velocity and duration). These tasks provide an excellent method for
quantifying and comparing objectively the responses of children with FASD to those of
control subjects, and may provide insight into the specific types of brain damage
associated with prenatal ethanol exposure.
A preliminary version of these data has been presented in abstract form (Green et
al., 2006;Green et al., 2004;Green et al., 2005).
39
2.2 Materials and Methods
2.2.1. Participants
All experimental procedures were reviewed and approved by the Queen’s
University Human Research Ethics Board. We selected children with FASD, as
determined by a clinical geneticist and according to the Canadian diagnostic guidelines
(Chudley et al., 2005). Ten children with FASD (four male, six female; 9.8 ± 0.4 years
of age, range 8-12 years) were recruited and compared with 12 age-matched control
subjects (six male, six female; 10.0 ± 0.3 years of age, range 8-12 years). Of the ten
children with FASD, eight were medicated for behavioral symptoms relating to their co-
morbidities (Table 2.1). Children were tested off their medication, such that their last
daily dose was administered the day before arriving at the lab; recognizing that for some
pharmacological agents this was not a sufficient wash-out period. Agents that were most
likely to interfere with testing were stimulant medications that have a relatively short
half-life (~6-12 hrs) (Katzung, 1998) and for which the overnight wash-out period was
sufficient. The contribution of each drug therapy could not be addressed in this study due
in part to sample size, but more precisely due to the extensive differences that exist
between medication regimens and treatment history. All control subjects had no known
neurological, psychiatric, or visual disorders, other than requiring corrective lenses,
which were worn if needed throughout the experiments. Parents and/or legal guardians
were informed of the nature of the study and provided written consent on behalf of the
participants. All subjects completed one, 1-h session and were paid $10.
40
Table 2.1: FASD subject information.
n IOM Sex Age Medication Co-morbidities Education History 1 pFAS F 10 -Lithium
-Learning disability -Resource help -Special education -Special class
5 FAS F 10 -Methyl-phenidate
-ADHD
-Learning disability -Resource help -Special education -Special program
6 FAS F 10 -n/a
-n/a
-Learning disability -Resource help
7 pFAS F 9 -Methyl-phenidate
-ADHD
-Suspension -Resource help -Special education -Special program -Special class
8 ARND M 8 -Methyl-phenidate -Clonidine
-ADHD -Conduct disorder
-Suspension -Learning disability -Special education -Special program -Special class
9 pFAS M 9 -Methyl-phenidate -Risperidone
-ADHD -Developmental Delay
-Learning disability -Resource help -Special education -Special program -Special class
10 FAS M 9 -n/a
-ADHD -Suspension -Learning disability -Resource help -Special education -Special program -Special class
41
2.2.2 SaccadeTask
All participants performed the saccade task (Fig. 1.1), consisting of one block of
prosaccade trials, followed by two blocks of antisaccade trials, each block consisting of
100 trials. Subjects received breaks and refreshments between blocks. Participants were
seated in a dentist chair, while in complete darkness facing the centre of a translucent
screen located 100-cm away. A red light-emitting diode (LED; 2.0 cd/m2) was
positioned onto the centre of the screen and served as the initial fixation point (FP). Red
target LEDs (5.0 cd/m2) were positioned at 20° to the right or left of the central FP. The
screen was diffusely illuminated between trials to avoid dark adaptation. Each trial began
with a 250 ms period of complete darkness. The FP appeared for 1000 ms and then one
of two events occurred. In the gap condition, the FP was extinguished and, after a gap
period of 200 ms, the eccentric stimulus appeared in the right or left visual field. In the
overlap condition, the FP remained lit when the eccentric stimulus appeared. In the pro-
saccade task, participants were instructed to start each trial fixated on the central FP and
then look towards the stimulus as soon as it appeared. In the antisaccade task,
participants were instructed to look away from the eccentric stimulus to the opposite side.
The stimulus remained illuminated for 1000 ms after which all LEDs disappeared and the
background illumination reappeared, indicating the end of that trial. Stimulus location
(right or left) and fixation conditions (gap or overlap) were pseudo-randomly interleaved
throughout each block of trials. Subjects were asked to repeat the instructions to the
experimenter to ensure they understood the paradigm before the onset of data collection.
42
2.2.3 Recording and Analysis of Eye Movements
Horizontal eye position was measured using DC-electrooculography (EOG). Ag-
AgCl electrodes were affixed bitemporally and a grounding electrode was placed in the
centre of the forehead. All experimental data were digitized at 1 kHz using REX (ver
5.4; (Hays et al., 1982)) and analyzed off-line on a Sun Ultra 60 Sparc station.
Saccadic reaction time (SRT) was defined as the time from stimulus appearance
to initiation of the first saccade that exceeded 30°/s. Saccades were scored as correct if
the first movement after appearance of the eccentric stimulus was >5° in amplitude and in
the correct direction (i.e., toward the stimulus in the prosaccade task; away from the
stimulus in the antisaccade task). Saccades were scored as incorrect if the first saccade
after appearance of the stimulus was in the wrong direction (i.e., away from the stimulus
in the prosaccade; toward the stimulus in the antisaccade task). Mean SRT in the pro-
and antisaccade tasks was computed from trials with reaction latencies between 90 and
1000 ms. These criteria served to eliminate anticipatory saccades and atypically long
responses (Munoz et al., 1998). In addition, we measured express saccades (latency: 90-
140 ms), which are the shortest latency visually-triggered saccades (Fischer and
Ramsperger, 1984;Munoz et al., 1998;Dorris et al., 1997). Express saccades have
latencies that approach the minimal afferent and efferent conduction times for visual
information to reach the oculomotor system and to be translated into a rapid eye
movement (Pare and Munoz, 1996;Dorris et al., 1997). Neurons in the superior
colliculus receive inputs from sensory, motor and cognitive inputs, and these inputs
contribute to establishing specific levels of excitability among populations of collicular
neurons (fixation and saccade) that result in the generation of express saccades.
43
The following parameters were computed for each condition (gap, overlap) and
direction (right, left): the mean SRT for correct trials, the coefficient of variation of SRT
for correct trials [(CV = standard deviation/mean) x 100], the percentage of express
saccades and the percentage of direction errors. Metric analyses for correct prosaccade
trials were also carried out to determine the amplitude of the first saccade and the number
of saccades made to reach the stimulus. For correct prosaccades that were restricted to
18°-21° in amplitude, duration and peak velocity were also computed.
2.2.4 Data Analysis
The two experiments (pro- and antisaccade tasks) contained two within-subject
factors: fixation state (gap vs. overlap) and direction (right vs. left); and one between-
group factor: clinical pathology (FASD vs. control). All dependent measures (SRT, CV,
express saccades, direction errors) were analyzed using ANOVA with alpha set at 0.05.
Two-tailed, unpaired Student’s t-tests were conducted and corrected with Welch’s
approximation when the assumption for homogeneity of variance was not met. We will
focus on descriptions of the relevant statistical parameters for comparisons and
interactions that occurred between the control and FASD groups.
44
2.3 Results
2.3.1 SRT
Figure 2.1 depicts the cumulative distribution of reaction times for correct
responses (positive values) and direction errors (negative values) for control and FASD
children in the pro- (Fig. 2.1A, C) and anti- (Fig. 2.1B, D) saccade tasks in both the gap
(Fig. 2.1A, B) and overlap (Fig. 2.1C, D) conditions. Controls were faster to react and
initiate saccades in both the pro- and antisaccade trials (solid traces lead dashed traces).
The gray boxes in Fig. 2.1 depict the express saccade epoch, 90-140 ms after stimulus
appearance. In the prosaccade task, the FASD group made more direction errors and
fewer express saccades compared to controls. In the antisaccade task FASD subjects
made more direction errors (though not significant); however, these errors were generated
at very different times. The majority of direction errors made by controls were triggered
in the express saccade range (gray box), while FASD direction errors were triggered
later.
The ANOVA revealed the following for dependent measures (SRT, CV, express
saccades, direction errors). FASD children had slower SRT compared to controls
(F(1,20) = 20.9, p < 0.001). Consistent with previous studies, mean SRT was increased
for antisaccades compared to prosaccades (F(1,20) = 47.7, p < 0.001), and in the overlap
condition compared to the gap condition (F(1,20) = 94.2, p < 0.001) for all groups. There
were no significant directional effects.
Figures 2.2 and 2.3 summarize the data from the pro- and antisaccade tasks,
respectively. In both the gap (Figs. 2.2A, 2.3A) and overlap (Figs. 2.2B, 2.3B)
conditions, the mean SRT was elevated in the FASD group compared to controls in the
45
0 200 400 600
-25
0
25
50
75
100 A
ControlFASD
Cum
ulat
ive
Prob
abili
ty
0 200 400 600
-25
0
25
50
75
100 B
0 200 400 600
-25
0
25
50
75
100 C
Cum
ulat
ive
Prob
abili
ty
0 200 400 600
-25
0
25
50
75
100 D
Gap
Overlap
Prosaccade Trials Antisaccade Trials
Saccadic Reaction Time (ms)
Fig. 2.1 Cumulative distribution of saccadic reaction times for correct responses (positive values on the ordinate) and direction errors (negative values on ordinate) for prosaccade (A, C) and antisaccade (B, D) trials in the gap (A, B) and overlap (C, D) conditions. Dashed traces, FASD data; solid traces, control data. The gray box highlights the express saccade epoch.
46
Control FASD150
200
250
300
350
400
450 A
*SR
T (m
sec)
Control FASD150
200
250
300
350
400
450 B
*
Control FASD0
1020304050607080 C
CV
(%)
Control FASD0
1020304050607080 D
Control FASD
0
25
50
75 E
*Perc
ent E
xpre
ss (%
)
Control FASD
0
25
50
75
*
F
Control FASD
0
10
20
30 G
Dir
ectio
n Er
rors
(%)
Control FASD
0
10
20
30 H
*
Gap Overlap
Fig. 2.2 Quantification of parameters in the gap (A,C,E,G) and overlap (B,D,F,H) conditions for the prosaccade task. A and B: mean SRTs for correct responses. C and D: coefficient of variation (SD of SRT/mean SRT x 100%). E and F: percentage of express saccades (SRT: 90-140 ms). G and H: percentage of direction errors. Values are presented as mean ± S.E.M. *p < 0.05.
47
Control FASD200
250
300
350
400
450
500
550 A
*SR
T (m
s)
Control FASD200
250
300
350
400
450
500
550 B
*
Control FASD10
20
30
40
50
60 C
*
CV
(%)
Control FASD10
20
30
40
50
60 D
Control FASD0
25
50
75 E
Dir
ectio
n Er
rors
(%)
Control FASD0
25
50
75 F
Gap Overlap
Fig. 2.3 Quantification of parameters in the gap (A,C,E) and overlap (B,D,F) conditions for the antisaccade task. A and B: mean SRTs for correct responses. C and D: coefficient of variation (SD of SRT/mean SRT x 100%). E and F: percentage of direction errors. Values are presented as mean ± S.E.M. *p < 0.05.
48
prosaccade task (gap: t(20) = 5.8, p < 0.001; overlap: t(20) = 4.6, p < 0.001) and in the anti-
saccade task (gap: t(20) = 2.5, p < 0.05; overlap: t(20) = 2.3, p < 0.05). The anti-effect
(anti-saccade SRT – prosaccade SRT) for children with FASD was not significantly
different from control children (t(20) = 0.95, p = 0.35).
The gap-effect (overlap SRT – gap SRT) for pro-saccades ranged between 19 –
95 ms for control subjects and 28 – 177 ms for FASD children, and there was no
significant difference between groups (t(20) = 0.02, p = 0.98). Similarly, the gap effect for
anti-saccades was also not significantly different between controls and FASD (t(20) =
0.16, p = 0.87), and ranged between -2 – 75 ms and -55 – 100 ms for control and FASD
children, respectively.
There was a significant interaction for group across direction and fixation
condition (F(1,20) = 5.81, p < 0.05). In control subjects, SRT in the prosaccade task
were faster for leftward saccades, whereas faster SRT in the antisaccade task were
dependent on rightward saccades. In contrast, for the FASD group, faster SRT in the pro-
saccade task were dependent on rightward saccades, and direction had no effect on SRT
in anti-saccades.
2.3.2 Coefficient of Variation
The coefficient of variation (CV) normalizes for intrasubject variability in SRT.
Only task was statistically significant for the CV, indicating increased variability in SRT
for the antisaccade task compared to the prosaccade task (F(1,20) = 8.5, p < 0.01). There
were no significant differences between group (F(1,20) = 2.0, p = 0.17), fixation
condition (F(1,20) = 0.9, p = 0.77) or direction (F(1,20) = 1.0, p = 0.34).
49
Figures 2.2C and D illustrate the intra-subject variability in SRT for prosaccades,
expressed as the CV. There was no significant difference between controls and FASD in
CV for the gap (t(20) = 2.3, p = 0.24) and overlap (t(20) = 0.04, p = 0.97) conditions (Fig.
2.2C, D). Figures 2.3 C and D illustrate CV for control and FASD children in the anti-
saccade task. CV was elevated for the FASD children in the gap condition (t(20) = 2.3,
p < 0.05], and the same trend was present in the overlap condition [t(20) = 1.4, p = 0.18].
2.3.3 Express Saccades
The ANOVA of dependent measures revealed significant differences between
group, task and fixation conditions with respect to express saccades. The control group
generated a higher percentage of express saccades compared to the FASD children
(F(1,20) = 9.9, p < 0.01). A higher percentage of express saccades were also generated in
the prosaccade task compared to antisaccade task (F(1,20) = 21.7, p < 0.001) and for the
gap condition compared to the overlap condition (F(1,20) = 35.5, p < 0.001. There were
no significant differences in direction (F(1,20) = 0.1, p = 0.78).
There was an unexpected and significant decrease in the percentage of express
saccades (Fig. 2.2E, F) by the FASD children in both the gap ( t(14) = 4.0, p < 0.01) and
overlap (t(12) = 3.1, p < 0.01) conditions. Express saccades are not generated in the anti-
saccade paradigm, and saccades with SRT latencies comparable to the express epoch
represent direction errors that are made toward the stimulus (see Fig. 2.1B, D).
There was an interaction between group and task (F(1,20) = 13.1, p < 0.01) such
that increased percentage of express saccades depended on the gap condition in the
control children, whereas this relationship was virtually absent in FASD children. There
was also an interaction for group across task and fixation condition (F(1,20) = 5.85, p <
50
0.05), which revealed that increased express saccades in controls was dependent on pro-
saccades in the gap condition. While there was no evidence, an interaction between
fixation condition and group approached statistical significance (F(1,20) = 3.80, p =
0.07).
2.3.4 Direction Errors
There was a statistically significant increase in the percent of direction errors with
respect to task (F(1,20) = 36.1, p < 0.001). Although there was no evidence for
differences in group (F(1,20) = 3.5, p = 0.08) or fixation condition (F(1,20), p = 0.07),
both dependent measures approached statistical significance. There was no significant
difference for direction (F(1,20) = 0.17, p = 0.68).
An unexpected finding was the increase in the percent of direction errors on pro-
saccade trials in the overlap condition (Fig. 2.2 H) for the FASD group compared with
controls (t(10) = 2.3, p < 0.05), which did not reach significance in the gap condition (t(20)
= 1.0, p = 0.31) (Fig. 2.2 G). The percentage of direction errors in the antisaccade task is
illustrated in Fig. 2.3, E and F. Although FASD children made more direction errors in
the antisaccade task, this failed to reach statistical significance (gap: t(12) = 1.5, p = 0.16;
overlap: t(13) = 1.2, p = 0.26).
2.3.5 Metrics
We also investigated saccade metrics for the saccades made in the prosaccade task
(Table 2.2). There were no differences between control and FASD subjects for amplitude
of the first saccade to stimulus (F(1,20) = 1.69, p = 0.21) or the number of saccades
(F(1,20) = 2.37, p = 0.139). For saccades between 18-21° in amplitude, there was a
strong trend toward an increase in duration (F(1,20) = 3.76, p = 0.07), and
51
Table 2.2 Saccade metrics from the prosaccade task.
Amplitude (0)
Number of Saccades
Duration (ms)
Peak Velocity (0/s)
Gap condition Control FASD
19 ± 1 19 ± 1
1.22 ± 0.05 1.09 ± 0.06
75 ± 5 88 ± 5
471 ± 25 398 ± 27
Overlap condition Control FASD
19 ± 1 20 ± 1
1.15 ± 0.04 1.07 ± 0.05
76 ± 5 89 + 5
445 ± 24 394 ± 26
52
reduction in saccade velocity (F(1,20) = 3.08, p = 0.10) for the FASD subjects compared
to controls. It is expected that with a larger sample size these latter two measures would
reach statistical significance.
53
2.4 Discussion
This study shows for the first time that saccadic eye movement experiments can
be conducted in children with FASD, and suggests that these tests may provide a
sensitive indicator of the brain injury associated with FASD. Significant differences
between the performance of FASD subjects and control subjects were demonstrated.
Children with FASD exhibited: 1) increased reaction times; 2) a decreased ability to
trigger express saccades; 3) an increase in direction errors in the prosaccade task; and 4)
no significant increase in direction errors in the antisaccade task. Therefore, we conclude
that these data support our initial hypothesis that eye movement experiments can be used
to assess executive function in children with FASD. These data are first discussed and
related to other clinical groups with developmental disabilities. We then review saccade
neural circuitry and speculate about FASD pathophysiology.
2.4.1 Eye Movement Abnormalities in Developmental Disorders
A frequent co-morbidity for individuals with FASD is attention-deficit
hyperactivity disorder (ADHD) (Table 2.1); however, differences in neurocognitive and
behavioral characteristics have been previously found (Coles et al., 1997). Several
saccadic eye movement studies have been conducted in the ADHD population using pro-
and antisaccade paradigms (Aman et al., 1998;Munoz et al., 2003;Klein et al.,
2003;Hanisch et al., 2006;Cairney et al., 2001;Mostofsky et al., 2001). These studies
have revealed contradictory results due largely to discrepancies in methodology. Two
studies with rigorous procedural control and statistical analyses reveal that children with
ADHD produce significantly more direction errors in the antisaccade task compared to
controls (Munoz et al., 2003;Klein et al., 2003). However, these studies also present
54
contrasting results regarding the occurrence of express saccades. Munoz and colleagues
(2003) described a trend toward ADHD children producing more express saccades
compared to controls. In contrast, Klein and colleagues (2003) found that children with
ADHD exhibited a reduced proportion of express saccades in the gap condition.
Although co-morbid ADHD existed in eight of the 10 cases of FASD, the
emerging profile for saccadic eye movement abnormalities in FASD is markedly
different from what is observed in children with a diagnosis of ADHD (Munoz et al.,
2003;Klein et al., 2003). Children with FASD failed to generate express saccades, even
among direction errors in the antisaccade task (see Fig. 2.1). In addition, they made more
direction errors in the prosaccade task, while ADHD children made more direction errors
in the ant-saccade task only. The increased percentage of direction errors in the pro-
saccade task exhibited in FASD is highly unusual and not observed in ADHD. Direction
errors in the antisaccade tasks tend to be initiated immediately following target
appearance, within the express epoch for both control (Munoz et al., 1998) and ADHD
(Munoz et al., 2003) subjects, while FASD subjects produce direction errors with much
longer latencies (see Fig.2.1 B, D). Future studies will be important for exploring the
potential use of saccadic eye movement experiments for contrasting FASD and ADHD.
The marked differences we report in express saccade occurrence and pattern of direction
errors provide important clues and definitely suggest dramatic differences in underlying
pathophysiology.
Using the same tasks described here, LeVasseur and colleagues (2001)
demonstrated that individuals with Tourette’s syndrome (TS) have increased SRTs, no
significant increase in direction errors in the antisaccade task, and a decrease in the
55
percentage of express saccades. Although this pattern of deficits resembles the data
observed in FASD, children with FASD make more direction errors in the prosaccade
task, while TS subjects do not. In addition, individuals with TS display no significant
differences in saccadic velocity or duration, while the amplitude of the first saccade was
smaller and more saccades were generated to move to the target. These observations
contrast the trends observed in FASD subjects, in which a decrease in saccadic velocity
and an increase in saccadic duration approached significance. These differences between
TS and FASD suggest very different patterns of pathophysiology in these two disorders.
Of interest, our observations on FASD are not attributable to developmental
delay. The normative data generated by Munoz and colleagues revealed that young
children (ages 5-8) initiated more express saccades (Munoz et al., 1998) than what we
observed in FASD. The increase in the occurrence of express saccades among young
children suggests that they have poor control over visual fixation, leading to the
generation of excessive automatic (reflexive) saccades. Fixation ability improves during
normal maturation. The virtual absence of express saccades in the FASD children must
therefore be due to a deficit that cannot be explained simply by a delay in normal
development.
2.4.2 Neural Circuitry
The neural circuitry underlying saccadic eye movements has been well
characterized (Munoz and Everling, 2004;Munoz and Schall, 2004;Pierrot-Deseilligny et
al., 2004;Sparks, 2002;Scudder et al., 2002;Schall, 2004). The dorsolateral prefrontal
cortex (dlPFC) is involved in executive function, spatial working memory, and
importantly, the suppression of unwanted saccades; while the frontal eye fields (FEF)
56
play a crucial role in the execution of voluntary saccades. Punctate lesions to the dlPFC
lead to increased direction errors in the antisaccade task (Gaymard et al., 1998;Guitton et
al., 1985). Damage to the FEF is correlated with prolonged SRT (Rivaud et al., 1994). In
the monkey, reversible inactivation of the FEF leads to increased SRT, decreased
saccadic velocity and increased saccadic duration (Sommer and Tehovnik, 1997;Dias and
Segraves, 1999). Reversible inactivation of the dlPFC, results in impairments in
reflexive saccadic inhibition, leading to increased direction errors in the antisaccade task
(Condy et al., 2006). These findings are similar to those obtained in our study, and
suggest that dlPFC and FEF dysfunction may account, in part, for the oculomotor deficits
observed in FASD. In FASD children, there appears to be global frontal lobe damage
that may include the FEF and dlPFC, which would account for the increased SRT and
excessive numbers of non-reflexive (longer-latency) direction errors in the anti-saccade
task.
Damage to frontal lobes has been well documented in the FASD population
(Wass et al., 2001;Sowell et al., 2002), and this has been correlated with deficits in
impulsivity, response inhibition and judgement (Rasmussen, 2005). While our study
failed to reveal deficits in impulsivity (increased reflexive direction errors in the anti-
saccade task), it was apparent that children with FASD executed more disorganized
responses that reflected increase direction errors in both the pro- and antisaccade tasks.
Additionally, their inability to turn off the fixation mechanism in advance precluded their
capacity to generate express saccades. These observations suggest that FASD children
have difficulty integrating multiple instructions into a correct sequence of actions, which
57
is consistent with the known deficits in planning ability and/or response inhibition that
are associated with FASD.
The relationship between dlPFC and express saccades has been previously
investigated using single pulse transcranial magnetic stimulation (TMS) and saccadic eye
movement experiments (Muri et al., 1999). The reduction in the SRT following TMS of
the dlPFC was attributed to an increase in the percentage of express saccades. The
authors suggested that this effect was mediated by either direct activation of the superior
colliculus (Leichnetz, 1981) or disinhibition of the superior colliculus via the basal
ganglia (Hikosaka et al., 2000). Thus, alterations in the pattern of signalling from dlPFC
to superior colliculus may result in deficient express saccade generation. Deficits in FEF
function can lead to increased latencies, which could further contribute to the increase in
prosaccade duration and decrease in prosaccade velocity. Taken together, these results
suggest that global deficits among regions of the frontal cortex lead to a specific pattern
of eye movement behavior that is unique to the FASD population consisting of increased
SRT and decreased percentage of express saccades. One plausible explanation for these
observed deficits is increased inhibition within frontal cortex. Studies conducted in
experimental animal models have shown that chronic prenatal ethanol exposure induces
an upregulation in the expression of GABAA receptors in the cerebral cortex of postnatal
offspring (Bailey et al., 1999;Bailey et al., 2001), which would be expected to increase
inhibitory tone.
2.4.3 The Accumulator Model
Several models have been proposed to explain the variability of reaction time
(Luce, 1986;Munoz and Schall, 2004;Ratcliff, 2006;Nazir and Jacobs, 1991;Trappenberg
58
59
et al., 2001). The accumulator model is useful for interpreting the neurophysiological
and behavioral data related to the initiation of saccades in clinical disorders (Munoz et al.,
2007). This model is based on the supposition that to initiate movement, neural activity
must grow to exceed a given threshold (Fig. 2.4). In the brain, this function may be
represented by the pre-saccadic activity of saccade neurons in the FEF and superior
colliculus (Munoz and Schall, 2004). These neurons can be activated in advance of target
presentation, as well as activated directly by target presentation in a neuron’s response
field (post-target activation). Three sources have been identified as contributors to
variability in reaction time: baseline, threshold, and rate of rise (from baseline to
threshold). Thus, pre-target (baseline) and post-target (rate of rise) information
processing can alter the accumulation of activity towards threshold to initiate action. In
Fig. 2.4, the vertical gray box represents the time of the visual response on saccade
neurons contralateral to the side of the target. Pre-target activity (to the left of the target
appearance in Fig. 2.4) is influenced by fixation disengagement and target predictability
(Munoz et al., 2000).
The accumulator model has been used to account for deficits in ADHD, TS and
Parkinson’s disease (Munoz et al., 2007). Mean SRT was elevated in ADHD, more
direction errors were generated in the antisaccade task compared to controls, and there
was a trend toward more express saccades and excessive variability in SRT. These
observations suggest poor control over pre-target activity. Excessive pre-target activity
can combine with the phasic visual response on the contralateral side to trigger express
saccades in the prosaccade task (Fig. 2.4A, black dashed traces) and reflexive direction
errors in the antisaccade task (Fig. 2.4B, black dotted trace). ADHD behavior can be
Pro-Saccade Trials Anti-Saccade Trials
Ipsilateral
Contralateral
RegularReflexive Errors FASD FASD Errors
Ipsilateral
Target
Eye
RegularExpress FASD FASD Error
Target
Eye Direction
Errors
Threshold Contralateral
DirectionErrors
Express
Regular
A B Express
Correct
Fig. 2.4 Accumulator model to describe eye movement abnormalities in FASD. Neural activity along the y-axis must grow to reach a given threshold to trigger a saccade. (A) In the pro-saccade task, with sufficient pre-target activity, the visual response can lead to the immediate threshold crossing and trigger an express saccade (black dashed trace). Reduced pre-target activity leads to the initiation of regular-latency saccades (black solid trace). In FASD, pre-target activity is reduced, leading to delayed threshold crossing (grey solid trace). In addition, activity is allowed to increase toward threshold on the ipsilateral side of the brain leading to highly unusual direction errors in the pro-saccade task (dotted grey trace). (B) To initiate a correct anti-saccade, activity must cross threshold on the ipsilateral side of the brain. If pre-target activity is too high, the post-target visual response can contribute to drive the contralateral accumulator over threshold triggering a reflexive direction error (black dotted trace). In FASD, reflexive direction errors are not triggered but longer latency errors can occur (grey dotted trace).
accounted for by deficits in managing pre-target excitability. Post-target factors appeared
somewhat normal in ADHD (Munoz et al., 2007). LeVasseur and colleagues (2001)
suggested that the increased SRT and reduced occurrence of express saccades in TS may
be due to a reduction in pre-target activity leading to delayed threshold crossing (similar
to grey traces in Fig. 2.4).
Recall that children with FASD exhibit increased SRT, a decreased ability to
trigger express saccades, increased direction errors in the prosaccade task and no
significant increase in direction error in the antisaccade task. We speculate that FASD
children have reduced excitability (reduced pre-target activity) in the saccade generating
circuit (Fig. 2.4, grey traces below black traces). As a consequence, in the prosaccade
task, an express saccade is never triggered, while in the antisaccade task, no direction
errors are triggered at express saccade latency. Instead, the reduced pre-target baseline
leads to prolonged reaction times. A striking difference between FASD and both TS and
ADHD, was the increase in the occurrence of direction errors in the prosaccade task.
Because of poor inhibitory control in FASD, inappropriate activity is allowed to increase
toward threshold on the ipsilateral side of the brain (Fig. 2.4A, see arrow and dotted grey
trace) leading to some direction errors in the prosaccade task, which is highly abnormal.
To initiate a correct antisaccade (Fig. 2.4B), activity must cross threshold on the
ipsilateral side of the brain. If pre-target activity is too high, the post-target visual
response on the contralateral side can contribute to drive the system over threshold
triggering a reflexive direction error (Fig. 2.4B, dotted black trace). Because of excessive
inhibition in FASD, reflexive direction errors are not triggered, but longer latency
direction errors can occur (Fig. 2.4B, see arrow and dotted grey trace).
61
Although, the specific mechanisms remain to be determined, our suggestions of
reduced pre-target activity and accumulation of activity on the wrong side (i.e., ipsilateral
side for prosaccades; contralateral side for antisaccades; see arrows in Fig. 2.4) is unique
for FASD and is dramatically different to what is proposed for ADHD subjects(Munoz et
al., 2007). As discussed above, this may be the result of an upregulation in the
expression of GABAA receptors (Bailey et al., 1999;Bailey et al., 2001), which would
lead to increased inhibition. Such a mechanism could lead to oculomotor abnormalities,
and explain the reduction in baseline activity among saccade neurons (Fig. 2.4).
Although FASD subjects do not appear to be impaired in their ability to inhibit automatic
visually triggered saccades in the antisaccade task, it is clear that they do have deficits is
suppressing activity calling for inappropriate saccades (direction errors) at longer latency.
The exact mechanism by which increased inhibition translates into these abnormal
processes remains to be fully determined.
2.4.4 Study Limitations
As the sample size was small, it was not possible to confirm with any certainty the
contribution that medication and/or co-morbidity may have had to the findings presented
here. It appears from the scatter plots that the effects reported in this study were not
driven by lone subjects, who were considered outliers (Figs. 2.2 and 2.3). Still, the
importance of these possible confounders is noted and will be more fully investigated in
future larger scale studies.
2.4.5 Conclusion
To the best of our knowledge, this study is the first of its kind to evaluate control
of saccadic eye movements in children with FASD. A preliminary report of eye
62
movement recording in young adults with prenatal alcohol exposure reported similar
effects (Willford et al., 2005). Results from the larger scale study will more fully
characterize the sensitivity and specificity of these deficits in the FASD population. The
results from this preliminary study suggest that measuring saccadic eye movement
behavior is a promising research and diagnostic tool for evaluating the brain injury
resulting from prenatal ethanol exposure.
63
Chapter 3 EXECUTIVE FUNCTION DEFICITS IN CHILDREN WITH FETAL ALCOHOL SPECTRUM DISORDERS ASSESSED USING A MOBILE EYE TRACKING LABORATORY 3.1 Introduction
Adverse outcomes occurring in offspring as a consequence of prenatal exposure to
alcohol are documented (McGee and Riley, 2006;Kodituwakku, 2007). Fetal alcohol
spectrum disorders (FASD) is the umbrella term used to represent the full range of
teratogenic effects attributed to gestational alcohol exposure, including fetal alcohol
syndrome (FAS) (Koren et al., 2003). An FAS diagnosis requires the presence of pre-
and postnatal growth restriction, craniofacial dysmorphology and central nervous system
dysfunction (Chudley et al., 2005;Clarren and Smith, 1978). In the absence of one or
more of these features, individuals may receive a diagnosis of partial FAS (pFAS) or
Individuals with FASD may present with a range of impairments in executive
function (Funahashi, 2001;Lezak, 1995) that include deficits in spatial working memory,
planning, response inhibition, abstract thinking and the ability to shift attention
(Kodituwakku, 2007;Rasmussen, 2005). Impairments in executive function and social
skills reported by parents and teachers demonstrate that pervasive deficits impact on
social behaviors across multiple settings (Schonfeld et al., 2006).
Measurement of eye movement control is a powerful tool for assessing executive
function (Munoz and Everling, 2004). Extensive literature based on neurophysiological,
anatomical, imaging and lesion studies has contributed to our understanding of the neural
circuits controlling saccadic eye movements (Leigh and Zee, 1999;Sweeney et al.,
64
2007;Heide and Kompf, 1998;Pierrot-Deseilligny et al., 2004), and paradigms have been
used extensively in basic and clinical research (Ramat et al., 2007;Munoz et al., 2007).
In this study, subjects were required to look either toward (prosaccade) or away
from (antisaccade) a peripheral target that appeared on a computer monitor. Prosaccades
can be triggered automatically by visual inputs to the saccade generating circuit from the
visual and posterior parietal cortices (Munoz and Everling, 2004). Antisaccades require
additional steps of processing: suppression of the automatic prosaccade; and initiation of
the voluntary antisaccade. Successful antisaccade performance relies on circuitry that
includes higher brain centers such as the frontal cortex and basal ganglia (Munoz and
Everling, 2004). Deficits in parietal and frontal cortices, and basal ganglia have been
previously reported in FASD (McGee and Riley, 2006) making saccade tasks an
appropriate tool for assessing executive function.
In a previous report (Green et al., 2007c), we described eye movement
abnormalities in a small cohort of children with FASD (Chapter 2). However, the sample
size was too small to determine the effects of development or diagnosis within the FASD
spectrum on oculomotor control. To address these important questions, we developed a
mobile laboratory that facilitated eye movement testing in different communities across
Canada. We hypothesized that children with FASD display a developmental delay in eye
movement control, such that younger children exhibit relatively greater deficits compared
with older children. Moreover, we predicted that differences in the magnitude of deficits
in oculomotor control exist among the diagnostic subgroups, such that the children with
FAS demonstrate the most profound deficits.
65
Preliminary versions of these data have been presented in abstract form (Green et
al., 2007b;Green et al., 2007a).
66
3.2 Materials and Methods
3.2.1 Participants
All experimental procedures were reviewed and approved by the Human Research
Ethics Boards of Queen’s University, the Children’s Hospital of Eastern Ontario (Ottawa
subjects), and the University of Alberta (Edmonton subjects). Children with FASD were
recruited from 8 different communities across Ontario and one community from Alberta
(see Table 3.1). A total of 189 subjects were recruited into the study: 92 (40 males, 52
females; 11.2 ± 0.2 years of age, range 8-15 years) were control children (non-FASD)
and 97 were grouped as FASD. Of the 97 subjects included in the FASD group, 89 (44
males, 45 females; 10.7 ± 0.2 years of age, range 8-15 years) had a diagnosis within the
FASD spectrum (FAS, pFAS, ARND), while 8 were suspected and/or exposed, but had
yet to receive a definitive diagnosis. The children with FASD were previously assessed at
local diagnostic clinics in accordance with the Canadian Diagnostic guidelines (Chudley
et al., 2005). Data sets from one control subject and one subject with FASD were lost
due to equipment problems. All data included in the analysis for the FASD group were
obtained from the 88 children who had received a diagnosis within the spectrum and 91
controls. For the purpose of analysis based on age, children were placed in one of three
separate age bins: 8-10 years, 11-12 years and 13-15 years.
Of the 89 children with FASD, 60 were medicated for behavioral symptoms
relating to their co-morbidities (i.e., stimulant and antipsychotic agents). On the test day,
primary caregivers were asked to withhold medication until the testing was completed.
Of the 60 children taking medications, 8 were tested on medication (87% compliance
67
Table 3.1: Test locations and subject breakdown.
TEST SITE
FASD (N)
CONTROL (N)
Cobourg, ON
0 12
Durham, ON
11 3
Edmonton, AB
17 2
Kenora, ON
11 0
Kingston, ON
11 46
Ottawa, ON
9 10
Peterborough, ON
6 5
Sioux Lookout, ON
15 6
Toronto, ON
9 8
Total:
89 92
68
with the off medication request). For the remaining 52 children, their last daily dose was
administered a minimum of 12 hours prior to testing.
All control subjects had no known neurological, psychiatric or visual disorders,
other than requiring corrective lenses. Primary caregivers were informed of the nature of
the study and provided written consent on behalf of the participants. All subjects
completed one, 1-hour eye movement session. Each subject received $10 and a small gift
for participating in the study.
3.2.2 Saccade Task
All participants performed a blocked design saccade task (Fig. 1.1), consisting of
2 blocks of prosaccade and 2 blocks of antisaccade trials, each consisting of 80 trials (320
trials total). Subjects received breaks when needed, and refreshments were provided
upon completion of the task. Participants were seated comfortably in a darkened room,
facing the center of a laptop screen located 46 cm away. Task presentation on the laptop
screen was produced using E-prime software. A red spot with a luminosity of
~12.5 cd/m2; and x=0.57 and y=0.32 coordinates in CIE space (relative to the background
lumination of ~ 1.0 cd/m2; and x=0.34 and y=0.34 coordinates in CIE space) was
positioned at the center of the screen and served as the initial fixation point (FP). Red
target (T) spots were positioned on the screen at 15° to the right or left of the central FP.
The screen was diffusely illuminated between trials to avoid dark adaptation. Each trial
began with a 250-ms period of darkness. The FP appeared for 1,000 ms and then one of
two conditions occurred (Fig. 1.1). In the gap condition, the FP was extinguished and,
after a period of 200 ms, the target appeared in the right or left visual field. In the overlap
condition, the FP remained illuminated while the target appeared.
69
In the block of prosaccade trials, participants were instructed to look toward the
target as soon as it appeared. In the block of antisaccade trials, participants were
instructed to look away from the target to the opposite side. The target remained
illuminated for 1,000 ms, after which all visual stimuli disappeared and the background
illumination reappeared, indicating the end of that trial. Target location (right or left) and
fixation condition (gap or overlap) were pseudo-randomly interleaved throughout each
block of trials. Subjects were asked to repeat and demonstrate the instructions to the
experimenter to ensure that they understood the task before the onset of data collection.
3.2.3 Recording and Analysis of Eye Movement
The video-based infrared eye-tracker (ISCAN Inc., Burlington, MA) was adapted
for use as a mobile laboratory, and transported to each test center. Eye position was
measured using a head-mounted camera that was connected to a data acquisition
computer. The video-based infrared eye-tracker, tracked the pupil movement, extracting
measures of eye position and pupil size at a sampling rate of 240 Hz. Only left eye
position was digitized. Saccades were detected offline at 3 standard deviations above the
background and must have lasted longer than 5 sample points (Matlab, custom software).
Saccadic reaction time (SRT) was defined as the time from target appearance to
initiation of the first saccade that exceeded 30°/s. Saccades were scored as correct if the
first movement after target appearance was > 5° in amplitude and in the correct direction
(i.e., toward the target for prosaccades; away from the target for antisaccades). Saccades
were scored as incorrect if the first saccade after the appearance of the target was in the
wrong direction relative to the instruction (i.e., away from the target in the prosaccade,
toward the target in the antisaccade). All saccade marks and direction errors were verified
70
off-line. The mean SRT in the prosaccade and antisaccade task was computed from all
correct trials with reaction latencies between 90 and 1000 ms to eliminate short-latency
anticipatory saccades (Munoz et al., 1998). In addition, we measured express saccades
(latency: 90-140 ms), which are the shortest latency visually triggered saccades (Dorris et
al., 1997;Fischer et al., 1993); and this express epoch was confirmed for the mobile
laboratory. There was some variability in the experimental conditions across multiple
test sites. Most notable was the amount of ambient light in which the test sessions were
conducted, and we attempted to control for this variability by covering external light
sources (i.e., windows) with curtains or sheets. However, target luminosity changed very
little regardless of these differences in background ambient light. We also maintained
similar set-up protocols to ensure that equipment and experimenter/subject space was
consistent for each test site.
The following parameters were computed for each condition (gap, overlap): the
mean SRT for correct trials, the coefficient of variation (CV) of SRT for correct trials
[(CV = standard deviation/mean) x 100], the percentage of express saccades, and the
percentage of direction errors.
3.2.4 Inclusion/Exclusion criteria
In order to determine inclusion and exclusion criteria, SRT histograms were
prepared for each subject for each experimental task (pro, anti) and condition (gap,
overlap). From these figures, subjects were placed in bins according to their
performance. For example, Selection A included all subjects who could perform
saccades under each task and condition, while Selection E reflected those subjects who
could only perform prosaccades. This approach provided a means for excluding subjects
71
who could not perform certain tasks or in situations where only a minimum number of
trials were completed under a given condition (Table 3.2). Univariate data analyses were
conducted for each outcome measure for each task (pro- and antisaccade) in each
condition (overlap and gap), which included only the data sets from those subjects who
were successful in performing the given task in the specified condition. Subsequently,
analysis including both tasks and both conditions demonstrated that the statistical
comparisons obtained from the complete data set were not different from the individual
univariate analyses. Therefore, statistically significant outcome measures from the
complete data set were a true representation of the study population.
3.2.5 Data Analysis
The two experiments (prosaccade and antisaccade) contained one within-subject
factor: fixation state (gap vs overlap); and two between-group factors: clinical pathology
(FASD vs control) and age (bins: 8-10 years, 11-12 years and 13-15 years). Unless
specified otherwise, all dependent measures (SRT, CV, express saccades, direction
errors) were analyzed using ANOVA with α set at 0.05. Difference scores (i.e., anti-
effect and gap-effect) were analyzed using two-tailed, unpaired Student’s t-tests corrected
with Welch’s approximation when the assumption for homogeneity of variance was not
met. The effect of diagnosis (ARND, pFAS and FAS) was also determined by matching
each subject in the FASD group (as close as possible) to a control subject by age and sex.
FASD and control subjects once subdivided were analyzed by univariate analyses to test
for differences between the diagnostic groups; and t-tests were conducted to contrast the
pairs. We focus on descriptions of the relevant statistical parameters for comparisons and
interactions that occurred between the control and FASD groups.
72
Table 3.2. Subject performance breakdown by task and condition for children with FASD and controls.
Selection
A B C D E F G
PG; PO AG; AO
PG; PO AO
PG; PO AG
PG AO
PG; PO PG None Total**
FASD
53
7
5
2
16
2
3*
88
Control
82
6
0
0
3
0
0
91
P=prosaccade; A=antisaccade; G=gap condition; O=overlap condition *Two subjects did not attempt the antisaccade trials. **One subject with FASD and one control subject data sets were lost due to equipment problems.
73
3.3 Results
3.3.1 Saccadic Reaction Time
Figure 3.1 depicts the cumulative distribution of SRT for correct responses
(positive values) and direction errors (negative values) in all experimental conditions for
control children and those diagnosed with ARND, pFAS or FAS. Children with FASD
had longer SRTs compared with controls [F(1,165) = 18.6, p < 0.001]. Consistent with
previous studies (Munoz et al., 1998;Dafoe et al., 2007), the mean SRT was increased for
antisaccades compared with prosaccades [F(1,165) = 649.0, p < 0.001], and in the
overlap condition compared with the gap condition [F(1,165) = 531.5, p < 0.001] for all
groups.
The anti-effect (anti SRT – pro SRT) provides a measure of the difference in
reaction times for anti- and prosaccades, thus illustrating differences in the voluntary and
automatic mechanisms. The anti-effect for children with FASD was not significantly
different from control children in the overlap or gap conditions (p > 0.05). The mean
anti-effect was 100 ± 7 ms and 119 ± 7 ms for children with FASD in the overlap and gap
condition, respectively; and 94 ± 5 ms and 109 ± 4 ms for controls, respectively.
The gap-effect (overlap SRT-gap SRT) provides a measure of the difference
between fixation conditions, and serves to illustrate whether there are deficits in the
processes of disengagement from fixation. The mean gap-effect for prosaccades was 71
± 4 ms for children with FASD and 75 ± 3 ms for control subjects, and there was no
significant difference between groups (p > 0.05). Similarly, the gap effect for
antisaccades was also not significantly different between the two groups (p > 0.05), and
the mean was 51 ± 7 ms and 60 ± 2 ms for FASD and control subjects, respectively.
74
0 100 200 300 400 500 600-0.2
0.0
0.2
0.4
0.6
0.8
1.0
ControlARNDpFASFAS
APr
obab
ility
0 100 200 300 400 500 600-0.6
-0.4
-0.2
-0.0
0.2
0.4
0.6
0.8
correct
error
B
0 100 200 300 400 500 600-0.2
0.0
0.2
0.4
0.6
0.8
1.0 C
SRT (ms)
Prob
abili
ty
0 100 200 300 400 500 600-0.6
-0.4
-0.2
-0.0
0.2
0.4
0.6
0.8 D
SRT (ms)
ProSaccade Trials AntiSaccade TrialsGap
Overlap
Figure 3.1. Cumulative distribution of saccadic reaction times for correct responses (positive values on the ordinate) and direction errors (negative values on the ordinate) for prosaccade (A,C) and antisaccade (B,D) trials in the gap (A,B) and overlap (C,D) conditions. Blue solid traces, alcohol-related neurodevelopmental disorder (ARND) data; green solid traces, partial fetal alcohol syndrome (pFAS) data; red solid traces, fetal alcohol syndrome (FAS) data; gray solid traces, control data. The open box highlights the express saccade epoch (90-140 ms).
75
After pairing each child within the diagnostic subgroup with the appropriate
control, unpaired t-tests were conducted. In the prosaccade task, complete data sets were
obtained from 42 children with ARND, 18 with pFAS and 25 with FAS; and in the
antisaccade task, there were 41 children with ARND, 18 with pFAS and 24 with FAS. In
comparison to their matched control, children with ARND had greater prosaccade SRTs
in the gap condition t(68) = 3.3, p < 0.01, but not in the overlap condition (p > 0.05); and
greater antisaccade SRTs in the overlap condition t(80) = 2.0, p < 0.05, which approached
significance in the gap condition (p = 0.08). Children with pFAS were not significantly
different from their matched control with respect to prosaccade SRTs in the overlap
condition (p > 0.05), although scores approached significance in the gap condition (p =
0.06); and antisaccade SRTs were significantly greater than the matched controls in the
gap condition t(34) = 2.9, p < 0.01, and approached significance in the overlap condition
(p=0.06). Compared to their matched controls, children with FAS demonstrated greater
prosaccade SRTs in the gap t(36) = 3.1, p < 0.01 and overlap t(37) = 2.3, p < 0.05
conditions; and similarly for antisaccade SRTs in the gap t(35) = 3.3, p < 0.01 and overlap
t(47) = 2.2, p < 0.05 conditions (Figs. 3.2 and 3.3).
We also were interested in determining whether there were significant differences
between children with ARND, pFAS and FAS across the different outcome measures.
There were no significant differences among the diagnostic subgroups for prosaccade
SRTs in the gap or overlap conditions (Fig. 3.2A and B); nor was there a difference for
antisaccade SRTs in the overlap condition (Fig. 3.3B). However, there was a significant
difference for antisaccade SRT in the gap condition F(2,80) = 5.4, p < 0.01, such that
76
Ctr ARND pFAS FAS150
250
350
* *
A
∞
SRT
(ms)
Ctr ARND pFAS FAS150
250
350
*B
Ctr ARND pFAS FAS30
35
40
45
50
* *
C
CV
(%)
Ctr ARND pFAS FAS30
35
40
45
50
**
D
Ctr ARND pFAS FAS0
5
10
15
20
*
E
Expr
ess
Sacc
ades
(%)
Ctr ARND pFAS FAS0
10
20 F
Ctr ARND pFAS FAS0
2
4
6
8
10
**
G
Dir
ectio
n Er
rors
(%)
Ctr ARND pFAS FAS0
2
4
6
8
10
** *
H
GAP OVERLAP
Figure 3.2. Quantification of parameters for the prosaccade task in the gap (A,C,E,G) and overlap (B,D,F,H) conditions. (A and B): mean saccadic reaction times (SRT) for correct responses. (C and D): coefficient of variation in SRT (SD of SRT/mean SRT x 100%). (E and F): percentage of express saccades (SRT: 90-140 ms). (G and H): percentage of direction errors. Grey, control (Ctr) data (subgroups collapsed); blue, alcohol-related neurodevelopmental disorder (ARND) data; green, partial fetal alcohol syndrome (pFAS) data; red, fetal alcohol syndrome (FAS) data. *p ≤ 0.05 compared with matched-control subjects; ∞0.05 < p < 0.1 compared with matched-control subjects.
77
Fig. 4GAP OVERLAP
Ctr ARND pFAS FAS300
350
400
450
* *
****A
∞
SRT
(ms)
Ctr ARND pFAS FAS300
350
400
450
**
B
∞
Ctr ARND pFAS FAS20
25
30
35
40
* *C
∞
CV
(%)
Ctr ARND pFAS FAS20
25
30
35
40
* * *
D
Ctr ARND pFAS FAS10
20
30
40
50
60
* * *E
Dire
ctio
n Er
rors
(%)
Ctr ARND pFAS FAS10
20
30
40
50
60
* * *
F
Figure 3.3. Quantification of parameters for the antisaccade task in the gap (A,C,E) and overlap (B,D,F) conditions. (A and B): mean saccadic reaction times (SRT) for correct responses. (C and D): coefficient of variation in SRT (SD of SRT/mean SRT x 100%). (E and F): percentage of direction errors. Grey, control (Ctr) data (subgroups collapsed); blue, alcohol-related neurodevelopmental disorder (ARND) data; green, partial fetal alcohol syndrome (pFAS) data; red, fetal alcohol syndrome (FAS) data. *p ≤ 0.05 compared with matched-control subjects; **p ≤ 0.05 statistical significance between the FASD diagnostic subgroups (A); ∞0.05 < p < 0.1 compared with matched control subjects.
78
children with pFAS and FAS had greater SRT than children with ARND (p < 0.05) (Fig.
3.3A). This difference in SRT performance in the gap condition was also reflected in the
anti-effect. There was a significant difference in the anti-effect only in the gap condition
[antisaccade SRT – prosaccade SRT] (F(2,80) = 4.2, p < 0.05): children with pFAS had a
greater anti-effect compared to the children with ARND (p < 0.05). There was no
statistically significant difference between children with FAS and ARND (p > 0.05), or
between children with FAS and pFAS (p > 0.05).
3.3.2 Coefficient of Variation in SRT
The CV expresses the intra-subject variability in SRT. Children with FASD
demonstrated greater variability compared to controls [F(1,165) = 32.0, p < 0.001]. This
difference in SRT variability among children in the FASD group is likely due to
increased heterogeneity in task performance resulting from differing degrees of brain
injury, and subsequent dysfunction, following prenatal alcohol exposure.
In comparison to their matched control, children with ARND had greater
prosaccade CV in the gap t(82) = 3.1, p < 0.01 and overlap t(82) = 3.0, p < 0.01 conditions;
and greater CV for antisaccades in the gap t(80) = 3.1, p < 0.01 and overlap t(80) = 4.3, p <
0.001 conditions. Children with pFAS were not significantly different from their
matched control with respect to prosaccade CV in either the gap or overlap conditions (p
> 0.05); however, CV for antisaccades was significantly greater in the overlap condition
t(34) = 3.0, p < 0.01 and approached significance in the gap condition (p = 0.06).
Compared to their matched controls, children with FAS demonstrated greater prosaccade
CV in the gap t(48) = 2.7, p < 0.05 and overlap t(48) = 2.1, p < 0.05 conditions; and
79
similarly CV for antisaccades was also greater in the gap t(47) = 2.3, p < 0.05 and overlap
t(35) = 3.6, p < 0.01 conditions.
Among the diagnostic subgroups, there were no significant differences in CV for
prosaccades (Figs. 3.2C and D) or antisaccades (Figs. 3.3C and D) in the gap or overlap
conditions (p > 0.05).
3.3.3 Express Saccades
In contrast to our previous findings (Green et al., 2007c) where children with
FASD generated significantly fewer express saccades, there was no effect of group on the
proportion of express saccades in either the gap or overlap conditions (p > 0.05).
In comparison to their matched control, children with ARND demonstrated no
significant differences in the percentage of express saccades generated in either the gap or
overlap conditions (p > 0.05). Children with pFAS generated significantly fewer express
saccades in the gap condition t(34) = 2.0, p = 0.05 compared to their matched controls, but
no significant difference in the overlap condition (p > 0.05). There was no significant
difference in the percentage of express saccades generated by children with FAS
compared to their matched controls in either the gap or overlap conditions (p > 0.05).
Among the diagnostic subgroups, there were no significant differences for the
percentage of express saccades in the prosaccade task in the gap or overlap conditions
(Figs. 3.2E and F) (p > 0.05).
3.3.4 Direction Errors
Consistent with previous literature (Munoz et al., 1998), there was a significant
increase in the percentage of direction errors in the antisaccade task [F(1,165) = 461.8,
p < 0.001] compared with the prosaccade task, and in the gap condition [F(1,165) =
80
260.9, p < 0.001] compared with the overlap condition. Children with FASD made more
direction errors compared to controls [F(1,165) = 30.5, p < 0.001].
In comparison to their matched control, children with ARND generated more
direction errors for prosaccades in the gap t(59) = 2.0, p = 0.05 and overlap t(55) = 2.4, p <
0.05 conditions; and more directions errors for antisaccades in the gap t(80) = 4.2, p <
0.001 and overlap t(69) = 5.0, p < 0.001 conditions. Children with pFAS were
significantly different from their matched control with respect to direction errors for
prosaccades in the gap t(28) = 2.1, p < 0.05 and overlap t(23) = 2.2, p < 0.05 conditions; and
for antisaccades in the gap t(34) = 2.0, p = 0.05 and overlap t(34) = 2.0, p < 0.05 conditions.
Compared to their matched controls, children with FAS demonstrated greater prosaccade
direction errors in the overlap t(30) = 2.8, p < 0.05, but not gap (p > 0.05) condition; and
increased direction errors for antisaccades in the gap t(47) = 3.1, p < 0.01 and overlap t(33)
= 4.2, p < 0.001 conditions.
Among the diagnostic subgroups, there were no significant differences in the
percentage of direction errors for prosaccades in the gap or overlap conditions (Fig. 3.2G
and H) (p > 0.05); nor were there differences for antisaccades in the gap condition (Fig.
3.3E) (p > 0.05). A trend was apparent for direction errors in the antisaccade task in the
overlap condition (F(2,80) = 2.6, p = 0.08) (Fig. 3.3F), such that the children with ARND
tended to make fewer direction errors compared to FAS (p = 0.1). The same trend was
not apparent between children with ARND and pFAS (p > 0.05), nor for children with
FAS and pFAS (p > 0.05).
81
3.3.5 Age
To examine the effect of age, children in the two experimental groups (controls
and FASD) were distributed into different age bins: 8-10 years, 11-12 years, and 13-15
years. The ANOVA revealed a significant effect of age for SRT F(2,165) = 11.2,
p < 0.001; CV F(2,165) = 9.6, p < 0.001; and direction errors F(2,165) = 13.5, p < 0.001;
but not for express saccades (F(2,165) = 0.4, p = 0.6). Consistent with previous studies
(Munoz et al., 1998), performance in these tasks improved across the range of ages tested
for children with FASD and controls, as observed for antisaccade SRT and percentage of
direction errors in the gap and overlap conditions (Fig. 3.4); and children with FASD
differed significantly from control subjects across each age bin (p < 0.05). The same
observations were made for antisaccade CV, as well as, prosaccade SRT, CV and
percentage of direction errors (not shown). However, there was no interaction between
age and group, suggesting that deficits in oculomotor control in children with FASD
cannot be explained by developmental delay alone, as they failed to achieve age-matched
control levels of performance.
82
8-10 11-12 13-15250
300
350
400
450
ControlFASD
A
* * *SRT
(ms)
8-10 11-12 13-15250
300
350
400
450 B
* * *
8-10 11-12 13-150
10
20
30
40
50
60 C * **
Age Bins
Dir
ectio
n Er
rors
(%)
8-10 11-12 13-150
10
20
30
40
50
60 D
* **
Age Bins
GAP OVERLAP
Figure 3.4. Mean saccadic reaction times (A,B) and direction errors (C,D) versus age for the antisaccade task in the gap (A,C) and overlap (B,D) conditions. Shaded bars, control data; open bars, fetal alcohol spectrum disorders (FASD) data. *p ≤ 0.05 compared with control subjects.
83
3.4 Discussion
In this study, subjects were required to look either toward (prosaccade) or away
from (antisaccade) a peripheral target that appeared on a computer monitor, which probes
the ability of subjects to generate automatic visually triggered saccades, and to suppress
the automatic saccade and generate a voluntary response in the opposite direction,
respectively. Children with FASD exhibited increased saccadic reaction times, intra-
subject variability, and direction errors. We also demonstrated that across the diagnostic
subgroups, the greatest magnitude of difference in performance occurred for antisaccade
tasks, reflecting deficits in executive function (Munoz and Everling, 2004). Moreover,
across the ages examined, children with FASD never achieved a level of performance
equivalent to the age-matched control group, suggesting that deficits in eye movement
control may persist into adulthood (Chudley et al., 2007). We discuss these findings as
they relate to the current understanding of oculomotor control and diagnostic subgroups
of FASD.
3.4.1 Oculomotor Circuitry
The oculomotor system has been well characterized (Sweeney et al., 2007;Pierrot-
Deseilligny et al., 2004;Munoz and Everling, 2004;Heide and Kompf, 1998). The main
cortical areas involved in saccade generation are the parietal eye field (PEF) located in
the posterior parietal cortex (PPC), as well as the frontal eye fields (FEF), the dorsolateral
prefrontal cortex (dlPFC) and the supplementary eye fields (SEF) in the frontal lobe
(Munoz and Everling, 2004), all of which project directly to the intermediate layers of the
superior colliculus (SCi) to control saccade production. Oculomotor areas of the frontal
cortex also send projections to the SCi via the direct, indirect and hyperdirect pathways
84
through the basal ganglia (Munoz et al., 2007;Hikosaka et al., 2000;Munoz and Everling,
2004;Nambu et al., 2002). The basal ganglia are generally associated with cognitive and
motor function, and play a key role in oculomotor control (Hikosaka et al., 2000). The
caudate nucleus is related to oculomotor behaviors that are necessary for predicting
environmental changes (Hikosaka et al., 1989;Cameron et al., 2007), and decreased
activity may impede performance even in simple oculomotor tasks such as the pro- and
antisaccade tasks.
PEF lesions produce increased prosaccade latencies, with little effect on volitional
saccades in monkeys (Lynch and McLaren, 1989); and unilateral lesions to the PPC
increase prosaccade latency in both the gap and overlap conditions in humans (Pierrot-
Deseilligny et al., 1987;Pierrot-Deseilligny et al., 1991). Patients with lesions to the FEF
demonstrate profound difficulties in initiating antisaccades leading to elevated SRTs
(Rivaud et al., 1994;Gaymard et al., 1999), suggesting its critical role in the initiation of
intentional voluntary saccades. Lesions to the dlPFC lead to an increase in direction
errors (i.e. automatic prosaccades) in the antisaccade paradigm; however, prosaccades are
relatively unaffected (Pierrot-Deseilligny et al., 1991;Guitton et al., 1985). The SEF is
important for saccade sequences by combining or coordinating voluntary saccades, and
may be important for generation of successful antisaccades (Schlag-Rey et al.,
1997;Amador et al., 2004).
The results from our study demonstrate two areas of deficient oculomotor control
in children with FASD: 1) saccade initiation leading to increased SRTs; and 2) saccade
suppression resulting in increased direction errors in the antisaccade task. These deficits
are consistent with damage to parietal and frontal cortices, and basal ganglia. Structural
85
MRI studies have demonstrated a number of abnormalities following prenatal alcohol
exposure: 1) a disproportionate reduction of activity in the parietal lobe (Archibald et al.,
2001); 2) a relative increase in gray matter and decrease in white matter in the perisylvian
cortex of the parietal lobes (Sowell et al., 2001); 3) reduced brain growth in ventral
aspects of the frontal lobes (Riley et al., 2004); and 4) decreased basal ganglia volumes,
with specific reductions in the caudate nucleus (Mattson et al., 1996;Archibald et al.,
2001). Decreased caudate activity has also been shown using the blood oxygenated level
dependent signal from fMRI in subjects with FASD following tasks that require
inhibitory control (Fryer et al., 2007). Taken together, these findings indicate that
prenatal alcohol exposure has prolonged effects on brain development long after the in
utero insult. These results are consistent with the known deficits in executive function
associated with FASD (Rasmussen, 2005), and implicate the parietal and frontal cortices,
and basal ganglia as areas of particular sensitivity to prenatal ethanol exposure.
To summarize, PPC damage likely contributes to increased SRTs observed for
prosaccades in children with FASD, while damage to frontal structures (FEF, SEF,
dlPFC) and basal ganglia lead to increased SRTs for antisaccades and reduced ability to
suppress automatic saccades. Downstream structures such as the SCi are likely affected
only indirectly via aberrant projections from the frontal or parietal cortices, or basal
ganglia. Based on the near-normal prosaccade metrics in FASD (Green et al., 2007c) and
the normal gap-effect (this study), it appears that the SCi and brainstem saccade
generating circuit remain structurally intact, and the functional abnormalities are due to
atypical connections arising from upstream structures. We attribute the increased
direction errors observed in the prosaccade task to difficulties in focused attention in
86
children with FASD. Future functional imaging studies using the same oculomotor tasks
will confirm or refute the extent of involvement of these structures, and provide more
definitive answers.
In contrast to our previous report (Green et al., 2007c), children with FASD did
not execute fewer express saccades compared to controls. This observation was not
attributed to sudden performance improvement by the children with FASD; rather it was
due to the control subjects, who generated fewer express saccades under the experimental
conditions used in the mobile laboratory. In our previous study complete darkness was
achieved during experimental testing; however, during target presentation, the same
conditions were not possible using the mobile laboratory and presence of ambient
lumination likely underlie this result. These observations warrant further investigation.
3.4.2 Developmental Delay and FASD Subgroups
This large scale study allowed us to address questions related to the effects of age
and diagnostic subgroup on oculomotor behavior in children with FASD. There was no
age by group interaction in performance of the oculomotor tasks. Although there was an
improvement with age, subjects with FASD failed to achieve age-matched control levels
of task performance at any of the ages tested. This suggests that the deficits in
oculomotor control cannot be explained by developmental delay alone, and are likely
attributed to persistent brain injury well into adulthood (Chudley et al., 2007) and
involving dysfunction of the frontal-striatal circuitry.
We postulated that eye movement testing would reveal differences in the
magnitude of deficits among the diagnostic subgroups (i.e., FAS, pFAS, ARND). That is,
we expected that children with FAS, considered to be at the more severe end of the
87
spectrum, exhibit the greatest magnitude of deficits in eye movement control. However,
this was not the case, as children with ARND (i.e., not exhibiting facial dysmorphology
of FAS) were not different from pFAS or FAS on the majority of outcome measures.
Consistent with this observation, other published studies have reported no performance
differences between dysmorphic and non-dysmorphic children, who were prenatally
exposed to alcohol, on a number of neuropsychological tests that probe aspects of
executive function (Mattson et al., 1999;Schonfeld et al., 2006). Alcohol-exposed
individuals with and without facial features both exhibited statistically significant
increases in cortical thickness demonstrating that the facial phenotype was not a
prerequisite for brain dysmorphology (Sowell et al., 2008). Response inhibition in
children and adults with heavy prenatal alcohol exposure showed no significant
differences in the regions of interest between individuals with and without a FAS
diagnosis, though both groups were significantly different from control subjects (Fryer et
al., 2007). Of interest, in the clinical situation, it is the children with ARND that are most
difficult to diagnose, as they lack the facial dysmorphology (Chudley et al., 2005).
Although, we did not find differences between the diagnostic subgroups, all subgroups
were different from their age-matched controls on multiple outcome measures, even the
children with ARND (Figs. 3.2 and 3.3). Thus, measuring deficits in eye movement
control may have significant potential for screening individuals at risk for FASD.
3.4.3 Conclusion
Saccadic eye movement tasks show promise for assessing the brain injury
resulting from prenatal exposure to alcohol. Children between the ages of 8-15 years
demonstrated profound deficits across many outcome measures for both pro- and
88
antisaccade tasks suggesting dysfunction in frontal and parietal cortices and the basal
ganglia. Thus, eye movement experiments, and particularly the antisaccade task, provide
objective measures of executive dysfunction in children with FASD, and may provide a
more sensitive measure of overall cognitive function. This is an important point, as it has
been shown that performance across tasks of executive function was lower in FASD than
would be otherwise predicted by IQ alone, supporting the need for novel tools that can
provide sensitive and specific assessments of brain injury (Niccols, 2007). With the
advent of eye tracker systems equipped for use in MRI, it will be possible to identify the
specific cortical and subcortical regions underlying these deficits.
89
Chapter 4 EXECUTIVE FUNCTION DEFICITS IN CHILDREN WITH FETAL ALCOHOL SPECTRUM DISORDERS (FASD) MEASURED USING THE CAMBRIDGE NEURO- PSYCHOLOGICAL TESTS AUTOMATED BATTERY (CANTAB) 4.1 Introduction
A serious and debilitating consequence to maternal consumption of alcohol during
pregnancy is FAS, characterized by growth restriction, craniofacial dysmorphology and
CNS dysfunction (Astley and Clarren, 2000;Clarren and Smith, 1978). However, FAS
represents only a fraction (10-15%) of the children affected by prenatal exposure to
alcohol; as it is more common for children to present with complex behavioural and
neurological dysfunction related to their exposure, but in the absence of some or all of the
characteristic facial features (Koren et al., 2003). In these situations, the diagnostic terms
partial FAS (pFAS) and alcohol-related neurodevelopmental disorders (ARND) have
been used to describe individuals who do not meet all of the criteria for FAS (Chudley et
al., 2005;Stratton et al., 1996).
Recently, the term fetal alcohol spectrum disorders (FASD) has been widely
adopted and encompasses all diagnoses and clinical presentations arising from prenatal
alcohol exposure, including FAS (Koren et al., 2003;Chudley et al., 2005). Despite the
various efforts to streamline diagnostic criteria, the need for accurate and objective
measurement tools that could assist in the identification of individuals with prenatal
exposure to alcohol is needed (Rasmussen, 2005). With early diagnosis, the appropriate
clinical and therapeutic interventions could be implemented, with the goal of preventing
and/or reducing the incidence of secondary disabilities (Streissguth et al.,
2004;Streissguth et al., 1985;Streissguth et al., 1991).
90
A hallmark feature of FASD is deficits in executive function [see reviews
(Rasmussen, 2005;Kodituwakku, 2007;Riley and McGee, 2005)]. Executive function is a
heterogeneous term that refers to a range of abilities involved in conscious, goal-oriented
behaviour (Funahashi, 2001). It has been postulated that a continuum exists wherein
those with prenatal alcohol exposure, but without FAS, demonstrate less severe deficits
compared to those with FAS. However, many research groups have failed to demonstrate
differences in executive function between dysmorphic and non-dysmorphic individuals
with prenatal alcohol exposure. For example, in a battery of 9 different executive
function tests, Connor and colleagues (2000) found no relationship between executive
function performance and facial phenotype. Task performance by dysmorphic and non-
dysmorphic subjects was intermingled, suggesting that the presence of facial features was
not predictive of performance. Similarly, both Schonfeld and colleagues (2006) and
Mattson et al. (1999) failed to find significant differences in executive function among
subjects with a history of prenatal alcohol exposure, both with and without facial features.
Recently, Kodituwakku postulated a behavioural phenotype for FASD associated
with the existing patterns of deficits in cognitive-behavioural function (Kodituwakku,
2007). These deficits contribute to a wide range of negative life outcomes that include
difficulties in academic, social and emotional aspects of life. Delineating the profile for
FASD is difficult as the severity of alcohol effects varies widely as a function of exposure
(i.e., quantity and frequency) and maternal factors (i.e., age, body weight) (Abel,
1995;Jacobson et al., 1998;Riley and McGee, 2005). However, individuals with FASD
experience greater difficulty achieving complex adaptive behaviours that involve the
91
integration of multiple domains, and which depend on different parts of the brain;
particularly the frontal lobes.
Interestingly, patients with FASD demonstrate clinical behaviours that resemble
those for patients diagnosed with frontal lobe lesions (Connor et al., 2000); and a
correlation between deficits in executive function and frontal lobe damage has been
evaluated in the FASD population. Functional magnetic resonance imaging (fMRI)
assessed inhibitory control in children and adolescents with prenatal alcohol exposure
using the blood-oxygen-level-dependent signal (Fryer et al., 2007). FASD individuals
demonstrated increased activation in the prefrontal cortex during trials that required
inhibition of action compared to control subjects, suggesting that greater cognitive
resources were required to perform the task. Increased neocortical thickness also has
been found in individuals with FASD following structural MRI analysis, over large areas
of the dorsolateral prefrontal lobes, especially in the right hemisphere (Sowell et al.,
2008). Neocortical thickness has been associated with functional integrity, where
neocortical thinning is associated with better general intellectual function. This is
consistent with previous observations demonstrating increased neocortical thinning from
childhood to adolescence (Sowell et al., 2004;Shaw et al., 2006). The correlation
between a thin neocortex and better performance in control subjects was not found in the
FASD group (Sowell et al., 2008), suggesting that pruning and myelination processes
may not be occurring normally in children with prenatal alcohol exposure. This
disorganization of neocortical structures may result from cellular changes that occur
during postnatal development and that are impacted by heavy prenatal alcohol exposure;
92
thus, supporting the view that brain-behaviour relationships do not develop normally in
these individuals.
The aim of our study was to assess executive function in children with FASD
compared to age- and sex-matched controls, using the Cambridge Neuropsychological
Test Automated Battery (CANTAB®) computerized test battery. Investigators have used
CANTAB® tasks to assess executive function during typical development (Luciana and
Nelson, 1998), and in other neurodegenerative (Egerhazi et al., 2007) and
neurodevelopmental disorders (Goldberg et al., 2005). The CANTAB® has several
advantages over other measures of executive function, as it provides a standardized
computer-administration format that controls for variations among different examiners. It
is nonverbal and provides information about direction and accuracy on screen and
employs the use of a touch-screen response that automates data acquisition. Finally, there
is evidence for the involvement of prefrontal and medial temporal brain regions in the
performance of the CANTAB® tasks (Luciana and Nelson, 2002). Thus, it was
hypothesized that children with FASD exhibit deficits in different domains of executive
function that can be quantified with the CANTAB® battery of neuropsychological tasks.
Second, it was hypothesized that tasks which demand the use of spatial working memory
and strategy demonstrate the most sensitivity to deficits in cognitive flexibility in children
with FASD, as these functions are particularly deficient in these individuals. Finally,
based on the literature, we also hypothesized that the magnitude of deficits in task
performance in CANTAB® is not different among the FASD diagnostic subgroups, with
and without the facial dysmorphology (i.e., FAS vs pFAS vs ARND).
93
Preliminary versions of these data has been presented in abstract form (Mihic et
al., 2007;Green et al., 2007a).
94
4.2 Materials and Methods
4.2.1 Participants
All experimental procedures were reviewed and approved by the Human Research
Ethics Boards of Queen’s University, the Children’s Hospital of Eastern Ontario (Ottawa
subjects), and the University of Alberta (Edmonton subjects). Parents provided informed
consent for participation. Children with FASD were recruited from 8 different
communities across Ontario and 1 from Alberta, and were previously assessed at local
diagnostic clinics and in accordance with the Canadian Diagnostic guidelines (Chudley et
al., 2005). A total of 189 subjects were recruited into the study: 92 (40 males, 52
females; 11.2 ± 0.2 years of age, range 8-15 years) were control children (non-FASD)
and 97 were grouped as FASD. Of the 97 subjects included in the FASD group, 89 (44
males, 45 females; 10.7 ± 0.2 years of age, range 8-15 years) had a diagnosis within the
FASD spectrum (FAS, pFAS, ARND), while 8 were suspected and/or exposed, but had
yet to receive a definitive diagnosis. All data included in the analysis for the FASD
group were obtained from the 89 children who had received a diagnosis within the
spectrum.
Of the 89 children with FASD, 60 were medicated (Table 4.1) for behavioural
symptoms relating to their co-morbidities (Table 4.2). On the test day, primary
caregivers were asked to withhold stimulant medication until the testing was completed.
Of the 60 children taking medications, 8 were tested on medication (87% compliance
with the off medication request), in most cases because the primary caregiver judged that
the child would not be able to complete testing off medication. For the remaining 52
children, their last daily dose of stimulant medication was administered a minimum of 12
95
Table 4.1 Medication history for children with FASD and Controls. Medications FASD Control Stimulants 38 (42.7%) 0 (0%) Antipsychotics 29 (32.6%) 0 (0%) Antidepressants 10 (11.2%) 0 (0%) Anticonvulsants 3 (3.4%) 0 (0%) Other* 20 (22.5%) 12 (13%) *Antihistamine, Anti-asthma, Oral contraceptives, Melanin
All control subjects had no known neurological, psychiatric or visual disorders,
other than requiring corrective lenses. Primary caregivers were informed of the nature of
the study and provided written consent on behalf of the participants. All subjects
completed one 30-45 minute neuropsychological battery. Each subject received $10 and
a small gift for participating in the study.
4.2.2 Neuropsychological Battery: CANTAB®
Subjects were asked to complete a series of 4 computerized neuropsychological
tests of the CANTAB® (Cambridge Cognition, Cambridge, United Kingdom). Subjects
were seated in front of a laptop screen and were instructed to carry out the tests by either
touching the screen or by pressing/releasing a press pad. Children were given short
breaks whenever needed, and snacks and beverages were provided upon completion of
the neuropsychological battery.
The goal of this research study was to assess the following four domains of
executive function: attention, planning, strategy use and spatial working memory. Based
on these areas of interest, the following four tests were selected as they were both age-
(other tasks were considered too difficult for the younger children in our cohort) and
time-appropriate (each testing session could be completed in 45 minutes or less):
Reaction Time (RTI) (which was used as a measure of attention and as a simple motor
screening task), Stockings of Cambridge (SOC) (assessed planning and strategy), Match
to Sample Visual Search (MTS) (assessed attention) and Spatial Working Memory
(SWM) (assessed spatial working memory and strategy). These tests will be described
briefly, as well as the pertinent outcome measures. Some children with FASD had
98
difficulty completing the full battery set (9 did not complete the SOC task; 2 did not
complete the MTS or SWM tasks), and in one situation a computer error prevented the
recording of data from one test for one control subject (SWM task).
4.2.2.1 Reaction Time (RTI)
In the RTI task, subjects were instructed to press down on the press pad until a
yellow dot appeared in the centre of either a single circle (simple) or in one of 5 different
concentric circle locations (5-choice). Upon appearance of the yellow dot, the subject
was instructed to release the press pad and touch the yellow circle as quickly as possible.
The outcome measures were reaction time (time to release press pad after the yellow
circle appeared) and movement time (time to touch the screen after releasing the press
pad) for both the simple and 5-choice problem sets.
4.2.2.2 Stockings of Cambridge (SOC)
The SOC task is similar to the Tower of London task, a derivative of the classic
Tower of Hanoi (Shallice, 1982), with the advantage being that data collection is
automated. Each problem set was comprised of three “stockings” or socks suspended
from a beam of different lengths containing different coloured balls (green, red and blue).
The computer created a problem set in the top portion of the screen and subjects were
then asked to copy this same configuration by moving their coloured balls so that the two
problem sets were identical. As the minimum number of moves increased, the
complexity of the problems increased as well. Outcome measures included the problems
solved in the minimum number of moves, the mean number of moves for each n-move
problem (i.e., n=2, 3, 4 or 5) and the mean initial thinking time for each n-move problem.
The SOC task also employed two modes for evaluation; one was a copy mode and one
99
was a follow mode. In the copy mode subjects were required to copy the problem set in
the required number of moves, while the follow mode instructed subjects to follow the
balls as they were moved into different stockings. The initial mean thinking time
measures were determined by taking the difference between the copy and follow mode,
which controlled for motor deficits.
4.2.2.3 Match to Sample Visual Search (MTS)
In the MTS task, a red box appeared in the centre of the screen concentrically
surrounded by 8 empty boxes. Upon pressing down on the press pad, a pattern appeared
in the center box, and after a brief delay an array of patterns appeared in 2, 4 or 8 of the
surrounding boxes. Upon recognition of the matching pattern, the subject was instructed
to release the press pad and touch the pattern that matched the center pattern. The
outcome measures included decision and movement times for each n-choice (i.e., n=2, 4
or 8) problem. Decision time represented the time to release the press pad after the
distracter patterns appeared, and the movement time was the time from releasing the
press pad to touching the correct pattern on the screen.
4.2.2.4 Spatial Working Memory (SWM)
In the SWM task subjects were presented with randomly distributed coloured
boxes ranging in number from 4 to 8. Subjects were instructed to locate hidden tokens
that appeared under each coloured box and move them to fill an empty panel located on
the right-hand side of the screen. Once a token had been located, subjects had to recall
that the computer would never hide a token in a coloured box previously found to contain
one; therefore, they had to remember not to revisit those coloured boxes. The outcome
measures analyzed were total number of errors (returning to a box previously found to
100
contain a token), errors for each n-box problem (i.e., n=4, 6 or 8), and a strategy score,
which indicated the use of a search strategy by the subject (low scores indicated good
strategy use).
4.2.3 Data Analysis
All dependent measures (RTI: reaction and movement time; SOC: problems
solved in the minimum number of moves and initial thinking time; MTS: movement time
and decision time and SWM: errors and strategy score) were analyzed using ANOVA
with α set at 0.05. Two-tailed, unpaired Student’s t-tests were conducted and corrected
with Welch’s approximation when the assumption for homogeneity of variance was not
met (SOC: initial thinking time across problem sets; MTS: movement and decision time
across problem sets). Data was analyzed by non-parametric Mann-Whitney tests when
the conditions for normal distribution were not met. The effect of diagnosis (ARND,
pFAS and FAS) also was determined by matching each subject in the FASD group (as
closely as possible), to a control by age and sex. FASD and control subjects once
subdivided were analyzed by univariate analysis to demonstrate differences. Effect sizes
were calculated from the means and standard deviations obtained for the major outcome
measures (Cohen, 1988). We focus on descriptions of the relevant statistical parameters
for comparisons that occurred between the control and FASD groups.
101
4.3 Results
We separately analyzed the impact of several potential confounding variables in
this study. First, 8 children in the FASD group were tested on stimulant medication.
However, when the data for these children were excluded from the analysis there was no
substantive change in the overall performance of the FASD group reported in this
communication. Second, within the FASD group, we compared the performance of
children withdrawn from stimulant medication to those children who were not taking any
stimulant medication. There were no differences between these groups for any of the
outcome measures reported in this communication (data not shown), suggesting that
stimulant drug withdrawal had a negligible impact on performance of the CANTAB®
tasks. Third, the major co-morbidity for children with FASD was attention-deficit
hyperactivity disorder (ADHD) (Table 4.2), and therefore we conducted an analysis of
performance between children who were co-morbid for ADHD versus those that were
not. There were no differences between these groups for any of the outcome measures
reported in this communication (data not shown), suggesting that the co-morbid diagnosis
of ADHD was not the major contributor to performance deficits in the CANTAB® tasks.
4.3.1 Reaction Time (RTI)
Figure 4.1 depicts the four outcome measures for the RTI: Simple and 5-Choice
reaction and movement times. The univariate ANOVA revealed the following for
dependent measures (simple and 5-choice reaction and movement times) and between-
subject measure (group). As compared to controls, children with FASD demonstrated
increased reaction times in the simple choice (F(1,169) = 14.5, p < 0.001) and 5-choice
102
Control FASD300
350
400
450
*A
Control FASD300
350
400
450
*B
Control FASD500
550
600
650 *C
Control FASD500
550
600
650 D
Reaction Time (ms)
Movement Time (ms)
Simple 5 Choice
Figure 4.1 Quantification of parameters for reaction time (A,B) and movement time (C,D) for simple (A,C) and 5-choice (B,D) problems in the Reaction Time (RTI) task. *p < 0.05 compared with control subjects.
103
(F(1,169) = 16.2, p < 0.001) tasks (Fig. 4.1A, B); as well as, increased movement times
in the simple choice (F(1,169) = 4.6, p < 0.05) task (Fig. 4.1C) and a similar trend for the
5-choice (F(1,169) = 3.0, p = 0.08) tasks (Fig. 4.1D).
4.3.2 Stockings of Cambridge (SOC)
Of the outcomes measures available for SOC, the problems solved in the
minimum number of moves, mean moves and initial thinking time were selected for
analysis (Fig. 4.2). The univariate ANOVA for the dependent measure (problems solved
in the minimum number of moves) and for between-subject effect (group) revealed that
children with FASD solved fewer problems in the minimum number of moves (F(1,160)
= 10.2, p < 0.005) (Fig. 4.2A) than the control group. Figure 4.2B illustrates the
breakdown in performance for children with FASD compared to controls for problem sets
of increasing difficulty. These data were analyzed using the non-parametric Mann-
Whitney test because the conditions for normal distribution were not met. Children with
FASD demonstrated poorer performance (i.e., more moves to solve a given problem) for
2-move (p < 0.05), 4-move (p < 0.05) and 5-move (p < 0.05) problems compared to
control children. For initial thinking time, the ANOVA for dependent measures (choice;
2, 3, 4 or 5), revealed an effect of choice (F(3,399) = 12.8, p < 0.001) such that the
children with FASD spent less time planning a strategy for completing the problem sets.
Children with FASD demonstrated a significant decrease in their initial thinking time for
4-move (t(165) = 1.9, p = 0.05) and 5-move (t(156) = 2.1, p < 0.05) problem sets compared
to control children, and no significant difference for 2- and 3-move problems (Fig. 4.2C).
104
Problem s solved in theM inim um Number of M oves
Control FASD0
5
10
*A
M ean M oves
2 3 4 50.0
2.5
5.0
7.5
ControlFASD
*
**B
n-Choice Problems
M ean In itia l T hinking T im e (m s)
2 3 4 50
2500
5000
7500
10000
* *
C
n-Choice Problems
Figure 4.2 Quantification of parameters for the total problems solved in the minimum number of moves (A), number of moves for n-choice problems (B) and mean initial thinking time for n-choice problems (C) in the Stockings of Cambridge (SOC) task. Open bars, fetal alcohol spectrum disorders (FASD) data; Shaded bars, control data. *p < 0.05 compared with control subjects.
105
4.3.3 Match to Sample Visual Search (MTS)
Figure 4.3 displays the outcome measures for MTS. For the univariate ANOVA
of the dependent measure mean movement time for correct responses, the effect of group
approached significance (F(1,167) = 3.0, p = 0.08); children with FASD were slower than
controls (Fig. 4.3A). For the decision time for correct responses, there was a group effect
(F(1,167) = 12.4, p < 0.005), demonstrating that children with FASD were slower to
recognize and decide which distracter pattern matched the central stimulus pattern
compared to controls (Fig. 4.3C). The movement and decision times across problem sets
of increasing difficulty are depicted in Fig. 4.3B and D. Movement time increased with
increasing difficulty (i.e., increased box number) and the ANOVA revealed for the
dependent measure (boxes; 2, 4, 8) an effect of box (F(2,332) = 29.1, p < 0.001). The
group effect approached statistical significance (F(1,166) = 2.8, p = 0.1); where children
with FASD had slower movement times compared to control children (Fig. 4.3A).
Decision time increased as the problem sets became more difficult (i.e., increased box
number) and the ANOVA revealed a significant effect of box (F(2,332) = 198.3, p <
0.001). There was a group effect for decision time (F(1,166) = 13.6, p < 0.001); which
demonstrated that children with FASD took longer to decide which distracter pattern
matched the central target pattern (Fig. 4.3C). For movement time, children with FASD
demonstrated significant motor delays for both the 4- and 8-box problem sets (t(99) = 2.5,
p < 0.05 and t(116) = 2.1, p < 0.05, respectively); and this approached significance in the 2-
box problem set (t(103) = 1.8, p = 0.08) (Fig. 4.3B). Similarly, for decision time, children
with FASD required more time to differentiate the matching pattern from distracters for
106
Control FASD0
500
1000
1500 A
2 4 80
1000
2000
ControlFASD
B
**
n-Boxes
Control FASD0
1000
2000
3000
4000 C *
2 4 80
1000
2000
3000
4000
5000
6000 D
**
*
n-Boxes
Movement Time (ms)
Decision Time (ms)
Figure 4.3 Quantification of parameters for the total movement time (A) and decision time (C); and the total movement time (B) and decision time (D) for n-move problems in the Match to Sample Visual Search (MTS) task. Open bars, fetal alcohol spectrum disorders (FASD) data; Shaded bars, control data. *p < 0.05 compared with control subjects.
107
2-, 4- and 8-box problems sets (t(136) = 4.4, p < 0.001, t(150) = 3.0, p < 0.005 and t(134) =
3.1, p < 0.005, respectively) (Fig. 4.3D).
4.3.4 Spatial Working Memory (SWM)
Figure 4.4A depicts the total number of errors (when a subject revisited a box
previously found to contain a token) in the SWM task for control and FASD subjects.
The univariate ANOVA for the total number of between errors revealed a significant
difference for group where children with FASD committed more errors compared with
controls (F(1,166) = 44.4, p < 0.001). Figure 4.4B depicts the number of errors stratified
by increasing task difficulty (i.e., increasing the number of boxes). As in the SOC task,
the conditions for normal distribution were not met and as a consequence non-parametric
analysis was conducted using the Mann-Whitney test. There was a significant difference
for the 4-, 6- and 8-box problem sets (p < 0.001), indicating that the children with FASD
demonstrated deficits in working memory such that they were unable to recall which
boxes had been previously searched and found to contain a token. This observation was
further supported by examining the strategy score; where lower scores indicate good use
of strategy (Fig. 4.4C). The univariate ANOVA revealed a significant effect of group on
strategy score, such that the control children demonstrated significantly lower scores
(F(1,166) = 23.6, p < 0.001).
4.3.5 Effect Size
The effect sizes were calculated for the major outcome measures obtained in the
CANTAB® tasks (Table 4.3). In the RTI task, there were moderate to strong effects in
reaction times, but relatively small effects in the movement time measures. Similarly, in
the MTS task, there was a moderate effect on decision time, but a relatively small effect
108
Errors
Control FASD0
25
50 *A
Errors
4 6 80
10
20
30
ControlFASD
*
**
B
n-box Problems
Strategy
Control FASD0
10
20
30
40 *C
Figure 4.4 Quantification of parameters for the total errors (A) and errors for n-box problems (B); and the strategy score (C) in the Spatial Working Memory (SWM) task. Open bars, fetal alcohol spectrum disorders (FASD) data; Shaded bars, control data. *p < 0.05 compared with control subjects.
on movement time. In the SOC task, the number of problems solved in the minimum
number of moves yielded a moderate effect. In contrast, very strong effects were obtained
in the SWM task, especially for the number of errors (searching a box previously found
to contain a token).
4.3.6 Diagnostic Subgroups
In the FASD group, 26 children had a diagnosis of FAS, 18 children had a
diagnosis of pFAS and 42 children had diagnosis of ARND. The control children were
matched to children from 1 of 3 subgroups (paired to FAS, paired to pFAS or paired to
ARND) based upon age and sex. Outcome measures for each task were then analyzed
and stratified by diagnosis for FASD and control children (control-FAS, control-pFAS
and control-ARND to signify the match). There was no significant difference between
diagnostic subgroups for any of the outcome measures in the tasks RTI, MTS and SWM,
although all diagnostic subgroups were different from controls (data not shown). In the
SOC task, there was one significant difference found between children in the diagnostic
subgroups (F(2,70) = 5.2, p < 0.01) that was not apparent for the matched control groups.
Specifically, children with a diagnosis of FAS solved significantly fewer problems
compared to children with a diagnosis of either pFAS (p < 0.05) or ARND (p < 0.05)
(Fig. 4.5).
111
ARND pFAS FAS5.0
7.5
10.0 ControlFASD
**
Problems solved in theMinimum Number of Moves
Figure 4.5 Quantification of the total problems solved in the minimum number of moves in the Stockings of Cambridge (SOC) task across diagnostic groups. Control subjects were matched perfectly or near perfectly to children with FAS, pFAS or ARND based on age and gender. Open bars, fetal alcohol spectrum disorders (FASD) data; Shaded bars, control data. *p < 0.05 depicts statistical significance.
112
4.4 Discussion
Our results suggest that the computerized CANTAB® research tool provides a
sensitive indicator of executive function deficits in children with FASD. Compared to
controls, children with FASD exhibited: 1) longer reaction/decision time latencies in the
RTI and MTS tasks; 2) a decrease in the number of problems solved in the minimum
number of moves, an increase in the mean number of moves and a decrease in the initial
thinking time in the SOC task; 3) increased errors and poorer use of strategy in the spatial
working memory task; and 4) little or no difference in performance across the diagnostic
subgroups (FAS, pFAS, ARND). Performance in these tasks revealed deficits in
attention, planning, strategy use and working memory. In this study population, the effect
size for impaired performance by children with FASD was greatest for the spatial
working memory task. These results support our initial hypotheses that children with
FASD demonstrate deficits in executive function that can be measured experimentally,
and that tasks that demand the use of spatial working memory and strategy demonstrate
the most sensitivity to deficits in cognitive flexibility in children with FASD. Of the 14
outcome measures analyzed across the four selected tasks, only one revealed significant
differences in performance across the diagnostic subgroups (FAS, pFAS, ARND),
indicating that deficits in the different domains of executive function provide sensitive
indicators of brain injury resulting from prenatal exposure to alcohol, regardless of the
presence of facial dysmorphology.
Our findings are consistent with previous studies in which prenatal alcohol
exposure has been correlated with generalized neurocognitive performance across tasks
of executive function [see reviews (Niccols, 2007;Kodituwakku, 2007;Rasmussen,
113
2005;Riley and McGee, 2005)]. Korkman and colleagues (2003) found deficits in
executive function and attention, and also demonstrated deficits in other cognitive
domains (Korkman et al., 2003). Similarly, Lee et al. (2004) were able to classify
alcohol-exposed children and controls with 93.3% and 90% specificity, respectively,
using two common attentional outcome measures from the Wechsler Intelligence Scale
for Children – Third Edition and the Attention Problems scale from the Child Behaviour
Checklist (Lee et al., 2004). The selected measures for attention reliably predicted
whether a child was prenatally exposed to alcohol, suggesting that attention deficits may
warrant further investigation as a potential mechanism for differentiating children with
FASD from other clinical populations.
The use of implicit strategy has been evaluated in children with heavy prenatal
alcohol exposure to determine its effects on learning and memory (Roebuck-Spencer and
Mattson, 2004). When semantic categories were not used, children with FASD forgot
more information than controls on a verbal learning test, and the greater the use of
semantic clustering positively correlated with the amount of information learned and
recalled. Interestingly, these observations were not driven by IQ differences between the
groups, suggesting that alcohol may affect memory abilities independent of its effect on
intellectual ability. The use of semantic clustering and rehearsal may be suitable
strategies for optimal learning in children with FASD. Recently, rehearsal training has
been evaluated in children with FASD (Loomes et al., 2007). Similar to the current
study, there were difficulties in the use of strategy and working memory in the children
with FASD, and these performance deficits were exacerbated with increasing task
complexity. However, children who received rehearsal training performed significantly
114
better than the control group and demonstrated the use of rehearsal strategies from their
training sessions, thus improving overall memory capabilities. We did not employ
rehearsal training in the current study, and thus it is possible that the poor performance
for children with FASD can be attributed to their inability to effectively develop suitable
strategies themselves in order to perform the tasks successfully. It is likely that the
implementation of rehearsal training may help to improve these core deficits.
After reviewing the literature, it was not surprising that there was only one
difference in cognitive performance among the diagnostic subgroups (FAS, pFAS and
ARND). Previous studies have reported little to no differences among dysmorphic and
non-dysmorphic subjects with prenatal alcohol exposure (Mattson et al., 1999;Roebuck-
Spencer and Mattson, 2004;Kodituwakku et al., 2001); and this is consistent with results
we obtained evaluating oculomotor control across the diagnostic subgroups (Green et al.
2008, unpublished findings). Individuals with FAS and fetal alcohol effects (FAE;
describes children who do not have all the physical characteristics of FAS) do not show
differences on tests of cognitive abilities, secondary disabilities and behavioural problems
(Sampson et al., 2000). Furthermore, it has been suggested that central nervous system
deficits in FAE may be as severe as or worse than individuals with FAS (Connor and
Streissguth, 1996). Thus, it is not surprising that significant differences in performance
among the three diagnostic subgroups were found only in one outcome measure.
While this study provided valuable data representative of a large sample size of
children with and without FASD, there were some limitations that should be noted. First,
we did not employ other neurocognitive tests in this study, which precludes the
determination of the relative sensitivity of CANTAB® compared with more traditional
115
cognitive and behavioural assessment tools. Second, data on ethnicity was not collected
in this study. As this may be associated with performance, differences in CANTAB®
task execution by ethnic group should be addressed in future studies. Third, it was not
possible to collect data regarding the frequency, quantity and timing of prenatal alcohol
exposure for each of our subjects, as this information was unavailable, especially for
children living in adoptive families or in foster care. It has proven very difficult to
ascertain a dose-response relationship for alcohol exposure and outcome in offspring, as
there are many factors (i.e., nutrition, genetics, ethnicity) that contribute to the severity,
and for which we were unable to control. Fourth, information on alcohol and nicotine use
was not quantified for our study population. It may be of interest to determine the
frequency and types of drug use among children between the ages of 8-15 years, as this
may impact on performance. Finally, as this was the first study to assess executive
function in children with FASD using the CANTAB®, only a specific subset of tasks was
selected. In future, tasks that probe other aspects of executive function may warrant
further investigation, especially those which assess verbal learning.
In conclusion, brain injury resulting from prenatal alcohol exposure can lead to
significant deficits in cognitive abilities that can be quantified using an easy to
administer, brief battery of computer-based neuropsychological tasks. We demonstrate
herein deficits in attention, planning, strategy and working memory, revealing that the
neurocognitive problems associated with FASD are widespread and generalized; though
deficits in spatial working memory may be affected to the greatest extent. Prenatal
alcohol exposure has been related to a decrease in the size of frontal cortex (Wass et al.,
2001;Riley et al., 2004;Sowell et al., 2008), which likely gives rise to most of these
116
impairments regardless of the presence or absence of facial dysmorphology. Finally, by
understanding the global dysfunction and comparing the subtle differences among
subjects with FASD to other clinical populations, it may be possible to develop specific
strategies and techniques that may mitigate the brain injury resulting from prenatal
exposure to alcohol and overcome these deficits in executive function.
117
Chapter 5 DEFICITS IN OCULOMOTOR CONTROL ARE CORRELATED WITH PERFORMANCE IN EXECUTIVE FUNCTION TASKS IN CHILDREN WITH FETAL ALCOHOL SPECTRUM DISORDERS (FASD) 5.1 Introduction
We have evaluated the use of saccadic eye movements as a novel method for
assessing brain function in children with FASD. Saccades are fast movements, in which
the line of sight is rapidly redirected as the eyes move in a coordinated fashion toward a
target that appears in the peripheral hemifield (Leigh and Zee, 1999). They are generated
quickly, and can be automatic or voluntary in nature depending on the task at hand. They
are easy to measure and non-invasive, and have been used to characterize brain function
in both neurodevelopmental and neurodegenerative disorders (Leigh and Kennard,
2004;Munoz et al., 2007;Ramat et al., 2007). Of the different types of saccades, it is the
volitional saccades that assess voluntary control (Leigh and Zee, 1999;Munoz and
Everling, 2004). They are internally triggered and provide a measure of both inhibitory
control and voluntary eye movement. In the antisaccade task – a type of volitional
saccade, the stimulus location and saccade goal are incompatible, and the automatic
response (i.e., toward the peripheral target) must be inhibited and a voluntary saccade
must be generated in the opposite direction (away from the peripheral stimulus) (Fig.
1.1). This task has been used to further characterize executive function in different
clinical populations (Munoz and Everling, 2004;Ramat et al., 2007;Munoz et al., 2007).
Although the concept of executive function is used commonly in the literature, its
definition remains more elusive. Executive function is generally accepted to represent
abilities that involve higher-level cognitive functions that describe ‘how’ human
behaviour is expressed (Lezak, 1995). Early lesion studies of individuals with frontal and
118
prefrontal lobe damage are credited with demonstrating their central role in executive
function. These first observations suggested that only the frontal lobes were involved;
however, it is now widely accepted that different subcortical and thalamic pathways also
play an important role [see review (Jurado and Rosselli, 2007)]. To date, several neural
circuits involving the frontal lobes, basal ganglia and thalamus have been implicated in
executive function performance (Royall et al., 2002). The dorsolateral prefrontal cortex
circuit underlies functions in planning, goal selection, set-shifting, working memory and
self-monitoring; the lateral orbitofrontal circuit is involved in risk assessment and
inhibition; and the anterior cingulate circuit monitors behaviour and self-correcting.
Deficits in executive function are a hallmark feature of FASD (Rasmussen, 2005),
and have been studied extensively in different cohorts of FASD subjects (Loomes et al.,
2007;Lee et al., 2004;Mattson et al., 1999;Roebuck-Spencer and Mattson,
2004;Schonfeld et al., 2001). These studies have provided valuable information
correlating the adverse effects of alcohol on brain development and function; and many
of these tools are used to assist in the diagnosis of individuals within the FASD spectrum.
Recently, our laboratory has adopted a standardized, computerized neuropsychological
test battery for testing children with FASD. The Cambridge Neuropsychological Test
Automated Battery (CANTAB®) is a highly validated research tool that has been used to
assess executive function in children (Luciana and Nelson, 2002). It has several
advantages over previous measures of executive function, as it provides a standard
computer-administration format that controls for variations among different examiners,
and there is support for the involvement of prefrontal and medial temporal brain regions
in the performance of the CANTAB® tasks (Luciana and Nelson, 1998).
119
Our laboratory has adapted both the eye movement experiments and
neuropsychological battery for use as a mobile laboratory, with the advantage of
attracting a greater number of participants into the study. The data generated in this study
allowed us to test the hypothesis that deficits in eye movement control are correlated with
performance in standardized neuropsychological tasks in children with FASD.
Preliminary versions of these data has been presented in abstract form (Green et
al., 2007a).
120
5.2 Materials and Methods
5.2.1 Participants
The composition of the study group is described in detail in the preceding
chapters. Additional information on the demographics of the study population is
presented in Appendix F (Table F.1). Primary caregivers were informed of the nature of
the study and provided written consent on behalf of the participants. All subjects
completed one, 1-hour eye movement session and a 45-minute neuropsychological test
battery. Each subject received $10 and a small gift for participating in the study.
5.2.2 Volitional Antisaccade Task
Participants performed two blocks of anti-saccades; each containing 80 trials (Fig.
1.1). For the antisaccade task, a red dot was positioned at the centre of the screen and
served as the initial fixation point. Red target dots were positioned on the screen at 150 to
the right or left of the central fixation point. The screen was diffusely illuminated
between trials to avoid dark adaptation. Each trial began with a 250-ms period of
darkness. In the task, participants were instructed to look away from the eccentric target
to the opposite side. The target remained illuminated for 1,000 ms, after which all visual
presentation disappeared and the background illumination reappeared, indicating the end
of that trial. Target location (right or left) was pseudo-randomly interleaved throughout
each block of trials. Subjects were asked to repeat and demonstrate the instructions to the
experimenter to ensure that they understood the paradigm before the onset of data
collection. For correlational analysis, the percentage of direction errors (saccades
generated towards the peripheral target) was computed.
121
5.2.3 Neuropsychological Tasks
Subjects completed the Stockings of Cambridge (SOC) and Spatial Working
Memory (SWM) computerized neuropsychological tests from the Cambridge
Neuropsychological Test Automated Battery (CANTAB® , Cambridge Cognition,
Cambridge, United Kingdom), as previously described in detail (Chapter 3). These tasks
probe aspects of planning, strategy use, and spatial working memory.
In the SOC test, the computer screen was divided horizontally into two; the top
portion representing the computer’s problem set, and the bottom portion the subject’s
problem set. The computer created a problem set in the top portion of the screen and
subjects were then asked to copy the same configuration by moving coloured balls on the
computer screen so that the two problem sets were identical. As the minimum number of
moves increased, the complexity of the problems increased as well. Outcome measures
used for correlational analyses included the total number of problems solved in the
minimum number of moves and the initial mean thinking time for 4- and 5-move
problems.
In the SWM task, subjects were presented with randomly distributed coloured
boxes ranging in number from 4 to 8. Subjects were required to locate hidden tokens that
appeared under each coloured box. Once a token was located, the box was recovered and
appeared identical to the other boxes. Subjects were informed that the computer would
never hide a token in a coloured box previously found to contain one; therefore, they had
to recall which boxes they had already searched and not revisit them. The outcome
measures used for correlational analyses included the total number of errors (returning to
122
a box previously found to contain a token) and the strategy score, which indicated the use
of a search strategy (a low scores indicated good strategy use).
5.2.4 Data Analysis
Direction errors in the antisaccade task were correlated with the
neuropsychological task outcome measures, as described above. Each data set was
analyzed for normality, and those that did not meet criteria for normal distribution
underwent non-parametric analysis using Spearman’s correlation. Pearson’s correlation
was used for parametric data and linear regression analyses were performed when
appropriate (Prism v.5.0, GraphPad Inc.). Significant correlations are indicated by
p<0.05. The correlational figures were further classified by the following age bins: 8-10
years, 11-12 years and 13+ years to determine if any clustering occurred among the
different age groups.
123
5.3 Results
An inverse correlation was found between direction errors in the antisaccade task
and initial mean thinking time for 4- and 5-Choice problems in the SOC task for children
with FASD (4-Choice: Spearman’s r = -0.34, p < 0.01; 5-Choice: Spearman’s r =-0.29,
p < 0.05) (Fig. 5.1). This correlation demonstrated that those children with FASD who
made fewer direction errors, also spent more timing planning their strategy for solving
both the 4- and 5-Choice problems, as indicated by the increased mean initial thinking
time. The same correlation was not apparent for control subjects. An inverse correlation
also was evident for children with FASD when the direction errors in the antisaccade task
and the total number of problems solved in the minimum number of moves in the SOC
task were contrasted (Spearman r = -0.31, p < 0.01). This correlation revealed that the
children, who made fewer direction errors, were the same children that solved more
problems in the SOC task (data not shown).
Direction errors in the antisaccade task also were correlated with errors and
strategy score outcome measures in the SWM task (Fig. 5.2). Both control and children
with FASD demonstrated a positive correlation between the number of direction errors in
the antisaccade task and the number of errors committed in the SWM task (FASD:
Pearson’s r = 0.39, p < 0.001; Control: Pearson’s r = 0.26, p < 0.05) (Fig. 5.2A,B). The
correlation indicated that children who committed fewer direction errors in the
antisaccade task also generated fewer errors in the SWM task. From the figure, it
appeared that the children in the control group clustered according to their age group,
such that the youngest children (8-10 years) demonstrated the poorest performance, while
the older children (13+ years) committed fewer direction errors in the antisaccade task
124
0 25 50 75 1000
10
20
30
40
50
Spearman r = -0.34p < 0.01
AIn
itial
Thi
nkin
g Ti
me
(s)
4-C
hoic
e Pr
oble
m
0 25 50 75 1000
10
20
30
40
50 B
0 25 50 75 1000
10
20
30
40
50
Spearman r = -0.29p < 0.05
C
Direction Errors (%)
Initi
al T
hink
ing
Tim
e (s
)5-
Cho
ice
Prob
lem
0 25 50 75 1000
25
50 D
Direction Errors (%)
FASD CONTROL
Figure 5.1 Correlations for the initial thinking time for 4-choice (A,B) and 5-choice (C,D) problems in the SOC task and percentage of direction errors in the antisaccade task for subjects with FASD (A,C) and controls (B,D). Filled circles, 8-10 years; open triangles, 11-12 years; filled squares, 13+ years. Linear regressions appear when correlations were significant (p < 0.05).
125
0 25 50 75 1000
25
50
75
100 Pearson's r = 0.39p < 0.001
AB
etw
een
Erro
rs
0 25 50 75 1000
10
20
30
40
50
60
70
Pearson's r = 0.26p < 0.05
B
0 25 50 75 10020
30
40
50
Pearson's r = 0.44p < 0.0001
C
Direction Errors (%)
Stra
tegy
Sco
re
0 25 50 75 100
20
30
40
50 D
Direction Errors (%)
FASD CONTROL
Figure 5.2 Correlations for errors (A,B) and strategy score (C,D) in the SWM task and percentage of direction errors in the antisaccade task for subjects with FASD (A,C) and controls (B,D). Filled circles, 8-10 years; open triangles, 11-12 years; filled squares, 13+ years. Linear regressions appear when correlations were significant (p < 0.05).
126
and errors in the SWM task. The same clustering of age groups was not apparent among
subjects with FASD, though there was no age by group interaction.
Finally, a significant positive correlation between direction errors in the
antisaccade task and strategy score in the SWM task was apparent for children with
FASD (Fig. 5.2C). This correlation indicated that the children who committed fewer
direction errors also demonstrated better use of a search strategy (Pearson’s r = 0.44,
p < 0.0001). This same correlation was not apparent in the control group.
127
5.4 Discussion
Here, we demonstrate for the first time that oculomotor behaviours correlate with
neuropsychological performance on tasks of planning, strategy and spatial working
memory in children with FASD, suggesting a relationship between eye movement
deficits and poor performance across tasks of neuropsychological function. In addition,
the data suggest a developmental pattern among control subjects, in which the younger
children demonstrate poorer performance across tasks, while the oldest children have
fewer difficulties; and the same clustering was not always apparent for children in the
FASD group. This observation suggests that performance deficits in the children with
FASD cannot be explained simply by developmental delay. We now review the
oculomotor neurocircuitry and then relevant findings will be discussed as they relate to
function and brain activity.
5.4.1 The antisaccade
Oculomotor tasks are an ideal tool for assessing executive function in children
(Salman et al., 2006;Munoz et al., 1998) and these tasks have been used to elucidate the
neural mechanisms involved in oculomotor control using both non-human and human
subjects (Munoz and Everling, 2004;Schall, 2004;Munoz and Schall, 2004;Everling and
Munoz, 2000;Munoz et al., 2000). The antisaccade task requires the recruitment of
structures located in the frontal and parietal cortices, basal ganglia and brainstem. These
structures have also been implicated in executive processes, and as such the antisaccade
task has been used to assess executive function in multiple clinical populations (Munoz et
al., 2007;Ramat et al., 2007). The antisaccade task is a two step process that requires
subject to 1) inhibit the automatic response to look at the target and 2) generate a
128
voluntary movement in the opposite direction (Fig. 1.1). The key brain structures
responsible for performing antisaccades are reviewed [for more detailed explanation of
saccadic eye movement neural circuitry please see (Gaymard et al., 1998;Pierrot-
Deseilligny et al., 1995;Munoz and Everling, 2004)].
Two key structures play a critical role in the suppression of the automatic
response and the generation of goal-directed saccades: the frontal eye fields (FEF) and
the intermediate layers of superior colliculus (SCi) (Munoz and Everling, 2004). Both
the FEF and SCi contain distinct populations of fixation and saccade neurons (Munoz et
al., 2000). Fixation neurons are tonically active during fixation and cease to fire during
saccadic activity, while saccade neurons are silent during fixation and fire high-frequency
action potentials for saccades on the contralateral visual field. For successful antisaccade
trials, where the target appears in the right visual field, saccade neurons in the left FEF
and SCi must be inhibited, while saccade neurons in the right FEF and SCi become
activated to drive the leftward saccade. Direction errors occur when there is insufficient
suppression of saccade neurons in the FEF and SCi prior to target appearance. Another
important region that contributes to the accumulation of activity toward threshold is the
supplementary eye fields (Schlag-Rey et al., 1997), which send motor commands to the
brainstem premotor circuit to enhance the motor command from FEF and SCi for the
successful production of an antisaccade. A second source of inhibitory signalling arises
in the dorsolateral prefrontal cortex (dlPFC), as it projects directly to the SCi and FEF.
Lesions to the dlPFC lead to a marked increase in the occurrence of direction errors
generated in the antisaccade paradigm (i.e., erroneous automatic prosaccades to the cue),
demonstrating a deficit in reflexive saccade inhibition (Pierrot-Deseilligny et al.,
129
1991;Guitton et al., 1985). As the frontal cortex is associated with successful
performance of executive function tasks (Funahashi, 2001), dysfunction to this region
likely occurs as a consequence to prenatal alcohol exposure and may underlie the deficits
in antisaccade performance observed for children with FASD.
5.4.2 Neuropsychological outcome measures
The SOC task measures spatial planning and behavioural inhibition, and during
the task children were encouraged to spend time planning an appropriate strategy for
solving each problem set. The negative correlation in mean initial thinking time for 4-
and 5-choice problems versus the percentage of direction errors in the FASD group
strongly suggests an impairment in the ability to properly plan solutions to a given
problem. Alternatively, the decreased time spent planning a strategy could be interpreted
as evidence for impulsivity. The negative correlation between initial thinking time for
SOC and direction errors in the antisaccade task strongly suggests that dysfunction in
regions of the frontal cortex, and possibly parietal cortex, underlie many of the
observations revealed for children with FASD.
In the SWM task, subjects were required to use mnemonic information to work
towards a goal, such as devising a search strategy to reduce the memory load for a given
trial, by following a predetermined search sequence. The strong positive correlation
between direction errors in the antisaccade task and errors in the SWM task for both the
FASD and control groups (Fig. 5.2A,B), also suggest the involvement of regions of
frontal cortex, consistent with the findings described earlier. Interestingly, by clustering
subjects by age bins, it appeared that the younger children were poorer performers in the
control group, while the older children were much better. For children with FASD
130
performance varied across the age bins and could not be attributed to development,
suggesting that protracted maturation of the frontal lobes could not fully explain the
correlation.
Deficits in working memory are common in individuals with FASD (Rasmussen,
2005), and working memory is a key component of human cognition. Recently, working
memory performance was assessed in typically developing children and adolescents
(Conklin et al., 2007). The findings revealed an improvement in performance on most
working memory tasks that was consistent with development and known brain maturation
events. In particular, improvements after age 12 were found in both spatial and verbal
domains, but no improvement on recognition memory was found in the study ages. The
improvements in the former two domains were supported by the fact that these functions
are governed by the frontal lobes, which undergo delayed maturation. On the contrary,
the latter function (recognition memory) is governed by posterior substrates, which
mature earlier negating further improvements. Taken together, these observations
suggest a hierarchical pattern of working memory development. This is consistent with
an earlier study that demonstrated that working memory development begins with the
refinement of basic perceptual and sensorimotor functions, and concludes with the
physiological maturation of widespread neural networks that can perform complex
working memory tasks (Luciana and Nelson, 1998). Thus, it is plausible for simple tasks
associated with working memory to remain intact in children with FASD, while other
functions associated with working memory that require higher cognitive demand, to
reveal profound deficiencies.
131
After assessing children with prenatal alcohol exposure on elements of encoding
(working memory), shifting, focused and sustained attention, it was the working memory
deficits that were primarily associated with FASD (Burden et al., 2005). In particular,
tests that required the active manipulation of information in memory-related task
execution were most difficult for these individuals. Consistently, Kodituwakku et al.
(1995) also found that based on task demands, children with FASD had greater difficulty
performing tests that maintained a high working memory component (Kodituwakku et al.,
1995). As working memory involves the ability to hold and manipulate visual-spatial
information and the maintenance and rehearsal of verbal information, it may represent a
core deficit in FASD. As such, working memory development has been associated with
posterior-to-anterior brain development, which suggests that impairments are associated
with alterations to this developmental pattern arising from the prenatal alcohol insult.
Findings from Conklin et al. (2007) further support this posterior-to-anterior
developmental pattern, as they found that working memory performance mediated
primarily by the dorsolateral prefrontal cortex was stabilized after performance on tasks
that were governed by ventral substrates. Thus, it is highly likely that prenatal alcohol
exposure has long-lasting effects on brain maturation that occur into postnatal life, well
after the initial insult has been made.
5.4.3 Conclusion
Deficits in eye movement control are correlated with cognitive dysfunction in
children with FASD, such that prenatal alcohol appears to affect brain development in a
long-lasting fashion. In particular, the frontal cortex appears to be particularly sensitive
to alcohol teratogenicity and deficient maturation, to both structure and function, is
132
consistent with the data from this study. Additionally, testing children across multiple
sites is now feasible, as the technology is mobile. Thus, eye movement behaviours may
be a powerful tool for providing insight into the cognitive deficits, and underlying
cortical and subcortical structures, that are most compromised in this population.
133
Chapter 6 GENERAL DISCUSSION
This study was conducted to explore the feasibility of developing a novel and
objective tool for assessing the brain injury resulting from prenatal alcohol exposure.
Thus, the aim was three-fold: 1) to demonstrate deficits in oculomotor control in children
with FASD, 2) to measure deficiencies in executive function using standardized computer
based testing, and 3) to adapt these research tools for mobile use in community settings
across multiple test sites. The general hypotheses and major findings from each paper are
summarized.
To address the first hypothesis that children with FASD will demonstrate specific
deficits in oculomotor control that can be measured using saccadic eye movement tasks,
we conducted a preliminary study. In a sample of 10 children with FASD, profound
deficits in oculomotor control were demonstrated, providing compelling evidence for
further investigation using a larger sample size. This pilot work set the foundation for the
multi-centered project that involved 9 communities across Canada.
In the multi-centered study, the increased subject recruitment pool enabled us to
address two important questions that could not be tested in the first study. Namely, the
effects of age and diagnosis on deficits in eye movement control and performance in
standardized neuropsychological tasks was also assessed. We demonstrated again that
deficits in saccadic eye movement tasks are associated with brain injury resulting from
prenatal exposure to alcohol. The data confirmed that children between the ages of 8-15
years exhibited profound deficits across many outcome measures for both pro- and
antisaccade tasks that suggests specific deficits in FEF, SEF and PEF function. We also
134
found no evidence for developmental delay across the age ranges tested, nor were there
substantial differences among the diagnostic subgroups (FAS, pFAS, ARND).
We assessed multiple domains of executive function using standardized
neuropsychological tasks to demonstrate whether children with FASD have specific and
global deficits. Using the CANTAB® tool, the data revealed profound deficits in
attention, planning, strategy and working memory, revealing that the neurocognitive
problems associated with FASD were widespread and generalized; and not specific to
one particular domain. Finally, we demonstrated a significant correlation between
oculomotor deficits and deficiencies in executive function. By correlating behavioural
data with neuropsychological outcomes, it was possible to speculate as to the brain
regions most sensitive to a prenatal alcohol insult. In particular, it was the frontal lobe
dysfunction that appeared to underlie many of the deficits we found in both measures of
executive function. With the use of functional MRI studies that assess oculomotor
control and performance in neuropsychological tasks, it will be possible to more
definitively determine the particular regions of the frontal cortex and/or brainstem that
are most sensitive to prenatal alcohol injury.
6.1 Clinical Relevance
The need for standardized, objective tools to assist in the diagnosis of individuals
with a history of prenatal alcohol exposure is necessary (Chudley et al., 2005). It is now
well appreciated that individuals who receive an early diagnosis demonstrate significantly
better outcomes and a reduction in the prevalence of secondary disabilities (Streissguth et
al., 2004;Streissguth et al., 1991;Streissguth et al., 1985). Currently, many of the
standardized techniques that are available for diagnosis are not appropriate for culturally
135
diverse populations. Additionally, they may not be suitable for infants and toddlers, who
are too young to undergo extensive neuropsychological assessment. Thus, the potential
for saccadic eye movement tasks and tests of executive function have significant
applicability for use as potential screening tools to assist in the early diagnosis of alcohol-
related disabilities.
Recently, a rural FASD diagnostic service model has been implemented in Cold
Lake, Alberta, Canada (McFarlane and Rajani, 2007). The Lakeland Centre provides
services to the region’s communities through mobile diagnostic teams and follow-up
support personnel. It was established in 1996 using the 4-Digit Code system, but adapted
to the Canadian diagnostic guidelines in 2005. It operates three multidisciplinary,
diagnostic teams (two for children, one for adults) that consist of a pediatrician,
neuropsychologist, speech-language pathologist, occupational therapist, public health
nurse, Aboriginal liaison, mental health therapist, social worker, addictions counsellor
and team coordinator. The child teams diagnose approximately 4 children per month;
while the adult team diagnose 1 adult per month. The diagnostic process consists of a
pre-clinic phase (Phase 0) and 5 clinical phases: assessments, discussion of results, client
debriefing, write up and team debriefing and post clinic. The model was adapted for rural
diagnosis, and includes in-kind donations, follow-up support and mobile teams. Such a
model may provide the framework for other diagnostic service systems both in and
outside of Canada. Tools such as the ones described in this research project could be
easily adapted for use in these mobile diagnostic clinics.
This study demonstrates that oculomotor tasks and standard neuropsychological
tests are objective, sensitive measures of global brain injury associated with prenatal
136
alcohol exposure. Future research must be conducted to assess whether these tools can be
used to assess brain function in younger children, and to improve upon the existing
protocols to probe more specific aspects of behaviour. Although, the sensitivity and
specificity of these tools remains to be determined, this study provides significant support
for their clinical applicability. Eye movement and standardized neuropsychological
testing tools hold significant promise for assisting in the screening and diagnosis of
individuals with a history of prenatal alcohol exposure.
6.2 Future Directions
1. Based on performance of oculomotor tasks, it appeared that children with FASD
have specific deficits in frontal lobe and brainstem function, in particular the FEF,
dlPFC and SC. To further support or refute this claim, brain function must be
assessed using the pro- and antisaccade tasks with function magnetic resonance
imaging. Imaging studies can confirm the extent of damage to these regions, as a
result of a prenatal alcohol insult. Furthermore, these studies can be further
stratified by age, sex and diagnostic subtype (i.e., FAS, pFAS or ARND) to
provide further insight into the specific types of damage, and how these covariates
influence brain function.
2. While evidence for developmental delay was not found in our study, future
investigations involving young adults (i.e., 18-24 years) would further support this
finding. In young adults, frontal lobe maturation is nearing completion (or
complete). By studying this age range, it would be possible to determine if
performance becomes comparable to controls, or whether performance deficits
persist. If these individuals continue to demonstrate profound deficits in
137
oculomotor control and neuropsychological function, the pathophysiology
underlying these deficits cannot be attributed to developmental delay (i.e.,
protracted maturation of frontal lobes), and instead suggest other mechanisms.
This insight may assist in the development of novel programs and intervention
strategies aimed at improving overall brain function for individuals with
neurological injury resulting from prenatal exposure to alcohol.
3. With early diagnosis and access to supports, the likelihood of developing
secondary disabilities for individuals with FASD decreases profoundly
(Streissguth et al., 2004;Streissguth et al., 1991;Streissguth et al., 1985). Thus,
oculomotor tasks that can be used to assess children, who are younger than 8
years of age, would be beneficial. Experiments that could use head mount-free
systems would be well suited for younger populations, in which calibration time is
reduced. As this study demonstrated profound deficits even in the prosaccade
task, it is plausible that future experiments could incorporate simple eye
movement protocols that could still be used to assess neurological function. For
example, experiments involving movie clips could be conducted in young
children, and these tracings could be analyzed off-line for differences in
performance.
4. Both animal and human studies have demonstrated hippocampal damage as a
result of prenatal alcohol exposure (Mattson et al., 2001) and hippocampal
function can be probed using oculomotor tasks (Pierrot-Deseilligny et al., 1995).
In particular, memory-guided saccade tasks would be a suitable protocol for
assessing working memory in individuals with FASD. In a version of this task,
138
subjects are seated in front of computer or projection screen and after a brief
delay; three target lights appear at random locations one after another. After
another brief delay, subjects must recall the location and pattern of the target
lights by moving their eyes in the same pattern. Preliminary data have been
collected for control children in the 8-12 year range, thus these children are
capable of performing the task.
5. Using the data sets collected in this study, it may be possible to generate
normative data sets for children with FASD based on the oculomotor and
neuropsychological outcome measures. To assess the specificity and sensitivity
of these tools, prospective testing could be conducted in the existing diagnostic
clinics. Once the data sets are obtained, they could be compared to the normative
data sets generated from this study. This would further assess the validity of these
tools for both screening and diagnostic purposes.
6. Finally, during the course of this study, 11 children with a diagnosis of attention-
deficit hyperactivity disorder (ADHD) were also tested with the future goal of
comparing data sets between ADHD, FASD and controls. With the recruitment
of additional 15-20 subjects with ADHD, it would be possible to conduct a 3-way
comparison study (by matching the ADHD children to a subset of FASD and
controls by age and sex). As ADHD and FASD are often misdiagnosed (Coles et
al., 1997;Nash et al., 2006), this study may provide insight into differences in
function among these clinical populations. These differences may be exploited
for differential diagnostic purposes that could be used to further increase the
specificity and sensitivity of existing diagnostic tools.
139
Reference List
Abel EL (1995) An update on incidence of FAS: FAS is not an equal opportunity birth defect. Neurotoxicol Teratol 17: 437-443.
Achenbach, Rescorla (2001) Manual for the ASEBA School-Age Forms and Profiles. Burlington, VT: University of Vermont, Research Center for Children Youth & Families.
Amador N, Schlag-Rey M, Schlag J (2004) Primate antisaccade. II. Supplementary eye field neuronal activity predicts correct performance. J Neurophysiol 91: 1672-1689.
Aman CJ, Roberts RJ, Jr., Pennington BF (1998) A neuropsychological examination of the underlying deficit in attention deficit hyperactivity disorder: frontal lobe versus right parietal lobe theories. Dev Psychol 34: 956-969.
Archibald SL, Fennema-Notestine C, Gamst A, Riley EP, Mattson SN, Jernigan TL (2001) Brain dysmorphology in individuals with severe prenatal alcohol exposure. Dev Med Child Neurol 43: 148-154.
Armstrong IT, Munoz DP (2003) Inhibitory control of eye movements during oculomotor countermanding in adults with attention-deficit hyperactivity disorder. Exp Brain Res 152: 444-452.
Astley SJ, Clarren SK (1996) A case definition and photographic screening tool for the facial phenotype of fetal alcohol syndrome. J Pediatr 129: 33-41.
Astley SJ, Clarren SK (2000) Diagnosing the full spectrum of fetal alcohol-exposed individuals: introducing the 4-digit diagnostic code. Alcohol Alcohol 35: 400-410.
Astley SJ, Stachowiak J, Clarren SK, Clausen C (2002) Application of the fetal alcohol syndrome facial photographic screening tool in a foster care population. J Pediatr 141: 712-717.
Autti-Ramo I, Gaily E, Granstrom ML (1992) Dysmorphic features in offspring of alcoholic mothers. Arch Dis Child 67: 712-716.
Bailey CD, Brien JF, Reynolds JN (1999) Altered GABA(A)-benzodiazepine receptor number and pharmacology in the adult guinea pig cerebral cortex after chronic prenatal ethanol exposure. Alcohol Clin Exp Res 23: 1816-1824.
Bailey CD, Brien JF, Reynolds JN (2001) Chronic prenatal ethanol exposure increases GABA(A) receptor subunit protein expression in the adult guinea pig cerebral cortex. J Neurosci 21: 4381-4389.
Burd L, Martsolf JT (1989) Fetal alcohol syndrome: diagnosis and syndromal variability. Physiol Behav 46: 39-43.
140
Burden MJ, Jacobson SW, Sokol RJ, Jacobson JL (2005) Effects of prenatal alcohol exposure on attention and working memory at 7.5 years of age. Alcohol Clin Exp Res 29: 443-452.
Cairney S, Maruff P, Vance A, Barnett R, Luk E, Currie J (2001) Contextual abnormalities of saccadic inhibition in children with attention deficit hyperactivity disorder. Exp Brain Res 141: 507-518.
Cameron IG, Coe B., Watanabe M, Stroman PW, Munoz DP (2007) fMRI of the caudate nucleus when required to instantly switch a planned pro or antisaccade. Society for Neuroscience 37th Annual Meeting.
Centers for Disease Control and Prevention (2004) Fetal Alcohol Syndrome: Guidelines for Referral and Diagnosis. Atlanta, GA: Centers for Disease Control and Prevention.
Chan F, Armstrong IT, Pari G, Riopelle RJ, Munoz DP (2005) Deficits in saccadic eye-movement control in Parkinson's disease. Neuropsychologia 43: 784-796.
Chudley AE, Conry J, Cook JL, Loock C, Rosales T, LeBlanc N (2005) Fetal alcohol spectrum disorder: Canadian guidelines for diagnosis. CMAJ 172: S1-S21.
Chudley AE, Kilgour AR, Cranston M, Edwards M (2007) Challenges of diagnosis in fetal alcohol syndrome and fetal alcohol spectrum disorder in the adult. Am J Med Genet C Semin Med Genet 145: 261-272.
Clarren SK, Smith DW (1978) The fetal alcohol syndrome. N Engl J Med 298: 1063-1067.
Coggins TE, Olswang LB, Carmichael-Olsen H, Timler G (2003) On becoming socially competent communicators:The challenge for children with fetal alcohol exposure. International Review of Research in Mental Retardation 27: 121-150.
Cohen J (1988) Statistical power analysis for the behavioral sciences (2nd ed.). Hillsdale, NJ: Erlbaum.
Cohen-Kerem R, Koren G (2003) Antioxidants and fetal protection against ethanol teratogenicity. I. Review of the experimental data and implications to humans. Neurotoxicol Teratol 25: 1-9.
Coles CD, Platzman KA, Raskind-Hood CL, Brown RT, Falek A, Smith IE (1997) A comparison of children affected by prenatal alcohol exposure and attention deficit, hyperactivity disorder. Alcohol Clin Exp Res 21: 150-161.
Condy C, Wattiez N, Rivaud-Pechoux S, Tremblay L, Gaymard B (2006) Antisaccade Deficit after Inactivation of the Principal Sulcus in Monkeys. Cereb Cortex.
141
Conklin HM, Luciana M, Hooper CJ, Yarger RS (2007) Working memory performance in typically developing children and adolescents: behavioral evidence of protracted frontal lobe development. Dev Neuropsychol 31: 103-128.
Connor PD, Sampson PD, Bookstein FL, Barr HM, Streissguth AP (2000) Direct and indirect effects of prenatal alcohol damage on executive function. Dev Neuropsychol 18: 331-354.
Connor PD, Streissguth AP (1996) Effects of prenatal exposure to alcohol across the life span. Alcohol Health Res World 20: 170-174.
Crawford TJ, Henderson L, Kennard C (1989) Abnormalities of nonvisually-guided eye movements in Parkinson's disease. Brain 112 ( Pt 6): 1573-1586.
Crawford TJ, Higham S, Renvoize T, Patel J, Dale M, Suriya A, Tetley S (2005) Inhibitory control of saccadic eye movements and cognitive impairment in Alzheimer's disease. Biol Psychiatry 57: 1052-1060.
Currie J, Joyce S, Maruff P, Ramsden B, McArthur-Jackson C, Malone V (1993) Selective impairment of express saccade generation in patients with schizophrenia. Exp Brain Res 97: 343-348.
Dafoe JM, Armstrong IT, Munoz DP (2007) The influence of stimulus direction and eccentricity on pro- and anti-saccades in humans. Exp Brain Res 179: 563-570.
Dias EC, Segraves MA (1999) Muscimol-induced inactivation of monkey frontal eye field: effects on visually and memory-guided saccades. J Neurophysiol 81: 2191-2214.
Dorris MC, Pare M, Munoz DP (1997) Neuronal activity in monkey superior colliculus related to the initiation of saccadic eye movements. J Neurosci 17: 8566-8579.
Douglas TS, Martinez F, Meintjes EM, Vaughan CL, Viljoen DL (2003) Eye feature extraction for diagnosing the facial phenotype associated with fetal alcohol syndrome. Med Biol Eng Comput 41: 101-106.
Douglas TS, Viljoen DL (2006) Eye measurements in 7-year-old black South African children. Ann Hum Biol 33: 241-254.
Egerhazi A, Berecz R, Bartok E, Degrell I (2007) Automated Neuropsychological Test Battery (CANTAB) in mild cognitive impairment and in Alzheimer's disease. Prog Neuropsychopharmacol Biol Psychiatry 31: 746-751.
Everling S, Munoz DP (2000) Neuronal correlates for preparatory set associated with pro-saccades and anti-saccades in the primate frontal eye field. J Neurosci 20: 387-400.
Fischer B, Biscaldi M, Gezeck S (1997) On the development of voluntary and reflexive components in human saccade generation. Brain Res 754: 285-297.
142
Fischer B, Ramsperger E (1984) Human express saccades: extremely short reaction times of goal directed eye movements. Exp Brain Res 57: 191-195.
Fischer B, Weber H, Biscaldi M, Aiple F, Otto P, Stuhr V (1993) Separate populations of visually guided saccades in humans: reaction times and amplitudes. Exp Brain Res 92: 528-541.
Fryer SL, Tapert SF, Mattson SN, Paulus MP, Spadoni AD, Riley EP (2007) Prenatal alcohol exposure affects frontal-striatal BOLD response during inhibitory control. Alcohol Clin Exp Res 31: 1415-1424.
Funahashi S (2001) Neuronal mechanisms of executive control by the prefrontal cortex. Neurosci Res 39: 147-165.
Gaymard B, Ploner CJ, Rivaud S, Vermersch AI, Pierrot-Deseilligny C (1998) Cortical control of saccades. Exp Brain Res 123: 159-163.
Gaymard B, Ploner CJ, Rivaud-Pechoux S, Pierrot-Deseilligny C (1999) The frontal eye field is involved in spatial short-term memory but not in reflexive saccade inhibition. Exp Brain Res 129: 288-301.
Goldberg MC, Mostofsky SH, Cutting LE, Mahone EM, Astor BC, Denckla MB, Landa RJ (2005) Subtle executive impairment in children with autism and children with ADHD. J Autism Dev Disord 35: 279-293.
Goodlett CR, Horn KH (2001) Mechanisms of alcohol-induced damage to the developing nervous system. Alcohol Res Health 25: 175-184.
Green CR, Mihic AM, Brien DC, Nikkel SM, Munoz DP, Reynolds JN (2007a) Eye movement behaviours in children with fetal alcohol spectrum disorders: Comparison with standardized neuropsychological tasks. Alcohol Clin Exp Res 31: 246A.
Green CR, Mihic AM, Brien DC, Nikkel SM, Stade BC, Rasmussen C, Munoz DP, Reynolds JN (2007b) Children with Fetal Alcohol Spectrum Disorders exhibit deficits in control of saccadic eye movements. Society for Neuroscience 37th Annual Meeting.
Green CR, Munoz DP, Nikkel SM, Reynolds JN (2007c) Deficits in eye movement control in children with fetal alcohol spectrum disorders. Alcohol Clin Exp Res 31: 500-511.
Green CR, Munoz DP, Reynolds JN (2004) Evaluation of Saccadic Eye Movement as a New Diagnostic Tool for Fetal Alcohol Syndrome (FAS). Perinatal Investigators 28th Annual Meeting.
Green CR, Munoz DP, Reynolds JN (2005) Saccadic Eye Movements: A Novel Diagnostic Approach to Fetal Alcohol Syndrome (FAS). Society for Neuroscience 35th Annual Meeting.
143
Green CR, Munoz DP, Reynolds JN (2006) Children with fetal alcohol spectrum disorders display a unique pattern of deficits in eye movement behaviours. International Society for Biomedical Research on Alcoholism.
Greenbaum R, Nulman I, Rovet J, Koren G (2002) The Toronto experience in diagnosing alcohol-related neurodevelopmental disorder: a unique profile of deficits and assets. Can J Clin Pharmacol 9: 215-225.
Guitton D, Buchtel HA, Douglas RM (1985) Frontal lobe lesions in man cause difficulties in suppressing reflexive glances and in generating goal-directed saccades. Exp Brain Res 58: 455-472.
Hallett PE (1978) Primary and secondary saccades to goals defined by instructions. Vision Res 18: 1279-1296.
Hanisch C, Radach R, Holtkamp K, Herpertz-Dahlmann B, Konrad K (2006) Oculomotor inhibition in children with and without attention-deficit hyperactivity disorder (ADHD). J Neural Transm 113: 671-684.
Hays, A. V., Richmond, R. J., and & Optician, L. M. A UNIX-based multiple process system for real-time data acquisition and control. 2, 1-10. 1982. WESCON. Ref Type: Conference Proceeding
Heide W, Kompf D (1998) Combined deficits of saccades and visuo-spatial orientation after cortical lesions. Exp Brain Res 123: 164-171.
Hikosaka O, Sakamoto M, Usui S (1989) Functional properties of monkey caudate neurons. III. Activities related to expectation of target and reward. J Neurophysiol 61: 814-832.
Hikosaka O, Takikawa Y, Kawagoe R (2000) Role of the basal ganglia in the control of purposive saccadic eye movements. Physiol Rev 80: 953-978.
Hoyme HE, May PA, Kalberg WO, Kodituwakku P, Gossage JP, Trujillo PM, Buckley DG, Miller JH, Aragon AS, Khaole N, Viljoen DL, Jones KL, Robinson LK (2005) A practical clinical approach to diagnosis of fetal alcohol spectrum disorders: clarification of the 1996 institute of medicine criteria. Pediatrics 115: 39-47.
Jacobson JL, Jacobson SW, Sokol RJ, Ager JW, Jr. (1998) Relation of maternal age and pattern of pregnancy drinking to functionally significant cognitive deficit in infancy. Alcohol Clin Exp Res 22: 345-351.
Jones KL, Smith DW (1973) Recognition of the fetal alcohol syndrome in early infancy. Lancet 2: 999-1001.
Jones KL, Smith DW (1975) The fetal alcohol syndrome. Teratology 12: 1-10.
144
Jones KL, Smith DW, Streissguth AP, Myrianthopoulos NC (1974) Outcome in offspring of chronic alcoholic women. Lancet 1: 1076-1078.
Jones KL, Smith DW, Ulleland CN, Streissguth P (1973) Pattern of malformation in offspring of chronic alcoholic mothers. Lancet 1: 1267-1271.
Jurado MB, Rosselli M (2007) The elusive nature of executive functions: a review of our current understanding. Neuropsychol Rev 17: 213-233.
Kimmig H, Haussmann K, Mergner T, Lucking CH (2002) What is pathological with gaze shift fragmentation in Parkinson's disease? J Neurol 249: 683-692.
Klein CH, Raschke A, Brandenbusch A (2003) Development of pro- and antisaccades in children with attention-deficit hyperactivity disorder (ADHD) and healthy controls. Psychophysiology 40: 17-28.
Kodituwakku PW (2007) Defining the behavioral phenotype in children with fetal alcohol spectrum disorders: a review. Neurosci Biobehav Rev 31: 192-201.
Kodituwakku PW, Handmaker NS, Cutler SK, Weathersby EK, Handmaker SD (1995) Specific impairments in self-regulation in children exposed to alcohol prenatally. Alcohol Clin Exp Res 19: 1558-1564.
Kodituwakku PW, May PA, Clericuzio CL, Weers D (2001) Emotion-related learning in individuals prenatally exposed to alcohol: an investigation of the relation between set shifting, extinction of responses, and behavior. Neuropsychologia 39: 699-708.
Koren G, Nulman I, Chudley AE, Loock C (2003) Fetal alcohol spectrum disorder. CMAJ 169: 1181-1185.
Korkman M, Kettunen S, Autti-Ramo I (2003) Neurocognitive impairment in early adolescence following prenatal alcohol exposure of varying duration. Child Neuropsychol 9: 117-128.
Le Heron CJ, MacAskill MR, Anderson TJ (2005) Memory-guided saccades in Parkinson's disease: long delays can improve performance. Exp Brain Res 161: 293-298.
Lee KT, Mattson SN, Riley EP (2004) Classifying children with heavy prenatal alcohol exposure using measures of attention. J Int Neuropsychol Soc 10: 271-277.
Leichnetz GR (1981) The prefrontal cortico-oculomotor trajectories in the monkey. J Neurol Sci 49: 387-396.
Leigh RJ, Kennard C (2004) Using saccades as a research tool in the clinical neurosciences. Brain 127: 460-477.
145
Leigh RJ, Zee DS (1999) The Neurology of Eye Movements. Philadelphia, PA: Davis.
Lemoine P, Harousseau H, Borteyru JP, Menuet JC (1968) Les enfants des parents alcoholiques: anomalies observees a propos de 127 cas. Ouest Medical 8: 476-482.
Lemoine P, Harousseau H, Borteyru JP, Menuet JC (2003) Children of alcoholic parents--observed anomalies: discussion of 127 cases. Ther Drug Monit 25: 132-136.
LeVasseur AL, Flanagan JR, Riopelle RJ, Munoz DP (2001) Control of volitional and reflexive saccades in Tourette's syndrome. Brain 124: 2045-2058.
Lezak MD (1995) Neuropsychological Assessment, 3rd Ed. New York: Oxford University Press, Inc.
Loomes C, Rasmussen C, Pei J, Manji S, Andrew G (2007) The effect of rehearsal training on working memory span of children with fetal alcohol spectrum disorder. Res Dev Disabil.
Luce RD (1986) Response Times: Their Role in Inferring Elementary Mental Organization. Oxford: Oxford Press.
Luciana M, Nelson CA (1998) The functional emergence of prefrontally-guided working memory systems in four- to eight-year-old children. Neuropsychologia 36: 273-293.
Luciana M, Nelson CA (2002) Assessment of neuropsychological function through use of the Cambridge Neuropsychological Testing Automated Battery: performance in 4- to 12-year-old children. Dev Neuropsychol 22: 595-624.
Lynch JC, McLaren JW (1989) Deficits of visual attention and saccadic eye movements after lesions of parietooccipital cortex in monkeys. J Neurophysiol 61: 74-90.
Manning MA, Eugene HH (2007) Fetal alcohol spectrum disorders: a practical clinical approach to diagnosis. Neurosci Biobehav Rev 31: 230-238.
Mattson SN, Goodman AM, Caine C, Delis DC, Riley EP (1999) Executive functioning in children with heavy prenatal alcohol exposure. Alcohol Clin Exp Res 23: 1808-1815.
Mattson SN, Riley EP, Sowell ER, Jernigan TL, Sobel DF, Jones KL (1996) A decrease in the size of the basal ganglia in children with fetal alcohol syndrome. Alcohol Clin Exp Res 20: 1088-1093.
Mattson SN, Schoenfeld AM, Riley EP (2001) Teratogenic effects of alcohol on brain and behavior. Alcohol Res Health 25: 185-191.
McFarlane A, Rajani H (2007) Rural FASD diagnostic services model: Lakeland Centre for fetal alcohol spectrum disorder. Can J Clin Pharmacol 14: e301-e306.
146
McGee CL, Riley EP (2006) Brain imaging and fetal alcohol spectrum disorders. Ann Ist Super Sanita 42: 46-52.
Meintjes EM, Douglas TS, Martinez F, Vaughan CL, Adams LP, Stekhoven A, Viljoen D (2002) A stereo-photogrammetric method to measure the facial dysmorphology of children in the diagnosis of fetal alcohol syndrome. Med Eng Phys 24: 683-689.
Mihic AM, Green CR, Brien DC, Nikkel SM, Stade BC, Rasmussen C, Munoz DP, Reynolds JN (2007) Executive function deficits in children with fetal alcohol spectrum disorders measured using the Cambridge Neuropsychological Tests Automated Battery. Society for Neuroscience 37th Annual Meeting.
Moore ES, Ward RE, Jamison PL, Morris CA, Bader PI, Hall BD (2002) New perspectives on the face in fetal alcohol syndrome: what anthropometry tells us. Am J Med Genet 109: 249-260.
Moore ES, Ward RE, Wetherill LF, Rogers JL, Autti-Ramo I, Fagerlund A, Jacobson SW, Robinson LK, Hoyme HE, Mattson SN, Foroud T (2007) Unique facial features distinguish fetal alcohol syndrome patients and controls in diverse ethnic populations. Alcohol Clin Exp Res 31: 1707-1713.
Mostofsky SH, Lasker AG, Cutting LE, Denckla MB, Zee DS (2001) Oculomotor abnormalities in attention deficit hyperactivity disorder: a preliminary study. Neurology 57: 423-430.
Munoz DP, Armstrong IT, Coe B. (2007) Using eye movements to probe development and dysfunction. In: Eye movements: A window on mind and brain. (Van Gompel RPG, Fischer MH, Murray WS, Hill RL, eds), pp 99-124. Oxford: Elsevier.
Munoz DP, Armstrong IT, Hampton KA, Moore KD (2003) Altered control of visual fixation and saccadic eye movements in attention-deficit hyperactivity disorder. J Neurophysiol 90: 503-514.
Munoz DP, Broughton JR, Goldring JE, Armstrong IT (1998) Age-related performance of human subjects on saccadic eye movement tasks. Exp Brain Res 121: 391-400.
Munoz DP, Dorris MC, Pare M, Everling S (2000) On your mark, get set: brainstem circuitry underlying saccadic initiation. Can J Physiol Pharmacol 78: 934-944.
Munoz DP, Everling S (2004) Look away: the anti-saccade task and the voluntary control of eye movement. Nat Rev Neurosci 5: 218-228.
Munoz DP, Schall JD (2004) Concurrent, Distributed Control of Saccad Initiation in the Frontal Eye Field and Superior Colliculus. In: The Superior Colliculus: New Approaches for Studying Sensorimotor Integration (Hall WC, Moschovakis A, eds), pp 55-82. Boca Raton: CRC Press LLC.
147
Muri RM, Rivaud S, Gaymard B, Ploner CJ, Vermersch AI, Hess CW, Pierrot-Deseilligny C (1999) Role of the prefrontal cortex in the control of express saccades. A transcranial magnetic stimulation study. Neuropsychologia 37: 199-206.
Nambu A, Tokuno H, Takada M (2002) Functional significance of the cortico-subthalamo-pallidal 'hyperdirect' pathway. Neurosci Res 43: 111-117.
Nash K, Rovet J, Greenbaum R, Fantus E, Nulman I, Koren G (2006) Identifying the behavioural phenotype in Fetal Alcohol Spectrum Disorder: sensitivity, specificity and screening potential. Arch Womens Ment Health 9: 181-186.
Nazir TA, Jacobs AM (1991) The effects of target discriminability and retinal eccentricity on saccade latencies: an analysis in terms of variable-criterion theory. Psychol Res 53: 281-289.
Niccols A (2007) Fetal alcohol syndrome and the developing socio-emotional brain. Brain Cogn 65: 135-142.
O'Driscoll GA, Depatie L, Holahan AL, Savion-Lemieux T, Barr RG, Jolicoeur C, Douglas VI (2005) Executive functions and methylphenidate response in subtypes of attention-deficit/hyperactivity disorder. Biol Psychiatry 57: 1452-1460.
Pare M, Munoz DP (1996) Saccadic reaction time in the monkey: advanced preparation of oculomotor programs is primarily responsible for express saccade occurrence. J Neurophysiol 76: 3666-3681.
Pierrot-Deseilligny C, Milea D, Muri RM (2004) Eye movement control by the cerebral cortex. Curr Opin Neurol 17: 17-25.
Pierrot-Deseilligny C, Rivaud S, Gaymard B, Agid Y (1991) Cortical control of reflexive visually-guided saccades. Brain 114: 1473-1485.
Pierrot-Deseilligny C, Rivaud S, Gaymard B, Muri R, Vermersch AI (1995) Cortical control of saccades. Ann Neurol 37: 557-567.
Pierrot-Deseilligny C, Rivaud S, Penet C, Rigolet MH (1987) Latencies of visually guided saccades in unilateral hemispheric cerebral lesions. Ann Neurol 21: 138-148.
Ramat S, Leigh RJ, Zee DS, Optican LM (2007) What clinical disorders tell us about the neural control of saccadic eye movements. Brain 130: 10-35.
Rasmussen C (2005) Executive functioning and working memory in fetal alcohol spectrum disorder. Alcohol Clin Exp Res 29: 1359-1367.
Ratcliff R (2006) A theory of memory retrieval. Psych Rev 85: 59-108.
Riley EP, McGee CL (2005) Fetal alcohol spectrum disorders: an overview with emphasis on changes in brain and behavior. Exp Biol Med (Maywood ) 230: 357-365.
148
Riley EP, McGee CL, Sowell ER (2004) Teratogenic effects of alcohol: a decade of brain imaging. Am J Med Genet C Semin Med Genet 127: 35-41.
Rivaud S, Muri RM, Gaymard B, Vermersch AI, Pierrot-Deseilligny C (1994) Eye movement disorders after frontal eye field lesions in humans. Exp Brain Res 102: 110-120.
Roebuck-Spencer TM, Mattson SN (2004) Implicit strategy affects learning in children with heavy prenatal alcohol exposure. Alcohol Clin Exp Res 28: 1424-1431.
Rosett HL (1980) A clinical perspective of the Fetal Alcohol Syndrome. Alcohol Clin Exp Res 4: 119-122.
Royall DR, Lauterbach EC, Cummings JL, Reeve A, Rummans TA, Kaufer DI, LaFrance WC, Jr., Coffey CE (2002) Executive control function: a review of its promise and challenges for clinical research. A report from the Committee on Research of the American Neuropsychiatric Association. J Neuropsychiatry Clin Neurosci 14: 377-405.
Salman MS, Sharpe JA, Eizenman M, Lillakas L, Westall C, To T, Dennis M, Steinbach MJ (2006) Saccades in children. Vision Res 46: 1432-1439.
Sampson PD, Streissguth AP, Bookstein FL, Barr HM (2000) On categorizations in analyses of alcohol teratogenesis. Environ Health Perspect 108 Suppl 3: 421-428.
Schall JD (2004) On the role of frontal eye field in guiding attention and saccades. Vision Res 44: 1453-1467.
Schall JD, Thompson KG (1999) Neural selection and control of visually guided eye movements. Annu Rev Neurosci 22: 241-259.
Schiller PH, Sandell JH, Maunsell JH (1987) The effect of frontal eye field and superior colliculus lesions on saccadic latencies in the rhesus monkey. J Neurophysiol 57: 1033-1049.
Schlag-Rey M, Amador N, Sanchez H, Schlag J (1997) Antisaccade performance predicted by neuronal activity in the supplementary eye field. Nature 390: 398-401.
Schonfeld AM, Mattson SN, Lang AR, Delis DC, Riley EP (2001) Verbal and nonverbal fluency in children with heavy prenatal alcohol exposure. J Stud Alcohol 62: 239-246.
Scudder CA, Kaneko CS, Fuchs AF (2002) The brainstem burst generator for saccadic eye movements: a modern synthesis. Exp Brain Res 142: 439-462.
Shallice T (1982) Specific impairments of planning. Philos Trans R Soc Lond B Biol Sci 298: 199-209.
149
Shaw P, Greenstein D, Lerch J, Clasen L, Lenroot R, Gogtay N, Evans A, Rapoport J, Giedd J (2006) Intellectual ability and cortical development in children and adolescents. Nature 440: 676-679.
Sokol RJ, Clarren SK (1989) Guidelines for use of terminology describing the impact of prenatal alcohol on the offspring. Alcohol Clin Exp Res 13: 597-598.
Sommer MA, Tehovnik EJ (1997) Reversible inactivation of macaque frontal eye field. Exp Brain Res 116: 229-249.
Sowell ER, Mattson SN, Kan E, Thompson PM, Riley EP, Toga AW (2008) Abnormal cortical thickness and brain-behavior correlation patterns in individuals with heavy prenatal alcohol exposure. Cereb Cortex 18: 136-144.
Sowell ER, Thompson PM, Leonard CM, Welcome SE, Kan E, Toga AW (2004) Longitudinal mapping of cortical thickness and brain growth in normal children. J Neurosci 24: 8223-8231.
Sowell ER, Thompson PM, Mattson SN, Tessner KD, Jernigan TL, Riley EP, Toga AW (2001) Voxel-based morphometric analyses of the brain in children and adolescents prenatally exposed to alcohol. Neuroreport 12: 515-523.
Sowell ER, Thompson PM, Mattson SN, Tessner KD, Jernigan TL, Riley EP, Toga AW (2002) Regional brain shape abnormalities persist into adolescence after heavy prenatal alcohol exposure. Cereb Cortex 12: 856-865.
Sparks DL (2002) The brainstem control of saccadic eye movements. Nat Rev Neurosci 3: 952-964.
Stoler JM, Holmes LB (2004) Recognition of facial features of fetal alcohol syndrome in the newborn. Am J Med Genet C Semin Med Genet 127: 21-27.
Stratton K, Howe C, Battaglia FC (1996) Fetal alcohol syndrome: diagnosis, epidemiology, prevention, and treatment. Washington, DC: Institute of Medicine and National Academy Press.
Streissguth AP, Aase JM, Clarren SK, Randels SP, LaDue RA, Smith DF (1991) Fetal alcohol syndrome in adolescents and adults. JAMA 265: 1961-1967.
Streissguth AP, Bookstein FL, Barr HM, Sampson PD, O'Malley K, Young JK (2004) Risk factors for adverse life outcomes in fetal alcohol syndrome and fetal alcohol effects. J Dev Behav Pediatr 25: 228-238.
Streissguth AP, Clarren SK, Jones KL (1985) Natural history of the fetal alcohol syndrome: a 10-year follow-up of eleven patients. Lancet 2: 85-91.
150
Stromland K (2004) Visual impairment and ocular abnormalities in children with fetal alcohol syndrome. Addict Biol 9: 153-157.
Stromland K, Pinazo-Duran MD (2002) Ophthalmic involvement in the fetal alcohol syndrome: clinical and animal model studies. Alcohol Alcohol 37: 2-8.
Sweeney JA, Luna B, Keedy SK, McDowell JE, Clementz BA (2007) fMRI studies of eye movement control: investigating the interaction of cognitive and sensorimotor brain systems. Neuroimage 36 Suppl 2: T54-T60.
Thompson KG, Bichot NP, Schall JD (1997) Dissociation of visual discrimination from saccade programming in macaque frontal eye field. J Neurophysiol 77: 1046-1050.
Thorne JC, Coggins TE, Carmichael OH, Astley SJ (2007) Exploring the utility of narrative analysis in diagnostic decision making: picture-bound reference, elaboration, and fetal alcohol spectrum disorders. J Speech Lang Hear Res 50: 459-474.
Trappenberg TP, Dorris MC, Munoz DP, Klein RM (2001) A model of saccade initiation based on the competitive integration of exogenous and endogenous signals in the superior colliculus. J Cogn Neurosci 13: 256-271.
Vitez M, Koranyi G, Gonczy E, Rudas T, Czeizel A (1984) A semiquantitative score system for epidemiologic studies of fetal alcohol syndrome. Am J Epidemiol 119: 301-308.
Wass TS, Persutte WH, Hobbins JC (2001) The impact of prenatal alcohol exposure on frontal cortex development in utero. Am J Obstet Gynecol 185: 737-742.
Willford JA, Luna B, Day NL (2005) Prenatal alcohol exposure impairs inhibitory and cognitive control in young adulthood. Alcohol Clin Exp Res 29: 128A.
Zanelli J, Simon H, Rabe-Hesketh S, Walshe M, McDonald C, Murray RM, Maccabe JH (2005) Eye tracking in schizophrenia: does the antisaccade task measure anything that the smooth pursuit task does not? Psychiatry Res 136: 181-188.
151
Appendix A: Institute of Medicine: Diagnostic Criteria for Fetal Alcohol Syndrome (FAS) and Alcohol-Related Effects (Stratton et al., 1996).
Fetal Alcohol Syndrome
1. FAS with confirmed maternal alcohol exposure A. Confirmed maternal alcohol exposure B. Evidence of a characteristic pattern of facial anomalies that includes features such
as short palpebral fissures and abnormalities in the premaxillary zone (e.g., flat upper lip, flattened philtrum, and flat midface)
C. Evidence of growth retardation, as in at least one of the following: - low birth weight for gestational age - decelerating weight over time not due to nutrition - disproportional low weight to height
D. Evidence of CNS neurodevelopmental abnormalities, as in at least one of the following:
- decreased cranial size at birth - structural brain abnormalities (e.g., microcephaly, partial or complete
agenesis of the corpus callosum, cerebellar hypoplasia) - neurological hard or soft signs (as age appropriate), such as impaired fine
motor skills, neurosensory hearing loss, poor tandem gait, poor eye-hand coordination
2. FAS without confirmed maternal alcohol exposure
B, C, and D as above
3. Partial FAS with confirmed maternal alcohol exposure A. Confirmed maternal alcohol exposure B. Evidence of some components of the pattern of characteristic facial anomalies
Either C or D or E
C. Evidence of growth retardation, as in at least one of the following: - low birth weight for gestational age - decelerating weight over time not due to nutrition - disproportional low weight to height
D. Evidence of CNS neurodevelopmental abnormalities, as in: - decreased cranial size at birth - structural brain abnormalities (e.g., microcephaly, partial or complete
agenesis of the corpus callosum, cerebellar hypoplasia) - neurological hard or soft signs (as age appropriate) such as impaired fine
motor skills, neurosensory hearing loss, poor tandem gait, poor eye-hand coordination
E. Evidence of a complex pattern of behavior or cognitive abnormalities that are inconsistent with developmental level and cannot be explained by familial background or environment alone, such as learning difficulties; deficits in school
152
performance; poor impulse control; problems in social perception; deficits in higher level receptive and expressive language; poor capacity for abstraction or metacognition; specific deficits in mathematical skills; or problems in memory, attention, or judgment
Alcohol-Related Effects
Clinical conditions in which there is a history of maternal alcohol exposure and where clinical or animal research has linked maternal alcohol ingestion to an observed outcome. There are two categories, which may co-occur. If both diagnoses are present, then both diagnoses should be rendered. 4. Alcohol-related birth defects (ARBD) List of congenital anomalies, including malformations and dysplasias
• Cardiac - Atrial septal defects - Aberrant great vessels - Ventricular septal defects - Tetralogy of Fallot
• Ocular - Strabismus - Refractive problems secondary to small globes - Retinal vascular anomalies
• Auditory - Conductive hearing loss - Neurosensory hearing loss
• Other
153
Virtually every malformation has been described in some patient with FAS. The etiologic specificity of most of these anomalies to alcohol teratogenesis remains uncertain.
5. Alcohol-related neurodevelopmental disorder (ARND) Presence of: A. Evidence of CNS neurodevelopmental abnormalities, as in any one of the
following: - decreased cranial size at birth - structural brain abnormalities (e.g., microcephaly, partial or complete
agenesis of the corpus callosum, cerebellar hypoplasia) - neurological hard or soft signs (as age appropriate), such as impaired fine
motor skills, neurosensory hearing loss, poor tandem gait, poor eye-hand coordination
and/or B. Evidence of a complex pattern of behavior or cognitive abnormalities that are
inconsistent with developmental level and cannot be explained by familial background or environment alone, such as learning difficulties; deficits in school performance; poor impulse control; problems in social perception; deficits in higher level receptive and expressive language; poor capacity for abstraction or metacognition; specific deficits in mathematical skills; or problems in memory, attention, or judgment
154
Appendix B: 4-digit diagnostic code (Astley and Clarren, 2000). Growth
Deficiency FAS facial phenotype
Brain Damage Prenatal Alcohol
4 Significant Severe Definite High risk 3 Moderate Moderate Probable Some risk 2 Mild Mild Possible Unknown 1 None Absent Unlikely No risk
Diagnostic category name and 4-Digit Diagnostic Codes within each category
A Fetal alcohol syndrome (alcohol exposed)
3433 4433 3434 4434 3443 4443 3444 4444
B Fetal alcohol syndrome (alcohol exposure unknown)
3432 4432 3442 4442
C Atypical fetal alcohol syndrome (alcohol exposed)
V No cognitive/behavioural or sentinel physical findings detected (no alcohol exposure)
1111 2111 1211 2211
157
Appendix C: Centers for Disease Control and Prevention. Brief Outline of Diagnostic criteria for Fetal Alcohol Syndrome (Centers for Disease Control and Prevention, 2004).
Facial dysmorphia Based on racial norms, individual exhibits all three characteristic facial features:
• Smooth philtrum (University of Washington Lip-Philtrum Guide rank 4 or 5) • Thin vermillion border (University of Washington Lip-Philtrum Guide rank 4 or
5) • Small palpebral fissures (at or below 10th percentile )
Growth problems Confirmed prenatal or postnatal height or weight, or both, at or below the 10th percentile, documented at any one point in time (adjusted for age, sex, gestational age, and race or ethnicity).
Central Nervous System Abnormalities I. Structural
1. Head circumference (OFC) at or below the 10th percentile adjusted for age and sex.
2. Clinically significant brain abnormalities observable through imaging. II. Neurological Neurological problems not due to a postnatal insult or fever, or other soft neurological signs outside normal limits.
III. Functional
Performance substantially below that expected for an individual's age, schooling, or circumstances, as evidenced by:
1. Global cognitive or intellectual deficits representing multiple domains of
deficit (or significant developmental delay in younger children) with performance below the 3rd percentile (2 standard deviations below the mean for standardized testing) or
2. Functional deficits below the 16th percentile (1 standard deviation below the mean for standardized testing) in at least three of the following domains:
a) cognitive or developmental deficits or discrepancies b) executive functioning deficits c) motor functioning delays d) problems with attention or hyperactivity e) social skills f ) other, such as sensory problems, pragmatic language problems, memory deficits, etc.
158
Maternal Alcohol Exposure
I. Confirmed prenatal alcohol exposure II. Unknown prenatal alcohol exposure
Criteria for FAS Diagnosis Requires all three of the following findings:
1. Documentation of all three facial abnormalities (smooth philtrum, thin vermillion border, and small palpebral fissures);
2. Documentation of growth deficits 3. Documentation of CNS abnormality
159
Appendix D: Canadian Diagnostic Guidelines for FASD. Harmonization of Institute of Medicine (IOM) nomenclature and 4-digit diagnostic code ranks for growth, face, brain and alcohol history (Chudley et al., 2005)
4-digit diagnostic code ranks
IOM Nomenclature Growth deficiency
FAS facial phenotype
CNS damage or dysfunction
Gesetational exposure to alcohol
FAS (with confirmed exposure)
2, 3 or 4 3 or 4 3 or 4 3 or 4
FAS (without confirmed exposure)
2, 3 or 4 3 or 4 3 or 4 2
Partial FAS (with confirmed exposure)
1, 2, 3 or 4 2, 3 or 4 3 or 4 3 or 4
ARND (with confirmed exposure)
1, 2, 3 or 4 1 or 2 3 or 4 3 or 4 (2 for < 6 years)
160
Appendix E: Clarification of the 1996 IOM Criteria for Diagnosis of FASD (Hoyme et al., 2005).
I. FAS with Confirmed Maternal Alcohol Exposure (requires all features A-D)
A. Confirmed maternal alcohol exposure B. Evidence of a characteristic pattern of minor facial anomalies, including ≥
2 of the following: • Short palpebral fissures (≤10th percentile) • Thin vermilion border of the upper lip (score 4 or 5 with the
lip/philtrum guide) • Smooth philtrums (score 4 or 5 with the lip/philtrum guide)
C. Evidence of prenatal and/or postnatal growth retardation • Height of weight ≤10th percentile, corrected for racial norms, if
possible. D. Evidence of deficient brain growth or abnormal morphogenesis, including
≥1 of the following: • Structural brain abnormalities • Head circumference 10th percentile
II. FAS Without Confirmed Maternal Alcohol Exposure IB, IC, and ID, as above III. Partial FAS With Confirmed Maternal Alcohol Exposure (requires all
features, A–C) A. Confirmed maternal alcohol exposure B. Evidence of a characteristic pattern of minor facial anomalies, including
2 of the following: • Short palpebral fissures ( 10th percentile) • Thin vermilion border of the upper lip (score 4 or 5 with the
lip/philtrum guide) • Smooth philtrum (score 4 or 5 with the lip/philtrum guide)
C. One of the following other characteristics • Evidence of prenatal and/or postnatal growth retardation
- Height or weight 10th percentile corrected for racial norms, if possible
• Evidence of deficient brain growth or abnormal morphogenesis, including 1 of the following
- Structural brain abnormalities - Head circumference 10th percentile
• Evidence of a complex pattern of behavioral or cognitive abnormalities inconsistent with developmental level that cannot be explained by genetic predisposition, family background, or environment alone
- This pattern includes marked impairment in the performance of complex tasks (complex problem solving, planning, judgment,
161
abstraction, metacognition, and arithmetic tasks); higher-level receptive and expressive language deficits; and disordered behavior (difficulties in personal manner, emotional lability, motor dysfunction, poor academic performance, and deficient social interaction)
IV. Partial FAS Without Confirmed Maternal Alcohol Exposure IIIB and IIIC, as above V. ARBD (requires all features, A–C)
A. Confirmed maternal alcohol exposure B. Evidence of a characteristic pattern of minor facial anomalies, including
2 of the following • Short palpebral fissures ( 10th percentile) • Thin vermilion border of the upper lip (score 4 or 5 with the
lip/philtrum guide) • Smooth philtrum (score 4 or 5 with the lip/philtrum guide)
C. Congenital structural defects in 1 of the following categories, including malformations and dysplasias (if the patient displays minor anomalies only, 2 must be present):
A. Confirmed maternal alcohol exposure B. At least 1 of the following
• Evidence of deficient brain growth or abnormal morphogenesis, including 1 of the following
- Structural brain abnormalities - Head circumference 10th percentile
• Evidence of a complex pattern of behavioral or cognitive abnormalities inconsistent with developmental level that cannot be explained by genetic predisposition, family background, or environment alone.
- This pattern includes marked impairment in the performance of complex tasks (complex problem solving, planning, judgment, abstraction, metacognition, and arithmetic tasks); higher-level
162
receptive and expressive language deficits; and disordered behavior (difficulties in personal manner, emotional lability, motor dysfunction, poor academic performance, and deficient social interaction)
163
Appendix F: Demographics, Connors Rating Scale and Questionnaire.
F.1 Demographics
Subject enrolment and demographic data was obtained from each primary
caregiver and summarized in Table F.1.
F.2 Connors Rating Scale
The Connors’ Rating Scale is a commercially available tool (Multi-Health
Systems Inc., Toronto, ON, Canada) that uses observer ratings to evaluate problem
behaviours in children and adolescents. It was developed by Dr. Keith Connors and has
been used in routine screening for attention-deficit hyperactivity disorder. Primary
caregivers completed the one-page questionnaire, which provided standardized age- and
sex-adjusted T-scores across 6 behavioural domains (Conduct Disorder, Learning
Problems, Psychosomatic, Impulsive-Hyperactive, Anxiety and Hyperactivity Index).
The CRS–R scales were standardized using a large normative database compiled from
over 200 data collection sites throughout North America. Separate norms for boys and
girls are provided in 3-year intervals for ages 3 through 17.
Children with FASD demonstrated significantly greater T-scores compared with
control subjects in each of the behavioural domains (Fig. F.1A). Figure F.1B depicts T-
score breakdowns according to the diagnostic subgroups (i.e., ARND, pFAS, FAS) for
children with FASD. There were no differences in scores on the Connors’ Rating Scale
between the diagnostic subgroups.
F.3 Questionnaire
An extensive questionnaire was created in-house and completed by primary
caregivers to provide a comprehensive overview of the education, medical and family
164
Table F.1. Demographic data for subjects. Category Control (n=92) FASD (n=89) Age (years) 11.2 ± 0.2 10.7 ± 0.2 Male: Female 40:52 44:45 Parent/Caregiver Level of Education (years) 16.5 ± 0.3 14.4 ± 0.3* Medication
Depression 1 (1%) 10 (11%) Ratio of Adults to Children (Home) 0.88 ± 0.04 0.76 ± 0.06* Living with Biological Parents 87 (97%) 15 (17%) Parent/Caregiver Employed 79 (88%) 65 (74%) aAntihistamine, Anti-asthma, Oral contraceptives, Melanin *p < 0.05
165
Connors Rating Scale
Conduct Pro
blems
Learn
ing Problem
s
Psych
osomati
c
Impulsi
ve-H
ypera
ctive
Anxiety
Hypera
ctivit
y Index
0102030405060708090 Control
FASD*
*
** *
*A
T-Sc
ores
Connors Rating ScaleFASD Subgroups
Conduct Pro
blems
Learn
ing Problem
s
Psych
osomati
c
Impulsi
ve-H
ypera
ctive
Anxiety
Hypera
ctivit
y Index
0102030405060708090 ARND
pFASFAS
B
T-Sc
ores
Fig. F.1 a) T-scores for Connors Rating Scale for control children (gray bars) and children with FASD (open bars); and b) T-scores for FASD subgroups, alcohol –related neurodevelopmental disorder (ARND): blue gray bars; partial fetal alcohol syndrome (pFAS): green bars; fetal alcohol syndrome (FAS): red bars, across six behavioural parameters. Values are presented as mean ± S.E.M.
166
history for each subject. This information was used to determine the type and frequency
of co-morbidities (Table 4.1) and medication (Table 4.2) among the children with FASD
and control subjects. Interestingly, sleeping disorders was the most commonly reported
co-morbidity among children with FASD occurring in 61.7% of the children, while
attention-deficit hyperactivity disorder was the second most common in 59.6% of the
children with FASD. Stimulants (42.7%) and antipsychotics (32.6%) were the two most
commonly reported medications for children with FASD.