1 SAE Commercial Vehicle Engineering Conference November 1-3, 2005 Development of Accelerated Development of Accelerated Durability Tests for Commercial Durability Tests for Commercial Vehicle Suspension Components Vehicle Suspension Components R. Ledesma, L. Jenaway, Y. Wang, S. Shih R. Ledesma, L. Jenaway, Y. Wang, S. Shih Advanced Engineering Advanced Engineering Commercial Vehicle Systems Commercial Vehicle Systems
• Development of spindle load spectra for a targeted customer usage, based on a limited set of field data
• Development of a proving ground testing schedule, based on a given set of proving ground events, that results in a well-defined correlation of spindle load spectra, between the targeted customer duty cycle and the proving grounds
• Development of a multi-axis, accelerated durability test in the laboratory that simulates the proving ground tests in a compressed time frame, while at the same time duplicating the failure modes observed at the proving grounds
• For accelerated durability testing purposes, the product’s duty profile is a function of three variables• roughness of the specific roads where the vehicle is anticipated
to operate
• the number of miles covered in the product’s warranty
• loading condition of the vehicle (percent of time the vehicle is fully laden)
Mule Vehicle Data AcquisitionMule Vehicle Data Acquisition
• Drive a mule vehicle on public roads and measure spindle loads that are representative for each type of road surface
• Mule vehicle is operated under normal driving conditions, usually following the allowable speed limits
• Also measure spindle loads corresponding to special discrete events such as curb strikes, railroad crossings, panic straight-line braking, braking while turning, and parking lot steering
• For each measured public road event or discrete event, perform rainflow counting on each of the spindle force components (longitudinal, lateral, and vertical directions)
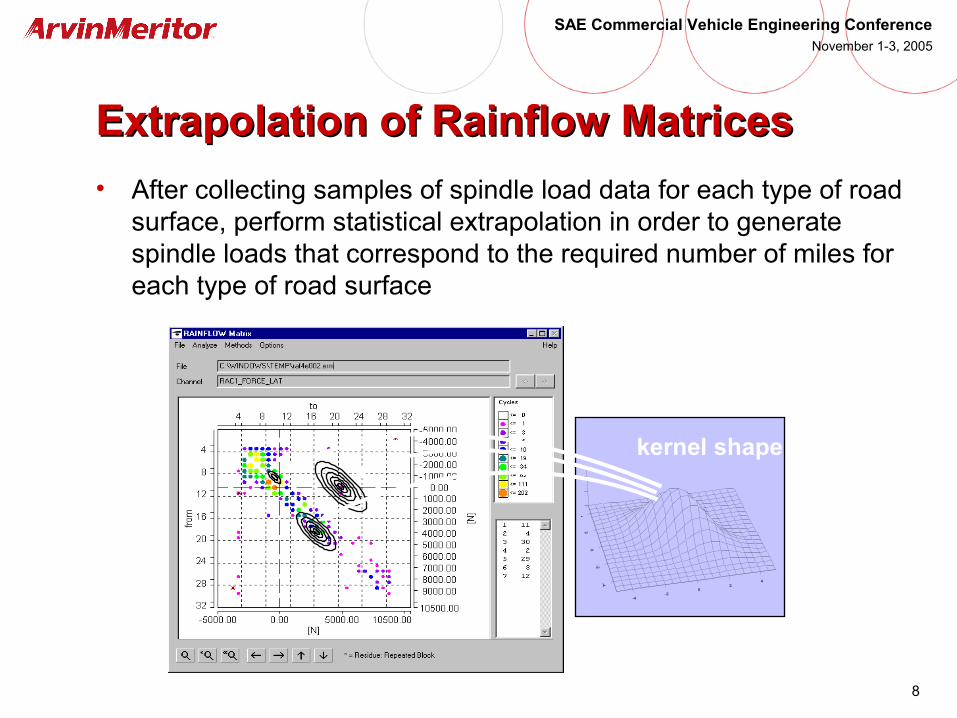
Extrapolation of Rainflow MatricesExtrapolation of Rainflow Matrices
• After collecting samples of spindle load data for each type of road surface, perform statistical extrapolation in order to generate spindle loads that correspond to the required number of miles for each type of road surface
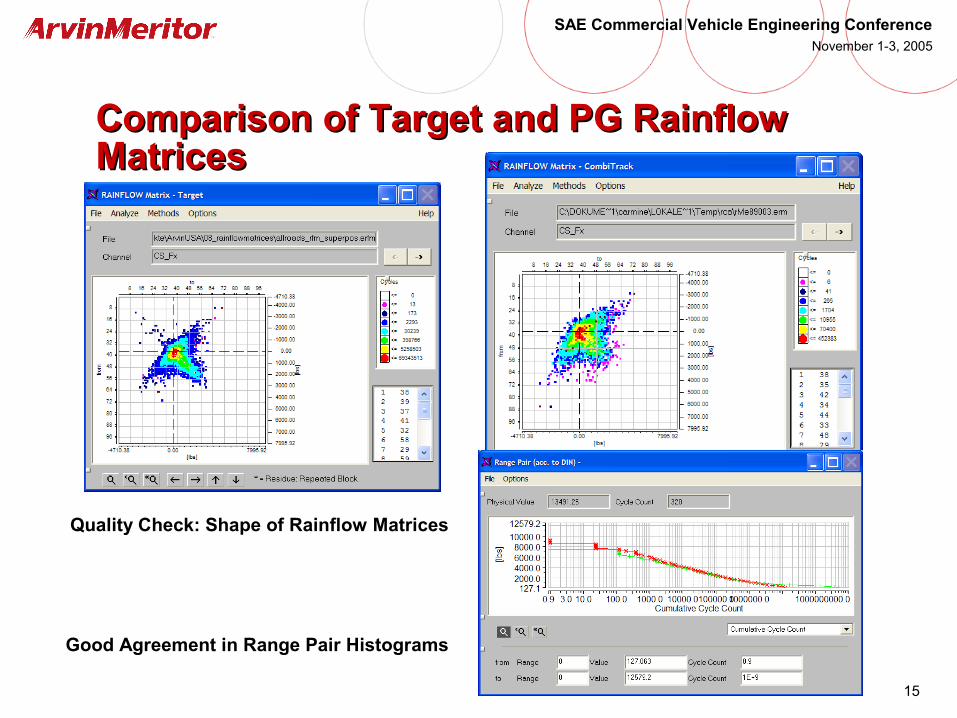
Superposition of Rainflow MatricesSuperposition of Rainflow Matrices
• After rainflow extrapolation is completed, perform rainflow superposition on each spindle load channel to generate the target rainflow matrix that corresponds to the expected mix of road surfaces
• In addition, rainflow matrices corresponding to special events such as curb strikes and railroad crossing events may be added
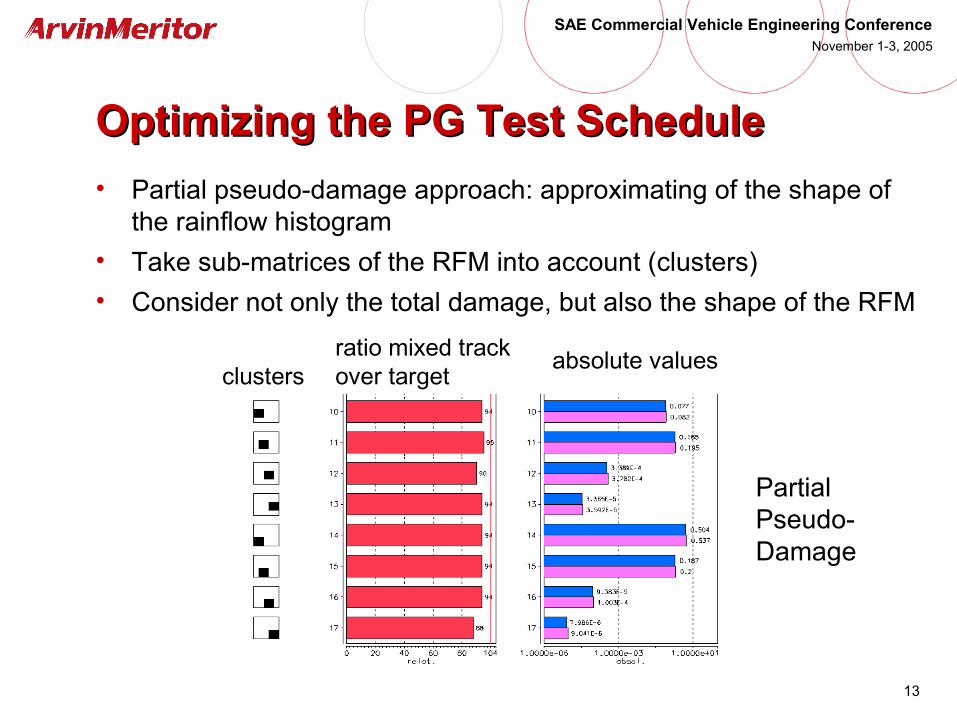
Proving Ground Test Schedule DeterminationProving Ground Test Schedule Determination
• The goal is to prescribe combinations of proving ground segments and vehicle speeds such that the combination of these proving ground events result in a good match between the target rainflow matrices and the rainflow matrices associated with the proving ground test, for all of the spindle load channels
• An exercise in multi-objective optimization: how many repeats of each of the candidate pairs of vehicle speed and proving ground road segment will result in the best match between the target rainflow matrices and proving ground rainflow matrices?
Accelerated Durability Rig Test ScheduleAccelerated Durability Rig Test Schedule
• The goal is to design a multi-axis, accelerated durability test in the laboratory such that the test simulates the proving ground tests in a compressed time frame, while at the same time duplicating the failure modes observed at the proving grounds
• Strategy: use time-domain fatigue editing techniques in order to preserve the proper phasing between multiple loads that act on the suspension system
• Construct a pseudo-damage time history associated with each of the spindle load channels. The pseudo-damage time histories are then lined up to identify time intervals at which there is little pseudo-damage across all spindle load channels
Example: Multi-Axis Rig Test ScheduleExample: Multi-Axis Rig Test Schedule
• Reduce testing time by 60% relative to the proving ground test, provided that the servo-hydraulic actuators have adequate capacity
• Retain 90% of the pseudo-damage associated with the original time history
Method:Time-Domain Fatigue Editing:The damage quotient of the 1. channel after filtering is 96.76The damage quotient of the 3. channel after filtering is 98.94The damage quotient of the 5. channel after filtering is 99.85The damage quotient of the 2. channel after filtering is 99.47The damage quotient of the 4. channel after filtering is 99.54The damage quotient of the 6. channel after filtering is 99.4429. direction has minimum damage quotient of 89.65
Simplified Single-Axis Component TestSimplified Single-Axis Component Test
• Possible only when the state of stress at the critical locations can be considered as uni-axial state of stress, and the geometry of the component results in stresses at the critical locations that heavily depend only on one input force component
• Single-axis rig test will address only one failure mode
• A series of single-axis rig tests can be performed on the same test specimen in order to arrive at a comprehensive design verification test that deals with multiple failure modes
Example: Specification for a Single-Axis, Example: Specification for a Single-Axis, Constant-Amplitude, Component Durability Constant-Amplitude, Component Durability TestTest
• Equivalent vertical spindle load• Mean value = 1.0G
• Customer usage profile was established, based on a limited set of field data
• An optimized proving ground test schedule was derived using commercial software
• Test schedules for the multi-axis, accelerated durability rig test were determined, allowing us to simulate the proving ground tests in a compressed time frame, while at the same time duplicating the failure modes observed at the proving grounds
• In some cases, simplified single-axis, single-component tests can be developed


![Print - Sun Earth · 2343 2343 2343 2343 2343 2343 2343 2343 3565 3565 3565 3565 3565 3565 3565 3565 [mm] 40-300 15-300 40-300 [mm] 2675 3445 4420 7070 2675 3445 4420 7070 2675 3445](https://static.documents.pub/doc/80x56/5e7c55371ac19940f3606150/print-sun-earth-2343-2343-2343-2343-2343-2343-2343-2343-3565-3565-3565-3565-3565.jpg)