29
SAE AERO DESIGN WEST – 2015 Van Nuys, California Design Report By TEAM - 310 MICRO CLASS B.M.S COLLEGE OF ENGINEERING BANGALORE , india
| Date post: | 12-Apr-2017 |
| Category: |
Documents |
| Upload: | abhiram-doddi |
| View: | 152 times |
| Download: | 8 times |

SAE AERO DESIGN WEST – 2015
Van Nuys, California
Design Report By
TEAM - 310
MICRO CLASS
B.M.S COLLEGE OF ENGINEERING
BANGALORE , india

B.M.S College of Engineering, Team-310
P a g e 2 | 29

B.M.S College of Engineering, Team-310
P a g e 3 | 29
Table of contents
List of figures and tables………………………………………………………………………….4
1.0 Executive summary
1.1 System overview……………………………………………………………………………..5
1.2 Competition projections……………………………………………………………………..5
1.3 Innovations…………………………………………………………………………………....5
2.0 Schedule summary………………………………………………………………………....6
3.0 References……………………………………………………………………………………6
4.0 Loads and Assumptions
4.1 Standard Environmental assumptions…………………………………………………….7
4.2 Landing Shock……………………………………………………………………………….7
5.0 Design Progress
5.1 Conceptual Design and Initial Weight Estimate …………………………………………8
5.2 Preliminary Design………………………………………………………………………….10
5.2.1 Configuration selection…………………………………………………………………..10
5.2.2 Airfoil Selection……………………………………………………………………………10
5.2.3 Planform Selection………………………………………………………………………..11
5.2.4 Detailed Design……………………………………………………………………………12
5.3 Geometry Selection And Optimization………………………………………………….....12
5.4.1 Servo Sizing………………………………………………………………………………..13
5.4.2 Propulsion…………………………………………………………………………………..13
5.4.3 Competitive Scoring and Strategy Analysis……………………………………….……14
6.0 Analysis
6.1 FEM Analysis of Wing Spar……………………………………………………..…………..14
6.2 CFD Analysis of 2D Airfoil………………………………………………………………..….16
6.2 Performance Analysis
6.2.1 Drag Analysis………………………………………………………………………………..17
6.2.2 Propulsion…………………………………………………………………………………....18
6.2.3 Wind Tunnel Test…………………………………………………………………………....18
6.3 Stability………………………………………………………………………………………….20
6.4 Thrust Analysis…………………………………………………………………………………21
7.0 Assembly And Sub-Assembly
7.1 Testing…………………………………………………………………….……………………...23
7.1.1 Aerodynamics………………………………………………………………………………....23
7.1.2 Dynamics and Controls………………….........................................................................23
7.1.3 Structures………………………………………………………………………………………23
7.1.4 Propulsion………………………………………………………………………………………23

B.M.S College of Engineering, Team-310
P a g e 4 | 29
7.1.5 Flight Testing………………………………………………………………………………….23
8.0 Manufacturing
8.1 Overview………………………………………………………………………………………....24
8.1.1 Laser Cutting…………………………………………………………………………………..24
8.1.2 Fuselage………………………………………………………………………………………..25
8.1.3 Wing…………………………………………………...........................................................25
8.1.4 Tail………………………………………………………………………………………………26
9.0 Conclusion
10.0 Appendix
List of figures and tables
FIGURE NO. FIGURE NAME PAGE NO.
1 Milestone Chart 6
2 Average Temperature in 2014 7
3 Weather Forecast 7
4 Landing Shock 7
5 Basic Design Progress 8
6 Optimization Flowchart 9
7 Mass Indexing of Fuselage 9
8 2D Analysis of High Lift air foils 11
9 S1223 Air foil 11
10 Airfoil Analysis 11
11 Geometry Selection And Optimization Flowchart 12
12 Matlab Code for Competitive Scoring 14
13 Von Mises Stress on deformed wing with respect to unloaded condition 15
14 Von Mises stress on Deformed wing 15
15 Shear Stress induced on Wing 16
16 Deformation Induced on Wing 16
17 CFD Analysis showcasing Surface Velocity 16
18 CFD Analysis showcasing Pressure Distribution 16
19 Virtual Wind Tunnel Test 19
20 Laser Cutting of Airfoil 25
21 Airfoil Section 25
22 Prototype Plane 26
TABLE NO. TITLE PG. NO.
1 Figure of Merit 11
2 Dimensions Table 13
3 Drag Analysis Table 18
4 Thrust Analysis Table 22
5 Master Test Schedule 25

B.M.S College of Engineering, Team-310
P a g e 5 | 29
1.1 System Overview This report presents the design, manufacturing, and testing processes conducted by Team
Yaksha of B.M.S College of Engineering in preparation for the SAE AERO WEST 2015 at Van
Nuys, California, USA. The winner of this competition is the team that achieves the highest
overall score, which consists of three parts, the average of successful flight round scores,
operational availability points depending on payload fraction of the aircraft and the assembly
demonstration bonus. To achieve this task in the micro-class competition, the aircraft designed
by this team utilized a conventional aircraft configuration, which was modified to excel at
providing heavy lift capabilities. The conventional aircraft configuration was chosen over more
advanced designs because of its performance predictability and ease of construction. In the
following sections, we outline the design process used to create our micro aircraft.
Calculations used to justify the aerodynamic, propulsion, and stability performance are
detailed and a final weight build-up is given. Finally we present the model diagram of the
aircraft based on the above considerations.
1.2 Competition Projections
Our team performed an analysis to identify how to maximize score based on the key
requirements. From this analysis, the team determined that minimizing the empty weight and
maximising the payload fraction are the main factors for maximizing the total flight score. This
was accomplished by maximizing the aerodynamic efficiency of the aircraft. The team after
several brainstorming sessions decided to choose a conventional wing design because of its
proven reliability, high stability and ease of construction. A high lift to drag ratio would help
increase the system efficiency. A rectangular carbon fibre fuselage was chosen consisting of
4 rods for its high strength to weight ratio. Truss structures were cut to minimize the net weight
of the aircraft. The aircraft uses a tractor propulsion system consisting of an AXI brushless
out-runner motor, 1000 mAh Li-Po battery pack and a 9x4.5 inch propeller.
1.3 Innovation The team tried innovative methods in fabricating the aircraft. Since the micro class has belly
landing instead of a landing gear mechanism most of the fuselage body was made of carbon
fibre. The team also used laser cutting techniques to fabricate the wing. Rapid prototyping
machine Protocentre 999 was used to make the model and test it on the wind tunnel. Hinges
were added at the tail to accommodate the aircraft inside the prescribed container comfortably.

B.M.S College of Engineering, Team-310
P a g e 6 | 29
2.0 SCHEDULE SUMMARY
The team constructed a rigid timeline with effective time distribution and was able to execute
them in regular intervals. Our team was divided into several section like design team ;
Fabrication Team ; Electronics ; Report and Red Team. The outline chart of our work processis
shown below in the following Gantt Chart.
3.0 REFERENCES
1. UIUC Applied Aerodynamics Group, UIUC Airfoil Coordinates Database.
www.ae.illinois.edu/m-selig/ads/coord_database.html
2. Carpenter and Houghton, “Aerodynamics for Engineering students”, Butterworth
andHeinemann, 17March 2003.
3. Raymer, Daniel P. 1999 “Aircraft design, A conceptual approach”, AIAA Alexander Bell
Drive and Reston. October 15, 2009.
4. WB Garner, Model Airplane Propellers. March 2009
http://www.dc- rc.org/pdf/Model%20Propellers%20Article.pdf
5. <http://www.csd.net/~cgadd/eflight/calcs_servo.htm
6. Selig, Michael S. “High-Lift Low Reynolds Number Airfoil Design”. Published in Journal of
Aircraft, Vol 34, No. 1, January-February 1997
7. Wilcox, David C (1998). "Turbulence Modeling for CFD". Second edition. Anaheim: DCW Industries, 1998. pp. 174.
Figure 1. Milestone Chart

B.M.S College of Engineering, Team-310
P a g e 7 | 29
4.0 Loads and Assumptions
4.1 Standard Environmental Assumptions:
The standard sea level conditions are shown above and these are taken into consideration
while designing the preliminary design. The team conducted a literature survey on the weather
conditions at Van Nuys; California. The MET department reports were studied and it was found
that the temperatures stay between 25 degrees Celsius (max) and 10 degrees (min). The
winds may range from 9 to 11 km/hr which comes under the category of light breeze under
Beaufort Scale. Though these are not alarming weather conditions; the team left no stone
unturned in prepare for the worst. The predicted weather during the period of the competition
are shown below collected from the survey done.
Figure 3. Weather forecast
4.2 Landing Shock
Calculating the landing shock of
the aircraft is an important factor
of analysis when there is no
landing gear present in the micro
class division. Thus a MATLAB
program was created to analyse
the force experienced by the belly
of the fuselage as it has to land
on the fuselage in the flight
rounds. A plot of Force vs Initial impact time is shown to understand the amount of force
that’s going to be acting at the impact time.
Figure 2. Average temperature in 2014
Figure 4: Landing Shock
B.M.S College of Engineering, Team-310
P a g e 8 | 29
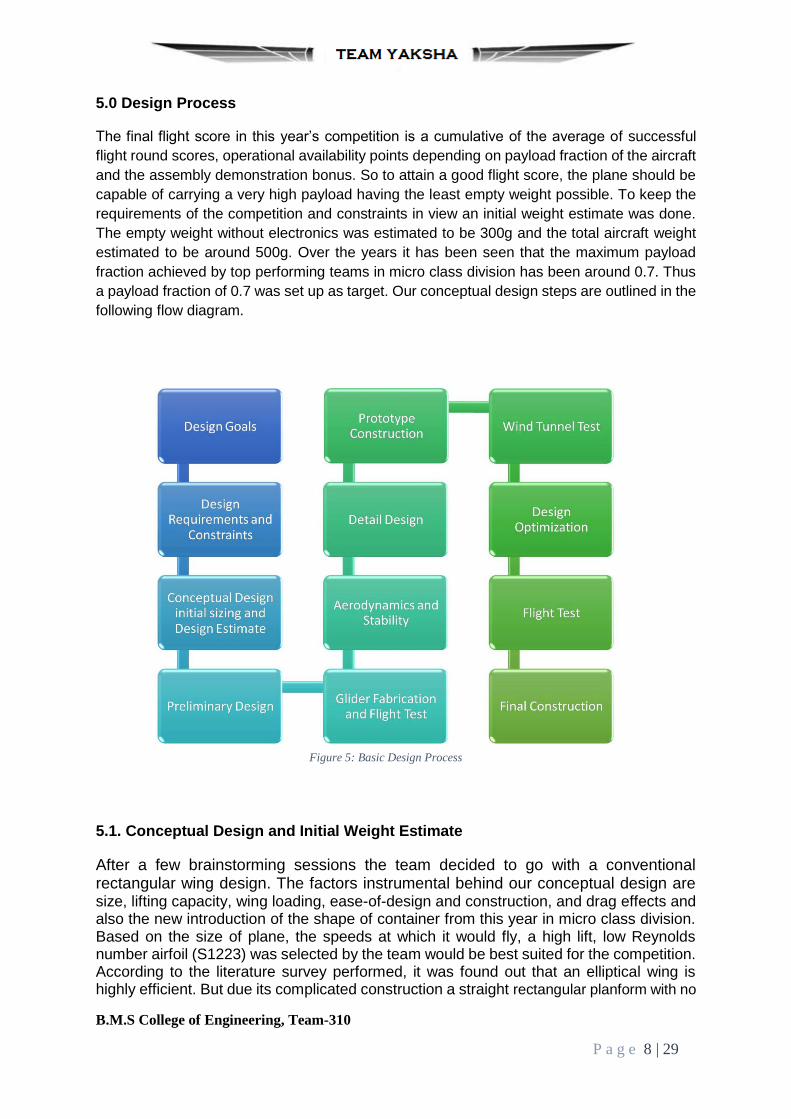
5.0 Design Process
The final flight score in this year’s competition is a cumulative of the average of successful
flight round scores, operational availability points depending on payload fraction of the aircraft
and the assembly demonstration bonus. So to attain a good flight score, the plane should be
capable of carrying a very high payload having the least empty weight possible. To keep the
requirements of the competition and constraints in view an initial weight estimate was done.
The empty weight without electronics was estimated to be 300g and the total aircraft weight
estimated to be around 500g. Over the years it has been seen that the maximum payload
fraction achieved by top performing teams in micro class division has been around 0.7. Thus
a payload fraction of 0.7 was set up as target. Our conceptual design steps are outlined in the
following flow diagram.
5.1. Conceptual Design and Initial Weight Estimate
After a few brainstorming sessions the team decided to go with a conventional rectangular wing design. The factors instrumental behind our conceptual design are size, lifting capacity, wing loading, ease-of-design and construction, and drag effects and also the new introduction of the shape of container from this year in micro class division. Based on the size of plane, the speeds at which it would fly, a high lift, low Reynolds number airfoil (S1223) was selected by the team would be best suited for the competition. According to the literature survey performed, it was found out that an elliptical wing is highly efficient. But due its complicated construction a straight rectangular planform with no
Figure 5: Basic Design Process

B.M.S College of Engineering, Team-310
P a g e 9 | 29
taper ratio was selected for the simplicity and ease of fabrication. A conventional tail was chosen for adding stability to the design. The main idea was to make the dead weight of the aircraft as minimum as possible. Thus a single carbon fibre rod is used to connect the main part of the fuselage and the tail. Moreover truss structures are used to optimise the weight to strength ratio as possible. The following flowchart describes the thought process implemented while doing the initial weight estimate.
Figure 6: Optimisation Flowchart
Figure 7: Mass Indexing of Fuselage

B.M.S College of Engineering, Team-310
P a g e 10 | 29
Next, we performed a mass indexing program to have an estimate whether actually the
proposed aircraft weight matches the calculated weight. The above diagram shows the mass
indexing of the entire fuselage part. It shows that with the available electronics it stands at
around 240g.
5.2 Preliminary Design:
5.2.1 Configuration Selection:
The configuration selection is the most important consideration of the entire project. The team
studied various configurations to determine which would suit the problem statement and uplift
the fight score and came up with 3 configurations namely, Monoplane (conventional), Biplane,
Flying wing. The various configurations were ranked points based on the literature survey
made by the team. Figure of merit (FOM) was used to decide, with the maximum of 5 points
allotted to each parameter.
Parameters Weightage Conventional Biplane Flying wing
Ease of Construction
0.6 4 3 3.5
Cost 0.3 4 3 3.5
Empty Weight 0.7 3 3 4
Stability and control
0.8 4.5 4 3.5
Historical data and literature
survey
0.6 4 3 2
TOTAL 11.7 9.8 9.95
Table No.1: Figure of Merit
Thus it can be found out from the above table that the conventional plane configuration is
giving us a better trade-off than the other designs thought of. The Biplane and the Flying Wing
configuration were eliminated because of its complexity in construction. Hence we concluded
that the conventional configuration was best suited for the competition requirements because
of high ‘Cl’ value at given Reynolds number, the ease of construction, historical data available,
structural simplicity and its cost involved.
5.2.2 Airfoil Selection:
The team conducted study on a wide range of airfoils. Among many airfoils suitable for high
lift application. E423, S1223, S1210 airfoils were analysed using XFLR5 software. It was
concluded that S1223 airfoil is best suited for payload lifting applications at a lower Reynolds
number. It has highest CL value at zero angle of attack which is required for high payloads and
also it has maximum lift coefficient. This airfoil has also proven to be effective for these
applications in the past. The primary reference for our final selection was Selig’s paper on the

B.M.S College of Engineering, Team-310
P a g e 11 | 29
S1223, which showed its superiority in comparison with other heavy lift airfoils. We also
referenced World of Krauss for low Reynolds number data.
Figure 8. 2D Analysis of high lift airfoils
Figure 9.S1223 airfoil
A batch analysis of the 2-D wing was setup on XFLR5 analysing the lift coefficient, drag
coefficient, moment coefficient for varying angle of attack and Reynold’s number for laminar
flow. The yielding data was then validated through Wind tunnel testing of a 3:8 scaled model.
Figure 10.S1223 Airfoil Analysis

B.M.S College of Engineering, Team-310
P a g e 12 | 29
5.2.3 Planform Selection
Though a rectangular planform is more efficient, a rectangular planform was selected due to
the lack of team’s past fabrication experience. A taper ratio of 1 was used to further simplify
the design calculations and construction. For an empty weight of 1.1 lb and a payload fraction
of 0.67, the required lift produced by the wing should be 3.51lb. Flight velocity of 36 ft/s was
assumed based on historical data. Using XFLR-5 software initial 2D-lift coefficient was found
to be 1.5. Using the formula for the lift, the wing area required for the corresponding lift was
found to be 1.59 ft2(0.148 m2).
5.2.4 DETAILED DESIGN
3-D Lift Coefficient (From finite wing theory):
The 2-D coefficients are for wings with an infinite aspect ratio. Wings of finite aspect ratio i.e.,
3 -D wings need a correction to the lift coefficient. The lift coefficient of finite wing is lower than
the infinite aspect ratio wing, due to lift induced drag which manifests as wing-tip vortices
reducing the overall lift coefficient. The finite wing lift curve has the same zero lift angle of
attack, and pivots about this point, clockwise. The reduced slope 𝑑𝐶𝑙𝑑∝ derived from theory
is given by,
From the above equations and, 𝑑𝐶𝑙𝑑∝ equals 0.08 Coefficient of lift for finite aspect ratio is given by the equation 𝐶𝐿= 𝑑𝐶l𝑑 𝛼∝+𝐶𝐿∝=0
And 𝐶𝐿∝=0 = 1.34. This gives a corrected 𝐶𝐿 value of 1.385 at ∝=5° A 3-D wing analysis using Vortex Lattice Method in XFLR-5 software resulted in a CL value
of 1.33 which closely matches with the theoretical value calculated above. A 3-D wing
analysis using Vortex Lattice Method in XFLR-5 software resulted in a CL value of 1.33
which closely matches with the theoretical value calculated above.
5.3 Geometry Selection and Optimization
The geometry of the aircraft was selected and optimized using Excel spreadsheet and
MATLAB program which incorporates take off analysis, stability analysis and also the
constraints put forth by the competition. The program was constructed as per the flowchart
shown in the Figure.

B.M.S College of Engineering, Team-310
P a g e 13 | 29
Figure 11. Geometry Selection and Optimisation Flowchart
Structural Component Dimensions
Total Length 34.929 inches
Fuselage Length 24.101 inches
HT Chord 4.72 inches
HT Span 11.22 inches
VT tip Chord 4.560 inches
VT Span 5.118 inches
Wing Span 55.110 inches
Wing Chord 5.5 inches
Wing Area 2.1035 ft2
HT Area 0.644 ft2
VT Area 0.1292 ft2
Aspect Ratio 10.22
Table No. 2: Dimensions Table
5.4.1 SERVO SIZING
Maximum Torque required for our constraints is given by the following equation:-
Torque required = 8.5 E-6 [C2 V2 L sin (S1) tan (S1) / tan (S2)]
C = Control surface chord in cm, L = Control surface length in cm, V = Speed in MPH,
S1 = Max control surface deflection in degrees, S2 = Max servo deflection in degrees,
For ideal performance and efficient manoeuvring, the chords of the control surfaces are taken to be one third of the main stabilizers chords. From this, the dimensions of the control surfaces are obtained as: Elevator =3.5 cm ×28.5cm and Rudder = 3.5cm x 12cm.The performance characteristics suggest a minimum take-off speed of 11 m/sec. The maximum torque required to operate the elevator and rudder at the above speed are 0.67 kg-cm which is well below the value of the maximum torque of the selected servos which is 2 kg-cm

B.M.S College of Engineering, Team-310
P a g e 14 | 29
5.4.2 Propulsion
The propulsion system was designed to produce the required thrust to overcome drag at cruise
while weighing as little as possible. It was designed to operate for a minimum of two minutes
to accommodate for multiple circuits of the course at maximum speed plus a safety factor. The
most important of these priorities was to produce enough power and, in turn, thrust to achieve
flight.
To get an initial estimate of the power output needed, we used the rule of thumb of
approximately 30 W per one lbf of weight lifted. At the beginning of the design process, our
initial weight was approximately 1.8kg and thus our required power was approximately 120 W.
Given the power estimate we determined a range of battery specifications that had the
capability of producing a minimum of 120 W. In order to achieve this power output, batteries.
As such, a three cell battery was chosen. Given the flight duration of two minutes, a maximum
amp-hour value for the battery was calculated to be 850 mAh at an operational current
between 20A and 25A and battery specification voltage of 11.1V.
5.4.3 Competitive Scoring and Strategy Analysis
Figure 12: MATLAB Code for competitive scoring
For analysing the flight score and to maximise the points based on the competition scenario
at the airfield; a simple program was constructed on MATLAB which is shown above. This
program is constructed on assumptions that the length of the container must be 56 inches
and a bonus of 1.7. Moreover all the flight rounds must have successful flight round scores.
On giving input of around 6 payload fractions we determine how the score is varying or
depending on the payload fractions given. So on input [0.3 0.42 0.45 0.5 0.52 0.55] we get a
total cumulative score of 120.2907 points. This is figure which we want to improve upon and
trials are going on to determine the maximum scoring possible.
B.M.S College of Engineering, Team-310
P a g e 15 | 29
6.0 ANALYSIS
6.1 FEM ANALYSIS OF WING SPAR
CFD results are directly analogous to wind tunnels results got in a research facility they both
speaks to sets of information for given stream arrangements at distinctive Mach numbers,
Reynolds number, and so forth. What's more mulling over is that CFD permits perception of
stream properties without exasperating the stream itself, which is not generally conceivable
with ordinary measuring instruments.
In real word scenario, the impinging air parameters are difficult to record, thus, hybrid
initialization is used. For zero angle of attack the speed forms will be symmetrical and in
accordance to rule of Bernoulli’s. In a symmetrical aerofoil at no occurrence, the circulation of
speed and in this way the pressure along both surfaces would have been precisely the same,
cancelling off one another to a subsequent aggregate lift power of zero.
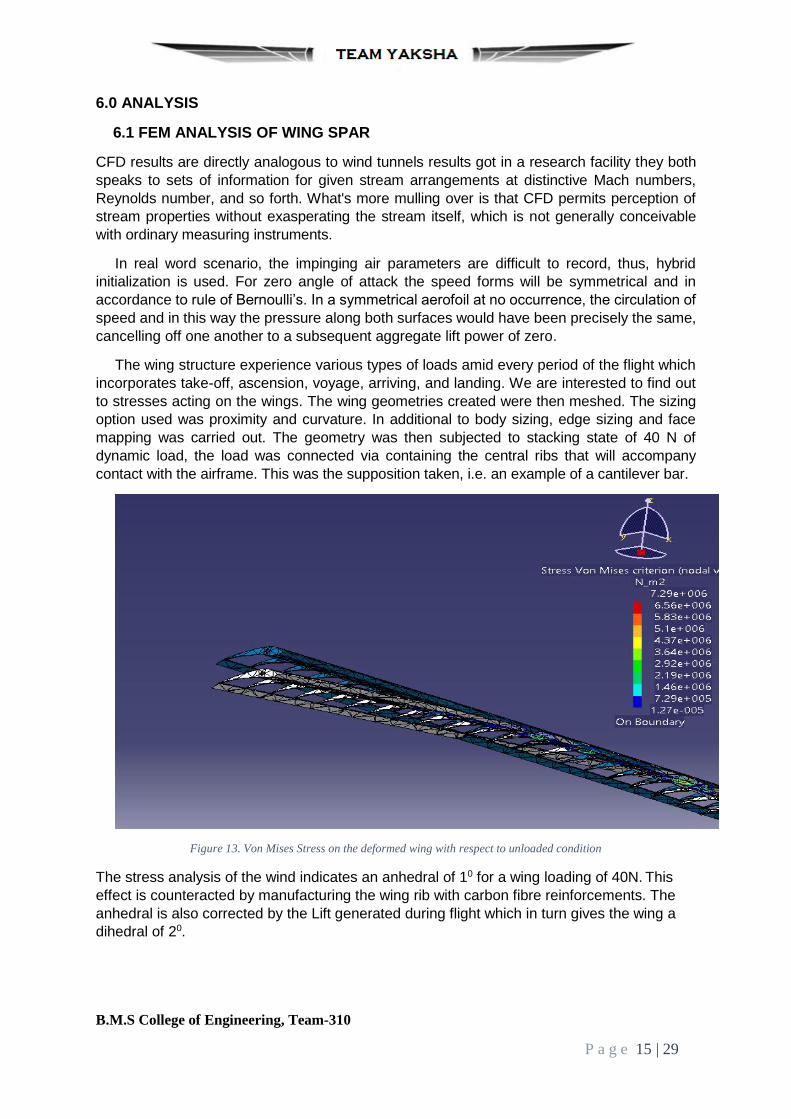
The wing structure experience various types of loads amid every period of the flight which
incorporates take-off, ascension, voyage, arriving, and landing. We are interested to find out
to stresses acting on the wings. The wing geometries created were then meshed. The sizing
option used was proximity and curvature. In additional to body sizing, edge sizing and face
mapping was carried out. The geometry was then subjected to stacking state of 40 N of
dynamic load, the load was connected via containing the central ribs that will accompany
contact with the airframe. This was the supposition taken, i.e. an example of a cantilever bar.
Figure 13. Von Mises Stress on the deformed wing with respect to unloaded condition
The stress analysis of the wind indicates an anhedral of 10 for a wing loading of 40N. This
effect is counteracted by manufacturing the wing rib with carbon fibre reinforcements. The
anhedral is also corrected by the Lift generated during flight which in turn gives the wing a
dihedral of 20.

B.M.S College of Engineering, Team-310
P a g e 16 | 29
Figure 14: Von Mises Stress on the deformed wing
Figure 15: Shear Stress induced on wing
Figure 16: Deformation induced in the wing

B.M.S College of Engineering, Team-310
P a g e 17 | 29
6.2 CFD Analysis of 2D Airfoil
The above figures show the CFD analysis is done at a free stream velocity of 10 m/s and a Reynolds number of 100,000 for Sellig-1223 2-D airfoil.
6.2 PERFORMANCE ANALYSIS
6.2.1 Drag Analysis The drag analysis of the plane is carried out in three parts-wing drag, fuselage drag and the tail drag. The team estimated the total drag co efficient of the wing using component build up method. The total drag coefficient of the airplane is the sum of these three drag components. CD=CDO+CDI where CDi= CL
2 / πeAR CDO=Cdo + Cd misc Cdo =1Σn (FF. Cf .Swet/Sref) Evaluation of Cd0: Swet=Sexp [1.977+0.52 (t/c)] FF of wing and tail = [1+0.6/( 𝑥/𝑐)2∗(𝑡/𝑐)+100 (𝑡/𝑐)4 ]* [1.34 M0.18 cos(𝛬𝑚)0.28] FF of fuselage= 1+𝑓0/𝑓3+𝑓/400 where f= 𝑙/𝑑… ..eqn 6.17 Cf = 1.328/ (Rcut-off)0.5 Rcut-off = 38.21(𝑙/𝑘)1.053
WING FUSELAGE VERTICAL TAIL
HORIZONTAL TAIL
Sref (mt2) 0.1918 0.066642 0.0115 0.03135
Swet (mt2) 0.379882 0.0497923 0.232584 0.060846
Swet /Sref 1.9806 0.74 2.022 1.94
Using the above equation, CDO is found for each component in the Table as shown below.
Figure 17: CFD Analysis showing surface velocity Figure 18: CFD analysis showing pressure
distribution

B.M.S College of Engineering, Team-310
P a g e 18 | 29
WING FUSELAGE VERTICAL TAIL HORIZONTAL TAIL
FF 1.327 1.15 1.1123 1.1097
l/k 35897.43 16117.948 2617.4 2724.87
Rcutoff 206896.3189
1029139.447 151772.9065 154628.81
Cf*10-3 2.919 1.31 3.4 3.37
Table No.3 Drag Analysis Table
Using the formula for the total drag, we have 𝐶𝐷=𝐶𝐷𝑂+𝑘𝐶𝐿2+𝑘′(𝐶𝐿−𝐶𝐿𝑚𝑖𝑛𝐷)
CDo = (𝐹𝐹)( 𝐶f)(𝑆wet/𝑆ref) k =1/(𝐴𝑅)𝑒 =0.039
k’ (for blunt rectangular plan form wings)=0.02
𝑘 CL 2+𝑘′(𝐶𝐿−𝐶𝐿𝑚𝑖𝑛𝐷) = 0.0728
For fuselage; FF= 1 + 60/𝑓3 + f/400 = 1.15
Therefore, CDo = n=1Σ4 [(𝐹𝐹)( 𝐶f)(𝑆wet/𝑆ref)]
CDo = 0.0236 ,Cmisc. = 0.0728 , CDi = 0.039 CL 2
Therefore, CD = (0.0964) + 0.039CL 2 Thus the drag polar curve is given below.
Drag Polar curve
6.2.2 Propulsion
The propulsion system was so designed to provide the necessary thrust to overcome the drag
experienced during flight. The initially designed system had a high power motor producing a
thrust of 3.96 lbs with a 11x5.5 propeller and required a higher capacity (mAh) battery which
invariably increased the weight of the system above the optimum level. Hence the team
optimized the plane design further in order to reduce the drag so that a lower thrust rated
motor can be used to provide the required outcome. Finally the team selected a motor that
provided 3.3 lbs thrust and having 1380 Rpm/volt. This motor required a 40A ESC and a lower
capacity battery to provide the same flight time necessary for a single course at max speed in
the competition still weighing less than the previously designed system.

B.M.S College of Engineering, Team-310
P a g e 19 | 29
In order to meet the required power output, batteries of different cell counts were considered.
For a given flight duration of two minutes, a 3 cell battery providing 11.1v, having a capacity
of 1000 mAh rated to have a constant 45c discharge rate and a burst of 90c was chosen. The
motor selected required a max current of 35A/60s from a 3 cell Li-Po along with a
9”x4.5” propeller for the designed system specifications to meet the necessary static thrust
for our application.
6.2.3 Wind tunnel Test
Data Validation was done through testing a scaled model in the wind tunnel facility at the
university. A 3:8 scaled model of the designed aircraft was fabricated using Rapid prototyping
technique to fit the dimensions of the test section of the wind tunnel (0.5mX0.5mX1m). A
blockage ratio of 60% was assumed due to high aspect ratio. Experimental data was gathered
using a 6 component strain gauge and the Coefficient of lift and drag were calculated for
various angle of attack.
Graph of lift coefficient V/S angle of attack
-10
0
10
20
30
40
50
60
-10 -5 0 5 10 15
CL/CD
-0.5
0
0.5
1
1.5
2
2.5
-10 -5 0 5 10 15
Lift Coefficient (CL)

B.M.S College of Engineering, Team-310
P a g e 20 | 29
Graph of CL/Cd v/S angle of attack
It was found that the values
were obtained to an
accuracy of approximately
80% of theoretical results.
A virtual wind tunnel was
conducted to find out the
drag coefficients.
6.3 Stability
Horizontal tail:
The horizontal tail volume co-efficient is given by
Vh was found to be 0.45, and the wing area, chord being – 308inch2 and 5.5inch
respectively, we find the optimum tail area to be 34.54inch2. Taking tip width to root width
ratio to be 0.45, we find the dimensions of the horizontal tail to be:
Tip width: 4’’; Root width: 2.4’’; Span: 11.2’’;
Vertical Tail:
The vertical tail volume co-efficient is given by
Vv was found to be 0.03, and the wing area, wing span being – 308inch2 and
56inch respectively, we find the optimum tail area to be 23.44inch2.
The vertical tail area is thus taken as 24inch2.
35% of the area of the tail area was considered for the elevator and rudder. With regard to
the above calculations an inverted flat plate was selected since it could satisfy all the
moment balancing requirements arising from the pitch moment generated by the main wing
and thus optimum stability was obtained.
Vh * Sw * c = St * lt
Vh=Tail Co-efficient
Sw=Wing area
St=Tail area
C=Mean average chord
Vv * Sw * b = St * lt Vh=Tail Co-efficient
Sw=Wing area
St=Tail area
b=Wing Span
Figure 19. Virtual Wind tunnel test

B.M.S College of Engineering, Team-310
P a g e 21 | 29
6.4 Thrust analysis
With respect to the nature of power output of propeller motors and the inherent relationship
between a motor and a propeller, it was necessary to consider motor choice and propeller
sizing in tandem. As such, the first general relation to consider was thrust versus RPM. Next
to be considered was propeller pitch versus thrust. Consequently, lower pitches meant higher
thrust values, but also lower RPM. Therefore, a higher power motor was required to spin a
propeller with less pitch at the same RPM as one with more pitch.
Finally, the relationship that brought the voltage of the battery and RPM of the motor together
was the KV parameter of the motor. KV is a measure of the RPM per Volt a motor can output,
and in doing so, how much torque a motor outputs. Lower K meant lower RPM with more
thrust which was typical of slow flying planes, much like the very aircraft our team was
designing [10]. Using these general guidelines as well as the parameters of the battery, the
motor Kv value was selected to be 1390 Kv. To determine prop size, it was necessary to relate
thrust and power to pitch speed, Vpitch. Pitch speed can be calculated using equations :
𝑇 = 𝑃/𝑉𝑝𝑖𝑡𝑐ℎ
Aprop = T/(0.5*p*Vc 2)
Dprop = 2*(Aprop/π)0.5
Dynamic thrust had to be greater than static thrust. It is given by
T = TC ρ V2D2
Since static thrust is dependent on the diameter of the propeller disk and the outgoing
airspeed, we determined that a nine-inch diameter, 4.5 inch pitch propeller was needed for
our application.
RPM/V 1380
Diameter x Pitch 9 x 4.5
Thrust 1500g
Table No.4 Thrust Analysis Table

B.M.S College of Engineering, Team-310
P a g e 22 | 29
7.0 ASSEMBLY AND SUBASSEMBLY
The aircraft was designed to be a four fixture plane consisting of two parts of the wing and two
parts fuselage. The larger structural parts of the aircraft had to be assembled in a certain order.
The fuselage was first assembled by bolting the carbon fibre rods to the mounting plates in a
rectangular fashion. Another carbon fibre boom of diameter 12 mm was fixed to the middle
plate which stretches to the tail. Then the horizontal stabilizer is fixed to the boom followed
by the vertical stabilizer.
The team fixed the control surfaces to the appropriate positions using hinges, then in the next
step electronics were integrated into the body. Then the assembly of the electronic
components starts with the motor which is fixed to the front mounting plate and secured
using screws. To ensure correct orientation and fit of the components special care was taken.
Connecting wires were cut into required length to optimize the space required to fit in all the
electronic components. The Electronic speed controller was then connected to the motor and
secured by applying glue. The battery is then placed in the appropriate position and secured
using zip ties as needed to be removable. The receiver is then placed suitable and the
connections between the ESC and the receiver are made.
For the wing assembly first the laser cut ribs of the airfoil shape were placed at the required
location on a wide sheet of balsa. Then a 5mm carbon fibre rod was made to pass through
the ribs and glued at the appropriate locations. After the wing is fabricated, the structure of the
wing is covered using monocot. Ailerons are the attached to the wing structure and secured
using hinges.
Wing rib Manufacturing
Next the two servos for the ailerons are fixed and secured in place, the servos are then
connected to the radio receiver in order to facilitate it’s working. Simultaneously the servos
assigned for the rudder and the elevator are also placed and connected to the receiver.
Propeller is then fixed to the motor using the mounting unit. In the final step of assembly the
pre prepared cargo bay unit is fixed and secured to the fuselage in order to provide the
required space to carry the designated payload. Next the fuselage is covered with monocot.
The wing is then placed on the fuselage and firmly attached using nylon hinges and fibre tape.
Finally the plane was completely sealed and all the electronic components were checked for
flight readiness.

B.M.S College of Engineering, Team-310
P a g e 23 | 29
7.1 TESTING
Objectives
After the prototype was complete, a series of tests were performed to evaluate the actual
performance of the aircraft. The prototype was tested in five categories: aerodynamics,
dynamics and controls, propulsions and structures. The goal of these tests was to verify
theoretical calculations and validate them with experimental data. Flight tests were also
performed to evaluate the overall aircraft performance.
7.1.1 Aerodynamics
Tests were run using the Wind Tunnel at BMS College of Engineering, Bangalore of
dimensions 0.5 m by 0.5m by 1 m. The main objective was to measure aerodynamic
performance by obtaining overall lift and drag coefficients at varying angles of attack and
free stream velocities from the measured aerodynamic forces. Lift and drag magnitudes were
then used for the propulsion analysis. All experiments were performed using the wind tunnel.
The aerodynamic coefficients tested in the tunnel were within 80% of the theoretical results.
7.1.2 Dynamics and Controls
The objectives of the stability tests were to ensure the aircraft had sufficient yaw, pitch, and
roll stability. Two tests were performed to measure the stability of the aircraft. In the first test,
wing size was adjusted to minimize drag while maintaining acceptable yaw stability. In the
second test, the elevators were tested to ensure adequate pitch and roll authority were
achieved while keeping a minimal overall weight. All tests utilized the wind tunnel apparatus.
7.1.3 Structures
Loading tests were performed on key aircraft structures to verify that failure loads exceeded
design requirements. The wing structure was tested by fixing the carbon fibre wing spar in the
Universal Testing Machine .The loads were applied were corresponding to a factor of safety
of 2 .The spar was able to withstand the applied loads with minimal deflection. These tests
identified potential failure points and design revisions were made accordingly.
7.1.4 Propulsion
A series of propulsion tests were executed to evaluate the performance of various motor,
battery, and propeller combinations. A wind tunnel and force balance were used to measure
the thrust produced at various flight speeds. A simple setup was fabricated on which the
motor was mount, and thrust was measured at different RPMs of the selected motors.
7.1.5 Flight Testing
Initially a full scale glider was constructed and glide tested to check the air worthiness of the
design. Later a full powered prototype aircraft was constructed and flight tested with different
payloads in order to test the stability and maximum payload capability of the aircraft.
The first few test flights resulted in frequent crashes due to stability and control inaccuracies.
These errors were a result of inaccurate calculation of CG. During landing of the next fight,
we witnessed another failure in the rib at the wing tip when the plane landed on its side. During
the next set of flights the ESC failed due to excess draw of current from the motor. Once these
issues were resolved by altering the position of the center of gravity and replacing the ESC
of higher current rating, a successful test flight was achieved.
A Master Test Schedule was constructed to analyse the different test results below.

B.M.S College of Engineering, Team-310
P a g e 24 | 29
Test area Test Objective Team members delegated
Duration
Aerodynamics Wind tunnel Lift, drag, pitching
Abhiram, Sachin
15/11/14 – 22/11/14
Dynamics and control
Elevator, Ailerons, Rudder sizing
Minimum sizing for maximum control
Indrajeet, Sachin, Achyut
29/11/14 – 15/12/14
Structures Spar testing Spar dimensions for 20N load
Abhiram, Srinath, Abijith
29/11/14 - 2/12/14
Wing testing Wing loading and torsional strength
Indrajeet, Blesson
15/12/14 – 31/12/14
Propulsion Propeller Correct sizing Apratim, Siddesh
1/1/15 – 5/1/15
Motor Necessary thrust
Siddesh, Apratim
5/1/15 – 15/1/15
Battery Various sizes for thrust alterations
Adarsh, Vishwas
8/1/15 – 28/1/15
Flight test Flight data Voltage, amperage, wattage
Akshay, Adarsh, Indrajeet
30/1/15 – 15/2/15
Flight characteristics
Necessary design changes and optimization
Abhishek, Ayush, Kushal, Deevyendu
15/2/15 – 28/2/15
Table No. 5- Master Test Schedule
8.0 Manufacturing
8.1 Overview
The team after conducted a literature survey on the material and found that the carbon fibre
rods have higher strength to weight ratio than other conventional materials. The team
decided to use birch wood for rib sections. The material used for the spars in the wing is
reinforced carbon fibre rods. Balsa sheet covering and cap strips are used to maintain the
airfoil shape.
Since it is a two piece wing, each segment was connected using reinforced carbon fiber rods
running through the ribs having holes of 5mm diameter. Monokote is used for covering the
wing. Hinges were used to fix the ailerons. The parts were bonded together using
Cyanoacrylate adhesive (743 Adhesive).
The fuselage is a rectangular structure, built using 4 carbon fibre rods and three mounting
plates. Then a carbon fibre rod boom is connected from the second plate till the end where
the tail is mounted.

B.M.S College of Engineering, Team-310
P a g e 25 | 29
8.1.1 Laser Cutting
Standard process for the laser printer was to model all parts in
software, produce a drawing with only the outlines of the parts.
The parts were printed from CATIA modelling software. For the
final model of the aircraft, the laser drafting cutter was
also used for the precise cutting and measurement of the
thick Monocot . The main challenges to using the laser cutter
were determining proper settings for each thickness of wood
and providing tolerance to structurally significant cut outs.
Mock printing sessions were conducted by the team prior to
cutting plane parts in order to discover the best printing settings
for different parts. Balsa wood and Monocot are soft materials
so they cut at a faster speed then the harder, more common
acrylic materials that the laser cutter is usually used for. Thus careful preventive measures
were undertaken. The ability to laser cut every part of the aircraft, whether it was Monocot,
balsa, or acrylic.
The main construction of the three parts of the aircraft is given below:
8.1.2 Fuselage
The main rectangular structure was constructed using four reinforced carbon fibre rods.
Two mounting plates were chosen and held together by screws. The rods were passed
through the third mounting plate in the middle. A 11mm carbon fibre rod was then mounted
from the middle plate. These rods provide the main strength and the rigid form of the entire
structure. The motor was mounted on the front plate of the fuselage
8.1.3 Wing
Balsa wood was used for the construction of the wing. It has a span of 1.4 metres. Birch wood
was used for rib sections at the ends of the wing to provide strength to the wing. Reinforced
Carbon Rods were passed through the 5mm holes to provide rigid form to the wing. Spars are
passed through 2mm holes which will take bending load stress. Each rib is placed after 2
inches. A prototype wing was built at first and tested. It was found to be heavy and stood
about 150g. Subsequent changes were made in lightening the overall weight. So the model
was optimized to the extent possible.
Figure 21: Airfoil Section
Figure 20. Laser Cutting Of Airfoils

B.M.S College of Engineering, Team-310
P a g e 26 | 29
8.1.4 Tail
The conventional inverted-T tail design was chosen and the balsa wood was laser cut
according to design and truss structures were introduced similar to the wing. Control surfaces
were laser cut too and attached to the tail and the wings using a hinge mechanism. Next a
hinge was introduced at the horizontal surface to fit the tail within the prescribed diameter.
This has proved to be a major challenge and the team is currently working on 2 to 3 methods
and choose the best of them.
The first prototype of the plane is shown below:
Figure 22: Prototype Plane
Conclusion
SAE Aero design competition is an excellent platform for the upcoming engineers to get a
deep insight into the design and fabrication aspects of aero-modelling since it requires
extensive multidisciplinary work which in turn helps the students to develop team building
skills. This competition provides a practical hands-on experience to the team members in both
building and flying of the aircraft.
TEAM YAKSHA of BMS College Of Engineering, India has done a complete study and made
slight modifications on the conventional design, performed through engineering analysis and
has constructed a final model that meets the requirements laid out by the Society of
Automotive Engineers for the Aero Design West competition 2015.

B.M.S College of Engineering, Team-310
P a g e 27 | 29
The test flights served as the basis for most of our modifications such as adjusting the centre
of gravity, increasing the stability. Working on the S1223 airfoil was a very challenging task as
the trailing edge of this particular airfoil is very narrow and hence too delicate, giving raise to
many complexities. Securing the electronic components in the hollow fuselage was an uphill
task.
It was a great learning curve of the young undergraduate team worked with passion and
dedication towards achieving the goal. Overall the experience gained while working towards
this competition proved to be very helpful and constructive and gave us an opportunity to have
a deeper look into the field of aero design and avionics.
Appendix A: Weight and balance data
Parts list with Weight data

B.M.S College of Engineering, Team-310
P a g e 28 | 29
Appendix B: PAYLOAD PREDICTION GRAPH
Payload Prediction Graph
Appendix C: Model of the aircraft
Isometric View of the model
Payload = -0.0001(density altitude) + 2.9066
0
0.5
1
1.5
2
2.5
3
0 2000 4000 6000 8000 10000 12000
Pay
load
s (l
bs)
Density Altitude(ft)
Payload prediction

B.M.S College of Engineering, Team-310
P a g e 29 | 29


