68
SAF Tehnika Yearbook 2011/12
Contents SAF Tehnika Overview.............................................................................................................................. 2
SAF Tehnika Management Board ............................................................................................................ 4
SAF Tehnika Supervisory Council.............................................................................................................. 5
Management Report................................................................................................................................ 8
Statement of the Board’s responsibilities .............................................................................................. 11
Supervisory Council report ..................................................................................................................... 12
Personnel................................................................................................................................................ 13
Corporate Social Responsibility.............................................................................................................. 16
Financial highlights ................................................................................................................................ 18
Key figures describing economic development...................................................................................... 20
Holdings and shares ............................................................................................................................... 20
Share price development ....................................................................................................................... 22
Corporate governance ........................................................................................................................... 24
Independent Auditors’ report................................................................................................................. 25
Consolidated Statement of Financial Position ....................................................................................... 27
Consolidated Statement of Profit or Loss and Other Comprehensive Income....................................... 28
Consolidated Statement of Changes to Shareholders’ Equity ............................................................... 29
Consolidated Statement of Cash Flows.................................................................................................. 30
Notes to the Consolidated Financial Statements................................................................................... 31
Company name: SAF Tehnika, JSC Legal address: 24a, Ganibu dambis, Riga, LV‐1005, Latvia Phone: +371 67046840 Fax: +371 67046809 Registration No.: LV40003474109 Financial Year: 1st July, 2011 – 30th June, 2012
1
SAF Tehnika Yearbook 2011/12
2
SAF Tehnika Overview
SAF Tehnika JSC is a Latvian (Europe) designer, manufacturer and distributor of digital microwave data transmission equipment. SAF Tehnika products provide wireless backhaul solutions for digital voice and data transmission to mobile and fixed network operators, data service providers, governments and private companies. Know‐how in modern wireless data transmission technologies, creativity in solutions, accuracy in design, precision in production and logistics make SAF Tehnika a unique designer and manufacturer of point‐to‐point microwave data transmission equipment. Located in Northern Europe, SAF Tehnika managed to acquire and consolidate valuable locally available intellectual resources of the microelectronics industry and spread its presence in more than 100 countries, covering all relevant market segments worldwide within just a decade. Flexibility and customer‐oriented business philosophy are the core concepts of SAF Tehnika research and business development. Our specialists are always following up‐to‐date industry trends to successfully integrate cutting‐edge technologies in our all‐inclusive portfolio of modular split‐mount and full outdoor systems. Standard to high capacity TDM, Hybrid TDM & Ethernet and 4G/LTE networks‐ready Native Ethernet/IP data transmission equipment for licensed and license‐free frequencies provides hundreds of supported, customer‐tailored product variations, all linked together by a fully featured SAF Network Management System. Affordable broadband connectivity and mobile communications have become the backbone of the modern world as well as an important business tool providing decisive impact on competitiveness of our customers. In response to these trends we are constantly striving to promote mobility and openness as the defining features of our company. SAF Tehnika has proved time and that it can swiftly adapt to the challenges of the changing environment and the ever‐increasing pace of technological innovations. The slogan Customized microwave solutions™ incorporates our commitment to an industry‐rare capability to design and implement specific, user‐adapted application techniques and features for our products to ensure that they are fit for planned expansion or fine‐tuning of existing 3G/HSPA backhaul, complex carrier‐grade LTE network migration, deployment of advanced future‐proof wireless infrastructure in underserved markets or a redundancy solution in last‐mile connections. Mobile and alternative operators, PTT/fixed operators, broadband access providers, ISPs, government, utility companies and many others across the world have already chosen to work with SAF Tehnika as a company of reliable and energy efficient products, unparalleled delivery terms and worldwide warranty service, as well as extremely effective and direct management‐level communication. Because broad expertise for a fair price is our proposal for time & money‐sensitive customers that value investments in high class service and sustainable solutions to stay fit for the emerging age of green and smart economies. SAF Tehnika team of direct sales representatives in Europe, North and South America, Africa, South and East Asia, together with a broad worldwide network of authorized partners are always ready to assist and provide up‐to‐date information on the available product options and solutions.
SAF Tehnika Yearbook 2011/12
3
SAF Mission
We deliver customized microwave radio equipment designed and produced in Europe.
SAF Vision
SAF is the first choice of the customer looking for a specific microwave solution at a competitive price and good quality.
Key Company Milestones
1999 Company foundation (10 employees) 2000 Introduction of PDH (CFM) product line 2003 ISO 9001 certification 2004 Acquisition of Viking Microwave AB, Sweden – SAF Tehnika Sweden AB foundation IPO ‐ Initial Public Offering 2006 SDH (CFQ) product line launch in the market Number of SAF Tehnika employees reaches 160 2007 Implementation of a new automated modern manufacturing line 2008 Introduction of CFIP product line – CFIP‐108 Mbps FODU Buy‐out of the capital shares of SAF Tehnika Sweden AB by its management 2009 SAF Tehnika 10 year anniversary Release of CFIP Lumina Full Outdoor radio (366Mbps) CFIP PhoeniX Hybrid Split Mount System (366Mbps) launch 2010 Release of license‐free SAF FreeMile radio 2011 Launch of CFIP Marathon 1.4 GHz and CFIP PhoeniX M split mount Becoming the member of Wireless Internet Service Provider Association CFIP Lumina production launch in Curitiba, Brazil Foundation of subsidiary SAF North America in Denver
SAF Tehnika launches an Online Store www.saf‐lastmile.com 2012 Launch of SAF FreeMile 5.8 GHz MIMO SAF Tehnika unveils exclusive 5 year warranty to all CFIP Lumina full outdoor radios www.saftehnika.com www.saf‐lastmile.com
SAF Tehnika Yearbook 2011/12
4
SAF Tehnika Management Board
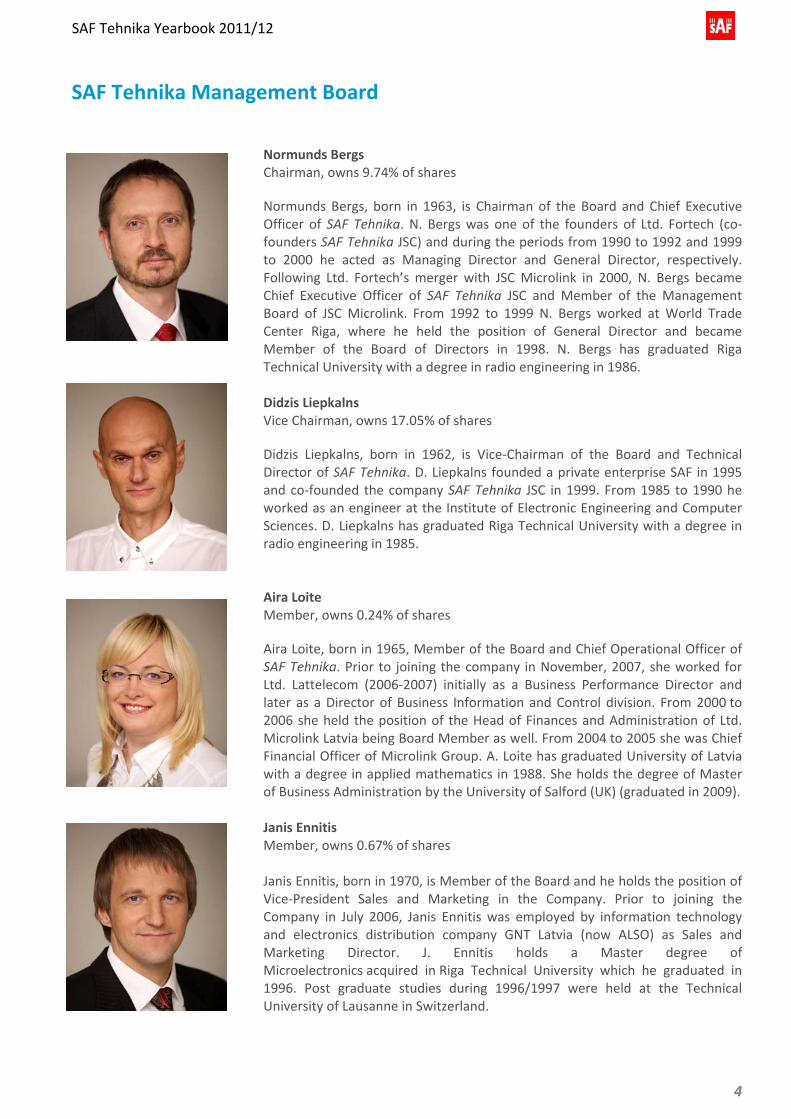
Normunds Bergs Chairman, owns 9.74% of shares
Normunds Bergs, born in 1963, is Chairman of the Board and Chief Executive Officer of SAF Tehnika. N. Bergs was one of the founders of Ltd. Fortech (co‐founders SAF Tehnika JSC) and during the periods from 1990 to 1992 and 1999 to 2000 he acted as Managing Director and General Director, respectively. Following Ltd. Fortech’s merger with JSC Microlink in 2000, N. Bergs became Chief Executive Officer of SAF Tehnika JSC and Member of the Management Board of JSC Microlink. From 1992 to 1999 N. Bergs worked at World Trade Center Riga, where he held the position of General Director and became Member of the Board of Directors in 1998. N. Bergs has graduated Riga Technical University with a degree in radio engineering in 1986. Didzis Liepkalns Vice Chairman, owns 17.05% of shares
Didzis Liepkalns, born in 1962, is Vice‐Chairman of the Board and Technical Director of SAF Tehnika. D. Liepkalns founded a private enterprise SAF in 1995 and co‐founded the company SAF Tehnika JSC in 1999. From 1985 to 1990 he worked as an engineer at the Institute of Electronic Engineering and Computer Sciences. D. Liepkalns has graduated Riga Technical University with a degree in radio engineering in 1985.
Aira Loite Member, owns 0.24% of shares
Aira Loite, born in 1965, Member of the Board and Chief Operational Officer of SAF Tehnika. Prior to joining the company in November, 2007, she worked for Ltd. Lattelecom (2006‐2007) initially as a Business Performance Director and later as a Director of Business Information and Control division. From 2000 to 2006 she held the position of the Head of Finances and Administration of Ltd. Microlink Latvia being Board Member as well. From 2004 to 2005 she was Chief Financial Officer of Microlink Group. A. Loite has graduated University of Latvia with a degree in applied mathematics in 1988. She holds the degree of Master of Business Administration by the University of Salford (UK) (graduated in 2009). Janis Ennitis Member, owns 0.67% of shares Janis Ennitis, born in 1970, is Member of the Board and he holds the position of Vice‐President Sales and Marketing in the Company. Prior to joining the Company in July 2006, Janis Ennitis was employed by information technology and electronics distribution company GNT Latvia (now ALSO) as Sales and Marketing Director. J. Ennitis holds a Master degree of Microelectronics acquired in Riga Technical University which he graduated in 1996. Post graduate studies during 1996/1997 were held at the Technical University of Lausanne in Switzerland.
SAF Tehnika Yearbook 2011/12
5
SAF Tehnika Supervisory Council
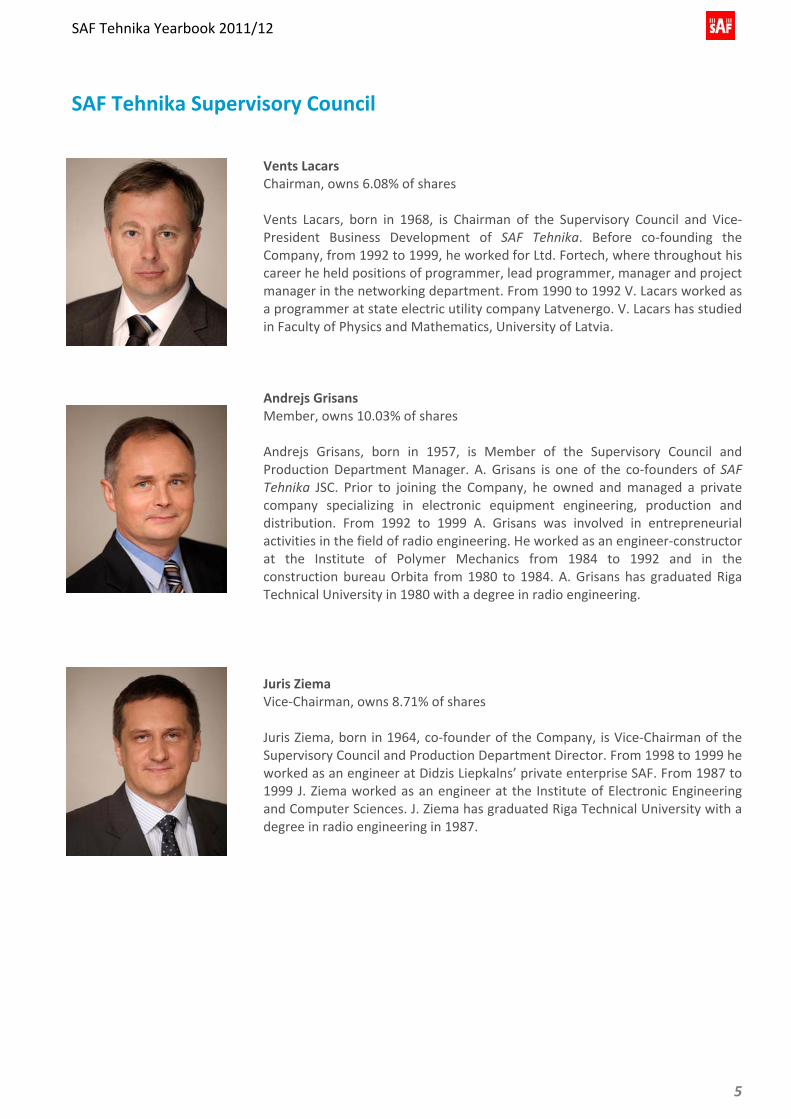
Vents Lacars Chairman, owns 6.08% of shares Vents Lacars, born in 1968, is Chairman of the Supervisory Council and Vice‐President Business Development of SAF Tehnika. Before co‐founding the Company, from 1992 to 1999, he worked for Ltd. Fortech, where throughout his career he held positions of programmer, lead programmer, manager and project manager in the networking department. From 1990 to 1992 V. Lacars worked as a programmer at state electric utility company Latvenergo. V. Lacars has studied in Faculty of Physics and Mathematics, University of Latvia. Andrejs Grisans Member, owns 10.03% of shares Andrejs Grisans, born in 1957, is Member of the Supervisory Council and Production Department Manager. A. Grisans is one of the co‐founders of SAF Tehnika JSC. Prior to joining the Company, he owned and managed a private company specializing in electronic equipment engineering, production and distribution. From 1992 to 1999 A. Grisans was involved in entrepreneurial activities in the field of radio engineering. He worked as an engineer‐constructor at the Institute of Polymer Mechanics from 1984 to 1992 and in the construction bureau Orbita from 1980 to 1984. A. Grisans has graduated Riga Technical University in 1980 with a degree in radio engineering.
Juris Ziema Vice‐Chairman, owns 8.71% of shares Juris Ziema, born in 1964, co‐founder of the Company, is Vice‐Chairman of the Supervisory Council and Production Department Director. From 1998 to 1999 he worked as an engineer at Didzis Liepkalns’ private enterprise SAF. From 1987 to 1999 J. Ziema worked as an engineer at the Institute of Electronic Engineering and Computer Sciences. J. Ziema has graduated Riga Technical University with a degree in radio engineering in 1987.
SAF Tehnika Yearbook 2011/12
6
SAF Tehnika Supervisory Council (continued)
Ivars Senbergs Member, owns 4.79% of shares Ivars Senbergs born in 1962, Member of the Supervisory Council, also Chairman of the Board of SIA Juridiskais Audits, SIA Namipasumu parvalde, SIA Synergy Consulting, SIA Dzirnavu centrs, SIA IŠMU, SIA "RK Konsultācijas" and Member of the Supervisory Council of AS MFS bookkeeping. From 1999 until 2000 he worked as Finance and Administrative Director at SIA Fortech. I. Senbergs has graduated Faculty of Law, University of Latvia in 1986. Juris Imaks Member since July 12, 2010 till November 11, 2011 Juris Imaks, born in 1971, worked for Latvijas Hipotēku un zemes banka from 1997 up to 2002 as the Head of the Securities trading department. J. Imaks held the office of the Member of the Supervisory Council in the Regulator of public services of the Riga municipality (2005‐2007), Ltd. Rīgas nami (2005‐2009), RSK (2007‐2009), but in Ltd. Latvijas Garantiju aģentūra he held the office of the Chairman of the Supervisory Council (2008‐2009). J. Imaks has graduated University of Latvia, Faculty of Economics and Management in 1994 as the Engineer‐Economist, but since 2004 he holds the Master's degree in Business Management in University of Latvia.
SAF Tehnika Yearbook 2011/12
7
Interest of members of the Management and Supervisory Council in other companies
Normunds Bergs • Member of the Board of Latvian Electrical
Engineering and Electronics Industry Association (LEtERA)
• Member of the Management Board of SIA “Namīpašumu pārvalde”
• Chairman of the Supervisory Council of SIA “LEO pētījumu centrs”
• Member of the Management Board of SIA „Real Sound Lab”
• Member of the Management Board Society „Connect Latvija”
• Member of the Supervisory Council SIA „LEITC”
• Member of the Supervisory Council SIA „Stream Networks”
• Valdemāra 9; Dzīvokļu īpašnieku biedrība, founder
• Shareholder of SIA “CityCredit”, owns 40.00% of the shares
• Shareholder of SIA “FMS Group”, owns 27.50% of the shares
• Shareholder of SIA “TCon”, owns 26.00% of the shares
• Shareholder of UAB “Fortek IT”, owns 26.00% of the shares
• Shareholder of SIA “CPS”, owns 18.00% of the shares
• Shareholder of SIA “Ecommerce Accelerator”, owns 22.50% of the shares
• Shareholder of SIA “Ūbeļu īpašumi”, owns 21.21% of the shares
• Shareholder of SIA “Real Sound Lab”, owns 8.00% of the shares
• Shareholder of SIA “Namīpašumu Pārvalde”, owns 40.00% of the shares
• Shareholder of SIA “Complete Payment System”, owns 18.00% of the shares
• Shareholder of UAB “Baltijos kompiuterių akademijos”, owns 33.00% of the shares
• Shareholder of OÜ “Cherry Media”, owns 70 shares
Janis Ennitis • Shareholder of SIA “Pakards”, owns 33.33% of
the shares • Shareholder of SIA “Auto Mikss”, owns 25.00%
of the shares Ivars Senbergs • Chairman of the Management Board of SIA
“Juridiskais Audits”, owns 58.62% of the shares • Chairman of the Management Board of SIA
“Namīpašumu pārvalde”, owns 30.00% of the shares
• Member of the Supervisory Council of JSC “MFS bookkeeping”
• Shareholder of SIA “Namservisa Aģentūra”, owns 49.00% of the shares
• Shareholder of SIA “Arhitekta K.Rukuta Birojs”, owns 5.12% of the shares
• Chairman of the Management Board of SIA “Synergy Consulting”, owns 100.00% of the shares
• Chairman of the Management Board of SIA “Dzirnavu centrs”, owns 85.71% of the shares
• Chairman of the Management Board of SIA “IŠMU”, owns 100.00% of the shares
• Chairman of the Management Board of SIA “RK Konsultācijas”, owns 100.00% of the shares
• Shareholder of SIA “Citikon”, owns 0.10% of the shares
• Shareholder of SIA “IT4B”, owns 60.00% of the shares
• Shareholder of SIA “Whitenet”, owns 65.00% of the shares
• Shareholder of SIA “Ūbeļu īpašumi”, owns 2.12% of the shares
• Shareholder of SIA “PRO 1 Service”, owns 100% of the shares
• Shareholder of SIA “PRO 1 Stage”, owns 100% of the shares
Vents Lacars • Member of the Management Board of Latvian
Multihull Yacht Association
SAF Tehnika Yearbook 2011/12
8
Management Report
Line of business The core business activity of SAF Tehnika (hereinafter – the Group) comprises the design, production and distribution of digital microwave transmission equipment. The Group offers comprehensive and cost‐effective solutions of wireless broadband connections for digital transmission of voice and data to the operators of fixed and mobile networks and providers of data transmission both in the public and private sector as an alternative to cable channels.
Activities during the reporting year Net turnover of the Group in the 2011/ 2012 financial year was LVL 9.64 million (EUR 13.71 million) which represents a decrease by 12% comparing to the previous financial year. Export represented 96.15% of turnover amounting to LVL 9.27 million (EUR 13.19 million). During the reporting period the products of the Group were exported to 82 countries in the world, five of which received the products of SAF for the first time. The Americas region continues to demonstrate positive trends. Turnover of the region in comparison with the previous financial year increased by 10% reaching LVL 3.3 million (EUR 4.7 million) and representing 34% of the total Group’s turnover during the reporting year. SAF North America, the US Subsidiary of SAF Tehnika, provided additional flexibility with regard to the availability of SAF products and cooperation with clients. Nevertheless, despite the fact that the number of SAF equipment units sold was higher than previously, stiff competition was the reason the prices were reduced; this had a direct effect on the growth of the regional turnover making it slower than expected. The manufacture of CFIP Lumina products in Brazil reached the planned optimum amount proving that the strategic decision of establishing the manufacturing arrangement in a promising yet very protected market was correct, as the status of a local manufacturer and the already achieved brand recognition have contributed to an increased interest about the products of SAF in the Brazilian market. During the following quarters, we expect the availability and delivery terms of the CFIP Lumina products to the clients of this region to improve considerably. At the same time, our turnover in Asia, Middle East and Africa decreased and revenue generated from the region represented only 28% of the total revenue of the Group. It may be explained by the fact that in 2011/ 2012 the Group did not have such large projects in this region as it did in the financial year 2010/ 2011, however, intensive cooperation with the existing and potential clients continued and there still was interest in the products of SAF Tehnika. This year we had successful cooperation with the two clients from Africa whose payments were delayed due to liquidity problems and the Group was required to recognize a significant amount of allowances for bad debts in the last year. The largest part of the debt was covered and the cooperation is continuing. The income generated from Europe and the CIS slightly decreased; nevertheless, the sales were material for the Group and amounted to 38% of the annual revenue. In order to strengthen the brand recognition of SAF, to promote products and develop the network of buyers and partners, SAF Tehnika JSC participated in international and regional exhibitions both individually and together with local partners. In particular we participated in exhibitions and various events in the USA focusing on the segment of data transmission companies (ISP). The following events should be noted: Comptel Plus2011, 4GWorld 2011, ISC West 2012 (LasVegas, Nevada), CTIA Wireless 2012 (New Orleans, LA), Animal Farm 2012 (Salt Lake City, UT), ISP America 2012 (Lake Buena Vista, FL). The most significant events in other regions include NigeriaCom 2011 (Lagos, Nigeria), AfricaCom 2011 (Cape Town, Republic of South Africa), CeBIT 2012 (Hannover, Germany). SAF Tehnika JSC expresses its gratitude to the Latvian Investment and Development
SAF Tehnika Yearbook 2011/12
9
Management Report (continued)
Activities during the reporting year (continued) Agency and the European Regional Development Fund that co‐financed the participation in the exhibitions during the reporting year.
AS a testimony to the high quality of SAF products and solutions the Group is the first in the industry sector to provide a five year warranty period for the CFIP Lumina full outdoor radios and antennas delivered in Europe and North America starting from March 2012. The Group continued developing various tools useful for the clients’ cooperation with SAF and use of SAF products. For example, the internet shop www.saf‐lastmile.com that sells SAF FreeMile products, a barcode scanner application for iPhone and Android smart phones in order to identify SAF products quickly, various functional improvements in the Network Management System, updates of the SAF FreeMile path calculator. The CFIP product line reinforced its position as the main product line in the portfolio of SAF manufactured products. The Group’s clients appeared to be strongly interested in the products of unlicensed frequencies, which translated in increased sales of the FreeMile product line. During the reporting year revenues have quintupled compared to the previous year. The demand for the products of the CFM product line continued to decrease confirming that the product line was approaching the phase when the Group would discontinue it. Assessing the results of 2011/ 2012, in appreciation of the high loyalty of employees, the level of their remuneration and contribution to the financial results of the Parent company, as well as the situation in the labour market the management decided to pay bonuses to staff. The financial result of 2011/ 2012 was a profit of LVL 608 thousand (EUR 865 thousand) representing 76% of the profit of the previous year. SAF Tehnika JSC has retained financial stability. The audited net cash flows of the Group for 12 months were positive and amounted to LVL 180 thousand (EUR 257 thousand). In November 2011, the Group paid out dividends of LVL 0.23 per share amounting to LVL 683 thousand in total. During the reporting year the Group made investments in the amount of LVL 254 thousand (EUR 361 thousand) to acquire production and research equipment, software and IT infrastructure in order to improve the manufacturing, research and testing processes, as well as invested in the products certification. Expenses of staff training were significantly larger than last year in order to acquire or develop competences in various technical areas, management and communication skills, as well as foreign language skills – LVL 41 thousand (EUR 58 thousand).
Research and development During the reporting year the Group continued developing its main product line in the licensed frequencies – CFIP where the main sources of income were CFIP Lumina and Phoenix, and CFIP Marathon, the product with the largest product niche potential, as well as the newest product line in the unlicensed frequencies – CFIP FreeMile. The range of frequencies available in each product line was broadened, the performance of products was improved and solutions were offered to improve the production process and reduce the cost of products. Significant resources were dedicated to the development of new generation products suitable for LTE networks and the goal is to present prototypes of these products in 2013.
SAF Tehnika Yearbook 2011/12
10
Management Report (continued)
Research and development (continued) The comparatively small but professional, creative and client‐oriented engineer team achieved good results developing various modifications of the existing products thus creating solutions for the needs and requirements of specific clients. Future perspectives The strategy of SAF Tehnika JSC has not changed. The Group continues working on a number of research and development projects focusing on the development of new next generation microwave data transmission equipment and improvement of the functionality of the existing products and solutions in order to adapt them to specific requirements of the niche clients. In order to be closer to the clients in regions and countries with increasing demand for the products of SAF, the Group is considering opening representative offices, establishing joint ventures or subsidiaries. SAF Tehnika has proved itself to be a financially stable company capable of surviving market fluctuations; however, the results of the next periods will largely depend on external factors such as investments in client networks as well as the situation in global economy. Although the Group views its market perspective to be rather consistent, due to the continuous instability of the world financial and telecommunication markets, the management feels it appropriate to refrain from providing specific estimates of its revenue and net financial results.
________________________________ Normunds Bergs Chairman of the Board
___________________________________ Didzis Liepkalns Deputy Chairman of the Board
________________________________ Aira Loite Board Member
___________________________________ Janis Ennitis Board Member
Riga, 29 October 2012
SAF Tehnika Yearbook 2011/12
11
Statement of the Board’s responsibilities
The Board of SAF Tehnika JSC (hereinafter – the Parent) is responsible for preparing the consolidated financial statements of the Parent and its subsidiaries (hereinafter ‐ the Group). The consolidated financial statements set out on pages 27 ‐ 62 are prepared in accordance with the source documents and present fairly the consolidated financial position of the Group as at 30 June 2012 and the consolidated results of its financial performance and cash flows for the year then ended. The above mentioned financial statements are prepared in accordance with International Financial Reporting Standards as adopted by the European Union, and are prepared on a going concern basis. Appropriate accounting policies have been applied on a consistent basis. Prudent and reasonable judgements and estimates have been made by the management in the preparation of the financial statements. The Board of SAF Tehnika JSC is responsible for the maintenance of proper accounting records, the safeguarding of the Group’s assets and the prevention and detection of fraud and other irregularities in the Group. The Board is responsible for compliance with the requirements of normative acts of the countries the Group operates in (Latvia and United States of America). On behalf of the Board:, ________________________________ Normunds Bergs Chairman of the Board
___________________________________ Didzis Liepkalns Deputy Chairman of the Board
________________________________ Aira Loite Board Member
___________________________________ Janis Ennitis Board Member
Riga, 29 October 2012
SAF Tehnika Yearbook 2011/12
12
Supervisory Council report
In opinion of Supervisory Council the JSC SAF Tehnika (hereinafter Company) has succeed to achieve the main targets set for the Company in financial year 2011/2012. All divisions of the Company contributed the improved efficiency, even though financial results call for reevaluation of targets and strategies for next financial year. Supervisory Council is encouraging the Board of the Company to emphasize the importance of fulfillment of product development plans, in order to assist and advance the positive trends in improving the position of the Company in key markets. During financial year 2011/2012 Supervisory Council exercised the functions of Revision Committee according to the laws in force and after completion of all the tasks can come to following conclusions: • Preparation of the financial statement was performed in accordance with the present International Financial Reporting Standards and International Accounting Standards; • Systems of internal control and risk management operate as well as business operations of the Company require it; • Examination of annual report was made in accordance with the present Auditing Standards. Corrections of drawbacks established during the examination were performed accordingly; • Supervisory Council has not established any fact which would give a ground to doubt the impartiality of the auditor selected for the examination of annual report from FY 2011/2012. Vents Lacars Chairman of the Supervisory Council Riga, 29th October 2012
SAF Tehnika Yearbook 2011/12
13
Personnel
JSC SAF Tehnika believes that the driving force of its success and the greatest asset is the company’s professional and highly skilled employees. The company had an average of 165 employees in the fiscal year. This year, our team has welcomed a number of new talented employees, who are successfully combining their current studies at institutions of higher education and development of practical skills and expertise at the company by learning from the company’s leading specialists. JSC SAF Tehnika is the company that cares about its employee’s motivation, growth, workplace safety and maintaining the company’s culture. We are a socially responsible, environmentally friendly and growth‐oriented company. Our main values are people, responsibility and quality.
Workplace Safety SAF policy is to be a responsible company that takes care of well‐being of its employees, providing safe, non‐hazardous, and friendly working environment. The company ensures constant supervision of working environment, regular improvement of employees’ knowledge and awareness of occupational health and work safety issues. The company complies with all biding laws and regulations.
Employees Growth and Development We consider it highly significant for employees to grow and develop continuously, to open new horizons. Therefore, SAF Tehnika provides employees with an opportunity to upgrade their qualification at various seminars and trainings by organizing corporate trainings, as well as participating in open education events both in Latvia, and abroad. This year, in co‐operation with Latvian Electrical Engineering and Electronics Industry Association („LEtERA”) and Latvian Chamber of Commerce and Industry (LCCI), we have been involved in a project for facilitating employees’ education and competence co‐funded by the European Social Fund. Within the framework of this project, the company’s employees have improved their English language skills, their expertise in project management, leadership, and communication. Development and Testing departments’ employees have taken part in special technical training programs in Denmark, Germany, and Spain. Employees from different departments regularly participate in product exhibitions abroad, where they seize an opportunity to learn, adopt the best experience from competitors and cooperation partners. It is essential for us to create a strong and mutually supportive team which is able to attend and respond to the customers’ requests promptly and professionally. We organize and support such activities of SAF employees that facilitate their internal cooperation, as well as promote communication and team building. We are in favor of initiative and personal growth of each employee!
SAF Tehnika Yearbook 2011/12
14
Personnel (continued)
Remuneration and Benefits JSC SAF Tehnika is a socially responsible company, which fully complies with labor law requirements. In addition to a fixed remuneration, SAF provides its employees with a bonus system, which is based on individual and corporate achievements. This financial year, 16.03 % of the annual salary fund has been paid to bonuses. To encourage professional development of employees, the annual performance development discussions are held by the company. According to results of discussions, the company defines employee’s professional training needs and career development prospects, as well as revises the salary of an employee. On special occasions like getting married and giving birth to a child, each employee receives a financial support along with good wishes from the company. September 1 is a compensated holiday for parents of children who begin their school studies in the first grade. Employees who have been working for the company for 5 and more years get an extra compensated holiday in addition to their annual vacation. SAF cares about its employees’ health and organizes regular vaccinations, eye sight tests, and mandatory health checks in the company’s premises, as well as provides employees with health insurance policies.
Leisure Activities According to the annual tradition, employees are offered such leisure activities as a New Year’s Party and the Summer Activities event. This year, our employees have participated actively in the New Year’s masked ball having disguised themselves as fairy‐tale characters. There have been plenty of imps and princesses, a couple of wolves and Little Red Riding Hoods, and even a dragon. Thus, even though being a company of a technological nature, our employees surely do not lack creative imagination. In addition, the company has organized a series of photo contests where the employees have had another opportunity to express themselves creatively. They have submitted a variety of wonderful pictures, the best of which now decorate the walls of the company’s office. In the middle of August, despite the changeable weather conditions, we were actively involved in the company’s sport games, playing traditional football and beach volleyball, as well as solving various logical tasks. Our employees enjoy relaxing both at company‐wide events and team outings with their fellow co‐workers bicycling or boating. It is a wonderful opportunity to build strong and friendly teams, and to encourage loyal attitude towards the company. Day after day, SAF Tehnika consolidates its reputation as an employer, which is proved by low employee turnover, a great number of those who take interest in the announced vacant positions, the increased demand for training places, and the ever growing education level of employees.
SAF Tehnika Yearbook 2011/12
15
Personnel (continued)
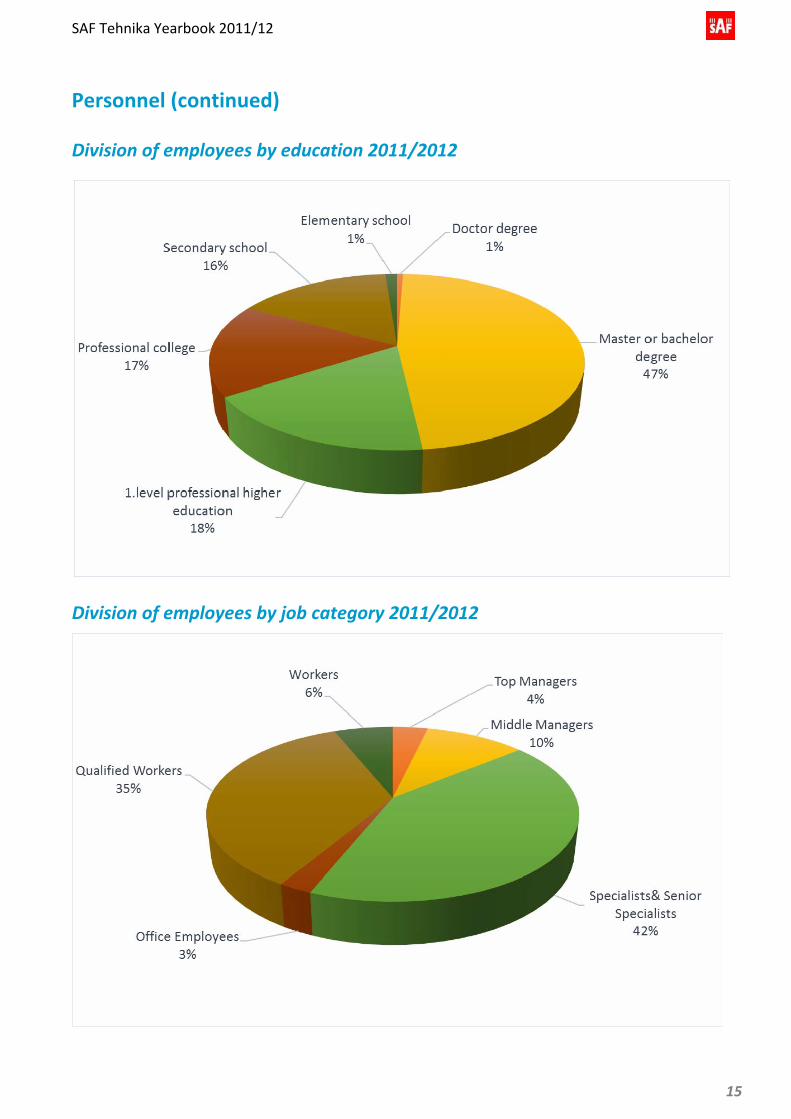
Division of employees by education 2011/2012
Division of employees by job category 2011/2012

SAF Tehnika Yearbook 2011/12
16
Corporate Social Responsibility
Sustainable, convenient and long‐term cooperation with all stakeholder groups – employees, shareholders, clients, partners, state and municipal authorities and society – makes basement for corporate social responsibility of SAF Tehnika JSC. We are looking forward to meet our values in everyday processes and to work responsibly, honestly and professionally.
Cooperation with schools to support talents As a company that is built on the skills and talents of its employees, SAF Tehnika is aware of how important education is to society. The company believes it has the power to unlock personal potential, deliver economic and social transformation, and change individual lives. SAF Tehnika is one of those companies which provide practical support for science and education development. We provide internships for students of higher education technical sciences faculties and professional schools. SAF Tehnika is constantly providing internships for the students from various educational institutions ‐ Ogre State Technical College, Technical College of Riga, Riga Technical University, Latvian University, and Latvian University of Agriculture. The company wants to attract the greatest potential talents on a national level and help perpetuate jobs related to the telecommunications industry. By giving high school students a chance to discover and learn to love the natural sciences, SAF Tehnika hopes to see young Latvians become outstanding engineers ready to meet the economic challenges of the real world. For the fourth year in a row SAF Tehnika has been sponsoring different education related projects. On of them ‐ “Mission Possible” program helps to recruit young, gifted university graduates with excellent leadership qualities to work as teachers for Latvian schools. The goal is to transform children schooldays into a stimulating journey, profoundly meaningful for their future. Since 2009 SAF Tehnika plays its part in an educational ecosystem within the scope of study‐camp „ALFA” in which Latvian educational Olympiad winners and scientific conference winners meet at lectures and practical sessions in four sections ‐ physics, mathematics and informatics, chemistry and biology, and social science. Lessons camp is organized by the Latvian University and Riga Technical University. In 2012 SAF Tehnika has participated also in the State Education Development Agency project "The City of Professions" helping to create informational website. It will give students detailed information about various professions, including the electronics industry. We believe that this will help young people to choose their future profession of high‐tech fields. Besides, as natural Sciences, especially physics are closely related to our business, SAF Tehnika supports those teachers, who break the concept of physics as a boring school subject. We hope this would contribute to the growth of the new generation of scientists, what is essential for Latvia in a long term. As a first time SAF Tehnika rewarded Aldona Alenchik, the teacher of physics from Vecumnieki high school with the Award of Excellence within the framework of the project „Natural Sciences and Mathematics" conducted by the State Education centre. We highly value her wisdom and outstanding work on implementing an innovative learning. In order to ensure efficient knowledge and information exchange with foreign partners, businesspersons, scientists, state officials and students of technological sciences, SAF Tehnika in cooperation with IT Cluster are supporting Riga Information Technology Demonstration Centre (IT Demo Centre) – place also for young and potential technology experts to rise their awareness of IT industry success stories in Latvia. IT Demo Centre was established in spring, 2012.

SAF Tehnika Yearbook 2011/12
17
Corporate Social Responsibility (continued)
Employee engagement SAF Tehnika’s employees are the key to product and client service excellence and to the success and future growth of the company. Company cares about its employees’ motivation, professional growth and workplace safety. As a responsible employer, SAF actively supports the professional development of its employees. Human Resources team deploys a variety of tools to develop talents. Training programs address the needs that have been identified and discussed during annual performance appraisal interviews. In addition to a fixed remuneration, SAF provides its employees with a bonus system, which is based on individual and corporate achievements. SAF is continuously investing in an effort to maintain its solid reputation as an employer, to keep the present trend of low employee turnover. Employees who have been working for the Company for five and more years get an extra compensated holiday as a token of appreciation.
Environmental sustainability Both despite and because of the fact that SAF has a mindset of a global company we’ve always paid the most thorough attention to the environmental impact assessment of our business activities. We are truly dedicated to an environment‐friendly production, and being active in more than 100 countries worldwide we’re fully aware of severe consequences of environmental irresponsibility. Not only does SAF encourage a paper‐free office and the reuse of printed paper, we are also fulfilling packaging, electric and electronic equipment waste management (EC Directive 2002/96/EC) programs in cooperation with Latvijas Zaļais punkts (Green Dot) and Latvijas Zaļas elektrons (Green Electron). Our equipment is designed to be as compact as possible, with power consumption levels that allow it to be powered by alternative energy sources such as solar and wind, and it is produced in full compliance with RoHS Directive (2002/95/EC). In order to increase internal awareness among employees regarding possibilities to decrease paper usage in daily work, SAF is promoting recycling of waste paper. The company gives its share for environmental protection by collecting used paper and sending it to paper mill “Līgatne” for making paper from recycled fibres. Employees of SAF Tehnika took part in extensive environmental clean‐up activity. Aleady the second event took place at the Ķemeri National Park and company’s employees worked together with employees from Pieriga Regional Administration. There was done recovery of the forest trail footbridge near the Dubļukrogs micro‐reserve in Klapkalnciems, the Sloka Lake surroundings and area of at least 200 square meters near the bird‐watching tower have been cleaned up, the same as the footway at least 400 m long of the trail has been restored.
Responsible Sourcing In order to reduce our carbon footprint even more, SAF is aiming at hiring local suppliers as much as possible, and the majority of our international suppliers are leading producers in their field, thus ensuring that these are companies with established environment awareness policies.
SAF Tehnika Yearbook 2011/12
18
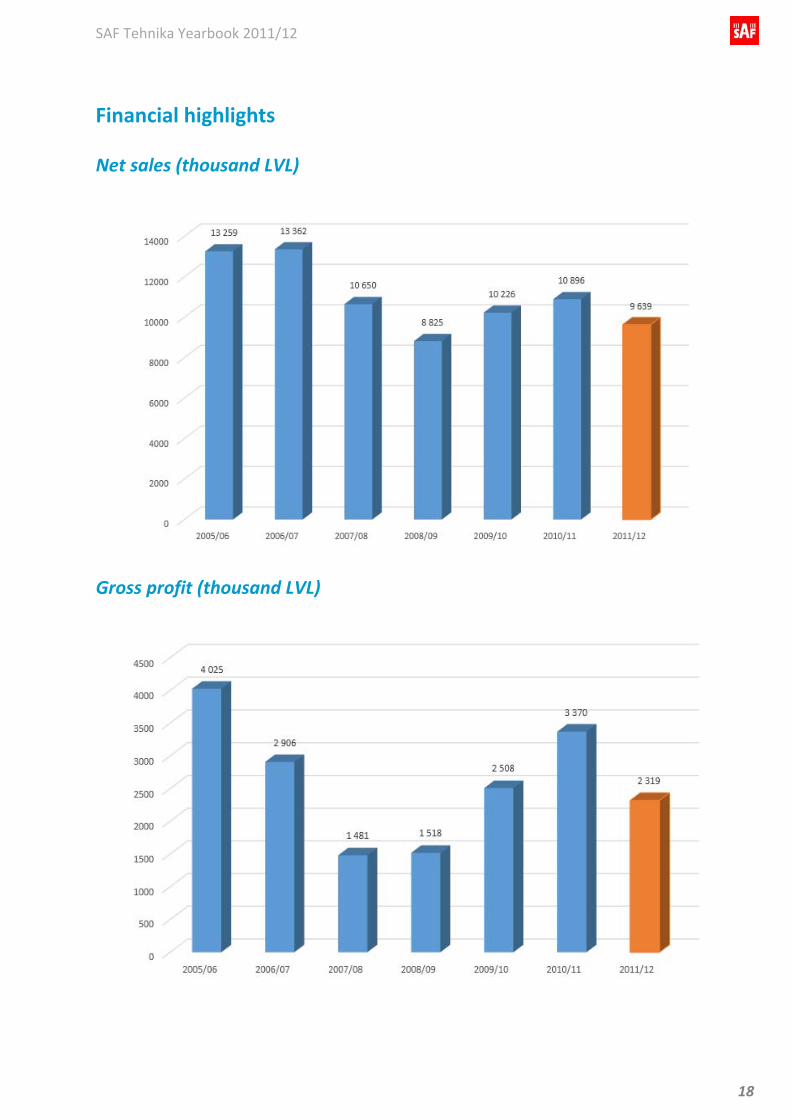
Financial highlights
Net sales (thousand LVL)
Gross profit (thousand LVL)
SAF Tehnika Yearbook 2011/12
19
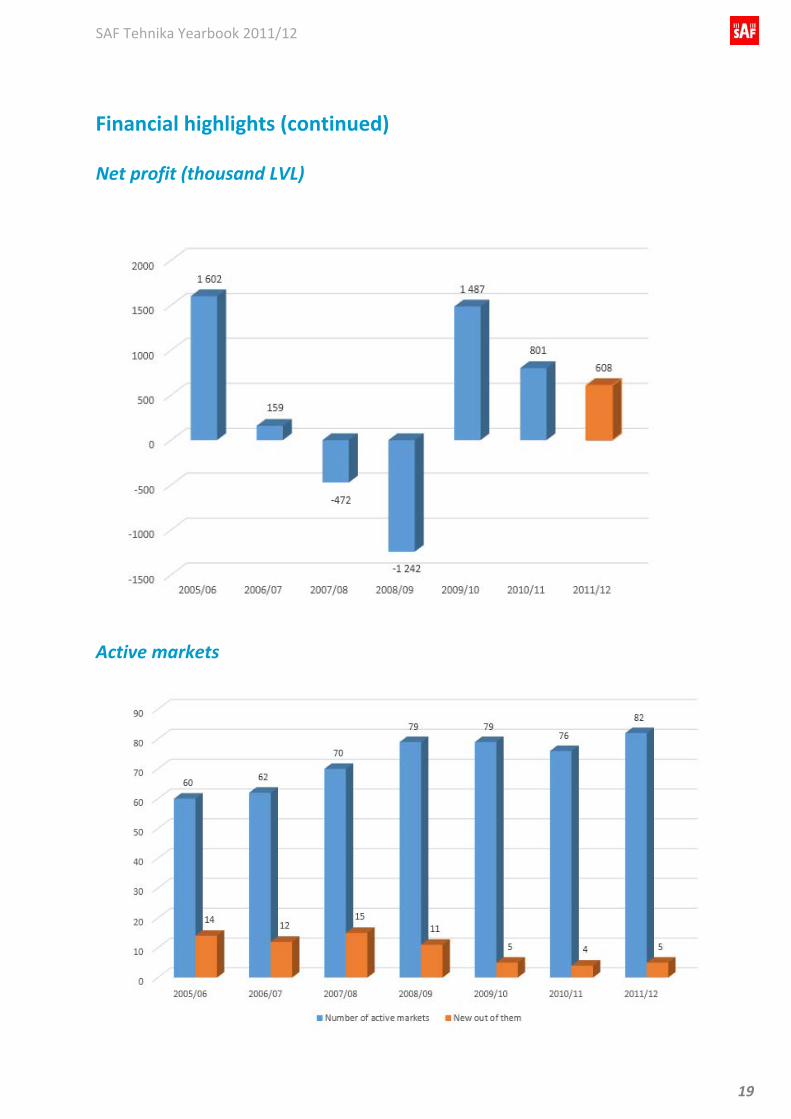
Financial highlights (continued)
Net profit (thousand LVL)
Active markets
SAF Tehnika Yearbook 2011/12
20
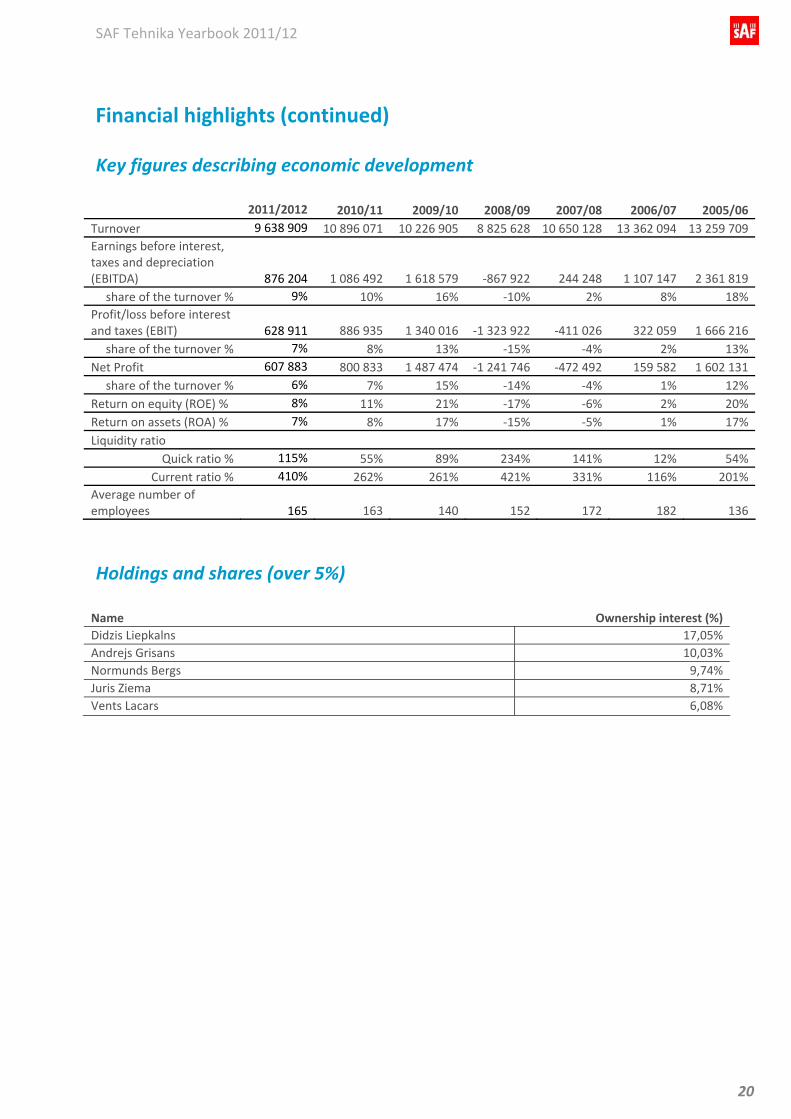
Financial highlights (continued)
Key figures describing economic development
2011/2012 2010/11 2009/10 2008/09 2007/08 2006/07 2005/06 Turnover 9 638 909 10 896 071 10 226 905 8 825 628 10 650 128 13 362 094 13 259 709 Earnings before interest, taxes and depreciation (EBITDA)
876 204 1 086 492 1 618 579 ‐867 922 244 248 1 107 147 2 361 819 share of the turnover % 9% 10% 16% ‐10% 2% 8% 18%
Profit/loss before interest and taxes (EBIT)
628 911 886 935 1 340 016 ‐1 323 922 ‐411 026 322 059 1 666 216
share of the turnover % 7% 8% 13% ‐15% ‐4% 2% 13% Net Profit 607 883 800 833 1 487 474 ‐1 241 746 ‐472 492 159 582 1 602 131
share of the turnover % 6% 7% 15% ‐14% ‐4% 1% 12% Return on equity (ROE) % 8% 11% 21% ‐17% ‐6% 2% 20% Return on assets (ROA) % 7% 8% 17% ‐15% ‐5% 1% 17% Liquidity ratio
Quick ratio % 115% 55% 89% 234% 141% 12% 54% Current ratio % 410% 262% 261% 421% 331% 116% 201%
Average number of employees
165 163 140 152 172 182 136
Holdings and shares (over 5%)
Name Ownership interest (%) Didzis Liepkalns 17,05% Andrejs Grisans 10,03% Normunds Bergs 9,74% Juris Ziema 8,71% Vents Lacars 6,08%
SAF Tehnika Yearbook 2011/12
21
Financial highlights (continued)
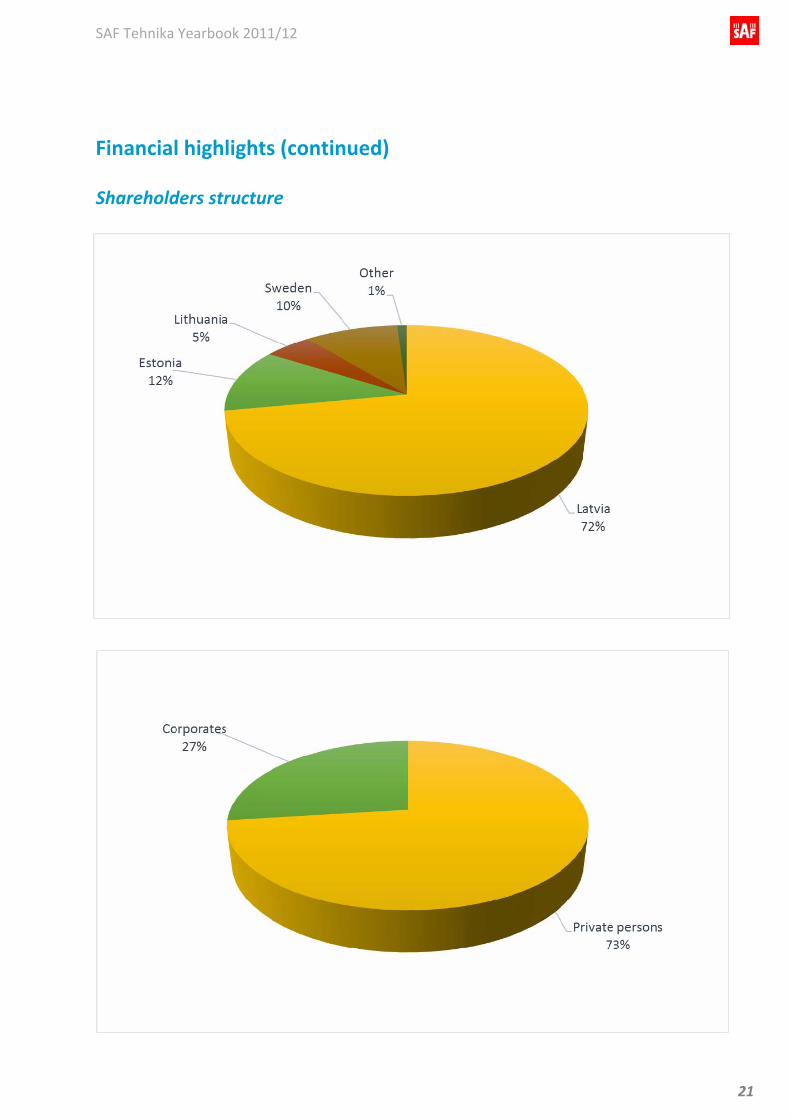
Shareholders structure
SAF Tehnika Yearbook 2011/12
22
Financial highlights (continued)
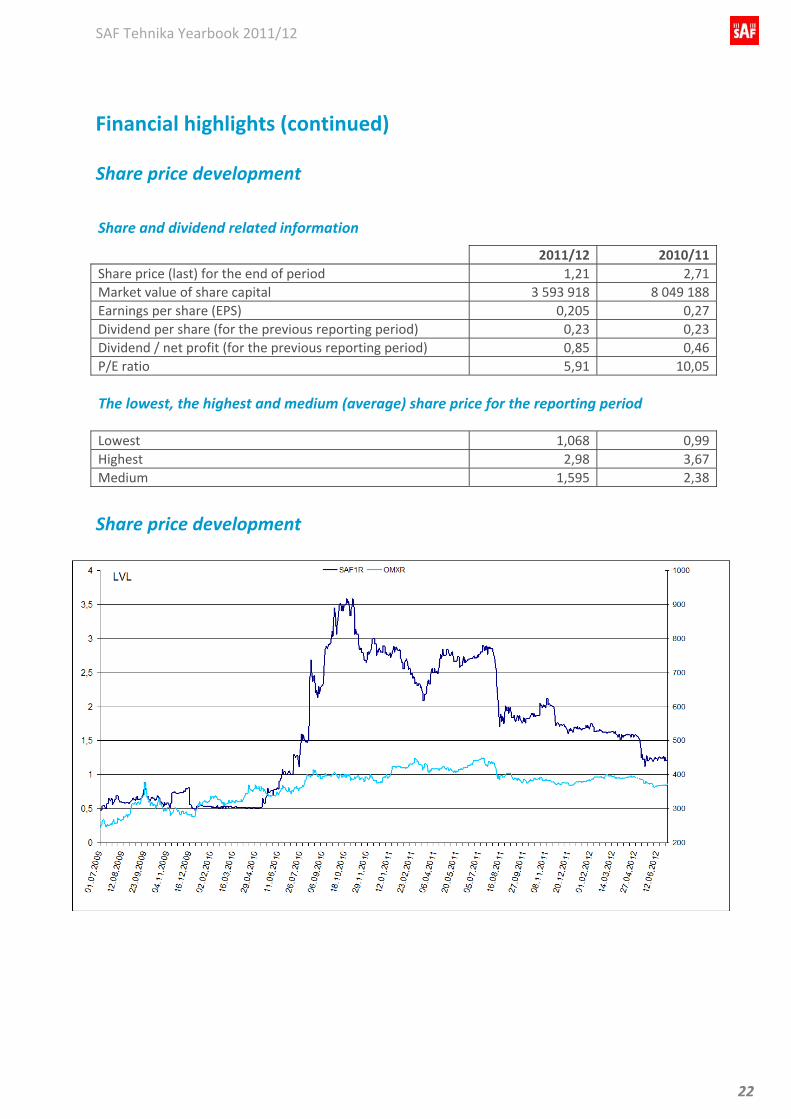
Share price development
Share price development
.
Share and dividend related information
2011/12 2010/11Share price (last) for the end of period 1,21 2,71Market value of share capital 3 593 918 8 049 188Earnings per share (EPS) 0,205 0,27Dividend per share (for the previous reporting period) 0,23 0,23Dividend / net profit (for the previous reporting period) 0,85 0,46P/E ratio 5,91 10,05 The lowest, the highest and medium (average) share price for the reporting period Lowest 1,068 0,99Highest 2,98 3,67Medium 1,595 2,38
SAF Tehnika Yearbook 2011/12
23
Financial highlights (continued)
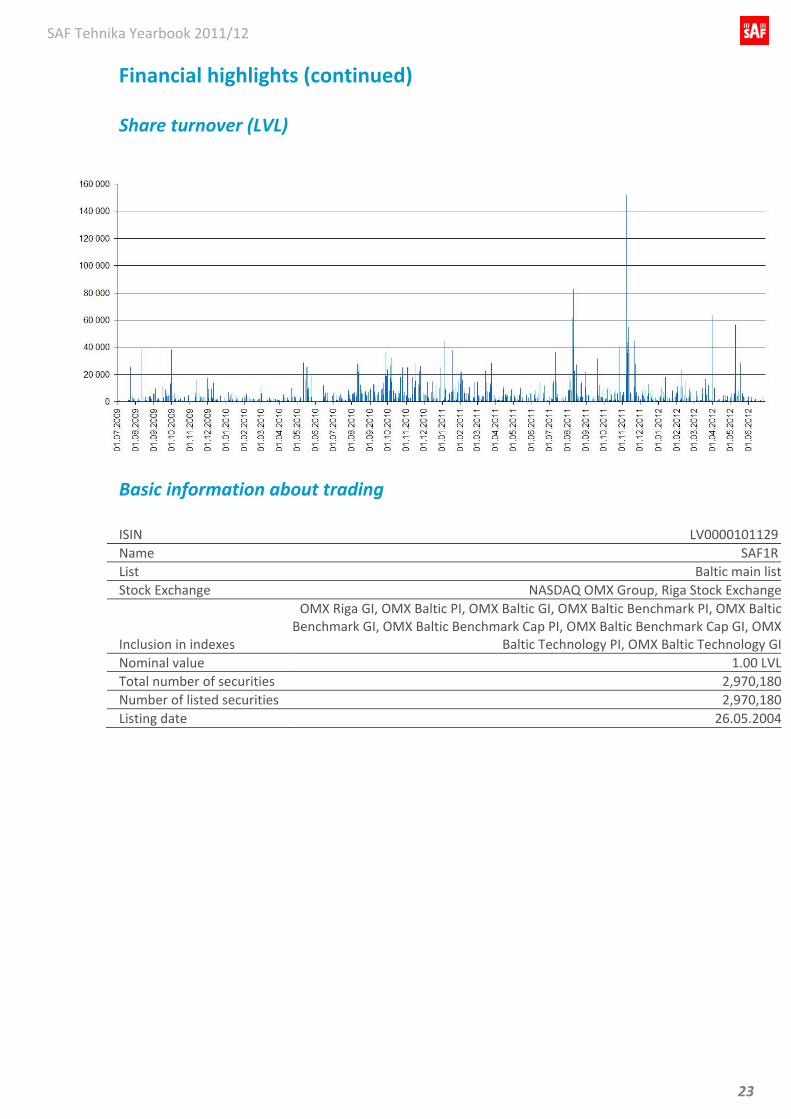
Share turnover (LVL)
Basic information about trading
ISIN LV0000101129 Name SAF1R List Baltic main listStock Exchange NASDAQ OMX Group, Riga Stock Exchange
Inclusion in indexes
OMX Riga GI, OMX Baltic PI, OMX Baltic GI, OMX Baltic Benchmark PI, OMX BalticBenchmark GI, OMX Baltic Benchmark Cap PI, OMX Baltic Benchmark Cap GI, OMX
Baltic Technology PI, OMX Baltic Technology GINominal value 1.00 LVLTotal number of securities 2,970,180Number of listed securities 2,970,180Listing date 26.05.2004
SAF Tehnika Yearbook 2011/12
24
Corporate governance
In the accounting period SAF Tehnika JSC has followed the principles of good corporate governance Selected principles from SAF Tehnika Corporate Governance report.
Shareholders’ meetings Shareholders exercise their right to participate in the management of SAF Tehnika JSC at Shareholders’ meetings. According to the laws in force, SAF Tehnika JSC calls the annual Shareholders’ meeting at least once a year. Extraordinary Shareholders’ meetings are called per necessity. All shareholders have equal rights to participate in the management of SAF Tehnika JSC. They are entitled to participate at Shareholders’ meetings and to receive information that shareholders need in order to make decisions. Only Shareholders’ meeting can amend the Articles of association.
Selection methods of Management Board and Supervisory Council According to the Commercial law of Latvia and the Articles of association of SAF Tehnika JSC its Supervisory Council consists of five members and is elected by Shareholders’ meeting for the term of three years. For its part, Management Board consists of four members and is elected by Supervisory Council for a term of three years. Management Board members must meet the criteria approved by Supervisory Council. Chairman of the Management Board is nominated by Supervisory Council. Supervisory Council can recall a member of the Management Board if there is a significant ground for that. Member of the Management Board can also leave the post voluntarily at any time.
Powers of the Management Board Powers of the Management Board are set in the Articles of association of SAF Tehnika JSC which are available on SAF website www.saftehnika.com. Management Board represents and manages SAF Tehnika JSC. Members of the Management Board can represent SAF Tehnika each separately. Shareholders’ meeting of SAF Tehnika JSC can not decide upon issues which fall within the competence of Management Board.
Dividend policy SAF Tehnika has not adopted a written dividend policy but the Company has always paid 15% to 50% of net profit in dividends.
Other contractual agreements with auditors SAF Tehnika JSC does not have any other contractual agreement with auditors ‐ only an auditing agreement.
The Corporate Governance report document can be found on SAF webpage www.saftehnika.com.
SAF Tehnika Yearbook 2011/12
27
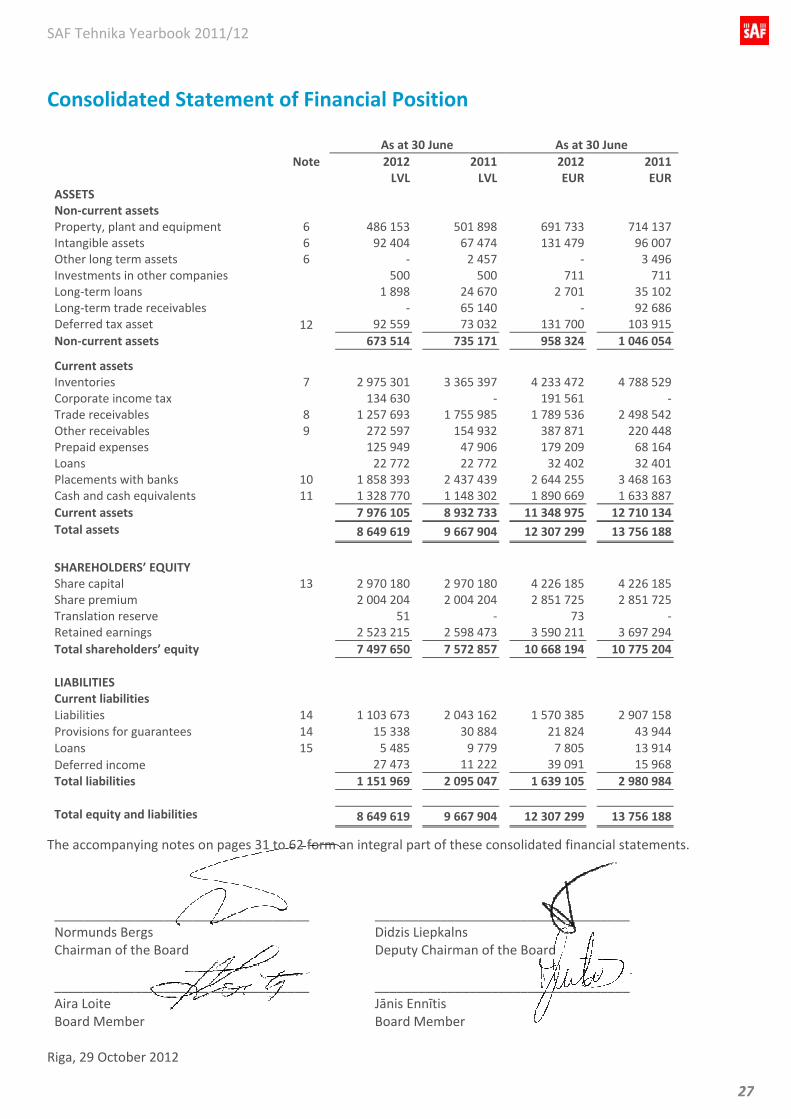
Consolidated Statement of Financial Position
As at 30 June As at 30 June Note 2012 2011 2012 2011 LVL LVL EUR EUR ASSETS Non‐current assets Property, plant and equipment 6 486 153 501 898 691 733 714 137 Intangible assets 6 92 404 67 474 131 479 96 007 Other long term assets 6 ‐ 2 457 ‐ 3 496 Investments in other companies 500 500 711 711 Long‐term loans 1 898 24 670 2 701 35 102 Long‐term trade receivables ‐ 65 140 ‐ 92 686 Deferred tax asset 12 92 559 73 032 131 700 103 915 Non‐current assets 673 514 735 171 958 324 1 046 054
Current assets Inventories 7 2 975 301 3 365 397 4 233 472 4 788 529 Corporate income tax 134 630 ‐ 191 561 ‐ Trade receivables 8 1 257 693 1 755 985 1 789 536 2 498 542 Other receivables 9 272 597 154 932 387 871 220 448 Prepaid expenses 125 949 47 906 179 209 68 164 Loans 22 772 22 772 32 402 32 401 Placements with banks 10 1 858 393 2 437 439 2 644 255 3 468 163 Cash and cash equivalents 11 1 328 770 1 148 302 1 890 669 1 633 887 Current assets 7 976 105 8 932 733 11 348 975 12 710 134 Total assets 8 649 619 9 667 904 12 307 299 13 756 188
SHAREHOLDERS’ EQUITY Share capital 13 2 970 180 2 970 180 4 226 185 4 226 185 Share premium 2 004 204 2 004 204 2 851 725 2 851 725 Translation reserve 51 ‐ 73 ‐ Retained earnings 2 523 215 2 598 473 3 590 211 3 697 294 Total shareholders’ equity 7 497 650 7 572 857 10 668 194 10 775 204 LIABILITIES Current liabilities Liabilities 14 1 103 673 2 043 162 1 570 385 2 907 158 Provisions for guarantees 14 15 338 30 884 21 824 43 944 Loans 15 5 485 9 779 7 805 13 914 Deferred income 27 473 11 222 39 091 15 968 Total liabilities 1 151 969 2 095 047 1 639 105 2 980 984 Total equity and liabilities 8 649 619 9 667 904 12 307 299 13 756 188
The accompanying notes on pages 31 to 62 form an integral part of these consolidated financial statements.
___________________________________ Normunds Bergs Chairman of the Board
___________________________________ Didzis Liepkalns Deputy Chairman of the Board
___________________________________ Aira Loite Board Member
___________________________________ Jānis Ennītis Board Member
Riga, 29 October 2012
SAF Tehnika Yearbook 2011/12
28
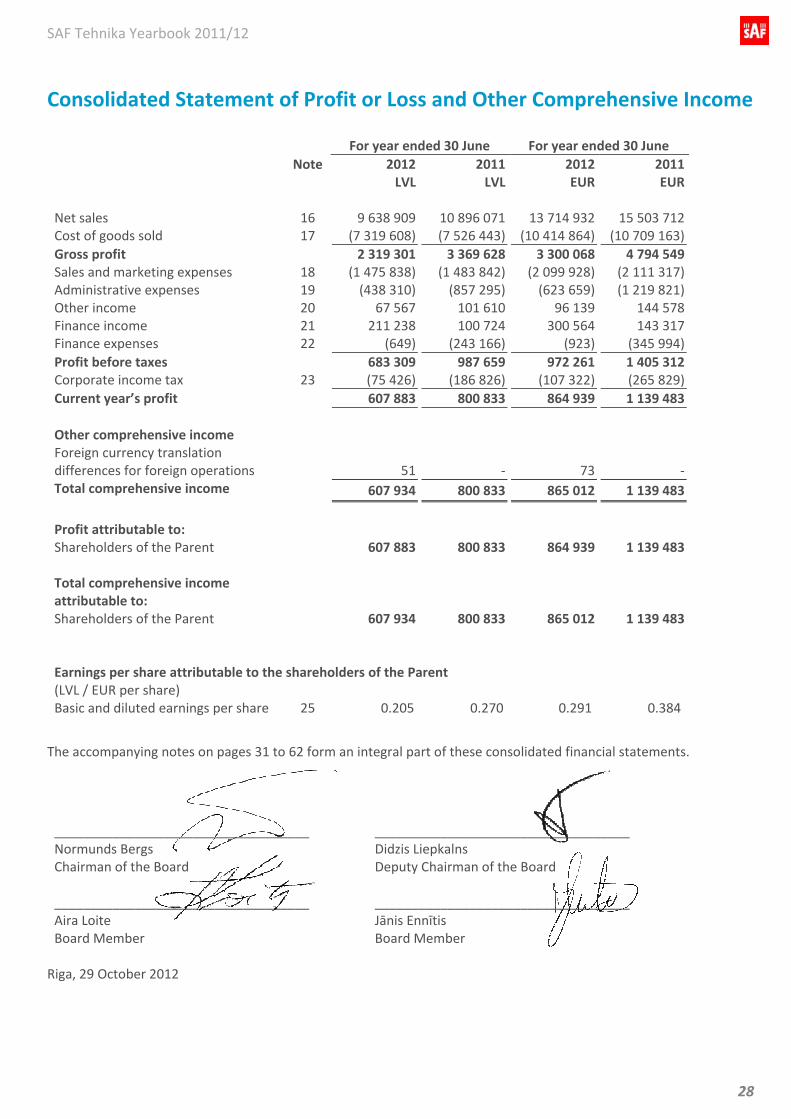
Consolidated Statement of Profit or Loss and Other Comprehensive Income
For year ended 30 June For year ended 30 June Note 2012 2011 2012 2011 LVL LVL EUR EUR Net sales 16 9 638 909 10 896 071 13 714 932 15 503 712Cost of goods sold 17 (7 319 608) (7 526 443) (10 414 864) (10 709 163)Gross profit 2 319 301 3 369 628 3 300 068 4 794 549Sales and marketing expenses 18 (1 475 838) (1 483 842) (2 099 928) (2 111 317)Administrative expenses 19 (438 310) (857 295) (623 659) (1 219 821)Other income 20 67 567 101 610 96 139 144 578Finance income 21 211 238 100 724 300 564 143 317Finance expenses 22 (649) (243 166) (923) (345 994)Profit before taxes 683 309 987 659 972 261 1 405 312Corporate income tax 23 (75 426) (186 826) (107 322) (265 829)Current year’s profit 607 883 800 833 864 939 1 139 483 Other comprehensive income Foreign currency translation differences for foreign operations
51 ‐ 73 ‐
Total comprehensive income 607 934 800 833 865 012 1 139 483
Profit attributable to: Shareholders of the Parent 607 883 800 833 864 939 1 139 483 Total comprehensive income attributable to:
Shareholders of the Parent 607 934 800 833 865 012 1 139 483
Earnings per share attributable to the shareholders of the Parent (LVL / EUR per share)
Basic and diluted earnings per share 25 0.205 0.270 0.291 0.384
The accompanying notes on pages 31 to 62 form an integral part of these consolidated financial statements.
___________________________________ Normunds Bergs Chairman of the Board
___________________________________ Didzis Liepkalns Deputy Chairman of the Board
___________________________________ Aira Loite Board Member
___________________________________ Jānis Ennītis Board Member
Riga, 29 October 2012
SAF Tehnika Yearbook 2011/12
29
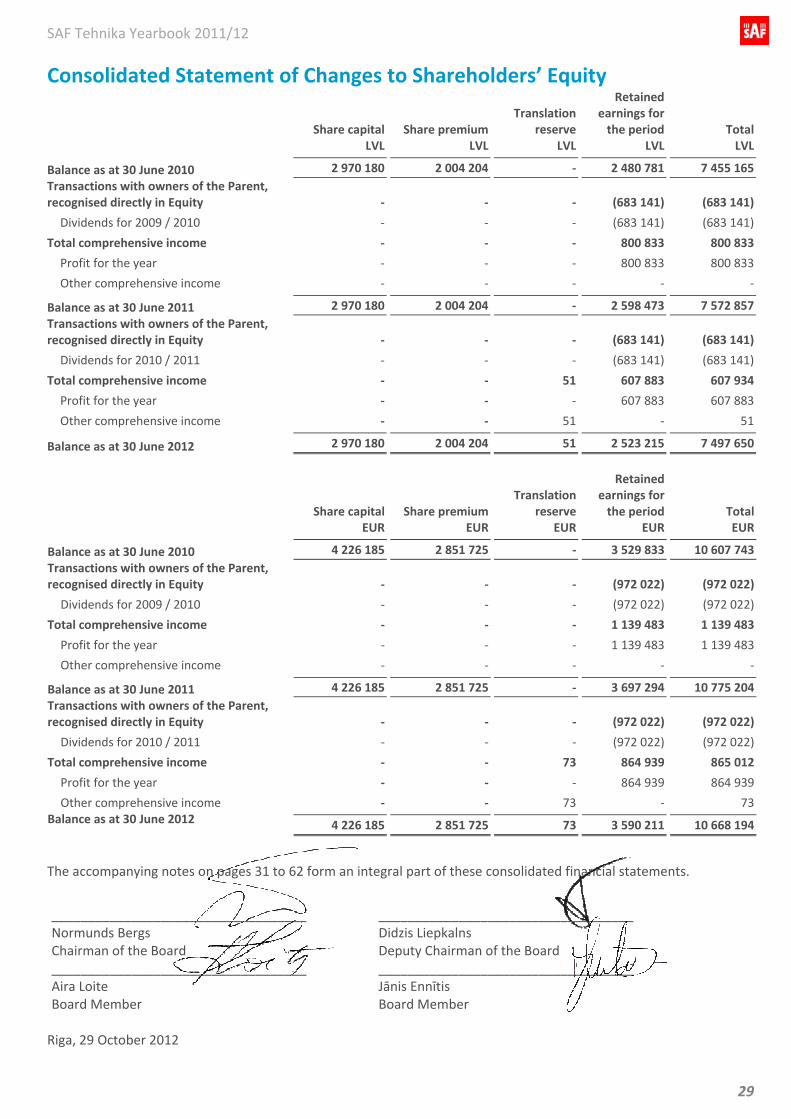
Consolidated Statement of Changes to Shareholders’ Equity
Share capital Share premiumTranslation
reserve
Retained earnings for the period Total
LVL LVL LVL LVL LVL
Balance as at 30 June 2010 2 970 180 2 004 204 ‐ 2 480 781 7 455 165Transactions with owners of the Parent, recognised directly in Equity ‐ ‐ ‐ (683 141) (683 141)
Dividends for 2009 / 2010 ‐ ‐ ‐ (683 141) (683 141)
Total comprehensive income ‐ ‐ ‐ 800 833 800 833
Profit for the year ‐ ‐ ‐ 800 833 800 833
Other comprehensive income ‐ ‐ ‐ ‐ ‐
Balance as at 30 June 2011 2 970 180 2 004 204 ‐ 2 598 473 7 572 857Transactions with owners of the Parent, recognised directly in Equity ‐ ‐ ‐ (683 141) (683 141)
Dividends for 2010 / 2011 ‐ ‐ ‐ (683 141) (683 141)
Total comprehensive income ‐ ‐ 51 607 883 607 934
Profit for the year ‐ ‐ ‐ 607 883 607 883
Other comprehensive income ‐ ‐ 51 ‐ 51
Balance as at 30 June 2012 2 970 180 2 004 204 51 2 523 215 7 497 650
Share capital Share premiumTranslation
reserve
Retained earnings for the period Total
EUR EUR EUR EUR EUR
Balance as at 30 June 2010 4 226 185 2 851 725 ‐ 3 529 833 10 607 743Transactions with owners of the Parent, recognised directly in Equity ‐ ‐ ‐ (972 022) (972 022)
Dividends for 2009 / 2010 ‐ ‐ ‐ (972 022) (972 022)
Total comprehensive income ‐ ‐ ‐ 1 139 483 1 139 483
Profit for the year ‐ ‐ ‐ 1 139 483 1 139 483
Other comprehensive income ‐ ‐ ‐ ‐ ‐
Balance as at 30 June 2011 4 226 185 2 851 725 ‐ 3 697 294 10 775 204Transactions with owners of the Parent, recognised directly in Equity ‐ ‐ ‐ (972 022) (972 022)
Dividends for 2010 / 2011 ‐ ‐ ‐ (972 022) (972 022)
Total comprehensive income ‐ ‐ 73 864 939 865 012
Profit for the year ‐ ‐ ‐ 864 939 864 939
Other comprehensive income ‐ ‐ 73 ‐ 73Balance as at 30 June 2012 4 226 185 2 851 725 73 3 590 211 10 668 194
The accompanying notes on pages 31 to 62 form an integral part of these consolidated financial statements.
___________________________________ Normunds Bergs Chairman of the Board
___________________________________ Didzis Liepkalns Deputy Chairman of the Board
___________________________________ Aira Loite Board Member
___________________________________ Jānis Ennītis Board Member
Riga, 29 October 2012
SAF Tehnika Yearbook 2011/12
30
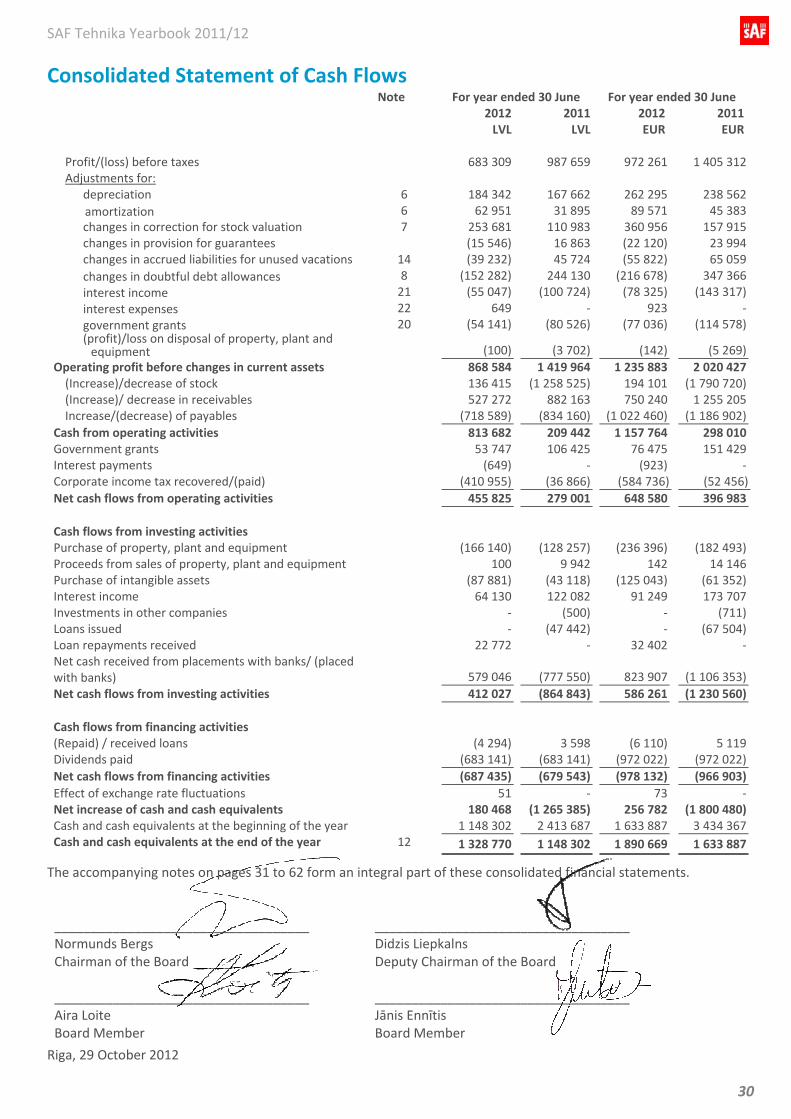
Consolidated Statement of Cash Flows Note For year ended 30 June For year ended 30 June 2012 2011 2012 2011 LVL LVL EUR EUR Profit/(loss) before taxes 683 309 987 659 972 261 1 405 312Adjustments for:
depreciation 6 184 342 167 662 262 295 238 562amortization 6 62 951 31 895 89 571 45 383changes in correction for stock valuation 7 253 681 110 983 360 956 157 915changes in provision for guarantees (15 546) 16 863 (22 120) 23 994changes in accrued liabilities for unused vacations 14 (39 232) 45 724 (55 822) 65 059changes in doubtful debt allowances 8 (152 282) 244 130 (216 678) 347 366interest income 21 (55 047) (100 724) (78 325) (143 317)interest expenses 22 649 ‐ 923 ‐government grants 20 (54 141) (80 526) (77 036) (114 578)(profit)/loss on disposal of property, plant and equipment
(100) (3 702) (142) (5 269)
Operating profit before changes in current assets 868 584 1 419 964 1 235 883 2 020 427(Increase)/decrease of stock 136 415 (1 258 525) 194 101 (1 790 720)(Increase)/ decrease in receivables 527 272 882 163 750 240 1 255 205Increase/(decrease) of payables (718 589) (834 160) (1 022 460) (1 186 902)
Cash from operating activities 813 682 209 442 1 157 764 298 010Government grants 53 747 106 425 76 475 151 429Interest payments (649) ‐ (923) ‐Corporate income tax recovered/(paid) (410 955) (36 866) (584 736) (52 456)Net cash flows from operating activities 455 825 279 001 648 580 396 983 Cash flows from investing activities Purchase of property, plant and equipment (166 140) (128 257) (236 396) (182 493)Proceeds from sales of property, plant and equipment 100 9 942 142 14 146Purchase of intangible assets (87 881) (43 118) (125 043) (61 352)Interest income 64 130 122 082 91 249 173 707Investments in other companies ‐ (500) ‐ (711)Loans issued ‐ (47 442) ‐ (67 504)Loan repayments received 22 772 ‐ 32 402 ‐Net cash received from placements with banks/ (placed with banks)
579 046 (777 550) 823 907 (1 106 353)
Net cash flows from investing activities 412 027 (864 843) 586 261 (1 230 560) Cash flows from financing activities (Repaid) / received loans (4 294) 3 598 (6 110) 5 119Dividends paid (683 141) (683 141) (972 022) (972 022)Net cash flows from financing activities (687 435) (679 543) (978 132) (966 903)Effect of exchange rate fluctuations 51 ‐ 73 ‐Net increase of cash and cash equivalents 180 468 (1 265 385) 256 782 (1 800 480)Cash and cash equivalents at the beginning of the year 1 148 302 2 413 687 1 633 887 3 434 367Cash and cash equivalents at the end of the year 12 1 328 770 1 148 302 1 890 669 1 633 887
The accompanying notes on pages 31 to 62 form an integral part of these consolidated financial statements. ___________________________________ Normunds Bergs Chairman of the Board
___________________________________ Didzis Liepkalns Deputy Chairman of the Board
___________________________________ Aira Loite Board Member
___________________________________ Jānis Ennītis Board Member
Riga, 29 October 2012
SAF Tehnika Yearbook 2011/12
31
Notes to the Consolidated Financial Statements
1. General information The core business activity of SAF Tehnika A/S (hereinafter – the Parent) and its subsidiary (hereinafter together referred to as “the Group”) comprises the design, production and distribution of microwave radio data transmission equipment offering an alternative to cable channels. The Group offers products to mobile network operators, data service providers (such as Internet service providers and telecommunications companies), as well as state institutions and private companies.
On 13 July 2010 with the aim to attract EU funds for research and development within the sphere of electronics and electrical engineering, the Parent, together with other members of the Latvian Electrical Engineering and Electronic Industry Association (LETERA), co‐founded a limited liability company “LEO pētījumu centrs” (LEO) investing 500 LVL (711 EUR) in its equity capital and becoming the owner of 10% of its share capital.
In order to provide clients in North America with individual and effective wireless data transmitting solutions, on 19 August 2011 a subsidiary “SAF North America” LLC was established, the Parent being the sole shareholder of “SAF North America” LLC. “SAF North America” LLC started active operations – promotion and marketing of products and services provided by SAF, market research, attraction of new clients and technical support – in spring of 2012.
The Parent is a public joint stock company incorporated under the laws of the Republic of Latvia. Its legal address is Ganību dambis 24a, Riga, Republic of Latvia.
The shares of the Parent are listed on NASDAQ OMX Riga Stock Exchange, Latvia.
These consolidated financial statements (hereinafter “financial statements”) were approved by the Board on 29 October 2012. The financial statements will be presented for approval to the shareholders’ meeting. The shareholders have the power to reject the financial statements prepared and issued by management and the right to request that new financial statements be issued.
2. Summary of accounting principles used These consolidated financial statements are prepared using the accounting policies and valuation principles set out below. These policies have been applied consistently to all the years presented, unless otherwise stated.
The previous set of consolidated accounts was prepared for the year ended 30 June 2009 as in November 2008 subsidiary SAF Tehnika Sweden AB was disposed.
Comparable data for 2010/ 2011 include individual financial information of AS SAF Tehnika.
A Basis of preparation These financial statements have been prepared in accordance with International Financial Reporting Standards as adopted by the European Union (IFRS as adopted by the EU). The financial statements have been prepared under the historical cost convention (including financial instruments available‐for‐sale as it is impracticable to determine their fair value).
The preparation of financial statements in conformity with IFRS as adopted by the EU requires the use of estimates and assumptions that affect the reported amounts of assets and liabilities and disclosure of contingent assets and liabilities at the date of the financial statements and the reported amounts of revenues and expenses during the reporting period. Although these estimates are based on Management’s best knowledge of current events and actions, actual results ultimately may differ from those. Significant accounting estimates are described in the relevant notes to the financial statements.
SAF Tehnika Yearbook 2011/12
32
Notes to the Consolidated Financial Statements (continued)
2. Summary of accounting principles used (continued) A Basis of preparation (continued) Standards, their amendments and Interpretations that became effective on 1 July 2011 and are applicable to financial statements for year ending on 30 June 2012:
Amendments to IFRS 7 Disclosures ‐ Transfers of Financial Assets (effective for annual periods beginning on or after 1 July 2011; to be applied prospectively). The Amendments require disclosure of information that enables users of financial statements:
• to understand the relationship between transferred financial assets that are not derecognised in their entirety and the associated liabilities; and
• to evaluate the nature of, and risks associated with, the entity’s continuing involvement in derecognised financial assets.
The Amendments define “continuing involvement” for the purposes of applying the disclosure requirements. The amendments to IFRS 7 had no material impact on the Group’s financial statements, because of the nature of the Group’s operations and the types of financial assets that it holds.
The following new Standards and Interpretations are not yet effective for the periods beginning on or after 1 July 2012:
Amendments to IAS 1 Presentation of Financial Statements: Presentation of Items of Other Comprehensive Income. The amendments require that the Group presents separately the items of other comprehensive income that may be reclassified to profit or loss in the future from those that would never be reclassified to profit or loss. If items of other comprehensive income are presented before related tax effects, then the aggregated tax amount should be allocated between these sections. The amendments change the title of the Statement of Comprehensive Income to Statement of Profit or Loss and Other Comprehensive Income; however, other titles are also allowed to be used. The Group has early adopted the amendments to IAS 1 from 1 July 2011. Before the amendments the Group used the title Income Statement, which has been changed to Statement of Profit or Loss and Other Comprehensive Income. The amendments had no other impact on the Group financial statements as the Group has no other comprehensive income.
Amendments to IAS 19 Employee Benefits (effective for annual periods beginning on or after 1 January 2013; to be applied retrospectively). The amendment requires actuarial gains and losses to be recognised immediately in other comprehensive income. The amendment removes the corridor method previously applicable to recognising actuarial gains and losses, and eliminates the ability for entities to recognise all changes in the defined benefit obligation and in plan assets in profit or loss, which currently is allowed under the requirements of IAS 19. The amendment also requires the expected return on plan assets recognised in profit or loss to be calculated based on rate used to discount the defined benefit obligation. The amendments are not relevant to the Group’s financial statements, since the entity does not have any defined benefit plans.
SAF Tehnika Yearbook 2011/12
33
Notes to the Consolidated Financial Statements (continued)
2. Summary of accounting principles used (continued) B Consolidation
(a) Subsidiaries
Consolidated subsidiaries are entities in which the Parent directly or indirectly holds more than 50% of voting rights or exercises another type of decision‐making power over its operations. The existence and efficiency of the voting rights that are subject to verification or transformation is checked in order to ascertain whether the Parent manages its subsidiaries.
Subsidiaries are fully consolidated as of the date when the control is transferred to the Group. Subsidiaries are excluded from consolidation starting the date when the control ceases.
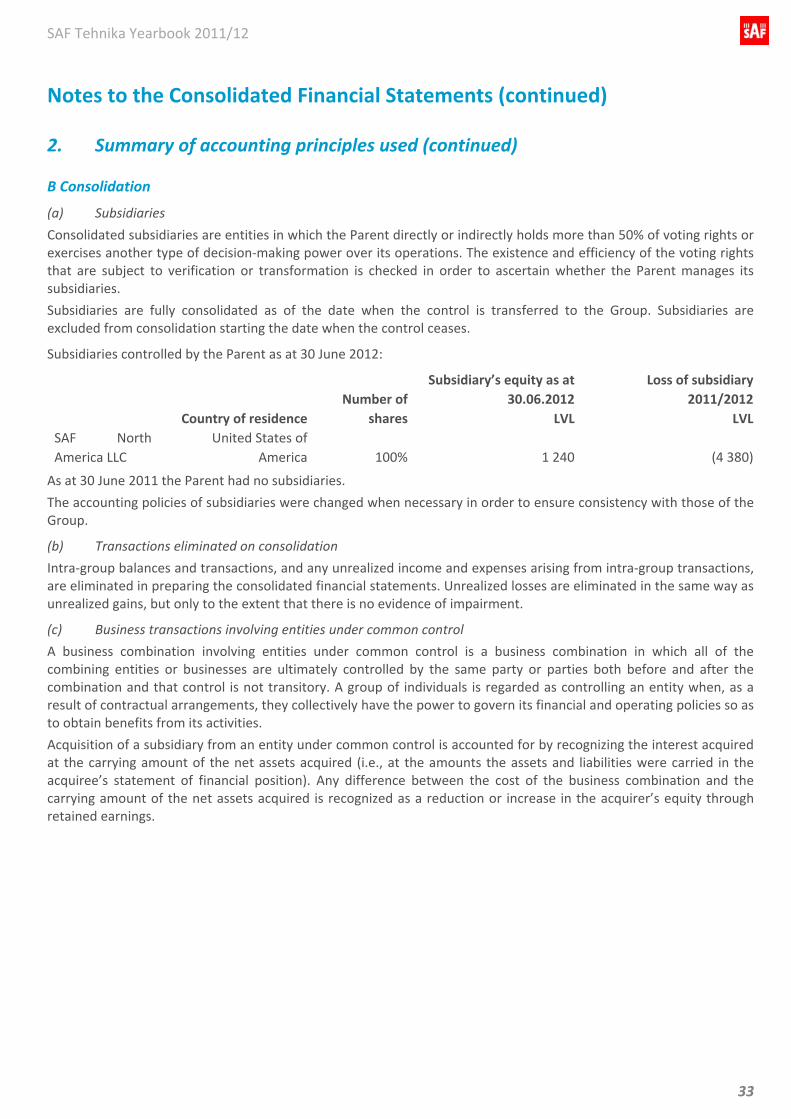
Subsidiaries controlled by the Parent as at 30 June 2012:
Country of residence Number of
shares
Subsidiary’s equity as at 30.06.2012
LVL
Loss of subsidiary 2011/2012
LVLSAF North America LLC
United States of America 100% 1 240 (4 380)
As at 30 June 2011 the Parent had no subsidiaries.
The accounting policies of subsidiaries were changed when necessary in order to ensure consistency with those of the Group.
(b) Transactions eliminated on consolidation
Intra‐group balances and transactions, and any unrealized income and expenses arising from intra‐group transactions, are eliminated in preparing the consolidated financial statements. Unrealized losses are eliminated in the same way as unrealized gains, but only to the extent that there is no evidence of impairment.
(c) Business transactions involving entities under common control
A business combination involving entities under common control is a business combination in which all of the combining entities or businesses are ultimately controlled by the same party or parties both before and after the combination and that control is not transitory. A group of individuals is regarded as controlling an entity when, as a result of contractual arrangements, they collectively have the power to govern its financial and operating policies so as to obtain benefits from its activities.
Acquisition of a subsidiary from an entity under common control is accounted for by recognizing the interest acquired at the carrying amount of the net assets acquired (i.e., at the amounts the assets and liabilities were carried in the acquiree’s statement of financial position). Any difference between the cost of the business combination and the carrying amount of the net assets acquired is recognized as a reduction or increase in the acquirer’s equity through retained earnings.
SAF Tehnika Yearbook 2011/12
34
Notes to the Consolidated Financial Statements (continued)
2. Summary of accounting principles used (continued) C Foreign currency revaluation
(a) Functional and reporting currency
Items of each structural unit of the Group included in the financial statements are measured using the currency of the primary economic environment in which the structural unit operates (‘the functional currency’). The financial statements are presented in Latvian Lats (LVL), which is the Group’s functional currency.
Requirements of Riga Stock Exchange prescribe that all balances are reported also in EUR. Statement of comprehensive income and related notes were denominated in LVL according to exchange rates set by the Bank of Latvia at the transaction date, statement of financial position and related notes were denominated according to exchange rates set by the Bank of Latvia at the financial position date. As a result of denomination in EUR no Foreign exchange gains and losses occurred, as Latvian lat is pegged to EUR at exchange rate of EUR 1 = LVL 0,702804.
(b) Transactions and balances
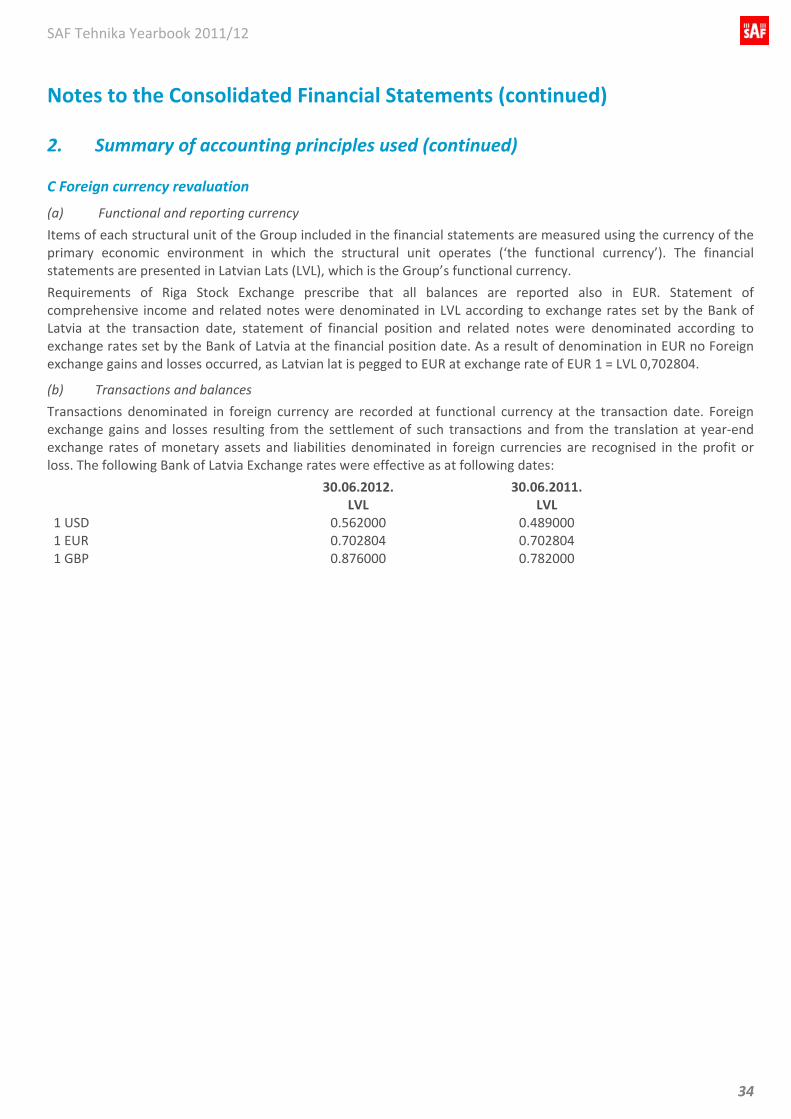
Transactions denominated in foreign currency are recorded at functional currency at the transaction date. Foreign exchange gains and losses resulting from the settlement of such transactions and from the translation at year‐end exchange rates of monetary assets and liabilities denominated in foreign currencies are recognised in the profit or loss. The following Bank of Latvia Exchange rates were effective as at following dates:
30.06.2012. 30.06.2011. LVL LVL 1 USD 0.562000 0.489000 1 EUR 0.702804 0.702804 1 GBP 0.876000 0.782000
SAF Tehnika Yearbook 2011/12
35
Notes to the Consolidated Financial Statements
2. Summary of accounting principles used (continued) C Foreign currency evaluation (continued)
(c) Group companies
The results of operations and the financial position of the Group companies (none of which are operating in hyperinflation economics) that operate with functional currencies other than the reporting currency are translated to the reporting currency as follows:
(i) Assets and liabilities are translated according to the exchange rate effective as at the date of the statement of financial position;
(ii) Transactions on the profit and loss statement and the statement of comprehensive income are translated at the exchange rate effective as at the transaction date; and
(iii) all currency exchange differences are recognized as a separate item of equity. D Property, plant and equipment Property, plant and equipment are stated at cost less accumulated depreciation and accumulated impairment losses. Cost includes expenses directly related to acquisition of property, plant and equipment. Such cost includes the cost of replacing part of such plant and equipment if the asset recognition criteria are met.
Leasehold improvements are capitalized and disclosed as property, plant and equipment. Depreciation of these assets is calculated over the shorter of the leasehold period or the estimated useful life on a straight line basis.
Where an item of property, plant and equipment has different useful live as the other items of the same property, plant and equipment, they are accounted for as separate items of property, plant and equipment.
The cost of replacing part of an item of property, plant and equipment is recognised in the carrying amount of the item if it is probable that the future economic benefits embodied within the part will flow to the Group and its cost can be measured reliably. The costs of the day‐to‐day servicing of property, plant and equipment is recognised in the profit or loss statement as incurred.
Maintenance costs of tangible assets are recognized in the profit and loss statement as incurred.
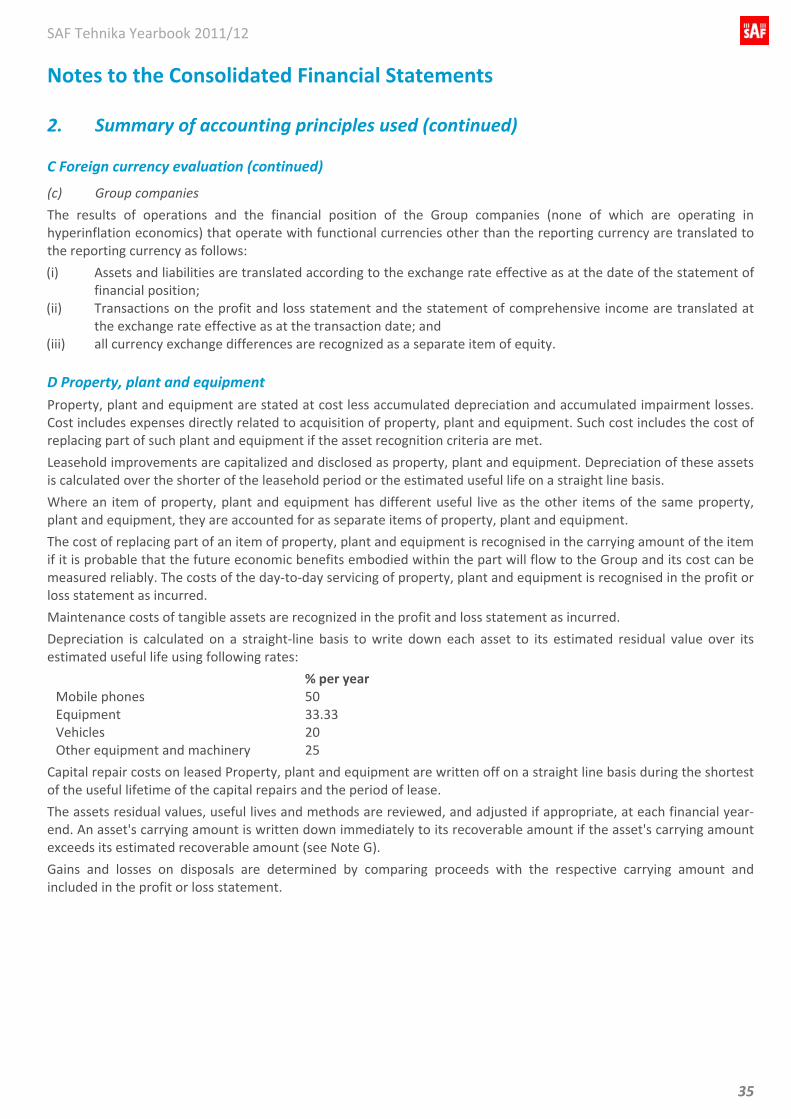
Depreciation is calculated on a straight‐line basis to write down each asset to its estimated residual value over its estimated useful life using following rates:
% per year Mobile phones 50 Equipment 33.33 Vehicles 20 Other equipment and machinery 25
Capital repair costs on leased Property, plant and equipment are written off on a straight line basis during the shortest of the useful lifetime of the capital repairs and the period of lease.
The assets residual values, useful lives and methods are reviewed, and adjusted if appropriate, at each financial year‐end. An asset's carrying amount is written down immediately to its recoverable amount if the asset's carrying amount exceeds its estimated recoverable amount (see Note G).
Gains and losses on disposals are determined by comparing proceeds with the respective carrying amount and included in the profit or loss statement.
SAF Tehnika Yearbook 2011/12
36
Notes to the Consolidated Financial Statements (continued)
2. Summary of accounting principles used (continued) E Intangible assets (a) Trademarks and licenses
Trademarks and licenses have a definite useful life and are carried at cost less accumulated amortisation and any accumulated impairment losses. Amortisation is calculated on a straight‐line basis to allocate the costs of trademarks and licenses over their estimated useful life, which usually is 3 years.
(b) Software
Acquired computer software licenses are capitalised on the basis of the purchase and installation costs. These costs are amortised over their estimated useful lives of three years.
F Cost of research and development activities Research costs are recognized in profit and loss statement as incurred. An intangible asset arising from the development expenditure on an individual project is recognized only when the Group can demonstrate the technical feasibility of completing the intangible asset so that it will be available for use or sale, its intentions to complete and its ability to use or sell the asset, how the asset will generate future economic benefits, the availability of resources to complete and the ability to measure reliably the expenditure during the development. Following the initial recognition of the development expenditure, the cost model is applied requiring the asset to be carried at cost less any accumulated amortisation and any accumulated impairment losses. Any expenditure capitalized is amortized over the period of the expected future sales from the related project.
G Impairment of assets Intangible assets that are not put in use or have an indefinite useful life are not subject to amortisation and are reviewed for impairment on an annual basis.
Moreover, the carrying amounts of the Group’s property, plant and equipment and intangible assets that are subject to amortisation and depreciation are reviewed at each reporting date to determine whether there is any indication of impairment. If any such indication exists, then the asset’s recoverable amount is estimated.
An impairment loss is recognised whenever the carrying amount of an asset or its cash‐generating unit exceeds its recoverable amount. A cash‐generating unit is the smallest identifiable asset group that generates cash flows that largely are independent from other assets and groups. Impairment losses are recognised in profit or loss. Impairment losses recognised in respect of cash‐generating units are allocated to reduce the carrying amount of the assets in the unit (group of unit) on a pro rata basis.
The recoverable amount of an asset or cash‐generating unit is the greater of its value in use and its fair value less costs to sell. In assessing value in use, the estimated future cash flows are discounted to their present value using a pre‐tax discount rate that reflects current market assessments of the time value of money and the risks specific to the asset in relation to which the future cash flows have not been adjusted.
In respect of other assets, impairment losses recognised in prior periods are assessed at each reporting date for any indications that the loss has decreased or no longer exists. Impairment loss is reversed if there has been a change in the estimates used to determine the recoverable amount. An impairment loss is reversed only to the extent that the asset’s carrying amount does not exceed the carrying amount that would have been determined, net of depreciation or amortisation, if no impairment loss had been recognised.
SAF Tehnika Yearbook 2011/12
37
Notes to the Consolidated Financial Statements (continued)
2. Summary of accounting principles used (continued)
H Segments Information on Group’s segments is disclosed in Note 16. Segment results that are reported to the Chief executive officer include items directly attributable to a segment as well as those that can be allocated on a reasonable basis. Unallocated items comprise mainly corporate assets (primarily the Group’s headquarters), head office expenses, and tax assets and liabilities.
I Government grants Government grants are recognized where there is a reasonable assurance that the grant will be received and all attaching conditions will be complied with. When the grant relates to an expense item, it is recognized as income over the period necessary to match the grant on a systematic basis to the costs that it is intended to compensate. Where the grant relates to an asset, the fair value is credited to a deferred income account and is released to the profit or loss statement over the expected useful life of the relevant asset by equal annual instalments.
J Inventories Inventories are stated at the lower of cost or net realizable value. Cost is stated on a first‐in, first‐out (FIFO) basis. Net realisable value is the estimated selling price in the ordinary course of business, less the estimated costs necessary to make the sale. Costs of finished goods and work‐in‐progress include cost of materials. During the reporting year the Management reviewed capitalization rates of expenses related with production attributable to the cost. Impact of changes on the next periods cannot be estimated.
K Financial instruments The Group’s financial instruments consist of trade receivables, investments in other companies’ equity (classified as available for sale), other receivables, cash and cash equivalents, borrowings, trade payables and other payables. Investments in other companies’ equity are classified as available for sale. All other financial assets are classified as loans and receivables but liabilities – as liabilities at amortised cost.
Financial instruments are initially recognised at fair value adding directly attributable transaction costs.
Financial assets are derecognised when the rights to receive cash flows from the investments have expired or have been transferred and the Group has transferred substantially all risks and rewards of ownership.
Regular way purchases and sales of financial assets are recognized on the trade date at which the Group commits to purchase or sell the asset. Financial liabilities are derecognized if the Group’s obligations specified in the contract expire or are discharged or cancelled.
SAF Tehnika Yearbook 2011/12
38
Notes to the Consolidated Financial Statements (continued)
2. Summary of accounting principles used (continued) K Financial instruments (continued)
Loans, receivables and other debts
Loans and receivables and other debts are non‐derivative financial assets with fixed or determinable payments that are not quoted in an active market, other than held for trading. Loans and receivables include trade and other receivables. Accounts receivable are stated at their amortized cost after deducting allowance for estimated irrecoverable amounts. A provision for impairment of loans and receivables is established when there is objective evidence that the Group will not be able to collect all amounts due according to the original terms of the receivables. Significant financial difficulties of the debtor, probability that the debtor will enter bankruptcy or financial reorganisation, and default or delinquency in payments are considered indicators that the loan or trade receivable is impaired. The amount of the provision is the difference between the asset’s carrying amount and the present value of estimated future cash flows, discounted at the original effective interest rate. The carrying amount of the asset is reduced and the amount of the loss is recognised in the profit or loss statement. When a loan, receivables and other debts are uncollectible, it is written off.
Financial investments available‐for‐sale
Financial investments available‐for‐sale are acquired to be held for an indefinite period of time. Financial investments, whose market value is not determined in an active market and whose fair value cannot be reliably measured, are carried at acquisition cost. All other financial investments available‐for‐sale are carried at fair value. Gains or losses resulting from the change in fair value of financial investments available‐for‐sale, except for impairment losses, are recognised in other comprehensive income until the financial asset is derecognised; thereafter, the cumulative gain or loss previously recognised in other comprehensive income is recognised in profit or loss.
Liabilities
Liabilities are recognised initially at fair value and subsequently measured at amortised cost using the effective interest method.
Interest bearing borrowings
Interest‐bearing borrowings are recognised initially at fair value less attributable transaction costs. Subsequent to initial recognition, interest‐bearing borrowings are stated at amortised cost with any difference between cost and redemption value being recognised in profit and loss over the period of the borrowings on an effective interest basis.
L Cash and cash equivalents Cash and cash equivalents comprise current bank accounts balances and deposits, and short term highly liquid investments with an original maturity of three months or less.
M Share Capital Ordinary shares are classified as equity. Incremental costs directly attributable to the issue of new shares are charged against the share premium account.
SAF Tehnika Yearbook 2011/12
39
Notes to the Consolidated Financial Statements (continued)
2. Summary of accounting principles used (continued) N Corporate income tax and Deferred tax Corporate income tax comprises current and deferred tax. Income tax is recognized in the statement of profit or loss and other comprehensive income.
The calculated current tax is the expected tax payable on the taxable income for the year, using tax rates enacted or substantially enacted at the end of the reporting period, and any adjustment to tax payable in respect of previous years.
Deferred taxation arising from temporary differences between carrying amounts for accounting purposes and for tax purposes is calculated using the liability method. However, if the deferred tax arises from initial recognition of an asset or liability in a transaction other than a business acquisition that at the time of the transaction affects neither accounting, non‐ taxable profit or loss, it is not accounted for. Deferred tax is determined using tax rates (and laws) that have been enacted by the financial position date and are expected to apply when the related deferred tax asset is realised or the deferred income tax liability is settled. Deferred tax assets are recognised to the extent that it is probable that future taxable profit will be available against which the temporary differences can be utilised.
O Employee benefits The Group makes social insurance contributions under the State's health, retirement benefit and unemployment schemes at the statutory rates in force during the year, based on gross salary payments. The Group will have no legal or constructive obligations to pay further contributions if the statutory fund cannot settle their liabilities towards the employees. The cost of these payments is included into the profit or loss statement in the same period as the related salary cost.
P Revenue recognition Revenue comprises the fair value of the goods and services sold, net of value‐added tax and discounts. Revenue is recognised as follows:
Sales of goods
Sale of goods is recognised when a Group entity has passed the significant risks and rewards of ownership of the goods to the customer, i.e. delivered products to the customer and the customer has accepted the products in accordance with the contract terms, and it is probable that the economic benefits associated with the transaction will flow to the Group.
(b) Provision of services
Revenue is recognised in the period when the services are rendered.
Q Lease Leases of property, plant and equipment in which a significant portion of the risks and rewards of ownership are retained by the lessor are classified as operating leases. Payments made under operating leases (net of any incentives received from the lessor) are charged to the profit or loss statement on a straight‐line basis over the lease period.
SAF Tehnika Yearbook 2011/12
40
Notes to the Consolidated Financial Statements (continued)
2. Summary of accounting principles used (continued) R Dividend payments Dividends payable to the Parent's shareholders are recognised as a liability in the Group’s financial statements in the period in which the dividends are approved by the Group's shareholders.
S Financial income and expenses Financial income and expenses comprise interest payable on borrowings calculated using the effective interest rate method, interest receivable on funds invested, and foreign exchange gains and losses. Interest income and expense are recognized in profit or loss as they accrue, taking into account the effective interest rate of the asset/liability. The interest expenses of finance lease payments are recognized in profit or loss using the effective interest rate method.
3. Finance risk management (1) Financial risk factors
The Group's activities expose it to a variety of financial risks:
(a) foreign currency risk; (b) credit risk; (c) liquidity risk; (d) cash flows and interest rate risk. The Group's overall risk management focuses on the unpredictability of financial markets and seeks to minimise its potential adverse effects on the Group's financial performance. The Group uses derivative financial instruments to hedge certain risk exposures. The responsibility for risk management lies with the Finance Department. The Finance Department identifies and evaluates risks and seeks for solutions to avoid financial risks in close co‐operation with other operating units of the Group.
(a) Foreign currency risk
The Group operates internationally and is exposed to foreign currency risk mainly arising from U.S. dollar fluctuations.
Foreign currency risk primarily arises from future commercial transactions and recognised assets – cash and trade receivables and liabilities – accounts payables and borrowings. To manage the foreign currency risk arising from future commercial transactions and recognised assets and liabilities, the Group uses forward foreign currency contracts. The foreign currency risk arises when future commercial transactions and recognised assets and liabilities are denominated in a currency different from the entity's functional currency. The Finance Department analyses the net open position in each foreign currency. The Group might decide to enter to forward foreign currency contracts or to maintain borrowings (in form of credit line) in appropriate currency and amount.
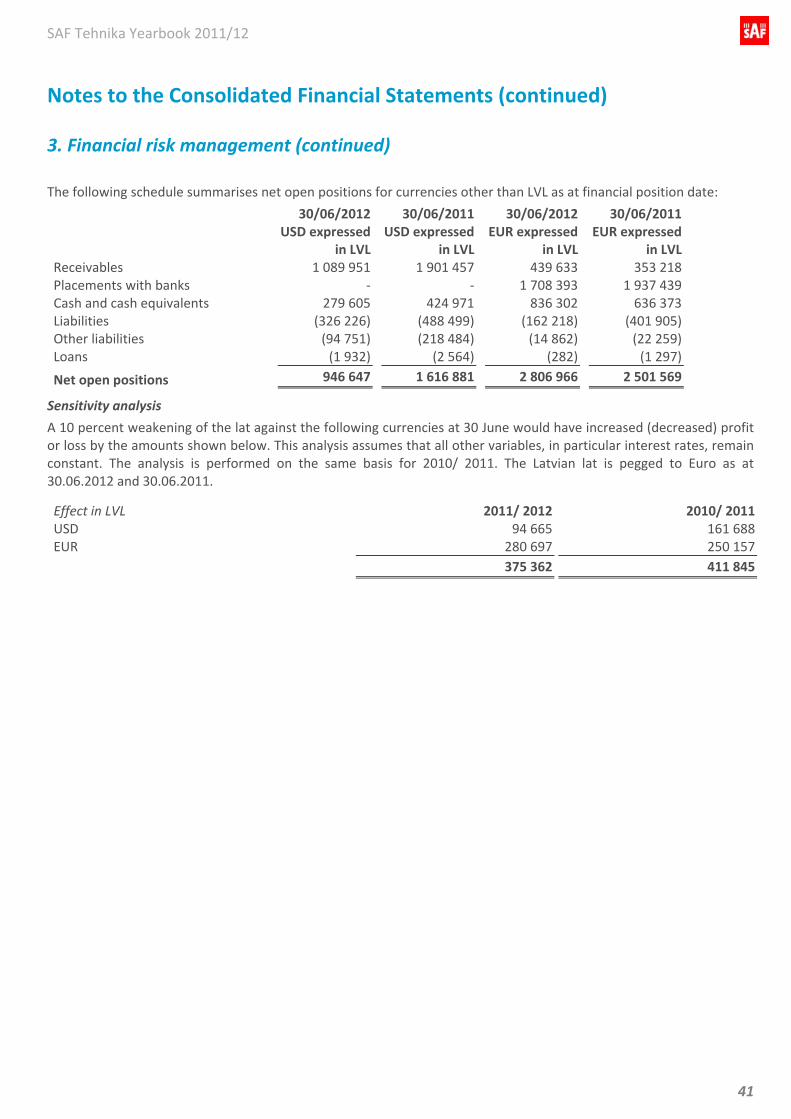
SAF Tehnika Yearbook 2011/12
41
Notes to the Consolidated Financial Statements (continued)
3. Financial risk management (continued)
The following schedule summarises net open positions for currencies other than LVL as at financial position date:
30/06/2012 30/06/2011 30/06/2012 30/06/2011 USD expressed
in LVLUSD expressed
in LVLEUR expressed
in LVL EUR expressed
in LVLReceivables 1 089 951 1 901 457 439 633 353 218Placements with banks ‐ ‐ 1 708 393 1 937 439Cash and cash equivalents 279 605 424 971 836 302 636 373Liabilities (326 226) (488 499) (162 218) (401 905)Other liabilities (94 751) (218 484) (14 862) (22 259)Loans (1 932) (2 564) (282) (1 297)
Net open positions 946 647 1 616 881 2 806 966 2 501 569
Sensitivity analysis
A 10 percent weakening of the lat against the following currencies at 30 June would have increased (decreased) profit or loss by the amounts shown below. This analysis assumes that all other variables, in particular interest rates, remain constant. The analysis is performed on the same basis for 2010/ 2011. The Latvian lat is pegged to Euro as at 30.06.2012 and 30.06.2011.
Effect in LVL 2011/ 2012 2010/ 2011USD 94 665 161 688EUR 280 697 250 157
375 362 411 845
SAF Tehnika Yearbook 2011/12
42
Notes to the Consolidated Financial Statements (continued)
3. Financial risk management (continued) (1) Financial risk factors (continued)
(b) Credit risk
The Group has significant exposure of credit risk with its customers. The Group’s policy is to ensure that wholesale of products is carried out with customers having appropriate credit history. If the customers are residing in countries with high credit risk, then Letters of Credit issued by reputable credit institutions are used as credit risk management instruments. In situations where no Letters of Credit can be obtained from reputable credit institutions, the prepayments from the customers are requested or State Export Guarantees purchased. Customers’ financial position is monitored on regular bases and assigned credit limits has been changed based on credit history and customer’s paying behaviour.
As at 30 June 2012, the Group’s credit risk exposure to a single customer amounted to 14.43% of the total short and long‐term receivables (30.06.2011: 38.07%). With respect to credit risk arising from the other financial assets of the Group, which comprise cash and cash equivalents and derivatives, the Group’s exposure to credit risk arises from the default of the counterparty, with a maximum exposure equal to the carrying amount of these instruments. The Group’s maximum credit risk exposure amounts to LVL 5 003 202 or 57.84% to total assets (30.06.2011: LVL 5 657 646 or 58.52% to total assets).
For more information in respect to Group’s exposure to liquidity risk, refer to note 8.
(c) Liquidity risk
The Group follows a prudent liquidity risk management and hence maintain a sufficient quantity of money.
The Group's management monitors liquidity reserves for the operational forecasting, based on estimated cash flows. Most of the Group's liabilities are short term.
Management believes that the Group will have sufficient liquidity to be generated from operating activities.
For more information in respect to Group’s exposure to liquidity risk, refer to Note 14.
(d) Cash flows and interest rate risk
As the Group does not have significant interest bearing liabilities, thus the Group's cash flows are largely independent of changes in market interest rates. The Group's cash flows from interest bearing assets are dependent on current market interest rates.
Accounting for derivative financial instruments The Group uses derivative financial instruments such as forward currency contracts to hedge its risks associated with foreign currency fluctuations. Such derivative financial instruments are initially recognized at fair value on the date on which derivative contract is entered to and are subsequently remeasured at fair value. Derivatives are carried as assets when the fair value is positive and as liabilities when the fair value is negative. The fair value of forward currency contracts is calculated by reference to current forward exchange rates for contracts with similar maturity profiles.
Any gains or losses arising from changes in fair value of derivatives that do not qualify as hedge accounting are taken directly to profit or loss for the year.
As at 30 June 2012 the Group did not have any open derivative financial instruments agreements.
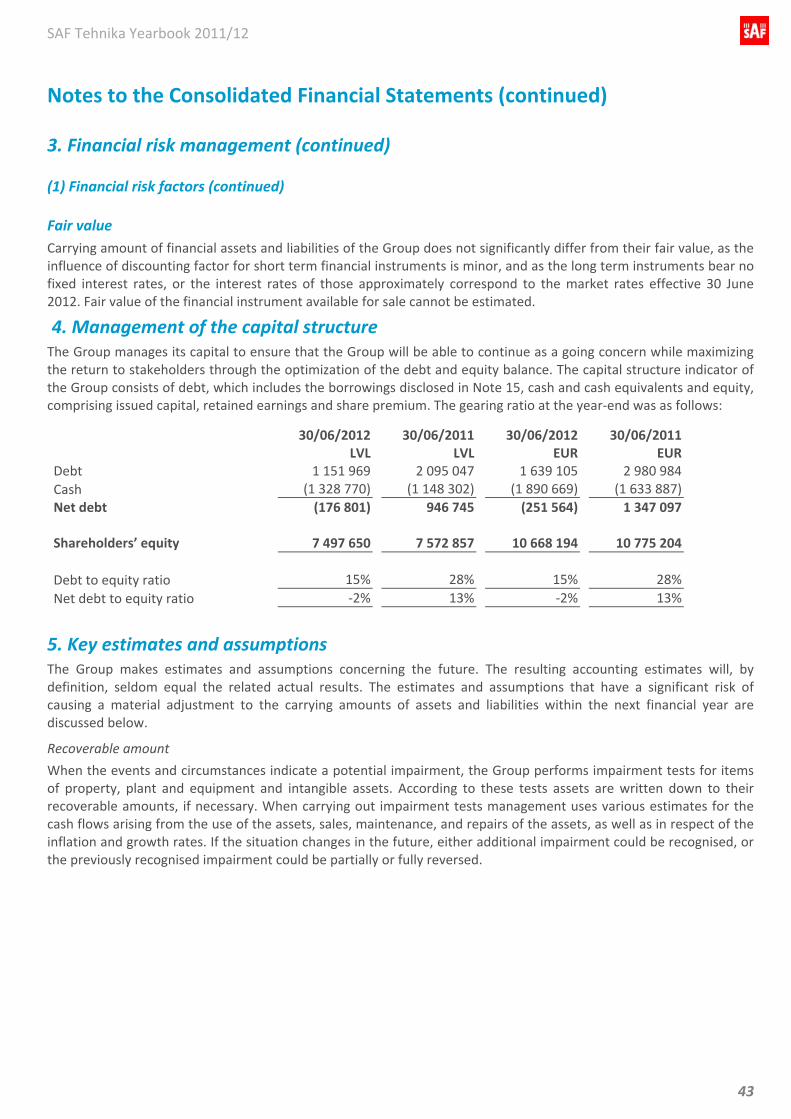
SAF Tehnika Yearbook 2011/12
43
Notes to the Consolidated Financial Statements (continued)
3. Financial risk management (continued) (1) Financial risk factors (continued) Fair value Carrying amount of financial assets and liabilities of the Group does not significantly differ from their fair value, as the influence of discounting factor for short term financial instruments is minor, and as the long term instruments bear no fixed interest rates, or the interest rates of those approximately correspond to the market rates effective 30 June 2012. Fair value of the financial instrument available for sale cannot be estimated.
4. Management of the capital structure The Group manages its capital to ensure that the Group will be able to continue as a going concern while maximizing the return to stakeholders through the optimization of the debt and equity balance. The capital structure indicator of the Group consists of debt, which includes the borrowings disclosed in Note 15, cash and cash equivalents and equity, comprising issued capital, retained earnings and share premium. The gearing ratio at the year‐end was as follows:
30/06/2012 30/06/2011 30/06/2012 30/06/2011 LVL LVL EUR EURDebt 1 151 969 2 095 047 1 639 105 2 980 984Cash (1 328 770) (1 148 302) (1 890 669) (1 633 887)Net debt (176 801) 946 745 (251 564) 1 347 097 Shareholders’ equity 7 497 650 7 572 857 10 668 194 10 775 204 Debt to equity ratio 15% 28% 15% 28%Net debt to equity ratio ‐2% 13% ‐2% 13%
5. Key estimates and assumptions The Group makes estimates and assumptions concerning the future. The resulting accounting estimates will, by definition, seldom equal the related actual results. The estimates and assumptions that have a significant risk of causing a material adjustment to the carrying amounts of assets and liabilities within the next financial year are discussed below.
Recoverable amount
When the events and circumstances indicate a potential impairment, the Group performs impairment tests for items of property, plant and equipment and intangible assets. According to these tests assets are written down to their recoverable amounts, if necessary. When carrying out impairment tests management uses various estimates for the cash flows arising from the use of the assets, sales, maintenance, and repairs of the assets, as well as in respect of the inflation and growth rates. If the situation changes in the future, either additional impairment could be recognised, or the previously recognised impairment could be partially or fully reversed.
SAF Tehnika Yearbook 2011/12
44
Notes to the Consolidated Financial Statements (continued)
5. Key estimates and assumptions (continued)
Impairment of loans and receivables
The Group recognizes allowance for doubtful loans and receivables. In order to set unrecoverable amount of receivables, management estimates the basis of which is the historical experience are used. Allowances for doubtful debts are recognized based on an individual management assessment of recoverability of each receivable.
Useful lives of property, plant and equipment
Management estimates the expected useful lives of Property, plant and equipment in proportion to the expected duration of use of the asset based on historical experience with similar Property, plant and equipment and based on future plans. Depreciation of property, plant and equipment is charged to the profit or loss statement on a straight‐line basis over the estimated useful lives of the individual assets. Depreciation of property, plant and equipment is calculated over the shortest period – lease term or over the useful life. No depreciation is calculated for land.
Provisions
Provisions are recognized when the Group has a present legal or constructive obligation as a result of a past event and it is probable that an outflow of economic benefits will be required from the Group to settle the obligation, and the amount of obligation can be measured reasonably. If the Group foresees that the expenses required for recognizing the provision will be partly or fully repaid, for example, within an insurance contract, the recovery of such expenses is recognized as a separate assets only when it is certain that such expenses will be recovered. Expenses connected with any provisions are recognized in the profit or loss statement less recovered amounts.
At the end of the reporting year:
• provisions for potential warranty expenses are recognized based on the management assessment of the risk of expected warranty repairs relating to the concluded contracts.
• accrued liabilities for unused vacations are calculated in accordance with the number of vacation days unused as at 30 June 2012 and the average remuneration during the last six months of the reporting year.
Deferred tax asset
A deferred tax asset is recognised only to the extent that it is probable that future taxable profits will be available against which the asset can be utilised. Deferred tax amounts are reduced to the extent that it is no longer probable that the related tax benefit will be realised.

SAF Tehnika Yearbook 2011/12
45
Notes to the Consolidated Financial Statements (continued)
6. Property, plant and equipment and intangible assets
Intangible assets
Leasehold improvemen
ts
Equipment and
machinery
Other property, plant and
equipmentPrepayment
s Total LVL LVL LVL LVL LVL LVL
Reporting year ended 30 June 2011 Opening balance 56 251 389 930 110 144 49 926 ‐ 606 251Acquisitions 43 118 310 118 449 7 041 2 457 171 375Charge for the period (31 895) (68 818) (66 000) (32 844) ‐ (199 557)Disposals ‐ (2 500) ‐ (3 740) ‐ (6 240)Closing balance 67 474 318 922 162 593 20 383 2 457 571 829 Reporting year ended 30 June 2012 Opening balance 67 474 318 922 162 593 20 383 2 457 571 829Acquisitions 87 881 ‐ 128 016 38 124 ‐ 254 021Reclassified ‐ ‐ 2 457 ‐ (2 457) ‐Charge for the period (62 951) (67 938) (97 118) (19 286) ‐ (247 293)Closing balance 92 404 250 984 195 948 39 221 ‐ 578 557 30 June 2010 Historical cost 552 910 759 837 2 027 517 389 188 ‐ 3 729 452Accumulated depreciation (496 659) (369 907) (1 917 373) (339 262) ‐ (3 123 201)Carrying amount 56 251 389 930 110 144 49 926 ‐ 606 251 30 June 2011 Historical cost 557 459 751 848 2 129 302 363 567 2 457 3 804 633Accumulated depreciation (489 985) (432 926) (1 966 709) (343 184) ‐ (3 232 804)Carrying amount 67 474 318 922 162 593 20 383 2 457 571 829 30 June 2012 Historical cost 631 953 751 848 2 253 630 392 864 ‐ 4 030 295Accumulated depreciation (539 549) (500 864) (2 057 682) (353 643) ‐ (3 451 738)Carrying amount 92 404 250 984 195 948 39 221 ‐ 578 557
During the reporting year, the Group did not enter into any operating or finance lease agreements.
Depreciation of LVL 145 637 is included in the profit or loss statement item Cost of sales (2010/ 2011: LVL 112 487); depreciation of LVL 70 898 in Selling and marketing costs (2010 / 2011: LVL 57 212); and depreciation of LVL 30 758 in Administrative expenses (2010/ 2011: LVL 29 858), including depreciation of LVL 21 under Other administration expenses (2010 / 2011: LVL 755).
The acquisition costs of fully depreciated property, plant and equipment that is still in use at the end of financial year amounted to LVL 2 733 318 (2010/ 2011: LVL 2 573 123).
The Equipment and machinery group includes items bought with EU co‐financing and according to agreement with EU have restrictions in their usage in operations. In total such items amount to LVL 304 043 (2010/ 2011: LVL 304 043), the residual value as at 30 June 2012 amounts to LVL 25 635 (2010/ 2011: LVL 49 373). Restrictions are in force till July, 2014.
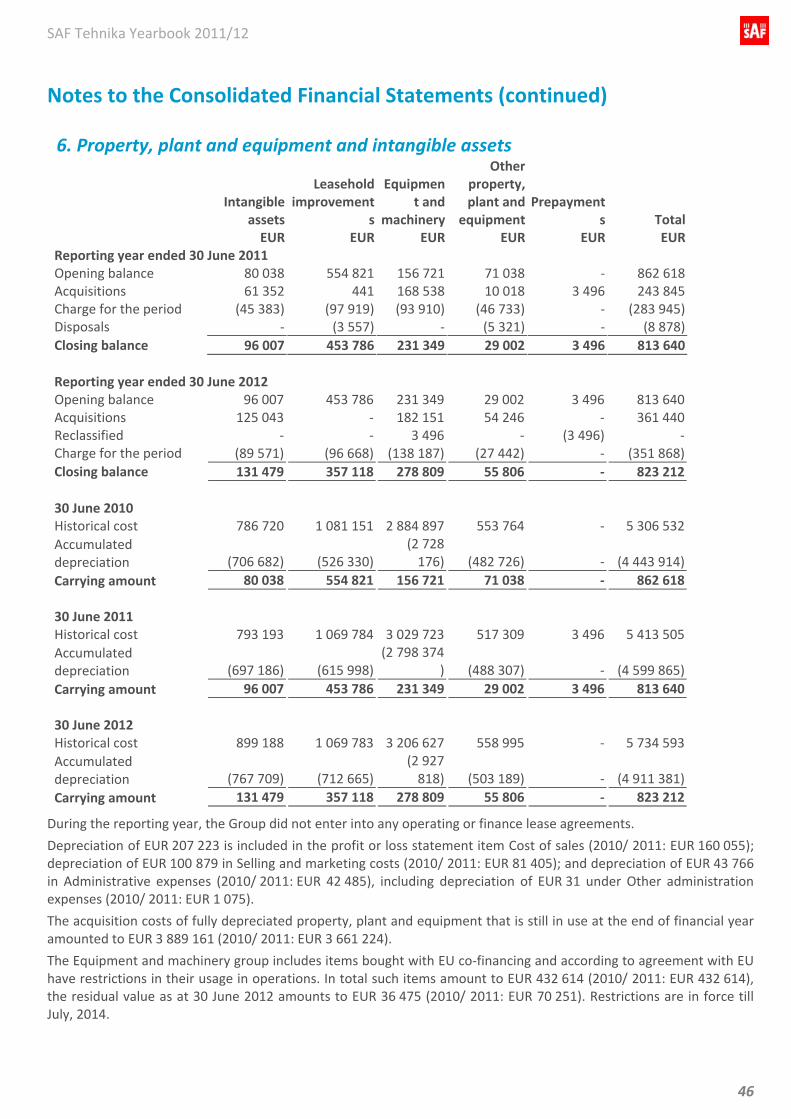
SAF Tehnika Yearbook 2011/12
46
Notes to the Consolidated Financial Statements (continued)
6. Property, plant and equipment and intangible assets
Intangible assets
Leasehold improvement
s
Equipment and
machinery
Other property, plant and
equipmentPrepayment
s Total EUR EUR EUR EUR EUR EUR
Reporting year ended 30 June 2011 Opening balance 80 038 554 821 156 721 71 038 ‐ 862 618Acquisitions 61 352 441 168 538 10 018 3 496 243 845Charge for the period (45 383) (97 919) (93 910) (46 733) ‐ (283 945)Disposals ‐ (3 557) ‐ (5 321) ‐ (8 878)Closing balance 96 007 453 786 231 349 29 002 3 496 813 640 Reporting year ended 30 June 2012 Opening balance 96 007 453 786 231 349 29 002 3 496 813 640Acquisitions 125 043 ‐ 182 151 54 246 ‐ 361 440Reclassified ‐ ‐ 3 496 ‐ (3 496) ‐Charge for the period (89 571) (96 668) (138 187) (27 442) ‐ (351 868)Closing balance 131 479 357 118 278 809 55 806 ‐ 823 212 30 June 2010 Historical cost 786 720 1 081 151 2 884 897 553 764 ‐ 5 306 532Accumulated depreciation (706 682) (526 330)
(2 728 176) (482 726) ‐ (4 443 914)
Carrying amount 80 038 554 821 156 721 71 038 ‐ 862 618 30 June 2011 Historical cost 793 193 1 069 784 3 029 723 517 309 3 496 5 413 505Accumulated depreciation (697 186) (615 998)
(2 798 374) (488 307) ‐ (4 599 865)
Carrying amount 96 007 453 786 231 349 29 002 3 496 813 640 30 June 2012 Historical cost 899 188 1 069 783 3 206 627 558 995 ‐ 5 734 593Accumulated depreciation (767 709) (712 665)
(2 927 818) (503 189) ‐ (4 911 381)
Carrying amount 131 479 357 118 278 809 55 806 ‐ 823 212
During the reporting year, the Group did not enter into any operating or finance lease agreements.
Depreciation of EUR 207 223 is included in the profit or loss statement item Cost of sales (2010/ 2011: EUR 160 055); depreciation of EUR 100 879 in Selling and marketing costs (2010/ 2011: EUR 81 405); and depreciation of EUR 43 766 in Administrative expenses (2010/ 2011: EUR 42 485), including depreciation of EUR 31 under Other administration expenses (2010/ 2011: EUR 1 075).
The acquisition costs of fully depreciated property, plant and equipment that is still in use at the end of financial year amounted to EUR 3 889 161 (2010/ 2011: EUR 3 661 224).
The Equipment and machinery group includes items bought with EU co‐financing and according to agreement with EU have restrictions in their usage in operations. In total such items amount to EUR 432 614 (2010/ 2011: EUR 432 614), the residual value as at 30 June 2012 amounts to EUR 36 475 (2010/ 2011: EUR 70 251). Restrictions are in force till July, 2014.
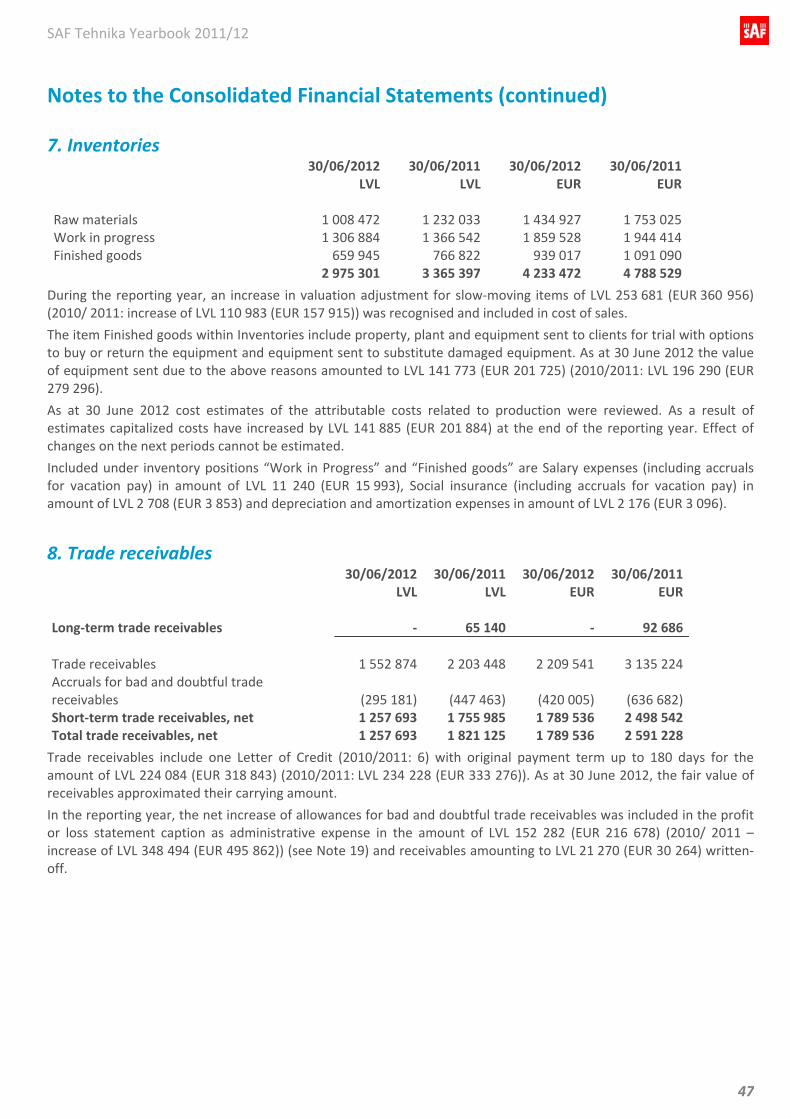
SAF Tehnika Yearbook 2011/12
47
Notes to the Consolidated Financial Statements (continued)
7. Inventories 30/06/2012 30/06/2011 30/06/2012 30/06/2011 LVL LVL EUR EUR Raw materials 1 008 472 1 232 033 1 434 927 1 753 025Work in progress 1 306 884 1 366 542 1 859 528 1 944 414Finished goods 659 945 766 822 939 017 1 091 090 2 975 301 3 365 397 4 233 472 4 788 529
During the reporting year, an increase in valuation adjustment for slow‐moving items of LVL 253 681 (EUR 360 956) (2010/ 2011: increase of LVL 110 983 (EUR 157 915)) was recognised and included in cost of sales.
The item Finished goods within Inventories include property, plant and equipment sent to clients for trial with options to buy or return the equipment and equipment sent to substitute damaged equipment. As at 30 June 2012 the value of equipment sent due to the above reasons amounted to LVL 141 773 (EUR 201 725) (2010/2011: LVL 196 290 (EUR 279 296).
As at 30 June 2012 cost estimates of the attributable costs related to production were reviewed. As a result of estimates capitalized costs have increased by LVL 141 885 (EUR 201 884) at the end of the reporting year. Effect of changes on the next periods cannot be estimated.
Included under inventory positions “Work in Progress” and “Finished goods” are Salary expenses (including accruals for vacation pay) in amount of LVL 11 240 (EUR 15 993), Social insurance (including accruals for vacation pay) in amount of LVL 2 708 (EUR 3 853) and depreciation and amortization expenses in amount of LVL 2 176 (EUR 3 096).
8. Trade receivables 30/06/2012 30/06/2011 30/06/2012 30/06/2011 LVL LVL EUR EUR Long‐term trade receivables ‐ 65 140 ‐ 92 686 Trade receivables 1 552 874 2 203 448 2 209 541 3 135 224Accruals for bad and doubtful trade receivables (295 181) (447 463) (420 005) (636 682)Short‐term trade receivables, net 1 257 693 1 755 985 1 789 536 2 498 542Total trade receivables, net 1 257 693 1 821 125 1 789 536 2 591 228
Trade receivables include one Letter of Credit (2010/2011: 6) with original payment term up to 180 days for the amount of LVL 224 084 (EUR 318 843) (2010/2011: LVL 234 228 (EUR 333 276)). As at 30 June 2012, the fair value of receivables approximated their carrying amount.
In the reporting year, the net increase of allowances for bad and doubtful trade receivables was included in the profit or loss statement caption as administrative expense in the amount of LVL 152 282 (EUR 216 678) (2010/ 2011 – increase of LVL 348 494 (EUR 495 862)) (see Note 19) and receivables amounting to LVL 21 270 (EUR 30 264) written‐off.
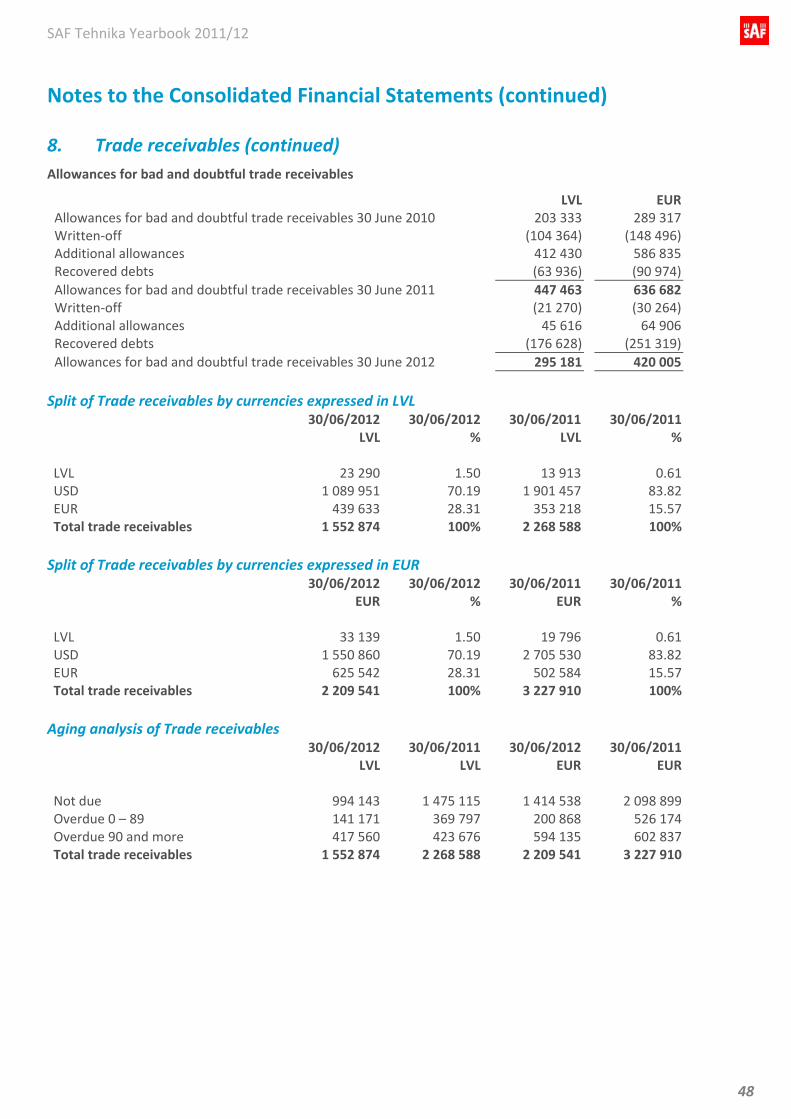
SAF Tehnika Yearbook 2011/12
48
Notes to the Consolidated Financial Statements (continued)
8. Trade receivables (continued) Allowances for bad and doubtful trade receivables
LVL EURAllowances for bad and doubtful trade receivables 30 June 2010 203 333 289 317 Written‐off (104 364) (148 496)Additional allowances 412 430 586 835 Recovered debts (63 936) (90 974)Allowances for bad and doubtful trade receivables 30 June 2011 447 463 636 682 Written‐off (21 270) (30 264)Additional allowances 45 616 64 906 Recovered debts (176 628) (251 319)Allowances for bad and doubtful trade receivables 30 June 2012 295 181 420 005 Split of Trade receivables by currencies expressed in LVL 30/06/2012 30/06/2012 30/06/2011 30/06/2011 LVL % LVL % LVL 23 290 1.50 13 913 0.61USD 1 089 951 70.19 1 901 457 83.82EUR 439 633 28.31 353 218 15.57Total trade receivables 1 552 874 100% 2 268 588 100% Split of Trade receivables by currencies expressed in EUR 30/06/2012 30/06/2012 30/06/2011 30/06/2011 EUR % EUR % LVL 33 139 1.50 19 796 0.61USD 1 550 860 70.19 2 705 530 83.82EUR 625 542 28.31 502 584 15.57Total trade receivables 2 209 541 100% 3 227 910 100% Aging analysis of Trade receivables 30/06/2012 30/06/2011 30/06/2012 30/06/2011 LVL LVL EUR EUR Not due 994 143 1 475 115 1 414 538 2 098 899Overdue 0 – 89 141 171 369 797 200 868 526 174Overdue 90 and more 417 560 423 676 594 135 602 837Total trade receivables 1 552 874 2 268 588 2 209 541 3 227 910
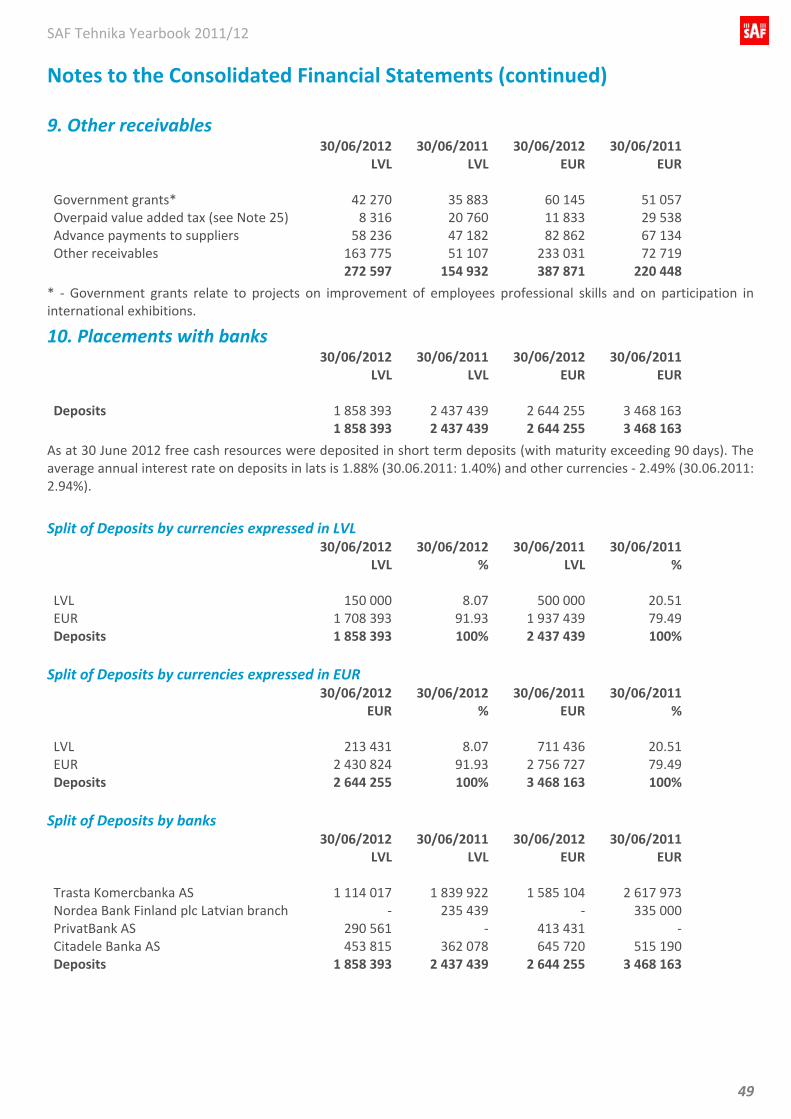
SAF Tehnika Yearbook 2011/12
49
Notes to the Consolidated Financial Statements (continued)
9. Other receivables 30/06/2012 30/06/2011 30/06/2012 30/06/2011 LVL LVL EUR EUR Government grants* 42 270 35 883 60 145 51 057Overpaid value added tax (see Note 25) 8 316 20 760 11 833 29 538Advance payments to suppliers 58 236 47 182 82 862 67 134Other receivables 163 775 51 107 233 031 72 719 272 597 154 932 387 871 220 448
* ‐ Government grants relate to projects on improvement of employees professional skills and on participation in international exhibitions.
10. Placements with banks 30/06/2012 30/06/2011 30/06/2012 30/06/2011 LVL LVL EUR EUR Deposits 1 858 393 2 437 439 2 644 255 3 468 163 1 858 393 2 437 439 2 644 255 3 468 163
As at 30 June 2012 free cash resources were deposited in short term deposits (with maturity exceeding 90 days). The average annual interest rate on deposits in lats is 1.88% (30.06.2011: 1.40%) and other currencies ‐ 2.49% (30.06.2011: 2.94%).
Split of Deposits by currencies expressed in LVL 30/06/2012 30/06/2012 30/06/2011 30/06/2011 LVL % LVL % LVL 150 000 8.07 500 000 20.51EUR 1 708 393 91.93 1 937 439 79.49Deposits 1 858 393 100% 2 437 439 100% Split of Deposits by currencies expressed in EUR 30/06/2012 30/06/2012 30/06/2011 30/06/2011 EUR % EUR % LVL 213 431 8.07 711 436 20.51EUR 2 430 824 91.93 2 756 727 79.49Deposits 2 644 255 100% 3 468 163 100% Split of Deposits by banks 30/06/2012 30/06/2011 30/06/2012 30/06/2011 LVL LVL EUR EUR Trasta Komercbanka AS 1 114 017 1 839 922 1 585 104 2 617 973Nordea Bank Finland plc Latvian branch ‐ 235 439 ‐ 335 000PrivatBank AS 290 561 ‐ 413 431 ‐Citadele Banka AS 453 815 362 078 645 720 515 190Deposits 1 858 393 2 437 439 2 644 255 3 468 163
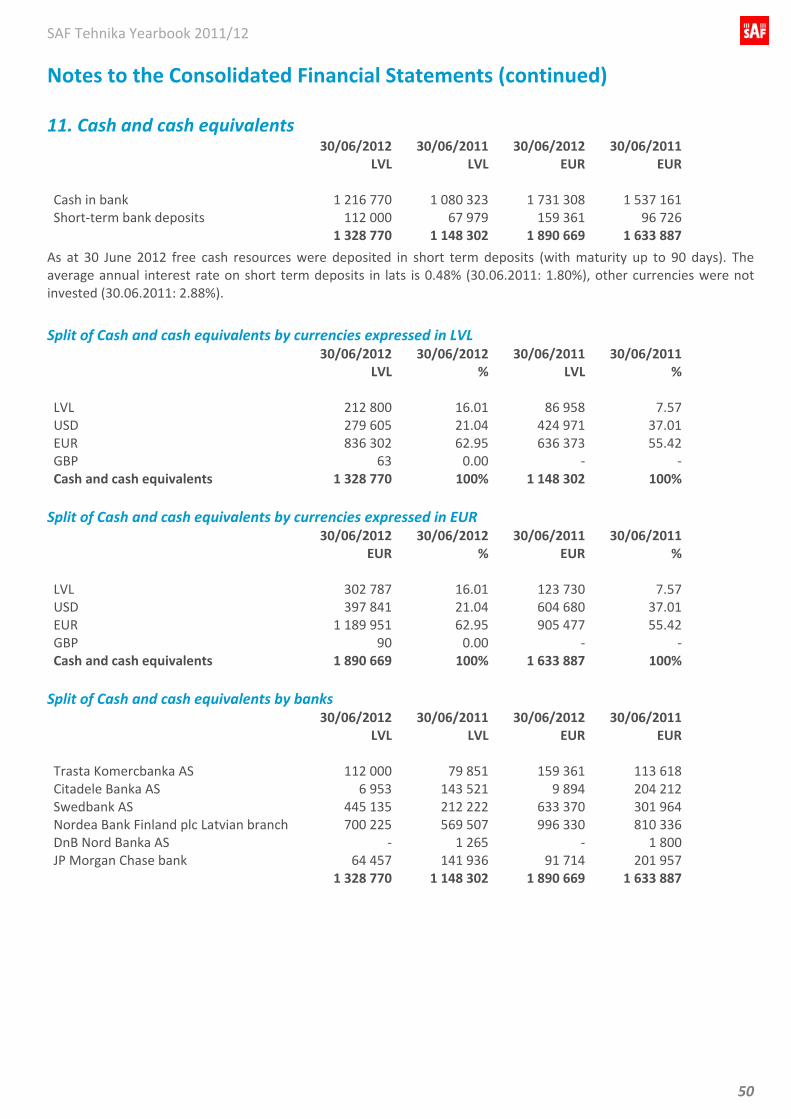
SAF Tehnika Yearbook 2011/12
50
Notes to the Consolidated Financial Statements (continued)
11. Cash and cash equivalents 30/06/2012 30/06/2011 30/06/2012 30/06/2011 LVL LVL EUR EUR Cash in bank 1 216 770 1 080 323 1 731 308 1 537 161Short‐term bank deposits 112 000 67 979 159 361 96 726 1 328 770 1 148 302 1 890 669 1 633 887
As at 30 June 2012 free cash resources were deposited in short term deposits (with maturity up to 90 days). The average annual interest rate on short term deposits in lats is 0.48% (30.06.2011: 1.80%), other currencies were not invested (30.06.2011: 2.88%).
Split of Cash and cash equivalents by currencies expressed in LVL 30/06/2012 30/06/2012 30/06/2011 30/06/2011 LVL % LVL % LVL 212 800 16.01 86 958 7.57USD 279 605 21.04 424 971 37.01EUR 836 302 62.95 636 373 55.42GBP 63 0.00 ‐ ‐Cash and cash equivalents 1 328 770 100% 1 148 302 100% Split of Cash and cash equivalents by currencies expressed in EUR 30/06/2012 30/06/2012 30/06/2011 30/06/2011 EUR % EUR % LVL 302 787 16.01 123 730 7.57USD 397 841 21.04 604 680 37.01EUR 1 189 951 62.95 905 477 55.42GBP 90 0.00 ‐ ‐Cash and cash equivalents 1 890 669 100% 1 633 887 100% Split of Cash and cash equivalents by banks 30/06/2012 30/06/2011 30/06/2012 30/06/2011 LVL LVL EUR EUR Trasta Komercbanka AS 112 000 79 851 159 361 113 618Citadele Banka AS 6 953 143 521 9 894 204 212Swedbank AS 445 135 212 222 633 370 301 964Nordea Bank Finland plc Latvian branch 700 225 569 507 996 330 810 336DnB Nord Banka AS ‐ 1 265 ‐ 1 800JP Morgan Chase bank 64 457 141 936 91 714 201 957 1 328 770 1 148 302 1 890 669 1 633 887
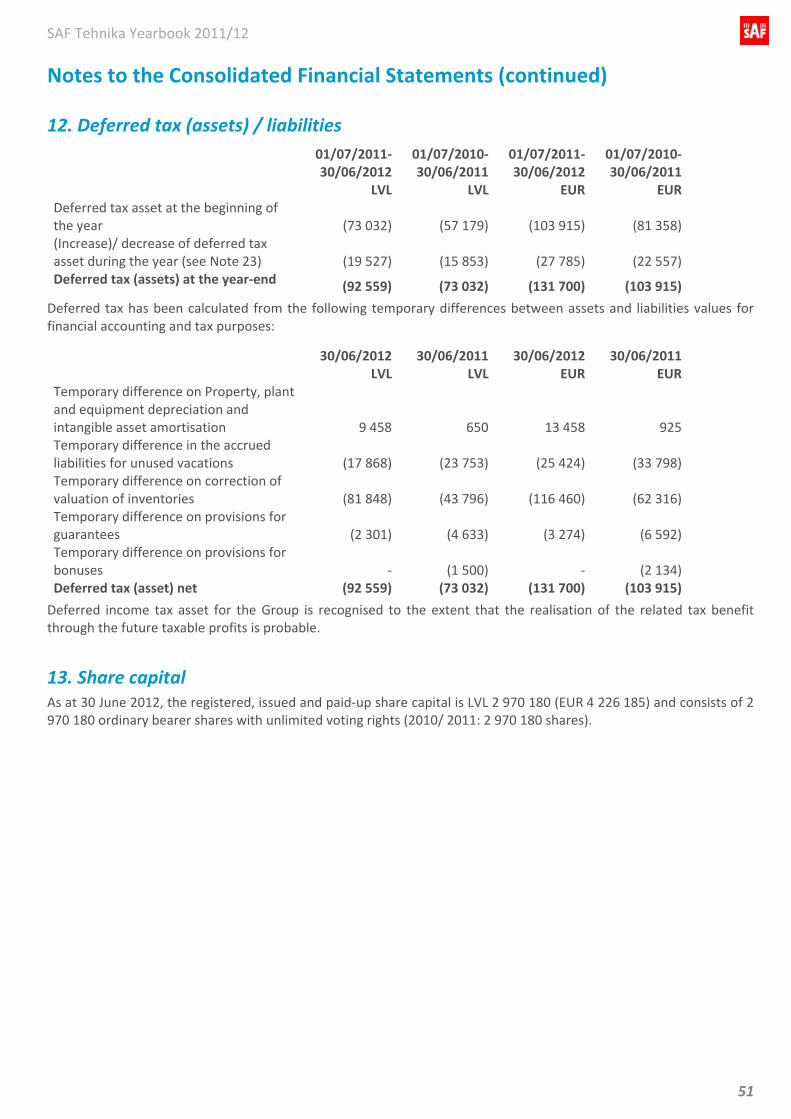
SAF Tehnika Yearbook 2011/12
51
Notes to the Consolidated Financial Statements (continued)
12. Deferred tax (assets) / liabilities 01/07/2011‐
30/06/201201/07/2010‐ 30/06/2011
01/07/2011‐ 30/06/2012
01/07/2010‐ 30/06/2011
LVL LVL EUR EURDeferred tax asset at the beginning of the year (73 032) (57 179) (103 915) (81 358)(Increase)/ decrease of deferred tax asset during the year (see Note 23) (19 527) (15 853)
(27 785) (22 557)
Deferred tax (assets) at the year‐end (92 559) (73 032) (131 700) (103 915)
Deferred tax has been calculated from the following temporary differences between assets and liabilities values for financial accounting and tax purposes:
30/06/2012 30/06/2011 30/06/2012 30/06/2011 LVL LVL EUR EURTemporary difference on Property, plant and equipment depreciation and intangible asset amortisation 9 458 650 13 458 925Temporary difference in the accrued liabilities for unused vacations (17 868) (23 753) (25 424) (33 798)Temporary difference on correction of valuation of inventories (81 848) (43 796) (116 460) (62 316)Temporary difference on provisions for guarantees (2 301) (4 633) (3 274) (6 592)Temporary difference on provisions for bonuses ‐ (1 500) ‐ (2 134)Deferred tax (asset) net (92 559) (73 032) (131 700) (103 915)
Deferred income tax asset for the Group is recognised to the extent that the realisation of the related tax benefit through the future taxable profits is probable.
13. Share capital As at 30 June 2012, the registered, issued and paid‐up share capital is LVL 2 970 180 (EUR 4 226 185) and consists of 2 970 180 ordinary bearer shares with unlimited voting rights (2010/ 2011: 2 970 180 shares).
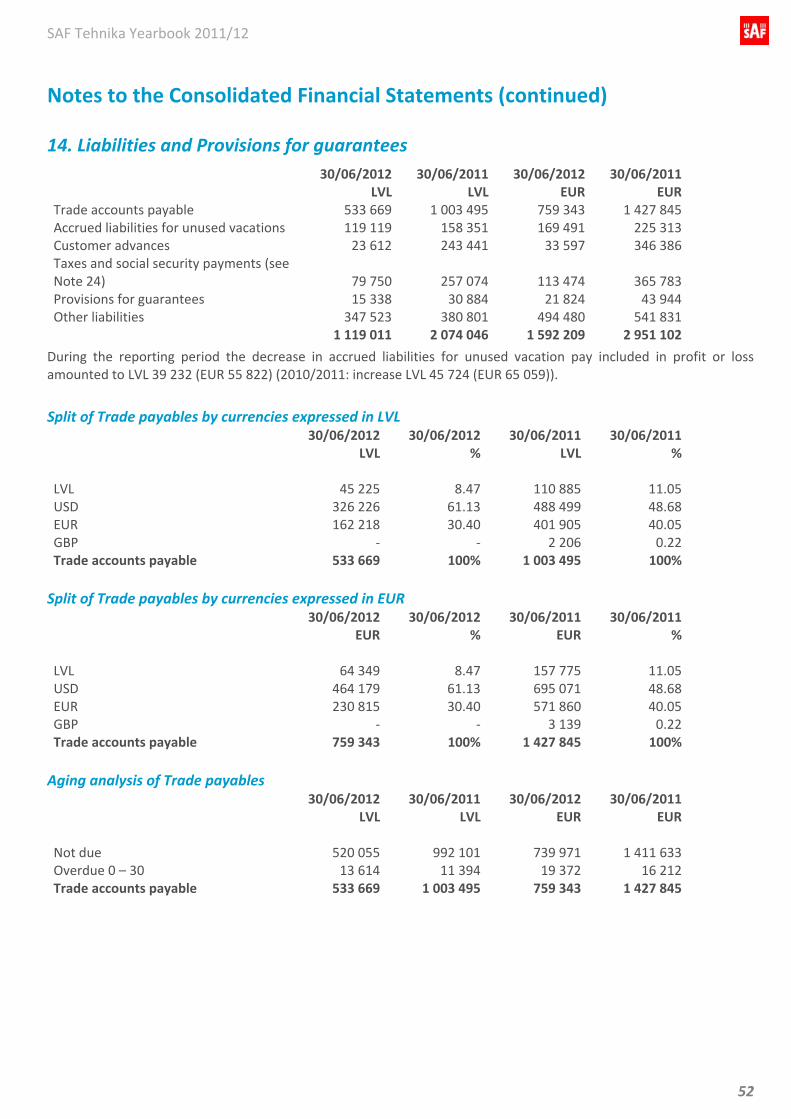
SAF Tehnika Yearbook 2011/12
52
Notes to the Consolidated Financial Statements (continued)
14. Liabilities and Provisions for guarantees 30/06/2012 30/06/2011 30/06/2012 30/06/2011 LVL LVL EUR EURTrade accounts payable 533 669 1 003 495 759 343 1 427 845Accrued liabilities for unused vacations 119 119 158 351 169 491 225 313Customer advances 23 612 243 441 33 597 346 386Taxes and social security payments (see Note 24) 79 750 257 074 113 474 365 783Provisions for guarantees 15 338 30 884 21 824 43 944Other liabilities 347 523 380 801 494 480 541 831 1 119 011 2 074 046 1 592 209 2 951 102
During the reporting period the decrease in accrued liabilities for unused vacation pay included in profit or loss amounted to LVL 39 232 (EUR 55 822) (2010/2011: increase LVL 45 724 (EUR 65 059)).
Split of Trade payables by currencies expressed in LVL 30/06/2012 30/06/2012 30/06/2011 30/06/2011 LVL % LVL % LVL 45 225 8.47 110 885 11.05USD 326 226 61.13 488 499 48.68EUR 162 218 30.40 401 905 40.05GBP ‐ ‐ 2 206 0.22Trade accounts payable 533 669 100% 1 003 495 100% Split of Trade payables by currencies expressed in EUR 30/06/2012 30/06/2012 30/06/2011 30/06/2011 EUR % EUR % LVL 64 349 8.47 157 775 11.05USD 464 179 61.13 695 071 48.68EUR 230 815 30.40 571 860 40.05GBP ‐ ‐ 3 139 0.22Trade accounts payable 759 343 100% 1 427 845 100% Aging analysis of Trade payables 30/06/2012 30/06/2011 30/06/2012 30/06/2011 LVL LVL EUR EUR Not due 520 055 992 101 739 971 1 411 633Overdue 0 – 30 13 614 11 394 19 372 16 212Trade accounts payable 533 669 1 003 495 759 343 1 427 845
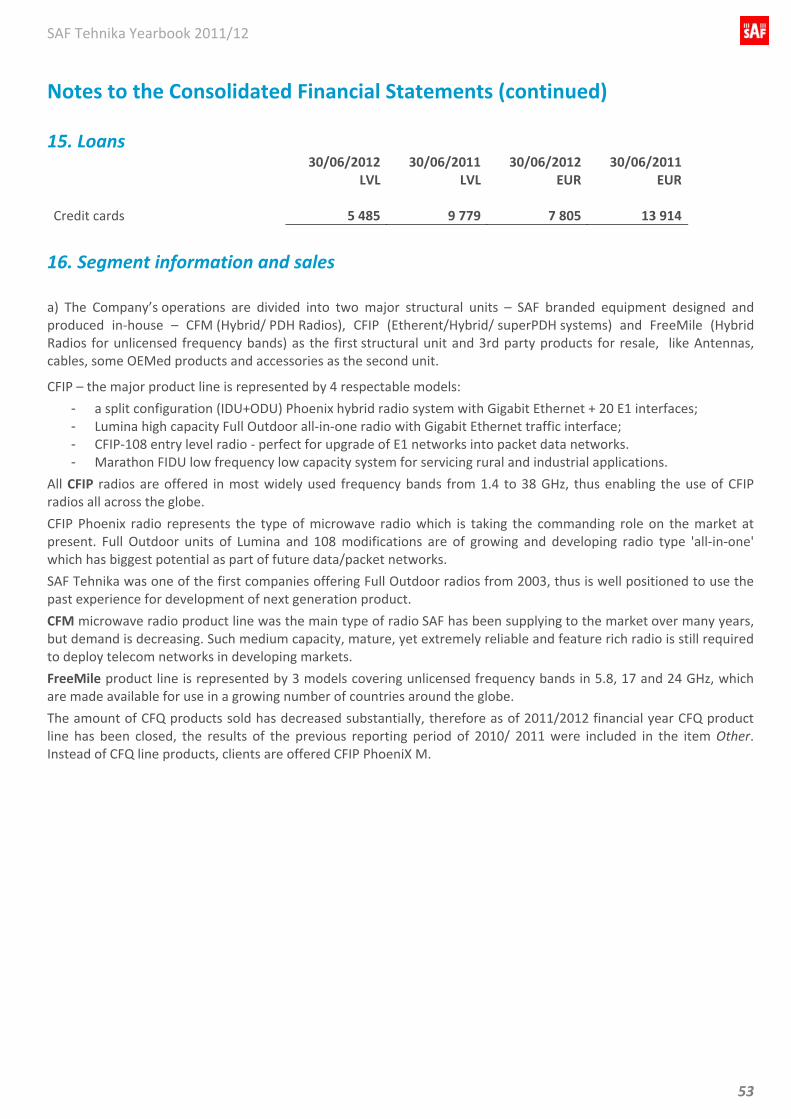
SAF Tehnika Yearbook 2011/12
53
Notes to the Consolidated Financial Statements (continued)
15. Loans 30/06/2012 30/06/2011 30/06/2012 30/06/2011 LVL LVL EUR EUR Credit cards 5 485 9 779 7 805 13 914
16. Segment information and sales a) The Company’s operations are divided into two major structural units – SAF branded equipment designed and produced in‐house – CFM (Hybrid/ PDH Radios), CFIP (Etherent/Hybrid/ superPDH systems) and FreeMile (Hybrid Radios for unlicensed frequency bands) as the first structural unit and 3rd party products for resale, like Antennas, cables, some OEMed products and accessories as the second unit.
CFIP – the major product line is represented by 4 respectable models:
- a split configuration (IDU+ODU) Phoenix hybrid radio system with Gigabit Ethernet + 20 E1 interfaces; - Lumina high capacity Full Outdoor all‐in‐one radio with Gigabit Ethernet traffic interface; - CFIP‐108 entry level radio ‐ perfect for upgrade of E1 networks into packet data networks. - Marathon FIDU low frequency low capacity system for servicing rural and industrial applications.
All CFIP radios are offered in most widely used frequency bands from 1.4 to 38 GHz, thus enabling the use of CFIP radios all across the globe.
CFIP Phoenix radio represents the type of microwave radio which is taking the commanding role on the market at present. Full Outdoor units of Lumina and 108 modifications are of growing and developing radio type 'all‐in‐one' which has biggest potential as part of future data/packet networks.
SAF Tehnika was one of the first companies offering Full Outdoor radios from 2003, thus is well positioned to use the past experience for development of next generation product.
CFM microwave radio product line was the main type of radio SAF has been supplying to the market over many years, but demand is decreasing. Such medium capacity, mature, yet extremely reliable and feature rich radio is still required to deploy telecom networks in developing markets.
FreeMile product line is represented by 3 models covering unlicensed frequency bands in 5.8, 17 and 24 GHz, which are made available for use in a growing number of countries around the globe.
The amount of CFQ products sold has decreased substantially, therefore as of 2011/2012 financial year CFQ product line has been closed, the results of the previous reporting period of 2010/ 2011 were included in the item Other. Instead of CFQ line products, clients are offered CFIP PhoeniX M.
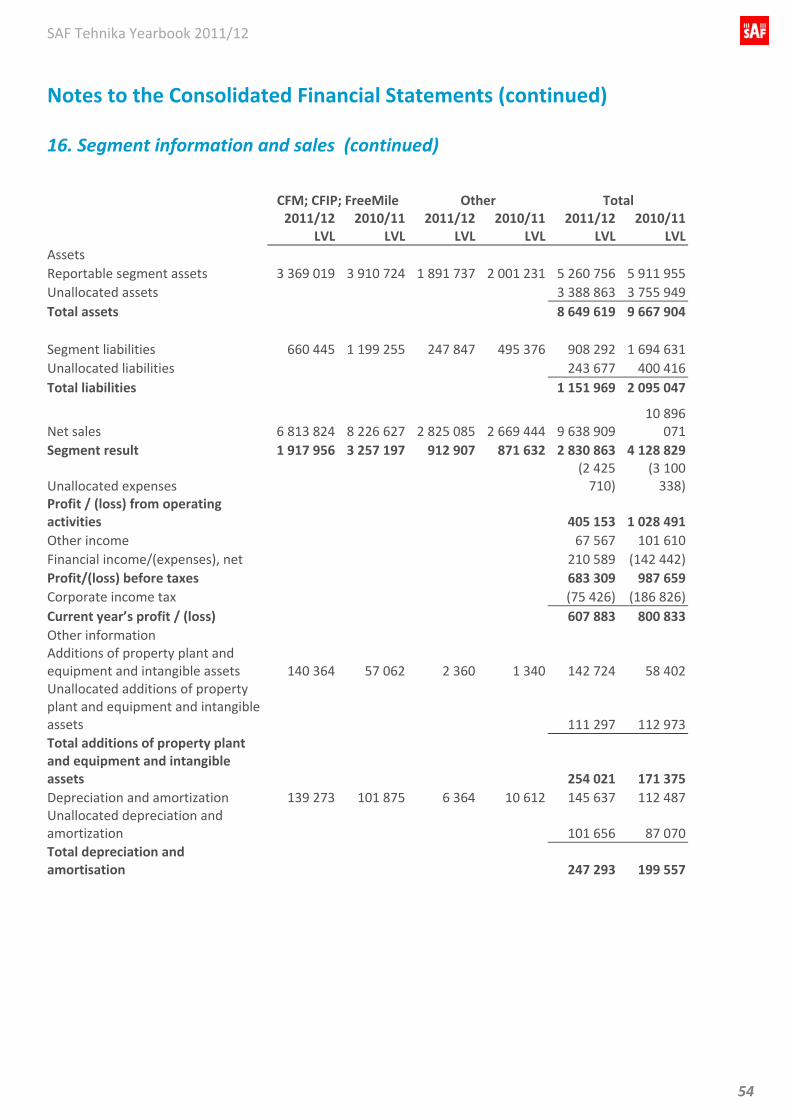
SAF Tehnika Yearbook 2011/12
54
Notes to the Consolidated Financial Statements (continued)
16. Segment information and sales (continued)
CFM; CFIP; FreeMile Other Total 2011/12 2010/11 2011/12 2010/11 2011/12 2010/11 LVL LVL LVL LVL LVL LVL
Assets Reportable segment assets 3 369 019 3 910 724 1 891 737 2 001 231 5 260 756 5 911 955Unallocated assets 3 388 863 3 755 949Total assets 8 649 619 9 667 904 Segment liabilities 660 445 1 199 255 247 847 495 376 908 292 1 694 631Unallocated liabilities 243 677 400 416Total liabilities 1 151 969 2 095 047
Net sales 6 813 824 8 226 627 2 825 085 2 669 444 9 638 909 10 896
071Segment result 1 917 956 3 257 197 912 907 871 632 2 830 863 4 128 829
Unallocated expenses (2 425 710)
(3 100 338)
Profit / (loss) from operating activities 405 153 1 028 491Other income 67 567 101 610Financial income/(expenses), net 210 589 (142 442)Profit/(loss) before taxes 683 309 987 659Corporate income tax (75 426) (186 826)Current year’s profit / (loss) 607 883 800 833Other information Additions of property plant and equipment and intangible assets 140 364 57 062 2 360 1 340 142 724 58 402Unallocated additions of property plant and equipment and intangible assets 111 297 112 973Total additions of property plant and equipment and intangible assets 254 021 171 375Depreciation and amortization 139 273 101 875 6 364 10 612 145 637 112 487Unallocated depreciation and amortization 101 656 87 070Total depreciation and amortisation 247 293 199 557
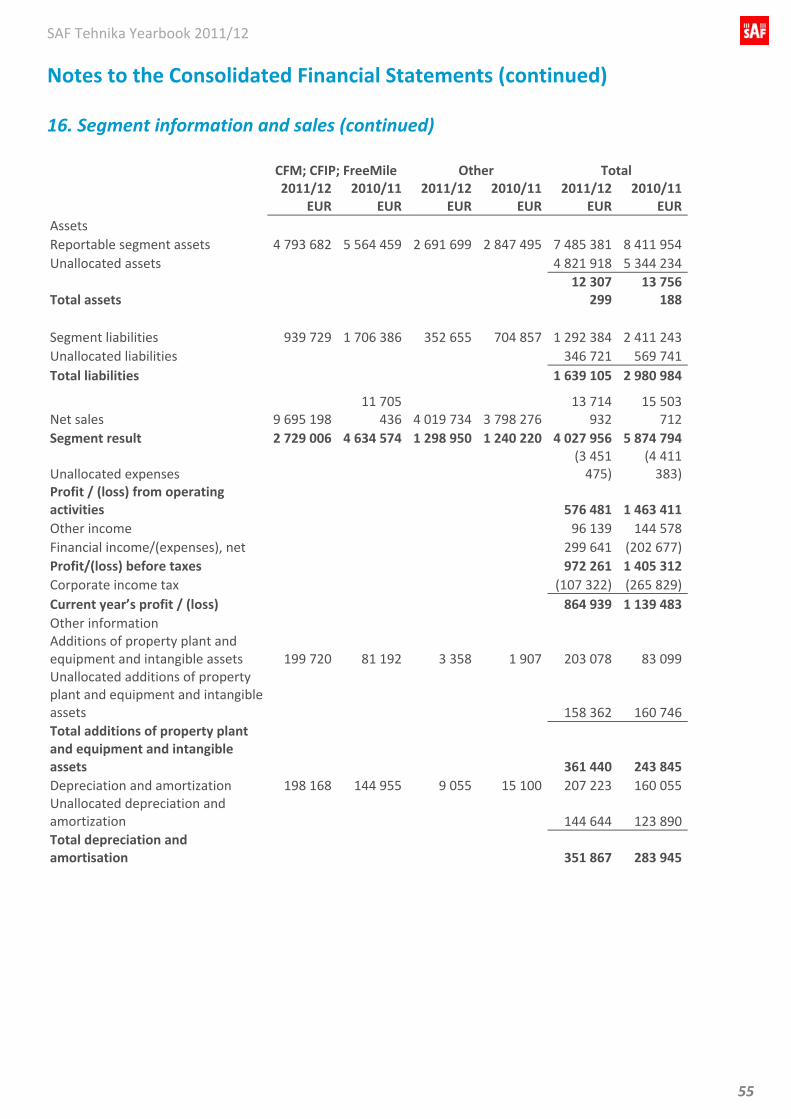
SAF Tehnika Yearbook 2011/12
55
Notes to the Consolidated Financial Statements (continued)
16. Segment information and sales (continued)
CFM; CFIP; FreeMile Other Total 2011/12 2010/11 2011/12 2010/11 2011/12 2010/11 EUR EUR EUR EUR EUR EUR
Assets Reportable segment assets 4 793 682 5 564 459 2 691 699 2 847 495 7 485 381 8 411 954Unallocated assets 4 821 918 5 344 234
Total assets 12 307
299 13 756
188 Segment liabilities 939 729 1 706 386 352 655 704 857 1 292 384 2 411 243Unallocated liabilities 346 721 569 741Total liabilities 1 639 105 2 980 984
Net sales 9 695 19811 705
436 4 019 734 3 798 27613 714
932 15 503
712Segment result 2 729 006 4 634 574 1 298 950 1 240 220 4 027 956 5 874 794
Unallocated expenses (3 451 475)
(4 411 383)
Profit / (loss) from operating activities 576 481 1 463 411Other income 96 139 144 578Financial income/(expenses), net 299 641 (202 677)Profit/(loss) before taxes 972 261 1 405 312Corporate income tax (107 322) (265 829)Current year’s profit / (loss) 864 939 1 139 483Other information Additions of property plant and equipment and intangible assets 199 720 81 192 3 358 1 907 203 078 83 099Unallocated additions of property plant and equipment and intangible assets 158 362 160 746Total additions of property plant and equipment and intangible assets 361 440 243 845Depreciation and amortization 198 168 144 955 9 055 15 100 207 223 160 055Unallocated depreciation and amortization 144 644 123 890Total depreciation and amortisation 351 867 283 945
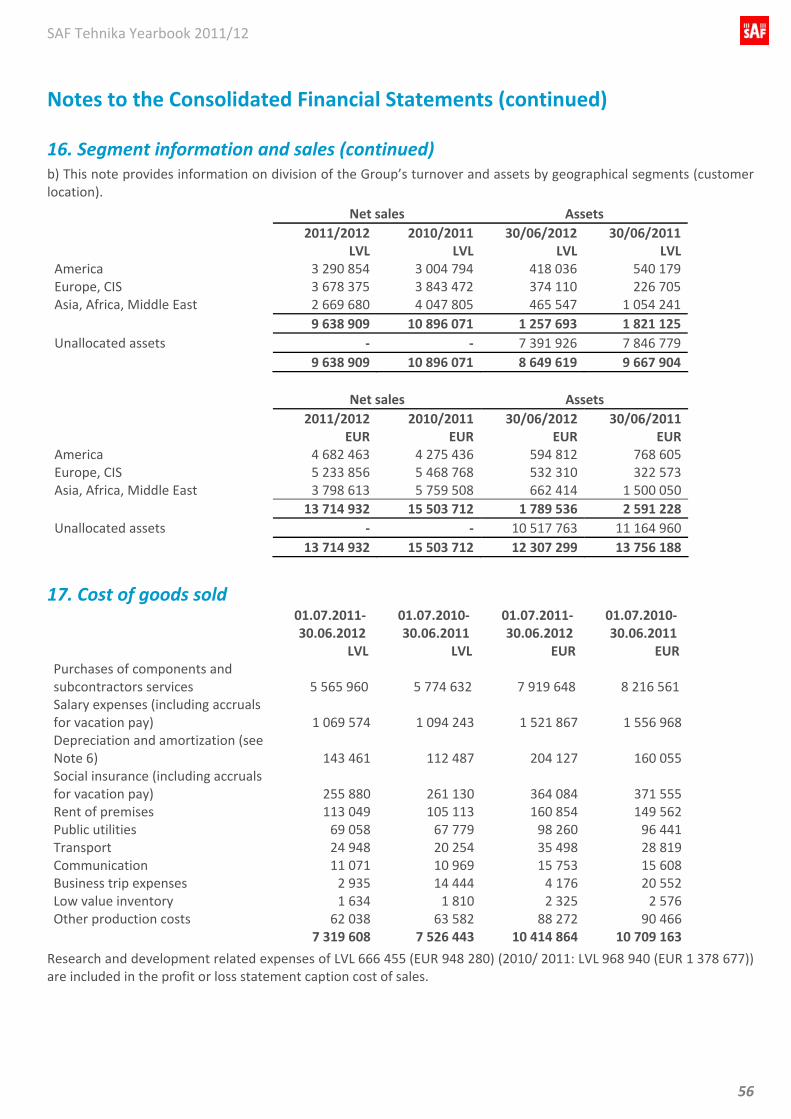
SAF Tehnika Yearbook 2011/12
56
Notes to the Consolidated Financial Statements (continued)
16. Segment information and sales (continued) b) This note provides information on division of the Group’s turnover and assets by geographical segments (customer location).
Net sales Assets 2011/2012 2010/2011 30/06/2012 30/06/2011 LVL LVL LVL LVLAmerica 3 290 854 3 004 794 418 036 540 179Europe, CIS 3 678 375 3 843 472 374 110 226 705Asia, Africa, Middle East 2 669 680 4 047 805 465 547 1 054 241 9 638 909 10 896 071 1 257 693 1 821 125Unallocated assets ‐ ‐ 7 391 926 7 846 779 9 638 909 10 896 071 8 649 619 9 667 904
Net sales Assets 2011/2012 2010/2011 30/06/2012 30/06/2011 EUR EUR EUR EURAmerica 4 682 463 4 275 436 594 812 768 605Europe, CIS 5 233 856 5 468 768 532 310 322 573Asia, Africa, Middle East 3 798 613 5 759 508 662 414 1 500 050 13 714 932 15 503 712 1 789 536 2 591 228Unallocated assets ‐ ‐ 10 517 763 11 164 960 13 714 932 15 503 712 12 307 299 13 756 188
17. Cost of goods sold 01.07.2011‐
30.06.2012 01.07.2010‐30.06.2011
01.07.2011‐30.06.2012
01.07.2010‐30.06.2011
LVL LVL EUR EUR Purchases of components and subcontractors services 5 565 960 5 774 632 7 919 648 8 216 561 Salary expenses (including accruals for vacation pay) 1 069 574 1 094 243 1 521 867 1 556 968Depreciation and amortization (see Note 6) 143 461 112 487 204 127 160 055Social insurance (including accruals for vacation pay) 255 880 261 130 364 084 371 555Rent of premises 113 049 105 113 160 854 149 562Public utilities 69 058 67 779 98 260 96 441Transport 24 948 20 254 35 498 28 819Communication 11 071 10 969 15 753 15 608Business trip expenses 2 935 14 444 4 176 20 552Low value inventory 1 634 1 810 2 325 2 576Other production costs 62 038 63 582 88 272 90 466 7 319 608 7 526 443 10 414 864 10 709 163
Research and development related expenses of LVL 666 455 (EUR 948 280) (2010/ 2011: LVL 968 940 (EUR 1 378 677)) are included in the profit or loss statement caption cost of sales.
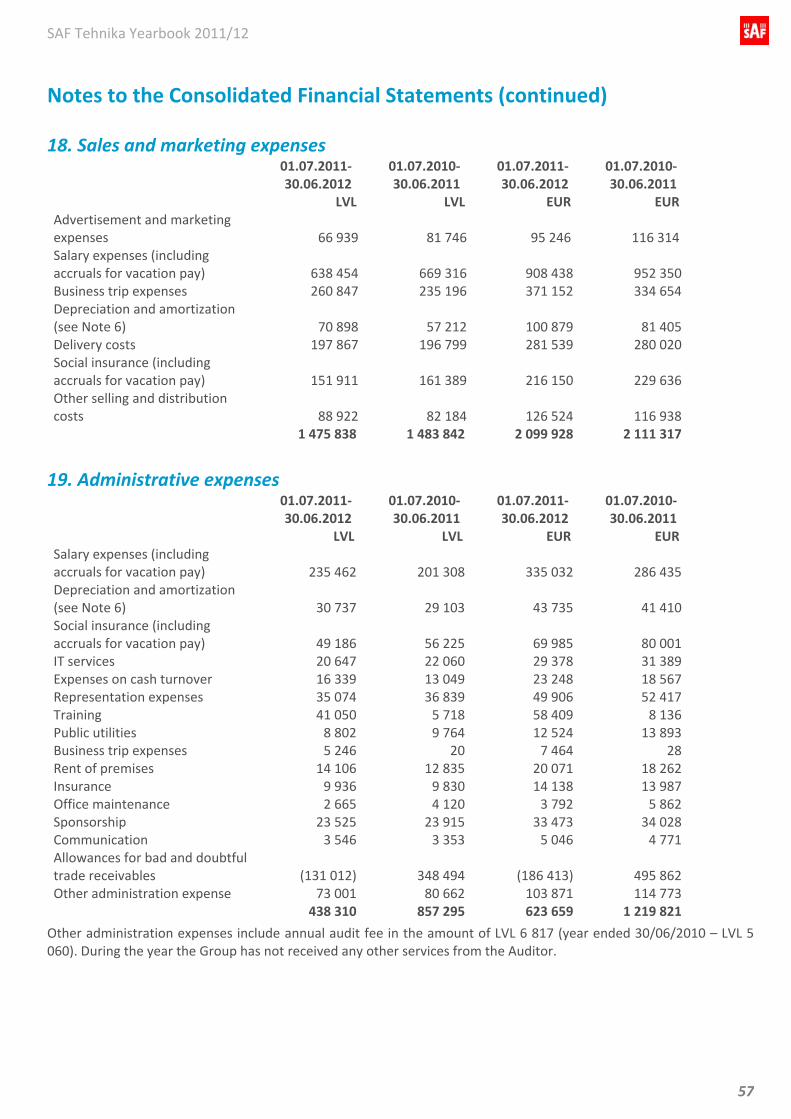
SAF Tehnika Yearbook 2011/12
57
Notes to the Consolidated Financial Statements (continued)
18. Sales and marketing expenses 01.07.2011‐
30.06.2012 01.07.2010‐30.06.2011
01.07.2011‐30.06.2012
01.07.2010‐30.06.2011
LVL LVL EUR EUR Advertisement and marketing expenses 66 939 81 746 95 246 116 314 Salary expenses (including accruals for vacation pay) 638 454 669 316 908 438 952 350Business trip expenses 260 847 235 196 371 152 334 654Depreciation and amortization (see Note 6) 70 898 57 212 100 879 81 405Delivery costs 197 867 196 799 281 539 280 020Social insurance (including accruals for vacation pay) 151 911 161 389 216 150 229 636Other selling and distribution costs 88 922 82 184 126 524 116 938 1 475 838 1 483 842 2 099 928 2 111 317
19. Administrative expenses 01.07.2011‐
30.06.2012 01.07.2010‐30.06.2011
01.07.2011‐30.06.2012
01.07.2010‐30.06.2011
LVL LVL EUR EUR Salary expenses (including accruals for vacation pay) 235 462 201 308 335 032 286 435Depreciation and amortization (see Note 6) 30 737 29 103 43 735 41 410Social insurance (including accruals for vacation pay) 49 186 56 225 69 985 80 001IT services 20 647 22 060 29 378 31 389Expenses on cash turnover 16 339 13 049 23 248 18 567Representation expenses 35 074 36 839 49 906 52 417Training 41 050 5 718 58 409 8 136Public utilities 8 802 9 764 12 524 13 893Business trip expenses 5 246 20 7 464 28Rent of premises 14 106 12 835 20 071 18 262Insurance 9 936 9 830 14 138 13 987Office maintenance 2 665 4 120 3 792 5 862Sponsorship 23 525 23 915 33 473 34 028Communication 3 546 3 353 5 046 4 771Allowances for bad and doubtful trade receivables (131 012) 348 494 (186 413) 495 862Other administration expense 73 001 80 662 103 871 114 773 438 310 857 295 623 659 1 219 821
Other administration expenses include annual audit fee in the amount of LVL 6 817 (year ended 30/06/2010 – LVL 5 060). During the year the Group has not received any other services from the Auditor.
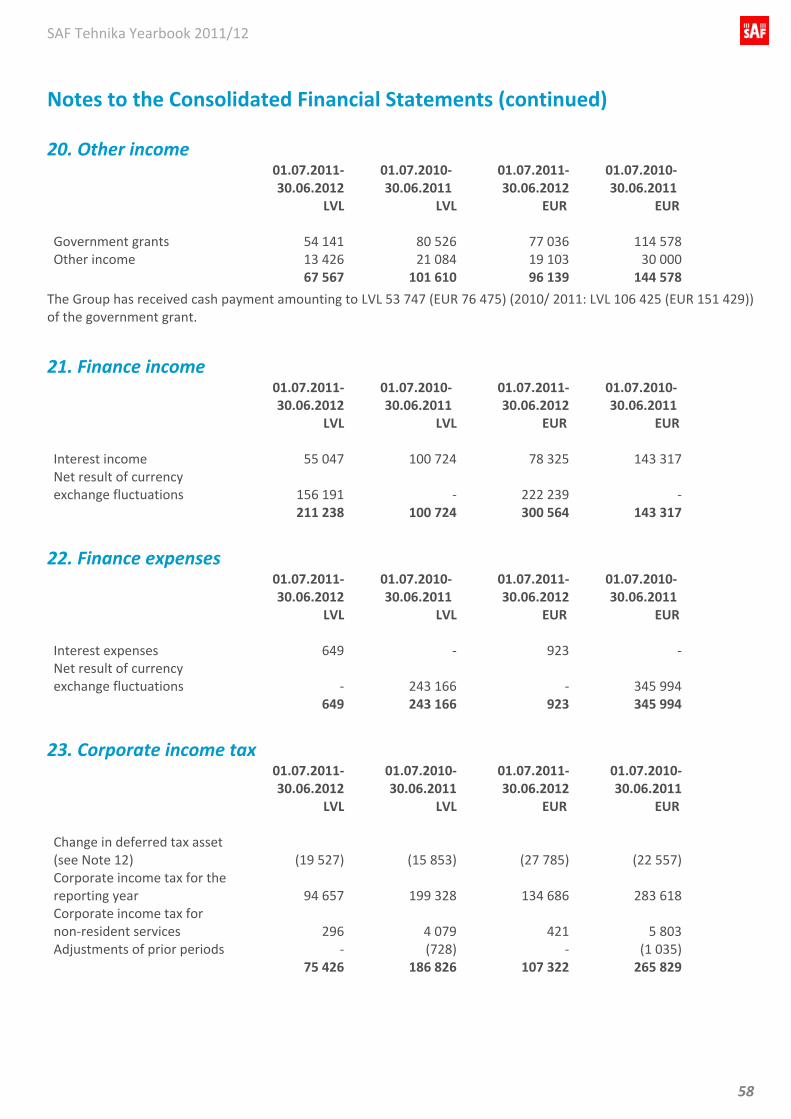
SAF Tehnika Yearbook 2011/12
58
Notes to the Consolidated Financial Statements (continued)
20. Other income 01.07.2011‐
30.06.201201.07.2010‐30.06.2011
01.07.2011‐30.06.2012
01.07.2010‐30.06.2011
LVL LVL EUR EUR Government grants 54 141 80 526 77 036 114 578Other income 13 426 21 084 19 103 30 000 67 567 101 610 96 139 144 578
The Group has received cash payment amounting to LVL 53 747 (EUR 76 475) (2010/ 2011: LVL 106 425 (EUR 151 429)) of the government grant.
21. Finance income 01.07.2011‐
30.06.201201.07.2010‐30.06.2011
01.07.2011‐30.06.2012
01.07.2010‐30.06.2011
LVL LVL EUR EUR Interest income 55 047 100 724 78 325 143 317Net result of currency exchange fluctuations 156 191 ‐
222 239 ‐
211 238 100 724 300 564 143 317
22. Finance expenses 01.07.2011‐
30.06.201201.07.2010‐30.06.2011
01.07.2011‐30.06.2012
01.07.2010‐30.06.2011
LVL LVL EUR EUR Interest expenses 649 ‐ 923 ‐Net result of currency exchange fluctuations ‐ 243 166
‐ 345 994
649 243 166 923 345 994
23. Corporate income tax 01.07.2011‐
30.06.201201.07.2010‐30.06.2011
01.07.2011‐30.06.2012
01.07.2010‐30.06.2011
LVL LVL EUR EUR Change in deferred tax asset (see Note 12) (19 527) (15 853) (27 785) (22 557)Corporate income tax for the reporting year 94 657 199 328 134 686 283 618Corporate income tax for non‐resident services 296 4 079 421 5 803Adjustments of prior periods ‐ (728) ‐ (1 035) 75 426 186 826 107 322 265 829
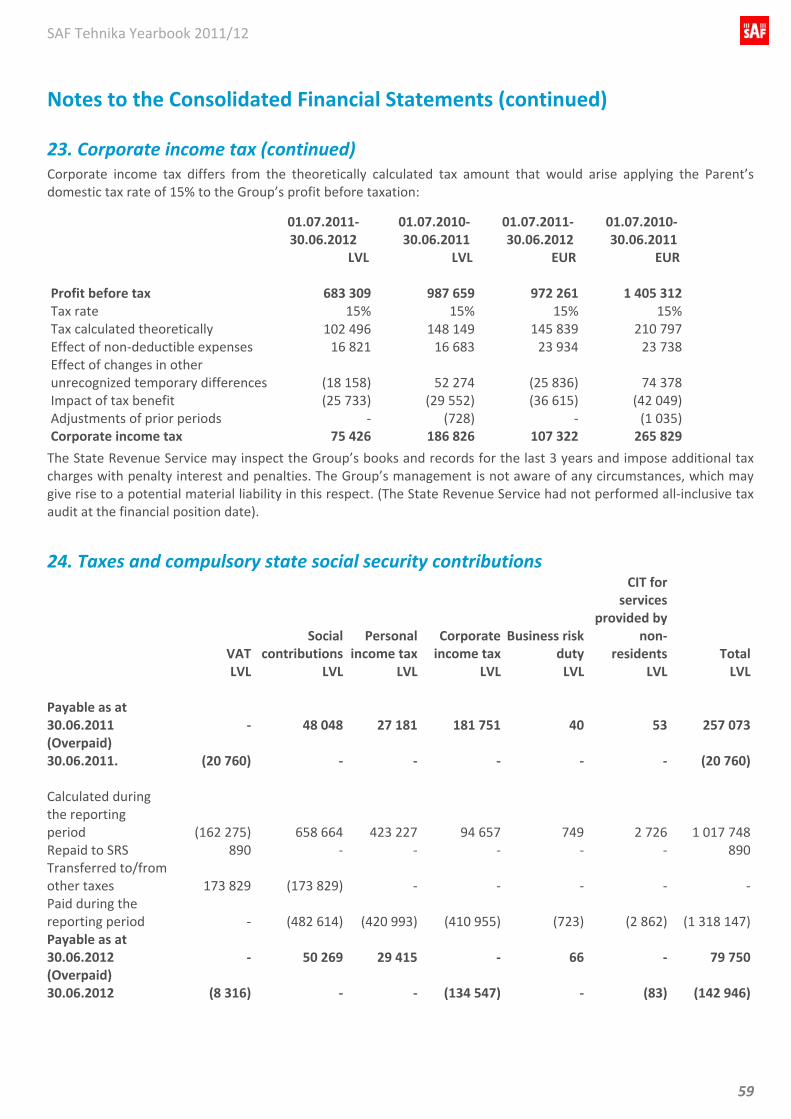
SAF Tehnika Yearbook 2011/12
59
Notes to the Consolidated Financial Statements (continued)
23. Corporate income tax (continued) Corporate income tax differs from the theoretically calculated tax amount that would arise applying the Parent’s domestic tax rate of 15% to the Group’s profit before taxation:
01.07.2011‐30.06.2012
01.07.2010‐30.06.2011
01.07.2011‐30.06.2012
01.07.2010‐30.06.2011
LVL LVL EUR EUR Profit before tax 683 309 987 659 972 261 1 405 312Tax rate 15% 15% 15% 15%Tax calculated theoretically 102 496 148 149 145 839 210 797Effect of non‐deductible expenses 16 821 16 683 23 934 23 738Effect of changes in other unrecognized temporary differences (18 158) 52 274
(25 836) 74 378
Impact of tax benefit (25 733) (29 552) (36 615) (42 049)Adjustments of prior periods ‐ (728) ‐ (1 035)Corporate income tax 75 426 186 826 107 322 265 829
The State Revenue Service may inspect the Group’s books and records for the last 3 years and impose additional tax charges with penalty interest and penalties. The Group’s management is not aware of any circumstances, which may give rise to a potential material liability in this respect. (The State Revenue Service had not performed all‐inclusive tax audit at the financial position date).
24. Taxes and compulsory state social security contributions
VAT Social
contributionsPersonal
income taxCorporate income tax
Business risk duty
CIT for services
provided by non‐
residents Total LVL LVL LVL LVL LVL LVL LVL Payable as at 30.06.2011 ‐ 48 048 27 181 181 751 40 53 257 073 (Overpaid) 30.06.2011. (20 760) ‐ ‐ ‐ ‐ ‐ (20 760) Calculated during the reporting period (162 275) 658 664 423 227 94 657 749 2 726 1 017 748Repaid to SRS 890 ‐ ‐ ‐ ‐ ‐ 890Transferred to/from other taxes 173 829 (173 829) ‐ ‐ ‐ ‐ ‐Paid during the reporting period ‐ (482 614) (420 993) (410 955) (723) (2 862) (1 318 147)Payable as at 30.06.2012 ‐ 50 269 29 415 ‐ 66 ‐ 79 750(Overpaid) 30.06.2012 (8 316) ‐ ‐ (134 547) ‐ (83) (142 946)
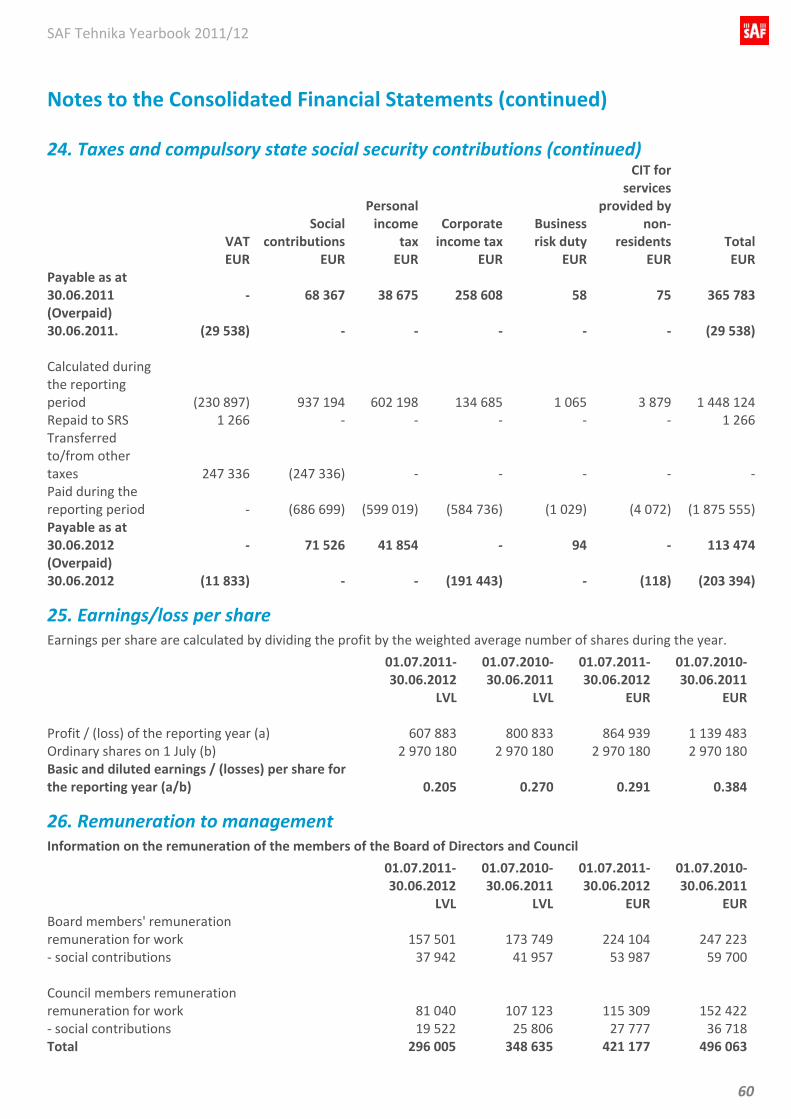
SAF Tehnika Yearbook 2011/12
60
Notes to the Consolidated Financial Statements (continued)
24. Taxes and compulsory state social security contributions (continued)
VAT Social
contributions
Personal income
taxCorporate income tax
Business risk duty
CIT for services
provided by non‐
residents Total EUR EUR EUR EUR EUR EUR EURPayable as at 30.06.2011 ‐ 68 367 38 675 258 608 58 75 365 783 (Overpaid) 30.06.2011. (29 538) ‐ ‐ ‐ ‐ ‐ (29 538) Calculated during the reporting period (230 897) 937 194 602 198 134 685 1 065 3 879 1 448 124Repaid to SRS 1 266 ‐ ‐ ‐ ‐ ‐ 1 266Transferred to/from other taxes 247 336 (247 336) ‐ ‐ ‐ ‐ ‐Paid during the reporting period ‐ (686 699) (599 019) (584 736) (1 029) (4 072) (1 875 555)Payable as at 30.06.2012 ‐ 71 526 41 854 ‐ 94 ‐ 113 474(Overpaid) 30.06.2012 (11 833) ‐ ‐ (191 443) ‐ (118) (203 394)
25. Earnings/loss per share Earnings per share are calculated by dividing the profit by the weighted average number of shares during the year.
01.07.2011‐30.06.2012
01.07.2010‐30.06.2011
01.07.2011‐30.06.2012
01.07.2010‐30.06.2011
LVL LVL EUR EUR Profit / (loss) of the reporting year (a) 607 883 800 833 864 939 1 139 483Ordinary shares on 1 July (b) 2 970 180 2 970 180 2 970 180 2 970 180Basic and diluted earnings / (losses) per share for the reporting year (a/b) 0.205 0.270
0.291 0.384
26. Remuneration to management Information on the remuneration of the members of the Board of Directors and Council
01.07.2011‐30.06.2012
01.07.2010‐30.06.2011
01.07.2011‐30.06.2012
01.07.2010‐30.06.2011
LVL LVL EUR EURBoard members' remuneration remuneration for work 157 501 173 749 224 104 247 223‐ social contributions 37 942 41 957 53 987 59 700 Council members remuneration remuneration for work 81 040 107 123 115 309 152 422‐ social contributions 19 522 25 806 27 777 36 718Total 296 005 348 635 421 177 496 063

SAF Tehnika Yearbook 2011/12
61
Notes to the Consolidated Financial Statements (continued)
27. Related party transactions Related parties represent both legal entities and private individuals related to the Group in accordance with the following rules.
a) A person or a close member of that person’s family is related to a group entity if that person:
i. has control or joint control over the group entity; ii. has significant influence over the reporting group entity; or iii. is a member of the key management personnel of the reporting group entity or of a parent of the reporting
entity.
b) An entity is related to a reporting group entity if any of the following conditions applies:
i. The entity and the reporting group entity are members of the same group (which means that each parent, subsidiary and fellow subsidiary is related to the others).
ii. One entity is an associate or joint venture of the other entity (or an associate or joint venture of a member of a group of which the other entity is a member).
iii. Both entities are joint ventures of the same third party. iv. One entity is a joint venture of a third entity and the other entity is an associate of the third entity. v. The entity is a post‐employment benefit plan for the benefit of employees of either the reporting group entity
or an entity related to the reporting entity. If the reporting entity is itself such a plan, the sponsoring employers are also related to the reporting entity.
vi. The entity is controlled, or jointly controlled by a person identified in (a). vii. A person identified in (a)(i) has significant influence over the entity or is a member of the key management
personnel of the entity (or of a parent of the entity).
Related party transaction ‐ A transfer of resources, services or obligations between a reporting group entity and a related party, regardless of whether a price is charged.
As of 1 July 2011 to 30 June 2012 the Group did not have any transactions with related parties.
28. Personnel costs 01.07.2011‐
30.06.201201.07.2010‐30.06.2011
01.07.2011‐30.06.2012
01.07.2010‐30.06.2011
LVL LVL EUR EUR Remuneration to staff 1 954 730 1 964 866 2 781 330 2 795 753Social contributions 459 685 478 744 654 073 681 191Total 2 414 415 2 443 610 3 435 403 3 476 944
29. Average number of employees 01.07.2011‐
30.06.201201.07.2010‐30.06.2011
The average number of staff in the reporting year: 165 163
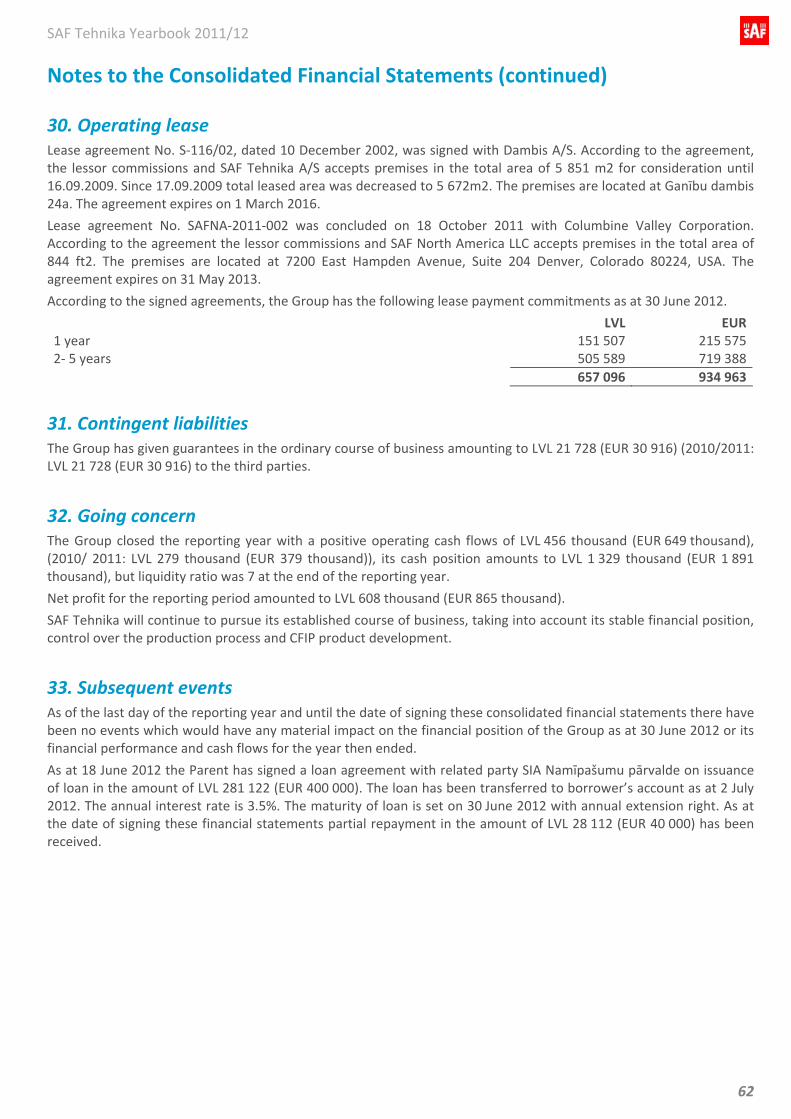
SAF Tehnika Yearbook 2011/12
62
Notes to the Consolidated Financial Statements (continued)
30. Operating lease Lease agreement No. S‐116/02, dated 10 December 2002, was signed with Dambis A/S. According to the agreement, the lessor commissions and SAF Tehnika A/S accepts premises in the total area of 5 851 m2 for consideration until 16.09.2009. Since 17.09.2009 total leased area was decreased to 5 672m2. The premises are located at Ganību dambis 24a. The agreement expires on 1 March 2016.
Lease agreement No. SAFNA‐2011‐002 was concluded on 18 October 2011 with Columbine Valley Corporation. According to the agreement the lessor commissions and SAF North America LLC accepts premises in the total area of 844 ft2. The premises are located at 7200 East Hampden Avenue, Suite 204 Denver, Colorado 80224, USA. The agreement expires on 31 May 2013.
According to the signed agreements, the Group has the following lease payment commitments as at 30 June 2012.
LVL EUR1 year 151 507 215 5752‐ 5 years 505 589 719 388 657 096 934 963
31. Contingent liabilities The Group has given guarantees in the ordinary course of business amounting to LVL 21 728 (EUR 30 916) (2010/2011: LVL 21 728 (EUR 30 916) to the third parties.
32. Going concern The Group closed the reporting year with a positive operating cash flows of LVL 456 thousand (EUR 649 thousand), (2010/ 2011: LVL 279 thousand (EUR 379 thousand)), its cash position amounts to LVL 1 329 thousand (EUR 1 891 thousand), but liquidity ratio was 7 at the end of the reporting year.
Net profit for the reporting period amounted to LVL 608 thousand (EUR 865 thousand).
SAF Tehnika will continue to pursue its established course of business, taking into account its stable financial position, control over the production process and CFIP product development.
33. Subsequent events As of the last day of the reporting year and until the date of signing these consolidated financial statements there have been no events which would have any material impact on the financial position of the Group as at 30 June 2012 or its financial performance and cash flows for the year then ended.
As at 18 June 2012 the Parent has signed a loan agreement with related party SIA Namīpašumu pārvalde on issuance of loan in the amount of LVL 281 122 (EUR 400 000). The loan has been transferred to borrower’s account as at 2 July 2012. The annual interest rate is 3.5%. The maturity of loan is set on 30 June 2012 with annual extension right. As at the date of signing these financial statements partial repayment in the amount of LVL 28 112 (EUR 40 000) has been received.


