34
1 Uncertainty Appraisal Report Klaas Metselaar, Karel Keesman, Wopke van der Werf, Herman van Keulen. August 2004.

1
Uncertainty Appraisal Report Klaas Metselaar, Karel Keesman, Wopke van der Werf, Herman van Keulen. August 2004.

2
Abstract ................................................................................................................................................... 4
1. Introduction................................................................................................................................... 5
2. Uncertainty analysis in a set-membership context..................................................................... 7
3. Model identification and evaluation cycle................................................................................... 7
4. Set parameter estimation procedure (calibration) ..................................................................... 8
4.1. Define bounds on data................................................................................................................ 8 4.1.1 Ideal procedure ................................................................................................................ 8 4.1.2 Actual procedure............................................................................................................... 9
4.2. Select the parameters to be estimated from the experiment. .................................................... 10 4.2.1 Ideal procedure ............................................................................................................... 10 4.2.2 Actual procedure............................................................................................................. 11
4.3. Set the parameter space to be searched. ................................................................................. 11 4.3.1 Ideal procedure ............................................................................................................... 11 4.3.2 Actual procedure............................................................................................................. 11
4.4. Define a procedure to generate a first acceptable parameter vector....................................... 11 4.4.1 Ideal procedure ............................................................................................................... 11 4.4.2 Actual procedure............................................................................................................. 11
4.5. Select the procedure to generate parameter vectors. ............................................................... 11 4.5.1 Ideal procedure ............................................................................................................... 11 4.5.2 Actual procedure............................................................................................................. 12
5. Set based validation. ................................................................................................................... 12
5.1 Ideal procedure ........................................................................................................................ 12
5.2 Actual procedure. ..................................................................................................................... 12
6. Results .......................................................................................................................................... 12
6.1 Feasible point detection ........................................................................................................... 12
6.2 Feasible parameter sets ........................................................................................................... 12 6.2.1 An example for trees (cherry)......................................................................................... 13 6.2.2 An example for a crop (forage maize) ............................................................................ 15
6.3 Validation on site experiments ................................................................................................. 16 6.3.1 Tree species .................................................................................................................... 16 6.3.2 Crop species.................................................................................................................... 18 6.3.3 Conclusions from the validation on monocultures. ........................................................ 19
6.4 Validation on agroforestry systems.......................................................................................... 19
7. Discussion .................................................................................................................................... 20
8. Conclusions.................................................................................................................................. 21
References ............................................................................................................................................. 21

3
Appendix 1: Objectives of the SAFE-project ..................................................................................... 23
Appendix 2: Simplifying approaches to SAFE-result to determine initial parameter estimates...24
Appendix 3: Overall calibration results tree and crop species. ........................................................ 26
Appendix 4: Justification crop yield bounds...................................................................................... 29
Appendix 5: Analysis of correlation structure in sets of acceptable parameter vectors ................ 31
Appendix 6: Additional documentation.............................................................................................. 33

4
Abstract The analysis presented in this report is executed in the context of the SAFE project. The report describes the methodology to describe uncertainty in the biophysical output (crop yield and tree wood production) of an agroforestry model (Yield-SAFE). Described within the context of a model identification procedure the ideal subprocedures are described and contrasted with the subprocedures actually used. Case studies at the level of the individual crop and at the level of the agroforestry system are analyzed. The performance of the model is assessed, and uncertainty in model parameters established. A large discrepancy between ideal and actual procedures followed is observed. This leads to the conclusion that given this discrepancy and the workload the proposed procedure already generates it is justifiable to assume a 15% overall uncertainty in the model parameters, instead of following the proposed procedure for all crops and all trees.

5
1. Introduction Within the SAFE-project (Appendix 1) mathematical modelling is envisioned as a major tool to increase understanding of the underlying crop/tree growth mechanisms under light, water and nutrient competition and to explore long-term effects of environmental conditions and management on yields of trees and crop. A mathematical model can only be applied successfully if it is a proper description, in terms of model structure and model parameters (model identification), of the underlying processes. Hence, theoretical modelling is not enough. There is also a need for identification of the model from experimental data. An acceptable model identification procedure yields the model structure, the parameter values and the parameter confidence intervals. In the case of agroforestry systems the options for model identification are strongly limited by the long term research requirements and commitments required. The datasets available -especially for innovative production systems - represent young systems. In general this limits the maximum number of parameters that can be estimated from a single experiment. In addition classic identification theory requires an additional model for errors in the experimental data. This error model requires assumptions regarding error distribution and error independence in experimental data. Problems in datasets, such as possible heteroskedasticity of the error variance and the occurrence of outliers need to be addressed. In addition, imperfect knowledge regarding model parameters combined with the impossibility to estimate all parameters simultaneously will bias parameter estimates. Even worse, estimates of parameter confidence intervals under the classic assumption of error independence are formally invalid. The classic approach to model identification, founded in statistical regression theory, which requires a formal definition of an error model for the data, is therefore very problematical. A so-called set-membership approach, where the experimental output data is expressed in bounds only, may help to circumvent some of the aforementioned problems (see Keesman, 2002, for a recent overview of non-linear bounding problems). However, the model will never be perfect, and knowledge about the agroforestry system will remain imperfect. Keeping these considerations in mind a model for agroforestry systems was developed. The model is called Yield-SAFE; from “YIeld Estimator for Long term Design of Silvo-Arable Agro-Forestry in Europe”. The model is a conscious attempt to keep processes and parameters to a just acceptable minimum. The model describes time courses of crop biomass, crop leaf area index, tree biomass, tree leaf area, number of shoots per tree, and a heat sum defining crop phenology. A simple water balance submodel allows to simulate the effects of water shortages. Daily inputs are temperature, global radiation and precipitation. The model has been described in a previous report (Stappers et al., 2003). This report focuses on uncertainty analysis. Uncertainty analysis, i.e. establishing the effect of imperfect knowledge on model outputs, is a very important step in the modelling process and in the application of the model in decision making. There are

6
different aspects in which knowledge is imperfect. This holds in different degrees for simple and complex models - for simple models one would like to know the effect of what has been left out; for complex models one would like to know the joint interactive effects of all the included detail. In uncertainty analysis one is mainly concerned with the effect that various sources of uncertainty have on the model output. Model sources of uncertainty can be in: (i) model inputs, (ii) model parameter values, (iii) initial state conditions, and in (iv) model structure. In this report we mainly focus on type (ii) of uncertainty. The results of uncertainty analysis have a direct bearing on the applicability of the developed mathematical model. The closest analogy is that of statistical hypothesis testing. Comparing two different experiments in terms of means and measurement error one may test whether the difference in outcome is statistically significant. Model-based uncertainty analysis allows to compare two simulated experiments in terms of the simulated means and the uncertainty. If the uncertainty in the simulated experimental outcome is larger than the difference between the simulated means the experiments do not differ (enough) or the model outcome is too uncertain. Uncertainty analysis allows scientists and policy makers to weigh information provided by simulation experiments. Objective of this report The objective of this report is to provide the partners with the basic information and procedures which allows them to simulate the performance of different agroforestry systems and its uncertainty. It provides the basis to assess and further evaluate the bio-physical uncertainty in the Yield-SAFE model. In combination with the uncertainty in the economic parameters the proposed procedures will serve and allow to critically compare results of the proposed model for agroforestry systems for different policy and management options. Overview/outline report The report describes the methodology to describe uncertainty in the biophysical output (crop yield and tree wood production) of an agroforestry model. Described within the context of a model identification procedure the ideal subprocedures are described and contrasted with the subprocedures actually used. Case studies at the level of the individual crop and at the level of the agroforestry system are analyzed. The performance of the model is assessed.

7
2. Uncertainty analysis in a set-membership context Central to the approach in this report is the concept of set-membership uncertainty analysis. To illustrate the set membership uncertainty analysis a simple example is presented in Figure 1. Available data are used to define acceptable and unacceptable model behaviour. Acceptable behaviour is defined by the area between the blue crosses in Figure 1a. At present model behaviour given the parameter values is unacceptable (red line in Figure 1a) This is followed by a systematic search in parameter space (Figure 1b) to identify those parameter values that generate acceptable model behaviour. All parameter values resulting in model outputs within the bounds are accepted (blue curves in Figure 1c). The set of parameter values (presented in Figure 1d) can now be used to investigate policy options and execute scenario analyses.
3. Model identification and evaluation cycle. Whereas the uncertainty analysis is central to this document it forms part of a model improvement and evaluation cycle within the project as sketched in Figure 2. The objectives of this improvement and evaluation cycle are 1) assess and improve the quality of the tools developed 2) generate scenario results (time series) with their associated uncertainties.

8
Figure 2 Model identification and evaluation cycle containing calibration, validation and revision steps, with a restart of the cycle if validation using agroforestry site experiments yields results that are not satisfactory. In the evaluation and improvement cycle, sets of model parameters are estimated from experiments on monocultures of trees and crops, which are subsequently used to predict the performance of both monocultures and agroforestry systems. These predictions serve to evaluate whether the parameter sets reflect the variation in the population. If the (sub)models show systematical prediction errors, the (sub)models may have to be modified to reduce these errors. If the errors are random, the parameter sets are revised (i.e. the bounds in the calibration procedure are extended to include the additional variation). The procedures -the set parameter estimation and the validation procedure- have to be adapted to the actual situation (data availability, required results)
4. Set parameter estimation procedure (calibration) The procedure consists of the following steps: 1- define acceptable model performance (define bounded output domain), 2- define parameter space to be searched (define bounded input domain), 3 - define search procedure (define the way in which the parameter domain is to be searched), 4- search parameter space and identify acceptable set (define (that part of) the parameter domain which produces model output in the acceptable output domain). In this paragraph the ideal procedure and that actually applied will be described.
4.1. Define bounds on data
4.1.1 Ideal procedure In a set-theoretical context one assumes that observations have an unknown, but bounded error, i.e. the interval within which the true value of the observation is
9
located is known, but its actual value is unknown. This minimal assumption is in very strong contrast to statistical parameter estimation theory, which assumes errors to be identically and independently distributed, and assumes a specific probability distribution function. In both approaches, whether defining the bounds or the error distribution, the definition has to be based on a representative sample from the population of interest. We are interested in predicting tree growth and crop yield for an arbitrary location in a climatologically homogeneous region, an eco-region. The tree growth and crop yield are to be predicted (at first) under potential conditions, i.e. factors other than radiation and temperature are assumed to be non-limiting. This population of "potential production situations" is represented by a sample from the region. Bounds are ideally determined on the basis of the variation of crop and tree growth within this sample.
4.1.2 Actual procedure Choice of eco-regions Climatologically homogeneous regions are defined in the Environmental classification of Europe (see e.g. Mücher et al. 2003). In the meeting in Toulouse and subsequent discussions it was decided to analyze production in three regions: Atlantic, Continental and Mediterranean. Atlantic was assumed to be represented by the meteorological data of Orleans, Continental by those of München, and Mediterranean by those of Madrid. Choice of tree species/crop species In the project studies focused on walnut hybrids (Juglans regia × Juglans nigra), holm oak (Quercus ilex), cherry (Prunus avium), poplar (Populus sp.), stone pine (Pinus pinea). Crops selected were grain and forage maize, winter wheat, durum wheat, and sunflower. In addition oilseed rape, alfalfa, and grass were regarded as desirable for simulation - in order to be able to simulate a complete rotation (or the shift from arable crops to grassland). Alfalfa and grass are perennial species that would require substantial modifications to the crop submodel, and have therefore not been included in this report. Available data Generally the sample size for both trees and crops was not sufficient to identify or estimate bounds on the data for acceptable performance. Where yield table data (generally based on a much larger sample) were available, the procedure to define yield classes was judged to be too subjective (Workshop Toulouse, 2004) to be used as a basis for setting bounds for the tree data. Given the restriction imposed by the available data bounds on the data were set using simple procedures. Crop data bounds As a first step, bounds were determined on the basis of an analysis of statistical yield data from EU databases. Year to year variation was analyzed per country. The

10
variation in yield for a single crop reflects the effects of varying levels of production factors in addition to that caused by meteorological factors. Assuming the effects of variability to be additive, the year-to-year variation in actual yield will be larger than the variation in potential yield. The variation of actual yield then constitutes an estimate for an upper bound to the variation in potential yield. The variation in yield for the selected crops is presented in Table 1. On average the c.v. of crop yield within Europe (EU-15) is 10%. Some aspects of this approach are discussed in Appendix 3. Table 1. Average crop yields and their variation within Europe (EU-15). The c.v. is assumed to provide an upper bound for the variation in potential production within an ecoregion. Datasource: EU statistical information (2004). Crop Average yield
(t/ha) Standard deviation (t/ha)
Coefficient of variation*
Winter wheat 5.8 0.4 0.09 Durum wheat 3.5 0.5 0.13 Maize** 8.9 0.5 0.06 Sunflower seeds 1.8 0.2 0.11 * calculated as the average of the individual c.v. ** type (forage or grain) not specified. Tree data bounds The procedure used for the crops is not applicable to the different tree species as tree growth statistics on a yearly basis per species per country are not available. Bounds were therefore determined as time-shifted data series. Upper bound at time t was the measurement at t+1; lower bound at time t was the t-1 measurement. For tree yield tables with data given every n years this corresponds to a n year improvement for the upper bound resp. n year loss in production for the lower bound
4.2. Select the parameters to be estimated from the experiment.
4.2.1 Ideal procedure Parameter selection is required for bio-physical models. There are several reasons. The first is that the possibility to estimate parameter values from data is limited by the available number of data pairs (number of parameters to be estimated always less than the number of data pairs). In addition the available information may be limiting. In that case the maximum number of parameters that can be estimated from the data is equal to that used in an empirical model yielding a good fit. Finally, the parameter space to be searched is multi-dimensional - if 100 (102) parameter vectors have to be examined to estimate 1 parameter value, 10010 (= 1020) are required for ten parameters. Any selection procedure will need to assess the effect different parameters have on a selection criterion. Possible selection criteria are the change in fit of the model, or the effect on the variable to be predicted. Those parameters having the largest effect are selected. Alternatively, if the model is simple, it can be mathematically analyzed and the parameters determining the behaviour selected.

11
4.2.2 Actual procedure Given the often limited number of data, the relatively simple empirical description of crop- and tree growth (3-4 parameters, using a nonlinear model) and the large number of parameters in the Yield-SAFE model (compared to a satisfactory empirical model) it is evident that not all parameters can be estimated from the data. A small number of parameters should be selected and can then be estimated using a set-theoretical approach. The mathematical analysis of the tree model and the crop model is described in Appendix 2. Based on this analysis a small number of parameters is considered for calibration.
4.3. Set the parameter space to be searched.
4.3.1 Ideal procedure Time required to test parameter vectors can be vastly reduced if lower and upper bounds for the parameter values are known. Generally, parameters in biophysical models are positive real numbers; more specific ranges can be derived from literature, or can be based on expert knowledge. Alternatively a first starting point has to be identified after which a random search around this point can be started within specified parameter ranges. In that case a procedure has to be defined to identify an initial parameter vector that generates acceptable model performance.
4.3.2 Actual procedure. Parameter bounds were (at least initially) unknown.
4.4. Define a procedure to generate a first acceptable parameter vector.
4.4.1 Ideal procedure If the parameter space can not be bounded prior to the set membership procedure, any procedure that yields a parameter vector generating acceptable behaviour in a small number of model evaluations will do.
4.4.2 Actual procedure In this report we use a Powell steepest descent method (Poweel, 1964) to identify a first acceptable parameter vector. To minimize the risk of missing that more acceptable parameter we used several different starting points. In the course of the calibration procedure information exchange lead to an iterative procedure for parameter estimation. It became apparent that to correctly simulate agroforestry and tree systems, an estimate or measurements of tree leaf area or the fraction of intercepted radiation is indispensable. In addition acceptable values tree light use efficiency appeared to be important.
4.5. Select the procedure to generate parameter vectors.
4.5.1 Ideal procedure Any procedure to generate parameter vectors should lead to a more or less systematic, more or less exhaustive sampling of the parameter space within the parameter bounds. Generated parameter vectors are tested and accepted if they generate perfromance

12
within the data bounds. In contrast to optimization procedures which aim at determining the most acceptable parameter vector, a set theoretic procedure aims at gathering the largest amount of information about the acceptable parameter domain in the smallest number of model evaluations.
4.5.2 Actual procedure We searched the parameter space in the neighbourhood of the first acceptable vector, using a random sample of 1000 parameter vectors (centered on the feasible point) The ranges are set as powers of 10 times the default value, and were set to ± 0.1, ± 0.2, ± 0.4, ± 0.6, ± 0.8, and ±1. Results were accepted if the criterion was at least equal to that of the starting point. In the case of cherry, in which no other feasible sets could be found, the bounds were chosen using a modification of the procedure described earlier. Instead of using measurements at t-1 and t+1 as bounds (see paragraph , measurements at t-2 and t+2 were used as bounds.
5. Set based validation.
5.1 Ideal procedure The parameter sets derived in the previous step are now used to predict an independent sample of data from the population of interest. There are two cases - 1) the experimental data are within the envelope predicted by the model. In that case the model is acceptable. In the scond case the data are outside the envelope predicted by the model. These data can then be used to reformulate the model, or revise the parameter sets to allow for this additional variation. In that case the validation set is used in a set calibration to revise the feasible parameter set. Alternatively, and less labour intensive, if the experimental data are outside the predicted range in a validation, for all future predictions the new predictive range is calculated as the simulated range increased by the difference between range and the prediction error found in the validation.
5.2 Actual procedure. We propose to follow the simplest procedure i.e. to modify predictive ranges after validation.
6. Results
6.1 Feasible point detection The results (parameter vectors) are available on the SAFE-website. We summarize the feasible points for the different tree and crop species in Appendix. A limited number of parameters was estimated. If parameter values are not given, they are set to the (default) values referred to in Appendix 6.
6.2 Feasible parameter sets The procedure was based on a random sampling of parameter space for the different crops and tree species. For trees the parameter sets correspond to an uncertainty in the diameter at breast height of 10-30% (strongly decreasing with age, initially 100%); an uncertainty in the height of 10-30% (strongly decreasing with age, initially 100%),

13
and a large uncertainty in the tree merchantable volume (20-50%). The assumptions under which these uncertainties were derived are highly hypothetical.
6.2.1 An example for trees (cherry) Properties of the acceptable parameter set The parameter sets derived for cherry are referred to in Appendix 6. Analysis of the parameter set (101 parameter vectors) yielding acceptable performance showed that 95% of the acceptable values was in a range between 0.68 and 1.35 times the calibrated value (nominal for most of the parameters). The correlation structure within the set (cf. Appendix 5) was weak (one value at 0.80). If correlations are high, this suggests that the effect of one parameter is compensated by a change in another parameter, without changing the acceptability of the result. Uncertainty associated with the acceptable parameter set Once acceptable parameter vectors have been identified, they can be used in simulation. To illustrate the procedure, Figure 3 shows the uncertainty in the ranges for dbh of cherry for the Atlantic and the Mediterranean region. As tree parameters were assumed to be the same, the difference is due to the difference in radiation. An example of the ranges in the model output (for cherry in the Atlantic region; leaf area index, dbh height and volume) given the parameter sets is presented in Figures 4a to 4d.
Figure 3 Comparison between predicted range of diameter at breast height for cherry in the Atlantic and in the Mediterranean region. The result for height is similar (not shown).

14
a b
c d Figure 4. a: Envelope for the tree leaf area index (cherry). Points below the main curve are leaf area indices in spring. Abrupt changes in leaf area index are due to the thinning regime. b Ranges for diameter at breast height for cherry, based on feasible parameter set as determined from data bounds. c. Ranges for height of cherry, based on feasible parameter set as determined from data bounds. d. Ranges for single tree merchantable volume of cherry based on feasible parameter set as determined from data bounds.

15
6.2.2 An example for a crop (forage maize) Properties of the acceptable parameter set The parameter sets derived for forage maize are referred to in Appendix 6. It proved rather difficult to generate acceptable parameter vectors. Analysis of the parameter set (24 parameter vectors) yielding acceptable model performance showed that 95% of the acceptable values was in a range between 0.83 and 1.15 times the calibrated value. The correlation structure within the set was weak (one value at 0.60, one at 0.99; c.f. Appendix 5), which shows that in most cases the effect of one parameter is not directly achieved by changing another parameter. As the parameter sets for the crop model were identified on the basis of another procedure to set bound on the data, an example for forage maize is presented in Figure 5.
Figure 5 The range in biomass for forage maize in Wageningen, the Netherlands, for a single meteorological year, as a result of the variation in accepted parameter values.

16
6.3 Validation on site experiments As described in the methodology this step consists of running parameter sets and detect the need to allow for an increase in the data error bound using available site experiments.
6.3.1 Tree species Cherry. Experiments at different densities and in different french locations, from a review by Gavaland (pers. comm. 2004), were used to compare measured data and predicted potential tree growth. Weather data for Madrid (as representative of the mediterranean region) were used. The data were provided by Palma (pers. comm., 2004) generated using a weather generator. Figure 6 Model results (potential growth) for cherry in the Mediterranean
region. First row: Experimental dbh (left) and height (right) data for Pamiers (5.5x5.5 m),
compared with potential cherry tree growth simulations in the Mediterranean region.
Second row: Experimental dbh and height data for Pamiers (5.5x11 m) and Grazac (6x10 m) compared with simulations of cherry tree potential growth in the Mediterranean region.
Third row: Experimental dbh and height data for Pamiers (11x11 m) compared with simulations of cherry tree potential growth in the Mediterranean region.
Fourth row: Experimental dbh and height data for Labarthe Riviere (6x7 m) compared with simulations of cherry tree potential growth in the Mediterranean region
Fifth row: Experimental dbh and height data for Aurignac (coppice stand) compared with simulations of cherry tree potential growth in the Mediterranean region (lower bound: 5x5 m; upper bound 11x11 m)

17

18
6.3.2 Crop species. Forage maize Forage maize yields (irrigated) in an 8 year crop rotation experiment on a sandy soil near Wageningen (Scholte, 1987) were used for validation of the crop part of the model. Yield was determined from four replicates. Three validation experiments using the established parameter set were executed: one in which measured weather data for Wageningen was used, one in which data for a location close to Wageningen (Scherpenzeel, artificial data generated using a weather generator) was used, and one in which generated data for Orleans were used. In the validation using meterological data from Scherpenzeel we predicted the time series of eight years four times, and used the overall minimum and maximum as the prediction of the yield range. In the validation experiment using data from Orleans we used the same year every year, and repeated this using another year. The measurements and the predicted bounds using Wageningen weather are presented in Figure 7, those using generated weather data for Scherpenzeel are presented in Figure 8. Results for the Orleans data are not shown. Prediction errors for the validation experiments were calculated as the RMSEP for the averages of prediction and measurement. The prediction error using Wageningen weather data is 2000 kg.ha-1. The range in the predicted values as generated by the parameter set using actual weather is 600 kg.ha-1. Using the artificial weather data for Scherpenzeel, the prediction error becomes 3000 kg.ha-1, with a range in the predictions of 900 kg.ha-1. In the third validation experiment (artificial data from Orleans), the prediction error becomes 4000 kg.ha-1, with a range in the predictions of 1100 kg.ha-1.
Figure 7 Prediction bounds for forage maize production at Wageningen using weather data for Wageningen, and presenting minimum and maximum yield for average planting and harvesting dates.

19
Figure 8 Prediction bounds for Wageningen forage maize production using 32 years of generated weather data for Scherpenzeel, and presenting minimum and maximum yield for average planting and harvesting dates.
6.3.3 Conclusions from the validation on monocultures. The measurements for the monocrop and monotree experiments are not contained in the predicted ranges. According to the procedure proposed, either the parameter sets would have to be modified, or the difference between the prediction error and the predicted range as established in validation would have to be added to a new prediction result. As the results for forage maize in the Netherlands show, this modification is conditional on the weather data to be used. The conclusions for the tree experiments is ambiguous, depending on the on-site production situation. The central question is whether tree growth in the experimental situations for cherry is water-limited.
6.4 Validation on agroforestry systems To test the performance of the model in the prediction of an agroforestry system an experiment with poplar at two sites in the UK (Leeds and Silsoe) was used. The crop data available did not allow to estimate parameter values (sowing date, date of harvest and final yield were available). Crop growth rates were derived from a simple sigmoid curve, and used as a forcing function for the agroforestry water balance. Tree parameter sets were estimated from yield tables for poplar (Christie, 1994), providing data on diameter at breast height, top height and stand volume. The data for yield class 16-20 were used as an estimate of potential yield. Climatic averages for Leeds and Bedford (WKI, 2004) were used as the basic input for the parameter estimation procedure. The established parameter sets and actual weather data were used to predict waterlimited poplar height and poplar DBH in Leeds and Silsoe. In the combined parameter sets (n=28) 95% of the overall variability was contained between 0.87 and 1.15 times the calibrated value. The correlation structure in the combined parameter set is weak, with five values between 50 and 70%. Figure 9 Prediction of poplar height and poplar volume in the Leeds agroforestry experiment

20
Figure 10 Prediction of poplar height and poplar volume in the Silsoe agroforestry experiment.
7. Discussion Limitations model/data As discussed in the development of the actual procedures, choosing the value of bounds on the data is conditioned by the available data. At present the available data only allow a rough approximation. Bounds on the data can only be set with any confidence if a sufficiently large and variable dataset for both crops and trees across Europe is available. At present the validation suggests an underprediction of tree production during early growth. Setting bounds on experimental crop data The assumption that the temporal variation in national yield statistics for a specific crop constitutes an upper bound to climate induced yield variability in an ecoregion is based on several assumptions. The first is that variation is additive, i.e. total variation is the sum of the effects of variation in the different production factors, and that variability based on national crop yield statistics is more variable than that in ecoregions. Based on this model, the variation constitutes an upper bound for variation in potential production. It is also assumed that this c.v. is constant for different ecoregions, and yield levels. Preliminary analyses at the level of national crop production statistics (based on detrended FAO data) suggest that standard deviation may increase with yield level, and that coefficient of variation may decrease with planted area (Appendix 4).

21
Setting bounds on yield table data The procedure to be preferred is to re-analyze the data on which yield tables are based. This was not possible due to time and data availability constraints. The present procedure based on time-shifted yield table series has a basis in error considerations, but bears no relation whatsover to variation in production within an eco-region. Reliability model results At present the prediction error could be shown to be roughly 10% for crop yield. The value for the reliability in the tree yield depends on unknown experimental conditions. What if new information becomes available. If for the presented validation experiments new data become available, the calculated prediction error can be updated. If knowledge on parameter values becomes available, this can serve to extend parameter bounds. In a set theoretic approach a decrease in the set bounds is not possible - which suggests that a set bound approach is based on the assumption that the more we know, the less certain we are. Alternative to a set bound approach. If one is unwilling to set an error bound on crop and tree experimental data, and unwilling to base estimates of parameter uncertainty on this approach, the alternative approach is to use the prediction error from validation experiments as an estimate of the overall uncertainty.
8. Conclusions As yet the discrepancy between the ideal and actual situation with respect to the uncertainty analysis (notably the point of defining bounds on experimental data) presented in this report is too large. More additional work regarding data gathering and data analysis to specify more reliable error bounds is required to reduce this discrepancy. From an engineering point of view, we propose to use the results regarding parameter uncertainty from the case studies presented in this report, and execute a Monte-Carlo analysis on this basis to provide the required uncertainty in scenario studies. For the crops we propose a 15% simultaneous uncertainy range in parameter values (based on the set calibration for forage maize); for the trees we also propose a range of 15% (based on the sets derived for poplar).
References Christie, J.M. (1994). Provisional yield tables for poplar in Britain. Technical paper 6. Forestry commission, Edinburgh 36 pp. Keesman, K.J. (2002).Nonlinear-Model Case in Bound-based Identification, in Control
Systems, Robotics and Automation, edited by H. Unbehauen, in Encyclopedia of Life Support Systems (EOLSS), UNESCO Publishing-Eolss Publishers, Oxford, UK (http://www.eolss.net).
Gavaland, A. (2004). Personal communication within the SAFE project. Scholte, K. (1987). Relationship between cropping frequency, root rot and yield of silage maize on sandy soils. Netherlands journal of agricultural science 35: 473-486. Palma, J. (2004). Personal communication within the SAFE-project. Mücher, C.A., R.G.H. Bunce,R.H.G. Jongman, J. A. Klijn, A.J.M. Koomen, M.J. Metzger, D.M. Wascher (2003). Identification and characterisation of environments and landscapes in Europe. Alterra, Wageningen, Alterra report 832. 199 p. KNMI (2004). Wereldklimaatinformatie (http://www.knmi.nl/voorl/kd/lijsten/normalen71_00/index.html, link july 2004)

22
Workshop Toulouse (2004). SAFE website (http://www.montpellier.inra.fr/safe/, august 2004) Stappers, R., K. Keesman, W. van der Werf (2003). The SAFE-RESULT Equations: an Agro-Forestry Model. Systems & Control and Crop & Weed Ecology Group Wageningen University, P.O. Box 43, 6700 AA Wageningen, The Netherlands. EU statistical information (2004). (http://europa.eu.int/comm/agriculture/agrista/index_en.htm, link july 2004). Powell, M. J. D. (1964). An efficient method for finding the minimum of a function of several variables without calculating derivatives. Computer Journal. 7, 155 -162.

23
Appendix 1: Objectives of the SAFE-project (http://www.montpellier.inra.fr/safe/, august 2004) Silvoarable agroforestry comprises widely-spaced trees intercropped with arable crops. This project builds on recent findings that indicate that modern silvoarable production systems are very efficient in terms of resource use, and could introduce an innovative agricultural production system that will be both environment-friendly and economically profitable. Growing high quality trees in association with arable crops in European fields may improve the sustainability of farming systems, diversify farmers incomes, provide new products to the wood industry, and create novel landscapes of high value. In support of the European Common Agricultural Policy, the SAFE project will provide models and databases for assessing the profitability of silvoarable systems, and will suggest unified European policy guidelines for implementing agroforestry. Our goals are to
• reduce the uncertainties concerning the validity of silvoarable systems • extrapolate plot-scale results to individual farms or sub-regions • suggest unified European policy guidelines for implementing agroforestry
The first main objective of the project is to reduce the uncertainties concerning the validity of silvoarable systems. Data from both traditional silvoarable systems and recent silvoarable experiments will be collated in a modelling framework that will be used to predict the outcomes of silvoarable management scenarios at the plot scale. This objective implies two technological and scientific tasks: 1. to build up a network to monitor the unique resource in silvoarable experiments provided by the
participants in the consortium using agreed measurement protocols and database structures; 2. to design and validate a mechanistic model of tree-crop interactions in silvoarable plots. An
inception workshop will allow to compare existing models produced in previous European or International programmes and prioritise the need for new modules. The model will be validated using available experimental data from the consortium, and will be used for predicting the future yields from silvoarable plots at a variety of European sites.
The second main objective is to extrapolate plot-scale results to individual farms or sub-regions, and to provide a unified framework to assess the impact of agricultural prices and EU regulations on the likely uptake of agroforestry. This second main objective implies three tasks: 1. to link the biophysical modelling of a silvoarable plot with economic modelling tools, and to
upscale the resulting integrated bio-economic model from the plot scale to the farm and the regional scales;
2. to identify where, in different European countries, agricultural and forestry policies are conflicting over the silvoarable agroforestry issue;
3. to define and predict the economic outcomes of a range of scenarios for implementation of silvoarable agroforestry, to compare these outcomes with existing land use profitability, and to consider the wider issues of grant eligibility, environmental impacts, or taxation levels which may constrain the uptake of agroforestry in Europe.
At the moment, many European farmers are deterred from establishing modern agroforestry systems because of legal and policy issues, rather than by their lack of profitability. Simultaneously, most traditional silvoarable systems are ignored by the CAP. This cultural heritage of rural Europe is therefore abandoned by farmers, leading to the loss of environment-friendly practices and of valued landscapes. There is, therefore, a clear need to use the experience gained from traditional and modern silvoarable systems across Europe to develop coherent agroforestry policies for the European Union. To meet these expectations, the SAFE project will develop biophysical and socio-economic tools to inform farmers and policy-makers of the potential for silvoarable agroforestry to contribute to the integrated and sustainable development of European rural areas. The final target is a coherent 'Agroforestry Policy Options' document which can be used by the EU to frame header and interpretative regulations, and by Member States or Autonomous Regions to assess the effect of forestry or agricultural grants on the uptake of agroforestry in the context of best European practice. A special 'agroforestry status' will be designed for the countries where tax policy and grant availability is dictated by land-use classes. Policies for agriculture and forestry grants should recognise that both silvoarable and silvopastoral systems are 'legal' forms of land-use which should be permitted to be on a 'level playing-field' with conventional agriculture or forestry. This agroforestry status will be designed to avoid any undue accumulation of European grants by landowners or farmers.

24
Appendix 2: Simplifying approaches to SAFE-result to determine initial parameter estimates Tree biomass The basic tree biomass differential equation is
mBIffdtdB
t
wredi −=ρ
ε
where
ti
kLef ρ−−= 1 In case LAI is large, fi ≈constant, and the differential equation has the approximate solution
)( 00
ttmeBmA
mAB −−
−−=
where A is short for
t
wredi Iffρ
ε
A problem in tree growth is that often only volume or height as a function of time is available. If tree merchantable volume is linearly related to biomass, we have
BcV 1= Rewriting the equation
−−
−−= )(11 001 ttme
AmB
mAcV
and reparameterizing:
−−−= )(1 0ttmeV βα
shows that we can estimate 3 parameters from a yield table,
mAc1=α ;
−=
AmB01β , and m
If we are willing to fix a value for B0 (or A), the other parameters can be calculated: (for the time being assuming B0 is fixed):
β−=
10mB
A or )1(0 β−=mAB
Amc α
=1
If the average seasonal radiation and the tree density are known, the product fifwredε can be estimated using the definition of A.

25
An approximation for an early stage can be based on a first order analysis. In this approximation a linear relation describes the early stages of light interception and the relation between number of shoots and biomass. If the relation between number of shoots and biomass is given by
BKBnn x +
= ,
the derivative with respect to B is
2)( KBKn
dBdn x
+= .
When used to derive a first order approximation near B= 0 this yields
BKn
n x=1
Obviously the associated leaf area is then calculated as
BLAKnL ss
xmax1 =
A first order approximation of the light interception function fi can be written as Lkf ti ρ=1
Substitution of fi1 ad L1 in the differential equation for biomass
mBIff
dtdB
t
wredi −=ρ
ε
yields
( )BmIfkLdtdB
wred −= ε1
After integration this yields an exponential equation for B with initial biomass B0 assumed known. The approximations show that a two parameter function allows to describe early growth, and that a late stage can be described by three parameters. The important parameters in the late stage are the light use efficiency ε and the attrition coefficient m; in the early stage the light use efficiency ε, and the initial leaf area (calulated in the implementation as nshootsinit*Lassmax) are important. Crop biomass The basic differential equation in SAFE (result) can only be integrated using average radiation, and a seasonal average value for leaf partitioning. The differential equation for the leaf area is linearly proportional to the one for biomass
dtdBsp
dtdL
c=
with
IfffdtdB
wredtticε= and kLefi−−= 1
this becomes:
)1( kLeIffspdtdL
wredttc−−= ε

26
The integral of this differential equation yields a function known as the expolinear equation due to its asymptotic behaviour:
−−+= )()1(1ln1 0
0ttkAez
kL c
where IffspA wredttcc ε=
and 0
0kLez =
For large exponential terms this equation reduces to a linear equation:
kz
ttAL c)1ln(
)( 00
−+−=
Near t0 f(t)=ln(1+z(t)) ≈ f(t0)+f''(t0)z(t) i.e.
)1ln()(2
000
−+−+= zttkAceAcLL
The important parameters are start time, end time, partitioning to leaves, and light use efficiency.
Appendix 3: Overall calibration results tree and crop species. Note 1: Allometric relations Tree and region SIGMA-
HEIGHT AP FORM-
FACTORWOOD DENSITY
PITIMBER
Stone pine-Mediterranean 26.927 0.641 0.5223 0.58 0.73 Holm oak-Mediterranean 12.144 0.6311 0.196 0.900 0.55 Walnut-Portiragnes-Mediterranean 16.395 0.4896 0.57 0.23 0.5 Walnut-Restinclieres-Mediterranean 27.731 0.6824 0.57 0.23 0.5 Cherry-Normandie-Atlantic 34.354 0.5948 0.4574 0.608 0.5 Poplar-Atlantic 68.556 1 0.367 0.410 0.5 Poplar-Mediterranean 68.556 1 0.367 0.410 0.5 Tree and region BTINIT NMAX-
SHOOTSEPST NSHOOTS-
INIT LASSMAX KMAIN
Stone pine-Mediterranean 0.20 3452 0.005 0.0001 Holm oak-Mediterranean 0.03 1.29 0.005 0.0001 Walnut-Portiragnes-Mediterranean 37.20 0.07 41.33 0.005 0.0001 Walnut-Restinclieres-Mediterranean
10.00 0.07 1.03 0.005 0.0001
Cherry-Normandie-Atlantic 50660 0.37 29 0.005 0

27
Poplar-Atlantic 3.32 2.69 0.005 0 Poplar-Mediterranean 2.37 8.24 0.005 0 Second Calibration (some issues to be discussed) Tree and region BTINIT NMAX-
SHOOTSEPST NSHOOTS-
INIT LASSMAX KMAIN
Stone pine-Mediterranean 0.1947 2.8963 0.05 0.0001 Holm oak-Mediterranean (on loose copies -check!)
0.03 1.29 0.05
Walnut-Portiragnes-Mediterranean (40 MJ/m2/d) Form factor = 1.233*10-6
0.3443 2.3633 0.05
Walnut-Restinclieres-Mediterranean (40 MJ/m2/d)
3.1658 0.3547 0.05
Cherry-Normandie-Atlantic (assumed 8x8 -no thinning) 38
10000 1.9051 0.1880 0.05 0.0001
Poplar-Atlantic 1.4086 0.6225 0.05 0.0001 Poplar-Mediterranean (assumed 6x6 250 trees/ha-no thinning)
1.1877 1.7938 0.025 0.0001
Second Calibration (some issues to be discussed) Tree and region BTINIT NMAX-
SHOOTSEPST NSHOOTS-
INIT LASSMAX KMAIN
Stone pine-Mediterranean -0.845347
1.98228 0.05 0.0001
Holm oak-Mediterranean
-1.82654
-2.69167 0.05
Walnut-Portiragnes-Mediterranean
0.05
Walnut-Restinclieres-Mediterranean
0.05
Cherry-Normandie-Atlantic
1.20276 -0.407166
-0.741861 0.05 0.0001
Poplar-Atlantic 0.06924
-2.19345 0.05 0.0001
Poplar-Mediterranean (assumed 6x6 250 trees/ha-no thinning)
-0.266452 v2? -0.100209
-1.77204 -1.67092
0.05 0.0001
Overall crop calibration results. In contrast to the procedure used in calibrating the tree model, the crop model was calibrated using a least squares criterium, combining crop biomass and leaf area index.

28
Durum wheat in the mediterranean region Parameter EPSC TSUM-
EMERGENCE TSUMRB TSUMRE TSUM-
HARVEST HI*
Season 9798 1.51 37 634 637 1469 0.285 Season 9899 1.36 57 579 587 1420 0.283 Season 9900 1.44 143 506 596 1400 0.264 Season 0001 1.53 9 757 675 1561 0.249 Season 0102 1.42 57 170 1075 1489 0.263 Data for durum wheat potential production, provided by Christian Dupraz, Isabel Lecomte, Martina Mayus using STICS. Meteorological data from Montpellier (Restinclieres) were used. Forage maize in the atlantic region The harvest index for forage maize is 1. Base temperature used was 5. Parameter EPSC TSUM-EMERGENCE TSUMRB TSUMRE TSUM-HARVEST SLAC Season 80 1.19 203 2070 1800 1593 0.0068 Season 81 1.11 156 1973 1800 1622 0.0066 Season 82 1.19 164 1275 1283 1800 0.0071 Season 83 1.17 188 1321 1108 1822 0.0065 Season 84 1.18 236 1673 1616 1569 0.0069 Data for forage maize potential production, provided by Christian Dupraz, Isabel Lecomte, Martina Mayus using STICS. Meteorological data from Wageningen were used. Grain maize in the mediterranean region HI was directly calculated from the simulation results. Parameter EPSC SLAC TSUM-
EMERGENCE TSUMRB TSUMRE TSUM-
HARVEST HI*
Season 97 1.38 0.0052 57 1099 1086 1816 0.375 Season 98 1.34 0.0051 57 1064 1296 1853 0.348 Season 99 1.35 0.0050 57 1143 1030 1860 0.388 Season 00 1.29 0.0053 110 903 934 1803 0.387 Season 01 1.29 0.0051 57 994 873 1802 0.363 Season 02 1.29 0.0046 57 1015 811 1780 0.381 Data provided by Christian Dupraz, Isabel Lecomte, Martina Mayus using STICS. Meteorological data from Montpellier (Restinclieres) were used. Sunflower in the mediterranean region HI was directly calculated from the simulation results. Base temperature TTHRESH was set to 8. Parameter EPST SLAC TSUMEMERGENCE TSUMRB TSUMRE TSUMHARVEST HI* Season 98 1.01 0.012 57 997 800 1505 0.328Season 99 1.09 0.014 94 828 800 1491 0.394Season 00 0.94 0.012 57 860 800 1462 0.394Season 01 0.97 0.014 57 791 800 1492 0.398Season 02 1.00 0.015 137 778 800 1498 0.372Data for sunflower potential production, provided by Christian Dupraz, Isabel Lecomte, Martina Mayus using STICS. Meteorological data from Montpellier (Restinclieres) were used.

29
Winter wheat in the atlantic region HI was directly calculated from the simulation results. Parameter EPST TSUMEMERGENCE TSUMRB TSUMRE TSUMHARVEST HI* Season 80-81 1.55 100 566 570 1362 0.351Season 81-82 1.32 57 461 464 1364 0.334Season 82-83 1.56 65 578 576 1476 0.327Season 83-84 1.34 57 456 464 1312 0.318Data for winter wheat potential production, provided by Christian Dupraz, Isabel Lecomte, Martina Mayus using STICS.
Appendix 4: Justification crop yield bounds We used statistics on a per crop and per country basis to derive an upper bound for the potential production per ecoregion expressed as a coefficient of variation. There are at least three implicit assumptions in this approach: 1 - Variation increases with yield level. 2 - The year-to-year variation per country is of the same magnitude as that of an ecoregion. 3 - The variability in actual production is additive. ad 1 We are able to find some justification for the first assumption if the year-to-year variability of the yield statistics for the industrialised countries is analyzed. Detrended FAO data show that standard deviation increases with yield level (Figures
Figure 4.1: Relation between average detrended yield statistics and standard deviation over years for different crops in the industrialised countries (FAOSTAT). The range is determined to a large part by the inclusion of sugarbeet data.

30
Detail of Figure 4.1: Relation between average linearly detrended yield statistics and standard deviation over years for different crops (excluding sugarbeet) in the industrialised countries (FAOSTAT) ad 2 Analysis of the yield variability (as c.v.) as a function of area cultivated suggests that the coefficient of variation decreases. The result of an analysis based on FAOSTAT data is presented in Figure
Figure 4.2. Data for different crops (except for sunflower seeds) are consistent in that they suggest that coefficient of variation decreases with area cultivated. Yield and area data are from FAOSTAT (industrialised countries) and were linearly detrended. ad 3 The simplest approach to productivity is that of Liebig - the production factor most strongly limiting determines production. If we accept the concept of potential production (Yp), and assume a stress reduction (f), yield is calculated as fYp. In a worst case estimate, given small uncertainties ∆ in f and Yp, the uncertainty in their

31
product is estimated as ∆f/f+∆Yp/Yp, the sum of relative uncertainties. This supports the use of the c.v. as criterion to express the error bounds.
Appendix 5: Analysis of correlation structure in sets of acceptable parameter vectors Table 5.1 Correlation structure (correlation in %) in the parameter set identified for cherry.
autumn spring ap btinit epst form fac
kmain kt lassmax nmax shoots
nshoots init
pi timber
rho timber
sigma height
taut
autumn 100 5 14 27 -26 11 30 6 34 9 -25 15 9 11 -37spring 100 2 7 9 -5 12 5 8 -24 6 -10 1 0 -15ap 100 19 -5 4 26 -5 18 -6 0 13 22 80 -24btinit 100 -32 -17 23 2 43 -20 19 17 3 16 -44epst 100 24 -19 -35 -55 -31 -12 -19 28 -10 19formfac 100 3 -19 4 -15 -11 9 -16 28 -24kmain 100 4 41 -17 -17 37 24 17 -27kt 100 33 37 21 -16 8 -18 -4lassmax 100 1 1 9 14 19 -36nmashoots 100 1 -22 1 -6 10nshootsinit 100 -18 -21 -2 -16pitimber 100 26 -5 -15rhotimber 100 17 -11sigma height
100 -28
taut 100
Table 5.2 Correlation structure (correlation in %) in the parameter set identified for poplar.
autumn spring btinit epst form fac
kmain kt lassmax nmax shoots
nshoots init
pi timber
rho timber
sigma height
taut
autumn 100 12 14 6 0 -13 10 -22 3 23 -17 -4 12 -14spring 100 9 -3 -28 -27 -5 -7 1 39 16 33 -26 4btinit 100 48 17 -24 25 11 4 25 -38 -17 36 -4epst 100 43 20 -10 28 40 -40 -56 -8 29 5formfac 100 15 -29 26 -1 -28 6 -11 33 8kmain 100 9 39 8 -54 -30 -13 -22 48kt 100 -21 -38 1 -22 1 -38 40lassmax 100 -11 -65 -53 -61 -14 34nmaxshoots 100 -3 -8 27 36 -42nshootsinit 100 44 39 12 -28pitimber 100 69 12 -17rhotimber 100 14 -4sigmaheight 100 -33taut 100
Table 5.3 Correlation structure (correlation in %) in the parameter set identified for forage maize.
bcinit epsc hi kc laiinicrop plinit slac tsum emergence
tsum harvest
tsumrb tsumre tthresh
bcinit 100 32 -35 -5 -5 -36 -4 -33 37 19 -20 -42epsc 100 -10 3 7 -43 -63 -7 44 10 -1 -40

32
hi 100 4 16 -3 10 13 -20 11 -32 21kc 100 -49 -42 -48 0 3 -35 5 -4laiinicrop 100 3 9 3 20 18 -34 -19plinit 100 8 20 -40 -13 19 44slac 100 22 -42 10 -9 37tsum emergence
100 -34 -38 -11 38
tsumharvest 100 45 -12 -99tsumrb 100 -28 -49tsumre 100 13tthresh 100
33
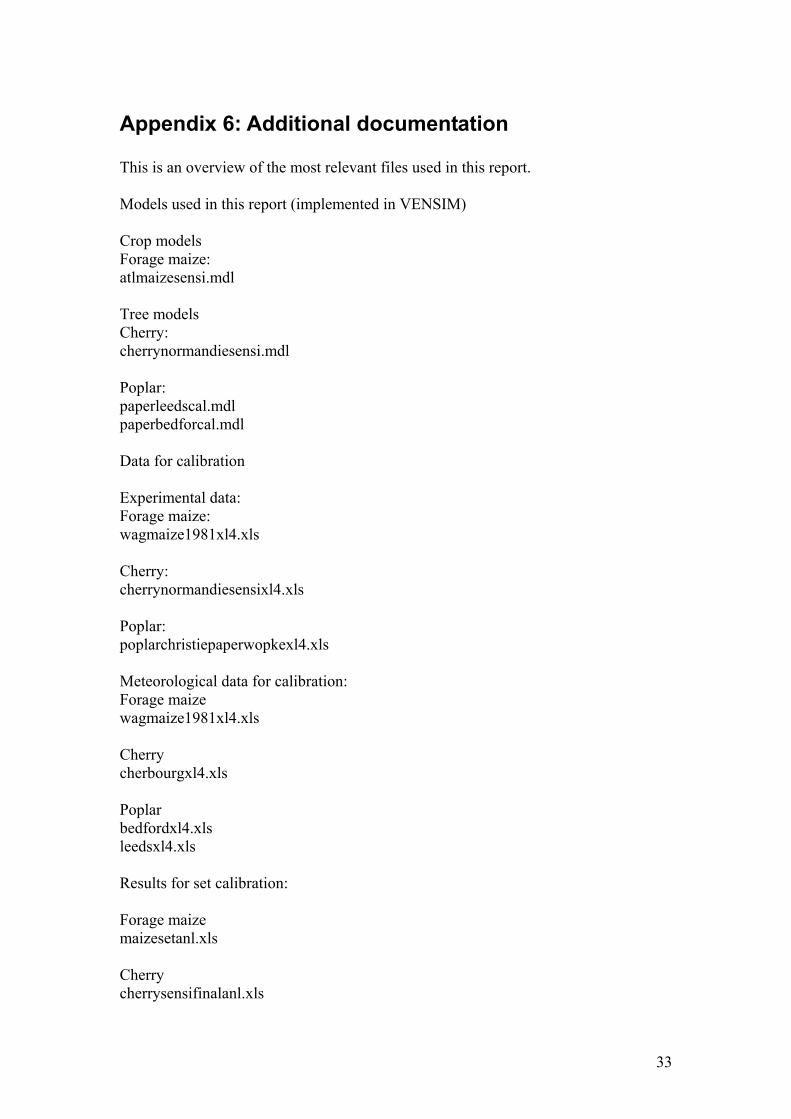
Appendix 6: Additional documentation This is an overview of the most relevant files used in this report. Models used in this report (implemented in VENSIM) Crop models Forage maize: atlmaizesensi.mdl Tree models Cherry: cherrynormandiesensi.mdl Poplar: paperleedscal.mdl paperbedforcal.mdl Data for calibration Experimental data: Forage maize: wagmaize1981xl4.xls Cherry: cherrynormandiesensixl4.xls Poplar: poplarchristiepaperwopkexl4.xls Meteorological data for calibration: Forage maize wagmaize1981xl4.xls Cherry cherbourgxl4.xls Poplar bedfordxl4.xls leedsxl4.xls Results for set calibration: Forage maize maizesetanl.xls Cherry cherrysensifinalanl.xls

34
Poplar poplarsetanl.xls Data for validation Crop Forage maize: Scholte.xls Meteo data: Wageningen: NL1979xl4.xls to NL1986xl4.xls Orleans: atlorleansxl4year1.xls, atlorleansxl4year2.xls Scherpenzeel: sch1xl4.xls to sch31xl4.xls Tree Cherry: dbhallrhomed.xls heightallrhomed.xls Meteo: medMadridxl4.xls Poplar Meteo and data Silsoe: Silsometxl4kkkkv2final.xls Leeds: Hadleyinpxl4kkkkfinalv2.xls Default parameter values: cf. relevant model versions.


