Safer by design: towards a conceptual assessment of safety
C. de Zanna, M. van Tooren, J. Schut, J. Stoop & R. Curran Delft University of Technology, Faculty of Aerospace Engineering, The Netherlands
Abstract
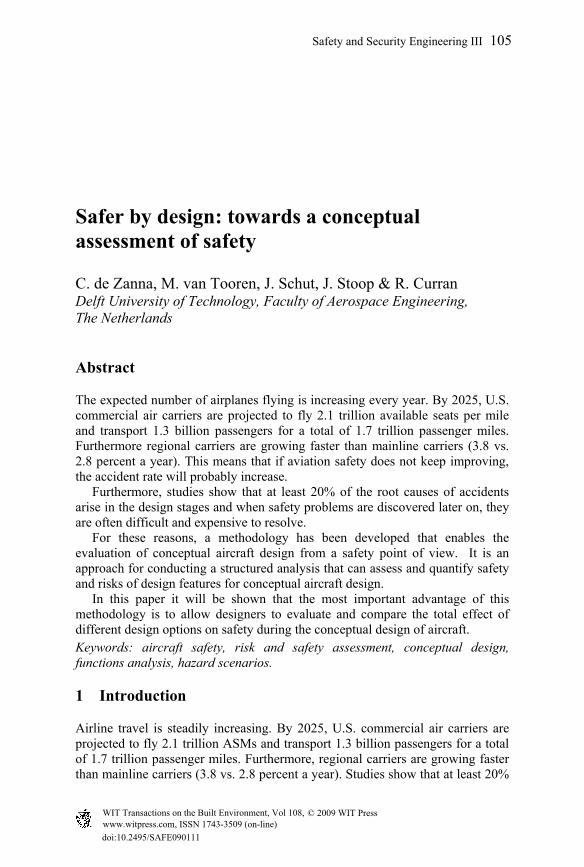
The expected number of airplanes flying is increasing every year. By 2025, U.S. commercial air carriers are projected to fly 2.1 trillion available seats per mile and transport 1.3 billion passengers for a total of 1.7 trillion passenger miles. Furthermore regional carriers are growing faster than mainline carriers (3.8 vs. 2.8 percent a year). This means that if aviation safety does not keep improving, the accident rate will probably increase. Furthermore, studies show that at least 20% of the root causes of accidents arise in the design stages and when safety problems are discovered later on, they are often difficult and expensive to resolve. For these reasons, a methodology has been developed that enables the evaluation of conceptual aircraft design from a safety point of view. It is an approach for conducting a structured analysis that can assess and quantify safety and risks of design features for conceptual aircraft design. In this paper it will be shown that the most important advantage of this methodology is to allow designers to evaluate and compare the total effect of different design options on safety during the conceptual design of aircraft. Keywords: aircraft safety, risk and safety assessment, conceptual design, functions analysis, hazard scenarios.
1 Introduction
Airline travel is steadily increasing. By 2025, U.S. commercial air carriers are projected to fly 2.1 trillion ASMs and transport 1.3 billion passengers for a total of 1.7 trillion passenger miles. Furthermore, regional carriers are growing faster than mainline carriers (3.8 vs. 2.8 percent a year). Studies show that at least 20%
of the root causes of accidents arise in the design stages [4] and when safety problems are discovered later on, they are often difficult and expensive to resolve. For these reasons a methodology has been developed that enables the evaluation of conceptual aircraft design from a safety point of view. It is an approach for conducting a structured analysis that can assess and quantify safety and risks of design features for conceptual aircraft design. It consists of five phases: System Identification, System Analysis, Failure Case Collection, Risk Assessment and Evaluation. To show the applicability of this methodology the effect on safety of different propulsion system is evaluated and compared with presently used general aviation aircraft with piston engines. This framework however can also be adapted to perform risk assessment on new concepts since it is based on a qualitative approach and it has the potential for extending its applicability to any system. By breaking down a scenario in its failing functions, this method offers a structured framework to predict the total effect of a design option on a scenario during conceptual design. Therefore, the most important advantage is that it allows designers to evaluate and compare the total effect of different design options on safety during the conceptual design of aircraft.
2 Safety today
Today aviation is the safest way of transport. Its fatality rate is considerably lower than the automotive rate, compared to number of travels and length of travel [1]. High safety standards can be achieved when different national authorities use identical procedures. These procedures provide boundaries in which the airlines and the aircraft manufacturers should operate. But the implementation of these rules is not sufficient to prevent accidents from happening and this holds especially for the general aviation category. Furthermore, accident observations lead to the idea that safety can also be improved by preventing accidents and protecting occupants during crashes that cannot be avoided. In the meantime different design approaches, such as Probabilistic Risk Assessment and Failure Mode and Effect Analysis have been developed, aimed to cost-effectively improve safety and performance of complex technological systems. Nevertheless accidents still occur, even with today’s technology. After comparing these existing design approaches, it was noticed that their common limitation is the size of the system that can be analyzed, while another challenge is represented by the risk assessment of new concepts. Therefore, the following requirements were incorporated:
‐ To be able to analyse complex systems (such as aircraft), ‐ To be able to include the “innovation” factor in the analysis, ‐ Incorporate risk related to human factor, ‐ Aiming on cost and time efficiency.
The methodology presented in this paper is the result of the integration of the aforementioned safety approaches. Combining the benefits of these safety
approaches, this new methodology was created such that, by integrating it very early in the design stage, it could enable an evaluation from a quantitative point of view of a conceptual aircraft design reducing at the same time the cost of later on modifications. It is a tool which is able to process and use existing knowledge to assess the safety level in design and support the design of new products by comparing the effect that different design options have on the total design.
3 Method description
As said before, this study aims to present a methodology able to assess the safety in a design, by processing and using existing knowledge. In order to do so, it needs to evaluate different possibilities. It also needs to compare them with present design. This means that an analysis on where the current design is with respect to the safety standards dictated by the aviation regulations is required. To analyze current design with respect to safety, a possible approach is to quantify the risk of that design. For this reason a Risk Assessment is performed. This can be done only after the probability and impact of the factors identifying the system have been calculated. These factors have been determined to be:
‐ The function(s) that caused the accident or incident ‐ The scenario(s) that resulted from it.
To find these two factors, firstly a functional analysis has to be carried out. It is needed to describe what the system will do and it includes every function needed by the system in order to meet the requirements specified. Secondly, a hazard scenario analysis can be performed, where a list of unwanted case scenarios that might occur during a flight is collected. Once the two factors described above have been found, a collection of cases can finally be created with specific knowledge about which function(s) failed and which scenario occurred. But in order to have a meaningful collection of cases, the functions and the scenarios are not the only elements that need to be known. And that is why an introductory step is required. This first step is needed in order to identify the system that has to be evaluated and its characteristics. This means determining what type of airplanes will be taken into account, which initial requirements such as payload, range, speed are considered and what type of mission is performed. Once the system has been identified in depth, the collection of cases finally includes all the necessary information necessary to evaluate different conceptual designs. This methodology however does need further investigation and improvements. One important recommendation is to ensure that the collection of failure cases obtained after the first two phases is highly detailed. In this way, once the risk assessment is performed, the evaluation phase becomes easier to be implemented in the design. Summing up, this methodology will follow five steps or phases, namely:
1. System Identification phase, 2. System Analysis phase (functions and scenarios), 3. Data Collection,
In Figure 1 a flow diagram representing the entire process can be found. This diagram shows the sequence of all the steps that will be performed throughout the five phases. In the following sections, these steps will be described.
3.1 System identification
The purpose of the first phase of the analysis is to constrain the system and define carefully its operation and design objectives. This will be performed in two steps: Mission specification and Mission profile. Typical parameters required in a mission specification are payload, range, cruise speed and altitude, field length, climb rate and certification base. More parameters can be added or changed, depending on various factors such as market opportunities, customer requirements and available technology. For the mission profile all the phases between the moment the aircraft is standing at the gate preparing for take-off and when it shuts down the engines after the landing, should be considered. Obviously, when large systems have to be analyzed, several simplifications have to be applied and it is important that these assumptions do not affect the reliability of the end results. Smart choices become essential for a good balance between end result and computational time, which can be translated with cost saving.
3.2 System analysis
In the second phase of this methodology, the system is analyzed more in depth. This analysis will be performed on the entire system at the same time and two different steps are included, namely:
The most generic function to be performed by any aircraft is: “Perform Air Transport Mission”. It basically means transporting cargo and payloads between
two points. This will be considered as the top level function, and it will be the starting element for this analysis. All the functions addressed in the analysis are the ones needed in order to proceed to the next flight phase safely. A good functional analysis is crucial because it can be generalized, to a certain extent, for every aircraft. Next to the functional analysis, the hazard scenario analysis is performed. A hazard scenario is a scenario which, if it occurs, can have negative consequences to personnel, material or the environment. It is an unwanted event that might occur during a flight. Basically it lists the results of a failure. Typical hazard scenarios that can occur are an aeroplane colliding with another aeroplane, vehicle or structure, or loss of engine power and so on.
3.3 Data collection
Once the analysis of the system is completed, various types of data must be collected and processed for use throughout this process. Such a database is useful so that all the accident and incident root causes can be extrapolated from it and linked to the aircraft functions and hazard scenarios. In this way it is possible to identify which one of them fails with the highest percentage and to point out which one occur the most. Finding the initiating event(s) that caused an incident or accident is a very challenging task. For this reason, a method is needed that could be used for every accident/incident with the following characteristics: try to limit a free “interpretation” of the given event description as much as possible and apply a certain consistency in the analysis of the data. This phase is a very critical part of the analysis, because all the required information is processed and integrated here. Without this step, the rest of the analysis would not be possible. For this reason it is very important that all the data gathered here is consistent with each other and that the relation between failing functions and scenarios is clearly defined and fixed.
3.4 Risk assessment
Per definition risk is the probability of an event multiplied by its consequences and it can be easily interpreted from the following questions:
1. What can go wrong? 2. How likely it is? 3. What are the consequences?
To quantify and assess the risk associated to each scenario and function, first the probability of functions failure and scenarios needs to be determined, then the impact that an event might have on both people and aircraft needs to be evaluated.
3.4.1 Probability The probability of function failures immediately follows from the case collection, since it is only needed to group the data according to its frequency. Same procedure holds for determining the rate of occurrence of hazard scenarios. To show the results matrices will be used (see a schematic representation in Table1 and Table 2):
Table 1: Probability of hazard scenario – flight phase.
Table 2: Probability of functions – flight phase.
Fp1 Fp2 Fp3 Tot
F1 p11 p12 p13 P1tot
F2 p21 p22 p23 P2tot
Fp1 Fp2 Fp3 Tot
S1 p11 p12 p13 P1tot
S2 p21 p22 p23 P2tot
Table 3: Hazard scenario rate of occurrence with respect to functions.
F1 F2 Tot
S1 p11 p12 P1tot
S2 p21 p22 P2tot
Where the following notation is used:
1. F1 and F2 represent two generic functions, 2. FP1, FP2 and FP3 represent three generic flight phases, 3. S1 and S2 indicates two different hazard scenarios, 4. pij is the probability 5. pi tot is the total probability per each function or per each scenario.
The first matrix of Table 1 relates functions that failed with the flight phase in which the failure occurred. The matrix of Table 2 shows the occurrence of a scenario with respect to the flight phase. After these two matrices have been completed, the results were combined in a new matrix. The result of this matrix can be interpreted as the probability that a certain function affects a given scenario. A schematic representation of this matrix is shown in Table 3. The same notation as above is used here as well.
3.4.2 Impact Probability’s limit is that it can only be based on experience, which means that it cannot say anything about innovative solutions and emerging technology. That is why the impact parameter is introduced here. There are many possibilities to define impact. In this study, impact was related to the damage caused both to the aircraft structure and to injury to passengers and crew. Since impact is just a “measure” of damage, the most obvious solution is to describe it with a number. In this study the impact will be an integer, ranging between a fixed minimum and a fixed maximum. A special attention is required to “translate” in numbers the difference between impact on structures and impact on passenger. This was done by using two different scales. Following the ICAO definitions [9] a Tolerability Matrix can be built. The definitions on the column represent damage on the structure and to each term a value from 1 to 4 has been assigned. The other definitions represent the passengers and pilot injuries and the values assigned range from 2 to 64 using a
Table 5: Risk of a hazard scenario related to flight phase.
Fp1 Fp2 Fp3 Tot
S1 p11*I11 p12*I12 p13*I13 R1
S2 p21*I21 p22*I22 p23*I23 R2
quadratic scale. The two scales were chosen in such way that the difference between structural damage and people injuries increases with the increase in impact severity. In Table 4 the “tolerability” of every type of impact can be distinguished also by the different colours applied: from green, which indicates an acceptable impact, to dark red which indicates maximum impact on both structure and people. The white cells represent situations that are extremely unlikely to occur and that are of no interest for the purpose of this analysis. In the accident and incident reports filed from the NTSB [10], the type of damage and payload injury is known and this information can be easily reported in the failure case collection. By applying the definitions given in Table 4 and the knowledge gained from the failure case collection, it is possible to build a matrix where per each scenario in each flight phase an impact value is determined. As done previously for the determination of the probability, the three matrices were used here as well.
3.4.3 Risk Now that both governing factors have been found, it is finally possible to quantify and assess the risk associated to each scenario and each function. This can be done by simply multiplying the probability values times the impact factors. Once again the three matrices were used to show the results, as can be seen in the schematic representation of Table 5, where Iij is the impact and Ri the Risk factor.
In order to evaluate the obtained risk values of the chosen functions and hazard scenarios, a suitable tool was created. This tool enables to compare and judge every risk value. This way it can be immediately judged what can be considered as acceptable risk and what is not, and most of all quantify how far is from acceptable. This is done by means of design space which can provide an immediate overview of all the results in one single graph, where the probability and impact values, found by the previous analysis, represents the coordinates of each point. In order to quantify the acceptability level of each risk values, a reference frame has to be chosen first. For this study, a reference line is used, so that every value can be compared. It is an arbitrary line built by combining definitions (used in safety regulations [3] and [9]) and the “impact scale” previously described. It is based on the following and represents the “allowable risk”:
‐ Severity of consequences to both airplane and its occupants caused by the failure of one or more functions (see Table 4) and
‐ Probability of the occurrence of such failure (see [3]). In Figure 2 an example of the design space used can be seen. The curved line is the risk allowable line, while the points represent each scenario’s risk value found through the described steps. The area on the right of the allowable line represents the non acceptable risk: the further the points lay from this line, the higher the associated risk value is. Depending on the set of data used to build these design space, they can represent one aircraft type or one aircraft category.
Figure 2: Example of hazard scenario design space.
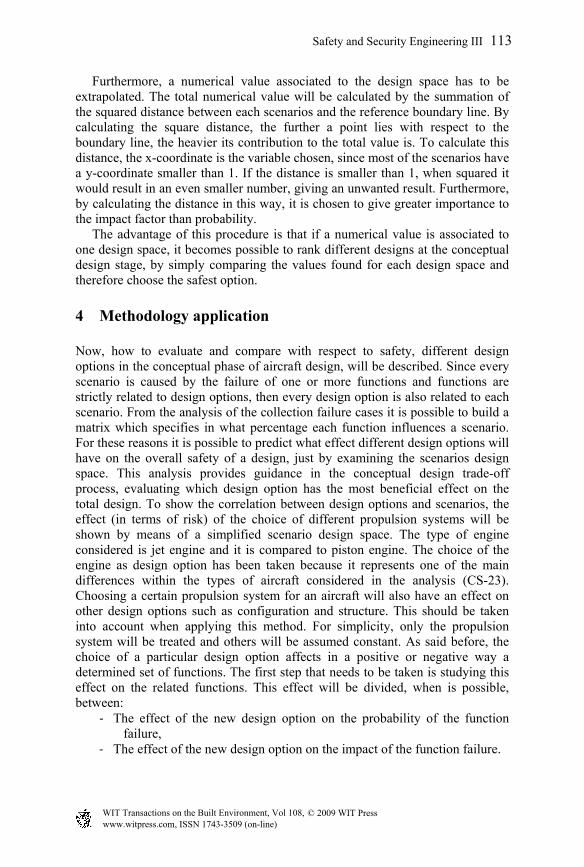
Furthermore, a numerical value associated to the design space has to be extrapolated. The total numerical value will be calculated by the summation of the squared distance between each scenarios and the reference boundary line. By calculating the square distance, the further a point lies with respect to the boundary line, the heavier its contribution to the total value is. To calculate this distance, the x-coordinate is the variable chosen, since most of the scenarios have a y-coordinate smaller than 1. If the distance is smaller than 1, when squared it would result in an even smaller number, giving an unwanted result. Furthermore, by calculating the distance in this way, it is chosen to give greater importance to the impact factor than probability. The advantage of this procedure is that if a numerical value is associated to one design space, it becomes possible to rank different designs at the conceptual design stage, by simply comparing the values found for each design space and therefore choose the safest option.
4 Methodology application
Now, how to evaluate and compare with respect to safety, different design options in the conceptual phase of aircraft design, will be described. Since every scenario is caused by the failure of one or more functions and functions are strictly related to design options, then every design option is also related to each scenario. From the analysis of the collection failure cases it is possible to build a matrix which specifies in what percentage each function influences a scenario. For these reasons it is possible to predict what effect different design options will have on the overall safety of a design, just by examining the scenarios design space. This analysis provides guidance in the conceptual design trade-off process, evaluating which design option has the most beneficial effect on the total design. To show the correlation between design options and scenarios, the effect (in terms of risk) of the choice of different propulsion systems will be shown by means of a simplified scenario design space. The type of engine considered is jet engine and it is compared to piston engine. The choice of the engine as design option has been taken because it represents one of the main differences within the types of aircraft considered in the analysis (CS-23). Choosing a certain propulsion system for an aircraft will also have an effect on other design options such as configuration and structure. This should be taken into account when applying this method. For simplicity, only the propulsion system will be treated and others will be assumed constant. As said before, the choice of a particular design option affects in a positive or negative way a determined set of functions. The first step that needs to be taken is studying this effect on the related functions. This effect will be divided, when is possible, between:
‐ The effect of the new design option on the probability of the function failure,
‐ The effect of the new design option on the impact of the function failure.
Since a quantitative estimate of these effects is not possible, they will be simply compared with the situation used as test case and an example will be given in the following table. When the effect on probability and impact is positive with respect to the reference design option (which means a reduction in likelihood of occurrence and in impact) it will be indicated with a “ ” in the table, when the effect is negative (which means in increase in probability and impact) a “ ” is used. If the new design option does not have any influence, then the cell will be left blank. Once the design options are evaluated and compared, an updated design space can be built. In order to do so, an estimate of the new probability and impact using these design options is necessary. To overcome this issue, an arbitrary (This percentage has been chosen with the only purpose to show the changes in the design space.) 5% increase or 5% decrease in the data used will be considered.
Table 6: Design option evaluation example.
Function Jet Engine
Probability Impact
Perform flight operation + +
Perform pre-flight operation -
Operate in environment +
Provide thrust + +
Provide communication (ATC)
+ +
Maintain structural integrity +
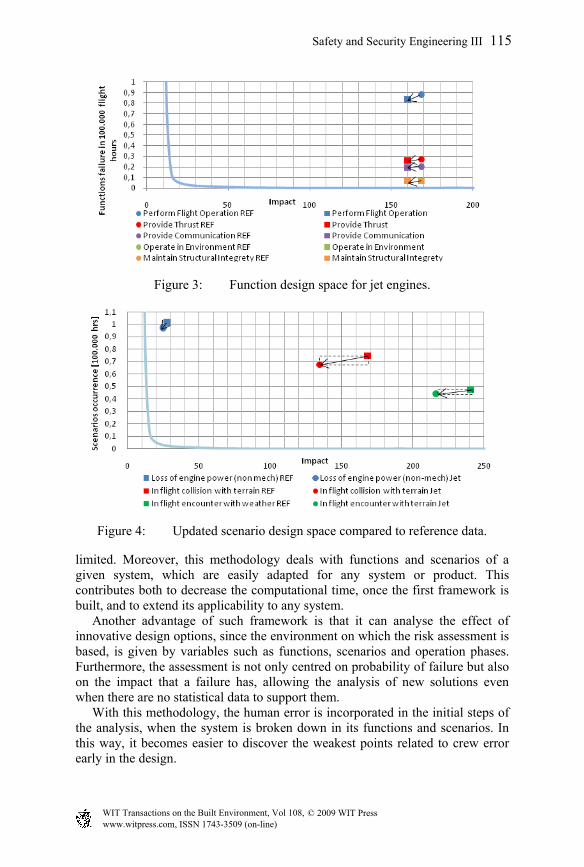
Since the link between scenario and functions is available from the analysis, it is possible to estimate the changes in the scenarios risk assessment due to the influence of different design options on each function (see Figure 1). From Figures 1 and 4 it can be graphically verified that, according to the results of this analysis, the choice of a jet engine above a piston engine for a CS-23 type of aircraft, results in an improvement in the risk value, hence in safety. Using the relation between functions and scenarios, the following updated scenario design space can be built. From these design spaces it becomes clear that the effect of a design option on one single function seems marginal, but since scenarios are influenced by several functions there is a cumulative effect given by design options.
5 Conclusions
This paper presented a methodology which enables the evaluation of conceptual aircraft design from a safety point of view. It can analyse complex systems without an excessive amount of workload since it is applied to the conceptual designs phase, where the amount of information and options to process is still
Figure 4: Updated scenario design space compared to reference data.
limited. Moreover, this methodology deals with functions and scenarios of a given system, which are easily adapted for any system or product. This contributes both to decrease the computational time, once the first framework is built, and to extend its applicability to any system. Another advantage of such framework is that it can analyse the effect of innovative design options, since the environment on which the risk assessment is based, is given by variables such as functions, scenarios and operation phases. Furthermore, the assessment is not only centred on probability of failure but also on the impact that a failure has, allowing the analysis of new solutions even when there are no statistical data to support them. With this methodology, the human error is incorporated in the initial steps of the analysis, when the system is broken down in its functions and scenarios. In this way, it becomes easier to discover the weakest points related to crew error early in the design.
Finally, as already been said when introducing this methodology, when issues related to safety are discovered later on the life cycle of the product, they are often difficult and expensive to be resolved. Implementation of safety measures becomes more efficient when safety assessment is performed in the early stages of a design. By breaking down a scenario in its failing functions, this method offers a structured framework to predict the total effect of a design option on a scenario during conceptual design. Therefore, the most important advantage is that it allows designers to evaluate and compare the total effect of different design options on safety during the conceptual design of aircraft.
References
[1] Tooren, M.J.L. van. Structural Design and Airworthiness. Delft : s.n. [2] Garrick, S. Kaplan and B.J. “On the Quantitative Definition of Risk,” Risk
Analysis. 1981. [3] FAA. System Safety Handbook. [4] 1997, BASE. Boeing Airplane Safety Engineering, Statistical Summary of
[5] A Knowledge Based Engineering Approach to Support Automatic Generation of FE Models in Aircraft Design. G. La Rocca, M. J.L. van Tooren. Delft University of Technology, Delft, the Netherlands : s.n., 2007.
[6] Quantitative Risk Assessment System (QRAS) Version 1.6 User’s Guide. NASA : s.n., April, 2001.
[7] Fault Tree Handbook with Aerospace Applications (Draft). NASA : s.n., June 2002.
[8] Probabilistic Risk Assessment Training Materials for NASA Mangers and Practitioners. 2002.
[9] ICAO Annex13 Ch.1. [10] NTSB (National Transportation and Safety Board) accident and incident