Page 1
Safety Performance Functions
FINAL REPORT
October 8, 2014
By Eric Donnell, Vikash Gayah, and
Paul Jovanis
The Thomas D. Larson
Pennsylvania Transportation Institute
COMMONWEALTH OF PENNSYLVANIA
DEPARTMENT OF TRANSPORTATION
CONTRACT # 4400008014
WORK ORDER # PSU 001
Page 2
Technical Report Documentation Page
1. Report No. FHWA-PA-2014-007-PSU WO 1
2. Government Accession No.
3. Recipient’s Catalog No.
4. Title and Subtitle Safety Performance Functions
5. Report Date October 8, 2014 6. Performing Organization Code
7. Author(s) Eric T. Donnell, Ph.D., P.E., Vikash V. Gayah, Ph.D., and Paul Jovanis, Ph.D.
8. Performing Organization Report No. LTI 2015-09
9. Performing Organization Name and Address Thomas D. Larson Pennsylvania Transportation Institute The Pennsylvania State University 201 Transportation Research Building University Park, PA 16802
10. Work Unit No. (TRAIS) 11. Contract or Grant No. 4400008014, WO No. PSU 01
12. Sponsoring Agency Name and Address The Pennsylvania Department of Transportation Bureau of Planning and Research Commonwealth Keystone Building 400 North Street, 6th Floor Harrisburg, PA 17120-0064
13. Type of Report and Period Covered Final Report: 8/9/2013 – 10/8/2014 14. Sponsoring Agency Code
15. Supplementary Notes Girish Modi ([email protected] ), Chief, Highway Safety, Risk Management and Crash Data Analysis, and Christopher Speese ([email protected] ), Manager, Safety Engineering and Risk Management, Pennsylvania Department of Transportation, served as the technical advisors on the project. Heather Heslop ([email protected] ) was the research project manager. 16. Abstract This project developed safety performance functions for roadway segments and intersections for two-lane rural highways in Pennsylvania. The statistical modeling methodology was consistent with that used in the first edition of the American Association of State Highway and Transportation Officials’ Highway Safety Manual. Two realistic case study examples are provided to illustrate how to use the safety performance functions developed in this project. 17. Key Words Safety performance functions, negative binomial regression, two-lane rural highways, intersections
18. Distribution Statement No restrictions. This document is available from the National Technical Information Service, Springfield, VA 22161
19. Security Classif. (of this report) Unclassified
20. Security Classif. (of this page) Unclassified
21. No. of Pages 81
22. Price N/A
Form DOT F 1700.7 (8-72) Reproduction of completed page authorized
Page 3
DisclaimerThisworkwas sponsoredby thePennsylvaniaDepartmentofTransportationand theU.S. Department of Transportation, Federal Highway Administration. The contents ofthis report reflect theviewsof theauthors,whoare responsible for the factsand theaccuracy of the data presented herein. The contents do not necessarily reflect theofficialviewsorpoliciesofeithertheFederalHighwayAdministration,U.S.Departmentof Transportation, or the Commonwealth of Pennsylvania at the time of publication.Thisreportdoesnotconstituteastandard,specification,orregulation.AcknowledgementTheauthorswishtoacknowledgeMr.GirishModi,Chief,PennDOTHighwaySafety,RiskManagementandCrashDataAnalysis,andMr.ChristopherSpeese,Manager,PennDOTSafetyEngineeringandRiskManagement,fortheirsupportandguidance.Theauthorsalsowish to acknowledgeMs.HeatherHeslop, PennDOTResearch ProgramManager,for her support. Finally, the authors wish to acknowledge Messrs. Philip Kulis andJeffreyGooch,bothgraduatestudentsatPennState, fortheireffortstocoordinatethedatacollectioneffortforthisproject.The20undergraduatestudentsatPennStatewhocollectedthedataareacknowledgedfortheirconsiderableeffort.
Page 4
iii
TABLEOFCONTENTS
INTRODUCTION........................................................................................................1
DATACOLLECTION.................................................................................................1
RoadwayManagementSystemData....................................................................................................1 SupplementalRoadwayandIntersectionDataElements...........................................................3 OnlineVideoPhotologDataCollection..................................................................................................3 GoogleEarthDataCollection......................................................................................................................4
ElectronicCrashData..................................................................................................................................5
ROADSEGMENTSAFETYPERFORMANCEFUNCTIONS...............................6
StatisticalModelingMethodology.........................................................................................................6 DataSummary................................................................................................................................................8 SafetyPerformanceFunctions................................................................................................................9 SummaryofFindings................................................................................................................................13
INTERSECTIONSAFETYPERFORMANCEFUNCTIONS...............................14
StatisticalModelingMethodology.......................................................................................................14 DataSummary..............................................................................................................................................15 SafetyPerformanceFunctions..............................................................................................................21 Summary.........................................................................................................................................................28
CASESTUDIES.........................................................................................................29
Casestudy1–Estimatingcrashfrequenciesforanexistingroadwaysegment.............29 Thesite/facility................................................................................................................................................29 Thequestion......................................................................................................................................................29 Thefacts..............................................................................................................................................................29 Assumptions......................................................................................................................................................32 Results..................................................................................................................................................................32 Steps......................................................................................................................................................................32
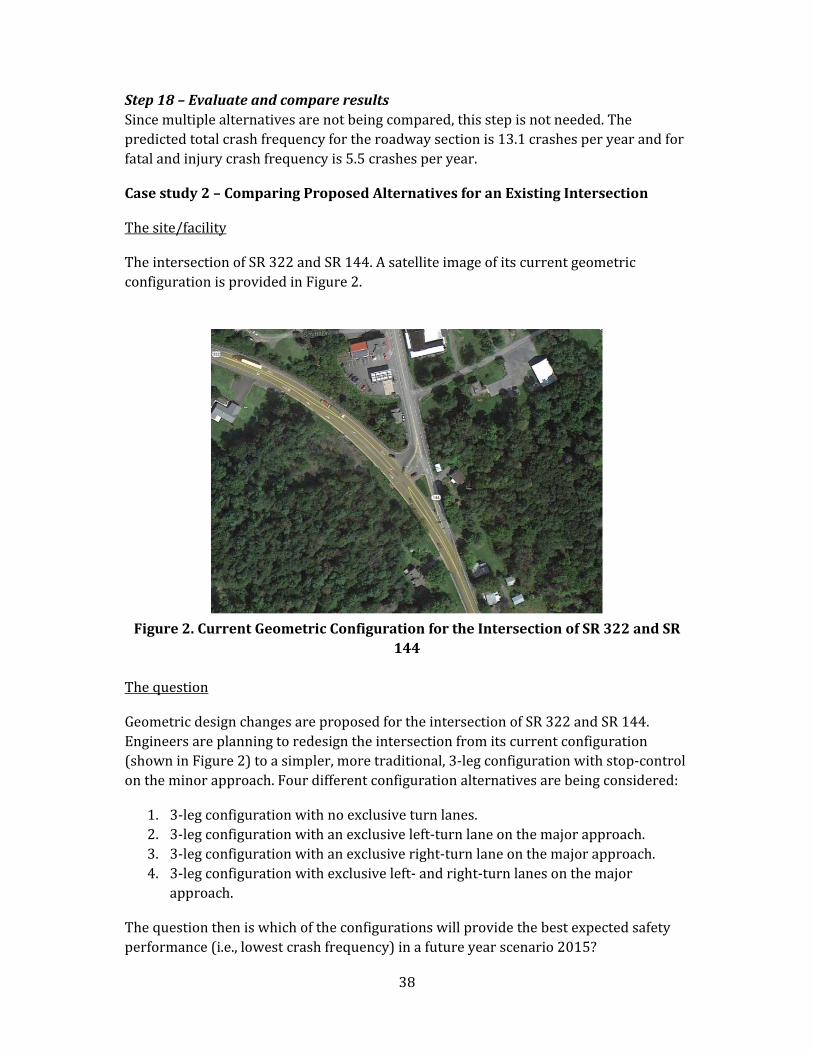
Casestudy2–ComparingProposedAlternativesforanExistingIntersection..............38 Thesite/facility................................................................................................................................................38 Thequestion......................................................................................................................................................38 Facts......................................................................................................................................................................39 Assumptions......................................................................................................................................................39 Results..................................................................................................................................................................39 Steps......................................................................................................................................................................39
REFERENCES............................................................................................................42
Page 5
iv
LISTOFFIGURESFigure1.SectionofSR322considered..................................................................................................29 Figure2.CurrentGeometricConfigurationfortheIntersectionofSR322andSR144...38
Page 6
v
LISTOFTABLESTable1.Crash,TrafficVolume,andSiteCharacteristicDataSummary....................................9 Table2.TotalCrashFrequencySafetyPerformanceFunctionForSegments......................10 Table3.FatalandInjuryCrashFrequencySafetyPerformanceFunctionforSegments.12 Table4.ElasticitiesforIndependentVariablesinTotalandFatalandInjuryCrashModels..................................................................................................................................................................12 Table5.SummaryStatisticsforTotalCrashFrequencybyIntersectionType....................16 Table6.SummaryStatisticsforFatalandInjuryCrashFrequencybyIntersectionType.................................................................................................................................................................................16 Table7.SummaryStatisticsfor4‐legSignalizedIntersections..................................................17 Table8.SummaryStatisticsfor3‐legSignalizedIntersections..................................................18 Table9.SummaryStatisticsfor4‐legAll‐wayStop‐controlledIntersections......................19 Table10.SummaryStatisticsfor4‐legTwo‐wayStop‐controlledIntersections................20 Table11.SummaryStatisticsfor3‐legTwo‐wayStop‐controlledIntersections................21 Table12.SafetyPerformanceFunctionfor4‐legSignalizedIntersections...........................22 Table13.SafetyPerformanceFunctionfor3‐legSignalizedIntersections...........................23 Table14.SafetyPerformanceFunctionfor4‐legAll‐wayStop‐controlledIntersections.................................................................................................................................................................................24 Table15.SafetyPerformanceFunctionfor4‐legTwo‐wayStop‐controlledIntersections.................................................................................................................................................................................25 Table16.SafetyPerformanceFunctionfor3‐legTwo‐wayStop‐controlledIntersections.................................................................................................................................................................................26 Table17.ElasticitiesforIndependentVariablesinTotalandFatalandInjuryCrashModelsfor4‐legSignalizedIntersections.............................................................................................27 Table18.ElasticitiesforIndependentVariablesinTotalandFatalandInjuryCrashModelsfor3‐legSignalizedIntersections.............................................................................................27 Table19.ElasticitiesforIndependentVariablesinTotalandFatalandInjuryCrashModelsfor4‐legAll‐wayStop‐controlledIntersections.................................................................28 Table20.ElasticitiesforIndependentVariablesinTotalandFatalandInjuryCrashModelsfor4‐legTwo‐wayStop‐controlledIntersections.............................................................28 Table21.ElasticitiesforIndependentVariablesinTotalandFatalandInjuryCrashModelsfor3‐legTwo‐wayStop‐controlledIntersections.............................................................28 Table22.GeometricandOtherCharacteristicsofStudyArea....................................................30 Table23.TrafficVolumesForRoadSegmentsinStudyArea......................................................31 Table24.TotalCrashFrequenciesforStudyArea............................................................................31 Table25.FatalandInjuryCrashFrequenciesforStudyArea.....................................................32 Table26.CrashFrequencyPredictionsforSegment650forAllAnalysisYears................36 Table27.SummaryofPredictCrashFrequenciesandCrashFrequenciesAccountingfortheEBAdjustment..........................................................................................................................................37 Table28.FutureTrafficVolumesforStudySite................................................................................39 Table29.SummaryofResultsoftheFourIntersectionConfigurationAlternatives.........42
Page 8
1
INTRODUCTION
TheAmericanAssociationofStateHighwayandTransportationOfficials’(AASHTO)HighwaySafetyManual(HSM)providestransportationprofessionalswiththetoolsnecessarytoquantifythesafetyperformanceofplannedorexistinghighways.OnesetoftoolsavailableinthecurrenteditionoftheHSMaresafetyperformancefunctions(SPFs)forruraltwo‐lane,ruralmulti‐lane,andurbanandsuburbanarterials.TheHSMalsoprovidesadetailedcalibrationmethodtoadapteachalgorithmtolocalconditionssincethedatausedtodevelopthecrashpredictionalgorithmswerenotacquiredfromPennsylvaniaandthusdonotreflectPennsylvaniadrivingconditions.Alternatively,theHSMindicatesthatdevelopingSPFsusinglocaldatawillprovidemorereliablecrashfrequencyestimatesthanapplyingthecalibrationprocedure.
Inlightofthis,theobjectivesofthisprojectaretodevelopSPFsforruraltwo‐laneroadsegmentsandintersectionsinPennsylvania.Statisticalmodelsfortotalcrashfrequencyandfatalandinjurycrashfrequencywerecreatedusingdatafromallstate‐ownedtwo‐laneruralroadwayswiththree‐digitorlowerstateroutenumbers.ToensurethatthemodelsdevelopedinthisresearchweresimilartothosepresentedintheHSM,thesamestatisticalanalysismethodswereused.
Thereportisorganizedintofoursubsequentsections.Thefirstdescribesthedataelementsandstructuresthatwereacquiredtoestimatethestatisticalmodelsofcrashfrequency.ThefollowingtwosectionsdescribetheestimationofroadwaysegmentSPFsandintersectionSPFs,respectively.ThefinalsectionofthisreportincludestworealisticcasestudyexamplestoillustratehowtheSPFscanbeusedtoassessthesafetyperformanceoftwo‐laneruralhighwaysegmentsandintersections,respectively,inPennsylvania.
DATACOLLECTION
ThefirstpartofthissectionincludesadescriptionofthePennDOTRoadwayManagementSystem(RMS)datafilesthatwereacquiredtodeveloptheSPFsandhowthesefileswereorganizedforstatisticalmodelingpurposes.ThesedataweresupplementedwithadditionalelementsthatwerecollectedusingPennDOT’sonlinevehiclephotologsystemandGoogleEarth,whicharedescribedinAppendicesAandB,respectively.ThelastpartofthissectionincludesinformationconcerningtheelectroniccrashdatathatwereusedtodeveloptheroadwayandintersectionSPFs.
RoadwayManagementSystemData
TheRMSdatafilesincludeinformationabouttheroadwaycross‐section,trafficvolume,accesscontrol,functionalclassification,postedspeedlimit,andintersectionlocationsandtrafficcontrol.ThesedataarecodifiedbasedonPennDOT’slinearreferencingsystem,whichisdefinedbythecounty,stateroute,andsegmentnumber.Twodatafiles
Page 9
2
(fortheyears2008and2012)wereacquiredfromPennDOTformodelingpurposes.Thesetwodatafileswereinitiallycomparedtodetermineifsegmentsorintersectionswereaddedordeletedduringthistimeperiodperhapsduetonewroadwayconstruction,majorreconstructionorchangesinthefunctionalclassificationofasegment.Forthemostpart,roadwayinfrastructureelementsinthedatafiles(e.g.,numberoflanes,lanewidth,shouldertype,shoulderwidth,divisortype,anddivisorwidth)remainedunchangedbetweentheyears2008and2012;however,anydifferenceswereidentified.Sinceacomparisonofthesegmentandintersectiondatainthe2008and2012filesrevealedthatfewdifferencesexistedbetweenthetwofiles,the2012filewasusedasthebasefilesinceitwasthemostrecentlyupdated.
Theonlyvariablesthatchangedsignificantlyacrossthefileswerethetrafficvolumes,expressedasaverageannualdailytraffic(AADT)inunitsofvehiclesperday.Toaccountforchangingtrafficvolumesfortheinterimyearsbetween2008and2012,theresearchteamusedlinearinterpolationoftheseknownvolumes.Ashistoricalcrashdatawasavailablestartingfrom2005,linearextrapolationwasusedtoestimatetrafficvolumesfortheyearsbetween2005and2008.
IntersectionlocationinformationwasacquiredfromthePennDOTRMSIntersectiondatafiles.TheRMSIntersectiondatafilesincludethecounty,stateroutenumber,segment,andoffsetwheretworoadwaysonthestate‐ownedroadwaynetworkintersect.Thisintersectionlocationinformationwasappendedtothesegmentdata.AftermergingtheRMSsegmentdatawiththeRMSIntersectiondata,twoseparatedatafileswerecreatedfortheSPFdevelopmentprocess.ThefirstfilewasusedforthedevelopmentofSPFsonroadwaysegments,andincludedthefollowingdataelements:
Linearreferenceinformation(county,route,andsegment) Segmentlength Averageannualdailytraffic(vehicles/day) Commercialvehicletraffic(trucks/day) Pavedroadwaywidth(includingalltravellanes) Numberoftravellanesinbothdirections Postedspeedlimit Divisortype Left‐andright‐shouldertype Left‐andright‐shoulderpavedwidth(feet) Left‐andright‐shouldertotalwidth
ThesecondfilewasusedforthedevelopmentofSPFsatintersectionsandwascomposedofonlytherelevantdatafromintersectionlocations.Thesedataincludedthetypeofcontrolpresentateachintersectionaswellasthesegment‐leveldatalistedaboveforeachintersectingroadwayintheintersectiondataanalysisfiles.
ThereareseveralsupplementaldataelementsthatwerecollectedaspartofthisprojecttoenableinclusionofadditionalroadwayandroadsidefeaturesintheSPFs.Atthe
Page 10
3
segment‐level,theseincludedtheroadsidehazardrating,presence,radiusandlengthofhorizontalcurves,presenceofpassingzones,andthepresenceofvariouslow‐costsafetyimprovements(i.e.,shoulderorcenterlinerumblestrips,horizontalcurvewarningpavementmarkings,intersectionwarningpavementmarking,andaggressivedrivingdotpavementmarkings).Fortheintersectiondatafiles,theadditionalelementsincludedintersectionskewangle,presenceofauxiliarylanesonintersectionsapproaches(i.e.,left‐orright‐turnlanes)andthepresenceofcrosswalksonanyintersectionapproach.Thepresenceandtypeofthetrafficcontrolateachintersectionwasalsoverifiedduringthisstageofthedatacollectionprocess.Eachofthesesupplementaldatacollectionstrategiesaredescribedbelow.
SupplementalRoadwayandIntersectionDataElements
Thispartofthedatacollectionplanisorganizedintotwoparts.ThefirstdescribesthedataelementsthatwerecollectedandcodifiedusingPennDOT’sonlinevideophotologsystem.TheseconddescribesthedataelementsthatwerecollectedusingtheGoogleEarthweb‐basedtool.AppendixAandAppendixBincludetheinstructionalguidesfortheonlinevideophotologandGoogleEarthdatacollectionmethods,respectively.
OnlineVideoPhotologDataCollection
PennDOT’svideophotologsystemcanbefoundonlineatthefollowinglink:
http://www.dot7.state.pa.us/VideoLog/Open.aspx
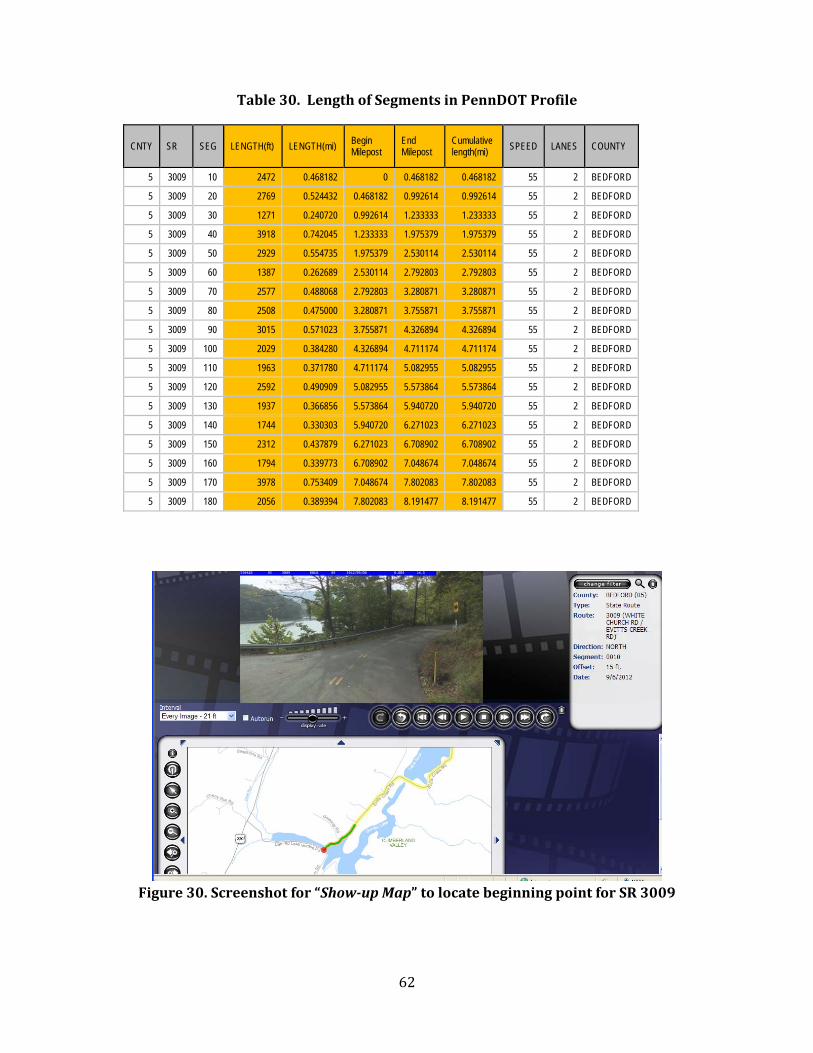
Theweb‐basedapplicationcontainsaforward‐lookingviewoftheroadwayandroadsidefromadriver’sperspective.Thedistancebetweenconsecutiveimagesvariesfrom21to210feet.Inadditiontotheforward‐lookingdisplay,amapofthesegmentwithintheroadwaynetworkisdisplayedwithinthevideophotologapplication.
Bothroadwaysegmentandintersectiondetailswerecollectedusingtheonlinevideophotologsystem.Thesegmentdataincluded:
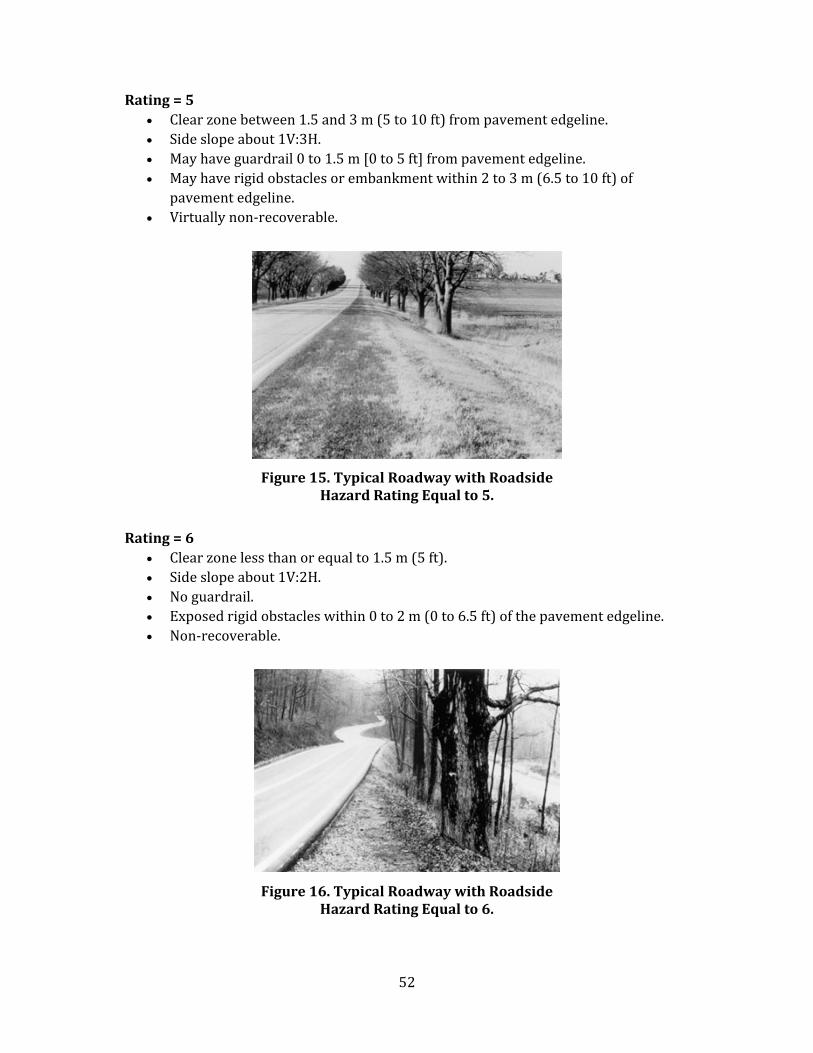
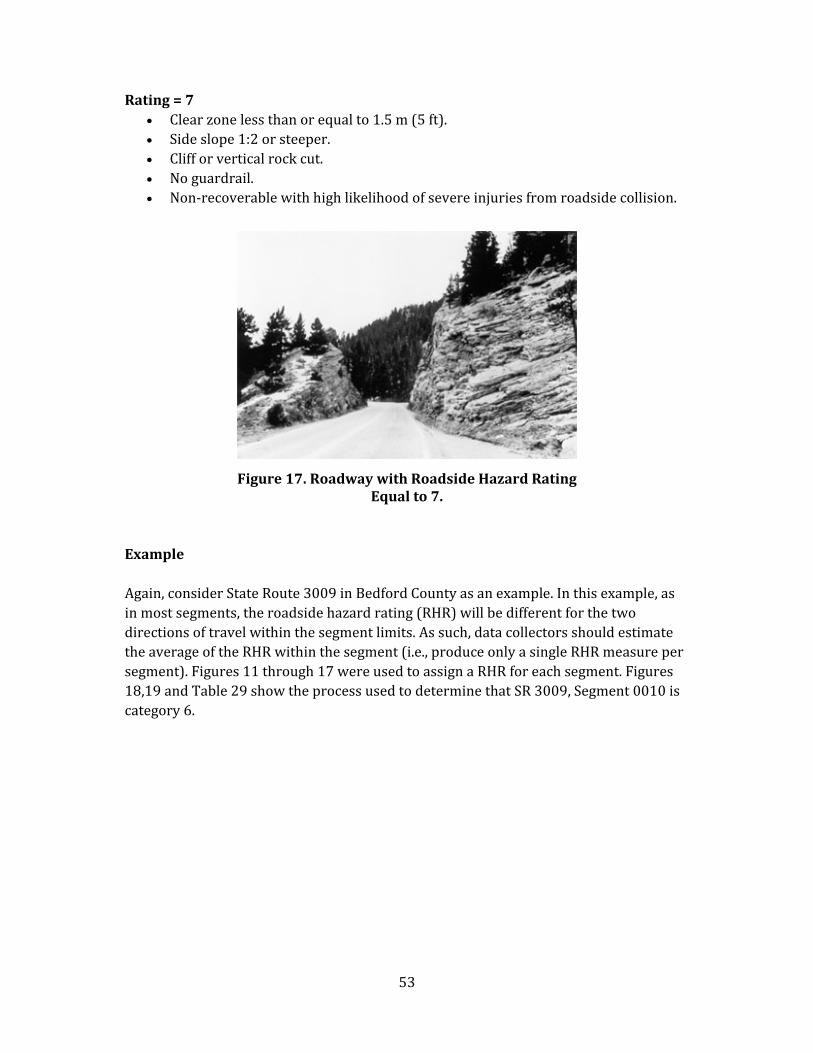
Roadsidehazardrating(RHR):estimatedonthe1to7scaleproposedbyZegeeretal.(1986)
Presenceofpassingzoneswithinthesegment. Presenceoflow‐costsafetyimprovements,suchas:centerlineandshoulder
rumblestripsonroadway,horizontalcurvewarningpavementmarkings,aggressivedrivingdots,andintersectionwarningpavementmarkings.
Drivewaydensity:thenumberofdrivewaysorintersectionsalongasegmentthatarenotincludedinthestate‐ownedintersectionanalysisdatabase.
EachofthesedataelementswerecodedintotheRMSdatafilesthataredescribedaboveforeachtwo‐laneruralhighwaysegment.Theintersectiondataelementsthatwerecollectedusingtheon‐linevideophotologsystemincluded:
Presenceofintersectionauxiliarylanes:left‐orright‐turnlanes
Page 11
4
Presenceofpedestriancrosswalkonintersectionapproach. Verificationofthetypeofintersectiontrafficcontrol:signalizedorstop‐
controlledintersections
EachofthesedataelementswerecodedintotheRMSIntersectiondatafilesthataredescribedabove.
AppendixAofthisreportincludesaninstructionalguidethatdescribesthedatacollectionprocedureandwasusedtoensureinter‐raterconsistencyamongthedatacollectionteamfortheRHR.
GoogleEarthDataCollection
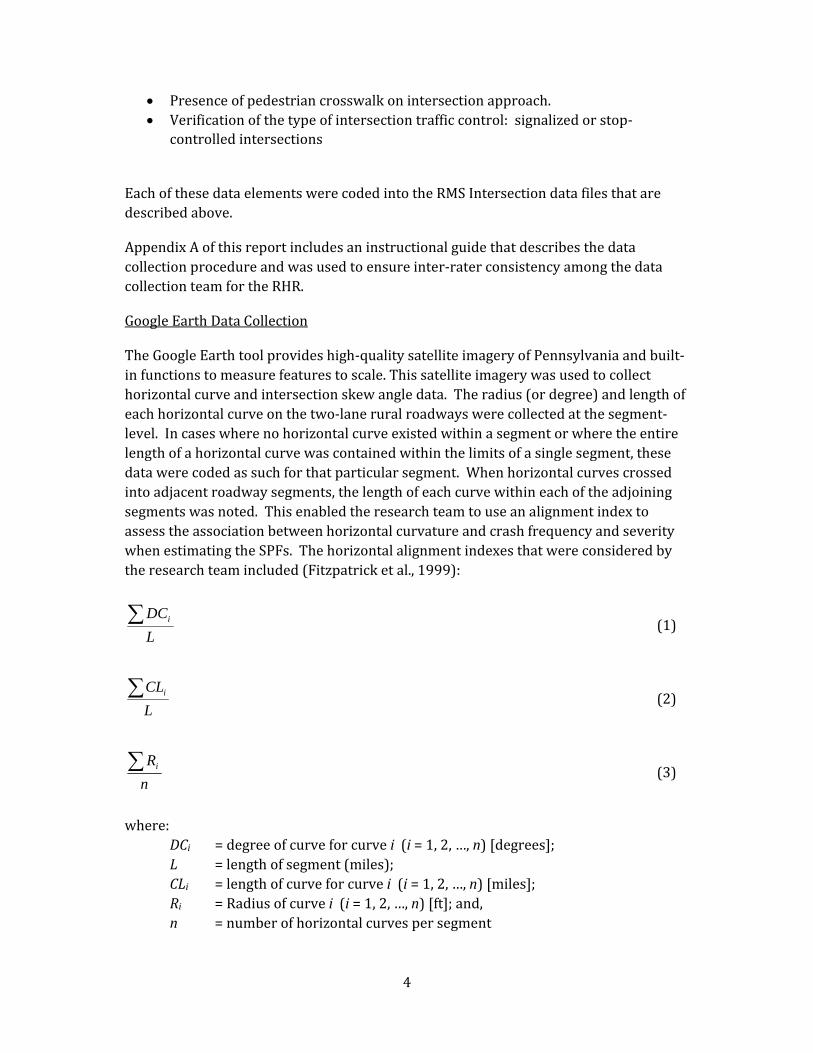
TheGoogleEarthtoolprovideshigh‐qualitysatelliteimageryofPennsylvaniaandbuilt‐infunctionstomeasurefeaturestoscale.Thissatelliteimagerywasusedtocollecthorizontalcurveandintersectionskewangledata.Theradius(ordegree)andlengthofeachhorizontalcurveonthetwo‐laneruralroadwayswerecollectedatthesegment‐level.Incaseswherenohorizontalcurveexistedwithinasegmentorwheretheentirelengthofahorizontalcurvewascontainedwithinthelimitsofasinglesegment,thesedatawerecodedassuchforthatparticularsegment.Whenhorizontalcurvescrossedintoadjacentroadwaysegments,thelengthofeachcurvewithineachoftheadjoiningsegmentswasnoted.ThisenabledtheresearchteamtouseanalignmentindextoassesstheassociationbetweenhorizontalcurvatureandcrashfrequencyandseveritywhenestimatingtheSPFs.Thehorizontalalignmentindexesthatwereconsideredbytheresearchteamincluded(Fitzpatricketal.,1999):
L
DCi (1)
L
CLi (2)
n
Ri (3)
where: DCi =degreeofcurveforcurvei(i=1,2,…,n)[degrees]; L =lengthofsegment(miles); CLi =lengthofcurveforcurvei(i=1,2,…,n)[miles];
Ri =Radiusofcurvei(i=1,2,…,n)[ft];and, n =numberofhorizontalcurvespersegment
Page 12
5
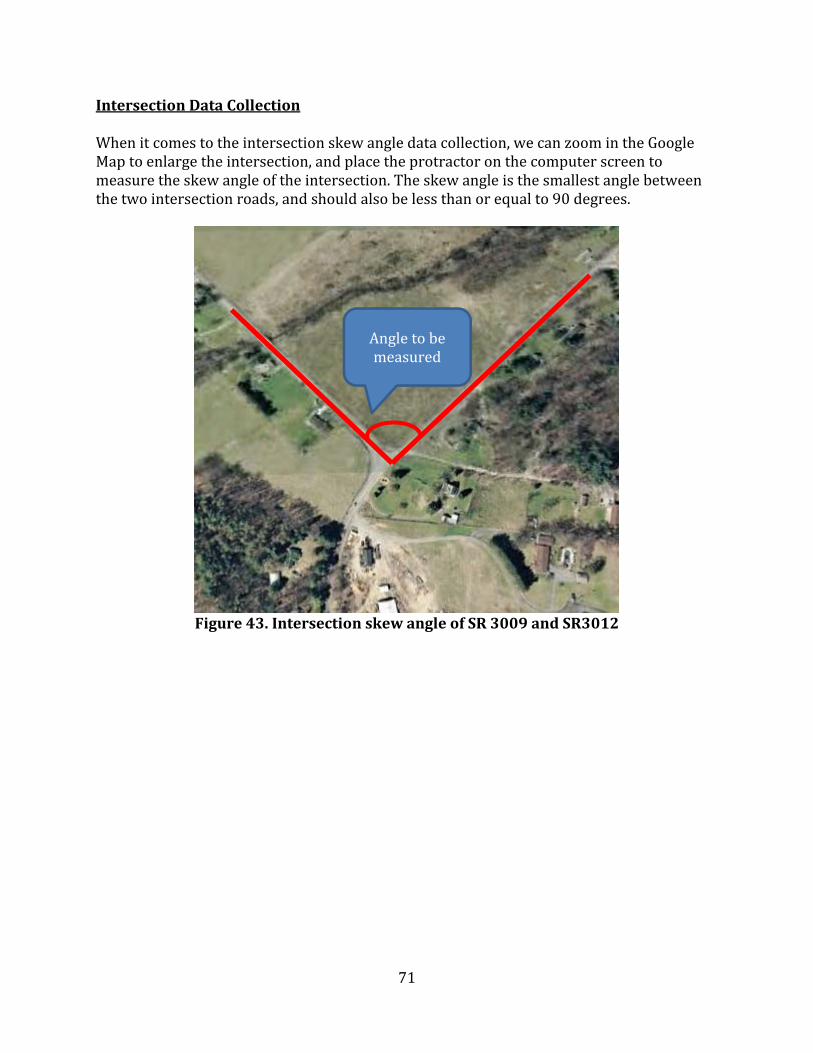
IntersectionskewanglewasdeterminedbyusingaprotractortomeasuretheangleoftheintersectingroadwaysfromGoogleEarthimages.ThesedatawerethenaddedtotheintersectionSPFanalysisdatabase.
AppendixBofthisreportincludesaninstructionalguidethatdescribesthedatacollectionprocedureandwasusedtoensureinter‐raterconsistencyamongthedatacollectionteamforthehorizontalcurveandintersectionskewangledataelements.
ElectronicCrashData
Theresearchteamusedthemostrecenteightyearsofcrashdata(2005through2012,inclusive)toestimatetheroadwaysegmentandintersectionSPFs.Thesedatafilescontainedinformationabouttheevent,driver,andvehicleoccupantsforeachreportedcrashonthestate‐ownedhighwaysysteminPennsylvania.Onlyeventinformationwasusedforthecurrentstudy.Thefollowingdataelementswereusedwhendevelopingthesegment‐levelanalysisdatabase:
Crashlocation:county,stateroute,segment,andoffset Crashdate:month,day,year Crashtype:rear‐end,head‐on,angle,sideswipe,hitfixedobject,hitpedestrian,
other Intersectiontype:mid‐block,four‐wayintersection,“t”intersection,“y”
intersection,trafficcircle/roundabout,multi‐legintersection,railroadcrossing,other
Locationtype:underpass,ramp,bridge,tunnel,tollbooth,drivewayorparkinglot,rampandbridge
Workzonetype:construction,maintenance,utilitycompany Injuryseverity:fatality,majorinjury,moderateinjury,minorinjury,noinjury
Severalofthecrashdataelementswereusedtoidentifycrashesoccurringonroadwaysegmentsandintersectionsofinterestforthepresentstudy.Forexample,crashesoccurringonrampswereusedasachecktoensurethattheRMSfileshavecorrectlyeliminatedrampsfromtheanalysisdatabase.Crashesinconstructionworkzoneswerenotincludedintheanalysisfilesastheseconditionsaretemporary.
CrashdataweremergedwiththeRMSandsupplementaldatafilesbasedonthelocationofthecrash(county,route,andsegment).Crashcounts(total,totalforeachseveritylevel,andtotalforeachcrashtype)foreachroadwaysegmentandintersectionweregeneratedforeachanalysisyear.Locationsthatdidnotexperienceacrashduringanyoneormoreyearswereretainedintheanalysisdatabaseandazerocrashcountwasnotedfortheselocations.
Page 13
6
ROADSEGMENTSAFETYPERFORMANCEFUNCTIONS
ThissectionofthereportdescribestheSPFsdevelopedforruraltwo‐lanehighwaysegmentsinPennsylvania.Thefirstpartofthissectiondescribesthestatisticalanalysismethodologyusedtogeneratethesafetyperformancefunctions.Thesecondpartbrieflysummarizesthedatausedformodelestimation,notingthatthedatacollectionmethodsthatwereusedtoassemblethedataanalysisfilesweredescribedintheprevioussectionofthisreport.Statisticalmodelsarethenreportedfortotalcrashesandfortotalfatalandinjurycrashes.Aninterpretationoftheregressioncoefficientsisalsoincludedinthelastpartofthissection.
StatisticalModelingMethodology
Severalcross‐sectionalmodelingapproacheswereconsideredtoestimatetheroadwaysegmentSPFsinthecurrentstudy.However,inanefforttobeconsistentwiththefirsteditionoftheHSM,negativebinomialregressionwasused.Suchanapproachmodelstheexpectednumberofcrashespermileperyearineachroadwaysegmentasafunctionofoneormoreexplanatoryvariables.Thisisaverycommonapproachtomodelroadwaysegmentcrashfrequency(e.g.,Miaou,1994;Shankaretal.,1995;Changetal.,2005;El‐BasyounyandSayed,2006)becauseitaccountsfortheoverdispersionthatisoftenobservedincrashdata.Overdispersionresultsfromthevarianceexceedingthemeaninthecrashfrequencydistribution.Thegeneralfunctionalformofthenegativebinomialregressionmodelis:
iii X ln (4)
where:i =expectednumberofcrashesonroadwaysegmenti;
=vectorofestimableregressionparameters;Xi =vectorofgeometricdesign,trafficvolume,andothersite‐specificdata;
and, i =gamma‐distributederrorterm.
Themean‐variancerelationshipforthenegativebinomialdistributionis:
)](1)[()( iii yEyEyVar (5)
where:
Var(yi) =varianceofobservedcrashesyoccurringonroadwaysegmenti; E(yi) =expectedcrashfrequencyonroadwaysegmenti;and, =overdispersionparameter.
Page 14
7
Theappropriatenessofthenegativebinomial(NB)regressionmodelisbasedonthesignificanceoftheoverdispersionparameter.Whenisnotsignificantlydifferentfromzero,thenegativebinomialmodelreducestothePoissonmodel.Forallthemodelsthatwereestimated,theestimateofisreportedtoverifytheappropriatenessofthenegativebinomialapproach.
Themethodofmaximumlikelihoodisusedtoestimatethemodelparameters.Thismethodestimatesmodelparametersbyselectingthosethatmaximizealikelihoodfunctionthatdescribestheunderlyingstatisticaldistributionassumedfortheregressionmodel.ThelikelihoodfunctionfortheNBmodelthatwasusedinthisstudyisshowninequation(6):
iy
i
iN
i ii
ii y
yL
1 !)(
)()( (6)
where: N =totalnumberofroadwaysegmentsinthesample; =gammafunction;and, =1/.Toapplythenegativebinomialregressionmodelsestimatedinthisstudy,thefollowingfunctionalformshouldbeused:
)...( 2210 nn XXi eAADTLe (7)
where:i =expectednumberofcrashesonroadwaysegmenti;
e =exponentialfunction; =regressioncoefficientforconstant;L =roadwaysegmentlength(miles);AADT =averageannualdailytraffic(veh/day);1 =regressioncoefficientforAADT;2,…,n =regressioncoefficientsforexplanatoryvariables,i=2,…,n;and,X2,...,Xn =vectorofgeometricdesign,trafficvolume,andothersite‐specific
data.
TheelasticityofeachindependentvariableincludedinthemodelisalsocomputedtohelpinterprettheresultsoftheroadwaysegmentSPFs.Theelasticitiesprovideameasureofresponsivenessofonevariabletoachangeinanother.Forthecontinuousexplanatoryvariablesconsideredinthisstudy(e.g.,AADT),theelasticityisinterpretedasthepercentchangeintheexpectedroadwaysegmentcrashfrequencygivenaonepercentchangeinthatcontinuousvariable.Ingeneral,theelasticityoftheexpected
Page 15
8
crashfrequencyforcontinuousexplanatoryvariable‘k’onroadwaysegment‘i’duringtimeperiod‘j’isdefinedas:
ij
ijk
ijk
ij x
xxE ij
ijk
(8)
Equation5reducestothefollowingexpressionsforthelog‐log(Equation9)andlog‐linear(Equation10)functionalforms,respectively.Theserepresentthetwotypesoffunctionalformsconsideredhere.ThefirstrepresentstherelationshipmodeledbetweenexpectedcrashfrequencyandtheAADTvariableandthesecondrepresentstherelationshipmodeledbetweenexpectedcrashfrequencyandallothercontinuousvariablesintheroadwaysegmentSPFs.
kE ij
ijkx (9)
ijkk xxE ij
ijk
(10)
Theelasticityforindicatorvariables(e.g.,presenceofpassingzones),termedpseudo‐elasticitybyLeeandMannering(2002),isthepercentchangeinexpectedcrashfrequencygivenachangeinthevalueoftheindicatorvariablefromzerotounity.Ingeneral,theelasticityoftheexpectedcrashfrequencyforindicatorvariable‘k’onroadwaysegment‘i’duringtimeperiod‘j’isdefinedas:
1exp kE ij
ijkx (11)
DataSummary
Therewere21,340uniqueroadwaysegmentsincludedinthedataanalysisfile.Becausetherewereeightyearsofcrashdataavailableforeachroadwaysegment(2005to2012),theanalysisdatabaseconsistedof170,720observations.Table1providessummarystatisticsofthesegment‐leveldatafortotalcrashes,fatal,injury,andPDOcrashes,trafficvolume,andtheroadwayandroadsidecharacteristicsincludedintheanalysisdatabase.
AsshowninTable1,therearemoreinjuryandpropertydamageonly(PDO)crashespersegmentthanfatalcrashespersegment.ThecategoricalvariablesareshowninthelowerpanelofTable1.Themajorityofroadwaysegmentshavearoadsidehazardrating(RHR)or4,5,or6.Fewerthan2percentofroadwaysegmentshavecurvewarning,intersectionwarning,or“aggressivedrivingdots”trafficcontroldevices.
Page 16
9
Table1.Crash,TrafficVolume,andSiteCharacteristicDataSummary
Variables Mean Standard Deviation
Minimum Maximum
Total crashes per year 0.667 1.144 0 23 Total fatal crashes per year 0.015 0.123 0 3 Total injury crashes per year 0.347 0.724 0 13 Total property-damage only (PDO) crashes per year 0.306 0.672 0 13 Average annual daily traffic (veh/day) 3282 2933 74 28,674 Segment length (miles) 0.474 0.129 0.003 1.476 Posted speed limit (mph) 47.421 7.650 15 55 Left paved shoulder width (feet) 3.002 2.305 0 22 Right paved shoulder width (feet) 3.048 2.304 0 19 Access density (access points and intersections per mile) 16.300 14.307 0 330 Horizontal curve density (curves per mile) 2.299 2.506 0 42.581 Degree of curve per mile 19.100 44.178 0 1263.478 Length of curve per mile 1004.945 1237.694 0 29,256.37 Categorical Variables Category Proportion
Roadside hazard rating (1 to 7)
1 0.1 2 0.5 3 5.1 4 21.6 5 53.1 6 19.4 7 0.2
Presence of a passing zone Yes 28.4 No 71.6
Presence of centerline rumble strips Yes 21.0 No 79.0
Presence of shoulder rumble strips Yes 8.1 No 91.9
Presence of curve warning pavement marking Yes 1.3 No 98.7
Presence of intersection warning pavement marking Yes 0.5 No 99.5
Presence of “aggressive driving dots” Yes 0.1 No 99.9
Page 17
10
SafetyPerformanceFunctions
TwoSPFsweredevelopedfortwo‐laneruralroadwaysegments:onefortotalcrashfrequency,andoneforthefrequencyoffatalandinjurycrashes.EachoftheindependentvariablesshowninTable1wasenteredintothepreliminarymodelsandtheirrespectivesignsandstatisticalsignificancewereassessed.Thosevariableswiththeexpectedsignthatwereeithersignificant(p‐value<0.05)ormarginallysignificant(p‐value<0.3)wereretainedinthemodels.AllSPFswereestimatedinaformconsistentwithequation(4)above.
NotethatseveralvariablesincludedintheHighwaySafetyManual’sSPFsfortwo‐laneruralroadswereexcludedfromconsiderationintheSPFsdevelopedfortwo‐laneruralroadsinPennsylvaniaduetolackofdataavailability,littlevariationindataacrossindividualroadwaysegments,limitedconfidenceindataqualityorlackofapplicationwithinPennsylvania.Thesevariablesincludeverticalgrade,presenceofverticalcurvature,laneandshoulderwidth,shouldertype,thepresenceoflightingandthepresenceofautomatedspeedenforcement.Furthermore,thepreliminarymodelsrevealedthatsomevariablesweremoreappropriatelytreatedinaformthatdiffersfromtheHSMmodels.Forexample,thepreliminarymodelsrevealedthatroadsidehazardratingcouldbecombinedusinggroupswithroadsidehazardratingsof1‐3,4‐5,and6‐7,sincethesafetyperformanceofroadwaysegmentswerethesamewithineachofthesegroups.
Tables2and3showtheresultsoftheSPFestimation.Eachtableincludestheregressioncoefficients,standarderrors,andt‐statisticsfortheindependentvariablesincludedinthetotalandfatalandinjurycrashmodels,respectively.
Table2.TotalCrashFrequencySafetyPerformanceFunctionForSegments
Variable Coefficient Standard
Error t-statistic p-value
Constant -5.934 0.042 -142.71 <0.001 Natural logarithm of AADT 0.754 0.005 161.44 <0.001 Roadside hazard rating 6 or 7 (1 if RHR is 6 or 7; 0 otherwise) 0.101 0.018 5.67 <0.001
Roadside hazard rating 4 or 5 (1 if RHR is 4 or 5; 0 otherwise)
0.091 0.016 5.71 <0.001
Presence of a passing zone (1 if present; 0 otherwise)
-0.239 0.009 -27.56 <0.001
Presence of shoulder rumble strips (1 if present; 0 otherwise)
-0.188 0.013 -14.19 <0.001
Access density 0.008 0.0003 31.36 <0.001 Horizontal curve density 0.030 0.002 14.81 <0.001 Degree of curve per mile 0.002 0.0001 17.16 <0.001 Overdispersion parameter = 0.514 Pseudo R2 = 0.0874 Log-likelihood at convergence = -174,406.04
Page 18
11
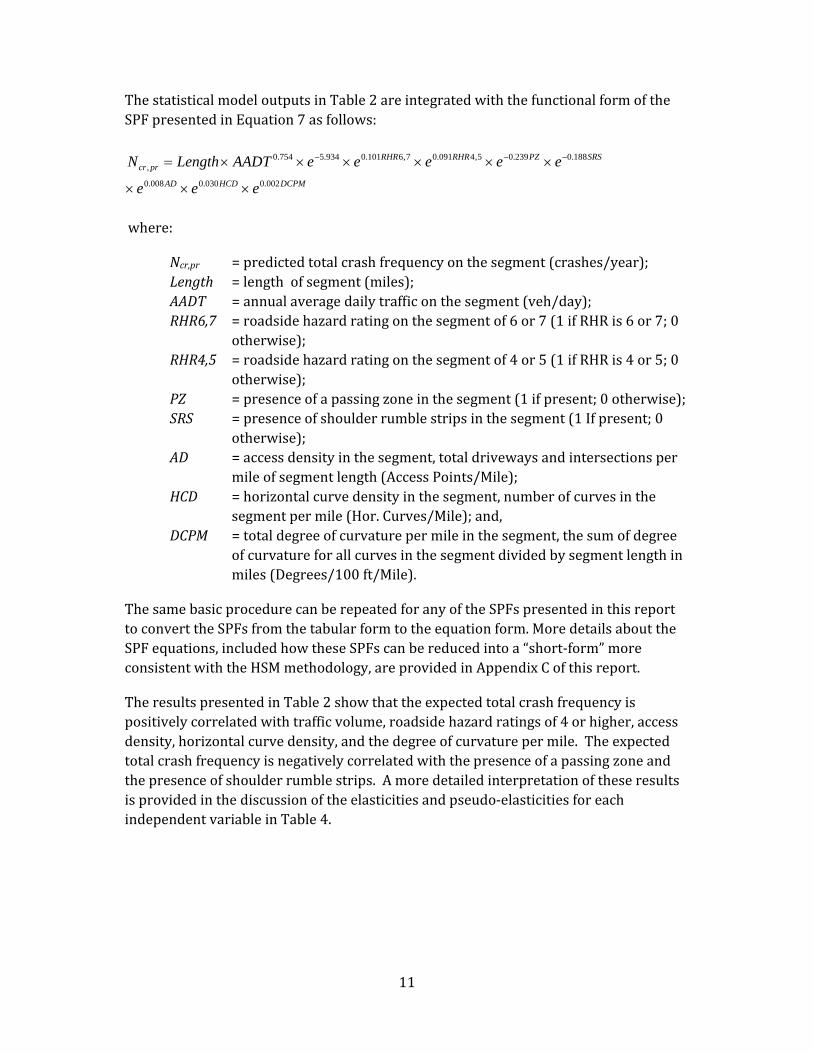
ThestatisticalmodeloutputsinTable2areintegratedwiththefunctionalformoftheSPFpresentedinEquation7asfollows:
DCPMHCDAD
SRSPZRHRRHRprcr
eee
eeeeeAADTLengthN002.0030.0008.0
188.0239.05,4091.07,6101.0934.5754.0,
where:
Ncr,pr =predictedtotalcrashfrequencyonthesegment(crashes/year);Length =lengthofsegment(miles);AADT =annualaveragedailytrafficonthesegment(veh/day);RHR6,7 =roadsidehazardratingonthesegmentof6or7(1ifRHRis6or7;0
otherwise);RHR4,5 =roadsidehazardratingonthesegmentof4or5(1ifRHRis4or5;0
otherwise);PZ =presenceofapassingzoneinthesegment(1ifpresent;0otherwise);SRS =presenceofshoulderrumblestripsinthesegment(1Ifpresent;0
otherwise);AD =accessdensityinthesegment,totaldrivewaysandintersectionsper
mileofsegmentlength(AccessPoints/Mile);HCD =horizontalcurvedensityinthesegment,numberofcurvesinthe
segmentpermile(Hor.Curves/Mile);and,DCPM =totaldegreeofcurvaturepermileinthesegment,thesumofdegree
ofcurvatureforallcurvesinthesegmentdividedbysegmentlengthinmiles(Degrees/100ft/Mile).
ThesamebasicprocedurecanberepeatedforanyoftheSPFspresentedinthisreporttoconverttheSPFsfromthetabularformtotheequationform.MoredetailsabouttheSPFequations,includedhowtheseSPFscanbereducedintoa“short‐form”moreconsistentwiththeHSMmethodology,areprovidedinAppendixCofthisreport.
TheresultspresentedinTable2showthattheexpectedtotalcrashfrequencyispositivelycorrelatedwithtrafficvolume,roadsidehazardratingsof4orhigher,accessdensity,horizontalcurvedensity,andthedegreeofcurvaturepermile.Theexpectedtotalcrashfrequencyisnegativelycorrelatedwiththepresenceofapassingzoneandthepresenceofshoulderrumblestrips.Amoredetailedinterpretationoftheseresultsisprovidedinthediscussionoftheelasticitiesandpseudo‐elasticitiesforeachindependentvariableinTable4.
Page 19
12
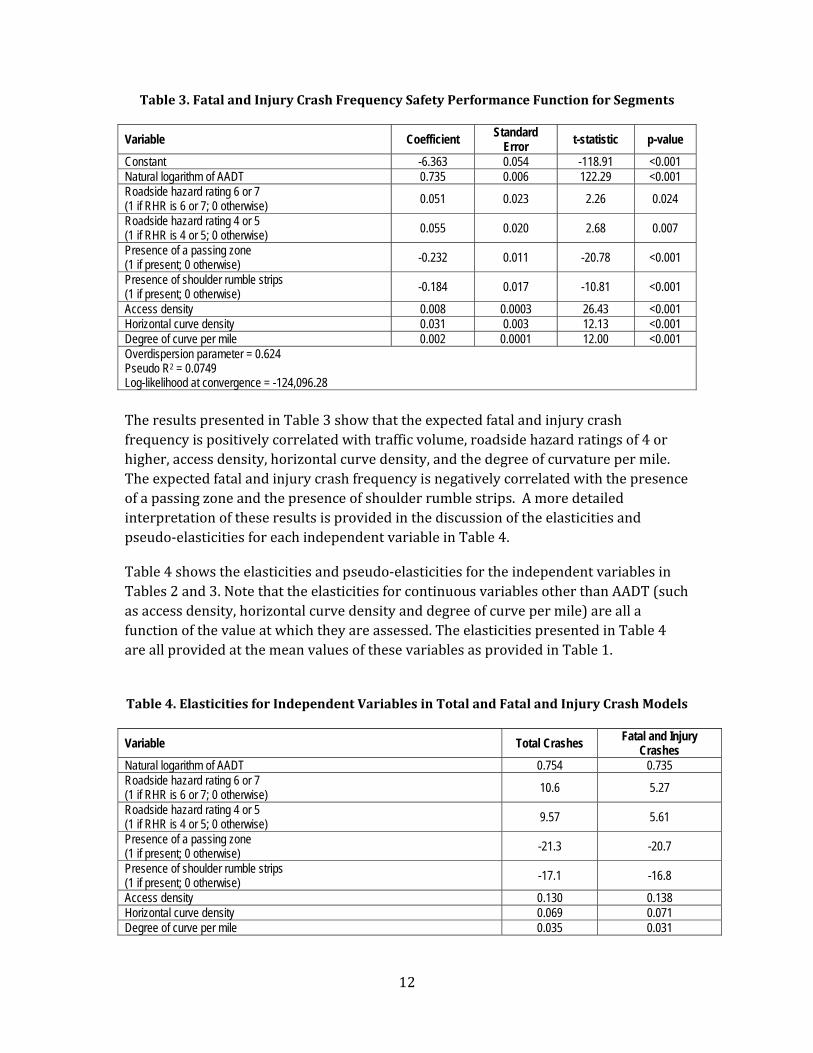
Table3.FatalandInjuryCrashFrequencySafetyPerformanceFunctionforSegments
Variable Coefficient Standard Error
t-statistic p-value
Constant -6.363 0.054 -118.91 <0.001 Natural logarithm of AADT 0.735 0.006 122.29 <0.001 Roadside hazard rating 6 or 7 (1 if RHR is 6 or 7; 0 otherwise) 0.051 0.023 2.26 0.024
Roadside hazard rating 4 or 5 (1 if RHR is 4 or 5; 0 otherwise) 0.055 0.020 2.68 0.007
Presence of a passing zone (1 if present; 0 otherwise) -0.232 0.011 -20.78 <0.001
Presence of shoulder rumble strips (1 if present; 0 otherwise)
-0.184 0.017 -10.81 <0.001
Access density 0.008 0.0003 26.43 <0.001 Horizontal curve density 0.031 0.003 12.13 <0.001 Degree of curve per mile 0.002 0.0001 12.00 <0.001 Overdispersion parameter = 0.624 Pseudo R2 = 0.0749 Log-likelihood at convergence = -124,096.28
TheresultspresentedinTable3showthattheexpectedfatalandinjurycrashfrequencyispositivelycorrelatedwithtrafficvolume,roadsidehazardratingsof4orhigher,accessdensity,horizontalcurvedensity,andthedegreeofcurvaturepermile.Theexpectedfatalandinjurycrashfrequencyisnegativelycorrelatedwiththepresenceofapassingzoneandthepresenceofshoulderrumblestrips.Amoredetailedinterpretationoftheseresultsisprovidedinthediscussionoftheelasticitiesandpseudo‐elasticitiesforeachindependentvariableinTable4.
Table4showstheelasticitiesandpseudo‐elasticitiesfortheindependentvariablesinTables2and3.NotethattheelasticitiesforcontinuousvariablesotherthanAADT(suchasaccessdensity,horizontalcurvedensityanddegreeofcurvepermile)areallafunctionofthevalueatwhichtheyareassessed.TheelasticitiespresentedinTable4areallprovidedatthemeanvaluesofthesevariablesasprovidedinTable1.
Table4.ElasticitiesforIndependentVariablesinTotalandFatalandInjuryCrashModels
Variable Total Crashes Fatal and Injury Crashes
Natural logarithm of AADT 0.754 0.735 Roadside hazard rating 6 or 7 (1 if RHR is 6 or 7; 0 otherwise) 10.6 5.27
Roadside hazard rating 4 or 5 (1 if RHR is 4 or 5; 0 otherwise) 9.57 5.61
Presence of a passing zone (1 if present; 0 otherwise)
-21.3 -20.7
Presence of shoulder rumble strips (1 if present; 0 otherwise)
-17.1 -16.8
Access density 0.130 0.138 Horizontal curve density 0.069 0.071 Degree of curve per mile 0.035 0.031
Page 20
13
Theelasticitiesprovidethepercentchangeinexpectedcrashfrequencywhentheindependentvariableisincreasedbyonepercent(forcontinuousvariablessuchasAADT,accessdensity,horizontalcurvedensityanddegreeofcurvepermile)orchangedfromzerotoone(forindicatorvariablessuchasroadsidehazardratinggroup,presenceofpassingzoneorshoulderrumblestrips).Asexpected,thereisapositiverelationshipbetweentrafficvolumeandcrashfrequency:aonepercentchangeinAADTwillincreasetheexpectedtotalcrashfrequencyby0.754percentandfatalandinjurycrashfrequencyby0.735percent,holdingallothervariablesconstant.Attheaveragevalueprovidedinthedataset,anincreaseinaccesspointdensitybyonepercentwillincreasetheexpectedtotalcrashfrequency(0.130percent)slightlylessthantheexpectedfatalandinjurycrashfrequency(0.138percent),althoughbothmagnitudesareaboutthesameandrelativelysmall.Theincreaseinbothtotalcrashfrequencyandfatalandinjurycrashfrequencyisthesameforaonepercentincreaseinhorizontalcurvedensity(about0.070percent)andaonepercentincreaseindegreeofcurvaturepermile(about0.033percent)atthemeanvaluesobserved.
Asexpected,segmentswithroadsidehazardratingsgreaterthan3areassociatedwithsignificantlyhighercrashfrequenciesthanthosewithpoorroadsidehazardratings.Fortheexpectedtotalcrashfrequency,aroadsidehazardratingof4or5isassociatedwitha9.57percentincreaseoverthebasecondition(RHRof1to3)andaroadsidehazardratingof6or7isassociatedwitha10.6percentincreaseoverthebasecondition.Fortheexpectedfatalandinjurycrashfrequency,aroadsidehazardratingof4or5isassociatedwitha5.27percentincreaseoverthebaseconditionandaroadsidehazardratingof6or7isassociatedwitha5.61percentincreaseoverthebasecondition.Thepresenceofpassingzonesandshoulderrumblestripsarebothassociatedwithlowerexpectedcrashfrequenciesrelativetothebaseconditionofnopassingzonesornoshoulderrumblestrips,respectively.Passingzoneswilldecreasebothexpectedtotalandfatalandinjurycrashfrequencybyabout21percentwhileshoulderrumblestripswilldecreasebothexpectedtotalandfatalandinjurycrashfrequencybyabout17percent,holdingallothervariablesinthemodelconstant.
SummaryofFindings
Thissectionofthereportestimatedstatisticalmodelsoftotalandfatalandinjurycrashfrequencyforroadwaysegmentsofstate‐owned,two‐laneruralhighwaysegmentsinPennsylvania.Thismodelingeffortfoundthatbothcrashfrequencytypeswereafunctionoftrafficvolumes(measuredinAADT),roadsidehazardrating,presenceofshoulderrumblestripsandpassingzones,densitiesofaccesspointsandhorizontalcurves,andthedegreeofhorizontalcurvaturewithintheroadwaysegment.Asexpected,themodelspredictsignificantlylowerfatalandinjurycrashfrequenciesthantotalcrashfrequencies.However,theelasticitiessuggestthatalmostallindependentvariablesimpacttotalandfatalandinjurycrashfrequencybythesamemagnitude.Theloneexceptionisroadsidehazardrating,forwhichtheimpactisabout85%largerfortotalcrashfrequencythanfatalandinjurycrashfrequency.
Page 21
14
SeveralexplanatoryvariablesincludedinTable1wereomittedfromthemodelseitherbecausetheywerenotstatisticallyinsignificantorwerefoundtobeunreliable.Examplesofthelatterincluderoadwaywidthandspeedlimit.Inmanycases,roadwaywidthsprovidedintheRMSdatabasewereunrealisticallylarge(greaterthan40feet)orsmall(lessthan20feet)fortwo‐laneruralroadways.Similarly,speedslimitsaslowas15mphwererecordedintheRMSdatabase,whicharetypicallyindicativeofwarningspeedsandnotregulatoryspeeds.Morereliablerecordsforthesevariablesshouldbeconsideredforfuturemodelingefforts.
INTERSECTIONSAFETYPERFORMANCEFUNCTIONS
ThissectionofthereportdescribestheSPFsdevelopedforruraltwo‐lanehighwayintersectionsinPennsylvania.Statisticalmodelsfortotalcrashfrequencyandfrequencyofdifferentlevelsofcrashinjuryseveritywereestimatedforintersectionsformedbythree‐digitstate‐ownedroadsontheruraltwo‐lanehighways.Includedinthissectionofthereportarethestatisticalmodelingmethodology,datasummary,analysisresults,andinterpretationofthestatisticalmodelingoutput.Thedataelementsandstructuresusedtoconstructthemodelingdatafilesweredescribedearlierinthisreport.
Statisticalmodelsarereportedforallintersectionsoftwostate‐ownedtwo‐laneruralroadswiththefollowingintersectionforms:
4‐legintersectionswithsignalcontrol 3‐legintersectionswithsignalcontrol 4‐legintersectionswithall‐waystopcontrol 4‐legintersectionswithminor‐streetstopcontrol 3‐legintersectionswithminor‐streetstopcontrol
ItshouldbenotedthatPennDOT’slinearreferencingsystemwasusedtoderivethe“influence”areaintersectionforcrashfrequencymodelingpurposes.Manyrecentsafetyevaluationstudiesdefinedintersection‐relatedcrashesasthosereportedwithin250‐feetofthepointwherethetwointersectingroadwayalignmentscross(e.g.,BauerandHarwood,1996;Harwoodetal.,2003;MitraandWashington,2012;WangandAbdel‐Aty,2006).Thesameinfluenceareaisassumedhereforeachofthestate‐ownedtwo‐laneruralroadintersectionsidentifiedusingtheRMSdata.
StatisticalModelingMethodology
AsnotedintheroadwaysegmentSPFsectionofthisreport,severalcross‐sectionalmodelingapproacheswereconsidered,butnegativebinomialregressionwasusedinanefforttobeconsistentwiththefirsteditionoftheHSM.Inthissectionofthereport,theexpectednumberofintersectioncrashesperyearwasmodeledasafunctionofseveralexplanatoryvariables.SeveralexamplesofintersectionSPFdevelopmentusingnegativebinomialregressioncanbefoundinthepublishedtrafficsafetyliterature(e.g.,
Page 22
15
PochandMannering1996;BauerandHarwood1996;Washingtonetal.2005).Similartothecrashfrequencymodelsforsegments,thismodelingapproachaccountsfortheoverdispersionthatexistsinthecrashdata.Thegeneralfunctionalformofthenegativebinomialregressionmodel,themean‐variancerelationship,andthemaximumlikelihoodfunction,areshowninEquations(12)through(14).Thedifferencebetweentheroadwaysegmentanalysisandtheintersection‐levelanalysisisthemodelspecification,whichisshowninEquation(12)belowforintersections:
)...(min
33210 nn XXormajori eAADTAADTe (12)
where:
i =expectednumberofcrashesatintersectioni; e =exponentialfunction;
=regressioncoefficientforconstant;AADTmajor =averageannualdailytraffic(veh/day)formajorroadway;AADTminor =averageannualdailytraffic(veh/day)forminorroadway;1,2 =regressioncoefficientsformajorandminorroadAADT,
respectively,3,…,n =regressioncoefficientsforexplanatoryvariables,i=3,…,n;and,X3,...,Xn =vectorofgeometricdesignandothersite‐specificdata.
WheninterpretingtheintersectionSPFs,theelasticityandpseudo‐elasticityfortheindependentvariablesinthemodelwerecomputedusingEquations(8)through(11).
DataSummary
Therewere683uniqueintersectionsincludedinthedataanalysisfile.Thedistributionoftheseintersectionsbasedonthetypeoftheintersectionwas:
4‐legsignalized‐105ofthisform 3‐legsignalized‐45ofthisform 4‐legall‐waystop‐control‐33ofthisform 4‐legtwo‐waystop‐control‐86ofthisform 3‐legtwo‐waystop‐control‐414ofthisform
Two‐waystopcontrolwasprovidedontheminorapproach(es)ofthe3‐and4‐legintersections.Becausetherewereeight(8)yearsofcrashdataforeachintersection,theanalysisdatabaseconsistedof5,464uniqueannualintersectionobservations.
Tables5and6providesummarystatisticsforthetotalcrashesandtotalfatalandinjurycrashesrecordedforeachintersectiontype.Asexpected,thetotalcrashfrequencyishigherthanthefatalandinjurycrashfrequency.Thesignalizedintersectionformshavethehighestmeanfrequencyofsevere(fatalandinjury)crashes.
Page 23
16
Table5.SummaryStatisticsforTotalCrashFrequencybyIntersectionType
Intersection Type Number of observations
Mean Standard Deviation
Minimum Maximum
4-leg, signalized 840 3.136 3.213 0 20 3-leg, signalized 360 1.922 2.559 0 15
4-leg, all-way stop 264 1.97 2.538 0 12 4-leg, two-way stop 688 1.637 2.312 0 15
3-leg, two-way stop 3312 1.383 2.023 0 16 ALL 5464 1.748 2.421 0 20
Table6.SummaryStatisticsforFatalandInjuryCrashFrequencybyIntersectionType
Intersection Type Mean Standard Deviation Minimum Maximum
4-leg, signalized 1.677 2.104 0 15
3-leg, signalized 1.203 1.831 0 13
4-leg, all-way stop 1.023 1.594 0 8
4-leg, two-way stop 0.920 1.663 0 11
3-leg, two-way stop 0.766 1.348 0 12
ALL 0.957 1.597 0 15
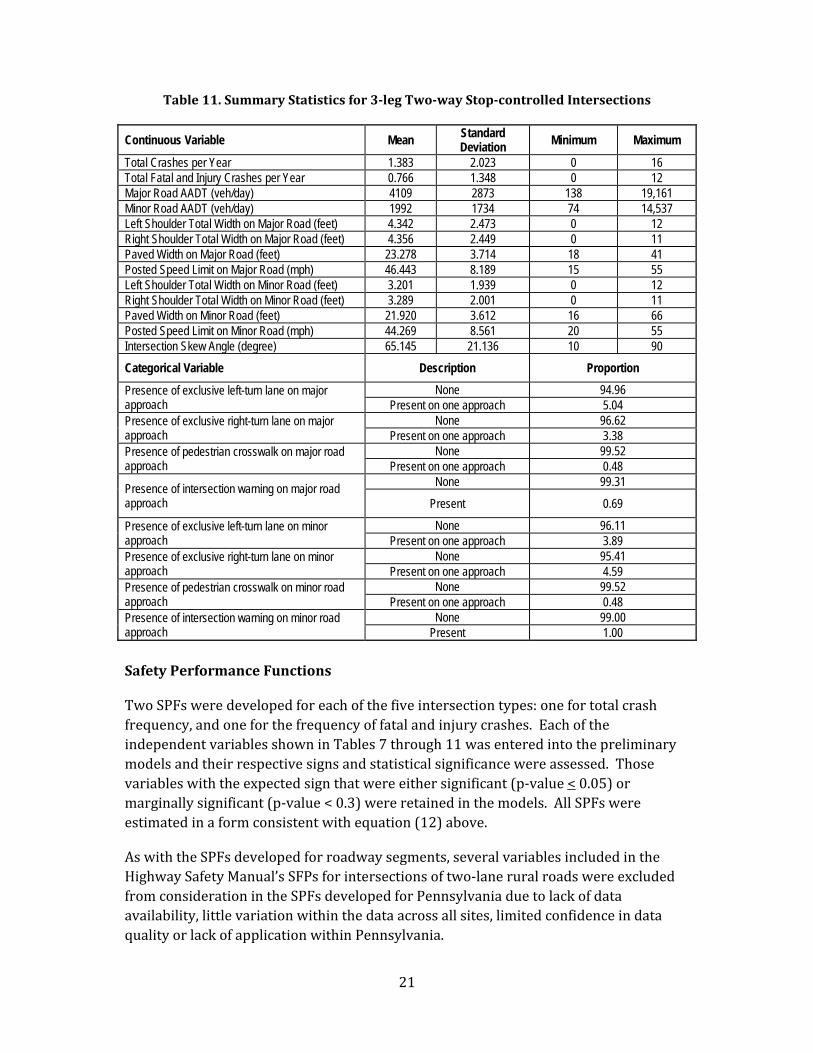
Tables7through11presentsummarystatisticsfortheindependentvariablesconsideredintheSPFdevelopmentbrokendownbythefiveintersectionformsincludedinthisreport.Thesignalizedintersectionsandthe3‐leg,two‐waystop‐controlledintersectionformshavethehighesttrafficvolumes.Thepavedwidthincludesthethroughlanes,turninglanes,andpavedshoulderwidthsoneachofthemajorandminorapproaches;therefore,thesewidthsvarywidelywithineachintersectionform,andwhencomparedacrossthedifferentintersectionforms.Thenumberofturn‐lanesisgenerallyhigheratsignalizedintersectionswhencomparedtostop‐controlledintersections.Thepostedspeedlimitsvaryconsiderablyforallintersectiontypes.
Page 24
17
Table7.SummaryStatisticsfor4‐legSignalizedIntersections
Continuous Variable Mean Standard Deviation
Minimum Maximum
Total Crashes per Year 3.136 3.213 0 20 Total Fatal and Injury Crashes per Year 1.677 2.104 0 15 Major Road AADT (veh/day) 7399 4102 793 23,375 Minor Road AADT (veh/day) 3858 2432 285 13,699 Left Shoulder Total Width on Major Road (feet) 3.682 2.885 0 13 Right Shoulder Total Width on Major Road (feet) 3.637 2.885 0 10 Paved Width on Major Road (feet) 27.988 7.872 20 54 Posted Speed Limit on Major Road (mph) 40.851 9.640 25 55 Left Shoulder Total Width on Minor Road (feet) 3.061 2.407 0 10 Right Shoulder Total Width on Minor Road (feet) 3.087 2.489 0 10 Paved Width on Minor Road (feet) 24.136 5.185 19 54 Posted Speed Limit on Minor Road (mph) 39.244 9.476 25 55 Intersection Skew Angle (degree) 76.714 15.560 15 90
Categorical Variable Description Proportion
Presence of exclusive left-turn lanes on major road approach
None 70.48 Present on one approach 22.86
Present on both approaches 6.67
Presence of exclusive right-turn lanes on major road approach
None 84.76 Present on one approach 14.29
Present on both approaches 0.95
Presence of pedestrian crosswalk on major road approach
None 74.52 Present on one approach 15.00
Present on both approaches 10.48 Presence of intersection warning on major road approach
None 97.86 Present 2.14
Presence of exclusive left-turn lane on minor road approach
None 78.10 Present on one approach 16.19
Present on both approaches 5.71
Presence of exclusive right-turn lane on minor road approach
None 86.67 Present on one approach 10.48
Present on both approaches 2.86
Presence of pedestrian crosswalk on major road approach
None 71.19 Present on one approach 18.33
Present on both approaches 10.48 Presence of intersection warning on major road approach
None 95.48 Present 4.52
Page 25
18
Table8.SummaryStatisticsfor3‐legSignalizedIntersections
Continuous Variable Mean Standard Deviation Minimum Maximum
Total Crashes per Year 1.922 2.558 0 15 Total Fatal and Injury Crash per Year 1.203 1.831 0 13 Major Road AADT (veh/day) 6710 3815 913 17,265 Minor Road AADT (veh/day) 4127 2819 324 12,501 Left Shoulder Total Width on Major Road (feet) 2.769 2.960 0 10 Right Shoulder Total Width on Major Road (feet) 2.858 3.141 0 10 Paved Width on Major Road (feet) 28.928 7.041 20 50 Posted Speed Limit on Major Road (mph) 38.722 11.072 20 55 Left Shoulder Total Width on Minor Road (feet) 2.297 1.992 0 8 Right Shoulder Total Width on Minor Road (feet) 2.386 2.011 0 8 Paved Width on Minor Road (feet) 24.739 5.139 20 42 Posted Speed Limit on Minor Road (mph) 37.833 9.005 25 55 Intersection Skew Angle (degree) 76.000 17.203 20 90
Categorical Variable Description Proportion
Presence of exclusive left-turn lane on major road approach
None 71.67 Present 28.33
Presence of exclusive right-turn lane on major road approach
None 93.61 Present 6.39
Presence of pedestrian crosswalk on major road approach
None 76.11 Present on one approach 19.44
Present on both approaches 4.44
Presence of exclusive left-turn lanes on minor road None 95
Present 5 Presence of exclusive right-turn lanes on minor road
None 93.06 Present 6.94
Presence of pedestrian crosswalk on minor road None 77.22
Present on one approach 18.33 Present on both approaches 4.44
Page 26
19
Table9.SummaryStatisticsfor4‐legAll‐wayStop‐controlledIntersections
Continuous Variable Mean Standard Deviation Minimum Maximum
Total Crashes per Year 1.970 2.538 0 12 Total Fatal and Injury Crash per Year 1.023 1.594 0 8 Major Road AADT (veh/day) 3763 2745 740 11,351 Minor Road AADT (veh/day) 1973 1356 317 5959 Left Shoulder Total Width on Major Road (feet) 4.254 2.473 0 10 Right Shoulder Total Width on Major Road (feet) 4.432 2.544 0 10 Paved Width on Major Road (feet) 22.659 3.268 20 35 Posted Speed Limit on Major Road (mph) 45.436 9.089 25 55 Left Shoulder Total Width on Minor Road (feet) 2.928 1.845 0 8 Right Shoulder Total Width on Minor Road (feet) 2.932 1.865 0 8 Paved Width on Minor Road (feet) 21.098 2.325 18 32 Posted Speed Limit on Minor Road (mph) 42.746 7.107 25 55 Intersection Skew Angle (degrees) 67.727 17.314 10 90
Categorical Variable Description Proportion
Presence of exclusive left-turn lane on major road approach
None 96.97 Present on both approaches 3.03
Presence of exclusive right-turn lane on major road approach
None 90.91 Present on one approach 6.06
Present on both approaches 3.03 Presence of pedestrian crosswalk on major road approach
None 96.97 Present on one approach 3.03
Presence of intersection warning on major road None 96.97
Present 3.03
Presence of exclusive left-turn lane on minor road approach
None 96.97 Present on one approach 3.03
Presence of exclusive right-turn lane on minor road approach
None 96.97 Present on both approaches 3.03
Presence of pedestrian crosswalk on minor road approach
None 96.97 Present on one approach 3.03
Presence of intersection warning on minor road None 90.91
Present 9.09
Page 27
20
Table10.SummaryStatisticsfor4‐legTwo‐wayStop‐controlledIntersections
Continuous Variable Mean Standard Deviation Minimum Maximum
Total Crashes per Year 1.637 2.312 0 15 Total Fatal and Injury Crash per Year 0.920 1.663 0 11 Major Road AADT (veh/day) 3913 2761 312 14,387 Minor Road AADT (veh/day) 1681 1278 172 8923 Left Shoulder Total Width on Major Road (feet) 3.610 2.362 0 14 Right Shoulder Total Width on Major Road (feet) 3.750 2.537 0 14 Paved Width on Major Road (feet) 23.968 6.818 20 66 Posted Speed Limit on Major Road (mph) 43.721 8.706 25 55 Left Shoulder Total Width on Minor Road (feet) 2.797 1.833 0 8 Right Shoulder Total Width on Minor Road (feet) 2.762 1.876 0 8 Paved Width on Minor Road (feet) 21.799 3.252 18 40 Posted Speed Limit on Minor Road (mph) 41.919 8.081 25 55 Skew Angle on Major Route (degree) 72.151 18.559 15 90
Categorical Variable Description Proportion
Presence of exclusive left-turn lane on major approach
None 96.51 Present on one approach 2.33
Present on both approaches 1.16 Presence of pedestrian crosswalk on major road approach
None 96.51 Present on one approach 3.49
Presence of intersection warning on major road approach
None 99.13
Present 0.87
Presence of exclusive left-turn lane on minor approach
None 98.84 Present on both approaches 1.16
Presence of exclusive right-turn lane on minor approach
None 98.84 Present on one approach 1.16
Presence of pedestrian crosswalk on minor road approach
None 93.02 Present on one approach 6.98
Presence of intersection warning on minor road approach
None 98.55 Present 1.45
Page 28
21
Table11.SummaryStatisticsfor3‐legTwo‐wayStop‐controlledIntersections
Continuous Variable Mean Standard Deviation Minimum Maximum
Total Crashes per Year 1.383 2.023 0 16 Total Fatal and Injury Crashes per Year 0.766 1.348 0 12 Major Road AADT (veh/day) 4109 2873 138 19,161 Minor Road AADT (veh/day) 1992 1734 74 14,537 Left Shoulder Total Width on Major Road (feet) 4.342 2.473 0 12 Right Shoulder Total Width on Major Road (feet) 4.356 2.449 0 11 Paved Width on Major Road (feet) 23.278 3.714 18 41 Posted Speed Limit on Major Road (mph) 46.443 8.189 15 55 Left Shoulder Total Width on Minor Road (feet) 3.201 1.939 0 12 Right Shoulder Total Width on Minor Road (feet) 3.289 2.001 0 11 Paved Width on Minor Road (feet) 21.920 3.612 16 66 Posted Speed Limit on Minor Road (mph) 44.269 8.561 20 55 Intersection Skew Angle (degree) 65.145 21.136 10 90
Categorical Variable Description Proportion
Presence of exclusive left-turn lane on major approach
None 94.96 Present on one approach 5.04
Presence of exclusive right-turn lane on major approach
None 96.62 Present on one approach 3.38
Presence of pedestrian crosswalk on major road approach
None 99.52 Present on one approach 0.48
Presence of intersection warning on major road approach
None 99.31
Present 0.69
Presence of exclusive left-turn lane on minor approach
None 96.11 Present on one approach 3.89
Presence of exclusive right-turn lane on minor approach
None 95.41 Present on one approach 4.59
Presence of pedestrian crosswalk on minor road approach
None 99.52 Present on one approach 0.48
Presence of intersection warning on minor road approach
None 99.00 Present 1.00
SafetyPerformanceFunctions
TwoSPFsweredevelopedforeachofthefiveintersectiontypes:onefortotalcrashfrequency,andoneforthefrequencyoffatalandinjurycrashes.EachoftheindependentvariablesshowninTables7through11wasenteredintothepreliminarymodelsandtheirrespectivesignsandstatisticalsignificancewereassessed.Thosevariableswiththeexpectedsignthatwereeithersignificant(p‐value<0.05)ormarginallysignificant(p‐value<0.3)wereretainedinthemodels.AllSPFswereestimatedinaformconsistentwithequation(12)above.
AswiththeSPFsdevelopedforroadwaysegments,severalvariablesincludedintheHighwaySafetyManual’sSFPsforintersectionsoftwo‐laneruralroadswereexcludedfromconsiderationintheSPFsdevelopedforPennsylvaniaduetolackofdataavailability,littlevariationwithinthedataacrossallsites,limitedconfidenceindataqualityorlackofapplicationwithinPennsylvania.
Page 29
22
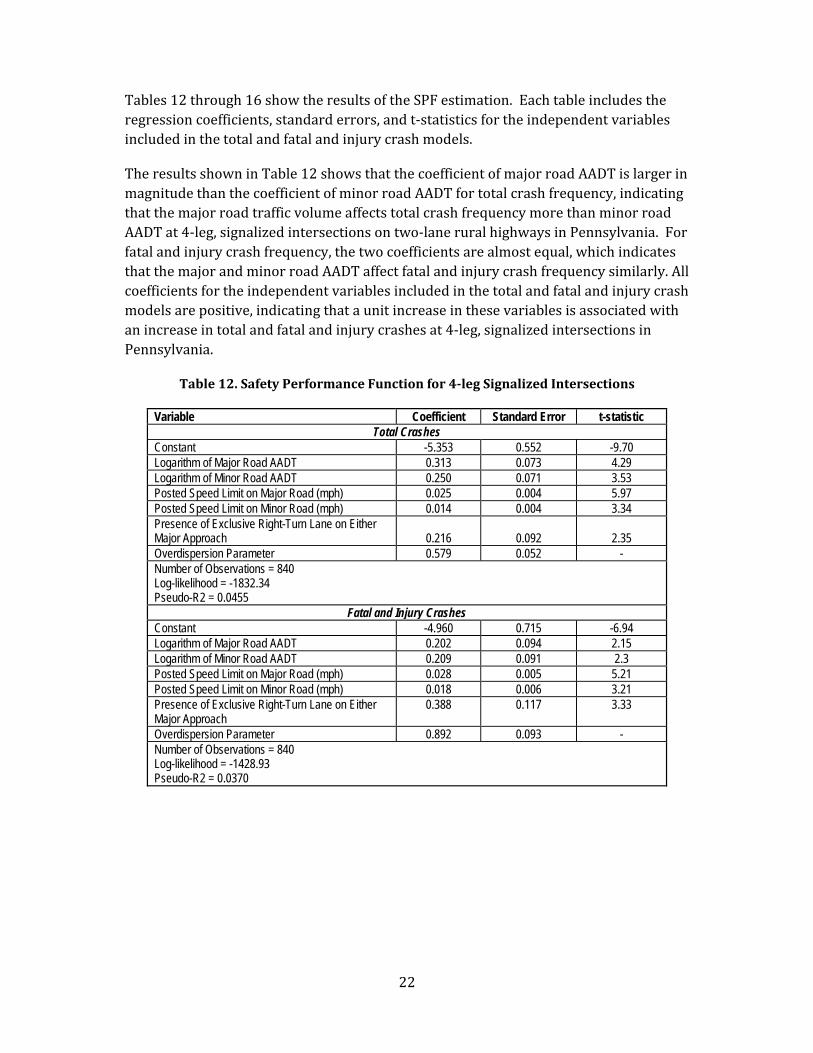
Tables12through16showtheresultsoftheSPFestimation.Eachtableincludestheregressioncoefficients,standarderrors,andt‐statisticsfortheindependentvariablesincludedinthetotalandfatalandinjurycrashmodels.
TheresultsshowninTable12showsthatthecoefficientofmajorroadAADTislargerinmagnitudethanthecoefficientofminorroadAADTfortotalcrashfrequency,indicatingthatthemajorroadtrafficvolumeaffectstotalcrashfrequencymorethanminorroadAADTat4‐leg,signalizedintersectionsontwo‐laneruralhighwaysinPennsylvania.Forfatalandinjurycrashfrequency,thetwocoefficientsarealmostequal,whichindicatesthatthemajorandminorroadAADTaffectfatalandinjurycrashfrequencysimilarly.Allcoefficientsfortheindependentvariablesincludedinthetotalandfatalandinjurycrashmodelsarepositive,indicatingthataunitincreaseinthesevariablesisassociatedwithanincreaseintotalandfatalandinjurycrashesat4‐leg,signalizedintersectionsinPennsylvania.
Table12.SafetyPerformanceFunctionfor4‐legSignalizedIntersections
Variable Coefficient Standard Error t-statistic Total Crashes
Constant -5.353 0.552 -9.70 Logarithm of Major Road AADT 0.313 0.073 4.29 Logarithm of Minor Road AADT 0.250 0.071 3.53 Posted Speed Limit on Major Road (mph) 0.025 0.004 5.97 Posted Speed Limit on Minor Road (mph) 0.014 0.004 3.34 Presence of Exclusive Right-Turn Lane on Either Major Approach 0.216 0.092 2.35 Overdispersion Parameter 0.579 0.052 - Number of Observations = 840 Log-likelihood = -1832.34 Pseudo-R2 = 0.0455
Fatal and Injury Crashes Constant -4.960 0.715 -6.94 Logarithm of Major Road AADT 0.202 0.094 2.15 Logarithm of Minor Road AADT 0.209 0.091 2.3 Posted Speed Limit on Major Road (mph) 0.028 0.005 5.21 Posted Speed Limit on Minor Road (mph) 0.018 0.006 3.21 Presence of Exclusive Right-Turn Lane on Either Major Approach
0.388 0.117 3.33
Overdispersion Parameter 0.892 0.093 - Number of Observations = 840 Log-likelihood = -1428.93 Pseudo-R2 = 0.0370
Page 30
23
TheresultsinTable13showthatthecoefficientofmajorroadAADTislargerinmagnitudethantheminorroadAADT,indicatingthatthemajorroadtrafficvolumeaffectstotalandfatalandinjurycrashfrequencymorethanminorroadAADTat3‐leg,signalizedintersectionsontwo‐laneruralhighwaysinPennsylvania.ThisfindingisconsistentwiththefindingsoftheHSM(AASHTO,2010).ThepositivecoefficientsforAADTandthepostedspeedlimitinbothmodelssuggestthatanincreaseineachofthesevariablesisassociatedwithanincreaseincrashfrequencyat3‐leg,signalizedintersectionsinPennsylvania.Thecoefficientsforthepresenceofcrosswalksonthemajorandminorroadapproachesarenegativeinbothmodels,whichsuggestthatthepresenceofacrosswalkisassociatedwithadecreaseincrashfrequencyat3‐leg,signalizedintersectionsinPennsylvania.
Table13.SafetyPerformanceFunctionfor3‐legSignalizedIntersections
Variable Coefficient Standard Error t-statistic Total Crashes
Constant -6.813 1.050 -6.49 Logarithm of Major Road AADT 0.451 0.185 2.44 Logarithm of Minor Road AADT 0.349 0.158 2.21 Posted Speed Limit on Major Road (mph) 0.020 0.006 3.08 Presence of a Crosswalk on Major Road Approach -0.433 0.188 -2.31 Presence of a Crosswalk on Minor Road Approach -0.345 0.200 -1.73 Overdispersion Parameter 0.982 0.149 - Number of Observations = 360 Log-likelihood = -637.61 Pseudo-R2 = 0.0490
Fatal and Injury Crashes Constant -6.981 1.182 -5.90 Logarithm of Major Road AADT 0.452 0.208 2.17 Logarithm of Minor Road AADT 0.287 0.180 1.59 Posted Speed Limit on Major Road (mph) 0.026 0.007 3.47 Presence of a Crosswalk on Major Road Approach -0.605 0.218 -2.77 Presence of a Crosswalk on Minor Road Approach -0.413 0.235 -1.76 Overdispersion Parameter 1.114 0.205 - Number of Observations = 360 Log-likelihood = -511.26 Pseudo-R2 = 0.0518
Page 31
24
TheresultsinTable14showthatthecoefficientofmajorroadAADTislargerinmagnitudethantheminorroadAADT,indicatingthatthemajorroadtrafficvolumeaffectstotalandfatalandinjurycrashfrequencymorethanminorroadAADTat4‐leg,all‐waystop‐controlledintersectionsontwo‐laneruralhighwaysinPennsylvania.ThisfindingisconsistentwiththefindingsoftheHSM(AASHTO,2010).TheAADTandpostedspeedlimitvariableshaveapositivesignsuggestingthat4‐legall‐waystop‐controlledintersectionsontwo‐wayruralhighwaysinPennsylvaniawithhighertrafficvolumesandhigherpostedspeedlimitsonthemajorapproachareassociatedwithhighertotalandfatalandinjurycrashfrequencies.
Table14.SafetyPerformanceFunctionfor4‐legAll‐wayStop‐controlledIntersections
Variable Coefficient Standard Error t-statistic Total Crashes
Constant -5.820 1.221 -4.77 Logarithm of Major Road AADT 0.693 0.146 4.75 Logarithm of Minor Road AADT 0.087 0.169 0.52 Posted Speed Limit on Major Road (mph) 0.057 0.015 3.65 Overdispersion Parameter 1.24 0.200 - Number of Observations = 264 Log-likelihood = -473.45 Pseudo-R2 = 0.0425
Fatal and Injury Crashes Constant -6.515 1.439 -4.53 Logarithm of Major Road AADT 0.630 0.183 3.44 Logarithm of Minor Road AADT 0.166 0.199 0.84 Posted Speed Limit on Major Road (mph) 0.046 0.0178 2.58 Overdispersion Parameter 1.547 0.311 - Number of Observations = 264 Log-likelihood = -350.03 Pseudo-R2 = 0.0372
Page 32
25
TheresultsshowninTable15showsthatthecoefficientofmajorroadAADTislargerinmagnitudethantheminorroadAADT,indicatingthatthemajorroadtrafficvolumeaffectstotalandfatalandinjurycrashfrequencymorethanminorroadAADTat4‐leg,two‐waystop‐controlledintersectionsontwo‐laneruralhighwaysinPennsylvania.ThisfindingisconsistentwiththefindingsoftheHSM(AASHTO,2010).Thepositivecoefficientforskewanglesuggeststhat4‐leg,two‐waystop‐controlledintersectionsontwo‐laneruralhighwaysinPennsylvaniawithlargerskewanglesareassociatedwithhighertotalandfatalandinjurycrashfrequencies.Thisparticulartrendissurprising,asonewouldintuitivelysuspectthatintersectionswithsmallerskewangleswouldpresentmorechallengestodriversjudgingopposingtrafficontheuncontrolledmajorroad.However,themajorityofintersectionshadlargeskewangles(i.e.,near90‐degreeangles)anddriversmightbehavemorecautiouslywhenapproachingintersectionswithlowerskewangles.
Table15.SafetyPerformanceFunctionfor4‐legTwo‐wayStop‐controlledIntersections
Variable Coefficient Standard Error t-statistic Total Crashes
Constant -6.359 0.774 -8.22 Logarithm of Major Road AADT 0.528 0.090 5.84 Logarithm of Minor Road AADT 0.275 0.078 3.51 Intersection Skew Angle (degree) 0.007 0.003 2.34 Overdispersion Parameter 1.348 0.138 - Number of Observations = 688 Log-likelihood = -1150.67 Pseudo R2 = 0.0322
Fatal and Injury Crashes Constant -6.156 1.027 -6.00 Logarithm of Major Road AADT 0.512 0.123 4.16 Logarithm of Minor Road AADT 0.176 0.104 1.70 Intersection Skew Angle (degree) 0.008 0.004 1.98 Overdispersion Parameter 2.597 0.301 - Number of Observations = 688 Log-likelihood = -854.78 Pseudo R2 = 0.0199
Page 33
26
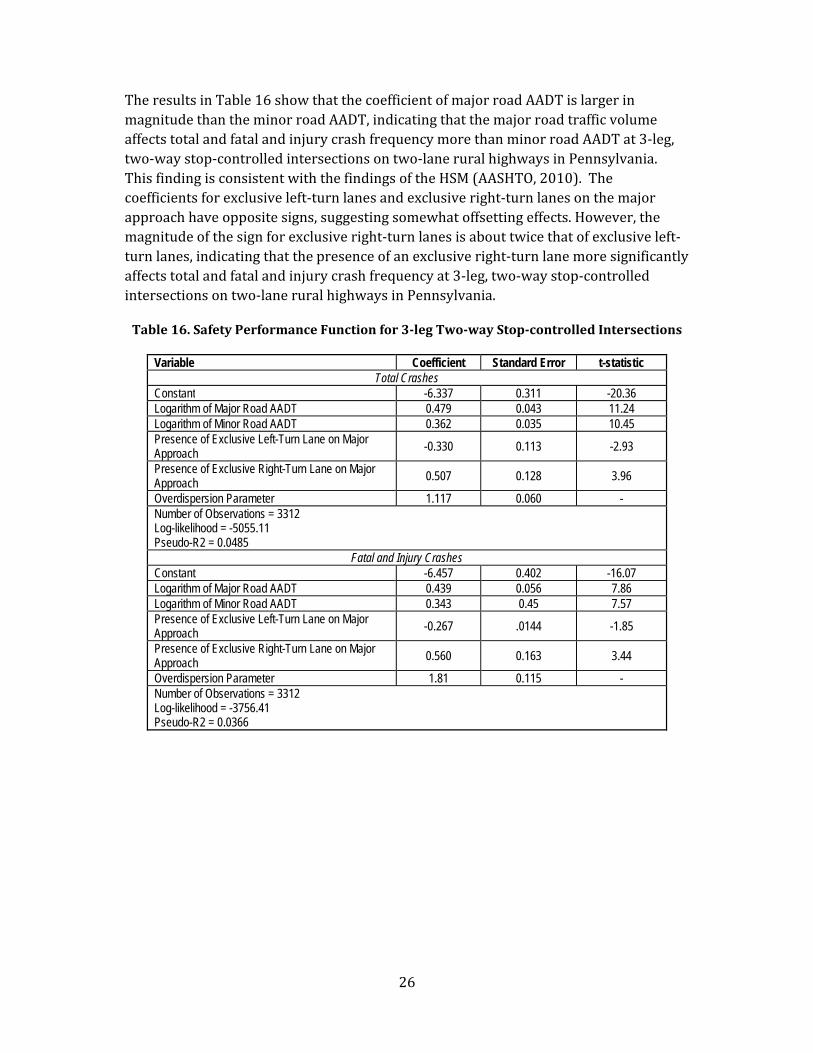
TheresultsinTable16showthatthecoefficientofmajorroadAADTislargerinmagnitudethantheminorroadAADT,indicatingthatthemajorroadtrafficvolumeaffectstotalandfatalandinjurycrashfrequencymorethanminorroadAADTat3‐leg,two‐waystop‐controlledintersectionsontwo‐laneruralhighwaysinPennsylvania.ThisfindingisconsistentwiththefindingsoftheHSM(AASHTO,2010).Thecoefficientsforexclusiveleft‐turnlanesandexclusiveright‐turnlanesonthemajorapproachhaveoppositesigns,suggestingsomewhatoffsettingeffects.However,themagnitudeofthesignforexclusiveright‐turnlanesisabouttwicethatofexclusiveleft‐turnlanes,indicatingthatthepresenceofanexclusiveright‐turnlanemoresignificantlyaffectstotalandfatalandinjurycrashfrequencyat3‐leg,two‐waystop‐controlledintersectionsontwo‐laneruralhighwaysinPennsylvania.
Table16.SafetyPerformanceFunctionfor3‐legTwo‐wayStop‐controlledIntersections
Variable Coefficient Standard Error t-statistic Total Crashes
Constant -6.337 0.311 -20.36 Logarithm of Major Road AADT 0.479 0.043 11.24 Logarithm of Minor Road AADT 0.362 0.035 10.45 Presence of Exclusive Left-Turn Lane on Major Approach -0.330 0.113 -2.93
Presence of Exclusive Right-Turn Lane on Major Approach
0.507 0.128 3.96
Overdispersion Parameter 1.117 0.060 - Number of Observations = 3312 Log-likelihood = -5055.11 Pseudo-R2 = 0.0485
Fatal and Injury Crashes Constant -6.457 0.402 -16.07 Logarithm of Major Road AADT 0.439 0.056 7.86 Logarithm of Minor Road AADT 0.343 0.45 7.57 Presence of Exclusive Left-Turn Lane on Major Approach -0.267 .0144 -1.85
Presence of Exclusive Right-Turn Lane on Major Approach 0.560 0.163 3.44
Overdispersion Parameter 1.81 0.115 - Number of Observations = 3312 Log-likelihood = -3756.41 Pseudo-R2 = 0.0366
Page 34
27
Tables17to21showtheelasticitiesandpseudo‐elasticitiesfortheindependentvariablesinTables12to16.NotethattheelasticitiesforanycontinuousvariablesotherthanAADTs(e.g.,postedspeedlimitsorskewangles)areallprovidedattheiraveragevaluesasprovidedinTable7andTable11.TheelasticitiesfortheAADTvariablesallholdfortheentirerangeofAADTsobserved.
Table17.ElasticitiesforIndependentVariablesinTotalandFatalandInjuryCrashModelsfor4‐legSignalizedIntersections
Variable Total Crashes Fatal and Injury Crashes
Logarithm of Major Road AADT 0.313 0.202 Logarithm of Minor Road AADT 0.250 0.209 Posted Speed Limit on Major Road (mph) 1.02 1.14 Posted Speed Limit on Minor Road (mph) 0.549 0.706 Presence of Exclusive Right-Turn Lane on Either Major Approach 24.1 47.4
TheelasticitiessuggestthataonepercentincreaseinmajorroadAADTisassociatedwitha0.313percentincreaseintotalcrashfrequencyanda0.202percentincreaseinfatalandinjurycrashfrequencyat4‐legsignalizedintersectionsontwo‐laneruralroadsinPennsylvania.MinorroadAADThasalesspronouncedeffect,asaonepercentincreaseisonlyassociatedwitha0.250percentincreaseintotalcrashfrequencyand0.209increaseinfatalandinjurycrashfrequency.Aonepercentincreaseinthepostedspeedlimitonthemajorroadhasalargerimpactontotalandfatalandinjurycrashfrequency(1.02and1.14percent,respectively)thanaonepercentincreaseinthepostedspeedlimitontheminorroad(0.549percentand0.706percent,respectively)whenbothareheldconstantattheirmeanvalues.Thepresenceofanexclusiveleft‐turnlaneoneithermajorroadapproachisassociatedwithanincreaseintotalcrashfrequencyof24.1percentandtotalandinjurycrashfrequencyof47.4percent.Notethatallotherelasticitytablescanbeinterpretedsimilarly.
Table18.ElasticitiesforIndependentVariablesinTotalandFatalandInjuryCrashModelsfor3‐legSignalizedIntersections
Variable Total Crashes Fatal and
Injury Crashes Logarithm of Major Road AADT 0.451 0.452 Logarithm of Minor Road AADT 0.349 0.287 Posted Speed Limit on Major Road (mph) 0.774 1.01 Presence of a Crosswalk on Major Road Approach -35.1 -45.4 Presence of a Crosswalk on Minor Road Approach -29.2 -33.8
Page 35
28
Table19.ElasticitiesforIndependentVariablesinTotalandFatalandInjuryCrashModelsfor4‐legAll‐wayStop‐controlledIntersections
Variable Total Crashes Fatal and Injury Crashes
Logarithm of Major Road AADT 0.693 0.630 Logarithm of Minor Road AADT 0.087 0.166 Posted Speed Limit on Major Road (mph) 2.59 2.09
Table20.ElasticitiesforIndependentVariablesinTotalandFatalandInjuryCrashModelsfor4‐legTwo‐wayStop‐controlledIntersections
Variable Total Crashes Fatal and Injury Crashes
Logarithm of Major Road AADT 0.528 0.512 Logarithm of Minor Road AADT 0.275 0.176 Skew Angle on Major Route (degree) 0.505 0.577
Table21.ElasticitiesforIndependentVariablesinTotalandFatalandInjuryCrashModelsfor3‐legTwo‐wayStop‐controlledIntersections
Variable Total Crashes Fatal and Injury Crashes
Logarithm of Major Road AADT 0.479 0.439 Logarithm of Minor Road AADT 0.362 0.343 Presence of Exclusive Left-Turn Lane on Major Approach -28.1 -23.4 Presence of Exclusive Right-Turn Lane on Major Approach 66.0 75.1
Summary
Thissectionestimatedstatisticalmodelsoftotalandfatalandinjurycrashfrequencyforfiveintersectiontypesontwo‐laneruralhighwaysinPennsylvania.ThemajorroadAADTcoefficientwaslargerthantheminorroadAADTinmostmodels,whichisconsistentwiththeHighwaySafetyManualSPFs.Theotherindependentvariablesincludedinthemodelsaregenerallyconsistentwithengineeringintuition.TheelasticitiesinTables17through21showthatthetotalandfatalandinjurycrashfrequencyincreasesasthepostedspeedlimitonthemajororminorroadincreases.ThesefindingsareconsistentwithseveralmodelsreportedbyWashingtonetal.,(2005).
Thepresenceofanexclusiveleft‐turnlaneonthemajorroadapproachwasconsistentlyfoundtobeassociatedwithlowerexpectedcrashfrequencies,whilethepresenceofaright‐turnlaneonthemajorroadapproachwasfoundtobeassociatedwithanincreaseinexpectedcrashfrequency,whenincludedintheSPFs.Theleft‐turnlanefindingisconsistentwiththeHighwaySafetyManualcrashmodificationfactorforexclusiveleft‐turnlanes;however,theright‐turnlanefindingisoppositeofthecrashmodificationfactorreportedintheHighwaySafetyManual.ItshouldbenotedthatWashingtonetal.,(2005)foundthesignoftheexclusiveright‐turnlaneindicatorvariabletobe
Page 36
29
inconsistentacrossvariousintersectionSPFs.Futureconsiderationofthepositiverelationshipbetweenright‐turnpresenceonmajorroadapproachesandcrashfrequencyisrecommended.
ThepresenceofpedestriancrosswalksonthemajorandminorroadapproacheswasassociatedwithfewerexpectedcrasheswhenincludedintheSPFmodelspecification.Thisfindingisconsistentwithengineeringintuitionandsuggeststhatdrivertravelmorecautiouslywhenpedestriancrossingsarepresentatanintersectioninruralareas.
CASESTUDIES
TworealisticcasestudiesweredevelopedtodemonstratetheapplicationoftheSPFsforsegmentsandintersectionsthatweredevelopedintheprevioustwosections,respectively.ThesecasestudiesallfollowtheformatoftheexamplecasestudiesintheHSMforconsistencywiththatguide.ThereaderisencouragedtorefertotheHSMformorespecificdetailsoneachoftheindividualsteps.
Casestudy1–Estimatingcrashfrequenciesforanexistingroadwaysegment
Thesite/facility
ThesectionofSR322showninFigure1below.
Thequestion
Whatisthepredictedaveragecrashfrequencyoftheroadwaysegmentfortheyear2013whenconsideringthepreviouscrashhistory?
Figure1.SectionofSR322considered.
Thefacts
Thesectionofroadwaycoversalengthofapproximately4.2milesandcontainsbothcurveandtangentsections.Adetaileddescriptionofthegeometricandothercharacteristicsofthisroadwaysectionrelevanttothesafetyperformancepredictionis
Page 37
30
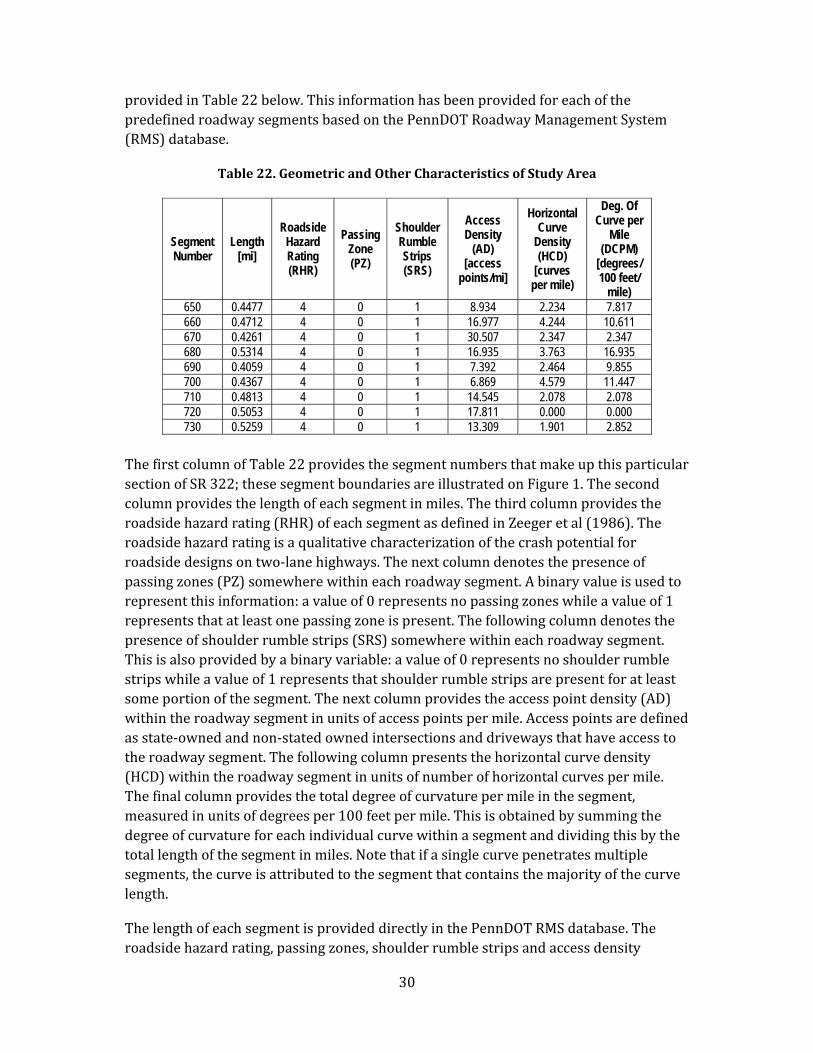
providedinTable22below.ThisinformationhasbeenprovidedforeachofthepredefinedroadwaysegmentsbasedonthePennDOTRoadwayManagementSystem(RMS)database.
Table22.GeometricandOtherCharacteristicsofStudyArea
Segment Number
Length [mi]
Roadside Hazard Rating (RHR)
Passing Zone (PZ)
Shoulder Rumble Strips (SRS)
Access Density
(AD) [access
points/mi]
Horizontal Curve
Density (HCD)
[curves per mile)
Deg. Of Curve per
Mile (DCPM)
[degrees/ 100 feet/
mile) 650 0.4477 4 0 1 8.934 2.234 7.817 660 0.4712 4 0 1 16.977 4.244 10.611 670 0.4261 4 0 1 30.507 2.347 2.347 680 0.5314 4 0 1 16.935 3.763 16.935 690 0.4059 4 0 1 7.392 2.464 9.855 700 0.4367 4 0 1 6.869 4.579 11.447 710 0.4813 4 0 1 14.545 2.078 2.078 720 0.5053 4 0 1 17.811 0.000 0.000 730 0.5259 4 0 1 13.309 1.901 2.852
ThefirstcolumnofTable22providesthesegmentnumbersthatmakeupthisparticularsectionofSR322;thesesegmentboundariesareillustratedonFigure1.Thesecondcolumnprovidesthelengthofeachsegmentinmiles.Thethirdcolumnprovidestheroadsidehazardrating(RHR)ofeachsegmentasdefinedinZeegeretal(1986).Theroadsidehazardratingisaqualitativecharacterizationofthecrashpotentialforroadsidedesignsontwo‐lanehighways.Thenextcolumndenotesthepresenceofpassingzones(PZ)somewherewithineachroadwaysegment.Abinaryvalueisusedtorepresentthisinformation:avalueof0representsnopassingzoneswhileavalueof1representsthatatleastonepassingzoneispresent.Thefollowingcolumndenotesthepresenceofshoulderrumblestrips(SRS)somewherewithineachroadwaysegment.Thisisalsoprovidedbyabinaryvariable:avalueof0representsnoshoulderrumblestripswhileavalueof1representsthatshoulderrumblestripsarepresentforatleastsomeportionofthesegment.Thenextcolumnprovidestheaccesspointdensity(AD)withintheroadwaysegmentinunitsofaccesspointspermile.Accesspointsaredefinedasstate‐ownedandnon‐statedownedintersectionsanddrivewaysthathaveaccesstotheroadwaysegment.Thefollowingcolumnpresentsthehorizontalcurvedensity(HCD)withintheroadwaysegmentinunitsofnumberofhorizontalcurvespermile.Thefinalcolumnprovidesthetotaldegreeofcurvaturepermileinthesegment,measuredinunitsofdegreesper100feetpermile.Thisisobtainedbysummingthedegreeofcurvatureforeachindividualcurvewithinasegmentanddividingthisbythetotallengthofthesegmentinmiles.Notethatifasinglecurvepenetratesmultiplesegments,thecurveisattributedtothesegmentthatcontainsthemajorityofthecurvelength.
ThelengthofeachsegmentisprovideddirectlyinthePennDOTRMSdatabase.Theroadsidehazardrating,passingzones,shoulderrumblestripsandaccessdensity
Page 38
31
variableswerecollectedusingthePennDOTonlinevideophotologsystemaspreviouslydescribedinthisreport.Thisinformationhasbeencollectedforallstate‐owned,two‐laneruralroadswithinPennsylvaniaandthedatahasbeenprovidedtoPennDOTforuseinsafetyapplications.Thecurveinformation(horizontalcurvedensityanddegreeofcurvaturepermile)wascollectedusingsatelliteimagerythroughtheGoogleEarthtool,aspreviousdescribed.Thisinformationhasbeencollectedforthree‐digitandlowerstateowned,two‐laneruralroadswithinPennsylvaniaandthedatahasbeenprovidedtoPennDOTforuseinsafetyapplications.
Table23alsoprovidesestimatesofhistoricaltrafficvolumedataforeachofthesegmentsidentifiedinTable22.ThisdataismaintainedinandavailablefromPennDOTsRMSdatabase.
Table23.TrafficVolumesForRoadSegmentsinStudyArea
Segment Average Annual Daily Traffic (AADT) [veh/day]
2005 2006 2007 2008 2009 2010 2011 2012 2013 650 11533 11648 11550 11550 11550 11550 11550 11550 11171 660 11533 11648 11550 11550 11550 11550 11550 11550 11171 670 11533 11648 11550 11550 11550 11550 11550 11550 11171 680 11533 11648 11550 11550 11550 11550 11550 11550 11171 690 11533 11648 11550 11550 11550 11550 11550 11550 11171 700 11533 11648 11550 11550 11550 11550 11550 11550 11171 710 11533 11648 11550 11550 11550 11550 11550 11550 11171 720 11533 11648 11550 11550 11550 11550 11550 11550 11171 730 11533 11648 11550 11550 11550 11550 11550 11550 11171
HistoricalcrashfrequenciesfortotalcrashesandfatalandinjurycrashesareprovidedinTable24andTable25respectively.ThiscrashdatawasobtainedfromthePennDOTelectroniccrashhistorydatabase.
Table24.TotalCrashFrequenciesforStudyArea
Segment 2005 2006 2007 2008 2009 2010 2011 2012 Mean 650 1 2 1 1 0 2 2 0 1.125 660 4 0 2 2 2 2 1 4 2.125 670 0 1 1 2 1 1 2 1 1.125 680 2 0 3 5 1 2 7 4 3 690 0 0 0 2 0 1 0 0 0.375 700 1 0 0 1 1 1 0 2 0.75 710 4 1 2 1 1 0 6 0 1.875 720 0 1 1 3 3 1 0 2 1.375 730 0 0 0 5 0 0 4 2 1.375
Total 12 5 10 22 9 10 22 15 13.125
Page 39
32
Table25.FatalandInjuryCrashFrequenciesforStudyArea
Segment 2005 2006 2007 2008 2009 2010 2011 2012 Mean 650 1 2 2 1 0 0 1 0 0.875 660 1 0 0 2 0 1 0 0 0.5 670 0 0 1 2 0 1 1 1 0.75 680 1 0 1 2 0 1 2 4 1.375 690 0 0 0 1 0 0 0 0 0.125 700 1 0 0 0 0 0 0 0 0.125 710 1 0 2 0 0 0 0 0 0.375 720 0 0 1 2 1 1 0 0 0.625 730 0 0 0 3 0 0 1 1 0.625
Total 5 2 7 13 1 4 5 6 5.375 Assumptions
None
Results
UsingthepredictivemethodoutlinedbelowandapplyingtheEmpiricalBayescorrection,thepredictedfrequencyoftotalcrashesforthisroadwaysectionis13.1crashesperyearandthepredictedfrequencyoffatalandinjurycrashesis5.5crashesperyear.
Steps
Step1–DefinethespatiallimitsofthestudyThelimitofthisstudyisprovideddirectlybytheproblemstatementandincludesonlythesectionofSR322illustratedinFigure1.Thissectioncontainsroadwaysegments650through730.
Step2–DefinetheperiodofinterestInthisproblemtheanalysisperiodofinterestis2013.However,aswillbeshownbelow,historicalcrashandtrafficvolumedatawillberequired,andestimatesofcrashfrequencyestimated,foraperiodofseveralyearsbeforetheanalysisyeartoapplytheEmpiricalBayesadjustment.AsshownintheFactssection,forthissegmentthedatarequiredfortheseestimationsareavailablefortheyears2005to2012.
Step3–DeterminetheavailabilityoftrafficvolumeandhistoricalcrashdataAspertheFactssection,theseinformationareavailablefromthePennDOTRMSdatabase.
Step4–DeterminegeometricdesignandothersitecharacteristicsAspertheFactssection,theseinformationareavailablefromthePennDOTRMSdatabaseandthesupplementaldatacollectedandprovidedbyPennStatetoPennDOT.
Page 40
33
Step5–DividetheroadwaynetworkintoindividualsegmentsAspertheFactssection,thePennDOTRMSdatabasedisaggregatesindividualroadwaysintomultiplesegmentsasawaytodescribegeometricandtrafficdata.Sincetherequiredinformation,suchasaccessdensityandcurvecharacteristics,hasalreadybeencollectedonthesegmentlevel,wewillusethesesegmentstoperformthesafetyanalysis.
Step6–AssigncrashestoindividualroadwaysegmentsThePennDOTcrashdatabaseprovidesthelocationofeachcrashintermsofthesegmentinwhichitoccurred.ThisinformationhasbeenprovidedintheFactssection.
Step7–SelectanindividualsiteinthestudynetworkWeselectthefirstsegmentintheroadwaysection(segment650)toillustratetheapplicationofthesafetyperformancefunctions(SPFs).
Step8–SelectanindividualanalysisyearintheperiodofinterestWeselecttheyear2013toillustratetheapplicationofthesafetyperformancefunctions(SPFs).
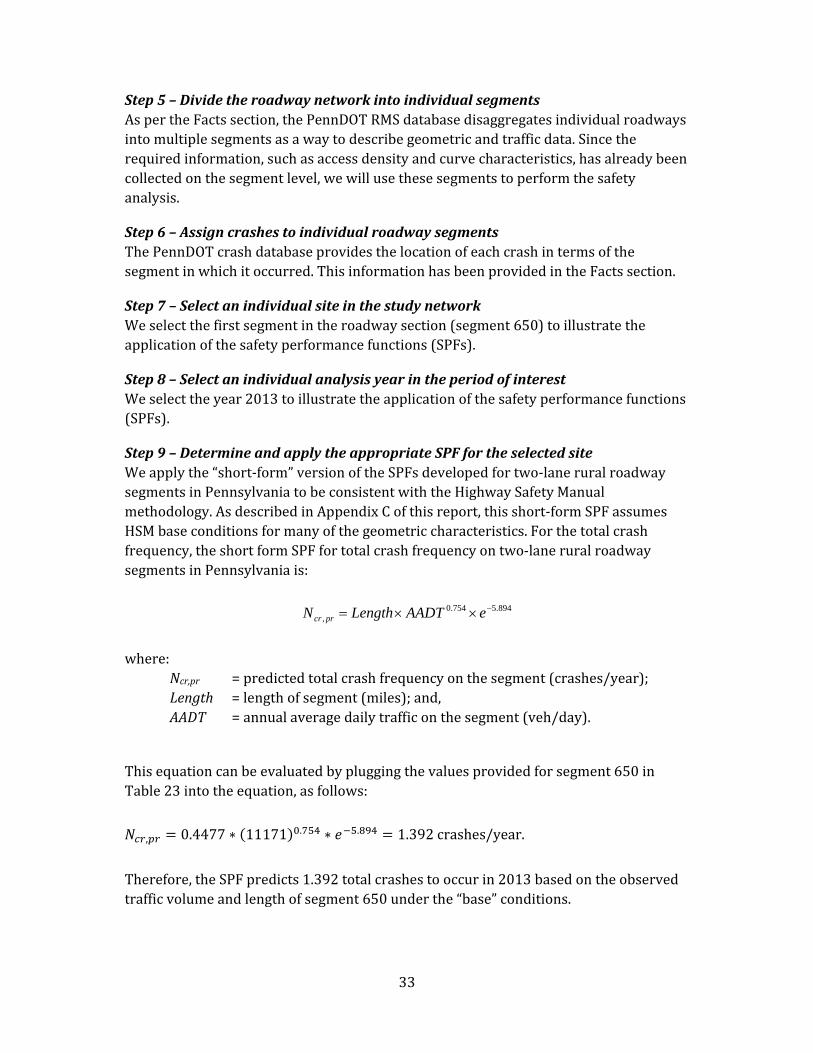
Step9–DetermineandapplytheappropriateSPFfortheselectedsiteWeapplythe“short‐form”versionoftheSPFsdevelopedfortwo‐laneruralroadwaysegmentsinPennsylvaniatobeconsistentwiththeHighwaySafetyManualmethodology.AsdescribedinAppendixCofthisreport,thisshort‐formSPFassumesHSMbaseconditionsformanyofthegeometriccharacteristics.Forthetotalcrashfrequency,theshortformSPFfortotalcrashfrequencyontwo‐laneruralroadwaysegmentsinPennsylvaniais:
894.5754.0,
eAADTLengthN prcr
where:Ncr,pr =predictedtotalcrashfrequencyonthesegment(crashes/year);Length =lengthofsegment(miles);and,AADT =annualaveragedailytrafficonthesegment(veh/day).
Thisequationcanbeevaluatedbypluggingthevaluesprovidedforsegment650inTable23intotheequation,asfollows:
, 0.4477 ∗ 11171 . ∗ . 1.392crashes/year.
Therefore,theSPFpredicts1.392totalcrashestooccurin2013basedontheobservedtrafficvolumeandlengthofsegment650underthe“base”conditions.
Page 41
34
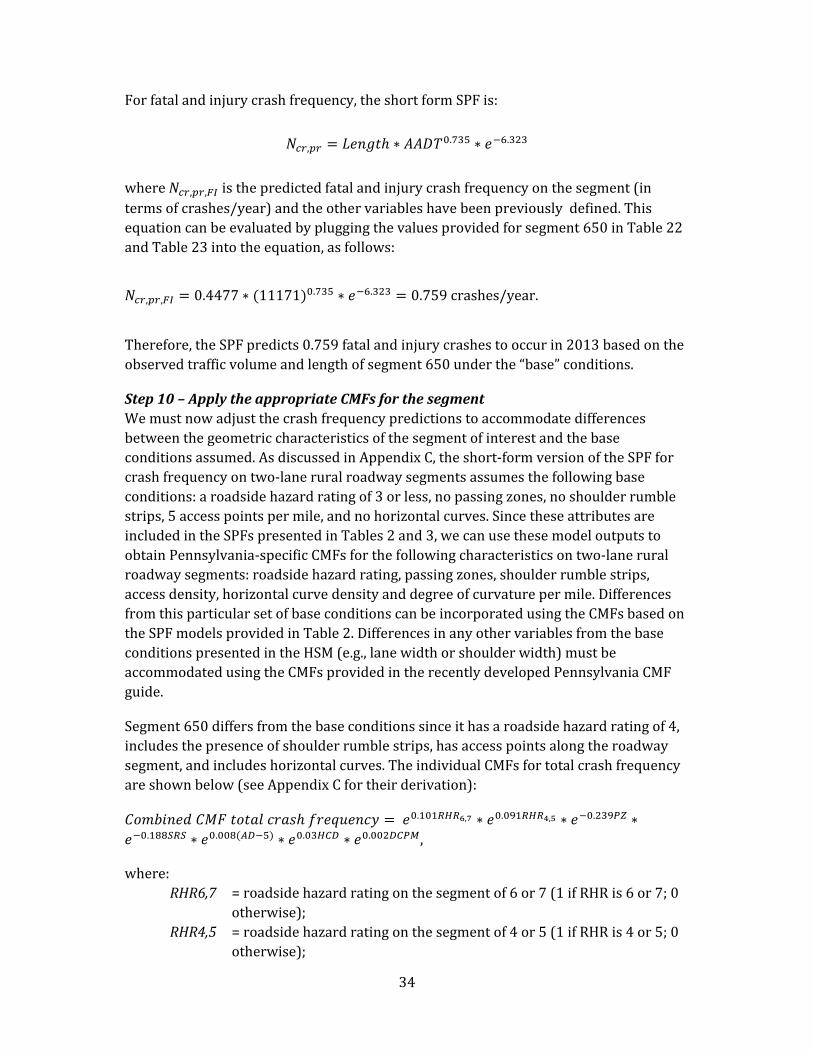
Forfatalandinjurycrashfrequency,theshortformSPFis:
, ∗ . ∗ .
where , , isthepredictedfatalandinjurycrashfrequencyonthesegment(intermsofcrashes/year)andtheothervariableshavebeenpreviouslydefined.Thisequationcanbeevaluatedbypluggingthevaluesprovidedforsegment650inTable22andTable23intotheequation,asfollows:
, , 0.4477 ∗ 11171 . ∗ . 0.759crashes/year.
Therefore,theSPFpredicts0.759fatalandinjurycrashestooccurin2013basedontheobservedtrafficvolumeandlengthofsegment650underthe“base”conditions.
Step10–ApplytheappropriateCMFsforthesegmentWemustnowadjustthecrashfrequencypredictionstoaccommodatedifferencesbetweenthegeometriccharacteristicsofthesegmentofinterestandthebaseconditionsassumed.AsdiscussedinAppendixC,theshort‐formversionoftheSPFforcrashfrequencyontwo‐laneruralroadwaysegmentsassumesthefollowingbaseconditions:aroadsidehazardratingof3orless,nopassingzones,noshoulderrumblestrips,5accesspointspermile,andnohorizontalcurves.SincetheseattributesareincludedintheSPFspresentedinTables2and3,wecanusethesemodeloutputstoobtainPennsylvania‐specificCMFsforthefollowingcharacteristicsontwo‐laneruralroadwaysegments:roadsidehazardrating,passingzones,shoulderrumblestrips,accessdensity,horizontalcurvedensityanddegreeofcurvaturepermile.DifferencesfromthisparticularsetofbaseconditionscanbeincorporatedusingtheCMFsbasedontheSPFmodelsprovidedinTable2.DifferencesinanyothervariablesfromthebaseconditionspresentedintheHSM(e.g.,lanewidthorshoulderwidth)mustbeaccommodatedusingtheCMFsprovidedintherecentlydevelopedPennsylvaniaCMFguide.
Segment650differsfromthebaseconditionssinceithasaroadsidehazardratingof4,includesthepresenceofshoulderrumblestrips,hasaccesspointsalongtheroadwaysegment,andincludeshorizontalcurves.TheindividualCMFsfortotalcrashfrequencyareshownbelow(seeAppendixCfortheirderivation):
. , ∗ . , ∗ . ∗. ∗ . ∗ . ∗ . ,
where:RHR6,7 =roadsidehazardratingonthesegmentof6or7(1ifRHRis6or7;0
otherwise);RHR4,5 =roadsidehazardratingonthesegmentof4or5(1ifRHRis4or5;0
otherwise);
Page 42
35
PZ =presenceofapassingzoneinthesegment(1ifpresent;0otherwise);SRS =presenceofshoulderrumblestripsinthesegment(1Ifpresent;0
otherwise);AD =accessdensityinthesegment,totaldrivewaysandintersectionsper
mileofsegmentlength(AccessPoints/Mile);HCD =horizontalcurvedensityinthesegment,numberofcurvesinthe
segmentpermile(Hor.Curves/Mile);and,DCPM =totaldegreeofcurvaturepermileinthesegment,thesumofdegree
ofcurvatureforallcurvesinthesegmentdividedbysegmentlengthinmiles(Degrees/100ft/Mile).
Applyingthesite‐specificconditionsforsegment650providedinTable22,wefindthat:
. ∗ . ∗ . ∗ . ∗. . ∗ . . ∗ . . 1.017.
Thepredictedtotalcrashfrequencyforsegment650in2013issimplytheproductofthepredictedvalueusingtheshort‐formSPFandthecombinedCMFthatprovidestheadjustmentfromthebaseconditions:1.392 ∗ 1.017 1.416crashes/year.
Similarly,theCMFsfortotalandinjurycrashfrequencyare:
. , ∗ . , ∗. ∗ . ∗ . ∗ . ∗ . .
Applyingthesite‐specificconditionsforsegment650providedinTable22,wefindthat:
. ∗ . ∗ . ∗. ∗ . . ∗ . . ∗ . . 0.987.
Thepredictedfatalandinjurycrashfrequencyforsegment650in2013issimplytheproductofthepredictedvaluefromtheshort‐formSPFandthecombinedCMFthatprovidestheadjustmentfromthebaseconditions:0.759 ∗ 0.987 0.749crashes/year.
Step11–MultiplytheresultbytheappropriatecalibrationfactorSinceweareapplyingSPFscreatedspecificallyfortwo‐laneruralroadsinPennsylvania,whichweredevelopedusinghistoricalcrashdatafromPennsylvania,nocalibrationfactorisrequiredtomodifythepredictionsoftheSPFs.
Step12–RepeatSteps8to11fortheremaininganalysisyearsSincecrashfrequencypredictionsareeventuallyneededforyears2005to2013,thesestepswererepeatedforthoseanalysisyears.TheresultsaresummarizedinTable26below.
Page 43
36
Table26.CrashFrequencyPredictionsforSegment650forAllAnalysisYears
Year Predictions from SPFs for Segment 650 Total Crashes Fatal and Injury Crashes
2005 1.450 0.767 2006 1.461 0.773 2007 1.452 0.768 2008 1.452 0.768 2009 1.452 0.768 2010 1.452 0.768 2011 1.452 0.768 2012 1.452 0.768
TOTAL 11.622 6.150
Step13–ApplytheEmpiricalBayes(EB)methodtoadjustresultsforobservedcrashfrequencyForamorerigorousstatisticalprediction,anEmpiricalBayes(EB)adjustmentcanbeappliedtothecrashpredictions.TheEBmethodusesaweightedaveragebetweenobservedcrashhistoryforasiteandthepredictedfrequencyfromtheSPFtoobtainabetterestimateofpredictedcrashfrequency,asdescribedintheequationbelow:
∗ 1 ∗
where:NEB–EBadjustedpredictedcrashfrequency(crashes/year);W–weightforEBadjustment;Npr–predictedcrashfrequencyfromtheSPF(crashes/year);and,Nob–observedmeancrashfrequencyfromcrashhistory(crashes/year).
Theweightingfactor, ,isbasedonthecrashfrequencypredictedbytheSPF,numberofyearsofhistoriccrashdata,andtheoverdispersionparameterobtainedfromtheSPFmodel:
1
1∑ , /
where: W–weightforEBadjustment;
∑Npr,ch–sumofpredictedcrashfrequencyforeachyearofcrashhistory;L–segmentlength(miles);and,‐overdispersionparameterfromtheSPFmodel.
TheoverdispersionparameterforthetotalcrashfrequencySPFis0.514.Usingthisinformation,theweightingfactorfortheestimateoftotalcrashfrequencyis:
Page 44
37
1
111.623/0.4477
0.514
0.019
TheEBadjustedpredictedcrashfrequencyforSegment650in2013isthen:
0.019 ∗ 1.416 1 0.019 ∗ 1.125 1.131 / BecausesolittleweightisgiventotheSPFprediction,theEBadjustedpredictionismuchclosertothecrashhistorymeanthantheprediction.Thisoccursbecausethereisalot(eightyears)ofhistoricalcrashdataavailablefortheroadwaysegment.ThisprocesscanberepeatedfortheFatalandInjurycrashprediction,forwhichtheSPFhasanoverdispersionparameterof0.624.
Step14–ApplythemethodologytoothersitesorsegmentsTheresultsofapplyingtheSPFsandEBadjustmentfortotalcrashesonallsegmentsaswellasfatalandinjurycrashesonallsegmentsareshownbelowinTable27.
Table27.SummaryofPredictCrashFrequenciesandCrashFrequencies
AccountingfortheEBAdjustment
Segment Total Crashes Fatal and Injury Crashes
Observed Mean
SPF, No EB Weight EB-
Adjusted Observed
Mean SPF,
No EB Weight EB-Adjusted
650 1.125 1.416 0.019 1.131 0.875 0.749 0.043 0.870 660 2.125 1.697 0.017 2.118 0.500 0.900 0.038 0.515 670 1.125 1.589 0.017 1.133 0.750 0.842 0.037 0.753 680 3.000 1.910 0.017 2.981 1.375 1.013 0.038 1.361 690 0.375 1.282 0.019 0.393 0.125 0.679 0.044 0.149 700 0.750 1.468 0.018 0.763 0.125 0.779 0.041 0.152 710 1.875 1.566 0.019 1.869 0.375 0.829 0.042 0.394 720 1.375 1.579 0.020 1.379 0.625 0.834 0.044 0.634 730 1.375 1.688 0.019 1.381 0.625 0.894 0.043 0.637
Total 13.125 14.196 13.147 5.375 7.519 5.465
Step15–Applytheproject‐levelEBadjustmentThisstepisnotapplicableforthesegmentlevelSPFsdevelopedforthetwo‐laneruralroadsinPennsylvania.
Step16–SumcrashfrequenciesacrossanalysisyearsandlocationsThissumisprovidedinTable27above.
Step17–DetermineifthereisanalternativedesigntobeevaluatedNoalternativesareproposedforthisroadwaysectionsothisstepisnotneeded.
Page 45
38
Step18–EvaluateandcompareresultsSincemultiplealternativesarenotbeingcompared,thisstepisnotneeded.Thepredictedtotalcrashfrequencyfortheroadwaysectionis13.1crashesperyearandforfatalandinjurycrashfrequencyis5.5crashesperyear.
Casestudy2–ComparingProposedAlternativesforanExistingIntersection
Thesite/facility
TheintersectionofSR322andSR144.AsatelliteimageofitscurrentgeometricconfigurationisprovidedinFigure2.
Figure2.CurrentGeometricConfigurationfortheIntersectionofSR322andSR
144Thequestion
GeometricdesignchangesareproposedfortheintersectionofSR322andSR144.Engineersareplanningtoredesigntheintersectionfromitscurrentconfiguration(showninFigure2)toasimpler,moretraditional,3‐legconfigurationwithstop‐controlontheminorapproach.Fourdifferentconfigurationalternativesarebeingconsidered:
1. 3‐legconfigurationwithnoexclusiveturnlanes.2. 3‐legconfigurationwithanexclusiveleft‐turnlaneonthemajorapproach.3. 3‐legconfigurationwithanexclusiveright‐turnlaneonthemajorapproach.4. 3‐legconfigurationwithexclusiveleft‐andright‐turnlanesonthemajor
approach.
Thequestiontheniswhichoftheconfigurationswillprovidethebestexpectedsafetyperformance(i.e.,lowestcrashfrequency)inafutureyearscenario2015?
Page 46
39
Facts
Trafficvolumes(measuredinAADT)forthefutureyearscenarioforwhichtheprojectisexpectedtobecompletedareprovidedinTable28.Thisinformationcanusuallybeobtainedfromtherelevantplanningofficeor,aswasdonehere,byextrapolatinghistoricaltrendstothefutureyearscenario.
Table28.FutureTrafficVolumesforStudySite
Intersecting Route AADT in 2015 [veh/day] Major approach (SR 322) 10981 Minor approach (SR 144) 4261
Assumptions
None
Results
Usingthepredictivemethodoutlinedbelow,theconfigurationalternativethatprovidesthelowestcrashfrequencyisalternative2(a3‐legintersectionwithanexclusiveleft‐turnlaneonly).Thepredictedfrequencyoftotalcrashesforthisproposedintersectionconfigurationis2.3crashesperyearandthepredictedfrequencyoffatalandinjurycrashesis1.3crashesperyear.
Steps
Step1–DefinethespatiallimitsofthestudyThelimitofthisstudyistheintersectionofSR322andSR144.Inpractice,theinfluenceareaofanyintersectionextends250feetupstreamofeachoftheintersectionapproaches.Thus,thepredictionsperformedherewillaccountforcrasheswithinthisinfluencearea.
Step2–DefinetheperiodofinterestInthisproblem,theanalysisperiodofinterestisthefutureyear2015.
Step3–DeterminetheavailabilityoftrafficvolumeandhistoricalcrashdataAspertheFactssection,thisinformationwouldbeeitheravailablefromtherelevantplanningauthorityorcanbeextrapolatedfromthecurrenthistoricaltrendsfoundinthecurrentPennDOTRMSdatabase.
Step4–DeterminegeometricdesignandothersitecharacteristicsThisinformationisusuallyavailablefromthePennDOTRMSdatabaseandthesupplementaldatacollectedandprovidedbyPennStatetoPennDOT.Forthisproblem,thegeometricdataisprovidedbytheconfigurationalternativesbeingconsidered.
Page 47
40
Step5–DividetheroadwaynetworkintoindividualsitesAsgivenbytheproblemstatement,onlyonesiteisbeingconsidered:theintersectionofSR322andSR144.
Step6–AssigncrashestoindividualsitesThisstepisnotapplicablesincetheanalysisperiodrepresentsafutureyearscenarioforwhichhistoricalcrashdatawouldnotbeavailable.
Step7–SelectanindividualsiteinthestudynetworkSinceonlyonesiteisbeingconsidered,thisistheonlysitethatwillbeselected.
Step8–SelectanindividualanalysisyearintheperiodofinterestSincetheperiodofinterestisjustthefutureyear2015,thisyearisselected.
Step9–DetermineandapplytheappropriateSPFfortheselectedsiteFromTable16,theshort‐formSPFfortotalcrashfrequencyon3‐legminor‐stopcontrolintersectionsoftwo‐laneruralroadsinPennsylvaniaunderthebaseconditionsofnoexclusiveleft‐turnorright‐turnlanesis:
,. ∗ . ∗ .
where:Npr,3st =predictedtotalcrashfrequencyattheintersection(crashes/year);AADTmaj =annualaveragedailytrafficonthemajorapproach(veh/day);and,AADTmin =annualaveragedailytrafficontheminorapproach(veh/day).
Thisequationcanbeevaluatedbyplugginginthetrafficvolumesprovidedfromthesitedataintotheequation,asfollows:
, 10981 . ∗ 4261 . ∗ . 3.142crashes/year
Therefore,basedonthetrafficcharacteristicsoftheintersectionandproposedconfiguration,theSPFpredicts3.142totalcrashestooccurinthefutureyearscenario2015underbaseconditions.
Similarly,fromTable16,theshort‐formSPFforfatalandinjurycrashfrequencyon3‐legminor‐stopcontrolledintersectionsoftwo‐laneruralroadsinPennsylvaniaunderthebaseconditionsofnoexclusiveleft‐turnorright‐turnlanesis:
, ,. ∗ . ∗ 6.457
where , , isthepredictedfatalandinjurycrashfrequencyatthe3‐legminor‐stopcontrolledintersection(intermsofcrashes/year)andtheothervariableshavebeenpreviouslydefined.Thisequationcanbeevaluatedbyplugginginthevaluesprovided
Page 48
41
fromthesitedatafortheproposedconfigurationalternative1intotheequation,asfollows:
, , 10981 0.439 ∗ 4261 0.343 ∗ 6.457 1.639 /
Therefore,basedonthetrafficcharacteristicsoftheintersectionandproposedconfiguration,theSPFpredicts1.639fatalandinjurycrashesinthefutureyearscenario2015underbaseconditions.
Step10–ApplytheappropriateCMFsforthesegmentWemustnowadjustthecrashfrequencypredictionstoaccommodatedifferencesbetweenthegeometriccharacteristicsofthesegmentofinterestandthebaseconditionsassumed.FortheSPFdevelopedfor3‐legminor‐stopcontrolledintersectionsoftwo‐laneruralroadways,thebaseconditionsassumethatnoexclusiveleft‐turnorright‐turnlanesareprovided.FromtheSPFoutputpresentedinTable16,Pennsylvania‐specificCMFscanbecreatedforthepresenceofexclusiveleft‐turnandright‐turnlanes.Sincethefirstalternativebeingconsideredincludesnoexclusiveturnlanes,theseCMFsdonotapplyandthisstepcanbeskippedforthisspecificalternative.
Step11–MultiplytheresultbytheappropriatecalibrationfactorSinceweareapplyingSPFscreatedspecificallyforintersectionsoftwo‐laneruralroadsinPennsylvania,whichweredevelopedusinghistoricalcrashdatafromPennsylvania,nocalibrationfactorisrequiredtomodifythepredictionsoftheSPFs.
Step12–RepeatSteps8to11fortheremaininganalysisyearsThisstepisnotrequiredsinceonlyasingleanalysisyearisbeingconsidered.
Step13–ApplytheEmpiricalBayes(EB)methodtoadjustresultsforobservedcrashfrequencyForsimplicity,thisstepisskippedsincethefutureyearscenariois2015andhistoricalcrashdataisnotavailablefortheprecedingyears.
Step14–ApplythemethodologytoothersitesorsegmentsSincenoothersiteisbeingconsidered,thisstepisnotrequired.
Step15–Applytheproject‐levelEBadjustmentThisstepisnotapplicablefortheintersectionlevelSPFsdevelopedforthetwo‐laneruralroadsinPennsylvania.
Step16–SumcrashfrequenciesacrossanalysisyearsandlocationsSinceonlyonelocationandanalysisyearisbeingconsidered,thisstepisnotrequired.
Step17–DetermineifthereisanalternativedesigntobeevaluatedInthisproblem,fouralternativesarebeingconsideredandonlythefirstwasanalyzed.TheSPFequationscanbeappliedtothefeaturesoftheotherconfigurationalternatives
Page 49
42
toassesstheirsafetyperformanceforthefutureyear2015.AsummaryoftheresultsareprovidedinTable29.
Table29.SummaryofResultsoftheFourIntersectionConfigurationAlternatives
Alternative Number Total crashes Fatal and injury crashes 1 3.142 1.639 2 2.259 1.255 3 5.217 2.869 4 3.751 2.197
Step18–EvaluateandcompareresultsWenowcomparethecrashfrequenciesestimatedforthevariousalternatives.AsshowninTable29,configurationalternative2hasthelowestestimatedcrashfrequenciesforbothtotalandfatalandinjurycrashesofthefourpossibilities.Thus,thisconfigurationwasselectedashavingthebestsafetyperformanceinthefutureyear2015scenario.
REFERENCES
AmericanAssociationofStateHighwayandTransportationOfficials.HighwaySafetyManual.AASHTO,Washington,DC,2010.Bauer,K.M.andD.W.Harwood.StatisticalModelsofAt‐gradeIntersectionAccidents.ReportNo.FHWA‐RD‐96‐125,FederalHighwayAdministration,McLean,VA,November1996.Fitzpatricketal.AlternativeDesignConsistencyRatingMethodsforTwo‐laneRuralHighways.ReportNo.FHWA‐RD‐99‐172,FederalHighwayAdministration,McLean,VA,1999.Harwood,D.W.,K.M.Bauer,I.B.Potts,D.J.Torbic,K.R.Richard,E.R.KohlmanRabbani,E.Hauer,L.Elefteriadou,andM.S.Griffith.SafetyEffectivenessofIntersectionLeft‐andRight‐TurnLanes.TransportationResearchRecord:JournaloftheTransportationResearchBoard,No.1840,TransportationResearchBoardoftheNationalAcademies,Washington,D.C.,2003,pp.131–139.Lee,J.,andF.Mannering.ImpactofRoadsideFeaturesontheFrequencyandSeverityofRun‐Off‐RoadAccidents:AnEmpiricalAnalysis.AccidentAnalysisandPrevention,Vol.34,No.2,2002,pp.149‐161.Mitra,S.andS.P.Washington.OnTheSignificanceofOmittedVariablesinIntersectionCrashModeling.AccidentAnalysisandPrevention,Vol.49,pp.439‐448,2012.
Page 50
43
Poch,M.,andF.Mannering.NegativeBinomialAnalysisofIntersectionAccidentFrequencies.JournalofTransportationEngineering,Vol.122,No.2,ASCE,1996,pp.105‐113.Torbic,D.J.,J.M.Hutton,C.D.Bokenkroger,K.M.Bauer,D.W.Harwood,D.K.Gilmore,J.M.Dunn,J.J.Ronchetto,E.T.Donnell,H.J.SommerIII,P.Garvey,B.Persaud,andC.Lyon.NCHRPReport641:GuidancefortheDesignandApplicationofShoulderandCenterlineRumbleStrips.TransportationResearchBoardoftheNationalAcademies,Washington,DC,2009.Wang,X.,andM.Abdel‐Aty.TemporalandSpatialAnalysesofRear‐EndCrashesatSignalizedIntersections.AccidentAnalysisandPrevention,Vol.38,No.6,2006.pp.1137–1150.Washington,S.,B.Persaud,C.Lyon,andJ.Oh.ValidationofAccidentModelsforIntersections.ReportNo.FHWA‐RD‐03‐037,FederalHighwayAdministration,McLean,VA,2005.Zegeer,C.V.,J.Hummer,L.Herf,D.Reinfurt,andW.Hunter.SafetyEffectsofCross‐SectionDesignforTwo‐LaneRoads.ReportFHWA‐RD‐87‐008.FederalHighwayAdministration,Washington,DC,1986.
Page 51
44
APPENDIXA
VIDEOPHOTOLOGDATACOLLECTIONINSTRUCTIONALGUIDE
Page 52
45
TheVideoLogsystemisusedbyPennDOTtodescribetheautomatedcollectionofpanoramicroadwayimagery.Thisonlinesystemisbeneficialbecausedatacollectorscanseevisualimagesofroadwayconditionswithouthavingtodriveintothefield.Inthisway,fewerman‐hoursarerequiredtocollectfielddatathatcanbeobtainedvisually.Inthisproject,thevideologsystemisusedtocollectthreepiecesofinformation:1)roadsidehazardratings(RHR)ofroadwaysegments;2)intersectionlaneconfigurations(e.g.,presenceofleft‐orright‐turnlanesonintersectionapproaches)atintersectionsofstate‐ownedtwo‐laneruralroads;and,3)verifythepresenceandtypeoftrafficcontrolthatexistsattheseintersections(e.g.,two‐wayvs.all‐wayvs.signalcontrol).
ThisdocumentwilldemonstratehowtocollectthedataneededforthisprojectusingStateRoute3009inBedfordCountyasanexample.Priortodemonstratingthemethodstocollectthedataofinteresttothepresentstudy,theprocedurenecessarytoaccessthePennDOTvideologsystemisdescribed.
Step1:AccessthePennDOTOnlineVideoLogsystematthefollowinglink: http://www.dot7.state.pa.us/VideoLog/Open.aspx
InternetExplorerwilllikelydisplaya“pop‐upblocker”forstate.pa.us–allowthistodisplay.
Step2.AftergainingaccesstothePennsylvaniaVideoLogApplication,click“IAccept”(Figure3).
Figure1.Screenshotof“IAccept”IconStep3.Inthe“SelectAreaofInterest”boxthatisshowninFigure4,select“route
segment”.Click“GenerateMap”whenfinished.
Page 53
46
Figure4.ScreenshotforSelectAreaofInterestStep4.Inthe“County”and“SelectaStateRoute”boxesshowninFigure5,select
BedfordCountyandSR3009asshowninFigures6and7,respectively.Besuretochoose“EntireRoute”whenselectingtheStateRouteasthiswillbeginthevideologatthefirstsegmentwithinthecounty.
Figure5.SelectaCountyandSelectaRouteScreenCapture
Page 54
47
Figure6.SelectingBedfordCounty
Figure7.SelectingSR3009
Page 55
48
Step5.Whenyougainaccesstothevideolog,click“ActivateMap”(seeFigure8).Amapwillappearthatprovidesalocalizedareamapofthesubjectroute,SR3009(seeFigure9).IfyouareusingacomputerthathasnotyetaccessedthePennsylvaniaVideoLogapplication,youwillneedtoinstallamapfunction
(seeFigure10),whichhasalinkjustbelowthevideologpicture.
Figure8.The“ActivateMap”Icon
Figure9.Screenshotfor“Show‐upMap”tolocatebeginningpointforSR3009
Page 56
49
Figure10.Screenshotforinstallingamapplug‐in
Thedatathatwillbecollectedfromthevideologsystemarenowdescribed.
RoadsideHazardRating(RHR)Theroadsidehazardrating(RHR)isaqualitativecharacterizationofthecrashpotentialforroadsidedesignsontwo‐lanehighways.TheseestimatesaremadebyvisuallyinspectingasegmentofroadwayandassigningitavaluebasedontheguidelinesprovidedinZegeeretal(1986).Inthissystem,aseven‐pointcategoricalscaleisusedtodescribethepotentialhazards,rangingfrom1(leasthazardous)to7(morehazardous).Forthisproject,wewillutilizethePennDOTonlinevideologsystemtoestimatetheRHRforallstate‐ownedroadwaysegmentsontwo‐laneruralhighways.Adetaileddescriptionofroadsidedesignfeaturesthat“map”toeachofthesevenRHRcategoriesareshownbelow,asareexamplegraphicsillustratingeachratingcategory(Torbicetal,2009):
Page 57
50
Rating=1 Wideclearzonesgreaterthanorequalto9m(30ft)fromthepavementedge
line. Sideslopeflatterthan1V:4H(Vertical:Horizontal). Recoverable(meaning:thedriverofavehiclethatdepartstheroadwaysection
shouldbeabletorecoverthevehicleandsteerbackontotheroadway).
Figure11.TypicalRoadwaywithRoadsideHazardRatingEqualto1.
Rating=2 Clearzonebetween6and7.5m(20and25ft)frompavementedgeline. Sideslopeabout1V:4H. Recoverable.
Figure12.TypicalRoadwaywithRoadsideHazardRatingEqualto2.
Page 58
51
Rating=3 Clearzoneabout3m(10ft)fromthepavementedgeline. Sideslopeabout1V:3Hor1V:4H. Roughroadsidesurface. Marginallyrecoverable.
Figure13.TypicalRoadwaywithRoadsideHazardRatingEqualto3.
Rating=4 Clearzonebetween1.5and3m(5to10ft)frompavementedgeline. Sideslopeabout1V:3Hor1V:4H. Mayhaveguardrail1.5to2m[5to6.5ft]frompavementedgeline. Mayhaveexposedtrees,poles,orotherobjects(about3mor10ftfrom
pavementedgeline). Marginallyforgiving,butincreasedchanceofareportableroadsidecollision.
Figure14.TypicalRoadwaywithRoadsideHazardRatingEqualto4.
Page 59
52
Rating=5 Clearzonebetween1.5and3m(5to10ft)frompavementedgeline. Sideslopeabout1V:3H. Mayhaveguardrail0to1.5m[0to5ft]frompavementedgeline. Mayhaverigidobstaclesorembankmentwithin2to3m(6.5to10ft)of
pavementedgeline. Virtuallynon‐recoverable.
Figure15.TypicalRoadwaywithRoadsideHazardRatingEqualto5.
Rating=6
Clearzonelessthanorequalto1.5m(5ft). Sideslopeabout1V:2H. Noguardrail. Exposedrigidobstacleswithin0to2m(0to6.5ft)ofthepavementedgeline. Non‐recoverable.
Figure16.TypicalRoadwaywithRoadsideHazardRatingEqualto6.
Page 60
53
Rating=7 Clearzonelessthanorequalto1.5m(5ft). Sideslope1:2orsteeper. Clifforverticalrockcut. Noguardrail. Non‐recoverablewithhighlikelihoodofsevereinjuriesfromroadsidecollision.
Figure17.Roadwaywith RoadsideHazardRatingEqualto7.
ExampleAgain,considerStateRoute3009inBedfordCountyasanexample.Inthisexample,asinmostsegments,theroadsidehazardrating(RHR)willbedifferentforthetwodirectionsoftravelwithinthesegmentlimits.Assuch,datacollectorsshouldestimatetheaverageoftheRHRwithinthesegment(i.e.,produceonlyasingleRHRmeasurepersegment).Figures11through17wereusedtoassignaRHRforeachsegment.Figures18,19andTable29showtheprocessusedtodeterminethatSR3009,Segment0010iscategory6.
Page 61
54
Figure18.VideoLogforSR3009,Segment0010.
Figure19.VideoLogforSR3009Segment0010.
Clearzoneless
than1.5m(5ft)
Side slope
about 1:2
Exposed rigid obstacles within
0 to 2 m (0 to 6.5 ft) of the
pavement edgeline NoGuardrail
Non‐recoverable
Page 62
55
Table29.ThechecklistofRHRforSR3009Segment0010.
SR3009segment0010isanexampleofa“severe”roadside.AnexampleofamoreforgivingroadsideisshowninFigures20through22,whichisSR3009,Segment0090inBedfordCounty.ThisexamplealsoillustrateshowtheRHRcanchangewithinthelimitsofasegment.Figure20showshowtheRHRfrombothsidesofthesegmentareaveraged,whileFigures21and22showhowtheRHRisaveragedoverthelengthofthesegment.ThisprocessresultedinSegment0090beingassignedaRHRof3.
Figure20.Videologforsegment0090(1)
clear zone side slope Cliff or Vertical Rock Guardrail Rigid Obstacles Recoverable
Rating 1 >=9 m(30 ft) Flatter than 1:4 No Yes
Rating 2 6‐7.5 m(20‐25 ft) 1:4 No Yes
Rating 3 3 m(10 ft) Rough roadside surface Marginally
Rating 4 Allowable(1.5‐2m[5‐6.5ft]) About 3m(10ft) Marginally forgiving
Rating 5 1:3 Allowable(0‐1.5m[0‐5ft]) 2‐3m(6.5‐10ft) Virtually non‐recoverable
Rating 6 1:2 0-2m(0-6.5ft) No
Rating 7 1:2 or steeper Yes N/A No(high likelihood of injure)
SR. 3009 seg. 0010 RHR
<=1.5 m(5 ft)
No
1.5‐3 m(5‐10 ft)
N/A
No
1:3 or 1:4
1. Wide clear zones ≥ 9 m (30 ft)
from the pavement edge line.
2. Side slope flatter than 1V:4H
1.Clear zone less than or equal to 1.5 m (5 ft).
2.Side slope about 1V:2H.
3.No guardrail.
4.Exposed rigid obstacles within 0 to 2 m (0 to
6.5 ft) of the pavement edgeline.
Rating6 Rating
Page 63
56
Figure21.VideologforSegment0090(2)
Figure22.VideologforSegment0090(3)
IntersectionLaneConfigurationsandVerificationofTrafficControlThevideologintersectiondatacollectioneffortwillbeusedtoidentifythepresenceofleftorright‐turnlanesonintersectionapproaches,andthetypeoftrafficcontrolpresentatintersections.Forthisproject,weareonlyinterestedintheintersectionsoftwostateownedroads.Therefore,youshouldverify(usingGoogleMapsorsomeothertool)thattheintersectionyouobserveinthevideologisanotherstateownedroad.Theintersectioncontroltypesconsideredinthisresearchare:two‐waystopcontrol,all‐waystopcontrol,andsignalizedintersectioncontrol.ConsidertheintersectionofSR3009withSR3011whichislocatedwithinSegment0150inBedfordCounty.Thisisatwo‐waystop‐controlledintersectionthathasnoleftturnlaneorrightturnlane.
Wide clear zones ≥ 9 m (30 ft)
Side slope flatter than
1V:4H
RecoverableRating
Side slope about
1V:3H
Clear zone between 1.5 and
3 m (5 to 10 ft) from
pavement edgeline
No guardrail
May have rigid obstacles or
embankment within 2 to 3 m (6.5
to 10 ft) of pavement edgeline
Non‐recoverable
Rating5
Page 64
57
Figure23.IntersectionDataCollectionandTrafficControl
OtherSegment‐levelDataIntheroadwaysegmentdatafiles,thefollowingadditionaldatawillbecollectedandenteredintotheappropriatecolumnsofthedatafile:
Presenceofpassingzones Presenceofcenterlineorshoulderrumblestrips Presenceofhorizontalcurvewarningpavementmarkings Presenceofintersectionwarningpavementmarkings Presenceofaggressivedriving“dots” Numberofdrivewaysandintersectionsthatarenotconsideredtheintersection
ofstate‐ownedroadways.
Anexampleofapassingzoneonatwo‐lanehighwayisshowninFigure24.Examplesofshoulder(leftpanel)andcenterline(leftpanel)rumblestripsareshowninFigure25.Figure26(leftpanel)showsanexampleofahorizontalcurvewarningpavementmarkingandtherightpanelofFigure26showsanexampleofintersectionwarningpavementmarkings.Aggressivedriving“dots”areshowninFigure27.
Nostopsigninmajordirection
Noleftturnlaneandright turn
Page 65
58
Figure24.Exampleofpassingzones.
Figure25.Exampleofcenterlinerumblestrips(leftpanel)andshoulderrumblestrips(rightpanel).
Figure26.Exampleofhorizontalcurvewarningpavementmarking(leftpanel)andintersectionwarningpavementmarking(rightpanel).
Figure27.Exampleofaggressivedriving“dots”signandpavementmarkings.
Page 66
59
APPENDIXB
GOOGLEEARTHDATACOLLECTIONINSTRUCTIONALGUIDE
Page 67
60
GoogleEarthisavirtualandgeographicprogramwherethe3Dterrainandroadwayfeaturescanbedetectedusingdetailedaerialmaps.SpecifictoolswithintheGoogleEarthprogramsallowforarelativelyprecisewaytomeasurelineardistancesandangles.Forthisproject,GoogleEarthprovidesausefulandstraightforwardwaytocollect:1)thegeometricparametersdescribinghorizontalcurves;and,2)theskewangleofintersectionsoftwostateownedroads.TheGoogleEarthtoolisfreelyavailableonlineat:http://www.google.com/earth/index.html.Thelowresolutionofaerialimageryavailableforruralareasmightresultinvariabilityinthedefinitionofthesehorizontalcurvesamongvariousdatacollectors.Inanefforttoalleviatethisissue,wewillalsomakeuseofPennDOT’svideologsystem(availableat:http://www.dot7.state.pa.us/VideoLog/Open.aspx)tohelpdefinethecurvelimitsfromadriver’sperspective.HorizontalCurveDataCollectionThegeometricdatathatweareinterestedinforeachhorizontalcurveincludes:1)thelengthofthecurve(i.e.,itsarclength);and,2)theradiusofthecurve.Thefollowingsectionsdescribethespecificprocessesusedtocollectthishorizontalcurvedata.Step1:DrawingtheroutepathinGoogleEarthSinceeverystate‐ownedruraltwo‐lanerouteiscodedinPennDOT’sroadwayfilesatthesegment‐level,horizontalcurvedataaredefinedwithinthesegmentboundaries.Foreachsegment,weareinterestedinthenumberofhorizontalcurvesthatexist,andtheradiusandarclengthofeach.Beforelocatingthestartingandendingpointsforsegments,wemustfirstdrawapathalongagivenrouteusingGoogleEarth.
Atthetopoftheorderpanel,clickthe“AddPath”icon(seeFigure28) .Awindow
willappeartocreateanewpath(seeFigure29).Givethepathaname(e.g.,SR3009inthisexample)anddrawapathalongtheroadwayofinterest.Thisisdonebyclickingatpointsalongtheroadwaytocreatenodesforthepath.Thenodesshouldbeplacedatfairlyregularintervals(~500ft)onstraightsections,andshouldbeplacedmuchcloseronhorizontalcurvestocapturethecurvegeometry.Afteryouhavefinishedcreatingthepath,click“Ok”.NOTE:basedonthewayroadwaysegmentsarenumberedinthePennDOTsystem,pathsshouldbecreatedfromwesttoeastandfromsouthtonorth(i.e.,directionofincreasingsegment).
Figure28.“AddPath”Icon
Page 68
61
Figure29.ScreenshotforAddingPathStep2:LocatingthestartingandendingpointforeachsegmentWemustnowdeterminethestartingandendingpointofeachsegmentusingthePennDOTroadwaydatabase.InTable30,thereare18contiguoussegmentsonStateRoute(SR)3009inBedfordCounty.Thefirstsegmentis0010whilethelastis0180.Thesegmentlengthinfeetisprovidedinthefourthcolumn,whileamileage‐basedsegmentlengthisshowninthefifthcolumn.Thecumulativelengthcolumnisameasureoftheroadwaylengthwithinthecountybeginningatthewestern‐orsouthern‐mostcountyboundary.Adjacentcumulativelengthvaluesrepresentthebeginningandendingmilepostsforeachsegmentalongtheroute,whichwillbeneededtousetheGoogleEarthtoolthatisdescribedinthisdocument.Firstandforemost,weneedtofindthebeginningpointfortheentireroute.Takesegment0010inBedfordCountyasanexample.Whenyougainaccesstothevideolog,whichwasillustratedinthevideologsheet,amapwillappearthatprovidesalocalizedareamapofthesubjectroute,SR3009(seeFigure30).Thiswillhelpyoulocatethestartingpointfortheentireroute.TofindallthenecessarylocationsontheGoogleEarthimage,wewillusethebuilt‐inrulertoaddeachsegmentlengthtothestartpoint.Click“ShowRuler” (seeFigure31),andchangetheunitoflengthto“Feet”,asshowninFigure32.
Page 69
62
Table30.LengthofSegmentsinPennDOTProfile
CNTY SR SEG LENGTH(ft) LENGTH(mi) Begin Milepost
End Milepost
Cumulative length(mi)
SPEED LANES COUNTY
5 3009 10 2472 0.468182 0 0.468182 0.468182 55 2 BEDFORD
5 3009 20 2769 0.524432 0.468182 0.992614 0.992614 55 2 BEDFORD
5 3009 30 1271 0.240720 0.992614 1.233333 1.233333 55 2 BEDFORD
5 3009 40 3918 0.742045 1.233333 1.975379 1.975379 55 2 BEDFORD
5 3009 50 2929 0.554735 1.975379 2.530114 2.530114 55 2 BEDFORD
5 3009 60 1387 0.262689 2.530114 2.792803 2.792803 55 2 BEDFORD
5 3009 70 2577 0.488068 2.792803 3.280871 3.280871 55 2 BEDFORD
5 3009 80 2508 0.475000 3.280871 3.755871 3.755871 55 2 BEDFORD
5 3009 90 3015 0.571023 3.755871 4.326894 4.326894 55 2 BEDFORD
5 3009 100 2029 0.384280 4.326894 4.711174 4.711174 55 2 BEDFORD
5 3009 110 1963 0.371780 4.711174 5.082955 5.082955 55 2 BEDFORD
5 3009 120 2592 0.490909 5.082955 5.573864 5.573864 55 2 BEDFORD
5 3009 130 1937 0.366856 5.573864 5.940720 5.940720 55 2 BEDFORD
5 3009 140 1744 0.330303 5.940720 6.271023 6.271023 55 2 BEDFORD
5 3009 150 2312 0.437879 6.271023 6.708902 6.708902 55 2 BEDFORD
5 3009 160 1794 0.339773 6.708902 7.048674 7.048674 55 2 BEDFORD
5 3009 170 3978 0.753409 7.048674 7.802083 7.802083 55 2 BEDFORD
5 3009 180 2056 0.389394 7.802083 8.191477 8.191477 55 2 BEDFORD
Figure30.Screenshotfor“Show‐upMap”tolocatebeginningpointforSR3009
Page 70
63
Figure31.The“ShowRuler”Icon
Figure32.Screenshotfor“ShowRuler”inTheStartingLocationAsshowninTable30,theendofthefirstsegment(0010)is2472ftfromthestartoftherouteinBedfordCounty.Usingtheruler,measureadistance2472ftfromthefirstpointonthepath.Thislocationrepresentstheendpointofsegment0010andthebeginningpoint(offset0000)ofsegment0020.Savethislocationonthemap.Todothis,click“Save”andthenclick“AddPlacemark” (seeFigures33and34).Thiswillcreateaplacemarkthatdenotesthestarting/endingpoint(seeFigures35and36).
Figure33.The“AddPlacemark”Icon
Figure34.Screenshotfor“AddPlacemark”
Page 71
64
Figure35.Locatingtheendingpointsofseg.10
Figure36.TheStartingandEndingPointsforSegments
Repeatthisprocessforallsegmentstarting/endingpointsalongtheroute.
Page 72
65
Step3:MeasuringCurvesinGoogleEarthVisuallyinspecteachsegmenttoidentifyanyhorizontalcurvesthatexistbasedonyourreviewofthevideolog.Onceacurvehasbeenidentifiedfromadriver’sperspective,checkthemapbelowthevideologtofindthelocationandthengotoGoogleEarthtoconfirmit.Ifthishorizontalcurvecannotbedetected,scrollwiththemousetoenlargethepicture.Inordertokeepconsistentlyacrossindividuals,wesetup1:1592.5cm(4cm:209ft)asscalelegendbecausethesegmentalmostcoversthewholescreeninthiszoominglevel(SeeFigure37).Thislevelhelpswhenabighorizontalcurveexistsandstretchesitselftoanothersegment.Now,wewillstarttomeasurethiscurve’sproperties.Figure38showsthevariouscomponentsofasimplehorizontalcurve(AASHTO,2011).Figure39showshowtoapplyeachcomponentontheGoogleEarthimages.Theradiusofcurveis“R”andthelengthofcurve(arc)isdenoted“L.”
Figure37.“ZoomingResolution”level
Figure38.Measuringthelengthofarcandradiusofthecurve.
Page 73
66
Figure39.TheRelationshipbetweenLC,M,andR
BasedonthegeometryofFigure38andFigure39,therelationshipbetweenLC,M,andradiusRisasfollows:
(LC/2)2+(R‐M)2=R2(10)R=LC2/8M+M/2 (11)
Considerahorizontalcurveinsegment0010ofStateRoute3009inBedfordCounty,asanexample.AfteridentifyingthecurveusingGoogleEarth,markthetwolocationswherethearc(lengthofcurve)isadjacenttotheintersectingtangents(labeledPCandPTinFigure38),andrecordthecoordinatesofthePC(pointofcurveorbeginningofcurveindirectionofincreasingsegment)andPT(pointoftangentorendofcurveindirectionofincreasingsegment).Thisisdonebyclicking“AddPlacemark” soyou
canmovetheyellowpin togainthelatitudeandlongitudeinformationofthetwo
points(anexampleisshowninFigure40).RecordthecoordinatesofthesetwopointsasshowninTable31.Thesecondproceduretomeasurethecurveistodrawachord(lineLCorCinFigure38)toconnectthePCandPT.Then,drawaperpendicularlinefromthechordtothemid‐pointofthearc(lineMinFigure38),whichisillustratedinFigures41and42,respectively.Tables32and33illustratehowthedatacollectorwillpopulatethelengthofchordandmid‐linelengthdataintotherespectivecells.
LC
R
R
M
R
Page 74
67
NotethatLCisthelengthofchordandMisthelengthofmid‐pointline,whichcanbe
calculatedfromthe“ShowRuler”tool inGoogleEarth.Theprocessusedtoaccessto
the“ShowRuler”toolwerenotedabove.
Figure40.ExampleofDisplayingCoordinates
Table31.FillingintheCoordinatesData
Figure41.ExampleofDrawingtheChord
CNTY SR SEG
LENGTH (ft)
Point of Tangents (PT) (1)
Length of chord(1) (LC,ft)
Mid-line length(1)
(M,ft)
Radius in map(1) (ft)
5 3009 10 2472
(39°45'11.08"N, 78°40'50.56"W) 266.10 27.09 340.28 (39°45'12.67"N, 78°40'47.93"W)
Page 75
68
Table32.FillinginLengthofChordData
Figure42.ExampleofDrawingtheMid‐line
Table33.FillinginMid‐lineData
Fromequation(11),theradius(R)isderivedfromtheLCandMterms.TheresultsaredisplayedinTable34.Whenasegmentdoesnothaveanycurves,putan“X”inthecurvecellsforthatparticularsegmenttodesignatethatyouhavecheckedthesegmentandnocurvesexist.Similarly,iftherearemorethanthreecurvesinacurrentsegment,insertmorecurvecolumnstothedatabase,totherightoftheexistingcurvedatacolumns.Notethatifasinglehorizontalcurvecrossestwoadjacentsegments,thiscurveshouldbe“split”intotwopartsandrecordedinthecorrespondingsegmentdatacells.Forexample,ifahorizontalcurvebeginsinsegment0040andcontinuesintosegment0050,thehorizontalcurvecomponentthatexistsinsegment0040willberecordedinsegment0040,andtheothercomponentofthecurvethatexistsinsegment0050willbeidentifiedasanotherhorizontalcurveinsegment0050.Theendpointofthecurve(PT)
CNTY SR SEG LENGTH (ft)
Point of Tangents (PT) (1)
Length of chord(1) (LC,ft)
Mid-line length(1) (M,ft)
Radius in map(1) (ft)
5 3009 10 2472
(39°45'11.08"N, 78°40'50.56"W) 266.10 27.09 340.28 (39°45'12.67"N, 78°40'47.93"W)
CNTY SR SEG LENGTH
(ft) Point of Tangents (PT) (1)
Length of chord(1) (LC,ft)
Mid-line length(1) (M,ft)
Radius in map(1) (ft)
5 3009 10 2472
(39°45'11.08"N, 78°40'50.56"W)
266.10 27.09 340.28 (39°45'12.67"N, 78°40'47.93"W)
Page 76
69
insegment0040shouldbeequaltothebeginningpointofthecurve(PC)insegment0050.
Page 77
70
Table34.PTCoordinates,Lengthofchord,Mid‐lineLengthandRadiusofCurve
CNTY SR SEG
LENGTHPointofTangents
(1)
Lengthof
chord(1)
Middlelinelength(1)
Radiusonmap(1)
PointofTangents(2)
Lengthof
chord(2)
Middlelinelength(2)
Radiusinmap(2)
PointofTangents(3)
Lengthofchord(3)
Middlelinelength(3)
Radiusiomap(3)
(ft) (PT) (LC,ft) (M,ft) (ft) (PT) (LC,ft) (M,ft) (ft) (PT) (LC,ft) (M,ft) (ft)
5 3009 10 2472
(39°45'11.08"N,78°40'50.56"W)
266.1 27.09 340.28
(39°45'12.61"N,78°40'47.99"W)
780.00 138.74 617.52
(39°45'16.01"N,78°40'38.94"W)
1119.32 113.50 1436.57
(39°45'12.67"N,78°40'47.93"W)
(39°45'16.01"N,78°40'38.94"W)
(39°45'19.69"N,78°40'32.92"W)
5 3009 20 2769
(39°45'40.62"N,78°40'12.15"W)
705.97 144.85 502.52 X X X X X X X X(39°45'45.77"N,78°40'6.14"W)
5 3009 40 3918
(39°46'1.78"N,78°39'19.77"W) 222.88 13.06 481.98 X X X X X X X X(39°46'3.60"N,78°39'18.04"W)
5 3009 50 2929
(39°46'3.60"N,78°39'18.04"W) 172.65 8.62 436.56 X X X X X X X X(39°46'5.27"N,78°39'17.78"W)
Page 78
71
IntersectionDataCollectionWhenitcomestotheintersectionskewangledatacollection,wecanzoomintheGoogleMaptoenlargetheintersection,andplacetheprotractoronthecomputerscreentomeasuretheskewangleoftheintersection.Theskewangleisthesmallestanglebetweenthetwointersectionroads,andshouldalsobelessthanorequalto90degrees.
Figure43.IntersectionskewangleofSR3009andSR3012
Angletobemeasured
Page 79
72
APPENDIX C Integrating the Pennsylvania Safety Performance Functions into the Highway Safety
Manual Framework
This Appendix describes a process to integrate the safety performance functions (SPFs) developed for two-lane rural roadways in Pennsylvania directly into the Highway Safety Manual (HSM) framework. This is done by considering the roadway segment SPF. It is recommended that the integration of the intersection SPFs be completed in a similar manner. This Appendix includes the HSM framework (left column) and describes (in the right column) the locations where Pennsylvania-specific information can be substituted into the framework, including the SPFs, base conditions, and application of crash modification factors (CMFs). Highway Safety Manual Framework The HSM crash prediction algorithm for two-lane rural highways is as follows:
xyxxxxspfpredicted CCMFCMFCMFNN 21
where: Npredicted = predicted average crash
frequency for a specific year for site type x; Nspf x = predicted average crash frequency determined for base conditions of the SPF developed for site type x; CMF1x = crash modification factors specific to site type x and specific geometric design and traffic control features y; and Cx = calibration factor to adjust SPF for local conditions for site type x.
In the case of the predictive model shown above, site type x refers to a roadway segment or an intersection. For two-lane rural highway roadway segments, Nspf x is computed as follows:
)312.0(610365 eLAADTN xspf
The base conditions that are associated with Nspf x are as follows:
Lane width = 12 feet
Pennsylvania Framework
To integrate the Pennsylvania roadway segment SPF into the HSM framework, consider the general functional form of the SPF as shown below (see equation 7 in report):
)...( 2210 nn XXi eAADTLe
In this equation, substitute Nspf in place of i
for a parallel construct to the HSM framework. The remaining variables are defined as follows: e = exponential function; = regression coefficient for constant; L = roadway segment length (miles); AADT = average annual daily traffic (veh/day); 1 = regression coefficient for average annual daily traffic on roadway segment; 2, …, n = regression coefficients for geometric design and other site-specific explanatory variables, i = 2, …, n X2, ..., Xn = vector of geometric design and other site-specific data; Use the negative binomial regression coefficients in Table 2 of this report and substitute the values into the regression coefficients (b) to create the roadway segment SPF. The “full” SPF is as follows:
Page 80
73
Shoulder width = 6 feet Shoulder type = Paved Roadside hazard rating = 3 Driveway density = 5 driveways per
mile Horizontal curvature = None Vertical curvature = None Centerline rumble strips = None Passing lanes = None Two-way left-turn lanes = None Lighting = None Automated speed enforcement =
None Vertical grade = Level (0%)
Note that similar base conditions exist in the HSM for the intersection SPFs for two-lane rural roads. In Chapter 10 of the HSM, a series of CMFs may be applied to the crash prediction algorithm to adjust for site-specific conditions are not the same as the base conditions. The HSM calibration procedure may be used to develop a numerical value for Cx in the crash prediction algorithm for jurisdictions whose data were not used to develop the HSM crash prediction algorithm. Because Pennsylvania data were not use to develop the HSM crash prediction algorithm, a Cx
value derived from Pennsylvania is needed, or Pennsylvania-specific SPFs and CMFs can be developed. The purpose of the present study was to develop Pennsylvania-specific SPFs, so the HSM calibration factor (Cx) should be set equal to 1.0 for rural two-lane highway segments and intersections.
).002.0030.0008.0188.0239.045091.067101.0(
754.0934.5
DCMHCDADSRSPZRHRRHR
spf
e
AADTLeN
where: Nspf = predicted average crash
frequency for a specific year for a road segment (crashes per mile per year); L = segment length (miles); AADT= average annual daily traffic (vehicles per day); RHR67 = 1 if roadside hazard rating is 6 or 7, 0 otherwise; RHR45 = 1 if roadside hazard rating is 4 or 5, 0 otherwise; PZ = 1 if passing zone is present, 0 otherwise; SRS = 1 if shoulder rumble strips are present, 0 otherwise; AD = number of intersections and driveways per mile; HCD = number of horizontal curves per mile; DCM = degree of curve per mile.
The base conditions assumed for the HSM can also be assumed for Pennsylvania. This includes a roadside hazard rating of 3, an access density of 5 per mile, no passing zones, no shoulder rumble strips, and no horizontal alignment. Applying these base conditions into the Pennsylvania-specific SPF above reduces the equation to the following:
754.0894.5 AADTLeNspf .
Thisisthe“short‐form”versionoftheSPFthatisconsistentwiththeHSManalysisframework. CMFs for lane width, shoulder width, shoulder type, vertical curvature, presence of centerline rumble strips, presence of two-way left-turn lanes, presence of roadway lighting, presence of automated
Page 81
74
enforcement, and vertical grade cannot be developed directly from the long-form Pennsylvania-specific SPF above, so the HSM CMFs for these geometric and other site-specific features should be used in Pennsylvania. For the roadside hazard rating, presence of passing zones, access density, presence of shoulder rumble strips, and horizontal alignment, CMFs for Pennsylvania may be derived from the long-form SPF above. These CMFs are as follows:
45091.067101.0 RHRRHRRHR eCMF
CMFRHR = CMF for roadside hazard rating RHR67 = 1 if roadside hazard rating is 6 or 7, 0 otherwise; RHR45 = 1 if roadside hazard rating is 4 or 5, 0 otherwise.
)239.0( PZ
PZ eCMF CMFPZ = CMF for presence of passing zone PZ = 1 if passing zone is present, 0 otherwise.
)188.0( SRSSRS eCMF
CMFSRS = CMF for presence of shoulder rumble strips; SRS = 1 if shoulder rumble strips are present, 0 otherwise.
)5(008.0 ADAD eCMF
CMFAD = CMF for access density; AD = number of intersection and driveways per mile.
).002.0030.0( DCMHCDHC eCMF
Page 82
75
CMFHC = CMF for horizontal curvature; HCD = number of horizontal curves per mile; DCM = degree of curvature per mile.