San Jose State University From the SelectedWorks of Camille Johnson February 14, 2017 Sage on the Stage: Women’s Representation at an Academic Conference Camille S. Johnson, San José State University Pamela K. Smith, University of California, San Diego Chunlei Wang, San Jose State University Available at: hps://works.bepress.com/camille_johnson/20/
Transcript
San Jose State University
From the SelectedWorks of Camille Johnson
February 14 2017
Sage on the Stage Womenrsquos Representation at anAcademic ConferenceCamille S Johnson San Joseacute State UniversityPamela K Smith University of California San DiegoChunlei Wang San Jose State University
Available at httpsworksbepresscomcamille_johnson20
Running head WOMENrsquoS REPRESENTATION AT AN ACADEMIC CONFERENCE 1
Sage on the Stage
Womenrsquos Representation at an Academic Conference
Camille S Johnson
San Jose State University
Pamela K Smith
University of California San Diego
Chunlei Wang
San Jose State University
WORD COUNT 10566
Author Note
The first two authors contributed equally to this article We would like to thank Rebecca
Sandoval Thuha Cao Pratyusha Meka and the attendees at the Duck Conference on Social
Cognition (2014 2015) for their assistance and encouragement Address for correspondence
Camille Johnson One Washington Square San Jose California 95192 or Pamela K Smith
University of California San Diego Rady School of Management 9500 Gilman Dr 0553 La
Jolla CA 92093-0553 E-mail camillejohnsonsjsuedu or psmithradyucsdedu
WOMENrsquoS REPRESENTATION AT AN ACADEMIC CONFERENCE 2
Abstract
Who presents at conferences matters Presenting research benefits speakers and
presenters shape the conclusions audiences draw about who can succeed in a field This is
particularly important for members of historically underrepresented or disadvantaged groups
such as women We investigated gender representation over a 13-year period among speakers
at the largest social and personality conference On average women were underrepresented as
speakers though this effect diminished over time Chairs appeared to serve as gatekeepers in
symposia chaired by women almost half of the invited speakers were women whereas in
symposia chaired by men it was a third The representation of women as speakers varied
significantly by academic rank with women underrepresented at lower ranks but not as full
professors and by topic Women also tended to present with a smaller less varied array of
individuals than men though this was explained by womenrsquos lower average academic rank
Keywords gender higher education diversity gender representation social network
development
WOMENrsquoS REPRESENTATION AT AN ACADEMIC CONFERENCE 3
Sage on the Stage
Womenrsquos Representation at an Academic Conference
Presenting research at a conference has obvious positive consequences for speakers
Talks increase visibility for the speakers and their research particularly among colleagues and
high-status others who may cite their work write their evaluation letters for tenure
recommend them for grant review boards and invite them to future conferences panels and
editorial boards (Kite et al 2001) Less obvious are the consequences for audience members
Beyond the specific knowledge conveyed by the presentations audience members also learn
about what kind of person is likely to be successful in their field For example when graduate
students and junior faculty who are women or members of other underrepresented or
historically disadvantaged groups see speakers who share their identity this signals that they
too can succeed (Asgari Dasgupta amp Cote 2010 Stout Dasgupta Hunsinger amp McManus
2012) Conversely a lack of similar others implies that success is unlikely for them (Ceci
Williams amp Barnett 2009) Given these important potential consequences of who is ldquoon stagerdquo
at conferences we analyze womenrsquos representation in peer-reviewed symposia at the annual
conference of the Society for Personality and Social Psychology (SPSP) the largest organization
for social and personality psychologists from 2003 to 2015
The Issue of Representation
A variety of scientific fields have focused on female representation on speaker panels
and enacted policies to address inequities (eg Casadevall 2015) They document
underrepresentation having proportionally fewer women speakers on panels than women
members of a society because it may suggest bias against women They also document
WOMENrsquoS REPRESENTATION AT AN ACADEMIC CONFERENCE 4
absolute representation because the salience of women speakers may increase perceptions that
a field is women-friendly and improve women audience membersrsquo beliefs about the ease with
which they can succeed (Sanders Willemsen amp Millar 2009) Therefore fields in which women
predominate (eg Isbell Young amp Harcourt 2012 Simon Morris amp Smith 2007) and those in
which women are a numerical minority (eg Casadevall amp Handelsman 2014 Roberts amp
Verhoef 2016) have concerns about representation
This work stems from a larger concern that members of historically disadvantaged
andor underrepresented groups leave many academic fields at disproportionate rates at more
senior ranks a pattern called the ldquoleaky pipelinerdquo (Pell 1996) This pattern has been identified
in STEM fields (Hill Corbertt amp St Rose 2010) and within American psychology (eg APA Task
Force on Women in Academe 2000) Women enter social psychology at a higher rate than men
but are underrepresented at the professorial levels In 2014 665 of US doctorates in social
psychology1 were awarded to women (National Science Foundation 2015) but only 541 of
assistant professors 458 of associate professors and 288 of full professors in
socialpersonality psychology in US graduate departments of psychology were women
(Wicherski Hamp Christidis amp Stamm 2014) Data on psychology as a field suggest that
gender differences in promotion from assistant onwards may no longer exist (Box-Steffensmeier
et al 2015 Ginther amp Kahn 2014) but it is unclear whether such patterns hold for individual
specialties like social psychology For example from 1994 to 2014 women earned on average
63 of social psychology PhDs and in all but 3 of those years (1995 2001 and 2002) women
1The most recent available data for personality psychology are from 2006 when 70 of US personality
psychology PhD recipients were women (Hoffer Hess Welch amp Williams 2007)
WOMENrsquoS REPRESENTATION AT AN ACADEMIC CONFERENCE 5
earned over 60 of social psychology PhDs (National Science Foundation 1994-2014) Given
this data assistant and associate professor percentages for 2014 should be over 60 if men and
H2 Women invited speakers are of higher status than men invited speakers
We examined the academic rank of invited speakers to determine whether women had
to be more experienced in the field or have higher status than men to be invited to present
Non-chair speakers by definition were invited to present Speakers whose academic rank was
not identified whose rank was classified as ldquootherrdquo or who held non-academic positions were
not included in this analysis This left 2381 invited speakers 1389 men (583) and 992 women
(417)
Contrary to the hypothesis a Mann-Whitney test revealed that women invited speakers
(Mdn = 300) were of lower rank than men invited speakers (Mdn = 400) U = 52733500 Z = -
10065 p lt 001 r = 21 The distributions of men and women invited speakers were not equal
at different career stages χ2(4) = 10472 p lt 001 Cramerrsquos V = 10 As shown in Figure 2
congruent with the fact that the majority of individuals receiving social psychology PhDs during
this time period were women invited speakers who were graduate students were more likely to
be women than men t(418) = 341 p = 001 d = 17 Invited speakers who were postdocs were
just as likely to be women as to be men t(184) = 037 p = 71 d = 03 In all faculty categories
(ie assistant associate and full professor) invited speakers were more likely to be men with
the gender gap growing from assistant professors t(661) = -353 p lt 001 d = 14 to associate
professors t(426) = -419 p lt 001 d = 20 to full professors t(687) = -1249 p lt 001 d = 48
WOMENrsquoS REPRESENTATION AT AN ACADEMIC CONFERENCE 17
These findings highlight the importance of academic rank in understanding womenrsquos
representation at the SPSP conference They are best interpreted in conjunction with
information about the percentage of women at different academic ranks in the broader
population so we later explore the role of academic rank for Hypothesis 5
H3 There are more women invited speakers on symposia with women chairs
Of the 8395 symposia with speakers who were not also chairs 337 (402) had all men
chairs 212 (253) had a mix of men and women chairs and 290 (364) had all women chairs
A Kruskal-Wallis test revealed that the gender of the chairs was related to the gender of the
invited speakers p lt 001 When all chairs were men 338 (SD = 294) of the invited
speakers in a symposium were women This percentage increased as the proportion of women
chairs increased to 425 (SD = 328) when there was a mix of men and women chairs and
496 (SD = 330) when there were only women chairs6
As shown in Figure 3 a chi-square test testing the hypothesis that the distributions of
the proportion of women invited speakers in symposia were the same across the different
proportions of women chairs revealed that women were more likely to be invited speakers in
symposia with at least one woman chair χ2(18)= 8406 p lt 001 Cramerrsquos V = 077
5One accepted symposium had four speakers (all men) who were all also chairs of the symposium 6The percentage of women invited speakers is lower than the percentage of women speakers because
more women chairs (749) than men chairs (674) were also speakers in their own symposium χ2(1) = 892 p = 003
7It could be argued that a more stringent test would only consider symposia with 2 or more chairs Of the 479 symposia with 2 or more chairs 146 (305) had all men chairs 212 (443) had a mix of men and women chairs and 121 (253) had all women chairs Again a Kruskal-Wallis test revealed that the gender of the chairs influenced the gender of the invited speakers p = 002 with 326 women invited speakers for all men chairs 425 for a mix and 468 for all women chairs and the distributions of the proportion of women speakers differed across the different proportions of women chairs χ2(14) = 3174 p = 004
WOMENrsquoS REPRESENTATION AT AN ACADEMIC CONFERENCE 18
H4 Gender representation differs by topic
We predicted that womenrsquos representation would differ by topic area We used one-
sample t-tests to compare the average percentage of women speakers in symposia associated
with each keyword to 50 (Since the keyword ldquootherrdquo does not represent a substantive topic
we will not discuss results for it though it is included in Table 3 for reference) As shown in
Table 3 the percentage of women deviated significantly from 50 for 15 of the 30 substantive
keywords Only three topics had on average more women than men speakers in their associated
symposia For the 15 most frequently occurring substantive keywords statistically significant
differences were found 8 times with six topics (social cognition motivation methods self-
regulation norms and social influence and judgment and decision-making) having majority
men speakers and two topics (close relationships and stereotypingprejudice) having majority
women speakers
We predicted that perceptions of a topic area as stereotypically masculine versus
feminine would be associated with the percentage of women speakers (Diekman et al 2011)
To test this we conducted a brief study examining social and personality psychologistsrsquo
perceptions of the 15 most frequently occurring substantive keywords (which were each
associated with at least 50 symposia) Social and personality psychologists were recruited via
Facebook and the SPSP Connect Forum for a study of ldquoPerceptions of Social and Personality
Psychologyrdquo Participants (N = 101) completed a Qualtrics survey online in which they were
presented with a list of these 15 keywords (presented in random order) and asked to rate how
well each of six adjectives (competitive collaborative quantitative creative high-status
prosocial) described each of the areas Participants responded using a 5-point scale (1 = not at
WOMENrsquoS REPRESENTATION AT AN ACADEMIC CONFERENCE 19
all descriptive 2 = a little descriptive 3 = somewhat descriptive 4 = mostly descriptive 5 = very
descriptive) Ratings of competitive and quantitative (r(13) = 55 p = 03) were averaged for a
measure of how stereotypically masculine a topic was and ratings of prosocial and collaborative
(r(13) = 60 p = 02) were averaged for a measure of how stereotypically female a topic was (see
Table 3 for means by keyword) These two measures were negatively correlated r(13) = -82 p
lt 001 We then tested whether gender representation was associated with perceptions of
topic areas Topics rated as more stereotypically feminine had a higher percentage of women
speakers r(13) = 86 p lt 001 and topics rated as more stereotypically masculine had a lower
percentage of women speakers r(13) = -60 p = 02 There were no significant correlations
between the percentage of women speakers and perceptions of how much a topic was
described as high status r(13) = -34 p = 21 or creative r(13) = -27 p = 33 While these
results cannot speak to causality they do provide one framework for understanding differences
in gender representation
Underrepresentation
Womenrsquos underrepresentation relative to the population in the field was examined
among three groups speakers in accepted symposia speakers in submitted symposia and
chairs in submitted symposia We used demographic information about 2015 SPSP
membership as a comparison baseline Reliable demographic data on SPSP membership for
other years was not available as response rates to voluntary surveys were low (less than 60)
or data were not maintained (C Rummel personal communication August 24 2016) In 2015
SPSP reported that women constituted 5625 of the SPSP membership
WOMENrsquoS REPRESENTATION AT AN ACADEMIC CONFERENCE 20
Womenrsquos representation in accepted versus rejected symposia was also compared to
determine if acceptance decisions were related to the percentage of women speakers in a
symposium
Finally for each group we examined underrepresentation at each academic rank Post-
doctoral students and lecturers were excluded from these comparisons because data on base-
rates by gender were not available For graduate students we used data from years 2003-2014
(2015 data were not yet available) of the annual census of US social psychology PhD recipients
by the National Science Foundation (the Survey of Earned Doctorates) as we could not obtain
data on the gender distribution among social and personality graduate students For assistant
associate and full professors we used data from years 2004-2014 (2003 and 2015 data were
unavailable) of the annual survey of US graduate departments8 by the APA Center for
Workforce Studies (the Faculty Salary Survey) By averaging across the available years of data
for a given academic rank we arrived at base-rates of 647 women for graduate students
508 women for assistant professors 458 women for associate professors and 281
women for full professors
H5a Women are underrepresented as speakers in accepted symposia
A one-sample t-test comparing the average percentage of women speakers in 2015
accepted symposia (n = 81 M = 502 SD = 288) to the percentage of women SPSP members
8These survey data include only colleges with a masters or doctoral program Across US academic fields
women are better represented at institutions that only reward bachelors or associates degrees (versus those with graduate programs American Association of University Professors 2015) so womenrsquos representation at different faculty ranks in the population is likely underestimated In this way our analyses are conservative tests of underrepresentation by rank
WOMENrsquoS REPRESENTATION AT AN ACADEMIC CONFERENCE 21
in 2015 revealed a marginally significant difference such that women were underrepresented
relative to the SPSP membership t(80) = -189 p = 063 CIdif [003 124] d = 21
Next underrepresentation of women as speakers in accepted symposia by rank relative
to the base-rates listed above was examined Women were underrepresented among
graduate student speakers (M = 585 SD = 493 t(708) = -333 p = 001 d = 13) assistant
professors speakers (M = 449 SD = 497 t(961) = -367 p lt 001 d = 12) and associate
professors speakers (M = 393 SD = 489 t(518) = -303 p = 003 d = 13) However women
were well-represented among full professor speakers (M = 290 SD = 454) t(815) = 059 p
= 55 d = 02) In short women were underrepresented as speakers in accepted symposia at
every academic rank relative to the population except at the highest rank of full professor
H5b Women are underrepresented as speakers in submitted symposia
A one-sample t-test revealed that the average percentage of women speakers (M =
518 SD = 271) in all submitted symposia in 2015 (n = 244) differed significantly from the
percentage of women SPSP members t(243) = -256 p = 01 CIdif [10 78] d = 16
Next we examined underrepresentation in all submitted symposia in 2014 and 2015 by
rank Women were well-represented among graduate student speakers (M = 608 SD =
489 t(548) = -185 p = 06 d = 08) assistant professor speakers (M = 518 SD = 500
t(443) = 042 p = 67 d = 02) and associate professor speakers (M = 464 SD = 500 t(251)
= 020 p = 84 d = 01) However women were overrepresented among full professor speakers
(M = 395 SD = 490) t(285) = 394 p lt 001 d = 23
H5c Women are underrepresented as chairs in submitted symposia
WOMENrsquoS REPRESENTATION AT AN ACADEMIC CONFERENCE 22
To test whether women were underrepresented as chairs we compared for 2015 the
average percentage of women chairs9 (M = 529 SD = 412) in submitted symposia (n = 244)
to womenrsquos membership in SPSP that year A one-sample t-test revealed that these two
percentages did not differ significantly t(243) = -128 p = 20 CIdif [-18 86] d = 08 That is
in 2015 women were chairing and submitting symposia at a rate proportional to their
percentage of the SPSP membership and were not underrepresented as applicants
Next we examined underrepresentation in all submitted symposia in 2014 and 2015 by
rank Women were underrepresented among assistant professor chairs (M = 422 SD =
495 t(191) = -241 p = 02 d = 17) but well represented among graduate student chairs (M
= 631 SD = 484 t(232) = -051 p = 61 d = 03) and associate professor chairs (M = 461
SD = 501 t(114) = 006 p = 95 d = 01) Women were overrepresented among full professor
chairs (M = 509 SD = 502) t(109) = 476 p lt 001 d = 45 As in the previous analysis of
speakers in submitted symposia women were overrepresented at the highest rank as chairs in
submitted symposia Additionally they were underrepresented at the rank of assistant
professor
H5d Gender representation in symposia influences acceptance
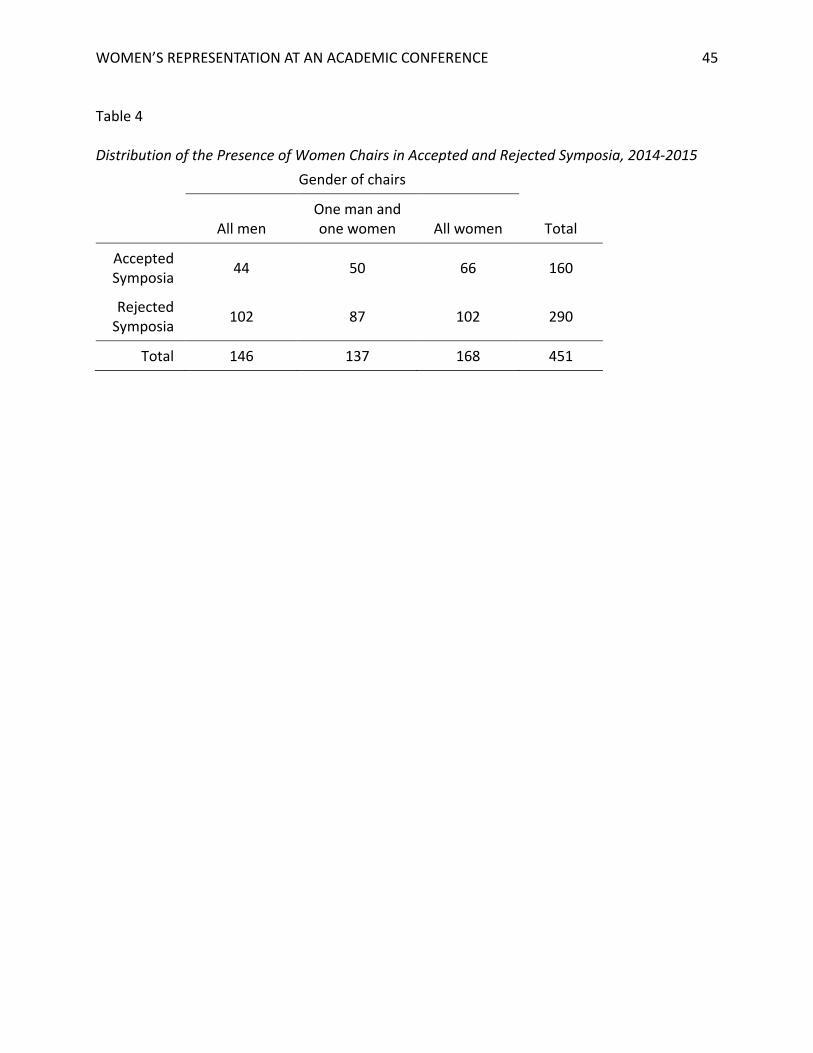
We compared gender representation in accepted (n = 160) and rejected (n = 291)
symposia using data from 2014 and 2015 The average percentage of women speakers in
accepted symposia (517 SD = 284) and rejected symposia (531 SD = 275) did not
9For simplicity we assume that in the case of multiple chairs both chairs were active as applicants If only
the gender of the person listed as the first chair is examined the average percentage of women first chairs in symposia submitted in 2015 (M = 564 SD = 497) also did not differ from womenrsquos membership in SPSP that year t(242) = 004 p =97
WOMENrsquoS REPRESENTATION AT AN ACADEMIC CONFERENCE 23
differ significantly t(449) = 053 p =60 CIdif [-39 69] d = 003 Thus for 2014 and 2015
there was no evidence consistent with bias against women speakers at the level of accepting
versus rejecting symposia
To examine whether the gender of a symposiumrsquos chairs influenced whether it was
accepted a chi-square test compared the gender mix of chairs in accepted and rejected
symposia (see Table 4) The distribution of women chairs was the same across accepted and
rejected symposia χ2(2) = 295 p = 23 Cramerrsquos V = 06 If anything a marginally significant
correlation suggests that the likelihood of a symposia being accepted increased with the
percentage of women chairs r(449) = 08 p = 09
H6 Womenrsquos representation has changed over time
To understand how patterns of representation changed over time we examined some of
the previous hypotheses using longitudinal analyses
We previously found that there were more men than women speakers (H1a) and a
tendency toward more men than women chairs (H1b) To test whether these patterns changed
over time we conducted one-way ANOVAs on the average percentage of women speakers and
chairs in symposia with year as a between-subjects factor As can be seen in Table 1 over time
the increase in the percentage of women speakers in symposia was significant F(12 827) =
219 p = 01 η2 = 03 for linear contrast p lt 001 η2 = 01 and the increase in the percentage of
women chairs was marginally significant F(12 827) = 173 p = 06 η2 = 02 for linear contrast p
lt 001 η2 = 01
We previously found that among invited speakers women were of lower academic rank
than men (H2) To examine this pattern over time we conducted a 2 (gender) x 13 (year)
WOMENrsquoS REPRESENTATION AT AN ACADEMIC CONFERENCE 24
between-subjects ANOVA on the average rank of invited speakers In addition to confirming the
previous finding that men were of higher rank than women F(1 2355) = 9714 p lt 001 η2 =
04 a significant main effect of year emerged F(12 2355) = 331 p lt 001 η2 = 02 A linear
contrast revealed that over time the average rank of invited speakers decreased p lt 001 η2 =
02 as can be seen in Table 1 There was no evidence that rank differences between men and
women invited speakers changed over time as the two-way interaction was nonsignificant
F(12 2355) = 044 p = 95 η2 = 002
In a more liberal test of this question we ran a series of one-way ANOVAs looking at the
effect of year on the percentage of women among invited speakers at each of the five academic
ranks There was no significant effect of year on the percentage of women among invited
speakers who were graduate students F(12 406) = 071 p = 75 η2 = 02 postdocs F(12 172) =
038 p = 97 η2 = 03 assistant professors F(12 649) = 051 p = 91 η2 = 01 associate
professors F(12 414) = 085 p = 60 η2 = 02 or full professors F(12 675) = 147 p = 13 η2 =
03 Again we found no evidence that rank differences between men and women invited
speakers changed over time
We previously found that symposia with more men chairs had fewer women invited
speakers (H3) To test whether this association changed over time we conducted a 3 (chairsrsquo
gender all men mix of men and women all women) x 13 (year) between-subjects ANOVA on
the average percentage of women invited speakers in symposia We replicated the earlier effect
of chairsrsquo gender F(2 800) = 1617 p lt 001 η2 = 02 This pattern was not moderated by year
F(24 800) = 049 p = 98 η2 = 005 and there was no significant main effect of year F(12 800) =
WOMENrsquoS REPRESENTATION AT AN ACADEMIC CONFERENCE 25
137 p = 17 η2 = 007 The pattern in which symposia that had more men chairs had fewer
women invited speakers did not appear to change over time
To summarize womenrsquos representation as speakers and chairs in accepted symposia has
increased over the 13-year period examined However gender differences in the academic rank
of invited speakers in a symposium remained steady as did the association between chair
gender and invited speaker gender
H7a Women presenters have less access to non-overlapping resources (ie their networks have
fewer structural holes) than men presenters
H7b Women presenters are less connected to social resources (ie have lower degree
centrality) than men presenters
To test these hypotheses we employed social network analysis (SNA Wasserman amp
Faust 1994) The analysis examined all co-occurrences on symposia between all presenters on
accepted symposia from 2003-2015 First we examined the extent to which presenters had
structural holes in their co-presenting network indicating their access to non-overlapping
resources The extent of structural holes was calculated using the constraint model (see Wang
et al 2014 for relevant formulas) taking into account the size of a personrsquos co-presenting
network and the degree to which that personrsquos co-presenters were directly or indirectly
connected to one another Women (n = 886) had fewer structural holes in their co-presenting
networks (M = 153 SD = 023) than men (n = 1014 M = 157 SD = 024) t(1898) = -331 p
lt001 CIdif [-0056 -0014] d = 17 Womenrsquos co-presenting networks offered access to fewer
unique resources than did menrsquos
WOMENrsquoS REPRESENTATION AT AN ACADEMIC CONFERENCE 26
Next we examined the number of different resources and connections presenters had
using degree centrality the number of co-occurrences on symposia with different people
Women had lower degree centrality (M = 623 SD = 557) than men (M = 715 SD = 601)
t(1898) = -344 p lt 001 CIdif [-144 -039] d = 016 Thus women were less central in the field
and had connections to fewer resources than did men
As the women in our sample are on average of lower academic rank than the men
differences in social networks between genders might be explained by differences in rank To
test this possibility we regressed a presentersrsquo highest academic rank10 while at the SPSP
conference the presenterrsquos gender and the interaction of the two onto the measures of
structural holes and degree centrality Only presenters who had been in an academic position
(eg graduate student) while presenting (n = 1880) were included in these analyses all non-
academic positions were coded as missing values Academic rank was positively related to the
number of structural holes beta = 003 SE = 001 t(1876) = 681 p lt 001 but gender no longer
had a significant effect beta = -003 SE = 002 t(1876) = -124 p = 22 and their interaction
was not significant beta = 001 SE = 002 t(1876) = 092 p = 36 Similarly academic rank was
positively related to degree centrality beta = 084 SE = 013 t(1876) = 669 p lt 001 but
gender no longer had a significant effect beta = -100 SE = 060 t(1876) = -168 p = 09 and
their interaction was not significant beta = 025 SE = 019 t(1876) = 136 p = 17 This suggests
that the previously found differences in the networks of men and women presenters were
accounted for by womenrsquos lower average academic rank
Discussion
10Results are similar if the presenterrsquos average academic rank across appearances is used
WOMENrsquoS REPRESENTATION AT AN ACADEMIC CONFERENCE 27
Social psychology is the scientific study of people and how they are affected by their
environments As such the science should be informed by a diversity of voices and
perspectives The present research considers one facet of diversity by examining gender
representation in SPSP symposia from 2003 to 2015 as well as exploring the characteristics of
symposia such as topic area and chair gender
The Big Picture Women are Underrepresented but Not Always
At the highest level of analysis the overall picture was mixed There were reasons for
optimism and areas for improvement On the one hand across all symposia there were more
men speakers than women speakers When walking into a symposium 28 of the time
audience members saw only one woman presenting her research and 155 of the time no
women at all In addition although many junior women participated in SPSP symposia women
were underrepresented at every rank except the full professor level relative to their
percentage in the population Finally men chairs were more likely to invite other men to speak
in their symposia than to invite other women This last effect is notable given that there were
previously only two ways to speak at the SPSP conference 1) organize a symposium or 2) be
invited to speak in someone elsersquos symposium
On the other hand the disparities were not large as can be seen from our effect sizes
and the representation of women has increased over time In 2015 women were organizing
and submitting symposia as chairs at a rate proportional to their membership in SPSP In
addition in the years tested having more women speakers or women chairs did not affect the
likelihood that a symposium was accepted The latter analysis is based on only two years of
data and the programs from those years are confounded with the motivations of the program
WOMENrsquoS REPRESENTATION AT AN ACADEMIC CONFERENCE 28
chairs (in 2014 the program chairs actively attended to gender issues in creating the
conference review panel and program [C Kaiser personal communication April 27 2016])
limiting the conclusions that can be drawn However this finding does suggest as other fields
have found (Casadevall 2015) that conscious attention to the gender representation of panels
can have meaningful effects
Analysis of symposia by topic likewise provided a mixed picture of gender
representation Among the 15 most common topics two (close relationships and
stereotypingprejudice) had on average significantly more women speakers than men speakers
on their symposia and seven did not significantly deviate from 5050 representation
(selfidentity emotion culture intergroup relations mental healthwell-being social
neuroscience and groupsintragroup processespower) However six topics (social cognition
motivation methods self-regulation norms and social influence and judgment and decision-
making) had on average significantly more men speakers than women speakers on their
symposia We did not have base-rate information for the population of social psychologists
studying each topic so could not test underrepresentation relative to any population As
prolific researchers often presented on several topic areas base-rate information may not be
useful We do know that perceptions of topic areas as collaborative and prosocial were
positively associated with womenrsquos representation and perceptions of topic areas as
competitive and quantitative were negatively associated with womenrsquos representation Just as
low participation of women and minorities in STEM disciplines is a concern researchers in areas
with low womenrsquos participation may use these findings to consider issues of parity as a lack of
WOMENrsquoS REPRESENTATION AT AN ACADEMIC CONFERENCE 29
diversity in researchers may constrain the kinds of research questions that are pursued and the
creativity of the field (eg Inbar amp Lammers 2012)
Looking at representation over time provided reasons for both optimism and concern
Representation of women is increasing over time However in the 13 years of conference data
studied there was no evidence that the pattern of women being underrepresented as speakers
at all ranks except full professor was changing Differences between men and women in
productivity and impact (Brown amp Goh 2016 Cikara et al 2012 Eagly amp Miller in press Nosek
et al 2010) may explain overall gender differences in representation but cannot explain why
these gender differences disappear among full professors as men full professors still publish
more and are better cited than women full professors (Eagly amp Miller in press) Another
potential explanation for this pattern is that women must be more established and successful
than men to be invited to join a symposium (Banaji amp Greenwald 1995 Biernat et al 1991)
Or less senior women may be more likely to turn down invitations to speak (Schroeder et
al2013) because of childbearing and family obligations more common at those ages that may
reduce their ability to attend conferences (Xu amp Martin 2011) Future research should test
these and other explanations
To further understand womenrsquos professional progress we explored their access to
professional resources through examination of their professional networks In the present
analysis we found that menrsquos and womenrsquos co-presenting networks and therefore resources
available to them differed Women were on symposia with fewer different individuals and
with individuals that likely had overlapping resources Men on the other hand were on
symposia with researchers who were more independent from one another which likely
WOMENrsquoS REPRESENTATION AT AN ACADEMIC CONFERENCE 30
increased the range of resources to which they had access These gender differences
disappeared when the lower average academic rank of women was taken into account
suggesting that these deficiencies in womenrsquos networks may decrease and eventually disappear
as more women achieve more senior academic positions This analysis reflected how women
and men interacted with their colleagues in the past further understanding of network
influence could help increase parity in the field
Future Actions
In addition to suggesting future research directions these results point to a number of
actions that could be taken by those who convene and organize conferences Encouragingly
the organizers of the SPSP conference have recently adopted some of these actions11 in
addition to greater vigilance and attention on the part of symposia chairs and program
committees For example in the years under review the only way to speak at the SPSP
conference was as part of a symposium which relies heavily on having or creating a network
Such a policy may disadvantage women for several reasons Women may be less likely to be
invited as speakers because they are less central in social networks and have a less diverse set
of connections than men as suggested by our co-presenting network data Furthermore men
chairs are less likely to invite women to speak than to invite men but women chairs do not
evidence a parallel preference in favor of women speakers This means that even if women are
well-represented as chairs (as was true in recent years see Table 1) they will be
underrepresented as speakers In addition women organizing symposia may have greater
11In 2014 preliminary analyses of these data were provided to the SPSP Program Committee for the 2015
conference and in 2016 these results were presented at the SPSP conference and to the SPSP Executive Committee
WOMENrsquoS REPRESENTATION AT AN ACADEMIC CONFERENCE 31
difficulty recruiting and attracting high-status speakers or speakers outside their network than
men SPSP created opportunities for submitting single-paper oral presentations to the 2017
conference in addition to symposia which could address these issues by reducing reliance on
social networks reducing the role of symposia chairs as gatekeepers and making it easier to
submit a presentation
In addition to changing the structure of the submission process in 2015 SPSP adopted a
double-blind review procedure Prior to this reviewers knew the identities of the submitting
authors limiting reviewersrsquo ability to assess symposia quality independent of biases associated
with author characteristics12 For example reviewers might have been biased towards
individuals who were members of their social networks or were of high status In addition
gender bias could have emerged as research of similar quality may receive lower ratings when
attributed to a woman scientist versus a man scientist (Knobloch-Westerwick et al 2013
Roberts amp Verhoef 2016)
Finally these analyses speak to the representation of women as speakers at the SPSP
conference but could not speak to the overall representation of women at the conference
(eg as attendees as poster presenters) or to the representation of other minority group
members Not only was it beyond the scope of the present research to examine poster
presentations but demographic information about submissions or attendees had not been
obtained or maintained by SPSP It is heartening that in response to requests for greater
12We did not find evidence of this policy change affecting the relationship between gender representation
and acceptance decisions in our limited data The difference between accepted and rejected symposia in percentage of women speakers was nonsignificant for 2014 F(1 205) = 002 p = 88 and 2015 F(1 242) = 043 p = 51 and the magnitude of this difference did not change between the two years F(1 447) = 011 p = 75
WOMENrsquoS REPRESENTATION AT AN ACADEMIC CONFERENCE 32
transparency and revelations of unequal representation the SPSP program committee has
begun to collect demographic information on membership attendees and submissions which
should aid future research
Significance and Conclusions
Our data fit a larger pattern of recent work suggesting that womenrsquos impact on
psychology is less than that of menrsquos (Brown amp Goh 2016 Cikara et al 2012 Eagly amp Miller in
press Nosek et al 2010) Here we focused only on women but with accurate and transparent
tracking of other demographic variables a fuller picture of who is presenting at the conference
and whether that representation is equitable can emerge Representation matters For
individuals presenting research at a conference increases the likelihood that research will be
read (de Leon amp McQuillin 2015) and cited (Winnik et al 2012) Given that citation counts are
often considered when measuring the impact of a researcherrsquos work and factored into hiring
retention and promotion decisions increasing citation counts increases the likelihood of
professional success Although we cannot directly attribute differences to fewer conference
appearances recent research has shown that womenrsquos research is cited less than menrsquos in
general (Lariviere Ni Gingras Cronin amp Sugimoto 2013) and specifically in social and
personality psychology (Eagly amp Miller in press Nosek et al 2010)
For the audience the identity of speakers matters (Murphy Steele amp Gross 2007
Sonnert Fox amp Adkins 2007) At early career stages individuals are working to create a viable
self-concept and construe role models as guides to the kinds of attributes they want to acquire
and develop In mid-career stages role models help people refine their self-concepts
Successful similar others serve as role models for individuals developing their professional self-
WOMENrsquoS REPRESENTATION AT AN ACADEMIC CONFERENCE 33
concepts (Gibson 2003 Sealy amp Singh 2006) In the absence of such role models individuals
may not gain the socialization necessary for success Relatedly exposure to similar successful
and counter-stereotypic women has been shown to change womenrsquos self-concepts and reduce
negative self-stereotypes (Asgari et al 2012 Dasgupta amp Ansari 2004) Finally role model
gender has more impact on women than men (Lockwood 2006)
For these and many other reasons we should attend to the visibility of women and
other minority groups in positions of status Social psychology is the study of humanity in
different situations because we know that who we are affects what we study (eg Inbar amp
Lammers 2012) social psychologists should represent all aspects of humanity and a wide range
of lived experiences
WOMENrsquoS REPRESENTATION AT AN ACADEMIC CONFERENCE 34
References
American Association of University Professors (2015 March-April) The compensation survey
(Survey report Table 12) Academe 101(2) Retrieved from
H2 Women invited speakers are of higher status than men invited speakers
We examined the academic rank of invited speakers to determine whether women had
to be more experienced in the field or have higher status than men to be invited to present
Non-chair speakers by definition were invited to present Speakers whose academic rank was
not identified whose rank was classified as ldquootherrdquo or who held non-academic positions were
not included in this analysis This left 2381 invited speakers 1389 men (583) and 992 women
(417)
Contrary to the hypothesis a Mann-Whitney test revealed that women invited speakers
(Mdn = 300) were of lower rank than men invited speakers (Mdn = 400) U = 52733500 Z = -
10065 p lt 001 r = 21 The distributions of men and women invited speakers were not equal
at different career stages χ2(4) = 10472 p lt 001 Cramerrsquos V = 10 As shown in Figure 2
congruent with the fact that the majority of individuals receiving social psychology PhDs during
this time period were women invited speakers who were graduate students were more likely to
be women than men t(418) = 341 p = 001 d = 17 Invited speakers who were postdocs were
just as likely to be women as to be men t(184) = 037 p = 71 d = 03 In all faculty categories
(ie assistant associate and full professor) invited speakers were more likely to be men with
the gender gap growing from assistant professors t(661) = -353 p lt 001 d = 14 to associate
professors t(426) = -419 p lt 001 d = 20 to full professors t(687) = -1249 p lt 001 d = 48
WOMENrsquoS REPRESENTATION AT AN ACADEMIC CONFERENCE 17
These findings highlight the importance of academic rank in understanding womenrsquos
representation at the SPSP conference They are best interpreted in conjunction with
information about the percentage of women at different academic ranks in the broader
population so we later explore the role of academic rank for Hypothesis 5
H3 There are more women invited speakers on symposia with women chairs
Of the 8395 symposia with speakers who were not also chairs 337 (402) had all men
chairs 212 (253) had a mix of men and women chairs and 290 (364) had all women chairs
A Kruskal-Wallis test revealed that the gender of the chairs was related to the gender of the
invited speakers p lt 001 When all chairs were men 338 (SD = 294) of the invited
speakers in a symposium were women This percentage increased as the proportion of women
chairs increased to 425 (SD = 328) when there was a mix of men and women chairs and
496 (SD = 330) when there were only women chairs6
As shown in Figure 3 a chi-square test testing the hypothesis that the distributions of
the proportion of women invited speakers in symposia were the same across the different
proportions of women chairs revealed that women were more likely to be invited speakers in
symposia with at least one woman chair χ2(18)= 8406 p lt 001 Cramerrsquos V = 077
5One accepted symposium had four speakers (all men) who were all also chairs of the symposium 6The percentage of women invited speakers is lower than the percentage of women speakers because
more women chairs (749) than men chairs (674) were also speakers in their own symposium χ2(1) = 892 p = 003
7It could be argued that a more stringent test would only consider symposia with 2 or more chairs Of the 479 symposia with 2 or more chairs 146 (305) had all men chairs 212 (443) had a mix of men and women chairs and 121 (253) had all women chairs Again a Kruskal-Wallis test revealed that the gender of the chairs influenced the gender of the invited speakers p = 002 with 326 women invited speakers for all men chairs 425 for a mix and 468 for all women chairs and the distributions of the proportion of women speakers differed across the different proportions of women chairs χ2(14) = 3174 p = 004
WOMENrsquoS REPRESENTATION AT AN ACADEMIC CONFERENCE 18
H4 Gender representation differs by topic
We predicted that womenrsquos representation would differ by topic area We used one-
sample t-tests to compare the average percentage of women speakers in symposia associated
with each keyword to 50 (Since the keyword ldquootherrdquo does not represent a substantive topic
we will not discuss results for it though it is included in Table 3 for reference) As shown in
Table 3 the percentage of women deviated significantly from 50 for 15 of the 30 substantive
keywords Only three topics had on average more women than men speakers in their associated
symposia For the 15 most frequently occurring substantive keywords statistically significant
differences were found 8 times with six topics (social cognition motivation methods self-
regulation norms and social influence and judgment and decision-making) having majority
men speakers and two topics (close relationships and stereotypingprejudice) having majority
women speakers
We predicted that perceptions of a topic area as stereotypically masculine versus
feminine would be associated with the percentage of women speakers (Diekman et al 2011)
To test this we conducted a brief study examining social and personality psychologistsrsquo
perceptions of the 15 most frequently occurring substantive keywords (which were each
associated with at least 50 symposia) Social and personality psychologists were recruited via
Facebook and the SPSP Connect Forum for a study of ldquoPerceptions of Social and Personality
Psychologyrdquo Participants (N = 101) completed a Qualtrics survey online in which they were
presented with a list of these 15 keywords (presented in random order) and asked to rate how
well each of six adjectives (competitive collaborative quantitative creative high-status
prosocial) described each of the areas Participants responded using a 5-point scale (1 = not at
WOMENrsquoS REPRESENTATION AT AN ACADEMIC CONFERENCE 19
all descriptive 2 = a little descriptive 3 = somewhat descriptive 4 = mostly descriptive 5 = very
descriptive) Ratings of competitive and quantitative (r(13) = 55 p = 03) were averaged for a
measure of how stereotypically masculine a topic was and ratings of prosocial and collaborative
(r(13) = 60 p = 02) were averaged for a measure of how stereotypically female a topic was (see
Table 3 for means by keyword) These two measures were negatively correlated r(13) = -82 p
lt 001 We then tested whether gender representation was associated with perceptions of
topic areas Topics rated as more stereotypically feminine had a higher percentage of women
speakers r(13) = 86 p lt 001 and topics rated as more stereotypically masculine had a lower
percentage of women speakers r(13) = -60 p = 02 There were no significant correlations
between the percentage of women speakers and perceptions of how much a topic was
described as high status r(13) = -34 p = 21 or creative r(13) = -27 p = 33 While these
results cannot speak to causality they do provide one framework for understanding differences
in gender representation
Underrepresentation
Womenrsquos underrepresentation relative to the population in the field was examined
among three groups speakers in accepted symposia speakers in submitted symposia and
chairs in submitted symposia We used demographic information about 2015 SPSP
membership as a comparison baseline Reliable demographic data on SPSP membership for
other years was not available as response rates to voluntary surveys were low (less than 60)
or data were not maintained (C Rummel personal communication August 24 2016) In 2015
SPSP reported that women constituted 5625 of the SPSP membership
WOMENrsquoS REPRESENTATION AT AN ACADEMIC CONFERENCE 20
Womenrsquos representation in accepted versus rejected symposia was also compared to
determine if acceptance decisions were related to the percentage of women speakers in a
symposium
Finally for each group we examined underrepresentation at each academic rank Post-
doctoral students and lecturers were excluded from these comparisons because data on base-
rates by gender were not available For graduate students we used data from years 2003-2014
(2015 data were not yet available) of the annual census of US social psychology PhD recipients
by the National Science Foundation (the Survey of Earned Doctorates) as we could not obtain
data on the gender distribution among social and personality graduate students For assistant
associate and full professors we used data from years 2004-2014 (2003 and 2015 data were
unavailable) of the annual survey of US graduate departments8 by the APA Center for
Workforce Studies (the Faculty Salary Survey) By averaging across the available years of data
for a given academic rank we arrived at base-rates of 647 women for graduate students
508 women for assistant professors 458 women for associate professors and 281
women for full professors
H5a Women are underrepresented as speakers in accepted symposia
A one-sample t-test comparing the average percentage of women speakers in 2015
accepted symposia (n = 81 M = 502 SD = 288) to the percentage of women SPSP members
8These survey data include only colleges with a masters or doctoral program Across US academic fields
women are better represented at institutions that only reward bachelors or associates degrees (versus those with graduate programs American Association of University Professors 2015) so womenrsquos representation at different faculty ranks in the population is likely underestimated In this way our analyses are conservative tests of underrepresentation by rank
WOMENrsquoS REPRESENTATION AT AN ACADEMIC CONFERENCE 21
in 2015 revealed a marginally significant difference such that women were underrepresented
relative to the SPSP membership t(80) = -189 p = 063 CIdif [003 124] d = 21
Next underrepresentation of women as speakers in accepted symposia by rank relative
to the base-rates listed above was examined Women were underrepresented among
graduate student speakers (M = 585 SD = 493 t(708) = -333 p = 001 d = 13) assistant
professors speakers (M = 449 SD = 497 t(961) = -367 p lt 001 d = 12) and associate
professors speakers (M = 393 SD = 489 t(518) = -303 p = 003 d = 13) However women
were well-represented among full professor speakers (M = 290 SD = 454) t(815) = 059 p
= 55 d = 02) In short women were underrepresented as speakers in accepted symposia at
every academic rank relative to the population except at the highest rank of full professor
H5b Women are underrepresented as speakers in submitted symposia
A one-sample t-test revealed that the average percentage of women speakers (M =
518 SD = 271) in all submitted symposia in 2015 (n = 244) differed significantly from the
percentage of women SPSP members t(243) = -256 p = 01 CIdif [10 78] d = 16
Next we examined underrepresentation in all submitted symposia in 2014 and 2015 by
rank Women were well-represented among graduate student speakers (M = 608 SD =
489 t(548) = -185 p = 06 d = 08) assistant professor speakers (M = 518 SD = 500
t(443) = 042 p = 67 d = 02) and associate professor speakers (M = 464 SD = 500 t(251)
= 020 p = 84 d = 01) However women were overrepresented among full professor speakers
(M = 395 SD = 490) t(285) = 394 p lt 001 d = 23
H5c Women are underrepresented as chairs in submitted symposia
WOMENrsquoS REPRESENTATION AT AN ACADEMIC CONFERENCE 22
To test whether women were underrepresented as chairs we compared for 2015 the
average percentage of women chairs9 (M = 529 SD = 412) in submitted symposia (n = 244)
to womenrsquos membership in SPSP that year A one-sample t-test revealed that these two
percentages did not differ significantly t(243) = -128 p = 20 CIdif [-18 86] d = 08 That is
in 2015 women were chairing and submitting symposia at a rate proportional to their
percentage of the SPSP membership and were not underrepresented as applicants
Next we examined underrepresentation in all submitted symposia in 2014 and 2015 by
rank Women were underrepresented among assistant professor chairs (M = 422 SD =
495 t(191) = -241 p = 02 d = 17) but well represented among graduate student chairs (M
= 631 SD = 484 t(232) = -051 p = 61 d = 03) and associate professor chairs (M = 461
SD = 501 t(114) = 006 p = 95 d = 01) Women were overrepresented among full professor
chairs (M = 509 SD = 502) t(109) = 476 p lt 001 d = 45 As in the previous analysis of
speakers in submitted symposia women were overrepresented at the highest rank as chairs in
submitted symposia Additionally they were underrepresented at the rank of assistant
professor
H5d Gender representation in symposia influences acceptance
We compared gender representation in accepted (n = 160) and rejected (n = 291)
symposia using data from 2014 and 2015 The average percentage of women speakers in
accepted symposia (517 SD = 284) and rejected symposia (531 SD = 275) did not
9For simplicity we assume that in the case of multiple chairs both chairs were active as applicants If only
the gender of the person listed as the first chair is examined the average percentage of women first chairs in symposia submitted in 2015 (M = 564 SD = 497) also did not differ from womenrsquos membership in SPSP that year t(242) = 004 p =97
WOMENrsquoS REPRESENTATION AT AN ACADEMIC CONFERENCE 23
differ significantly t(449) = 053 p =60 CIdif [-39 69] d = 003 Thus for 2014 and 2015
there was no evidence consistent with bias against women speakers at the level of accepting
versus rejecting symposia
To examine whether the gender of a symposiumrsquos chairs influenced whether it was
accepted a chi-square test compared the gender mix of chairs in accepted and rejected
symposia (see Table 4) The distribution of women chairs was the same across accepted and
rejected symposia χ2(2) = 295 p = 23 Cramerrsquos V = 06 If anything a marginally significant
correlation suggests that the likelihood of a symposia being accepted increased with the
percentage of women chairs r(449) = 08 p = 09
H6 Womenrsquos representation has changed over time
To understand how patterns of representation changed over time we examined some of
the previous hypotheses using longitudinal analyses
We previously found that there were more men than women speakers (H1a) and a
tendency toward more men than women chairs (H1b) To test whether these patterns changed
over time we conducted one-way ANOVAs on the average percentage of women speakers and
chairs in symposia with year as a between-subjects factor As can be seen in Table 1 over time
the increase in the percentage of women speakers in symposia was significant F(12 827) =
219 p = 01 η2 = 03 for linear contrast p lt 001 η2 = 01 and the increase in the percentage of
women chairs was marginally significant F(12 827) = 173 p = 06 η2 = 02 for linear contrast p
lt 001 η2 = 01
We previously found that among invited speakers women were of lower academic rank
than men (H2) To examine this pattern over time we conducted a 2 (gender) x 13 (year)
WOMENrsquoS REPRESENTATION AT AN ACADEMIC CONFERENCE 24
between-subjects ANOVA on the average rank of invited speakers In addition to confirming the
previous finding that men were of higher rank than women F(1 2355) = 9714 p lt 001 η2 =
04 a significant main effect of year emerged F(12 2355) = 331 p lt 001 η2 = 02 A linear
contrast revealed that over time the average rank of invited speakers decreased p lt 001 η2 =
02 as can be seen in Table 1 There was no evidence that rank differences between men and
women invited speakers changed over time as the two-way interaction was nonsignificant
F(12 2355) = 044 p = 95 η2 = 002
In a more liberal test of this question we ran a series of one-way ANOVAs looking at the
effect of year on the percentage of women among invited speakers at each of the five academic
ranks There was no significant effect of year on the percentage of women among invited
speakers who were graduate students F(12 406) = 071 p = 75 η2 = 02 postdocs F(12 172) =
038 p = 97 η2 = 03 assistant professors F(12 649) = 051 p = 91 η2 = 01 associate
professors F(12 414) = 085 p = 60 η2 = 02 or full professors F(12 675) = 147 p = 13 η2 =
03 Again we found no evidence that rank differences between men and women invited
speakers changed over time
We previously found that symposia with more men chairs had fewer women invited
speakers (H3) To test whether this association changed over time we conducted a 3 (chairsrsquo
gender all men mix of men and women all women) x 13 (year) between-subjects ANOVA on
the average percentage of women invited speakers in symposia We replicated the earlier effect
of chairsrsquo gender F(2 800) = 1617 p lt 001 η2 = 02 This pattern was not moderated by year
F(24 800) = 049 p = 98 η2 = 005 and there was no significant main effect of year F(12 800) =
WOMENrsquoS REPRESENTATION AT AN ACADEMIC CONFERENCE 25
137 p = 17 η2 = 007 The pattern in which symposia that had more men chairs had fewer
women invited speakers did not appear to change over time
To summarize womenrsquos representation as speakers and chairs in accepted symposia has
increased over the 13-year period examined However gender differences in the academic rank
of invited speakers in a symposium remained steady as did the association between chair
gender and invited speaker gender
H7a Women presenters have less access to non-overlapping resources (ie their networks have
fewer structural holes) than men presenters
H7b Women presenters are less connected to social resources (ie have lower degree
centrality) than men presenters
To test these hypotheses we employed social network analysis (SNA Wasserman amp
Faust 1994) The analysis examined all co-occurrences on symposia between all presenters on
accepted symposia from 2003-2015 First we examined the extent to which presenters had
structural holes in their co-presenting network indicating their access to non-overlapping
resources The extent of structural holes was calculated using the constraint model (see Wang
et al 2014 for relevant formulas) taking into account the size of a personrsquos co-presenting
network and the degree to which that personrsquos co-presenters were directly or indirectly
connected to one another Women (n = 886) had fewer structural holes in their co-presenting
networks (M = 153 SD = 023) than men (n = 1014 M = 157 SD = 024) t(1898) = -331 p
lt001 CIdif [-0056 -0014] d = 17 Womenrsquos co-presenting networks offered access to fewer
unique resources than did menrsquos
WOMENrsquoS REPRESENTATION AT AN ACADEMIC CONFERENCE 26
Next we examined the number of different resources and connections presenters had
using degree centrality the number of co-occurrences on symposia with different people
Women had lower degree centrality (M = 623 SD = 557) than men (M = 715 SD = 601)
t(1898) = -344 p lt 001 CIdif [-144 -039] d = 016 Thus women were less central in the field
and had connections to fewer resources than did men
As the women in our sample are on average of lower academic rank than the men
differences in social networks between genders might be explained by differences in rank To
test this possibility we regressed a presentersrsquo highest academic rank10 while at the SPSP
conference the presenterrsquos gender and the interaction of the two onto the measures of
structural holes and degree centrality Only presenters who had been in an academic position
(eg graduate student) while presenting (n = 1880) were included in these analyses all non-
academic positions were coded as missing values Academic rank was positively related to the
number of structural holes beta = 003 SE = 001 t(1876) = 681 p lt 001 but gender no longer
had a significant effect beta = -003 SE = 002 t(1876) = -124 p = 22 and their interaction
was not significant beta = 001 SE = 002 t(1876) = 092 p = 36 Similarly academic rank was
positively related to degree centrality beta = 084 SE = 013 t(1876) = 669 p lt 001 but
gender no longer had a significant effect beta = -100 SE = 060 t(1876) = -168 p = 09 and
their interaction was not significant beta = 025 SE = 019 t(1876) = 136 p = 17 This suggests
that the previously found differences in the networks of men and women presenters were
accounted for by womenrsquos lower average academic rank
Discussion
10Results are similar if the presenterrsquos average academic rank across appearances is used
WOMENrsquoS REPRESENTATION AT AN ACADEMIC CONFERENCE 27
Social psychology is the scientific study of people and how they are affected by their
environments As such the science should be informed by a diversity of voices and
perspectives The present research considers one facet of diversity by examining gender
representation in SPSP symposia from 2003 to 2015 as well as exploring the characteristics of
symposia such as topic area and chair gender
The Big Picture Women are Underrepresented but Not Always
At the highest level of analysis the overall picture was mixed There were reasons for
optimism and areas for improvement On the one hand across all symposia there were more
men speakers than women speakers When walking into a symposium 28 of the time
audience members saw only one woman presenting her research and 155 of the time no
women at all In addition although many junior women participated in SPSP symposia women
were underrepresented at every rank except the full professor level relative to their
percentage in the population Finally men chairs were more likely to invite other men to speak
in their symposia than to invite other women This last effect is notable given that there were
previously only two ways to speak at the SPSP conference 1) organize a symposium or 2) be
invited to speak in someone elsersquos symposium
On the other hand the disparities were not large as can be seen from our effect sizes
and the representation of women has increased over time In 2015 women were organizing
and submitting symposia as chairs at a rate proportional to their membership in SPSP In
addition in the years tested having more women speakers or women chairs did not affect the
likelihood that a symposium was accepted The latter analysis is based on only two years of
data and the programs from those years are confounded with the motivations of the program
WOMENrsquoS REPRESENTATION AT AN ACADEMIC CONFERENCE 28
chairs (in 2014 the program chairs actively attended to gender issues in creating the
conference review panel and program [C Kaiser personal communication April 27 2016])
limiting the conclusions that can be drawn However this finding does suggest as other fields
have found (Casadevall 2015) that conscious attention to the gender representation of panels
can have meaningful effects
Analysis of symposia by topic likewise provided a mixed picture of gender
representation Among the 15 most common topics two (close relationships and
stereotypingprejudice) had on average significantly more women speakers than men speakers
on their symposia and seven did not significantly deviate from 5050 representation
(selfidentity emotion culture intergroup relations mental healthwell-being social
neuroscience and groupsintragroup processespower) However six topics (social cognition
motivation methods self-regulation norms and social influence and judgment and decision-
making) had on average significantly more men speakers than women speakers on their
symposia We did not have base-rate information for the population of social psychologists
studying each topic so could not test underrepresentation relative to any population As
prolific researchers often presented on several topic areas base-rate information may not be
useful We do know that perceptions of topic areas as collaborative and prosocial were
positively associated with womenrsquos representation and perceptions of topic areas as
competitive and quantitative were negatively associated with womenrsquos representation Just as
low participation of women and minorities in STEM disciplines is a concern researchers in areas
with low womenrsquos participation may use these findings to consider issues of parity as a lack of
WOMENrsquoS REPRESENTATION AT AN ACADEMIC CONFERENCE 29
diversity in researchers may constrain the kinds of research questions that are pursued and the
creativity of the field (eg Inbar amp Lammers 2012)
Looking at representation over time provided reasons for both optimism and concern
Representation of women is increasing over time However in the 13 years of conference data
studied there was no evidence that the pattern of women being underrepresented as speakers
at all ranks except full professor was changing Differences between men and women in
productivity and impact (Brown amp Goh 2016 Cikara et al 2012 Eagly amp Miller in press Nosek
et al 2010) may explain overall gender differences in representation but cannot explain why
these gender differences disappear among full professors as men full professors still publish
more and are better cited than women full professors (Eagly amp Miller in press) Another
potential explanation for this pattern is that women must be more established and successful
than men to be invited to join a symposium (Banaji amp Greenwald 1995 Biernat et al 1991)
Or less senior women may be more likely to turn down invitations to speak (Schroeder et
al2013) because of childbearing and family obligations more common at those ages that may
reduce their ability to attend conferences (Xu amp Martin 2011) Future research should test
these and other explanations
To further understand womenrsquos professional progress we explored their access to
professional resources through examination of their professional networks In the present
analysis we found that menrsquos and womenrsquos co-presenting networks and therefore resources
available to them differed Women were on symposia with fewer different individuals and
with individuals that likely had overlapping resources Men on the other hand were on
symposia with researchers who were more independent from one another which likely
WOMENrsquoS REPRESENTATION AT AN ACADEMIC CONFERENCE 30
increased the range of resources to which they had access These gender differences
disappeared when the lower average academic rank of women was taken into account
suggesting that these deficiencies in womenrsquos networks may decrease and eventually disappear
as more women achieve more senior academic positions This analysis reflected how women
and men interacted with their colleagues in the past further understanding of network
influence could help increase parity in the field
Future Actions
In addition to suggesting future research directions these results point to a number of
actions that could be taken by those who convene and organize conferences Encouragingly
the organizers of the SPSP conference have recently adopted some of these actions11 in
addition to greater vigilance and attention on the part of symposia chairs and program
committees For example in the years under review the only way to speak at the SPSP
conference was as part of a symposium which relies heavily on having or creating a network
Such a policy may disadvantage women for several reasons Women may be less likely to be
invited as speakers because they are less central in social networks and have a less diverse set
of connections than men as suggested by our co-presenting network data Furthermore men
chairs are less likely to invite women to speak than to invite men but women chairs do not
evidence a parallel preference in favor of women speakers This means that even if women are
well-represented as chairs (as was true in recent years see Table 1) they will be
underrepresented as speakers In addition women organizing symposia may have greater
11In 2014 preliminary analyses of these data were provided to the SPSP Program Committee for the 2015
conference and in 2016 these results were presented at the SPSP conference and to the SPSP Executive Committee
WOMENrsquoS REPRESENTATION AT AN ACADEMIC CONFERENCE 31
difficulty recruiting and attracting high-status speakers or speakers outside their network than
men SPSP created opportunities for submitting single-paper oral presentations to the 2017
conference in addition to symposia which could address these issues by reducing reliance on
social networks reducing the role of symposia chairs as gatekeepers and making it easier to
submit a presentation
In addition to changing the structure of the submission process in 2015 SPSP adopted a
double-blind review procedure Prior to this reviewers knew the identities of the submitting
authors limiting reviewersrsquo ability to assess symposia quality independent of biases associated
with author characteristics12 For example reviewers might have been biased towards
individuals who were members of their social networks or were of high status In addition
gender bias could have emerged as research of similar quality may receive lower ratings when
attributed to a woman scientist versus a man scientist (Knobloch-Westerwick et al 2013
Roberts amp Verhoef 2016)
Finally these analyses speak to the representation of women as speakers at the SPSP
conference but could not speak to the overall representation of women at the conference
(eg as attendees as poster presenters) or to the representation of other minority group
members Not only was it beyond the scope of the present research to examine poster
presentations but demographic information about submissions or attendees had not been
obtained or maintained by SPSP It is heartening that in response to requests for greater
12We did not find evidence of this policy change affecting the relationship between gender representation
and acceptance decisions in our limited data The difference between accepted and rejected symposia in percentage of women speakers was nonsignificant for 2014 F(1 205) = 002 p = 88 and 2015 F(1 242) = 043 p = 51 and the magnitude of this difference did not change between the two years F(1 447) = 011 p = 75
WOMENrsquoS REPRESENTATION AT AN ACADEMIC CONFERENCE 32
transparency and revelations of unequal representation the SPSP program committee has
begun to collect demographic information on membership attendees and submissions which
should aid future research
Significance and Conclusions
Our data fit a larger pattern of recent work suggesting that womenrsquos impact on
psychology is less than that of menrsquos (Brown amp Goh 2016 Cikara et al 2012 Eagly amp Miller in
press Nosek et al 2010) Here we focused only on women but with accurate and transparent
tracking of other demographic variables a fuller picture of who is presenting at the conference
and whether that representation is equitable can emerge Representation matters For
individuals presenting research at a conference increases the likelihood that research will be
read (de Leon amp McQuillin 2015) and cited (Winnik et al 2012) Given that citation counts are
often considered when measuring the impact of a researcherrsquos work and factored into hiring
retention and promotion decisions increasing citation counts increases the likelihood of
professional success Although we cannot directly attribute differences to fewer conference
appearances recent research has shown that womenrsquos research is cited less than menrsquos in
general (Lariviere Ni Gingras Cronin amp Sugimoto 2013) and specifically in social and
personality psychology (Eagly amp Miller in press Nosek et al 2010)
For the audience the identity of speakers matters (Murphy Steele amp Gross 2007
Sonnert Fox amp Adkins 2007) At early career stages individuals are working to create a viable
self-concept and construe role models as guides to the kinds of attributes they want to acquire
and develop In mid-career stages role models help people refine their self-concepts
Successful similar others serve as role models for individuals developing their professional self-
WOMENrsquoS REPRESENTATION AT AN ACADEMIC CONFERENCE 33
concepts (Gibson 2003 Sealy amp Singh 2006) In the absence of such role models individuals
may not gain the socialization necessary for success Relatedly exposure to similar successful
and counter-stereotypic women has been shown to change womenrsquos self-concepts and reduce
negative self-stereotypes (Asgari et al 2012 Dasgupta amp Ansari 2004) Finally role model
gender has more impact on women than men (Lockwood 2006)
For these and many other reasons we should attend to the visibility of women and
other minority groups in positions of status Social psychology is the study of humanity in
different situations because we know that who we are affects what we study (eg Inbar amp
Lammers 2012) social psychologists should represent all aspects of humanity and a wide range
of lived experiences
WOMENrsquoS REPRESENTATION AT AN ACADEMIC CONFERENCE 34
References
American Association of University Professors (2015 March-April) The compensation survey
(Survey report Table 12) Academe 101(2) Retrieved from
WOMENrsquoS REPRESENTATION AT AN ACADEMIC CONFERENCE 44
Politics 26 312 -461 lt001 090
Evolution 23 467 -053 060 011
BelongingRejection 19 618 203 006 046
Gender 18 667 229 004 054
Field ResearchInterventions 17 497 -004 097 001
Applied Social Psychology 17 448 -076 046 019
Diversity 15 622 163 013 042
ReligionSpirituality 15 300 -270 002 070
AggressionAntisocial 13 365 -211 006 059
Note Keywords are listed in order of descending number of symposia listing that keyword 825 symposia were associated with two
different keywords and are represented twice 15 were associated with only one keyword and are represented once The one-
sample t-tests test the average percentage of women speakers against 50 Rated masculinity is the average of ratings of
competitive and quantitative and rated femininity is the average of ratings of collaborative and prosocial all on 5-point scales These
ratings were only collected for the 15 most frequently occurring substantive keywords (ie excluding ldquootherrdquo see main text for
details)
WOMENrsquoS REPRESENTATION AT AN ACADEMIC CONFERENCE 45
Table 4
Distribution of the Presence of Women Chairs in Accepted and Rejected Symposia 2014-2015
Gender of chairs
Total
All men One man and one women All women
Accepted Symposia
44 50 66 160
Rejected Symposia
102 87 102 290
Total 146 137 168 451
WOMENrsquoS REPRESENTATION AT AN ACADEMIC CONFERENCE 46
Figure 1 Representation of women as speakers in accepted symposia 2003-2015
0
50
100
150
200
250
300
0 20-40 50 60-80 100
Nu
mb
er o
f Sy
mp
osi
a
Percentage of Speakers that Were Women
WOMENrsquoS REPRESENTATION AT AN ACADEMIC CONFERENCE 47
Figure 2 Distribution of invited speakers in accepted symposia by gender and academic rank
2003-2015
175(418) 90
(486)
376(568) 256
(606)
492(715)
244(582)
95(514)
286(432)
171(394)
196(285)
0
100
200
300
400
500
600
700
800
GraduateStudent
Postdoc AssistantProfessor
AssociateProfessor
Full Professor
Nu
mb
er o
f In
vite
d S
pea
kers
Rank of Invited Speakers
Women
Men
WOMENrsquoS REPRESENTATION AT AN ACADEMIC CONFERENCE 48
Figure 3 Representation of women as invited speakers in accepted symposia by gender of
chairs 2003-2015
0
20
40
60
80
100
120
0 20-40 50 60-80 100
Nu
mb
er o
f Sy
mp
osi
a
Percentage of Speakers that Were Women
All Women Chairs
Mix of Men and Women Chairs
All Men Chairs
San Jose State University
From the SelectedWorks of Camille Johnson
February 14 2017
Sage on the Stage Womenrsquos Representation at an Academic Conference
tmp8Ztbv8pdf
WOMENrsquoS REPRESENTATION AT AN ACADEMIC CONFERENCE 31
difficulty recruiting and attracting high-status speakers or speakers outside their network than
men SPSP created opportunities for submitting single-paper oral presentations to the 2017
conference in addition to symposia which could address these issues by reducing reliance on
social networks reducing the role of symposia chairs as gatekeepers and making it easier to
submit a presentation
In addition to changing the structure of the submission process in 2015 SPSP adopted a
double-blind review procedure Prior to this reviewers knew the identities of the submitting
authors limiting reviewersrsquo ability to assess symposia quality independent of biases associated
with author characteristics12 For example reviewers might have been biased towards
individuals who were members of their social networks or were of high status In addition
gender bias could have emerged as research of similar quality may receive lower ratings when
attributed to a woman scientist versus a man scientist (Knobloch-Westerwick et al 2013
Roberts amp Verhoef 2016)
Finally these analyses speak to the representation of women as speakers at the SPSP
conference but could not speak to the overall representation of women at the conference
(eg as attendees as poster presenters) or to the representation of other minority group
members Not only was it beyond the scope of the present research to examine poster
presentations but demographic information about submissions or attendees had not been
obtained or maintained by SPSP It is heartening that in response to requests for greater
12We did not find evidence of this policy change affecting the relationship between gender representation
and acceptance decisions in our limited data The difference between accepted and rejected symposia in percentage of women speakers was nonsignificant for 2014 F(1 205) = 002 p = 88 and 2015 F(1 242) = 043 p = 51 and the magnitude of this difference did not change between the two years F(1 447) = 011 p = 75
WOMENrsquoS REPRESENTATION AT AN ACADEMIC CONFERENCE 32
transparency and revelations of unequal representation the SPSP program committee has
begun to collect demographic information on membership attendees and submissions which
should aid future research
Significance and Conclusions
Our data fit a larger pattern of recent work suggesting that womenrsquos impact on
psychology is less than that of menrsquos (Brown amp Goh 2016 Cikara et al 2012 Eagly amp Miller in
press Nosek et al 2010) Here we focused only on women but with accurate and transparent
tracking of other demographic variables a fuller picture of who is presenting at the conference
and whether that representation is equitable can emerge Representation matters For
individuals presenting research at a conference increases the likelihood that research will be
read (de Leon amp McQuillin 2015) and cited (Winnik et al 2012) Given that citation counts are
often considered when measuring the impact of a researcherrsquos work and factored into hiring
retention and promotion decisions increasing citation counts increases the likelihood of
professional success Although we cannot directly attribute differences to fewer conference
appearances recent research has shown that womenrsquos research is cited less than menrsquos in
general (Lariviere Ni Gingras Cronin amp Sugimoto 2013) and specifically in social and
personality psychology (Eagly amp Miller in press Nosek et al 2010)
For the audience the identity of speakers matters (Murphy Steele amp Gross 2007
Sonnert Fox amp Adkins 2007) At early career stages individuals are working to create a viable
self-concept and construe role models as guides to the kinds of attributes they want to acquire
and develop In mid-career stages role models help people refine their self-concepts
Successful similar others serve as role models for individuals developing their professional self-
WOMENrsquoS REPRESENTATION AT AN ACADEMIC CONFERENCE 33
concepts (Gibson 2003 Sealy amp Singh 2006) In the absence of such role models individuals
may not gain the socialization necessary for success Relatedly exposure to similar successful
and counter-stereotypic women has been shown to change womenrsquos self-concepts and reduce
negative self-stereotypes (Asgari et al 2012 Dasgupta amp Ansari 2004) Finally role model
gender has more impact on women than men (Lockwood 2006)
For these and many other reasons we should attend to the visibility of women and
other minority groups in positions of status Social psychology is the study of humanity in
different situations because we know that who we are affects what we study (eg Inbar amp
Lammers 2012) social psychologists should represent all aspects of humanity and a wide range
of lived experiences
WOMENrsquoS REPRESENTATION AT AN ACADEMIC CONFERENCE 34
References
American Association of University Professors (2015 March-April) The compensation survey
(Survey report Table 12) Academe 101(2) Retrieved from