69
SAIA Consumer Education Projects Report: 2012/13 February 2014 # 112957

SAIA Consumer Education
Projects Report: 2012/13 February 2014
# 112957

Page | 2
Table of Content
1 Executive Summary ........................................................................................... 3
2 Introduction ........................................................................................................ 5 2.1 SAIA Consumer Education Strategy ............................................................. 5 2.2 SAIA Consumer Financial Education Programme Guidelines ....................... 6 2.3 Financial Sector Code ................................................................................... 9
3 2012/13 SAIA Consumer Education Initiative ................................................ 11 3.1 Teacher Development (iCount) Project ....................................................... 11 3.2 Community Radio Project............................................................................ 12
3.3 Funding ....................................................................................................... 13
4 Teacher Development (iCount) Project .......................................................... 14
4.1 The Project .................................................................................................. 14 4.2 The Research .............................................................................................. 18
4.3 The Research Findings ............................................................................... 21 4.4 Recommendations ...................................................................................... 51
5 Community Radio Project ............................................................................... 54 5.1 The Project .................................................................................................. 54 5.2 Project Background ..................................................................................... 54 5.3 The Project Context .................................................................................... 57
5.4 The Research .............................................................................................. 59
6 Project Impact (Ukhozi FM) ............................................................................. 61 6.1 Profile of Participants .................................................................................. 61
6.2 Main Findings .............................................................................................. 61 6.3 Conclusions................................................................................................. 63 6.4 Recommendations (Ukhozi FM) .................................................................. 63
7 Radio Sonder Grense (RSG) ........................................................................... 64 7.1 Findings ...................................................................................................... 64
7.2 Measurement of Radio Audience for RSG .................................................. 68 7.3 Recommendations (RSG FM) ..................................................................... 69

Page | 3
1 Executive Summary
Since the inception of the SAIA Consumer Education initiative in 2004, over R60
million has been spent on various consumer education projects aimed at creating
awareness on the importance of financial management as well as to increase the
consumers’ understanding of financial services and products. The SAIA Consumer
Education Initiative is considered to be one of the best industry-led initiatives that are
making a difference in the lives of South African consumers, particularly in the low-
income market. The initiative’s success is attributed to the commitment of SAIA
members, who even before the Financial Sector Code (FSC) was gazetted,
voluntarily contributed funds in recognition of the initiative’s its importance as a social
and business imperative.
For the 2012/13 SAIA Consumer Education Initiative, three projects were
implemented namely; The Teacher Development Project (iCount), Managing Your
Money (MYM) and the Radio Financial Literacy Project. As stipulated in the FSC
guidelines, all consumer financial education projects must be monitored and
evaluated for impact analysis. This was done through a baseline and endline survey
for both the Teacher Development and the Radio Financial Literacy Projects during
the campaign.
With regard to the MYM project, there was no impact study conducted during or after
the project, as this was a revision exercise for previous MYM material produced in
2008 for Grades 10, 11 and 12 for Maths Literacy teachers. The SAIA had partnered
with the Financial Services Board (FSB) on the MYM project in 2008 and due to its
success; the FSB requested that the material be revised to align it with the new
curriculum referred to as the Curriculum Assessment Policy Statement (CAPS),
introduced in schools in 2013. The material was revised by service provider, Bright
Media in consultation with officials from the Department of Basic Education. A total of
600 MYM resource files were printed and distributed to the provincial Heads of
Mathematical Literacy in all nine provinces to be used in schools.
In terms of the Teacher Development Project, this was a continuation of the 2011/12
iCount project, which focused on training Accounting subject school teachers in
Grade 10. This project was initially implemented at the request of the national
Department of Education (DBE) who had previously endorsed the MYM project, as
part of the Economic and Management Sciences (EMS) subjects for Grades 10 to
12. Due to the success of the iCount project in 2012, and for continuation purposes,
a decision was made to continue with the iCount project in 2013/14, focusing on
Grades 11 and 12. In this campaign, a total of 1,768 were trained through workshops

Page | 4
to teach learners the Accounting subject using material that was specifically
produced for them.
For the Radio Financial Literacy project, this was rolled out on two SABC Public
Broadcast Service (PBS) radio stations, namely; Radio Sonder Grense (RSG), which
broadcasts in Afrikaans and Ukhozi FM, which broadcasts in isiZulu. This project
entailed a 26 episode radio drama series in both languages, aimed at creating
awareness of financial products and services, the management of finances through
budgeting and saving, as well as to change behaviours and attitudes of consumers
with regard to financial management. Live call-in sessions were held after the
broadcast of each episode on both radio stations. With this interactive segment of
the project, voluntary experts drawn from SAIA member companies who were
proficient in Afrikaans and/or iSizulu participated in the call-in sessions to engage
with listeners and to answer questions. In total, the Radio project reached over two
million listeners (1, 86 million on Ukhozi FM and 155,000 on RSG).
The evaluations of both projects reveal that they were not only well received by the
intended audiences, but that there was also significant improvement in the
knowledge, understanding and change in attitude of the respondents. With regard to
the iCount project, teachers who attended the training workshops as well as their
learners said that the content was useful, particularly the inclusion of financial
literacy into the Accounting subject.
Similarly with the Radio Financial Literacy project, there was keen interest from
Ukhozi FM listeners, with respondents of the impact study recalling the content of the
episodes and making an effort to change how they manage their finances and risk. It
was revealed though that some respondents to the survey, particularly males, were
not happy with the programme’s timeslot as this was during the day when they did
not have access to the radio. A recommendation has been made to take cognisance
of that should we implement a similar project in the future.
With regard to RSG, the baseline survey initially revealed a negative response to the
programme, which necessitated a mid-term study to find out what the issue was. It
was noted that a significant number of RSG’s listeners were in the upper LSMs and
therefore did not find the information engaging. To rectify this, the service provider
worked closely with the SABC to develop programmes around the central drama to
reflect the needs of the listener base. This worked very well and the endline survey
reflected positive responses. However, these need to be considered in light of the
adjusted proportion of the upper LSM respondents.

Page | 5
2 Introduction
Consumer financial education continues to play a pivotal role in creating awareness
about sound financial management as well as in increasing consumer knowledge
and understanding of financial products and services. In the last few years, there has
been an increased focus on consumer financial education in light of the global
economic crisis, which left many people financially distressed. This, together with the
ever increasing financial choices that consumers have to make, the need for
knowledge to make informed decisions about their finances and lifestyles has
become even more relevant for consumers.
A recent national financial literacy survey conducted by the Human Sciences
Research Council (HSRC) indicates that many South Africans, particularly in the low-
income market make poor financial decisions due to a lack of financial management
skills, and continuously find themselves in the proverbial debt trap and the perpetual
cycle of poverty. Further exacerbating this problem is the lack of understanding of
the importance of risk management as an important pillar of financial management. It
is against this background that the South African Insurance Association (SAIA) has
since 2005 embarked on consumer education projects on behalf of the short-term
insurance industry.
Although members initially participated in the SAIA Consumer Education Initiative on
a voluntary basis, in 2009 the SAIA drafted a Consumer Education Strategy and
Guidelines, making it mandatory for members to contribute to the industry consumer
education project. This ensured that the collaborative initiative would continue
regardless of the Financial Sector Charter (now referred to as the Financial Sector
Code) being gazetted or not. For an update on the Financial Sector Code (FSC)
please see page 7 of this report.
2.1 SAIA Consumer Education Strategy
In terms of the strategy, participation in consumer education is a SAIA membership requirement.
All SAIA members are required to spend 0.2% of after tax profits on consumer education in the low-income market. (This percentage has since been revised following the gazetting of the FSC) to 0.4%.
A minimum of 0.1% (i.e. half of the 0.2% requirement) must be contributed to the SAIA industry initiative. The funds in this pool will be used by SAIA for generic consumer education, with an emphasis on short-term insurance.
Page | 6
SAIA members that wish to spend their remaining 0.1% on their own projects may do so.
SAIA members that do not wish to implement their own consumer education projects may contribute the full 0.2% to the SAIA industry initiative.
The SAIA will spend these funds in such a way that members will receive their points for consumer education on the FSC scorecard..
SAIA members that form part of conglomerate groups may choose to spend their 0.2% together with the other companies in their group. All spend should adhere to the SAIA Consumer Education standards and guidelines.
Such spend should be reported to the SAIA.
SAIA members that are granted exemption for the Access pillar in the Financial Sector Code may apply the SAIA membership requirement to spend the 0.2% of the after tax profits on consumer education.
Consumer education policies and guidelines should either be included in the general SAIA Code of Good Business Practice, or a Code for Consumer Education should be drafted.
2.2 SAIA Consumer Financial Education Programme Guidelines
The SAIA Consumer Education guidelines are premised on the definition of
financial education as defined by the Organisation for Economic Co-operation
and Development (OECD) as well as the FSC Consumer Education Standards.
This definition is also used by the industry’s regulator, the Financial Services
Board (FSB). According to the OECD, financial education is “the process by
which financial consumers/investors improve their understanding of financial
products, concepts and risks and, through information, instruction and/or
objective advice, develop the skills and confidence to become more aware of
financial risks and opportunities, to make informed choices, to know where to
go for help, and to take other effective actions to improve their financial well-
being”. Financial education therefore includes improving the levels of
knowledge, skills and attitudes that will lead to behaviour change.

Page | 7
Principles Providing financial education to consumers should form part of a financial
institution’s good governance and business practice in respect of their
relationship with their clients. This would include providing information,
appropriate disclosure and appropriate advice at point of sale according to any
relevant legislation, regulation and/or good practice, but also creating financially
aware and literate clients in the long term. The other principles are as follows:
Financial education should be provided in a fair and unbiased manner
and be non-discriminatory.
Programmes should be co-ordinated and fit into a sector and/or national
programme. Therefore, programmes should take cognisance of the
national consumer financial education framework / strategy as approved
by the FSB, and should seek to fit into this overall strategy. In addition,
programmes should seek to fit into the sector initiative and follow the
SAIA guidelines and FSC Standards.
Financial education programmes should provide context. For example,
should the target audience fall under the low income category and have
low levels of education, basic financial principles such as budgeting,
saving etc should provide a starting point. General principles regarding
insurance and specifically short-term insurance should provide the back-
drop for product information.
Financial education should be seen as a long-term commitment,
although short-term outcomes may be the starting point of a programme.
It should be seen as a continuous, on-going commitment towards clients
and potential clients.
Financial education programmes should be designed to meet the needs
of the target market and should take into account the general literacy
and financial literacy levels of the target market.
Financial education programmes and the outcomes of these
programmes should be shared at a general level in terms of the SAIA
requirements as well as a national framework or strategy to prevent
duplication and encourage learning.

Page | 8
Good Practices
Financial education programmes should be holistic, comprehensive and complementary.
Financial education could include generic financial literacy concepts, generic short-term insurance financial literacy concepts as well as general product information.
Objective information on risks and products and how these relate to the
needs of different target audiences should be encouraged.
A clear distinction should be made between financial education and
commercial information. Commercial financial information should be
disclosed as such and must fall outside of the consumer education spend
required by the SAIA of its members.
Financial education should be appropriate. The target audience should be
identified clearly. The message, content and delivery mechanisms used
should be aligned to the target audience. Information or education
provided should be simple and understandable. In South Africa, such
education should preferably be provided in the language/s best
understood by the target audience.
Financial education should have specific objectives.
Financial education should be monitored and assessed to ensure
appropriateness and impact.
Financial education should, if at all possible, attempt to create a link
between the consumer financial education and increased access to
financial services products.

Page | 9
2.3 Financial Sector Code
After a decade of protracted negotiations, the Financial Sector Code (previously
referred to as the Charter) was finally gazetted in November 2012 and was
officially launched to the financial sector in July 2013. However, the SAIA had
since inception of the consumer education initiative adhered to the FSC
consumer education requirements even when the Code was not in place.
This ensured that SAIA members would qualify for the points for consumer
education spend regardless of the Code being gazetted. New FSC standards
for consumer education have been agreed. Changes worth noting in the
consumer education standards include the following:
Target market:
The target market will include individuals earning less than R180,000 per
annum and 25% of funding should be used to reach rural areas.
New definitions:
‘Face-to-face’ initiatives have been replaced with ‘interactive’ initiatives
and can now also include other types of projects such as media projects
provided that interaction is possible between the target audience and the
facilitator.
‘Awareness’ projects will provide only basic information and will now be
strictly related to awareness creation only.
Funding percentage splits between different types of initiatives:
Up to 100% of funds can be spent on interactive projects and awareness
projects are capped at 40%.
The requirement for the financial sector to spend 0.2% of after tax profits on
consumer education has been increased to 0.25% for 2012. This percentage
will increase to 0.3% for 2013 and 0.4% for 2014. Strict requirements regarding
monitoring and evaluation, impact measurement as well as branding now form
part of the new FSC Consumer Education standards.

Page | 10
When considering projects for the 2012/13 consumer education initiative, the
Code was not yet in effect, however the following FSC Consumer Education
standards were taken into account.
Physical accessibility: Consumer education initiatives and
programmes must be offered and made available to all consumers of
FSC products and services at points of service or transaction.
Appropriateness: Consumer education initiatives and programmes
must meet the identified needs of consumers in the FSC target groups
with the aim of achieving the Code’s access goals. The outcomes of
FSC consumer education programmes must be measurable and be able
to contribute to the achievement of scoring points. Consumer education
must enable consumers to make more informed decisions about their
finances and lifestyles.
Affordability: Consumer education must be offered free of charge to the
consumer.
Simplicity: Consumer education initiatives and programmes must meet
the identified needs of consumers in the target groups with the aim of
achieving the Code’s Access goals. All consumer education materials
must meet the Code’s criteria for simplicity, being able to understand
and disclosure.
Non-discrimination: Consumer education materials must be freely
available in all languages. Suppliers must meet the FSC’s service
provider accreditation and BEE procurement criteria.

Page | 11
3 2012/13 SAIA Consumer Education Initiative
The mix of projects for the 2012/13 SAIA Consumer Education Initiative is a
continuation of the previous year’s projects. Due to the success of these projects and
to maintain consistency, a decision was made to continue with the Teacher
Development (iCount) project and the Radio Financial Literacy project. A request
was also made by the FSB to revise the Managing Your Money (MYM) material in
line with the Curriculum Assessment Policy Statement (CAPS). As this was just a
revision of material exercise, no impact study was conducted.
In the previous initiatives, the three projects addressed the financial skills gap in the
Living Standard Measurement (LSM) 1-8 as per the FSC requirement and also
enabled SAIA members to obtain points in accordance with the Code.
3.1 Teacher Development (iCount) Project
In 2011, the national Department of Basic Education (DBE) requested that the
schools’ project change focus from the Economic Management Sciences
(EMS) subjects previously done in 2010/11 and target the Accounting subject in
Grades 10 to 12. This intervention was initiated due to the lack of support for
Accounting at schools and based on the successful track record of Managing
your Money project for Mathematical Literacy.
The first phase of the iCount project was successfully implemented in the
2011/12 consumer education initiative in Grade 10. 2012/13 saw the
implementation of the second phase in Grades 10, 11 and 12 reaching over
69% of all teachers of the Accounting subject in the nine provinces. Lower LSM
consumers were targeted, and the profile of the recipients was aligned to the
Code’s requirements of over 70% Black.
The SAIA Consumer Education intervention in schools has an extensive track
record of success and impact and is one of the few government-industry
collaborations that make a demonstrable difference in content knowledge,
financial literacy indicators, classroom method and the use of the resources
provided. The resources content is aligned to the national curriculum financial
capability content. The service provider, Bright Media developed simple, clear,
educational materials through a collaborative process, with DBE officials being
involved at all levels.

Page | 12
3.2 Community Radio Project
The Radio Financial Literacy project which has proven successful over the last
three years was again implemented in the 2012/13 SAIA consumer education
initiative. The project is aimed at improving consumer knowledge, skills, and
attitudes and to develop behaviours which show critical and selective
engagement with financial products and to build the required knowledge to be
good life and risk managers. The financial education was delivered through a
radio “soap” drama programme on two public broadcast stations (RSG and
Ukhozi FM) through a series of 26 episodes on each station. Each episode was
followed immediately by a live call-in session with a topical short-term
insurance expert. The radio drama, as well as the follow up programme was
broadcast in Afrikaans and isiZulu, the languages of the respective radio
stations.
The anticipation was that the above mix of project would derive the
following results:
Measurable impact across a broad constituency.
Ability to reinforce education concepts applied in existing projects and to
expand consumer education to provide more focus on short-term
insurance product education.
Easy extension of the target market from Living Standards Measures
(LSM) 1-5 to include LSM 1- 8.
Building of relationships with existing suppliers with proven track records
for good delivery.
Managing Your Money (MYM) Project
The Managing Your Money project was a revision of previous MYM material in line with the Curriculum Assessment Policy Statement (CAPS), which was introduced in schools in 2013. The request to revise the material was made by the FSB who had partnered with the SAIA in a previous campaign. There was no impact study conducted for the MYM as the project was a revision of material exercise.

Page | 13
3.3 Funding
The final budget for the 2012/13 consumer education initiative was
R11 938 442,78. The total budget was made up of the pledged amount of
R9 895,879 from members, R900, 000 contributed by the FSB and R1 142, 563
from additional funds available from the previous year’s campaign interest.
The following funding proposal was approved.
Projects
Teacher Development (iCount) Project
SAIA funds R 6 805 087,07
Radio Financial Literacy Project
SAIA Funds R 2 566 595,00
FSB funds R 500 000,00
Managing Your Money
SAIA funds R 433 955,14
FSB funds R 400 000,00
Total expenditure R 10 705 637,21
The balance of R1 232 805,59 was added to the 2013/14 SAIA Consumer Education
campaign, including the accumulated interest.

Page | 14
4 Teacher Development (iCount) Project
4.1 The Project
The iCount project was first implemented in 2012 for Grade 10 learners
following a request by the Department of Basic Education (DBE) who had
identified Accounting as an area needing intervention. Due to its success and
for continuity reasons, the project was rolled out to Grades 11 and 12 in 2013.
A total of 1,768 teachers were trained in 2013 in all provinces through
workshops, bringing the total number of teachers who had undergone the
training (including those who trained in 2012) to 3,645.
Training Material
Each teacher received specialised training as well as a ready-to-use resource
pack for Accounting in Grades 10, 11 and 12. The Curriculum Assessment
Policy Statement (CAPS) aligned Grade 10 material was included in the pack to
ensure continuity in lessons. Two DVDs with 13 episodes each of Accounting
material was also given to the teachers. The full training resource pack
contained three high quality books of 56 colour pages each and two posters.
Accounting resources for teachers and learners
A total of 8,000 iCount resource files were printed and 8,000 DVD double packs
containing 26 episodes of Accounting material were delivered to the provinces.
These files contained 27,000 books based on the curriculum for Accounting
and teaching Financial Literacy. The files were distributed in classrooms of
schools most in need, as identified by the DBE.
Each resource file was professionally developed, published and printed to
contain the following elements:
One Grade 10 full colour resource book of 56 pages, aligned to the
CAPS document for Accounting.
One Grade 11 full colour resource book of 56 pages, aligned to the
CAPS document for Accounting.
One Grade 12 full colour resource book of 56 pages, aligned to the
CAPS document for Accounting.

Page | 15
One A2 sized poster, printed in full colour on the front reflecting the
Generally Accepted Accounting Principles (GAAP) with additional
Accounting terminology on the reverse side, as well as summaries of all
26 iCount episodes.
One A2 sized poster, printed in full colour on the front reflecting the
Steps to Financial Literacy principles, which are the core financial
capability indicators, expressed clearly in useable steps for learners and
teachers.
Two DVD disks in a pouch, which slots into the resource file, containing
all 26 of the iCount television episodes which include animation, live
action sequences with actors of 23 minutes in duration each – for use on
a computer or in a DVD machine. In addition, the DVD contains the
booklets in printable PDF format, the resources mentioned by the
curriculum such as the King Report and other resources for use in the
classroom.
The Adult Financial Capability Framework was used to develop the content,
reflecting the process model, including three broad elements of financial
capability, i.e. financial knowledge and understanding, financial skills and
competence, and financial responsibility. Quantitative and qualitative research
was conducted to assess the relevance, reach and impact of the project on
both financial capability and usefulness for the Accounting classroom.
Face to Face Workshops - Training in the nine (9) provinces:
Forty-four (44) teacher training workshops were successfully hosted (two
more than the contracted 42 workshops) reaching 1,768 educators in all
nine provinces.
The teachers were provided with resources to implement the iCount
project with their learners in classrooms.
This number was achieved despite the SADTU go-slow and strike action
at this time. Contingency plans were implemented and 10 workshops
were postponed and completed.

Page | 16
The workshop schedule was designed for each province ensuring that
reach and target audience of the project covered areas and schools
where the most need was, i.e. taking accounting learner performance
into consideration as well as alignment with any existing development
projects or programs such as the 'Underperforming Schools Project',
which were currently running in the provinces.
Nine meetings were held with provincial officials to discuss each
province's unique CAPS implementation plan and the alignment of the
SAIA Schools Project with this.
The date, time and venue for the workshops were discussed and
finalised once it was established which districts and/or schools would
participate.
The Educational District Officials also attended the workshops together
with accounting teachers. All iCount workshops were both opened and
closed by the relevant District Officials for the areas.
An iCount, audio visual DVD, episode was screened using a data
projector at 95% of the training workshops. The remaining 5% were
negatively affected by the lack of electricity or unforeseeable problems,
which could not be resolved.
Achievements
Developing financial literacy content for schools, publishing and printing 26,000
books in 8,000 files, organising a total of 44 workshops, which were
successfully conducted in all nine provinces during the first two school terms of
2013 summarises the project’s achievement.
A total of 1,768 attendees took part in the Accounting workshops. This
figure was attained despite two disruptive elements, namely the national
SADTU go-slow and strikes in the Eastern Cape, which took place
simultaneously. Due to constant monitoring of the media as well as
direct contact with the provincial Accounting co-ordinators, the situation
was monitored and the necessary contingency plans were implemented.
All workshop attendees filled out an evaluation form on completion of
each workshop. An independent research company conducted pre- and
post-intervention interviews with attendees. This qualitative and

Page | 17
quantitative information was data captured and analysed for insertion in
this final report.
All aspects of the training received a high majority rating of either
‘Excellent’ or ‘Good’, averaging out to an overall rating of ‘92% by all
attendees, for all aspects of the training. When including the ‘Average’
rating, 99% of all training delegates rated all aspects of the training as
between ‘Average’ – ‘Excellent’. This is a very positive aspect of the
training analysis as adult training is a much specialised field of expertise
due to the complex nature and varied expectations of trainees,
especially in the intricate field of education.
An overwhelmingly positive response has been received at provincial,
district and teacher level. Positive emails, telephone calls and SMS
messages poured in from the teachers on completion of the project.
A very important, achievement of this project is the potential reach that
each trained and resourced teacher has to improve the quality of their
learners’ educational experience. This reach covers both the in-class
experience through Accounting as well as the learners’ general financial
literacy to equip them to be better-informed consumers. Statistically, if
each trained teacher reaches an average of 50 – 60 Accounting learners
then 88,400 – 106,080 learners would have been reached through this
phase of the iCount project.
With CAPS training rolling out during the mid-year school holidays
(June/July) within most provinces, the teachers were excited to be in
possession of their first CAPS aligned resource. They also indicated that
they were less intimidated by the CAPS roll-out after experiencing the
lesson demonstration activities during the workshop as it made them feel
more at ease with CAPS and its implementation. The fact that the iCount
resource is CAPS aligned increases the likelihood of it being used in the
classroom as the teachers currently do not have any CAPS aligned
materials and they expressed their enthusiasm to use the iCount
materials as they now feel comfortable with the contents thereof.

Page | 18
Multimedia
The written and printed content was supplemented by audio-visual
content (episodes) in a multimedia pack, which was very well received.
Innovation
Two Knowledge Boxes were launched - one in in Gauteng, which was installed
at the Sci-bono Discovery Centre in Newtown, Johannesburg. A second one
was installed in Mthunzini in KwaZulu Natal. The Knowledge Box is an
interactive tool which teachers can use to receive updated resources by using a
USB memory stick, a memory card or a cell phone with Bluetooth to link to the
Knowledge Box. Using the high-tech touch screen, teachers browse through
valuable resources such as past exam papers, policy documents, lesson plans,
worksheets and the complete range of iCount resource books as well as the 26
multi-media episodes for Accounting teachers. These resources are updated on
a regular basis.
4.2 The Research
Objectives
The overall objective of the project was to evaluate the attitude of educators
and learners who had not been exposed to the iCount training workshop with a
view to conducting a future measurement of the impact, amongst educators
and learners who had recently been exposed to the iCount training.
Further objectives were to establish:
Initial evaluation of the learners’ own levels of financial literacy in terms
of their current level of knowledge, awareness, skills and impact of what
they have acquired in terms of financial literacy to date;
Evaluation of learner reaction to the training of their educators, both prior
and post the training received, positive and negative aspects;
Ascertain improved level of awareness and knowledge amongst learners
after their educators had been trained;

Page | 19
Determine response of learners to the educators who have been through
the training on the difference the learners now experience in their
understanding of financial literacy;
Identification of gaps in the training and recommendations for the future
of such programmes, focusing also on areas which learners feel that the
programme missed or areas where they feel they are lacking in terms of
financial literacy.
Develop a benchmark figure of a pre-workshop level of understanding of
accountancy principles against a first stage monitoring and evaluation
after one term’s work amongst learners whose educators had attended
the iCount workshops.
Overall Approach
The approach encompassed both a qualitative discussion with educators and
learners prior to the implementation of the training and educators attending the
training workshops. Learners in selected schools also completed quantitative
questionnaires to provide a baseline against which a second post training
impact study could be measured. In addition a control group of learners who
had not been taught by the trained educators was included in the study. The
study was conducted in Gauteng, amongst schools where educators had not
previously been trained on the iCount project, as well as in a control school
where educators were not trained at all.
Two training workshops were held in June 2013, one in Randfontein and one in
Dale Park, where about thirty educators completed the questionnaire in each
area. From amongst these educators, two schools were selected in each area
for participation in the study and fifty questionnaires were delivered to each
school. Ultimately three schools completed the questionnaires. Also included in
the study was a control school from the same area in Randfontein, so as to
provide a comparison of like with like in terms of learner background, etc. The
training was conducted just prior to the school holidays so the questionnaires
and the focus groups were conducted with students who were present doing
exams, mainly the Grade 12 pupils. The questionnaire was a self-completion
questionnaire, which was easy and quick to complete in order not to interfere
with the school day unduly.

Page | 20
Qualitative Stage
Two focus group discussions were held in June 2013 with educators, one in
Randfontein and one in Dale Park in Gauteng. Focus groups were held with
learners at three schools where educators had been trained and with learners
in a control school where the educators had received no iCount training.
Educators and learners at the workshops and at the selected participating
schools also completed a pre-training questionnaire.
All educators attending the training workshops were asked to complete a short
quantitative questionnaire. In each workshop, two educators were asked if they
would facilitate a quantitative study amongst their learners and an additional
control school, where no educator had received the iCount training. The
questionnaire was distributed amongst learners for a self-completion exercise.
This study forms the baseline, capturing information from educators and
learners prior to the educators receiving the training and prior to them providing
any input to the learners. The comparison is between user and non-user
schools and another endline study could be conducted amongst the same
educators and learners after the end of the third term. This is a further impact
study, and even beyond this, the matric results could be a further measure of
impact and change in knowledge skill and attitude. Each of the 1,768 attendees
of the workshops provided written assessment of the project, which was data
captured and analysed as part of the monitoring and evaluation.
Timing
The study was conducted in June 2013 with the non-trained school interviews
being conducted in July 2013.
Page | 21
The Research Findings
Research Limitations
Due to strike action, the timing for this study was very close to the exams and
school holidays so although it was possible to distribute the questionnaires to
the educators at the workshop for the learners to complete; only the Grade 12
learners were at school to complete this questionnaire. However this does
provide a unique opportunity to compare the matric results for these schools
when the results are available, to provide an additional layer of analysis of the
impact of the training. Of the four schools selected, only three managed to get
the learners to complete the questionnaires in time. It has been envisaged that
150 interviews would be completed with learners from the trained schools but
because of school closures, only 130 interviews were achieved.
Although it was possible to identify the non-participating school where the
educators were not trained in the Randfontein areas for direct comparison
purposes, it was only possible to conduct the study when the school reopened
in July. The overall objective of the project was to evaluate the attitude of
educators and learners who had not been exposed to the iCount training
workshop with a view to conducting a future measurement of the impact,
amongst educators and learners who had recently been exposed to the iCount
training.
Profile of the Educators and Learners
One hundred and sixty-four (164) learners took part in the study of which 36
participants amongst these learners were those with educators who did not
attend the iCount workshop; and 128 learners in schools where educators had
received training. Amongst the educators in the qualitative stage, 51 trained
educators were interviewed, 22 in Randfontein and 29 in Dale Park. Due to the
time period when the study was conducted, all the trained learners were in
Grade 12. Amongst the non-trained learners, 44% were in grade 11 and 56% in
Grade 12.The average number of learners taught per class/grade was as
follows: 39 in Grade 10, 34 in Grade 11 and 31 in Grade 12.
The Research Results
This is the baseline for this study, where the learners were tested before their
educators had a chance to put into practice any of the training or resources
Page | 22
they had received. The differences between the learners from schools where
educators attended the iCount training and those who had not are not
significant at the baseline stage. Full impact can only be measured when
implementation has an extended time for learning to be transferred as part of
the curriculum. By January 2014, impact will be able to be fully measured. The
following findings have relevance:
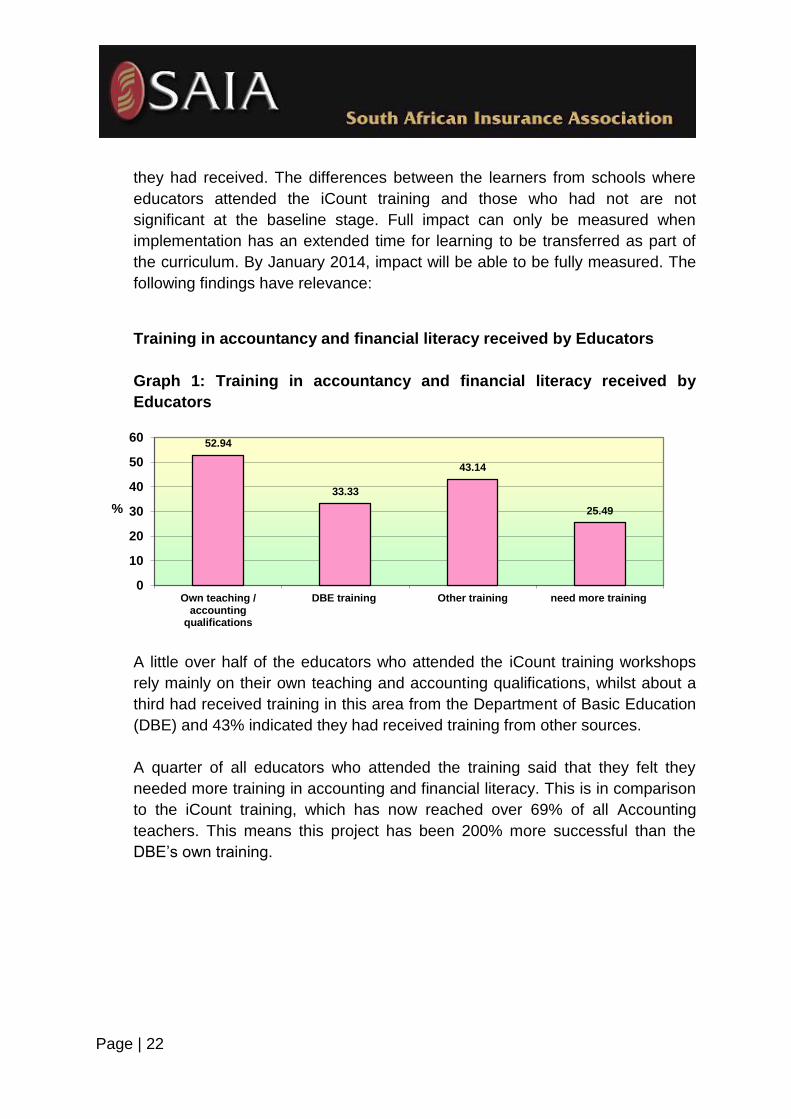
Training in accountancy and financial literacy received by Educators
Graph 1: Training in accountancy and financial literacy received by
Educators
A little over half of the educators who attended the iCount training workshops
rely mainly on their own teaching and accounting qualifications, whilst about a
third had received training in this area from the Department of Basic Education
(DBE) and 43% indicated they had received training from other sources.
A quarter of all educators who attended the training said that they felt they
needed more training in accounting and financial literacy. This is in comparison
to the iCount training, which has now reached over 69% of all Accounting
teachers. This means this project has been 200% more successful than the
DBE’s own training.
52.94
33.33
43.14
25.49
0
10
20
30
40
50
60
Own teaching /accounting
qualifications
DBE training Other training need more training
%

Page | 23
Resources currently utilised by Educators in facilitating Accounting and
financial literacy
Graph 2: Resources currently utilised by Educators
The main resource educators rely on is the textbook for Accounting for their
Grades, closely followed by past examination papers. All the educators used
textbooks and about 83% used past papers. Workbooks were used by 63% of
educators and 27% use DVDs of programmes on accounting and financial
literacy. About a third mentioned material and resources that they had made
and 14% use other materials as an aid in their lessons.
Educators have indicated that work books are needed for learners, that provide
exercises aligned with the text book material. This is to aid the learners in
putting into practice what they have learnt. A further problem that hinders
learning in Accounting is the lack of text books for learners. Educators also felt
that to enhance the subject and motivate their learners, the work books should
also include real life examples of businesses for the learners to work on.
Another area of perceived lack, particularly in teaching Accounting is that many
schools do not have computers for learners to use and work from. Educators
also find it extremely useful working with computers with projectors so that they
can pre-load accountancy information and present it to their learners.
Comments from some of the learners indicate that the resources do exist in
their schools but are used selectively and not always to the benefit of
accountancy learners.
100
62.75
33.33
82.35
27.45
13.73
0
10
20
30
40
50
60
70
80
90
100
Textbook Workbooks Resourcesmade myself
Past papers DVD / episodes Other
%

Page | 24
Educators need more training on following areas
Graph 3: Educators need more training on following areas
Educators were asked to indicate areas in which they needed more training and
significantly over half indicated that Risk Management was an area of greatest
need. This was followed by CAPS (47%), Accounting content in general (41%),
savings (41%) then Financial Literacy and Budgeting at 39%. Results from the
indicated levels of awareness of accountancy content indicate that educators
do need additional training in Risk Management, as they indicate here. In
addition, observed behaviour of educators in the training indicated that there is
sometimes a level of confusion and they actually need additional training in
some basic concepts such as how to work out compound and simple interest.
Another area of lack was in terms of understanding how business plans can be
used as a budget forecast for a business for the coming year and how
businesses need to use these plans to incorporate future development.
41.18
47.06
39.22 41.18 39.22
54.9
3.92
0
10
20
30
40
50
60
Acco
un
tin
gco
nte
nt
CA
PS
Fin
an
cia
l L
itera
cy
Sa
vin
gs
Bu
dg
eti
ng
Ris
k m
an
ag
em
en
t
Oth
er

Page | 25
Learner’s behaviour in income management
Graph 4: Learner’s behaviour in income management
A large percentage, 56%-58% of learners in schools with trained and non-
trained educators save their funds at home in a safe place, many referring to a
money box. This is a more convenient system for most learners who are often
at a distance from the local bank or post office, and require money to catch a
bus before they can access or deposit their funds. Therefore many prefer to
keep their money accessible, and without having to pay bank charges. About
59% of learners in “non-trained” and 42% of learners in “trained” schools say
they save their money in some form of bank account, be it a student account, a
savings account, an investment account or post office account.
Stokvel saving is practiced by 11%/7% of learners while 11%/13% of learners
said they use their income to develop their own small businesses. Some
learners save in both formal and informal systems. Significantly 11% of learners
in “non-trained schools” and 7% in trained schools also save their money in a
small insurance policy to cover things like cell phone insurance or other type of
insurance. A large proportion (58% “non-trained” and 44% “trained) of learners
say they use their funds for things they need such as airtime, clothes, books,
etc., and similarly a large group also lend to their families.
Moneybox
StudentA/c
Banksave a/c
PO savea/c
Investment a/c
StokvelSmall
insurancepolicy
Build OBUse forthings Ineed
Use forpleasure
lend tofamily
Non trained schools 56% 28% 22% 3% 8% 11% 11% 11% 58% 17% 61%
Trained schools 58% 10% 27% 3% 2% 7% 5% 13% 44% 9% 55%
56%
28% 22%
3% 8%
11% 11% 11%
58%
17%
61% 58%
10%
27%
3% 2% 7% 5%
13%
44%
9%
55%
0%
10%
20%
30%
40%
50%
60%
70%

Page | 26
Learners budgeting behaviour
Graph 5: Learners budgeting behaviour
In all, a reasonably high percentage of learners (72% “non-trained” and 69%
“trained” schools) indicated they know what money is available in their purse or
savings, and 42%-48% said they could use the information on what they had to
pay versus what they have coming in, to create a budget and plan what they
could save. Learners in the focus groups discussed budgeting and from their
comments they seem to grasp the whole concept of budgeting and the reason
for it in their own lives as well as in a business.
Knowmoney
available
Knowexpense
s
Knowincome
Calculate
balance
Calculate what Ican save
Plan topay &save
Writedownplan
Workwith plan
Non trained schools 72% 47% 28% 42% 50% 47% 58% 58%
Trained schools 69% 62% 37% 48% 63% 44% 37% 49%
72%
47%
28%
42%
50% 47%
58% 58%
69%
62%
37%
48%
63%
44%
37%
49%
0%
10%
20%
30%
40%
50%
60%
70%
80%%

Page | 27
Learner’s attitude towards saving
Graph 6: Learners attitude towards saving
Most learners (67% learners in non-trained schools and 75% in trained
schools), said they saved for what they needed now, followed closely by 69% -
59% who intend to save in the future. About 28% - 37% (“non-trained” and
“trained”) learners indicate that they save for the future, and 33%-41% save for
future education. Further, about 17% - 13% (“non-trained” and “trained”)
learners say they also save in a small insurance policy. This saving behaviour
is slightly higher amongst learners from schools where their educators have
attended an iCount training workshop. What is of note is the reasonably high
percentage of learners (42% “non-trained” and 38% trained) who indicate they
have not chosen their savings account indiscriminately but have discussed
terms and benefits to see what they are liable for and how they will benefit.
It must be said that the educator in the non-trained school, whilst not having
attended the iCount training had certainly attended other Financial Literacy
training courses and mathematics courses conducted by Bright Media in the
past and was very disappointed to have missed the iCount training.
Save forfuture
Save forwhat I need
Save forfuture
education
Save insmall
insurancepolicy
Save whenI can
Intend tosave infuture
Discussedterms &benefits
Non trained schools 28% 67% 33% 17% 58% 69% 42%
Trained schools 37% 71% 41% 13% 47% 59% 38%
28%
67%
33%
17%
58%
69%
42% 37%
71%
41%
13%
47%
59%
38%
0%
10%
20%
30%
40%
50%
60%
70%
80%

Page | 28
Learners and Educators awareness & knowledge of financial and
accountancy
Practices
Learners in the focus group who were taking Accounting spoke about the value
of the subject to them and why they enjoy it.
Financial Literacy
The graphs below show the level of awareness and knowledge of Accounting
practices amongst Learners and Educators, at the school where the educators
have not received training in the iCount workshop (non-trained School) and at
schools where the educators have received this training (trained Schools).
Again it must be stressed that this is the baseline for this study, where the
learners have been tested before their educators have had a chance to put into
practise any of the training or resources they have received.
Graph 7: I know how to write a budget / savings plan - Learners
The majority of the learners in the “trained” schools, 52%, know very little whilst
11% didn’t answer this section at all. Nevertheless, about 38% said that they
knew quite a lot about this aspect. In contrast 44% of learners in the “non-
trained” school say they know a lot and 39% know something, whilst 17% said
it did not apply (i.e. didn’t know). Educators who received training in iCount are
comfortable with their level of knowledge about financial management, with
86% saying they know a lot while 14% know a little.
Applies a lot Applies a little Doesn't Apply
Non trained schools 44% 39% 17%
Trained schools 38% 52% 11%
44% 39%
17%
38%
52%
11%
0%
10%
20%
30%
40%
50%
60%

Page | 29
Graph 8a: I understand why I should save - Learners
The majority of the learners in both “trained” and “non-trained schools”, about
81%-82% say they do understand why they should save. Similarly in both types
of schools, 17% -13% say the statement applies a little, with very few (3% - 5%)
saying the statement does not apply.
Graph 8b: I understand why I should save - Educators
Trained educators were very confident in their knowledge of this aspect, with
94% saying they know a lot.
Applies a lot Applies a little Doesn't Apply
Non trained schools 81% 17% 3%
Trained schools 82% 13% 5%
81%
17%
3%
82%
13%
5%
0%
10%
20%
30%
40%
50%
60%
70%
80%
90%
Applies a lot Applies a little Does not Apply
Educators 94% 6% 0%
94%
6% 0%
0%
10%
20%
30%
40%
50%
60%
70%
80%
90%
100%

Page | 30
Graph 9a: I control my spending so I can save what is left over - Learners
Almost two thirds of learners in “trained” schools where the educator had
attended the iCount training indicated that they control their spending to allow
them to save the balance, and close behind at 58%, were the learners from a
“non-trained” school where the educator had not attended the iCount training.
Graph 9b: I control my spending so I can save what is left over –
Educators
On the whole the majority of educators do try to control their spending in order
to save, with 73% saying this applies to them, with 27% saying it applies a little.
Applies a lot Applies a little Doesn't Apply
Non trained schools 58% 33% 8%
Trained schools 63% 29% 8%
58%
33%
8%
63%
29%
8%
0%
10%
20%
30%
40%
50%
60%
70%
Applies a lot Applies a little Does not Apply
Educators 73% 27% 0%
73%
27%
0% 0%
10%
20%
30%
40%
50%
60%
70%
80%
90%

Page | 31
Graph 10a: I ask about how much interest and costs are for any savings
plan - Learners
Again there is a similar profile for learners in both schools where their
educators had been trained at the iCount workshop as well as the school where
the educator had not been trained. The majority of the learners in the non-
trained schools, 39%, indicated that the statement, “I ask about how much
interest and costs are for any savings plan” applies to them a lot whilst 44%
said it applies to them a little, and 17% said it didn’t apply. Amongst learners
whose educators had attended the iCount training 34% said the statement
applied a lot and 45% a little over a fifth said it didn’t apply at all.
Graph 10b: I ask about how much interest and costs are for any savings
plan – Educators
Almost 70% of educators indicated that this statement applied to them a lot,
while a quarter said a little. 6% indicated this didn’t apply to them at all.
Applies a lot Applies a little Doesn't Apply
Non trained schools 39% 44% 17%
Trained schools 34% 45% 22%
39%
44%
17%
34%
45%
22%
0%
10%
20%
30%
40%
50%
Applies a lot Applies a little Does not Apply
Educators 69% 25% 6%
69%
25%
6%
0%
10%
20%
30%
40%
50%
60%
70%

Page | 32
Knowledge of Accountancy content
Graph 11a: I know and can explain the accounting cycle - Learners
When it comes to Accounting content knowledge levels drop somewhat. The
majority of the learners in both the “non-trained” and “trained” schools (50% -
58%) said that know very little about the Accounting cycle whilst 14%-16%
didn’t know at all. Nevertheless, about 36% of “non-trained” and 27% of
“trained” school learners said that they knew a lot about the Accounting cycle
and were able to explain it.
Graph 11b: I know and can explain the Accounting cycle – Educators
The majority of educators, 94%, were confident in their knowledge of this
aspect, with a mere 6% saying they only knew a little.
Applies a lot Applies a little Doesn't Apply
Non trained schools 36% 50% 14%
Trained schools 27% 58% 16%
36%
50%
14%
27%
58%
16%
0%
10%
20%
30%
40%
50%
60%
Applies a lot Applies a little Does not Apply
Educators 94% 6% 0%
94%
6% 0%
0%
10%
20%
30%
40%
50%
60%
70%
80%
90%
100%

Page | 33
Graph 14a: I know about compound interest and simple interest & know
how to calculate them – Learners
Knowledge of compound and simple interest is relatively high amongst both
groups, with 69% of “non-trained” school learners and 63% of “trained” school
learners indicating they know a lot about this aspect. A similar profile in both
groups (22% “non-trained” and 24% “trained”) indicated they know a little about
compound /simple interest, whilst 8% of “non-trained” and 13% of “trained
school learners say they know nothing, i.e. the statement doesn’t apply to them
at all.
Graph 14b: I know about compound interest and simple interest & know
how to calculate them – Educators
A little over 60% of educators indicated that they know a lot about compound
interest and 35% said they knew a little, while 4% said this does not apply to
them. This is important because it was noted in the training that in some
aspects of the Accounting content some educators seemed a little confused
about the difference between the two.
Applies a lot Applies a little Doesn't Apply
Non trained schools 69% 22% 8%
Trained schools 63% 24% 13%
69%
22%
8%
63%
24%
13%
0%
10%
20%
30%
40%
50%
60%
70%
Applies a lot Applies a little Does not Apply
Educators 61% 35% 4%
61%
35%
4%
0%
10%
20%
30%
40%
50%
60%
70%

Page | 34
Graph 15a: I know about income tax and why it is important to pay for
government services – Learners
Awareness of income tax was high amongst both groups but higher in the “non-
trained” school learners, at 69%, than amongst “trained” school learners, at
58%. Those who indicated they know a little were 22% amongst “non-trained”
school learners and 28% amongst “trained” school learners. Finally 8% “non-
trained” school learners and 14% “trained” school learners indicated they knew
nothing.
Graph 15b: I know about income tax and why it is important to pay for
government services – Educators
The majority of educators, 84%, were confident in their knowledge of income
tax, with only 16% saying they only knew a little about this.
Applies a lot Applies a little Doesn't Apply
Non trained schools 69% 22% 8%
Trained schools 58% 28% 14%
69%
22%
8%
58%
28%
14%
0%
10%
20%
30%
40%
50%
60%
70%
Applies a lot Applies a little Does not Apply
Educators 84% 16% 0%
84%
16%
0% 0%
10%
20%
30%
40%
50%
60%
70%
80%
90%

Page | 35
Graph 16a: I know how to calculate gross profit and net profit on sales –
Learners
Awareness of how to calculate gross profit and net profit on sales was
reasonably good amongst both groups but higher in the “non- trained” school
learners, at 53%, than amongst “trained” school learners, at 46%. Those who
indicated they know a little were about a quarter of “non-trained” school
learners and 38% amongst “trained” school learners. However almost a quarter
of the “non- trained” school learners indicated they didn’t know how to calculate
gross & net profit at all, while 17% of “trained” school learners indicated they
knew nothing of this aspect.
Graph 16b: I know how to calculate gross profit and net profit on sales –
Educators
The majority of educators, 96%, were confident in their ability to calculate gross
and net profit on sales, with only 4% saying they knew little about this.
Applies a lot Applies a little Doesn't Apply
Non trained schools 53% 25% 22%
Trained schools 45% 38% 17%
53%
25% 22%
45%
38%
17%
0%
10%
20%
30%
40%
50%
60%
Applies a lot Applies a little Does not Apply
Educators 96% 4% 0%
96%
4% 0%
0%
10%
20%
30%
40%
50%
60%
70%
80%
90%
100%

Page | 36
Graph 17a: I understand what a perpetual inventory system is – Learners
The majority of the learners in both the “non-trained” and “trained” schools
(50% - 45%) said that know very little about the perpetual inventory system
whilst 17%-29% didn’t anything know at all. However about a third of “non-
trained” and a quarter of “trained” school learners said that they knew a lot
about the perpetual inventory system.
Graph 17b: I understand what a perpetual inventory system is –
Educators
About three quarters of educators indicated that they knew a lot about the
perpetual inventory system, with 16% saying they know a little, while 8% said
they did not know.
Applies a lot Applies a little Doesn't Apply
Non trained schools 33% 50% 17%
Trained schools 26% 45% 29%
33%
50%
17%
26%
45%
29%
0%
10%
20%
30%
40%
50%
Applies a lot Applies a little Does not Apply
Educators 76% 16% 8%
76%
16%
8%
0%
10%
20%
30%
40%
50%
60%
70%
80%

Page | 37
Graph 18a: I know about creating a business plan as a budget and how to
work with a budget for a business – Learners
The majority of the learners in both the “non-trained” and “trained” schools
(53% - 52%) said that know very little about creating a business plan as a
budget and how to work with a budget for a business whilst 14%-16% didn’t
anything know at all.
However about a third of both “non-trained” and “trained” school learners said
that they knew a lot about creating a business plan as a budget and how to
work with a budget for a business.
Graph 18b: I know about creating a business plan as a budget and how to
work with a budget for a business – Educators
Creating a business plan as a budget and knowing how to work with a budget for
a business was an aspect that educators do not, on the whole feel very confident
about, with only 47% saying they know a lot and 45% saying they know a little
and 8% saying they know nothing about this aspect of Accounting.
Applies a lot Applies a little Doesn't Apply
Non trained schools 33% 53% 14%
Trained schools 32% 52% 16%
33%
53%
14%
32%
52%
16%
0%
10%
20%
30%
40%
50%
60%
Applies a lot Applies a little Does not Apply
Educators 47% 45% 8%
47% 45%
8%
0%
10%
20%
30%
40%
50%

Page | 38
Graph 19a: I know and can explain account reconciliation - Learners
Most of the learners in both the “non-trained” and “trained” schools (50% - 56%)
said that know very little about account reconciliation whilst 6% of “non- trained”
school learners and about a quarter of “trained” school learners didn’t anything
know at all. However about 44% of “non-trained” and a fifth of “trained” school
learners said that they knew a lot about account reconciliation.
Graph 19b: I know and can explain account reconciliation – Educators
About three quarters of the educators indicated they knew and could explain
account reconciliation, with almost a quarter saying they knew a little about this
and only 6% did not know.
Applies a lot Applies a little Doesn't Apply
Non trained schools 44% 50% 6%
Trained schools 20% 56% 24%
44%
50%
6%
20%
56%
24%
0%
10%
20%
30%
40%
50%
60%
Applies a lot Applies a little Does not Apply
Educators 73% 22% 6%
73%
22%
6%
0%
10%
20%
30%
40%
50%
60%
70%
80%

Page | 39
Graph 20a: I know about financial Accounts and financial statements that
you analyse to determine how well the company is financially – Learners
The majority of learners in “non-trained” schools, 56%, knew a lot about
financial Accounts and financial statements, with about a third saying they knew
a little and only 11% saying they know nothing. Conversely amongst the
“trained” school learners, the majority, 51%, said they only knew a little and a
little over a third said they knew a lot about financial accounts and financial
statements, with 14% saying they do not know.
Graph 20b: I know about financial accounts and financial statements that
you analyse to determine how well the company is financially – Educators
The majority of educators, 84%, indicated they know about financial accounts
and financial statements with only 12% saying they know a little and 4% saying
they know nothing.
Applies a lot Applies a little Doesn't Apply
Non trained schools 56% 33% 11%
Trained schools 35% 51% 14%
56%
33%
11%
35%
51%
14%
0%
10%
20%
30%
40%
50%
60%
Applies a lot Applies a little Does not Apply
Educators 84% 12% 4%
84%
12%
4%
0%
10%
20%
30%
40%
50%
60%
70%
80%
90%

Page | 40
Graph 21a: I know how VAT is calculated and how to complete VAT
returns – Learners
Most of the learners in both the “non-trained” (50%) and “trained” (58%)
schools indicated they knew a lot about how VAT is calculated and how to
complete VAT returns. About 39% - 31% said they knew a little, whilst 11% in
both groups said they knew nothing.
Graph 21b: I know how VAT is calculated and how to complete VAT
returns – Educators
About three quarters of educators indicated they know a lot regarding VAT and
VAT returns with 18% saying they know a little and only 6% indicate they know
nothing.
Applies a lot Applies a little Doesn't Apply
Non trained schools 50% 39% 11%
Trained schools 58% 31% 11%
50%
39%
11%
58%
31%
11%
0%
10%
20%
30%
40%
50%
60%
Applies a lot Applies a little Does not Apply
Educators 76% 18% 6%
76%
18%
6%
0%
10%
20%
30%
40%
50%
60%
70%
80%

Page | 41
Graph 22a: I know that other threats to businesses are external risks
such as fire, floods or theft – Learners
Most of the learners in both the “non-trained” (56%) and “trained” (59%)
schools indicated they knew a lot about external risks to businesses such as
fire, floods or theft. About 39% - 28% said they knew a little, whilst 6%-13%
said they knew nothing.
Graph 22b: I know that other threats to businesses are external risks such
as fire, floods or theft – Educators
Amongst educators 67% were confident in their knowledge about external risks
to businesses such as fire, floods or theft, with 67% saying they know a lot as
opposed to 12% who said they knew a little. However, significantly, about a
quarter of educators said they knew nothing about this, indicating an area of
importance for future training.
Applies a lot Applies a little Doesn't Apply
Non trained schools 56% 39% 6%
Trained schools 59% 28% 13%
56%
39%
6%
59%
28%
13%
0%
10%
20%
30%
40%
50%
60%
Applies a lot Applies a little Does not Apply
Educators 67% 12% 22%
67%
12%
22%
0%
10%
20%
30%
40%
50%
60%
70%

Page | 42
Graph 23a: I know how to calculate operating expenses, operating profit
on sales – Learners
The majority of learners in “non-trained” schools, 47%, knew a lot about how to
calculate operating expenses, operating profit on sales with about 39% saying
they knew a little and 14% saying they know nothing. Conversely amongst the
“trained” school learners, the majority, 45%, said they only knew a little and a
little and 41% said they knew a lot about how to calculate operating expenses,
operating profit on sales, with 14% saying they do not know.
Graph 23b: I know how to calculate operating expenses, operating profit
on sales. – Educators
About three quarters of educators indicated they know a lot about how to
calculate operating expenses, operating profit on sales with 18% saying they
know a little and only 8% indicate they know nothing.
Applies a lot Applies a little Doesn't Apply
Non trained schools 47% 39% 14%
Trained schools 41% 45% 14%
47%
39%
14%
41% 45%
14%
0%
10%
20%
30%
40%
50%
Applies a lot Applies a little Does not Apply
Educators 75% 18% 8%
75%
18%
8%
0%
10%
20%
30%
40%
50%
60%
70%
80%

Page | 43
Graph 24a: I know how to calculate current ratio, acid test ratio, solvency
ratio on business to see if it can survive - Learners
Among both group, “non-trained” and “trained” school learners, about 47%-48%
indicated they know a lot about how to calculate current ratio, acid test ratio,
and solvency ratio on business to see if it can survive. However, about half of
“non-trained” school learners indicated that they knew little and 3% said they
knew nothing. Conversely 34% of “trained” learners knew little whilst 18% said
they knew nothing; an area in need of strengthening.
Graph 24b: I know how to calculate current ratio, acid test ratio and
solvency ratio on business to see if it can survive – Educators
About three quarters of educators knew a lot about how to calculate current
ratio, acid test ratio and solvency ratio on business to see if it can survive, with
18% saying they know a little and 8% who know nothing.
Applies a lot Applies a little Doesn't Apply
Non trained schools 47% 50% 3%
Trained schools 48% 34% 18%
47% 50%
3%
48%
34%
18%
0%
10%
20%
30%
40%
50%
Applies a lot Applies a little Does not Apply
Educators 75% 18% 8%
75%
18%
8%
0%
10%
20%
30%
40%
50%
60%
70%
80%

Page | 44
Graph 25a: I know about values such as integrity and honesty, respect,
fairness that builds trust and how this affects a business amongst its
customers – Learners
Learners in both “non-trained” and “trained” schools are equally aware of the
importance of values such as integrity and honesty, respect, fairness that build
trust and how this affects a business amongst its customers, with 44% of both
groups saying they know a lot. However at least half of the “non- trained”
school learners say they know little about this and 6% know nothing. This
compares with 38% of “trained” school learners who know little and 18% who
know nothing. This is an area in need of strengthening.
Graph 25b: I know about values such as integrity and honesty, respect,
fairness that builds trust and how this affects a business amongst its
customers – Educators
Applies a lot Applies a little Doesn't Apply
Non trained schools 44% 50% 6%
Trained schools 44% 38% 18%
44%
50%
6%
44%
38%
18%
0%
10%
20%
30%
40%
50%
Applies a lot Applies a little Does not Apply
Educators 73% 18% 10%
73%
18%
10%
0%
10%
20%
30%
40%
50%
60%
70%
80%

Page | 45
Knowledge and awareness of insurance products
I understand what insurance does
Graph 26: Know and understand what Insurance does
Overall there is an increase in awareness of what insurance does, with 86%-
84% of learners in both iCount “non-trained” and “trained” schools knowing
what insurance does. The level of financial literacy awareness is higher, in
comparison to the previous study, because all the educators in all schools have
previously attended training, which incorporates financial literacy in all its
modules. Thus awareness of insurance, particularly amongst these Grade 12
learners is high.
In 2012, the results for this question were 63% amongst “non-trained” schools
and 74% amongst “trained” schools. These Grade 12 learners have now
probably been through two to three years of influence from educators trained in
financial literacy from attending previous courses in mathematics or Managing
your Money, and the long term effect can clearly be seen.The following table
shows the statements chosen by those who said yes, they knew what
insurance does.
Learners Educators
Non trained school 86%
Trained schools 84% 78%
86% 84% 78%
0%10%20%30%40%50%60%70%80%90%
100%

Page | 46
Table 1: Choice of statements by those who said yes, they know and
understand what Insurance does
Learners Educators
Non
trained
School
Trained
Schools
Trained
Schools
A plan to help people when they have
problems 35% 35% 50%
A structured savings plan to helps you save
for specific goals, like retirement etc 65% 65% 50%
The majority of learners in trained and non- trained schools chose statement
two, which focuses on a structured savings plan. However it seems that
learners are a little more au fait than their educators, who have a greater
proportion choosing the incorrect statement.
I understand what Educational Insurance does
Graph 27: Know and understand what Educational Insurance does
In total 61% of learners in non-trained schools and 73% of learners in trained,
said that they understood what Educational Insurance does.The statements
chosen by those who had said yes above, are listed in the table below.
Learners Educators
Non trained school 61%
Trained schools 73% 96%
61%
73%
96%
0%10%20%30%40%50%60%70%80%90%
100%

Page | 47
Table 2: Choice of statements by those who said yes, they know and
understand what Educational Insurance does
Learners Educators
Non
trained
School
Trained
Schools
Trained
Schools
Educational insurance is money you save
into an insurance policy so that when you
need it for tertiary education you have
something to help 77% 88% 98%
Education insurance is only worthwhile if you
can save for more than 10 years 23% 12% 2%
The majority of learners in both “trained” and “non-trained” schools, who said
they knew about Educational Insurance, chose statement 1, which is a simple
statement outlining what is Educational Insurance.
I understand what Short-term Insurance is
Graph 28: Know and understand what short term insurance does
Overall only 53% of learners in non-trained schools and 60% in trained schools
said they knew about Short-term insurance. They were looking at the multi-
choice questions so they didn’t have to guess. Amongst educators most also
said they knew what it was.
Learners Educators
Non trained school 53%
Trained schools 60% 92%
53% 60%
92%
0%10%20%30%40%50%60%70%80%90%
100%
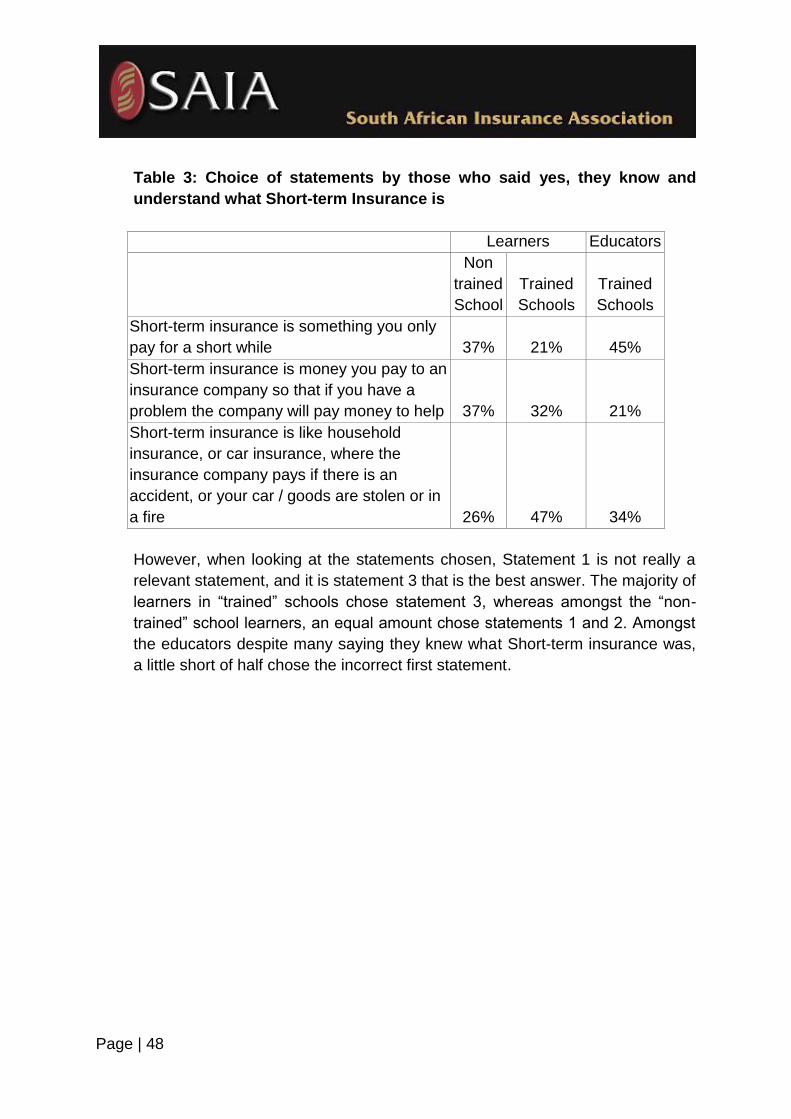
Page | 48
Table 3: Choice of statements by those who said yes, they know and
understand what Short-term Insurance is
Learners Educators
Non
trained
School
Trained
Schools
Trained
Schools
Short-term insurance is something you only
pay for a short while 37% 21% 45%
Short-term insurance is money you pay to an
insurance company so that if you have a
problem the company will pay money to help 37% 32% 21%
Short-term insurance is like household
insurance, or car insurance, where the
insurance company pays if there is an
accident, or your car / goods are stolen or in
a fire 26% 47% 34%
However, when looking at the statements chosen, Statement 1 is not really a
relevant statement, and it is statement 3 that is the best answer. The majority of
learners in “trained” schools chose statement 3, whereas amongst the “non-
trained” school learners, an equal amount chose statements 1 and 2. Amongst
the educators despite many saying they knew what Short-term insurance was,
a little short of half chose the incorrect first statement.

Page | 49
I understand what Household Insurance is
Graph 29: Know and understand what household insurance does
The majority of learners from both “trained” and “non-trained” schools (79%-
81%) said they knew what household insurance was.The majority of learners
from both “trained” and “non-trained” schools (79%-81%) said they knew what
short term insurance was.
Table 4: Choice of statements by those who said yes, they know and
understand what Household Insurance is
Learners Educators
Non
trained
Schools
Trained
Schools
Trained
Schools
Household insurance is an insurance
policy so that if your house burns down the
company will pay to rebuild it 48% 40% 36%
Household insurance is an insurance
policy that will pay to replace things inside
your house if burnt, or damaged in a flood,
or stolen 52% 60% 64%
Learners Educators
Non trained school 81%
Trained schools 79% 71%
81% 79% 71%
0%10%20%30%40%50%60%70%80%90%
100%

Page | 50
This was a bit of a trick question, as the wrong answer was place first.
However, it is significant that, as opposed to the results in 2012, when this was
chosen by the majority of learners, the Grade 12’s in the 2013 study mainly
chose the correct answer, with a little over half of the learners in the “non-
trained” school and about 60% of learners from the “trained schools”. There is a
similar profile amongst the educators.
I understand what All Risks Insurance is
Graph 30: Know and understand what All Risks insurance does
Only 50% of learners in the “non-trained” school, compared with 66% of
learners from the “trained: schools claimed to know what All Risks Insurance
was. The level of claim amongst educators also indicates some hesitancy in
claiming knowledge despite a multiple choice question.
Learners Educators
Non trained school 50%
Trained schools 66% 53%
50%
66%
53%
0%10%20%30%40%50%60%70%80%90%
100%

Page | 51
Table 5: Choice of statements by those who said yes, they know and
understand what All Risks Insurance is
Learners Educators
Non
trained
School
Trained
Schools
Trained
Schools
An all risks policy is insurance for your
personal stuff, e.g. cell phone, iPod,
shoes, text books, etc. 22% 36% 44%
An All Risks Policy will insure you
personally for all risks, like if you have
an accident 78% 64% 56%
Here statement one was correct and statement two was incorrect. Amongst
learners in the trained schools 64%% chose the correct statement and 78% of
learners in the non- trained schools chose the incorrect statement. Amongst
educators a little over half chose the incorrect statement.
4.3 Recommendations
The impact of the iCount training was significant, both in improvement of the
level of confidence in the knowledge of the educators and also in the impact
on the learners, as seen in the full research results.
The natural extension of this is to recommend that iCount workshops be
conducted in all grades of FET, replicating the roll out that has been made
with Managing Your Money workshops.
The research found that there are surprisingly few educators present in the
high schools teaching accountancy. The related recommendation is to
include all possible educators in the workshops. It is also clear that alternate
ways of reaching learners, who do not have teachers, must be explored,
and innovations like the "knowledge box" should be used to reach learners
directly, where there is an absence of teachers, and on-going distribution of
the iCount content should be considered for new teachers joining schools
without training or content.

Page | 52
The content of iCount was seen as useful by both teachers and learners,
and the content writing team should continue to develop content that brings
financial literacy into the subject of Accounting. In addition to this existing
content, continuing to bring detailed aspects of financial literacy into content
is also important.
The impact on knowledge gain is clear from the responses, the change in
attitudes towards finance and risk is noted. What is seen as most significant
is the change in behaviour, which was not anticipated at this stage as
behaviour change is expected after time.
In these findings, the unexpected aspect was the actions taken by teachers,
who have been on the course, to seek and actually acquire appropriate
additional insurance to cover their risks.
In order to get an on-going measure of financial literacy impact, the project
strongly recommends continued work and cooperation with principals and
teachers in the schools visited and ask them to provide the results of the
accountancy tests for their learners at Grade 10, which is the level of
student that has been interviewed. It would also be good to later assess
their matric results for accountancy against the national or provincial
average. It is only the final results for the year that will give us a proper
measurement of impact.
To expand the iCount project to focus on the senior phase (Grade 7 – 9)
Economic and Management Sciences (EMS) teachers who are tasked with
preparing the learners for the Further Education and Training (FET) band of
Grade 10 – 12. The problem being that most EMS teachers are not trained
in the Accounting component of their subject. This negative attitude towards
Accounting is seriously influencing the number of learners choosing
Accounting as a subject for Grade 10; to such a serious degree that many
districts have reported that they are closing the Accounting subject down as
there are insufficient learner numbers to qualify for teacher allocations. This
means that in three years from now, a serious shortage of matriculants who
have Accounting will impact on intake at university level into the commercial
degrees and diplomas. The ripple effect will be felt in the economy as a
whole within a few years when a shortage of qualified commerce personnel
is felt.

Page | 53
To make the iCount resource available in Afrikaans as this is the only other
language that Accounting is offered in at Grade 12 level for matric exams.
The Grade 10 version has already been translated, courtesy of the Western
Cape Department of Education. They have offered to translate the Grade 11
and 12 versions as well. The Afrikaans version in PDF format should be
distributed via the Knowledge Boxes as well as email versions to all the
provincial heads of Accounting for further distribution to the District Offices.
Also requested by several teachers where dual medium teaching is found.
To maintain the current model and quality of workshop format that includes
a main focus on lesson demonstrations. The participants found the practical
nature of the format to be very useful and empowering to the teachers. The
most mentioned item on the evaluation forms related to the facilitation skills
and the mode of presentation.
To include the development of a learner workbook which is easy to
photocopy and provide to learners. These could include worksheets,
assignments, tests and exam-type questions. Some teachers also
mentioned this on their evaluation forms.
To build in a competition where some technological equipment, i.e. laptop or
data projector is won by teachers. There is a great need for resourcing of
the schools and the teachers are very intrigued and hungry for technology
which could be used to enhance teaching in the Accounting classroom.

Page | 54
5 Community Radio Project
5.1 The Project
This project was funded by the SAIA and FSB to promote financial literacy
amongst all South African adults. The project attempts to make a difference in
the lives of South Africans by improving their knowledge, skills, and attitudes
and developing behaviours, which showed critical and selective engagement
with financial products, to build the required knowledge to be good life and risk
managers. The financial education was delivered through a radio “soap” drama
programme on two public broadcast stations, RSG and Ukhozi FM, through a
series of 26 episodes on each station.
Each episode was followed immediately by a live call in session with a topical
expert. The radio drama, as well as the follow-up programme, was broadcast in
the different languages of the respective radio stations. The impact of the
project was measured through a mixed methods quasi-experimental approach,
using both quantitative and qualitative.
5.2 Project Background
The concept of the Financial Freedom project was aimed at promoting financial
inclusion across various low-income populations in South Africa. The majority
of people on the African continent do not use formal financial services.
The lack of access is both a symptom and a major cause of poverty since the
low-income population are not able to benefit from the savings vehicles,
transaction functionality, risk management tools and various wealth-building
options offered by supervised financial institutions, perpetuating financial
problems. When this project was conceptualised in 2008, the South African
financial services industry, as well as the media industry only considered radio
suitable for entertainment and the provision of basic information, but limited the
potential educational role of radio.

Page | 55
No credible research project had been completed to prove the impact of
educational radio projects other than some anecdotal evidence. A radio
drama/soap format has shown to be very successful in health education, and
has now been applied to financial education successfully. In the 2012/13
consumer education campaign, the project was extended to the languages of
reach: Ukhozi FM in isiZulu, which has the most listeners in Africa and RSG in
Afrikaans which has the widest signal reach on land in South Africa.
Radio was chosen as the delivery mechanism for this project as radio in South
Africa reaches listeners in their own languages and in their communities. The
latest radio audience measurement share (RAMS) indicates a listenership of
94.4% of the South African population, the widest reach of any media in South
Africa. The objective was to investigate the use of radio as a delivery
mechanism for financial education to reach many people in a cost effective and
interesting way resulting in increased financial literacy and capability.
Education-Entertainment and Edutainment and Media for Social Change
models were used to develop the content. Both the radio research approach
and sampling approach were based on past South African Broadcast
Corporation (SABC) radio practice and research, as well as the Soul City and
ABC Ulwazi models.
Financial Freedom was a programme that appealed to rural, peri-urban and
urban audiences, due to the mix of characters. The intention was to appeal
more to the rural and peri-urban audiences than the urban one, based on the
assumption that opportunities for financial education are more readily available
to urban audiences; however, because of the nature of a radio audience, all
three geographic groups were included in the research.
The various interactions and evaluation methodologies indicate that the
programme had a greater impact on rural audiences.
Specifically, a greater number of callers were from rural areas. Callers who had
never heard of insurance products and the increasing questions on details of
risk management showed progress around knowledge and confidence on
financial issues and risk management. The location of the callers was identified
through both a direct response question (where are you calling from) but also
from their language. It was possible to correlate the claimed calls with the
received calls.

Page | 56
Financial Freedom Storyline and Delivery
Financial Freedom was developed as a radio “edu-drama” format in which the
characters were developed to play a specific educational and dramatic role.
The content matrix was a core element of storyline development and
educational messaging aligned to story arcs and the development of characters
and life events that were relevant to the listeners. This process ensured that the
storylines and characters were both compelling and educational.
One of the characters, Dumi, provided the correct and knowledgeable
information about financial management. His role in the drama was to assist
with knowledge and information development, and good role modelling for
financial behaviour. He saved money; he insured his goods and acted ethically
and knowledgeably in all situations. Other characters followed a story arc of
development of new knowledge and behaviours, but also following dramatic
story arcs of poor choices and their consequences. This use of dramatic
narrative ensured that audiences remained compelled by the events, yet also
learnt along with the failures and successes of the characters they may identify
with. This included the challenges and solutions regarding life events, risk and
the core financial behaviours like savings, debt reduction and financial services
related to these life events.
Production Process
Twenty-six (26) episodes of Financial Freedom were produced and broadcast
on the SABC radio stations with the widest reach: Ukhozi FM (1.86 million
listeners to this programme and RSG with 155 000 listeners to this
programme). The service provider, Bright Media worked with each of the
stations to ensure the localisation of each of the language versions. There is a
specific way of ensuring localised versioning that includes cultural and linguistic
sensitivity, to ensure that the characters are adapted according to local norms
and customs for each audience. By using local production teams, this
“versioning” as opposed to “translation” of master scripts ensured relevance
and compelling content for each audience.
Other development processes built into the production process were workshops
with the radio stations that had not produced radio drama recently to ensure the
process was completed as planned.

Page | 57
Call in sessions with industry “experts”
The intention of the call-in sessions after each episode was to stimulate full
interaction with the audience and to ensure that ordinary people had the
opportunity to take some of the topics further in a question and answer session.
In order to prepare for this interactive segment, the SAIA and FSB gathered a
voluntary panel of experts drawn from their member companies who are
proficient in the languages of the stations. A workshop was held to ensure the
radio “expert” element ran neutrally with no mention of specific companies, and
that experts were prepared for the Question and Answer sessions to ensure
that they provided sufficient answers for the callers, and had sufficient
information to refer specific product enquiries to the neutral call centre. The
audiences responded very well to the localised, first language edutainment
programme, “the first time someone spoke my language – I understand about
saving and risk and that insurance is also something for me.”
5.3 The Project Context
The most important reason to use radio has been the success in impact: we
have shown that we can educate the population about insurance products so
that they can understand them and use them more effectively through good
financial management decisions. Those who already have such products could
use their products more effectively while those who have yet to acquire such
products would be in a position to make informed decisions about which
products (if any) suit their needs. In addition, we were aware of the fact that
people in the lower income groups are moving upwards and becoming
increasingly engaged with financial products in South Africa. People may start
to acquire more complex products available while not being informed about
them. Consumer education has been highlighted by the South African National
Treasury as the most important element that the financial sector can focus on,
in order to make a better South Africa.

Page | 58
Analysis of the impact of the project according to the ‘Theory of Change’
The three developmental phases are:
Inform Phase: This phase forms the foundation for later development of
support for the change. It prepares people for changing their behaviour.
This phase consists mainly of making people aware of change and why
the change is occurring. The wide radio listener group for the drama
does this by creating wider awareness of the need for financial planning,
and then more specifically for risk products.
Educate Phase: This phase marks a passage into an understanding of
what the change means for them. This enables people to begin making
decisions about whether to accept or reject the change. During this
phase, the stakeholders begin to understand how the change will directly
impact them and their routines; and, it will be necessary to present
information about the change that promotes a positive perception. This is
done by the actual learning through the radio drama and the radio
presenter-led programme to change knowledge and develop new skills
through the radio drama.
Commit Phase: The change is implemented during this phase.
Everything up to this point has been preparation for the change. During
this phase the change is acted upon and becomes part of everyday life
for the stakeholders. For our project, this is the callers phoning in, asking
for more information and calling the phone line.
The seven commitment stages are:
Contact: The earliest encounter an individual or group has with the fact
change is taking place (e.g., an announcement or memo).
Awareness: The individual or group has a working knowledge of the
change.
Understanding: The individual or group demonstrates comprehension
of the nature and intent of the change (i.e., what will be expected of
them).

Page | 59
Positive Perception: The individual or group develops a positive view
and disposition toward the change.
Adoption: The change has been used long enough to demonstrate its
worth and impact on the organisation or community.
Institutionalisation: The change has durability, and continuity, and has
been formally incorporated into the routine operating procedures of the
organisation or community.
Internalisation: Organisational members are highly committed to the
change because it is congruent with their personal interest, goals or
value system.
5.4 The Research
Baseline
The baseline survey was conducted in November 2012 amongst the Ukhozi
Listeners who took part in the initial monitoring and evaluation study. The
respondents were asked if it would be possible to contact them again later in
2013 at the end of the broadcast period to conduct a further interview.
The sample size at the baseline study was 60 respondents per site, 20 in
urban, 20 in peri-urban and 20 in rural areas, with the anticipation that a
minimum of 50 per site would be available for participation at the endline stage.
The original sample was selected using a random scientific sample of radio
listeners in each of the broadcast footprints. As independent verification of
listeners, the profile of listeners to Ukhozi was drawn from the South African
Advertising Foundation (SAARF) radio audience measurement survey (RAMS)
to provide an overall profile of listeners.
Target Audiences
The target audience at the baseline study was all those people over the age of
18 who listen to the SABC station (commonly known as Public Broadcast
Service ‘PBS’) on Ukhozi FM.

Page | 60
Data collection methods
At the mid-term stage the respondents were telephoned using the contact
details garnered at the baseline stage, and a short five minute interview was
conducted telephonically.
Ukhozi FM – Zulu broadcast, based in KwaZulu Natal, with the
interviews taking place around Durban and environs.
RSG FM – Afrikaans broadcast, based in both Cape Town and
Johannesburg, reaching the widest land area through its signal in South
Africa.
Sample design
The universe of the survey was composed of people living in households that
are based within the specified sampling areas within the broadcast footprint of
the five chosen public radio stations and who are in the LSM groups, 1 to 8.
These households were spread across the sample areas, with Durban the key
area for the Ukhozi listeners. From the urban areas the sample spread out to
the peri-urban and surrounding rural areas to ensure that all LSM groups were
available for this survey. The spread included townships, informal settlements,
peri-urban areas and rural villages. The survey included all people/communities
over 18 years of age living in households / structures / hostels, with the
exclusion of those living in special institutions, hospitals, prisons and such.
Permanent members of the households also formed part of the universe
available for the study.

Page | 61
6 Project Impact (Ukhozi FM)
6.1 Profile of Participants
Based on the RAMS data, it is estimated that approximately 1,095,000 listeners
of Financial Freedom are from LSM 1-4 followed by LSM 5-7 with a listener
base of 842,000. This means that the total listener base of 1,9 million listeners
on average tuned in to Financial Freedom in the initial period and 1.7 million in
the later period.
6.2 Main Findings
In total, out of 56 respondents who we attempted to contact, 31% had listened
to the programme, 44% had not listened, and 25% were not contactable.
Reasons for not listening to the programme: In total about 15% were either
too busy or exhibited insufficient interest, while 10% would be interested in
future and a couple had no access to radio during the broadcast times.
Amongst those who listened to the Financial Freedom programme on Ukhozi
FM from 09h30 to 10h00 on Tuesday and/or Thursday mornings, i.e. 55% of
the sample, almost all, 97% (30 out of 31) of those who listened, liked the
programme and had no criticism of the programme. Only one person did not
like the programme.
The one respondent who did not like the programme was more because he felt
he already had this information from listening to earlier radio programmes or on
television.
Reasons for liking the Financial Freedom programme: about 67%
mentioned some aspect of insurance. It is a quite significant number of people
who mentioned some aspect of household contents and homeowners policies
and the need for both types of insurance. Some also mentioned that as a
consequence of listening to the programme they went and took out cover,
particularly on the aspect of household contents insurance.
It was also significant that a number of respondents also mentioned the aspects
of budgeting and saving as being something that the programme covered that
was of interest to them.

Page | 62
Measurement of Radio Audience for of listeners to the 13 episodes
Ukhozi FM
Source: Radio Diary (SA) 2013/2 Jan/May 13 Adult 15+
Weight: All Adults
Table - All Adults 15+
Units : 1000's
Radio Diary
(SA) 2013/2
Jan/May 13
Adult 15+
Radio Diary
(SA) 2013/2
Jan/May 13
Adult 15+
Radio Diary
(SA) 2013/2
Jan/May 13
Adult 15+
Radio Diary
(SA) 2013/2
Jan/May 13
Adult 15+
Total Men Women Blacks
Total RAMS Sample 34 935 16 880 18 056 26 785
0930-1000 Tue - Ukhozi FM 1 029 413 617 1 029
0930-1000 Thu - Ukhozi FM 1 043 390 653 1 042
Radio Diary
(SA) 2013/2
Jan/May 13
Adult 15+
Radio Diary
(SA) 2013/2
Jan/May 13
Adult 15+
Radio Diary
(SA) 2013/2
Jan/May 13
Adult 15+
Radio Diary
(SA) 2013/2
Jan/May 13
Adult 15+
15-24 25-34 35-49 50+
Total RAMS Sample 9 820 7 906 8 814 8 395
0930-1000 Tue - Ukhozi FM 236 249 257 288
0930-1000 Thu - Ukhozi FM 251 224 257 312
Radio Diary
(SA) 2013/2
Jan/May 13
Adult 15+
Radio Diary
(SA) 2013/2
Jan/May 13
Adult 15+
Radio Diary
(SA) 2013/2
Jan/May 13
Adult 15+
LSM 1-4 LSM 5-7 LSM 8-10
Total RAMS Sample 8 234 17 448 9 253
0930-1000 Tue - Ukhozi FM 579 391 59
0930-1000 Thu - Ukhozi FM 516 451 77
The results from the above survey conducted by the South African Advertising
and Research Foundation (SAARF) on radio listenership of programmes
indicates that the main listener base for Financial Freedom is LSM 1-4 with
1,095,000 listeners, followed by LSM 5-7 with a listener base of 842,000.
The overall age of the listeners is fairly even across the age groups, with a
higher listenership amongst the over 50+s at 600,000 (28.9%), followed by the
35-49 year olds at 514,000 (24.8%).

Page | 63
The gender is interesting because the RAMS total sample reflects the SA total
population according to the census 2011. However the listenership is
essentially 61% females to 39% males. The fact that this programme is aired in
the mornings on a weekday would probably reflect this sample. Finally, in terms
of population groups, the only group really listening to this were Blacks, with no
Whites or Coloureds and a very small number of Indians.
6.3 Conclusions
The results indicate that the listenership of Ukhozi FM Financial Freedom
programmes is a highest amongst the lowest LSM groups. Comments
emanating from this short, mid-term study indicate that not only are the
respondents recalling the content, but their use of the language to describe
what they have learnt indicates that the Financial Indicators as outlined in the
proposal are being met in terms of the changes in understanding and the
impact on behaviour from listening to these programmes. The timing, i.e. early
mornings, sees more females listening to the programme. Males who are
working either do not have access or are too busy to listen. The change in the
profile from the RAMS sample to the listeners of Ukhozi FM indicates the effect
of the programme times on the listeners. The overall number of listeners is high
with a total of 2,072,000 listeners tuning into the programmes on Tuesdays and
Thursdays during the week.
6.4 Recommendations (Ukhozi FM)
This programme definitely seems to answer the needs of the Ukhozi FM
listeners, and this is remarkable because all of those who were contacted had
already taken part in the initial monitoring and evaluation study during 2010 –
2011. The interest in financial literacy is high and people wanted more
interventions. The study also revealed that the broadcast times of the
programme is important as this would ensure that males listeners are also able
to listen to it. It is therefore recommended to schedule the programme when
men are also able to listen, particularly in the evenings.

Page | 64
7 Radio Sonder Grense (RSG)
7.1 Findings
This report reflects on the endline results for the broadcast on Radio Sonder
Grense. Originally 59 respondents were recruited with the intention that
approximately 50 would be available for interview by the time of the endline
survey. Contact was made with 44 respondents, and 30 had listened to the
Financial Freedom programme. The profile of these 30 was aligned to the
profile of the radio station, i.e. predominantly upper LSM, higher income.
Therefore although in some respects the results of the endline survey over the
baseline are very positive, this needs to be considered in the light of the
adjusted proportion of upper LSM respondents.
In some respect, quite possibly because of the skew towards the upper LSM,
the results of the responses are remarkably high, with 100% levels of
awareness in some instances. In addition, because of high levels of response
and awareness at the initial baseline, some of the increases appear low, but
this may well be the difference between 97% at baseline to 100% at endline.
Foundation of Financial Literacy Part 1
The key question at this stage was to determine the percentage increase in the
number of people who are able to develop a budget for money management.
At this endline stage 80% of the participants said they could actually work out
from their income and expenses how much they will have to live on. Slightly
less, 77% said they actually write down their budget plans. This is a reasonably
high figure, an 11% increase on the baseline who now write down their
budgets. This skill is an actual behaviour change to planning your money
actions.
Foundation of Financial Literacy part 2
The area of focus at this section was on planned financial behaviour and it was
important to determine the percentage increase in the number of people who
take actions aligned to the budget and plan. From the current assessment,
about three quarters of participants endeavour to pay their bills regularly and try
to save money from what they have left of their income after they have paid
their bills and accounts. This is a key indicator, showing the percentage of

Page | 65
people who take actions aligned with their plan, including the payment of their
bills.
Savings as a basis for Financial Security
There is every indication that high levels (60%) of participants understand the
value of savings, with about half understanding the value of savings as the
basis for financial security. About 73% already have a plan in place to save,
with the balance of participants (about 30%), saying they will do so “once their
financial situation improves”. Savings mechanisms vary, with about 80% of
participants having a bank savings account and 20% have a post office savings
account. A further 10% have an investment account and many also save
through insurance policies.
When it comes to saving for an unexpected future event or to provide money
for their families in an emergency, about 73% say they save for such a
situation. There has been a significant drop of 34% amongst those who said
they save for something they know about. This may not necessarily reflect a
change in savings pattern, but, as the profile at the endline is largely upper
LSM in nature, this may indicate that they have a different spending pattern.
Cumulative savings indicator as a basis for financial security
Ownership and awareness of bank accounts is high with 80% of participants
having a savings account at a bank and 10% having a current account, while a
further 10% have an investment account, and 2% opening one since listening
to Financial Freedom. A further 20% have a savings account with the Post
Office. Awareness of different savings options was high at 80% overall, but
what is significant here is that the percentage of listeners 50-53%, who said
that insurance was another savings option for them, showed a significant
increase of 53% from the baseline.
Finally, there is also a high level of awareness of respondents saying they are
able to compare and select a financial product that suits them best. This is also
one of the key indicators of the beginnings of an appreciation of risk
management, which is the basis for appreciation of insurance products.

Page | 66
Knowledge of various Financial Products
Awareness of financial products and instruments is high amongst the group of
higher LSM listeners on RSG, with 100% saying they know what a loan is, what
interest on a loan is and what Hire Purchase is. There is, in some cases a slight
increase on the baseline because the baseline figure was high in the first
instance, i.e. 80% at baseline and endline who said they knew another savings
option.
The majority appear to have a clear grasp of interest rates and their impact on
savings interest and interest charged on credit. Furthermore, there is also an
indication of a reasonable understanding of the consequences of debt. It is also
important to note that 65% of participants stated that unstable financial
circumstances would necessitate a visit to their insurance company to
renegotiate their insurance policy arrangements.
Increasing awareness, understanding & choice of Insurance products
The project aimed to enable listeners to be able to make choices and show
behaviour change towards greater financial capability with regard to their
knowledge of the various insurance options, indicate consideration of different
types of insurance products that are suitable for them, and to understand the
differences between various insurance products.
Ownership of insurance products is proportionately higher amongst the
changed LSM profile from the baseline study. Car insurance is now the highest
at 60%, followed by medical insurance at 53% and life and household
insurance at 47%. Awareness of all insurance products covered in this study
was high with over 90% awareness of the products. In addition there is an
increased proportion of ownership of insurance products. Also of significance is
the high level of awareness of aspects surrounding insurance, such as
awareness of implications regarding making an insurance claim, what to do if
the insurance company will not pay, what is insurance fraud, etc.
Cumulative Behaviour Change
As previously mentioned, there is every indication that high levels (60%) of
participants understand the value of savings, with about half understanding the
value of savings as the basis for financial security. About 73% already have a
plan in place to save, with the balance of participants saying they will do so
“once their financial situation improves”. Savings mechanisms vary, with about

Page | 67
80% having a savings account at a bank and 20% having a post office savings
account. Further 10% have an investment account and many also save through
insurance policies.
The level of understanding of financial products, and respondents’ ability to
compare products is high and these indicators show that in terms of financial
products, respondents have grasped quite clearly the concept of interest
understand it and its implication in various financial products. Over 90% overall
appear to have a clear grasp of interest rates and their impact on savings
interest and interest charged on credit.
There is also indication of a reasonable understanding of the consequences of
debt. It is also important to note that 65% said that unstable financial
circumstances would necessitate a visit to their insurance company to
renegotiate their insurance policy arrangements. In terms of regular
contributions to savings accounts and other savings mechanisms, overall 63%
of participants say they save for a future unexpected event. In addition, those
who claim to save regularly in any format, were 60% overall. In both instances
there was a 7% increase on the baseline study.
Budgets and Budgeting
There is a relatively high level of awareness of what money participants have
coming in (income) as well as their expenses and costs for the month
(expenses), with approximately 77% of respondents saying they write down a
budget or financial plan, an improvement of 11% on the baseline study. This is
important because of the need to ensure that financial products are contributed
to regularly.
Savings
There is a high level of awareness of the need to save, with almost all
participants having a savings account of some sort, many with more than one
type of account. Overall 80% have a bank savings account, 20% save in a post
office account, 10% have a current bank account and 10% have an investment
account.

Page | 68
Awareness, knowledge and ownership of insurance products and other
financial products
The level of understanding of financial and insurance products is reasonably
high, with high levels of ownership of insurance products; 47% having life
insurance, 30% having a retirement annuity and 27% with endowment policies.
The awareness of short-term products was significantly higher with 60% having
vehicle insurance, 47% have household contents insurance, 40% have funeral
insurance and 30% have all risk insurance. Although ownership of insurance
products is high, it must be remembered that the profile of the endline
respondents is more amongst the upper LSM group; therefore the increase
should be seen in proportion to the size of the sample. Nevertheless, this
segment of the population, in the higher income categories, once made aware
of the risks, seems to have taken steps to cover themselves.
Sources of financial advice
Participants were simply asked what sources people used for financial advice
and information. The question about radio programmes came midway in the
questionnaire, so there was no possibility of the interviewers selecting it in
order of priority. Nevertheless, this source was rated second highest at 93%, an
increase of 57% on the baseline study.
7.2 Measurement of Radio Audience for RSG
The results of the RAMS (Radio Audience Measurement Survey) produced by
the South African Advertising and Research Foundation (SAARF) shows that
RSG attracted a total audience of 155,000 Afrikaans speaking listeners who
listened to the programme, from January to May 2013.
The LSM profile for RSG is essentially 7-10 and the RAMS support this with
over half of listeners at 55%, who are LSM 8 -10 and 35% at LSM 5 - 7. The
lowest LSM, which this programme was originally designed to address, only
has a reach of about 10% amongst the LSM group 1 - 4. The overall age of the
listeners is skewed to an older age group, in line with the profile of the radio
station with the 50+ age group at about 59% and the 35 - 49 age group at 21%.
Listenership amongst the younger age groups was 15.5% amongst the 25 - 34
year olds and 13.5% amongst the 15 -24 year olds. Finally, in terms of
population groups, the Afrikaans speaking listener group for RSG was
predominantly white, at 58%, with 31% Coloureds and 11% Black.

Page | 69
7.3 Recommendations (RSG FM)
Bright Media was aware of the different profile of the RSG listeners and worked
closely with the SABC to develop programmes around the central drama to
reflect the needs of the listener base¸ which was predominantly the upper LSM
group. Amongst those listeners who enjoyed listening to Financial Freedom,
almost all those who listened to the programme, there was an increase in levels
of awareness and behaviour change amongst these listeners. Therefore if this
programme is planned to continue on RSG, the changed approach needs to be
continued. However, from the RAMS and from the results of the endline study,
the lower LSM listeners who were initially targeted are not really being
addressed by the programme on this radio station, with only 10% of the LSM 1-
4 listeners being recorded by the RAMS results.
There is an opportunity to reach non-white Afrikaans speakers – yet from the
research, it is clear that the station loses these listeners. The lower LSM
Afrikaans speaking population needs an accessible and relevant station with
access to these consumer education programmes, which have been so
accepted by other PBS radio stations.
# 112957


