December 31, 2011 Saint Paul Early Childhood Scholarship Program Evaluation Final Evaluation Report 2008-2011 SRI Project 18280 Submitted to Duane Benson, Executive Director Minnesota Early Learning Foundation 2021 E Hennepin Ave, Ste 250 Minneapolis, MN 55413 Prepared by SRI International Erika Gaylor Donna Spiker Cyndi Williamson Kate Ferguson
Transcript
December 31, 2011
Saint Paul Early Childhood Scholarship Program Evaluation
Final Evaluation Report 2008-2011
SRI Project 18280
Submitted to
Duane Benson, Executive Director Minnesota Early Learning Foundation 2021 E Hennepin Ave, Ste 250 Minneapolis, MN 55413 Prepared by SRI International Erika Gaylor Donna Spiker Cyndi Williamson Kate Ferguson
i
Acknowledgements
The SRI International evaluation team would like to gratefully acknowledge and thank all the many participants and colleagues who worked so hard and diligently to support the evaluation and make it a success. These include the scholarship model developers and implementation staff, the early childhood education (ECE) program directors, teachers and other ECE program staff, the parent mentors, the Saint Paul Public School administrators, principals and teachers who participated in the kindergarten outcome assessments, the staff and Board of Directors at the Minnesota Early Learning Foundation, our research consortium colleagues at the Center for Early Education and Development at the University of Minnesota and at Child Trends, the parent interview staff at LHK Partners, Inc., the cost study staff at the RAND Corporation, and the Technical Work Group. We especially want to give a special thanks to the families who participated in the evaluation. Their participation contributed to the many lessons learned from the evaluation that will assist in supporting early learning for future cohorts of Minnesota’s young children.
Suggested citation: Gaylor, E., Spiker, D., Williamson, C., & Ferguson, K. (2011). Saint Paul Early Childhood Scholarship evaluation: Final evaluation report–2008-2011. Menlo Park, CA: SRI International.
For additional information and reports, see:
http://www.melf.us/ and http://policyweb.sri.com/cehs/
ii
Contents Acknowledgements ........................................................................................................................ i
Executive Summary ..................................................................................................................... vi
Scholarship Model Description and the Evaluation ................................................................ vi
Data Collection Methods ........................................................................................................ vii
Sample of Participating Children and Families ...................................................................... vii
Summary of Major Evaluation Findings ................................................................................ viii
Implications of Scholarship Evaluation Findings ................................................................... xiii
Literacy, Early Math Skills, and Behavior .................................................................................... 52
Baseline, One-Year, and Kindergarten Entry Child Assessment Outcome Data .................. 52
Sample of Children and Families .......................................................................................... 54
Imputation of Missing Data .................................................................................................... 55
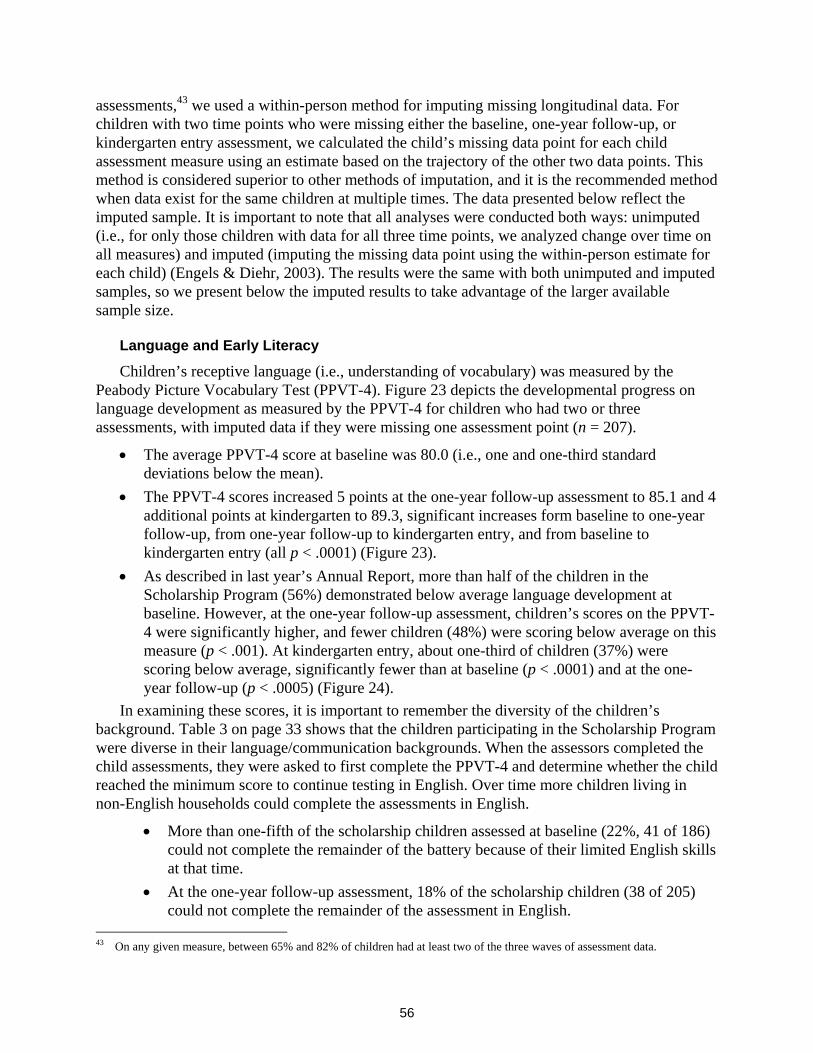
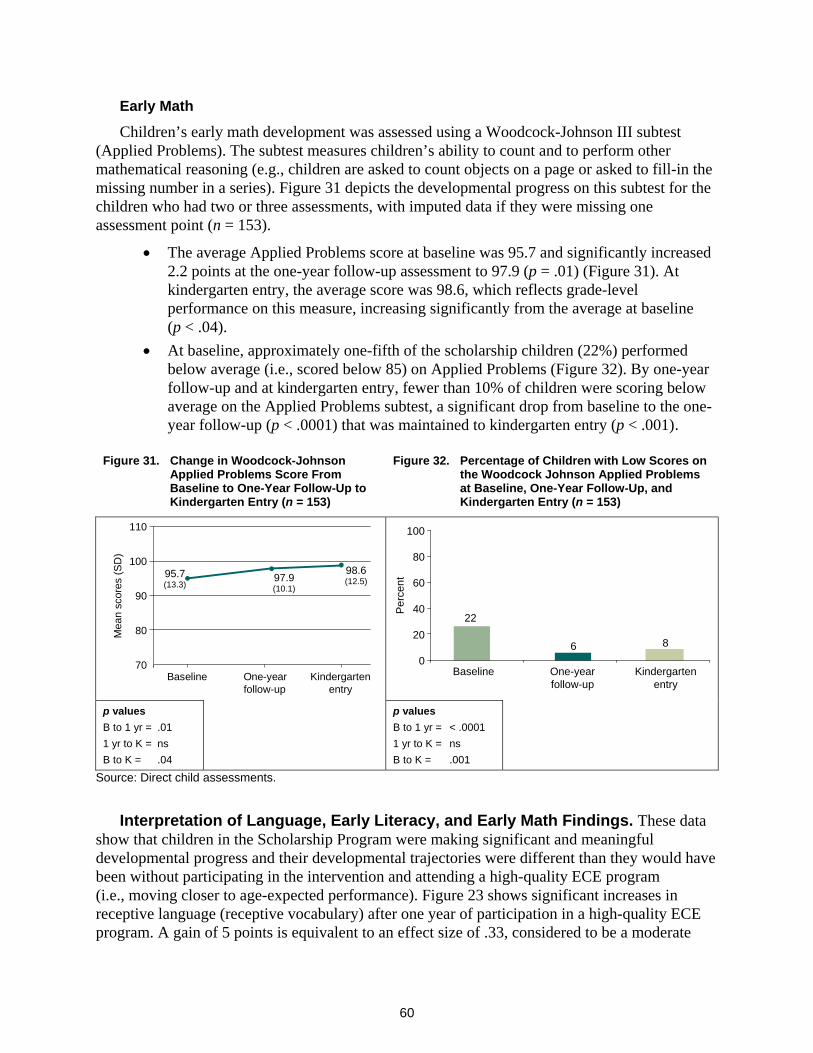
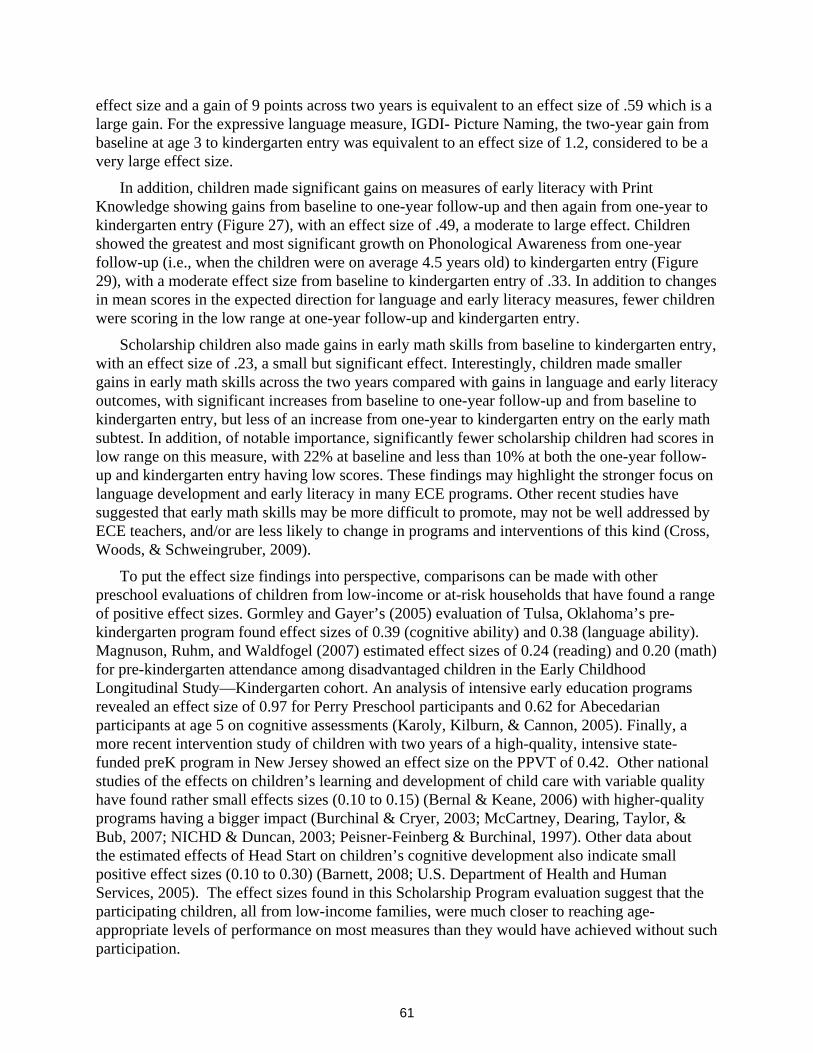
Interpretation of Language, Early Literacy, and Early Math Findings. .................................. 60
Findings: Kindergarten Outcome Data on Scholarship Versus Comparison Group on Children’s Language, Literacy, Early Math Skills, and Behavior ............................... 67
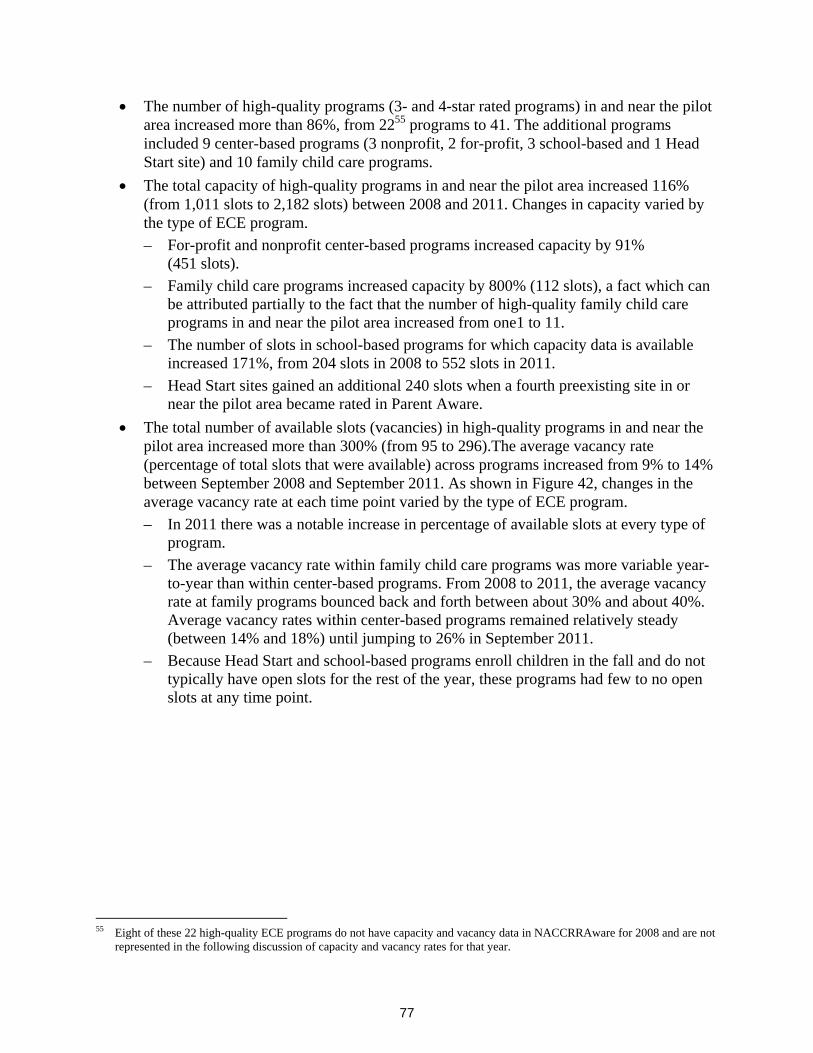
Findings: ECE Program Supply and Quality in the Pilot Communities ...................................... 76
Changes in the Supply of High-Quality ECE Programs in the Pilot Areas from 2008 to 2011 ...................................................................................................................... 76
iii
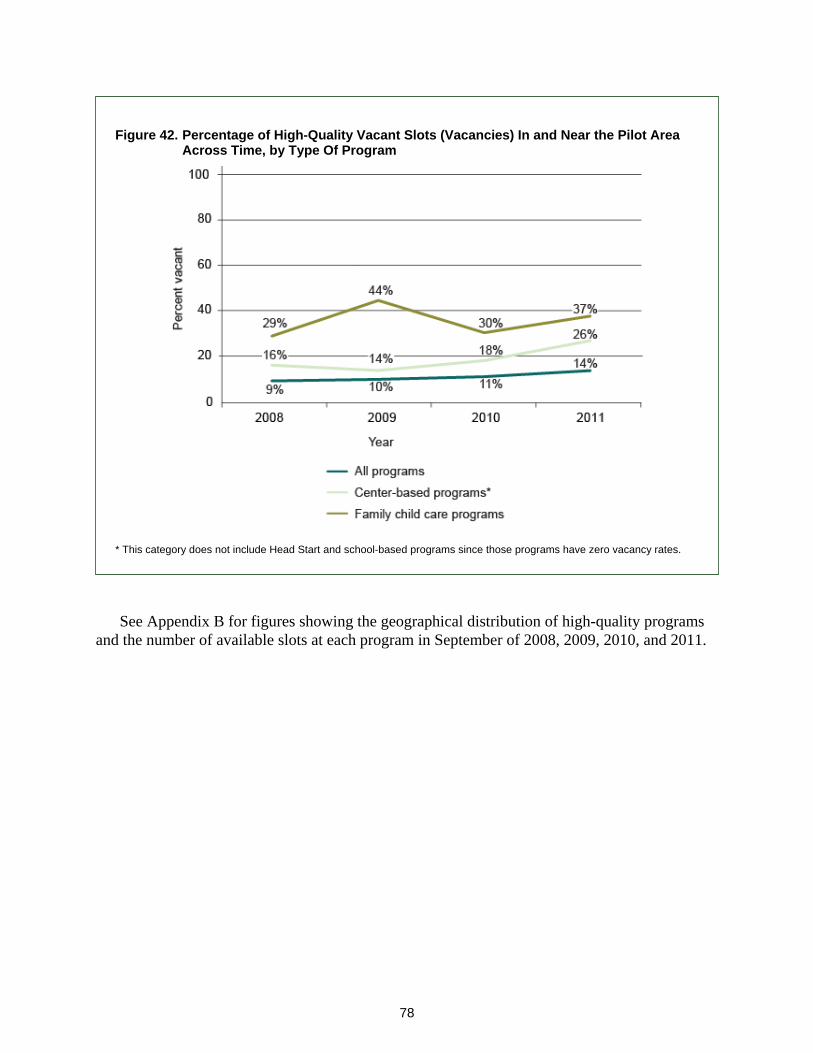
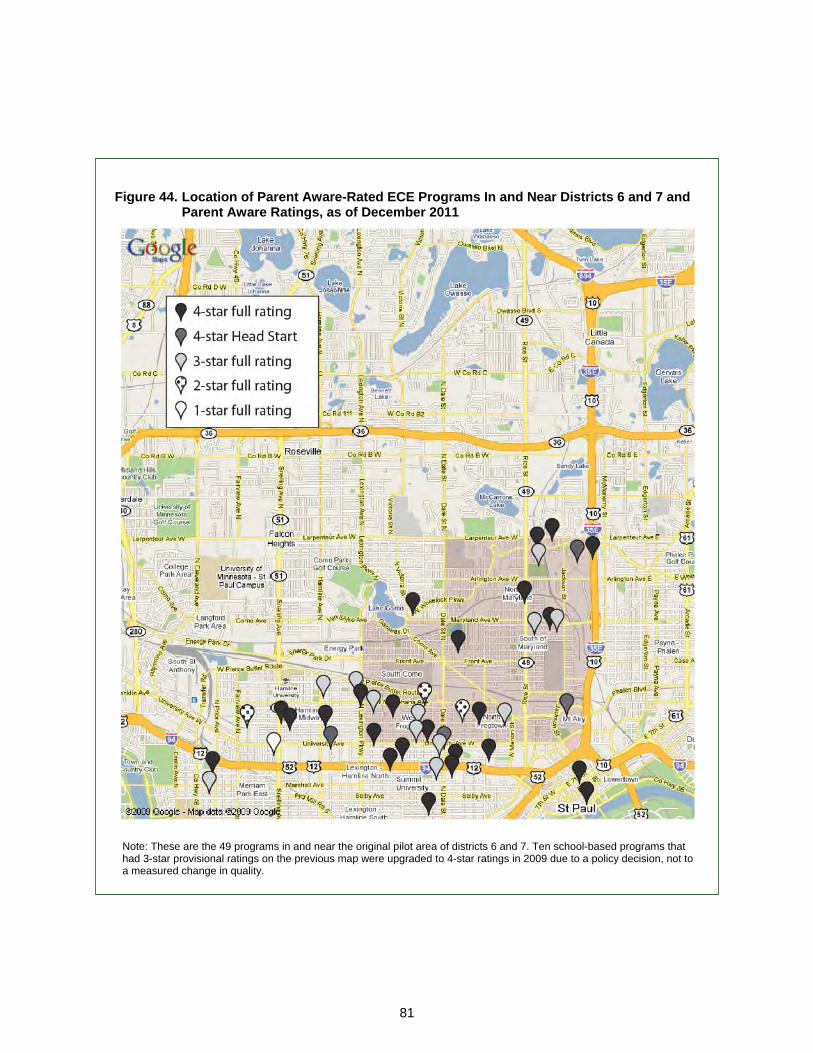
Changes in the Quality of ECE Programs in the Pilot Areas from 2008 to 2011 .................. 79
ECE Programs Selected by Children and Families with Scholarship Funds During 2008, 2009, and 2010 ............................................................................................ 82
Elementary Schools Selected by Children and Families with Scholarship Funds During Their Kindergarten Year (2010 and 2011) .............................................................. 83
Elementary Schools Selected by Children in the Comparison Group During their Kindergarten Year (2010 and 2011) .................................................................................. 85
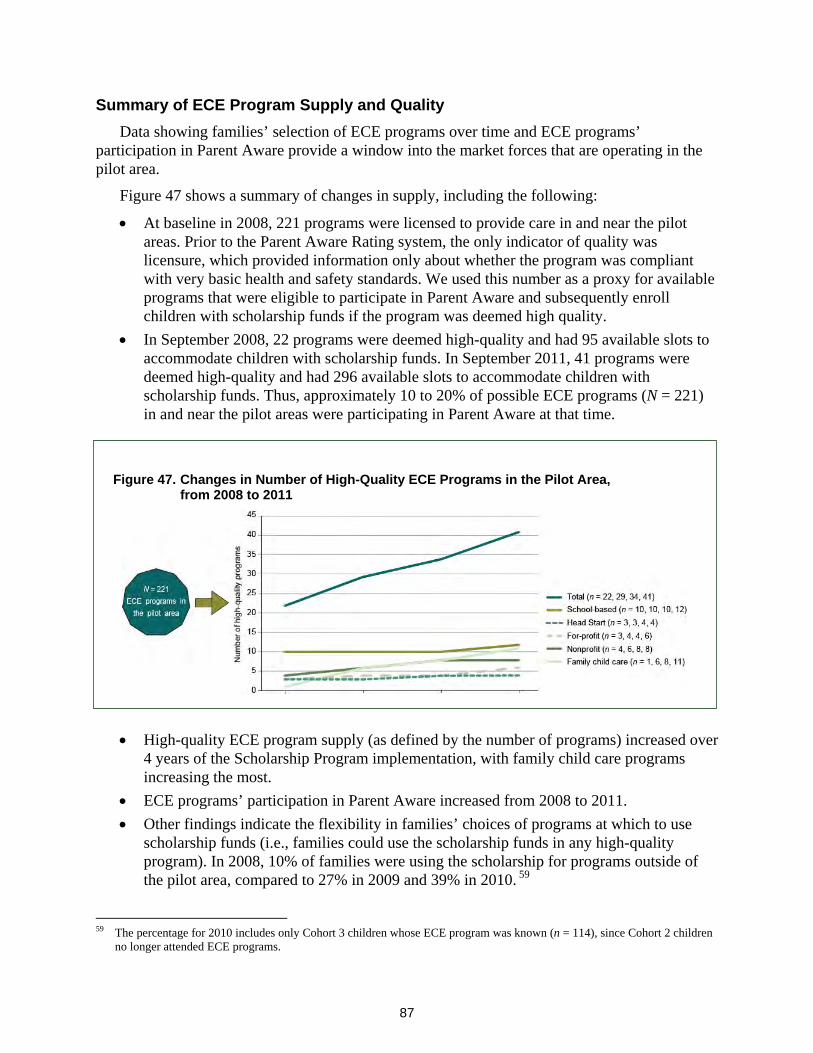
Summary of ECE Program Supply and Quality .................................................................... 87
Findings: ECE Program Costs and Uses of the Scholarship Program ....................................... 88
Costs Associated with Providing a High-Quality ECE Experience ........................................ 88
Saint Paul Early Childhood Scholarship Programs’ Use of Scholarship Funds .................... 90
Perceived Benefits of the Scholarship Payment Process ..................................................... 93
Summary of Cost Study ........................................................................................................ 95
Findings: Focus Group Data About Perspectives of Participating Parents ................................ 96
Focus Groups Samples ......................................................................................................... 96
Key Parent Focus Group Findings ........................................................................................ 98
Tables 1. Scholarship Program Evaluation Questions and Data Sources ......................................... 21
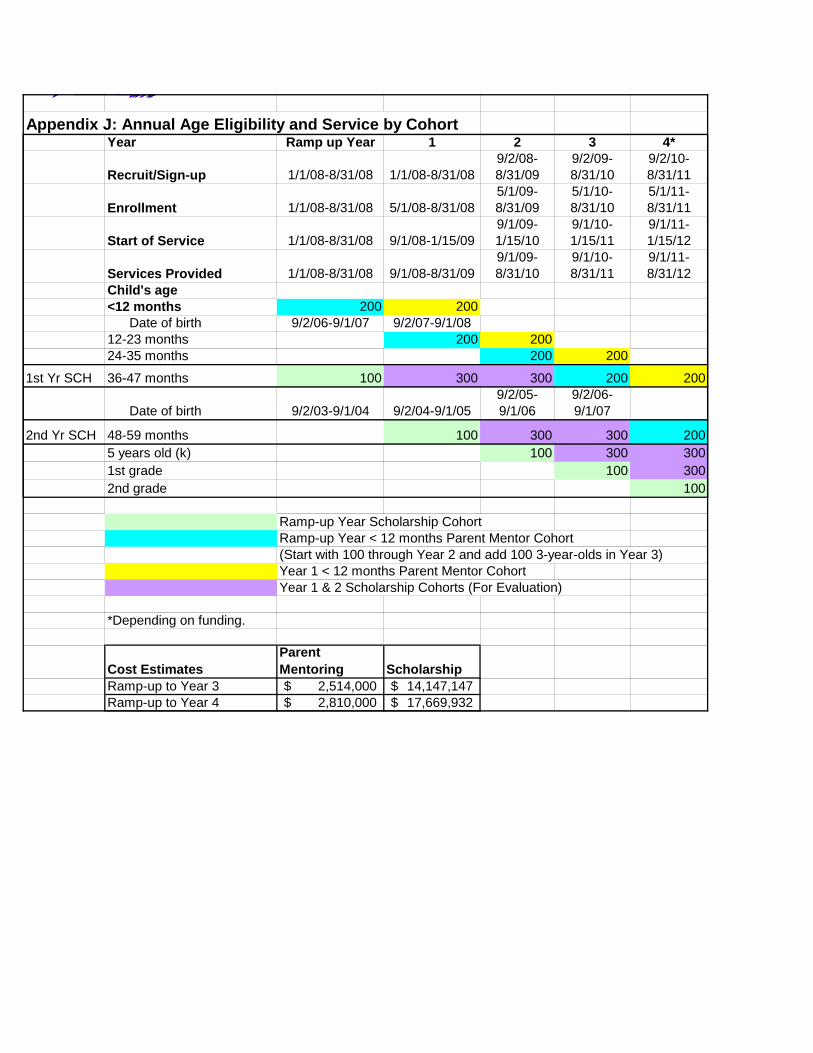
2. Number of Participants in Scholarship Program, by Cohort ............................................... 22
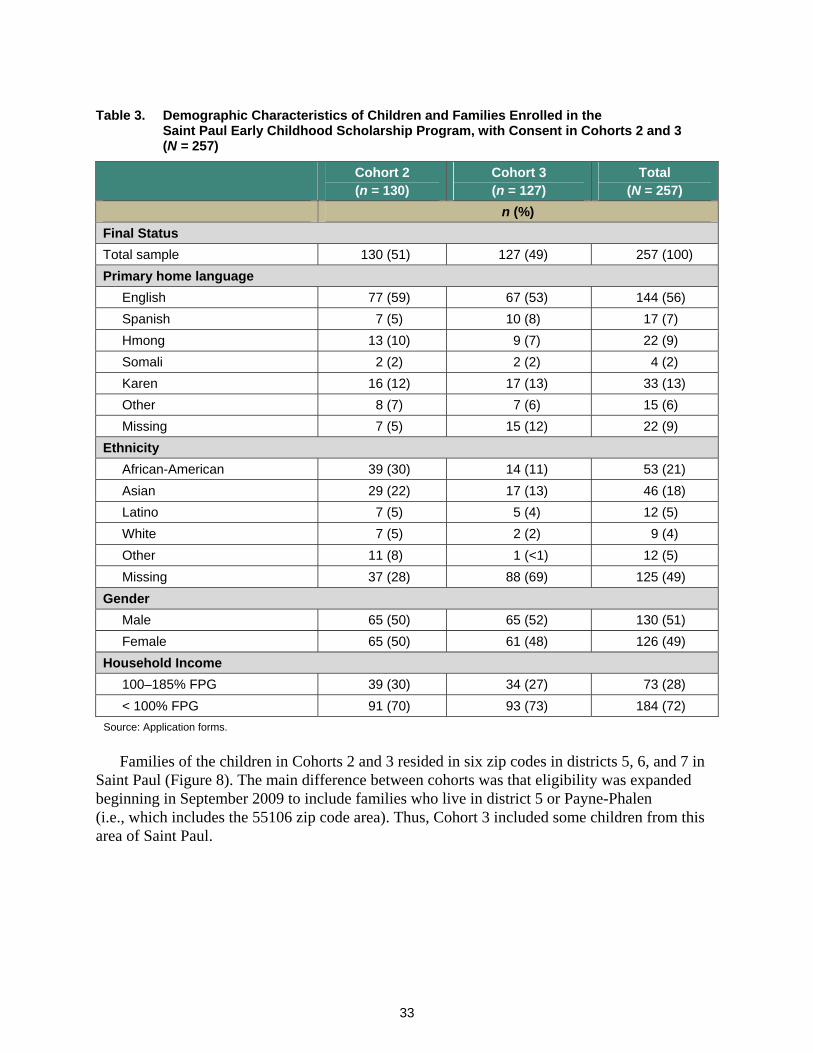
3. Demographic Characteristics of Children and Families Enrolled in the Saint Paul Early Childhood Scholarship Program, with Consent in Cohorts 2 and 3 (N = 257) ................... 33
4. Baseline, One-Year Follow-Up, and Kindergarten Data Collection for Parent Interviews .. 45
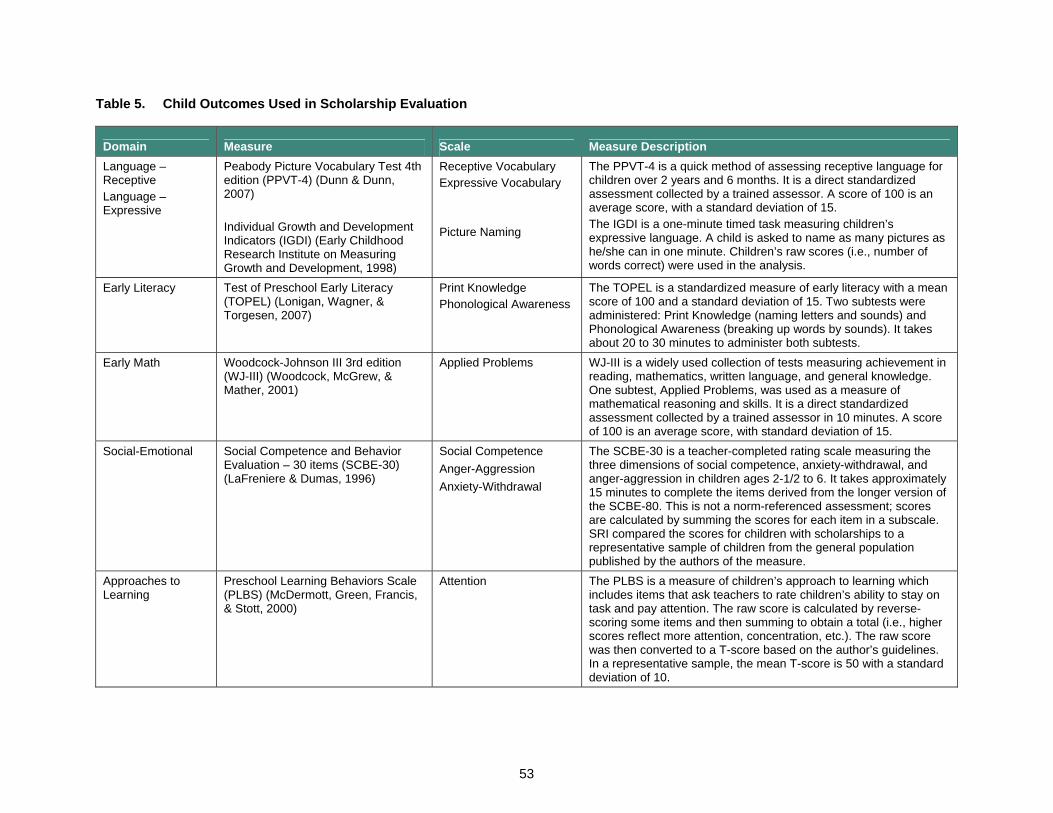
5. Child Outcomes Used in Scholarship Evaluation ............................................................... 53
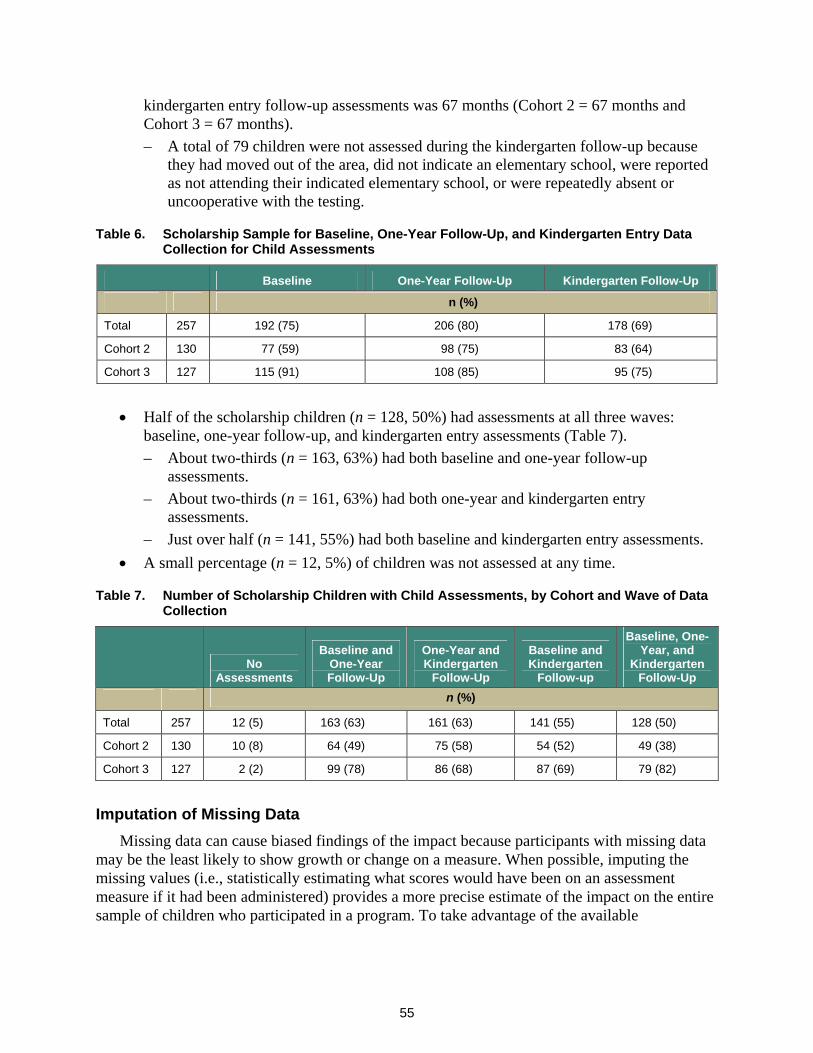
6. Scholarship Sample for Baseline, One-Year Follow-Up, and Kindergarten Entry Data Collection for Child Assessments ....................................................................................... 55
7. Number of Scholarship Children with Child Assessments, by Cohort and Wave of Data Collection ........................................................................................................................... 55
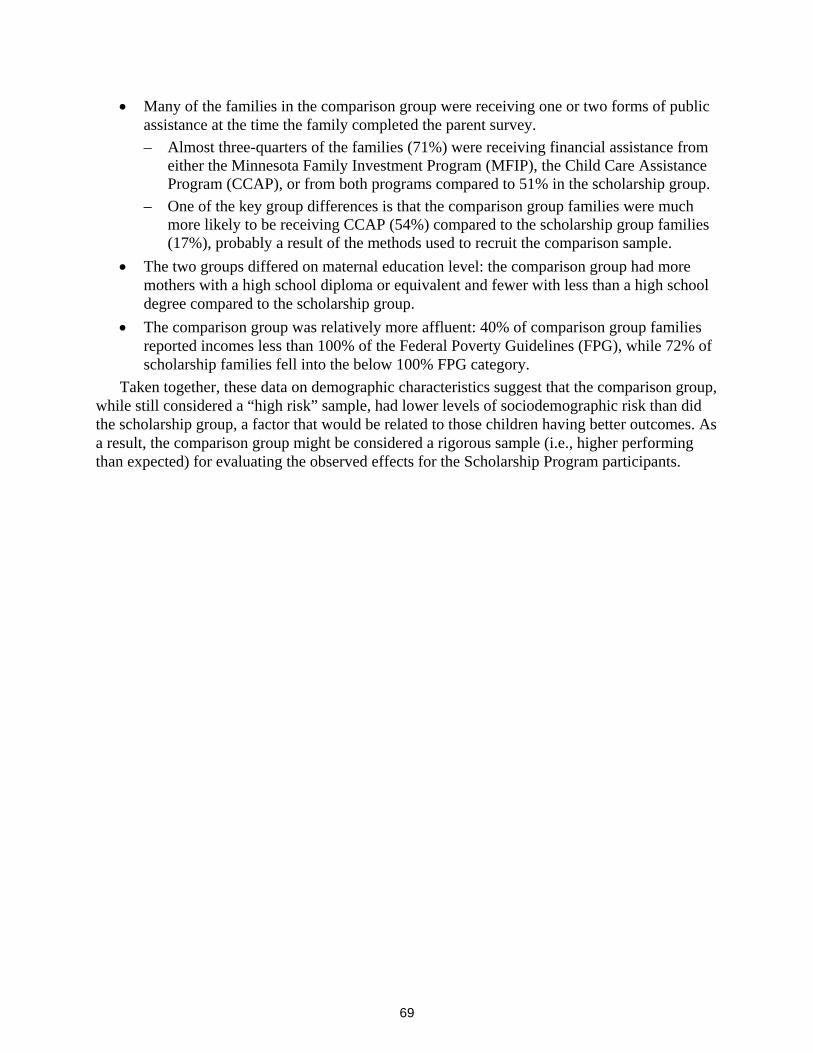
8. Demographic Characteristics of Children and Families in Kindergarten Comparison Versus Scholarship Groups .............................................................................................. 70
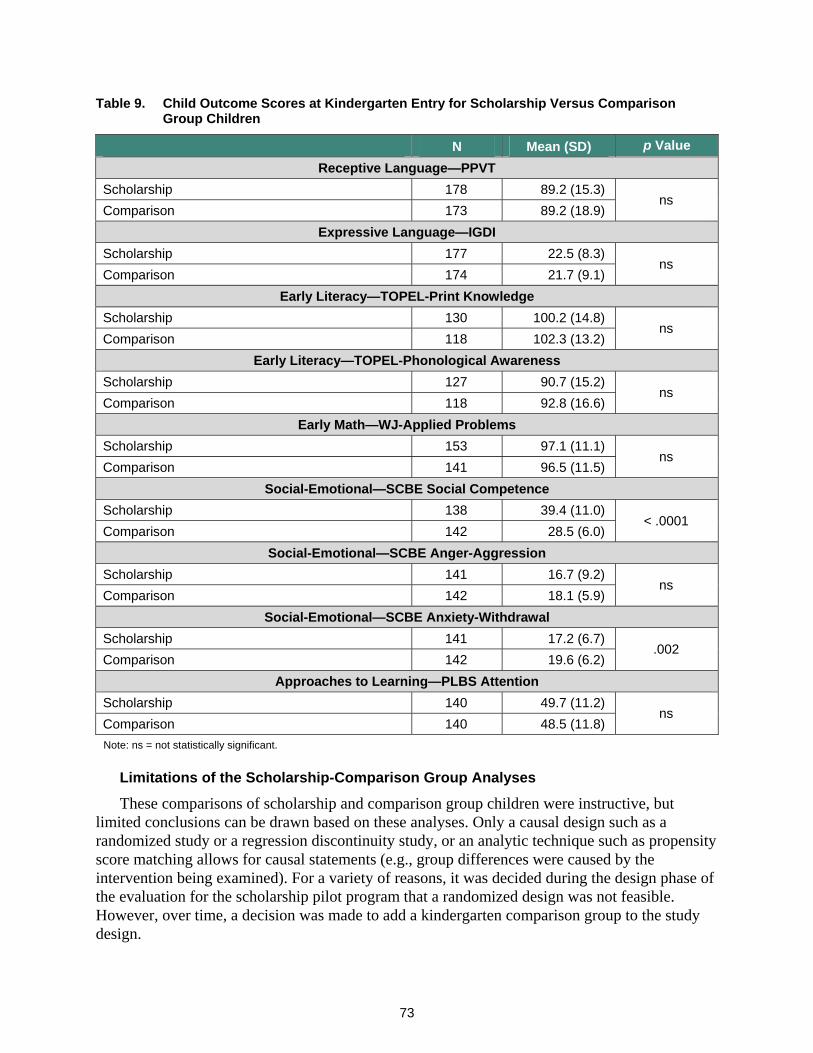
9. Child Outcome Scores at Kindergarten Entry for Scholarship Versus Comparison Group Children ................................................................................................................... 73
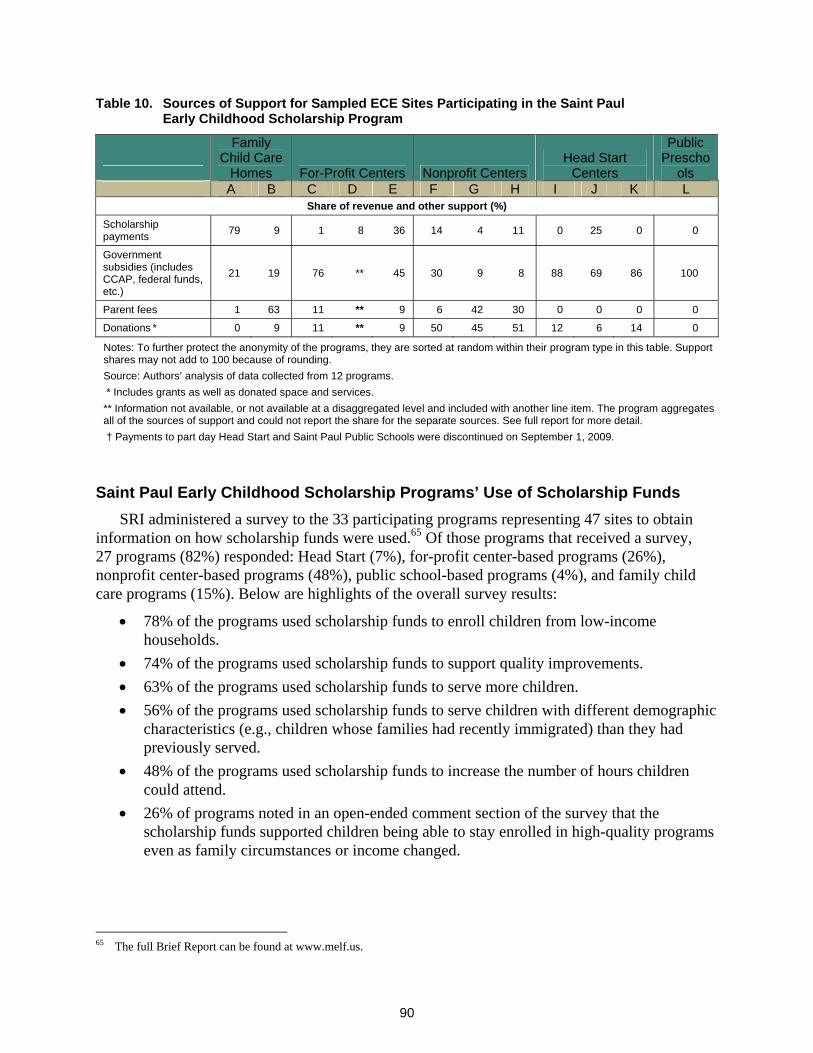
10. Sources of Support for Sampled ECE Sites Participating in the Saint Paul Early Childhood Scholarship Program ........................................................................................ 90
iv
Figures 1. Logic Model of the Saint Paul Early Childhood Scholarship Program—Goal:
Children from Low-Income Families Are Prepared to Succeed in School ......................... 18
2. Number of Children in Cohorts 2 and 3 Participating in the Scholarship Program and Evaluation .......................................................................................................................... 25
3. Sources of Referral to the Saint Paul Early Childhood Scholarship Program, Participating Families with Signed Consent (N = 257) ....................................................... 26
4. Start Dates of Early Childhood Education Program Participation Using Scholarship Funds, Cohorts 2 and 3, Families with Signed Consent (N = 257) .................................... 27
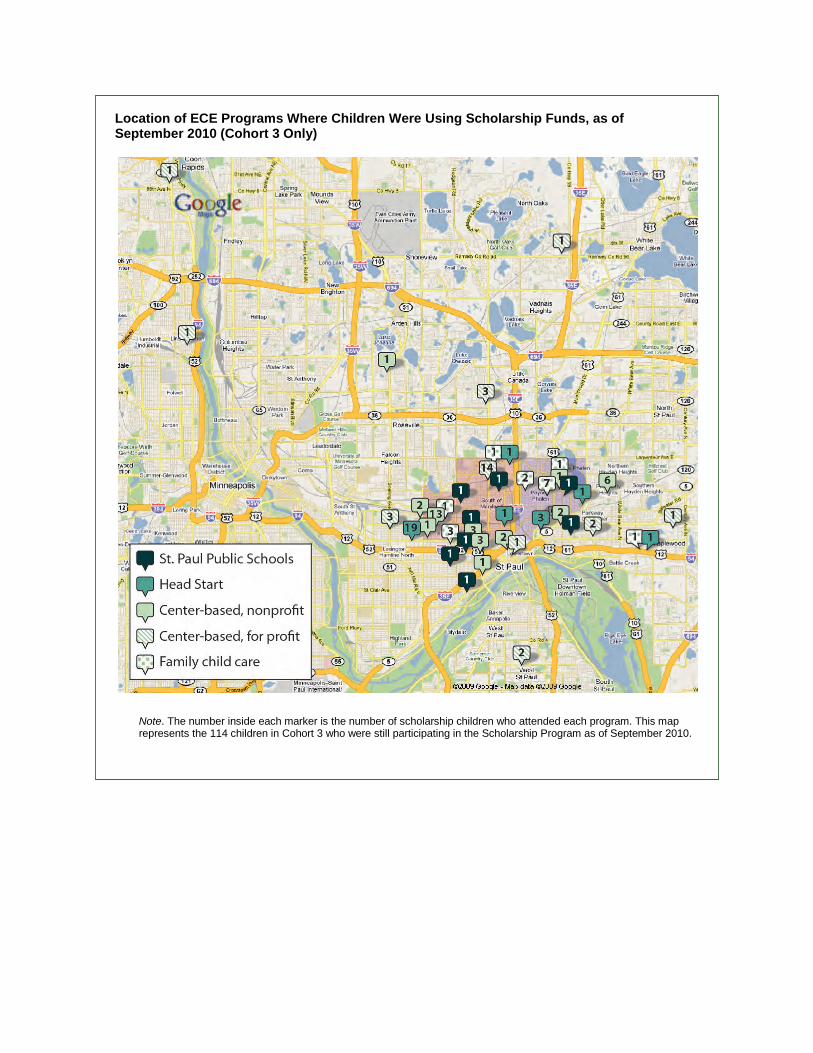
5. ECE Programs in Which Participating Children Used Their Scholarship Funds (N = 257) ............................................................................................................................ 28
6. Months Children Attended a High-Quality ECE Program (N = 254) ................................... 30
7. Absenteeism of Scholarship Participants in ECE Program (N = 254) ................................ 31
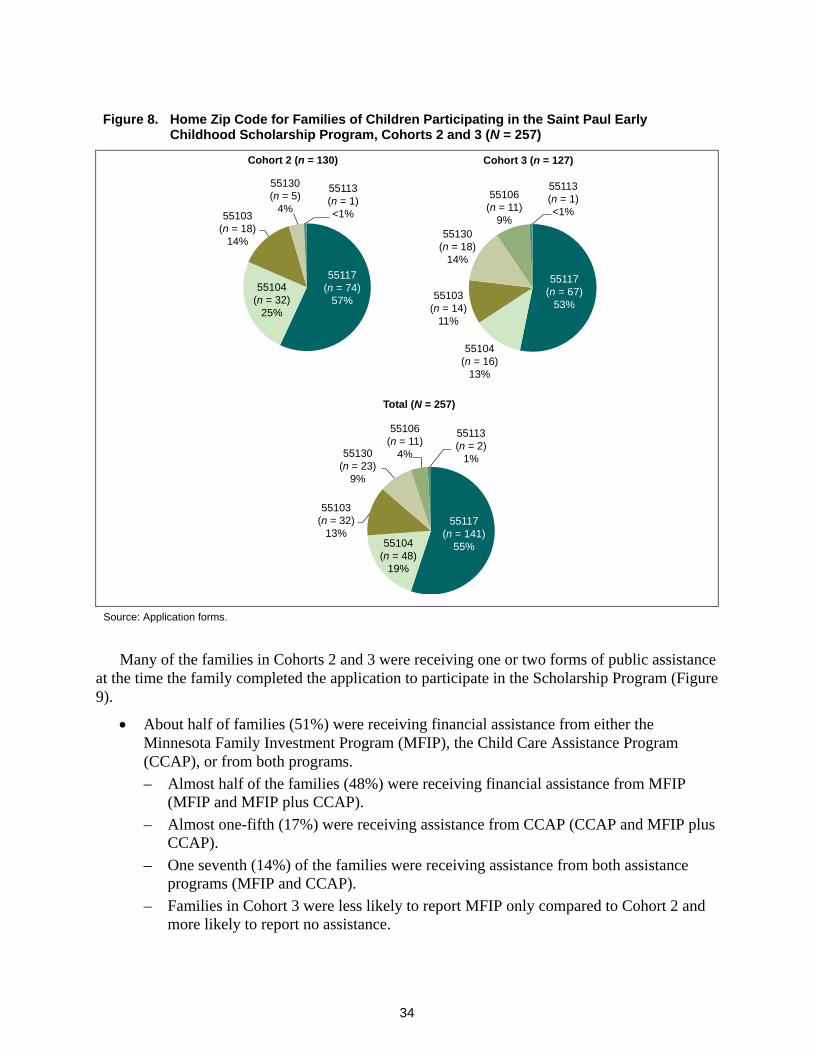
8. Home Zip Code for Families of Children Participating in the Saint Paul Early Childhood Scholarship Program, Cohorts 2 and 3 (N = 257) .............................................................. 34
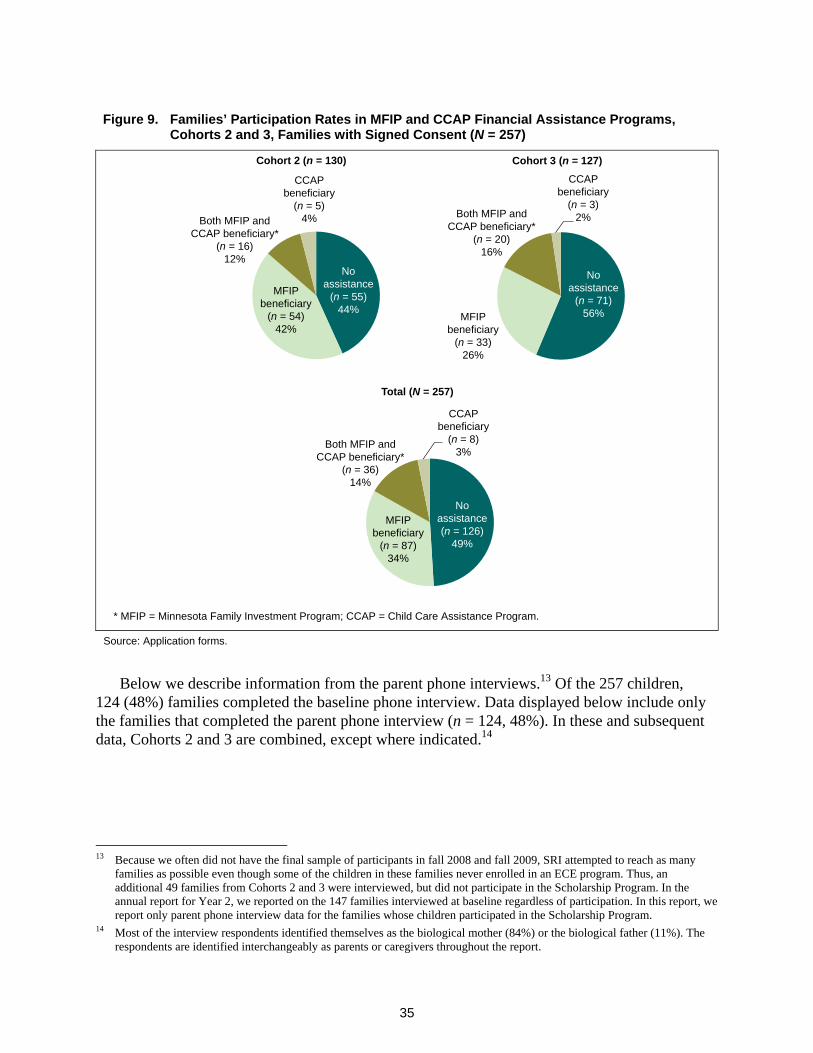
9. Families’ Participation Rates in MFIP and CCAP Financial Assistance Programs, Cohorts 2 and 3, Families with Signed Consent (N = 257) ................................................ 35
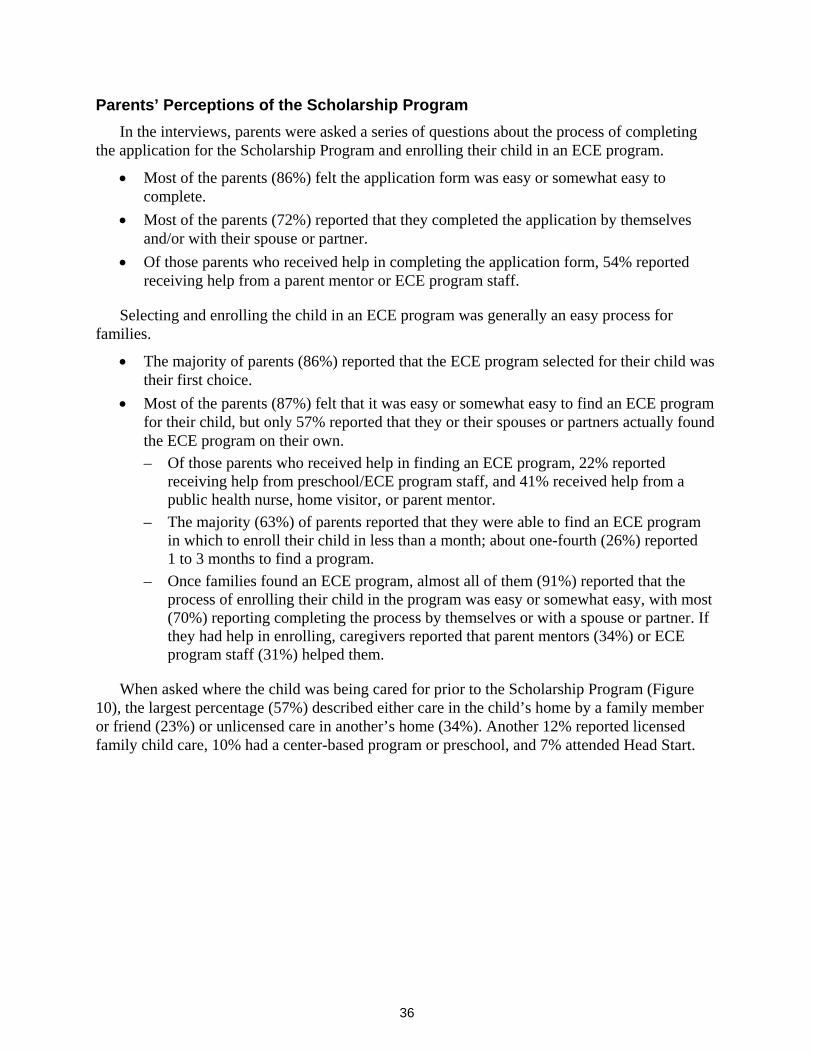
10. Parents’ Report of Child’s Care Prior to Scholarship Program Enrollment (N = 122) ........ 37
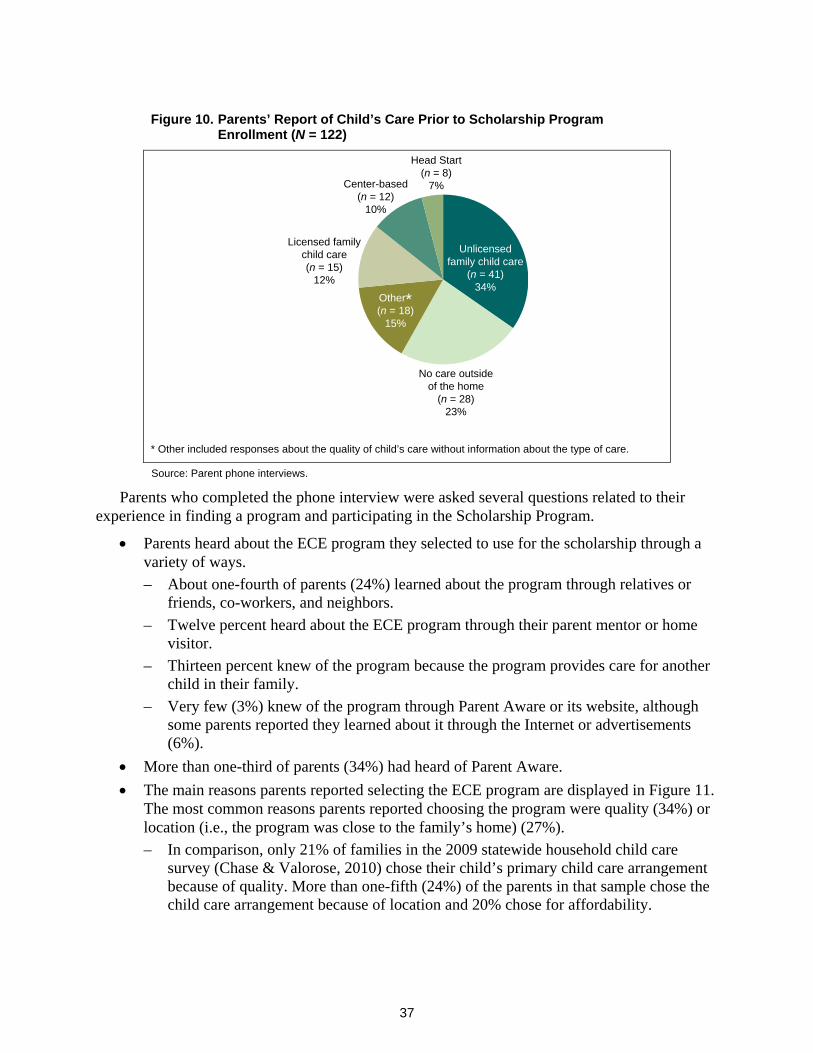
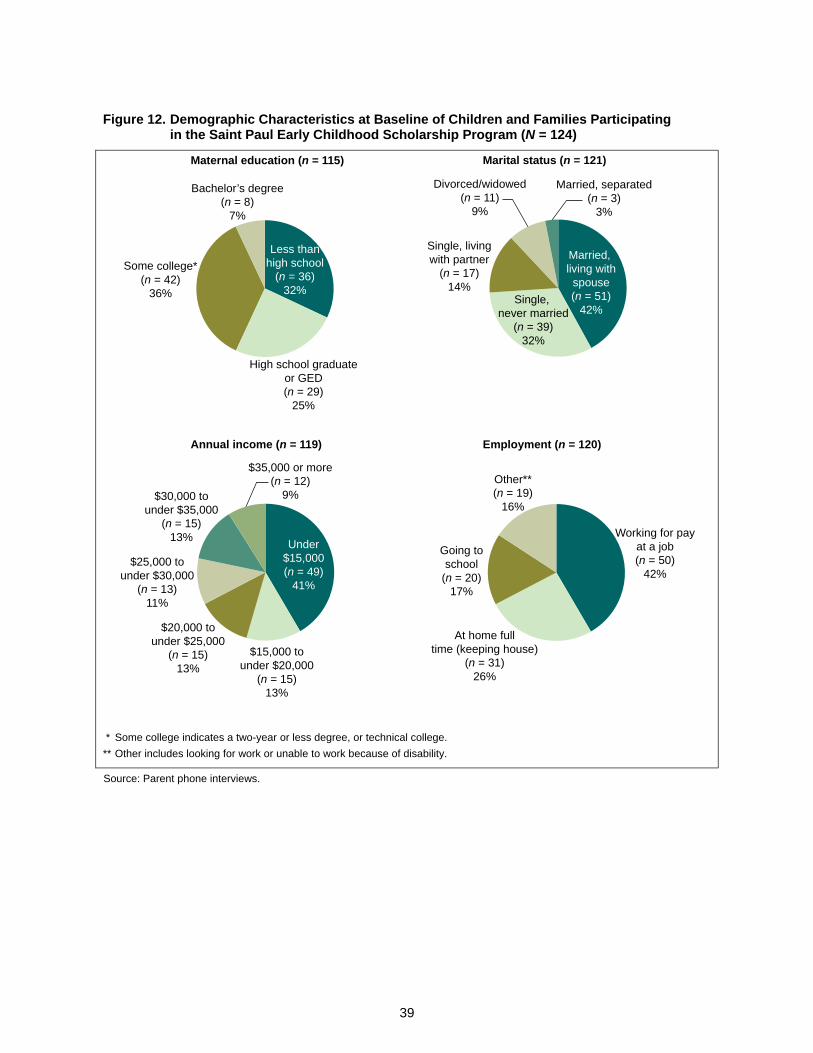
11. Factors Parents Used to Select ECE Program for the Scholarship Funds (N = 117) ........ 38
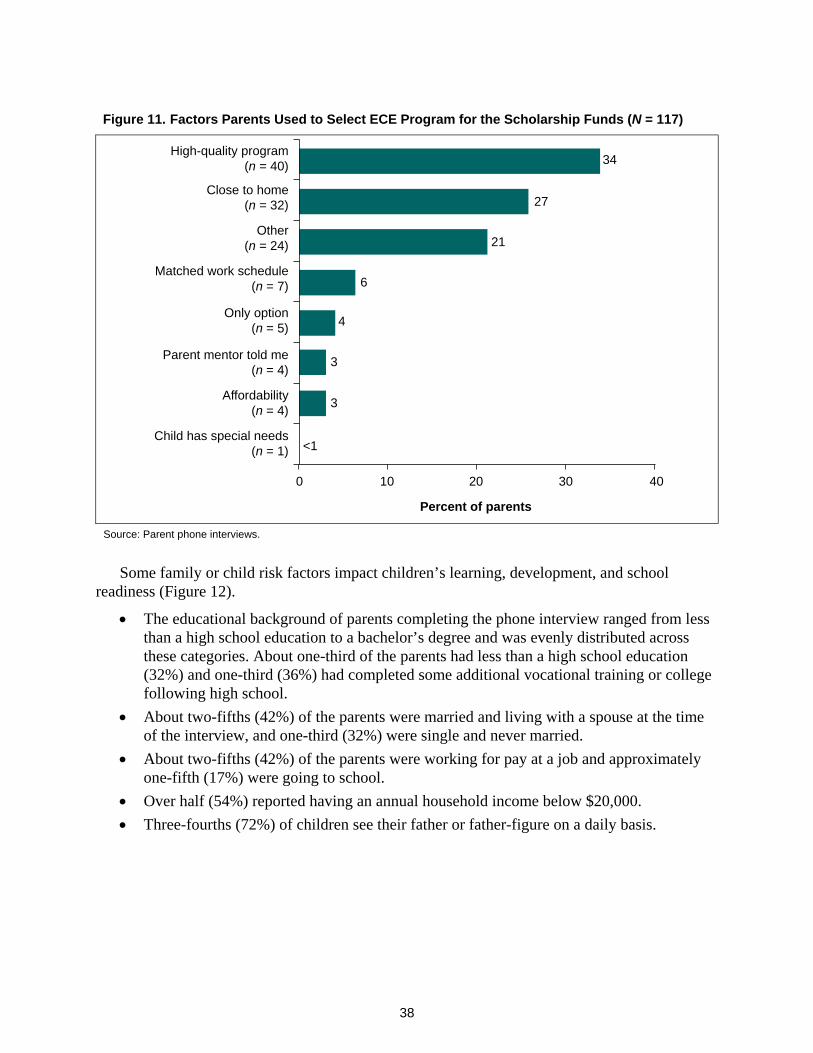
12. Demographic Characteristics at Baseline of Children and Families Participating in the Saint Paul Early Childhood Scholarship Program (N = 124) .............................................. 39
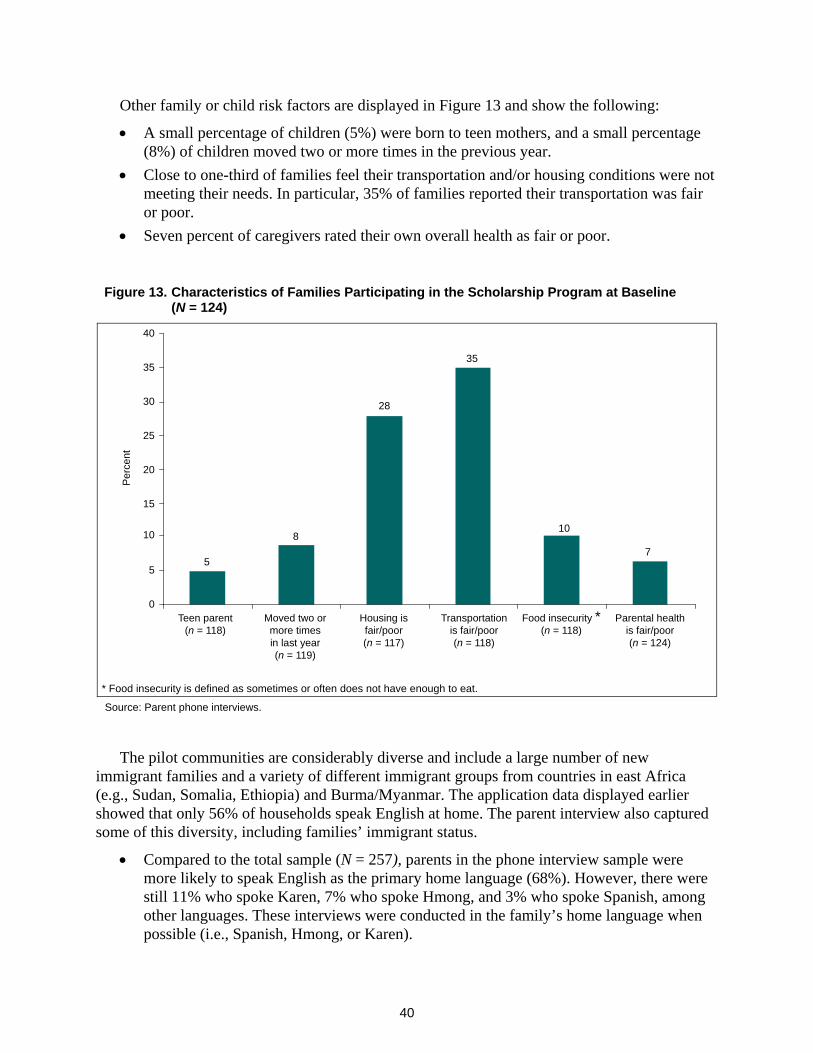
13. Characteristics of Families Participating in the Scholarship Program at Baseline (N = 124) ............................................................................................................................ 40
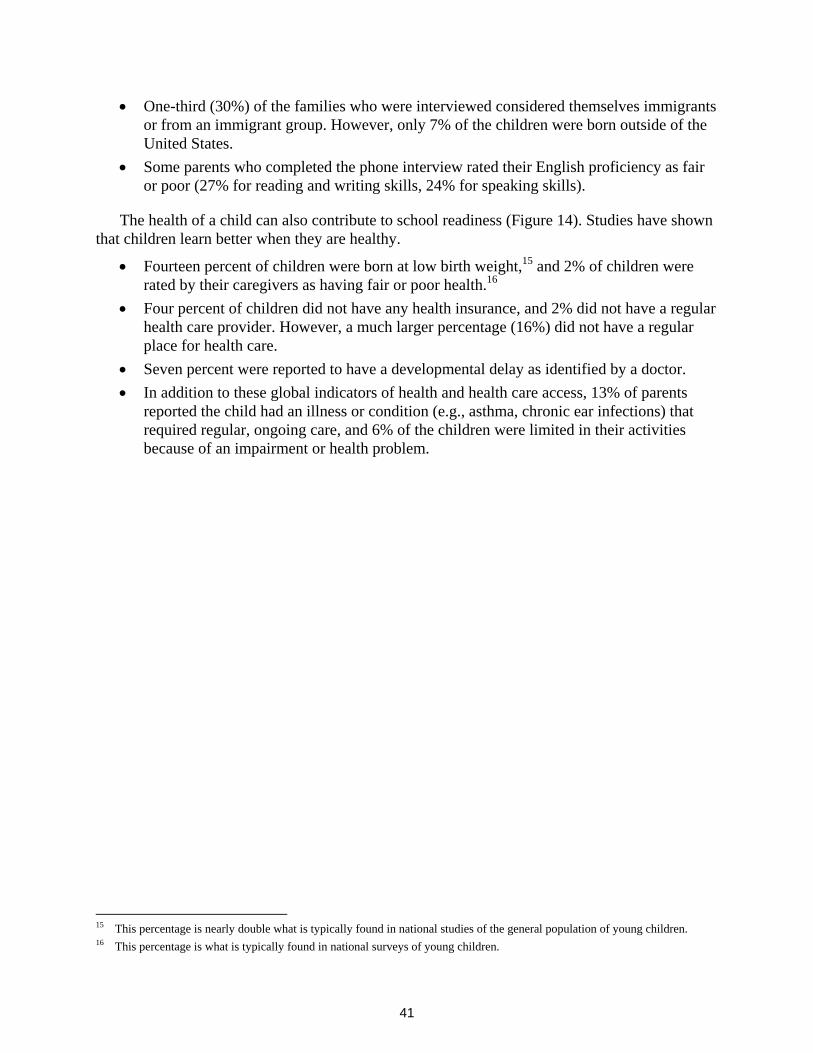
14 Health Characteristics of Children Participating in the Scholarship Program at Baseline (N = 124) ............................................................................................................. 42
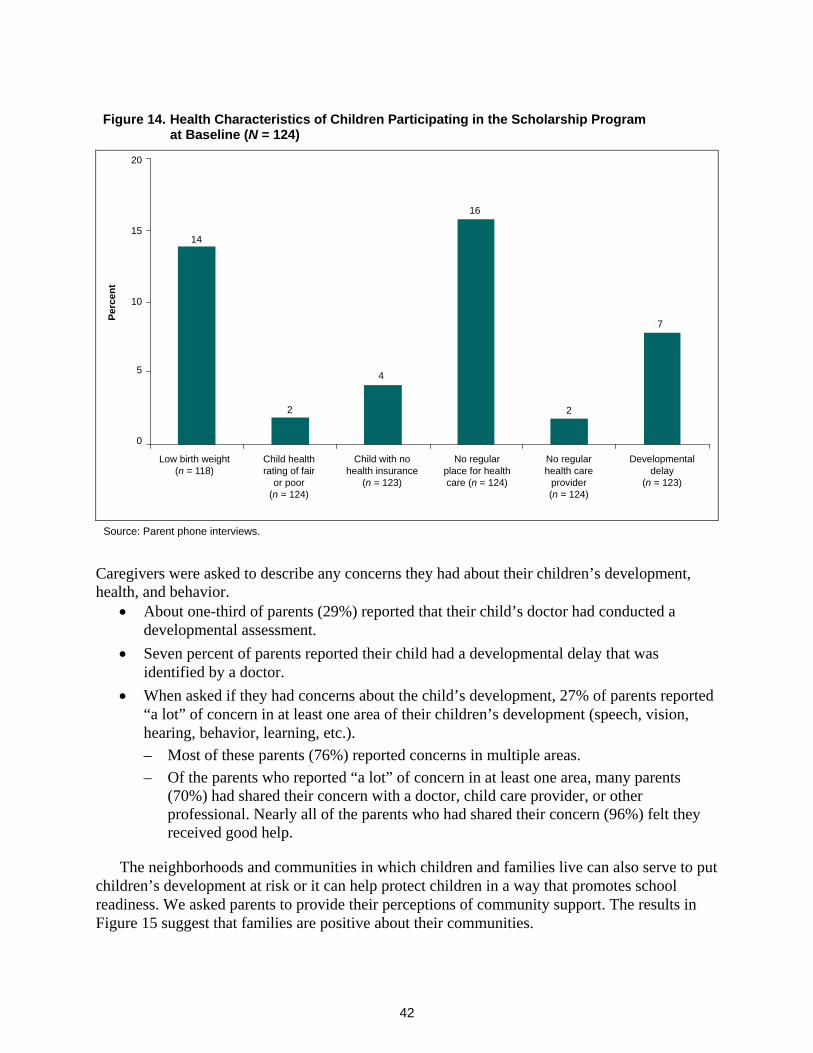
15. Parents’ Perceptions of Their Community Support at Baseline (N = 124) ......................... 43
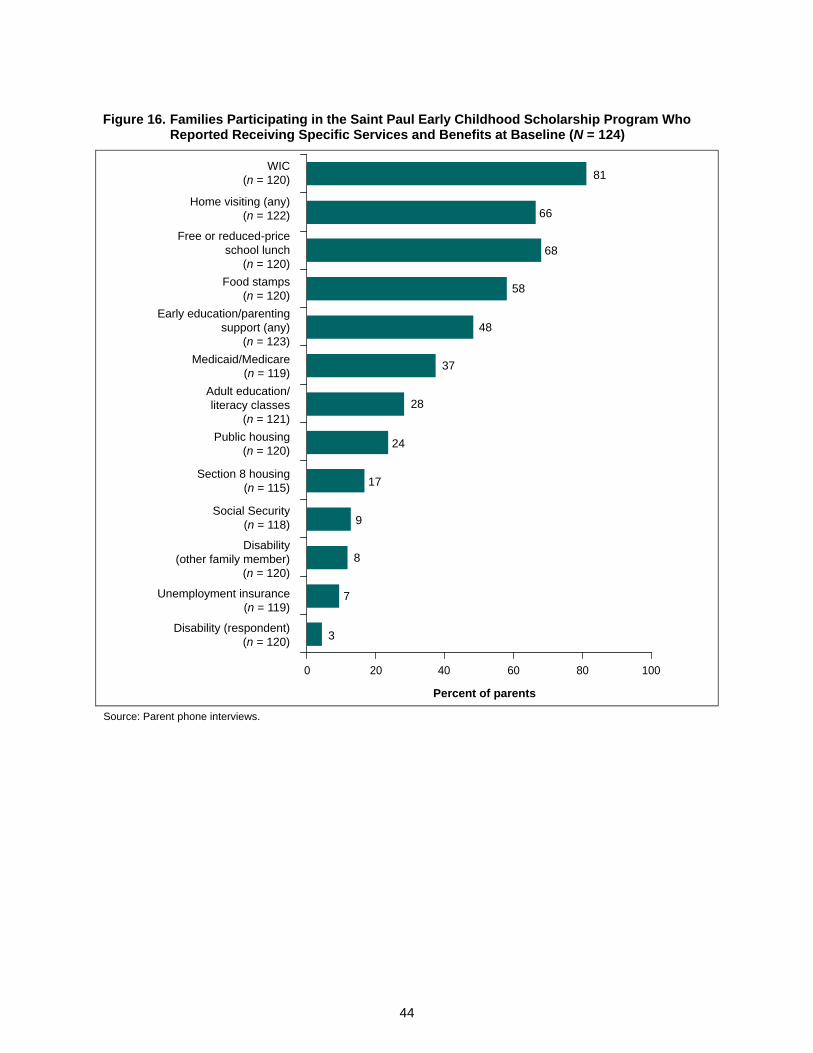
16. Families Participating in the Saint Paul Early Childhood Scholarship Program Who Reported Receiving Specific Services and Benefits at Baseline (N = 124) ....................... 44
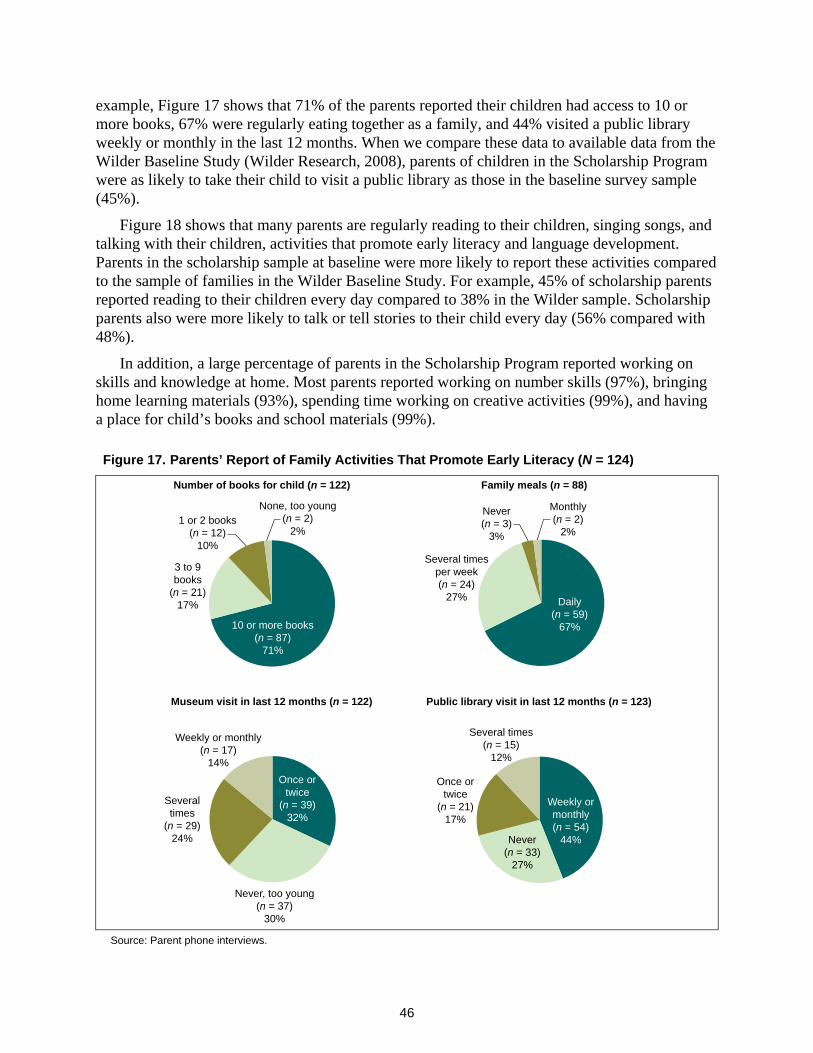
17. Parents’ Report of Family Activities That Promote Early Literacy (N = 124) ...................... 46
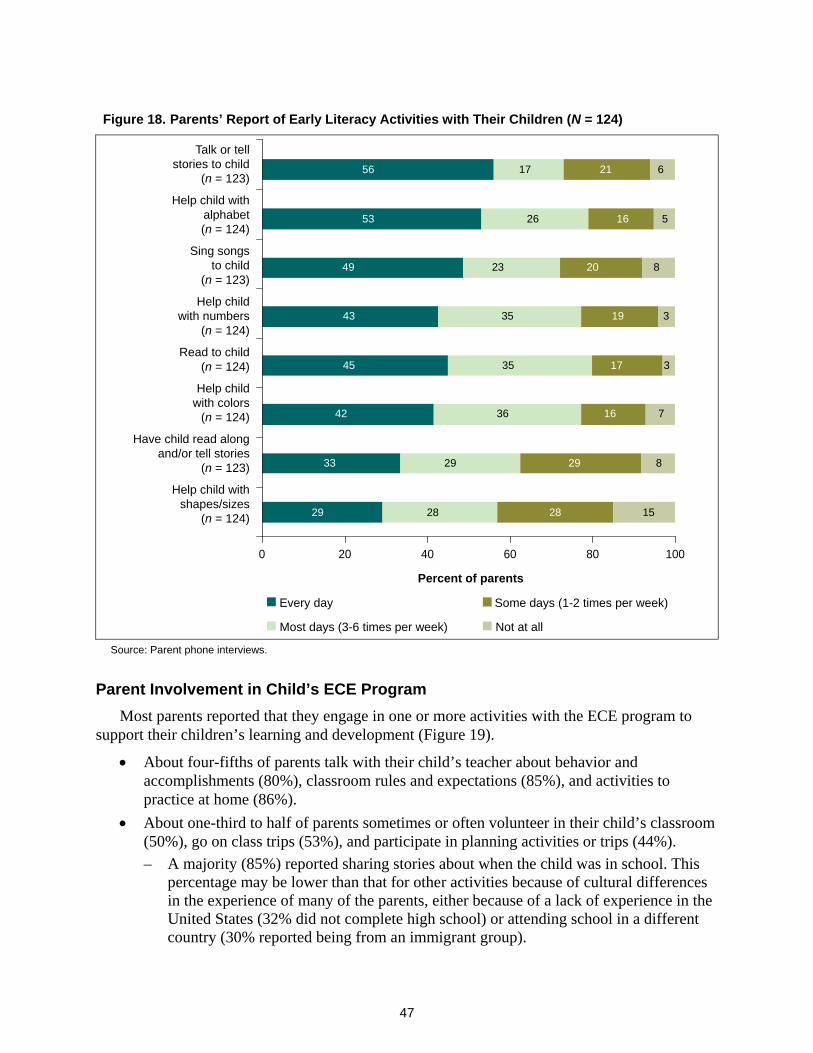
18. Parents’ Report of Early Literacy Activities with Their Children (N = 124) ......................... 47
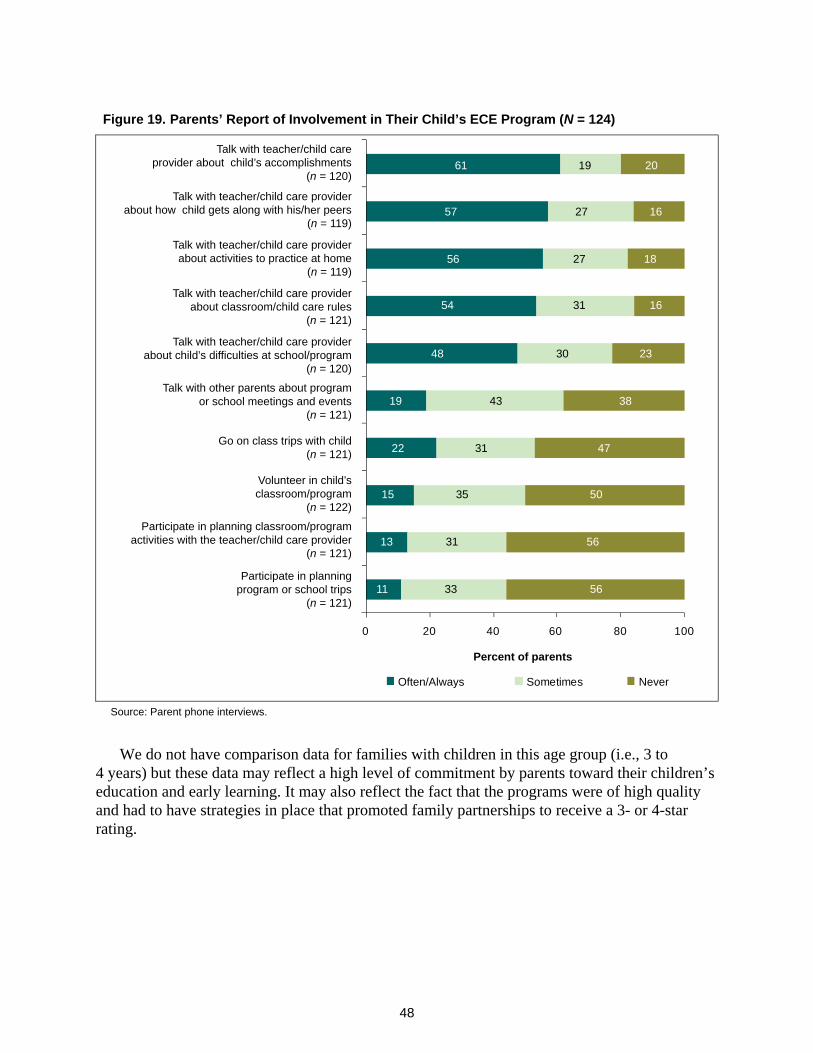
19. Parents’ Report of Involvement in Their Child’s ECE Program (N = 124) .......................... 48
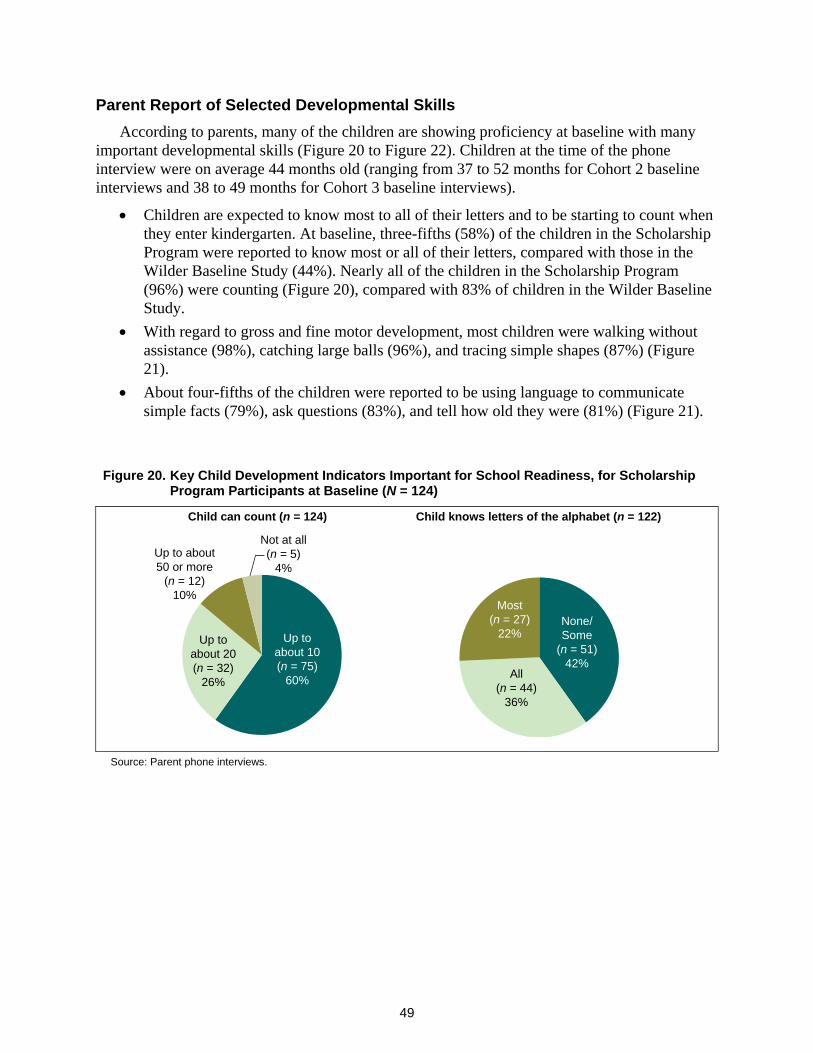
20. Key Child Development Indicators Important for School Readiness, for Scholarship Program Participants at Baseline (N = 124) ....................................................................... 49
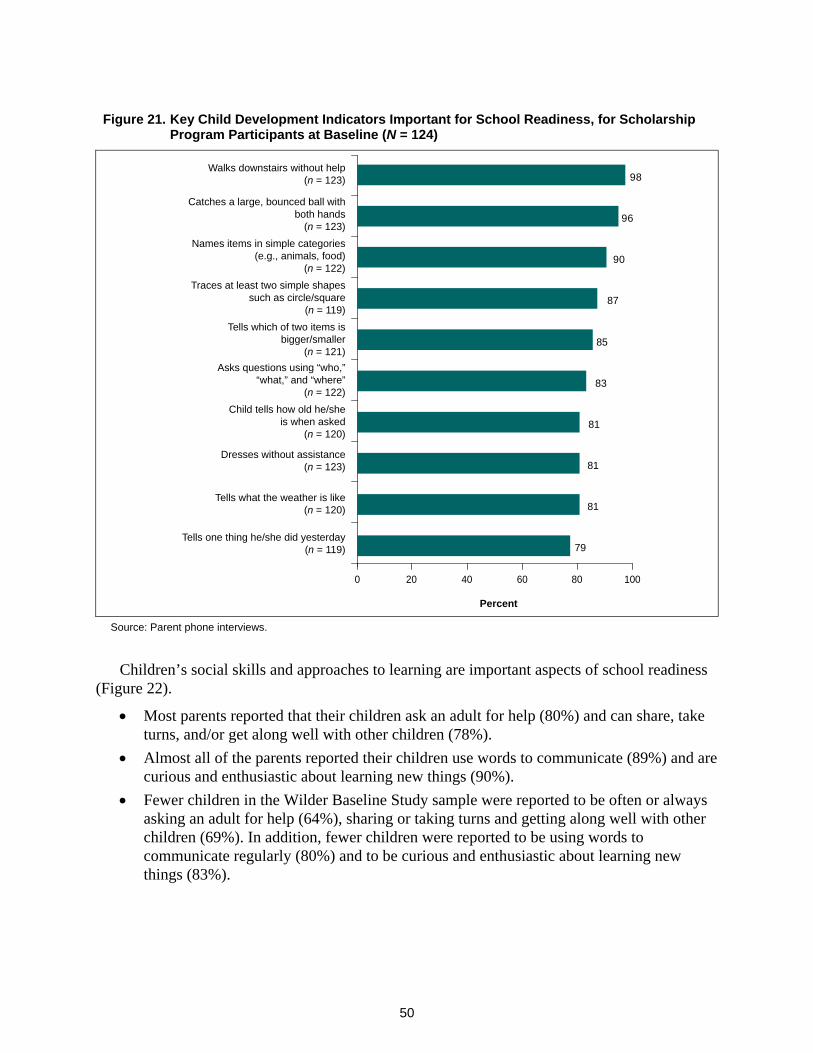
21. Key Child Development Indicators Important for School Readiness, for Scholarship Program Participants at Baseline (N = 124) ....................................................................... 50
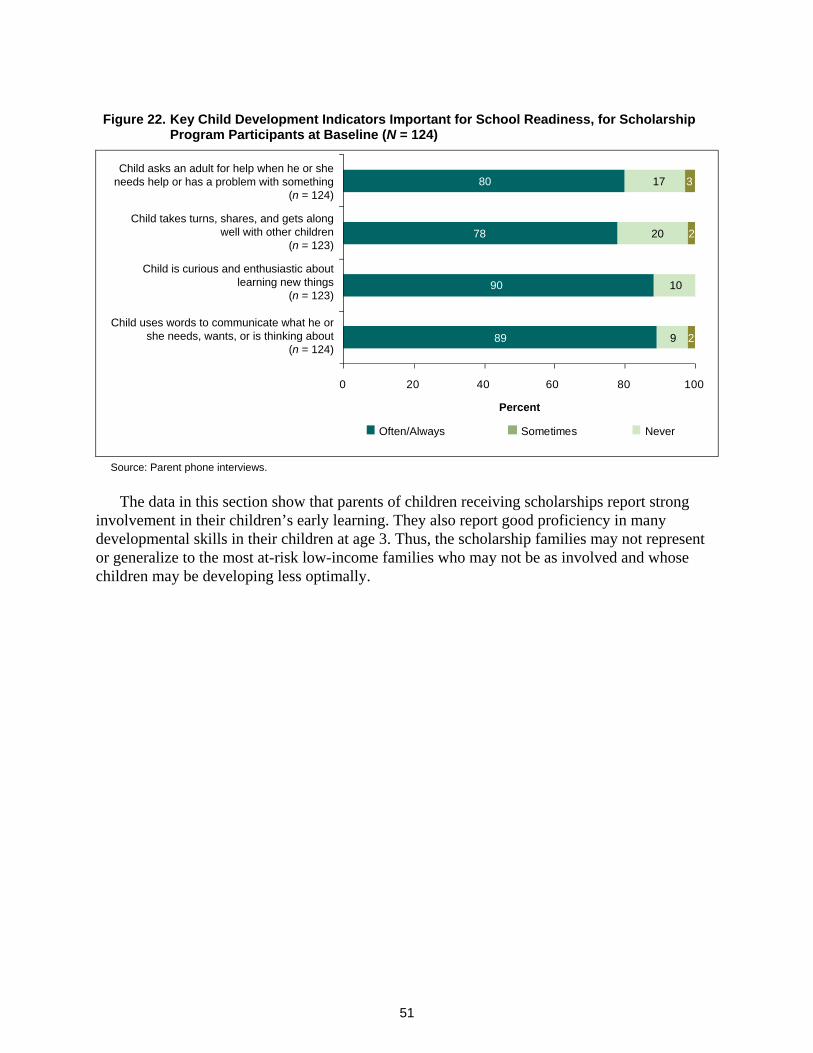
22. Key Child Development Indicators Important for School Readiness, for Scholarship Program Participants at Baseline (N = 124) ....................................................................... 51
23. Change in PPVT Score From Baseline to One-Year Follow-Up to Kindergarten Entry (n = 207) ................................................................................................................... 57
24. Percentage of Children with Low Scores on the PPVT at Baseline, One-Year Follow-Up, and Kindergarten Entry (n = 207)..................................................................... 57
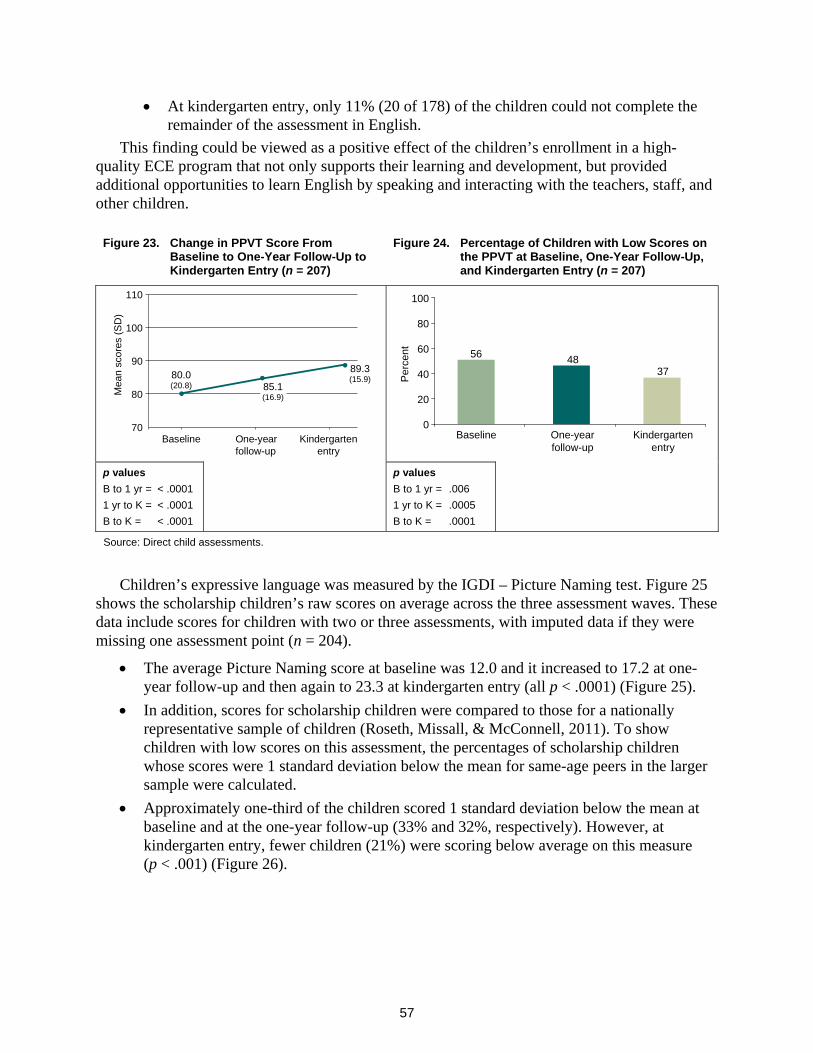
25. Change in IGDI-Picture Naming Scores From Baseline to One-Year Follow-Up to Kindergarten Entry (n = 204) .............................................................................................. 58
26. Percentage of Children with Low Scores on the IGDI-Picture Naming at Baseline, One-Year Follow-Up, and Kindergarten Entry (n = 204) .................................................... 58
v
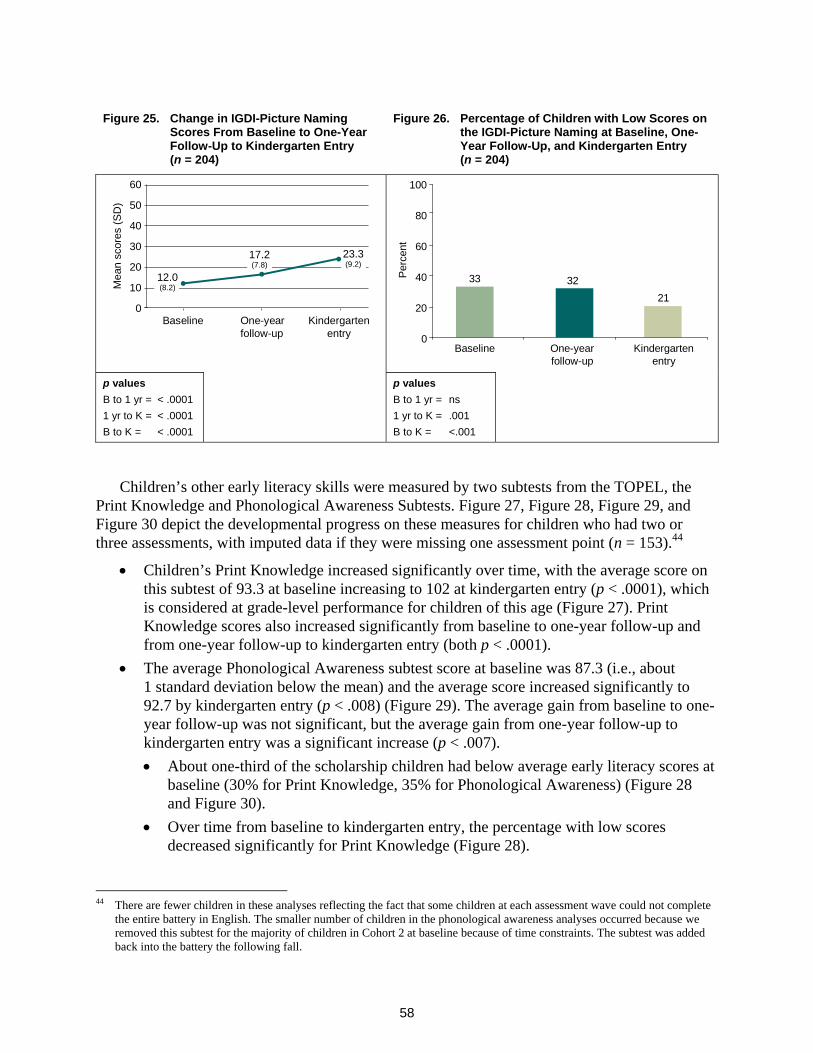
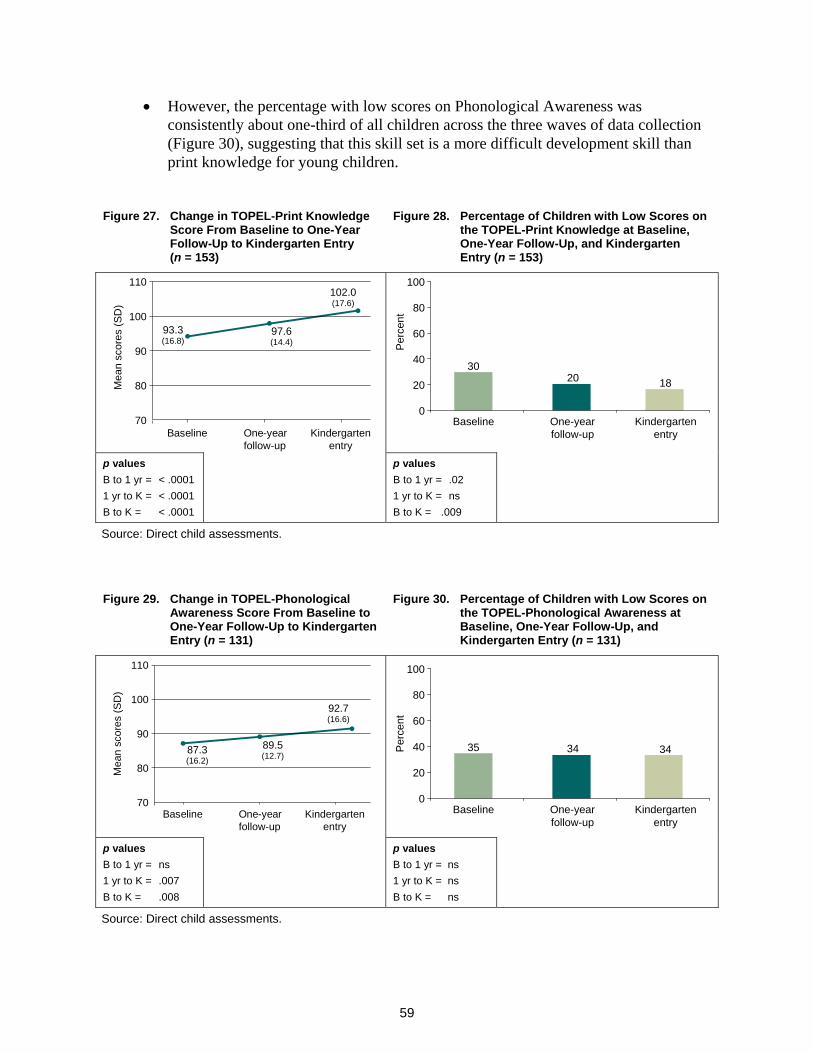
27. Change in TOPEL-Print Knowledge Score From Baseline to One-Year Follow-Up to Kindergarten Entry (n = 153) ............................................................................................. 59
28. Percentage of Children with Low Scores on the TOPEL-Print Knowledge at Baseline, One-Year Follow-Up, and Kindergarten Entry (n = 153) .................................................... 59
29. Change in TOPEL-Phonological Awareness Score From Baseline to One-Year Follow-Up to Kindergarten Entry (n = 131)......................................................................... 59
30. Percentage of Children with Low Scores on the TOPEL-Phonological Awareness at Baseline, One-Year Follow-Up, and Kindergarten Entry (n = 131) .................................... 59
31. Change in Woodcock-Johnson Applied Problems Score From Baseline to One-Year Follow-Up to Kindergarten Entry (n = 153)......................................................................... 60
32. Percentage of Children with Low Scores on the Woodcock Johnson Applied Problems at Baseline, One-Year Follow-Up, and Kindergarten Entry (n = 153) ................ 60
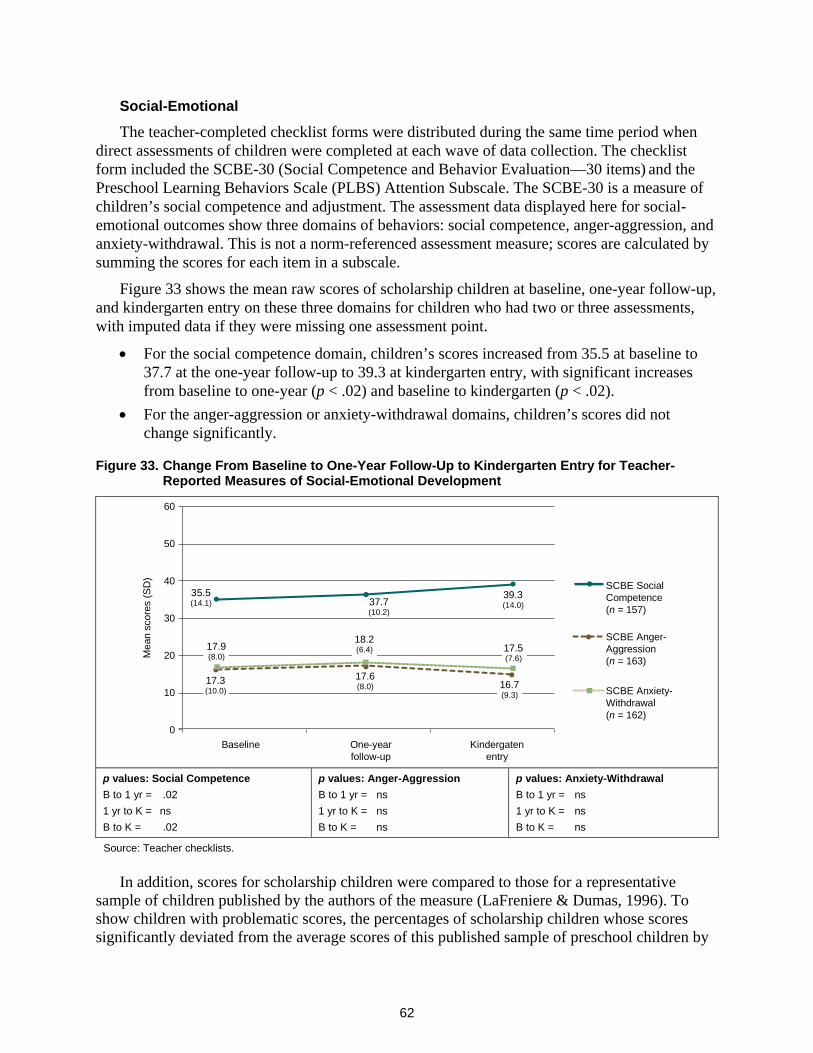
33. Change From Baseline to One-Year Follow-Up to Kindergarten Entry for Teacher-Reported Measures of Social-Emotional Development ..................................................... 62
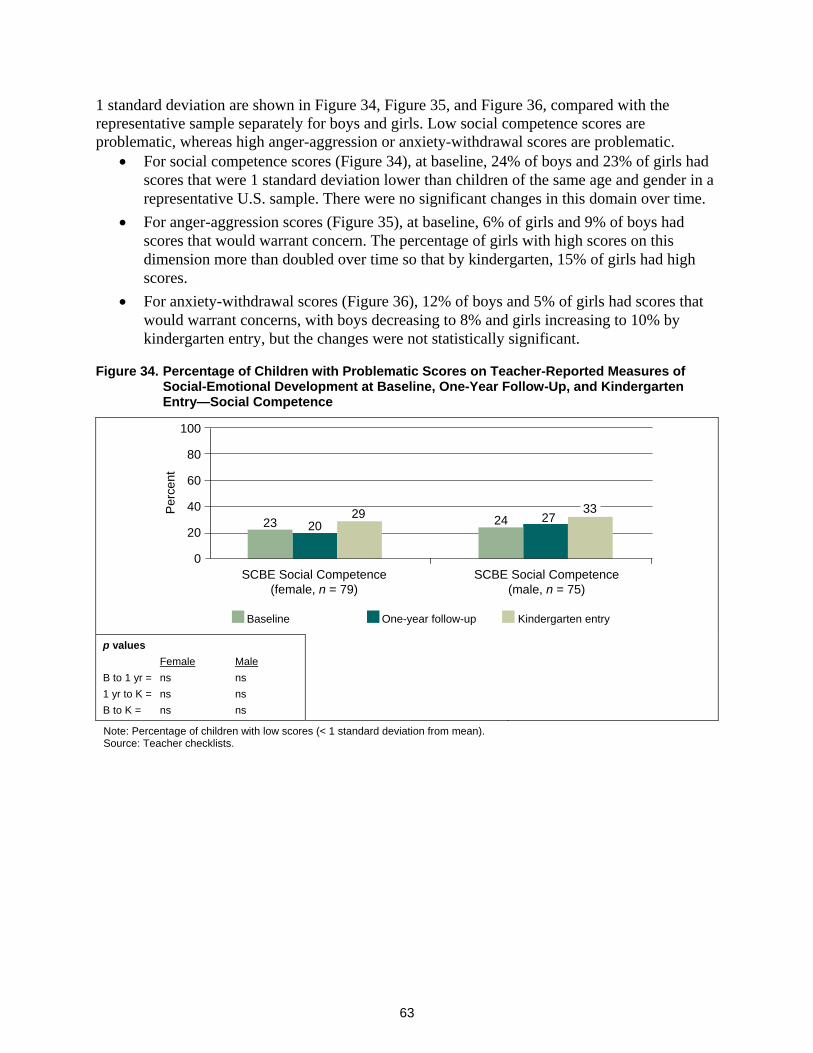
34. Percentage of Children with Problematic Scores on Teacher-Reported Measures of Social-Emotional Development at Baseline, One-Year Follow-Up, and Kindergarten Entry—Social Competence ................................................................................................ 63
35. Percentage of Children with Problematic Scores on Teacher-Reported Measures of Social-Emotional Development at Baseline, One-Year Follow-Up, and Kindergarten Entry—Anger-Aggression .................................................................................................. 64
36. Percentage of Children with Problematic Scores on Teacher-Reported Measures of Social-Emotional Development at Baseline, One-Year Follow-Up, and Kindergarten Entry—Anxiety-Withdrawal ................................................................................................ 64
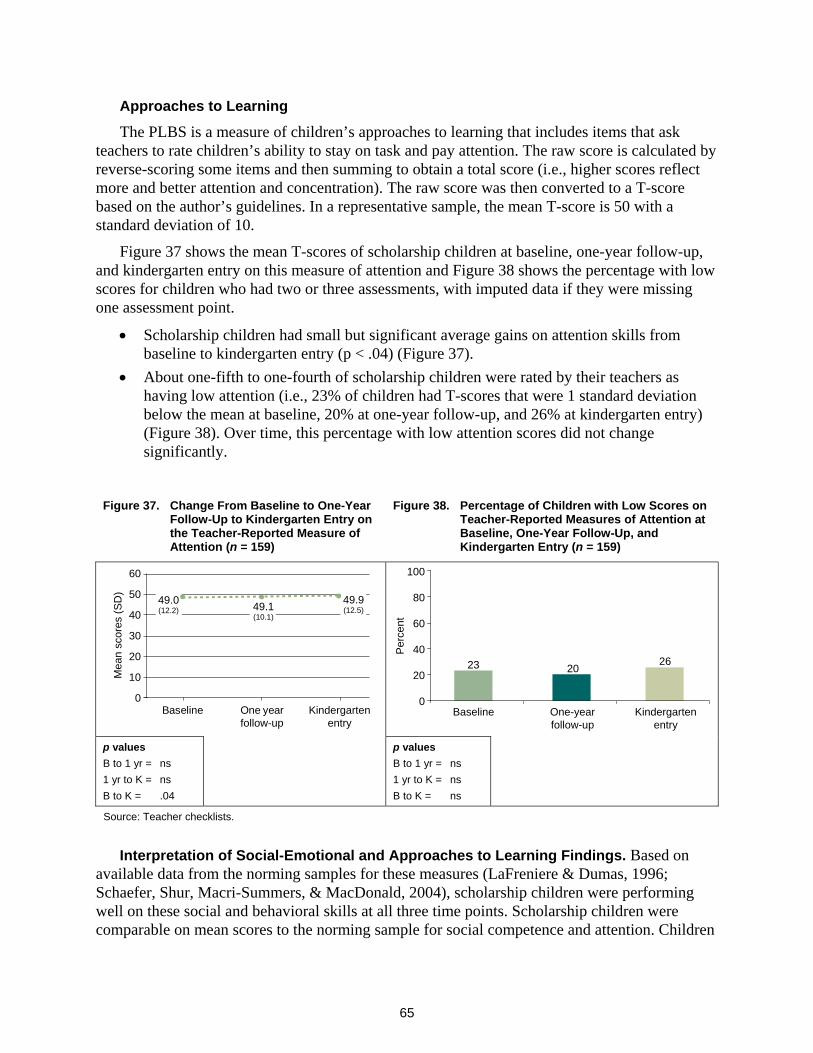
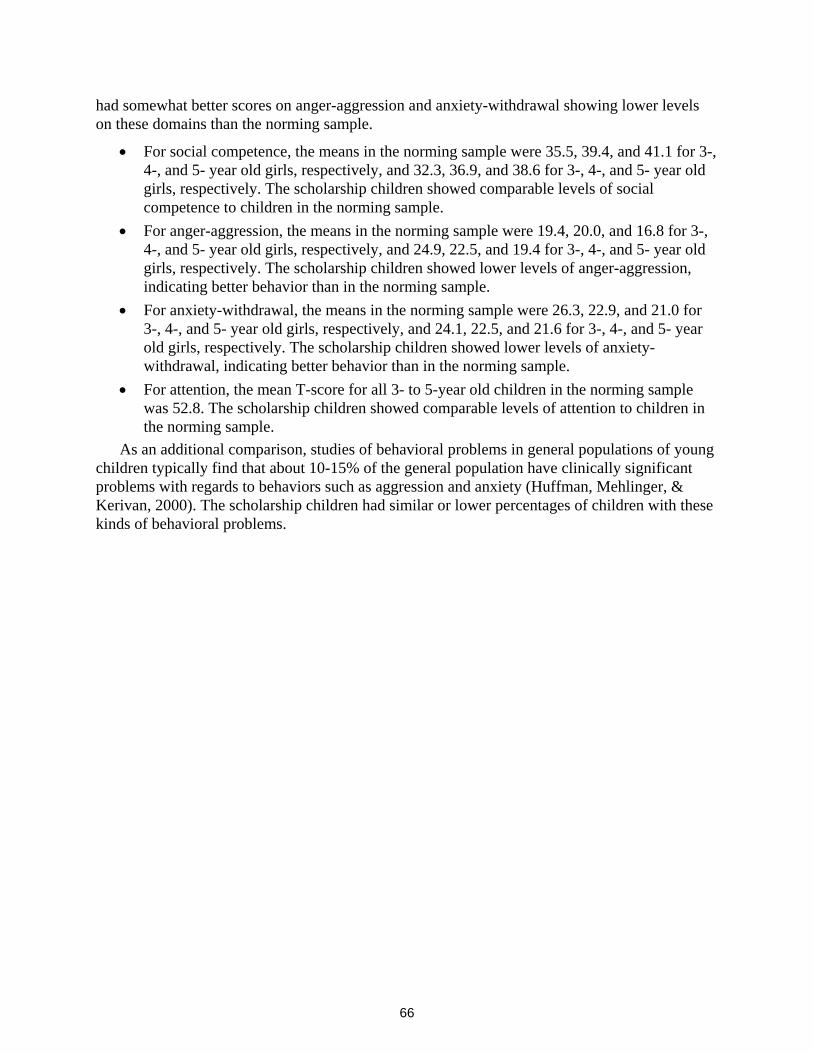
37. Change From Baseline to One-Year Follow-Up to Kindergarten Entry on the Teacher-Reported Measure of Attention (n = 159) ........................................................................... 65
38. Percentage of Children with Low Scores on Teacher-Reported Measures of Attention at Baseline, One-Year Follow-Up, and Kindergarten Entry (n = 159) ................................ 65
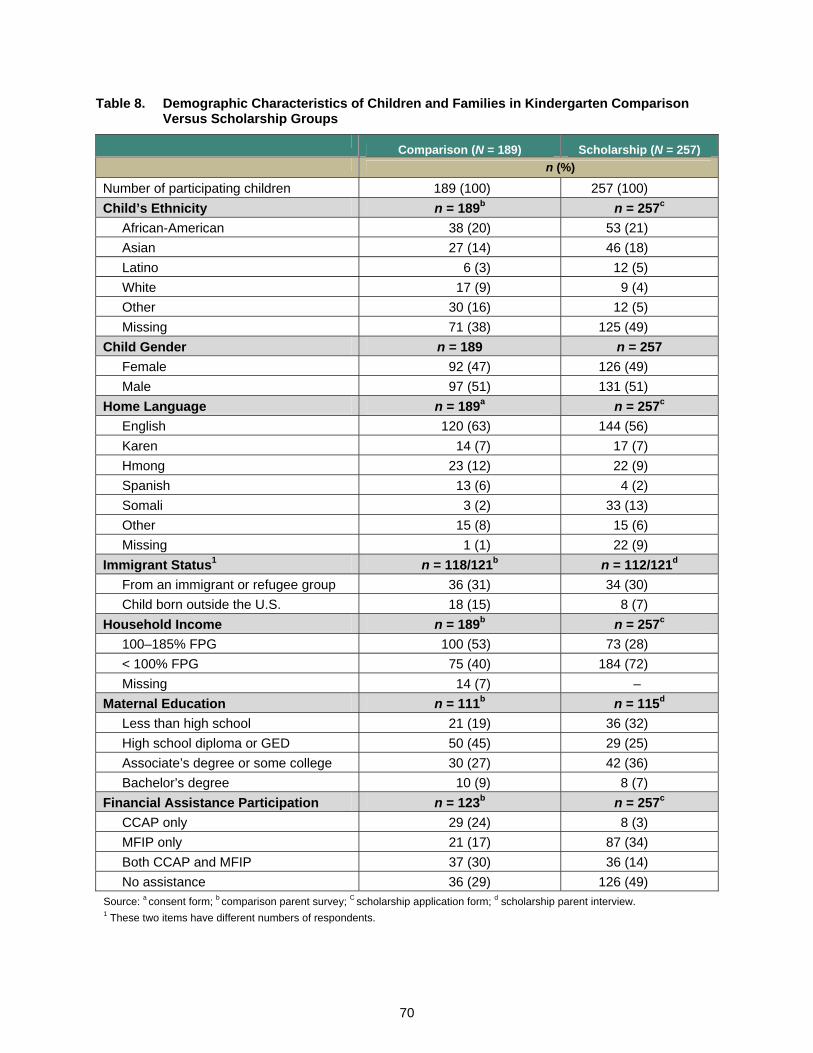
39. Home Zip Codes of Kindergarten Comparison Group Families (n = 187) ......................... 71
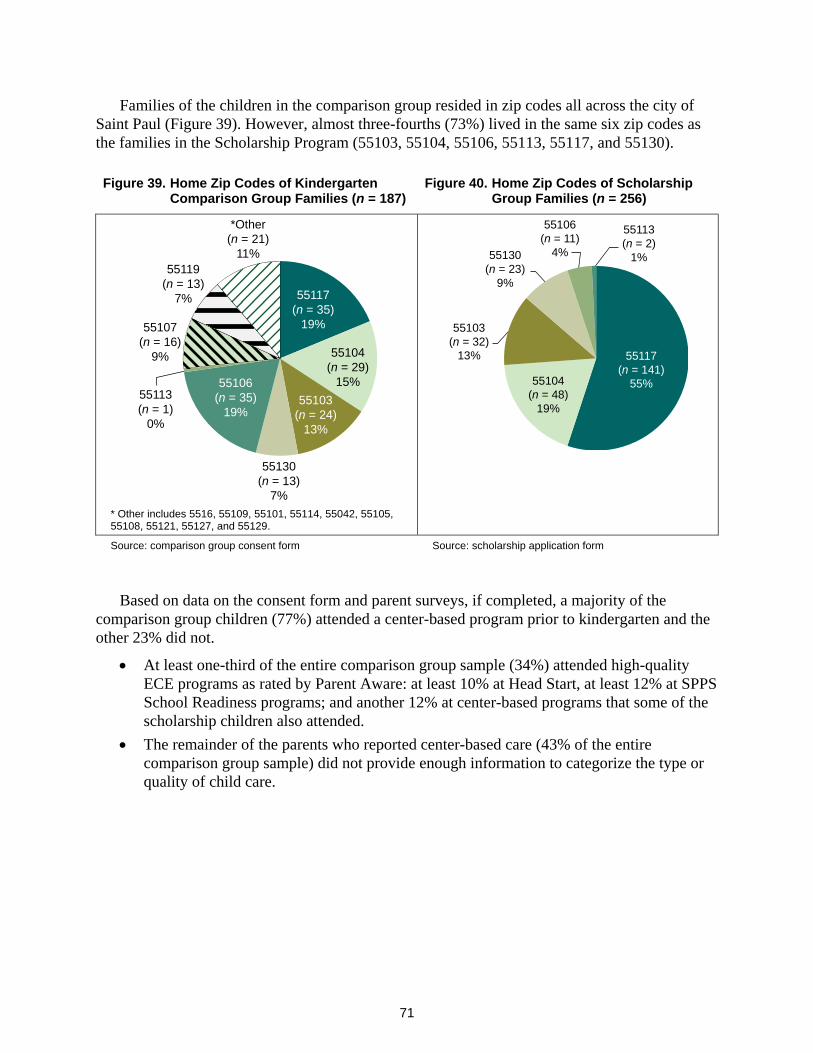
40. Home Zip Codes of Scholarship Group Families (n = 256) ................................................ 71
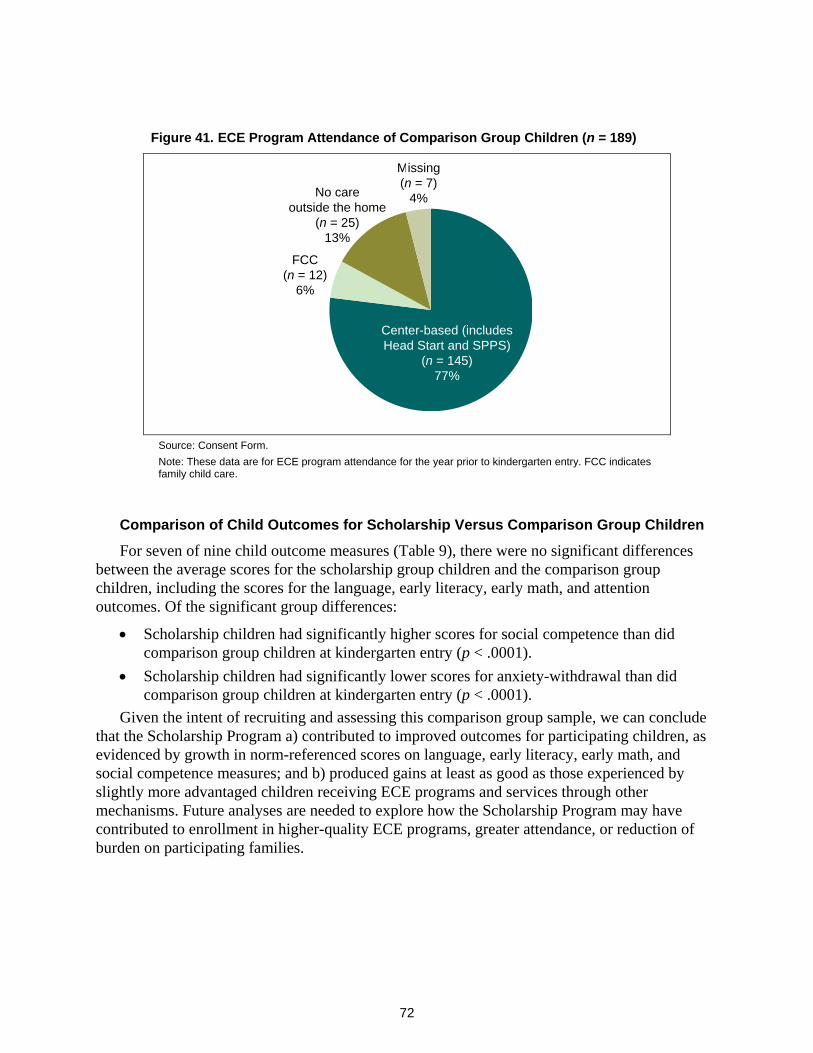
41. ECE Program Attendance of Comparison Group Children (n = 189) ................................. 72
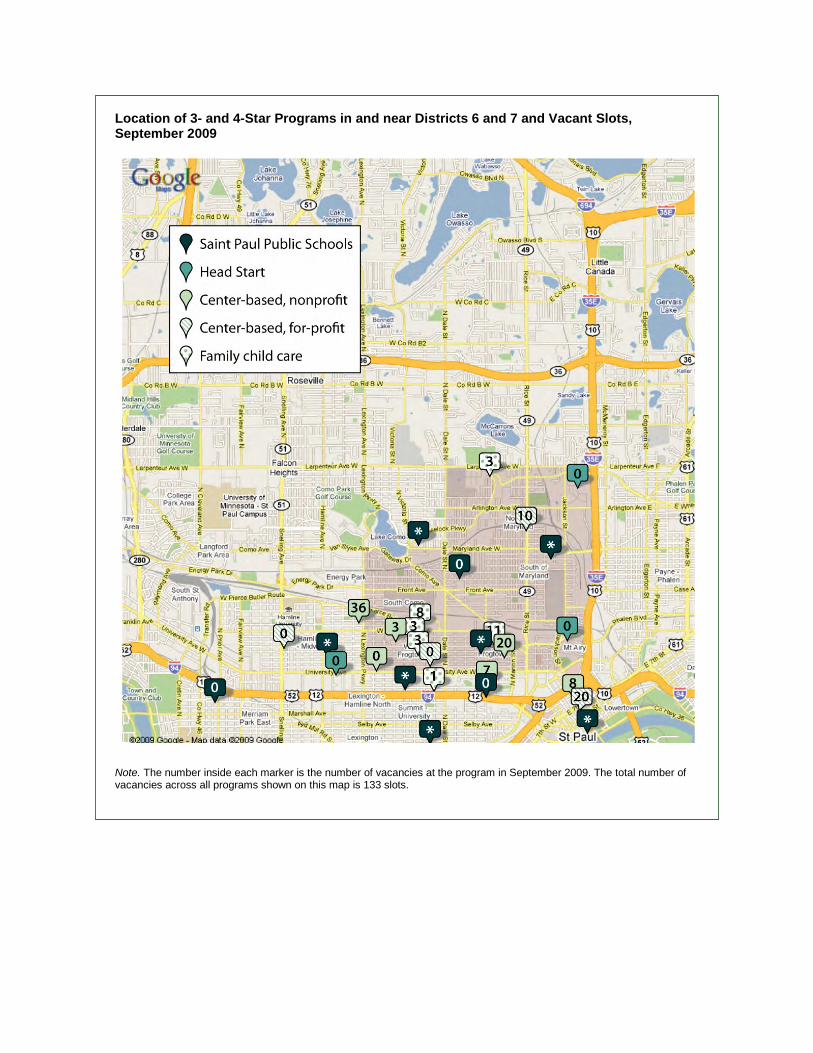
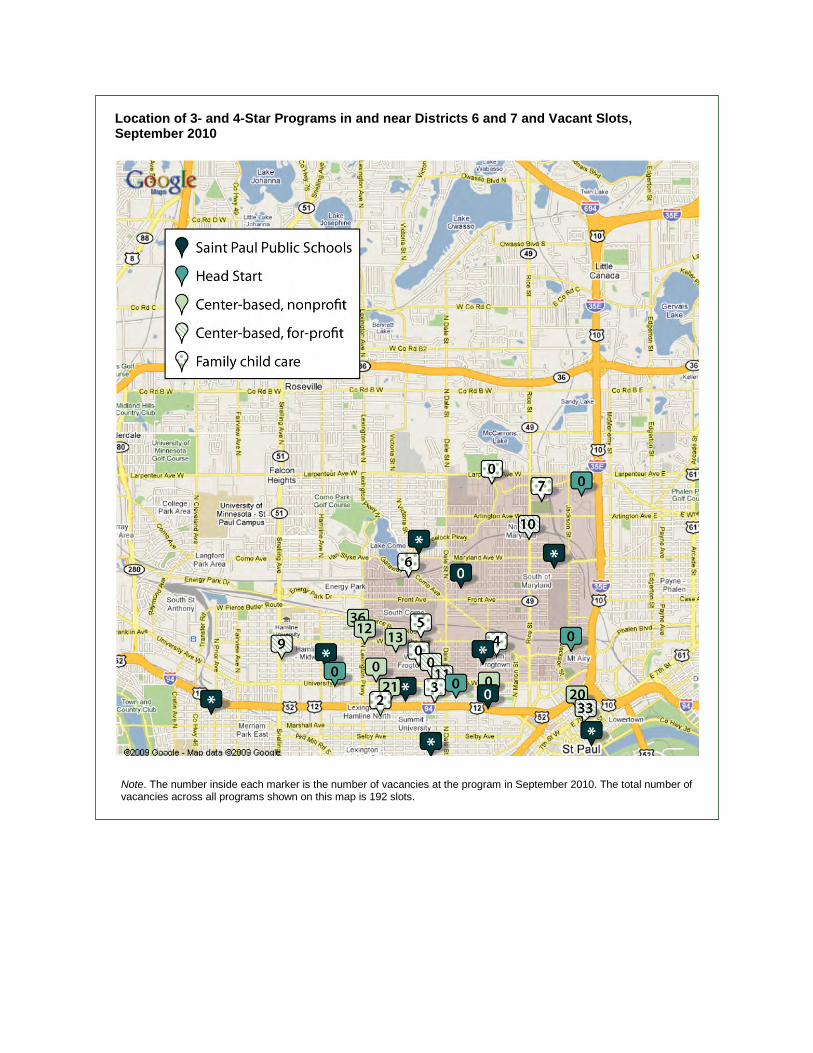
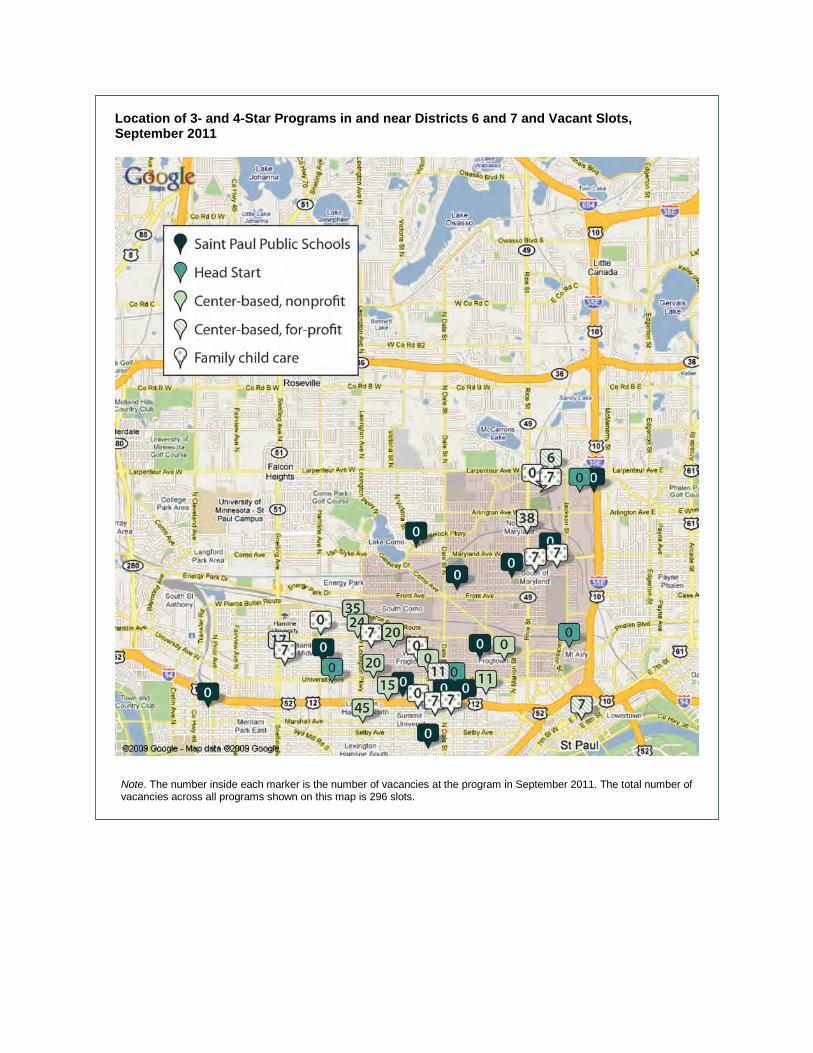
42. Percentage of High-Quality Vacant Slots (Vacancies) In and Near the Pilot Area Across Time, by Type Of Program ..................................................................................... 78
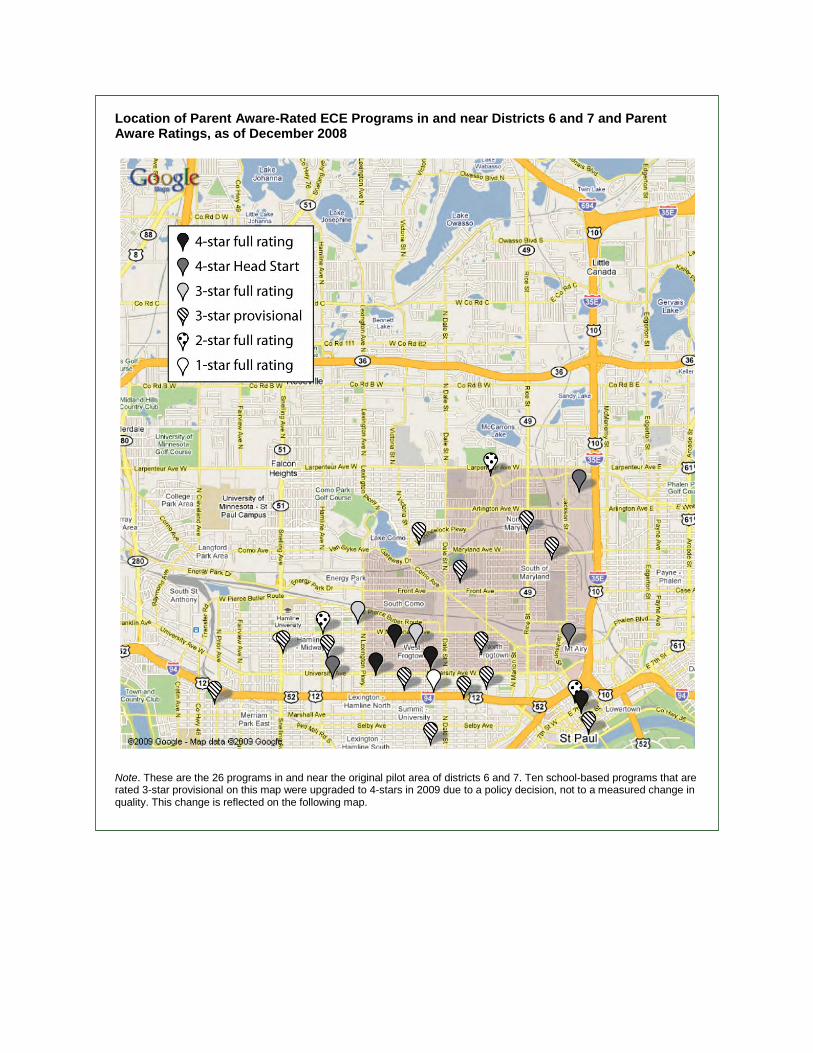
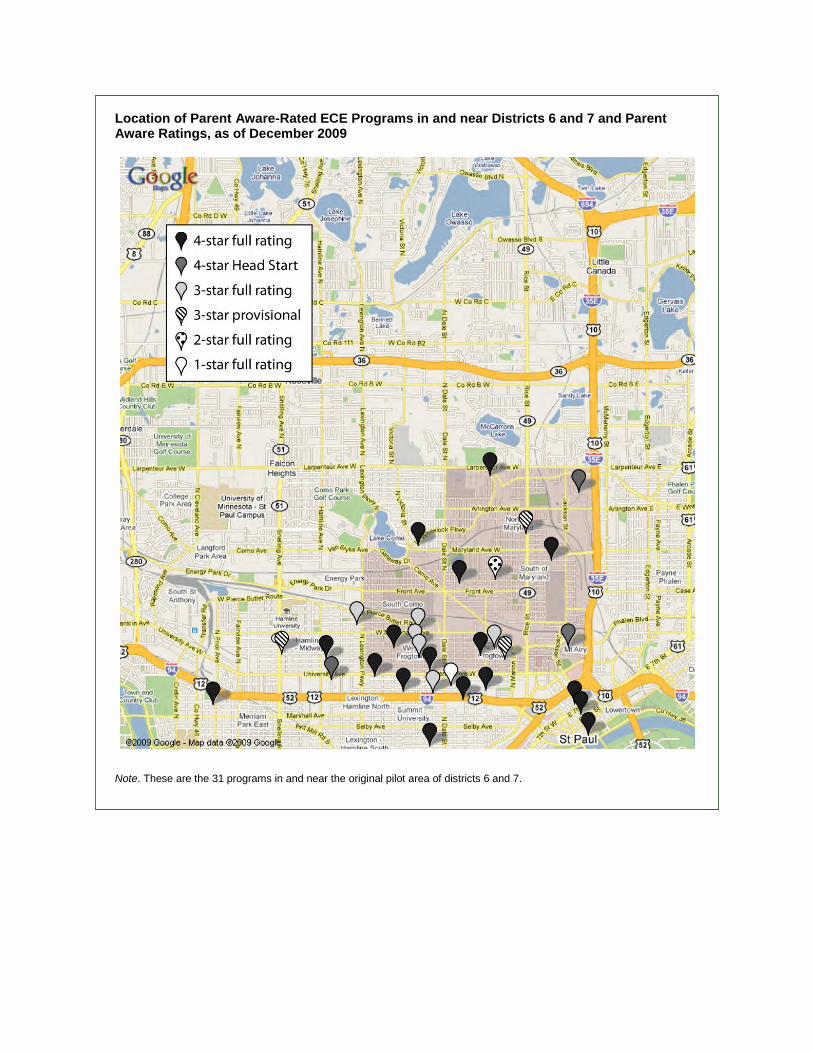
43. Location of Parent Aware-Rated ECE Programs In and Near Districts 6 and 7 and Parent Aware Ratings, as of December 2008 ............................................................. 80
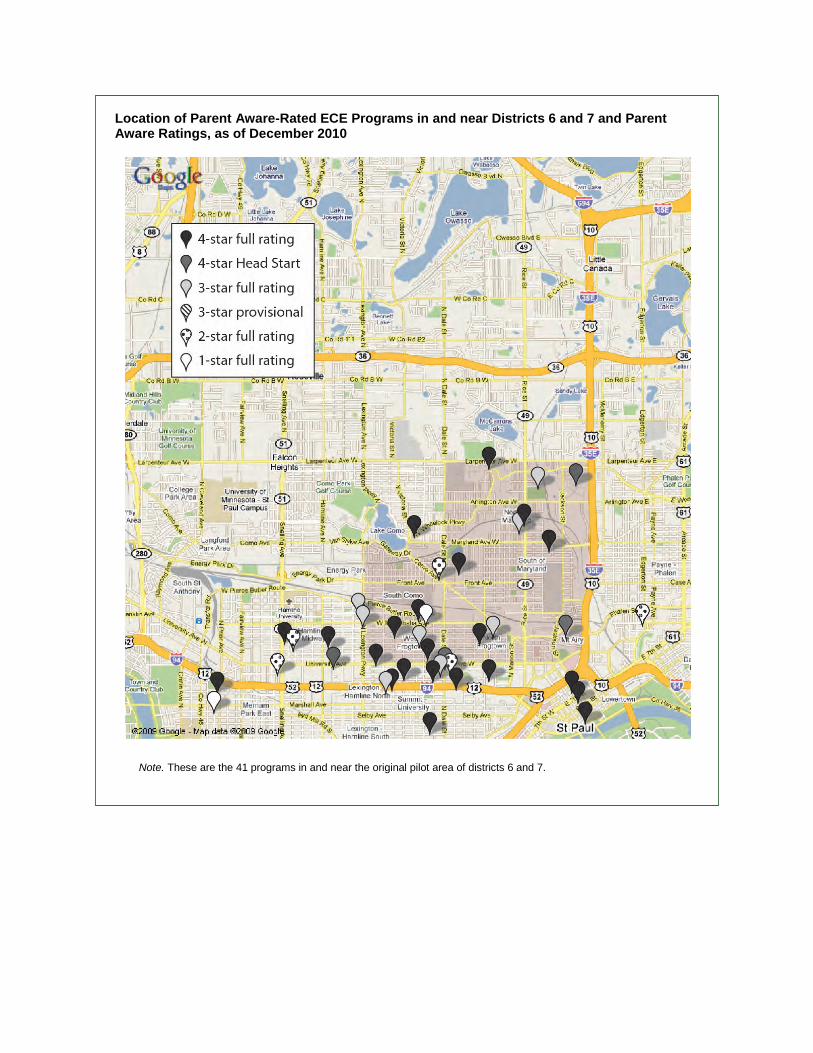
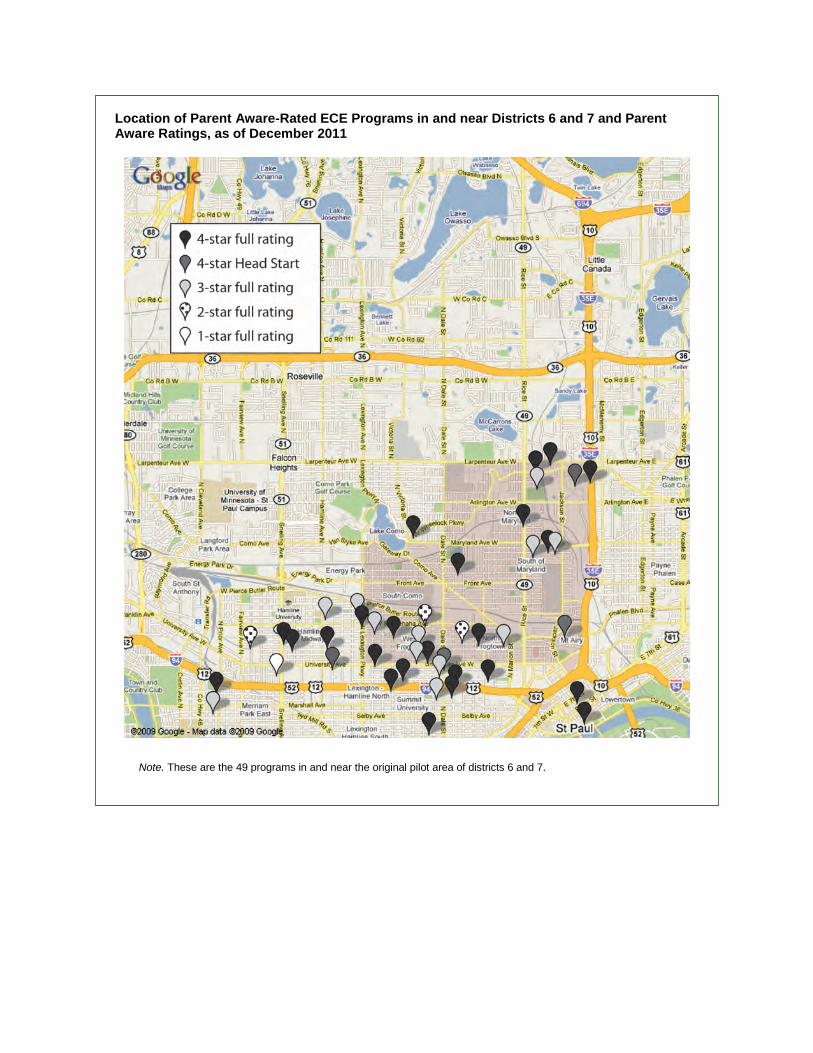
44. Location of Parent Aware-Rated ECE Programs In and Near Districts 6 and 7 and Parent Aware Ratings, as of December 2011 .................................................................... 81
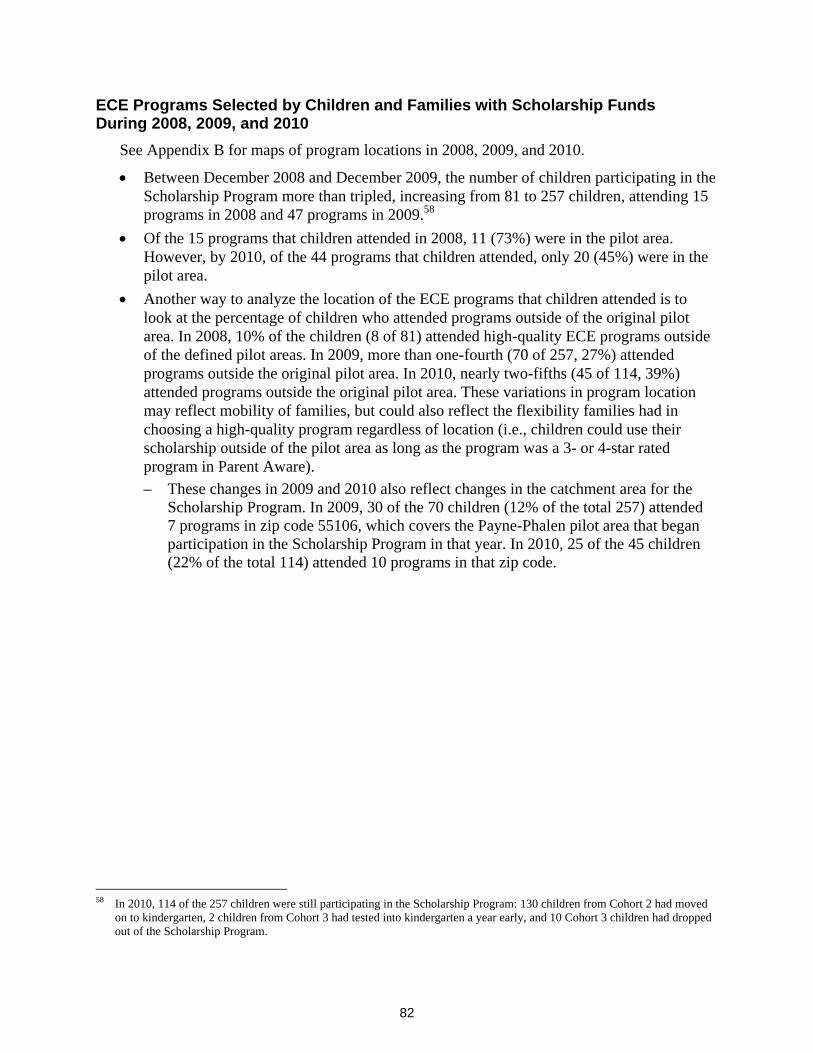
45. Location of Elementary Schools Selected by Children and Families with Scholarship Funds During their Kindergarten Year (2010 and 2011) .................................................... 84
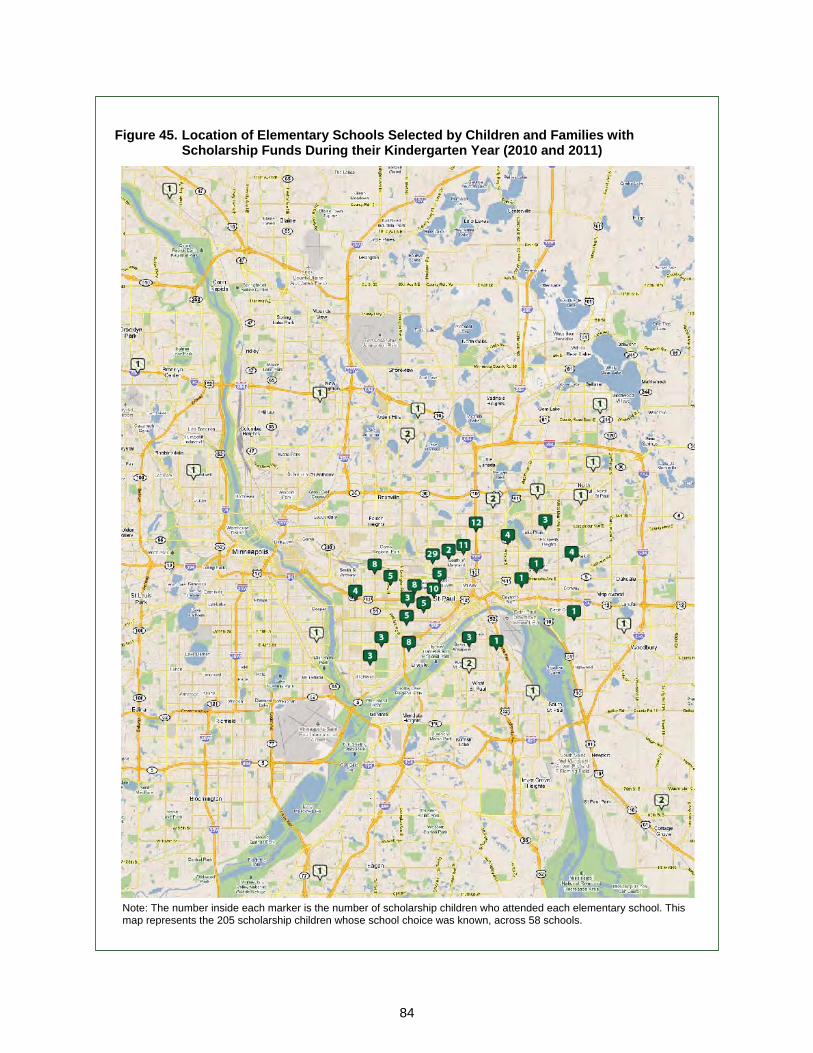
46. Location of Elementary Schools Selected by Families of Children in the Comparison Group During their Kindergarten Year (2010 and 2011) .................................................... 86
47. Changes in Number of High-Quality ECE Programs in the Pilot Area, from 2008 to 2011 ...................................................................................................................... 87
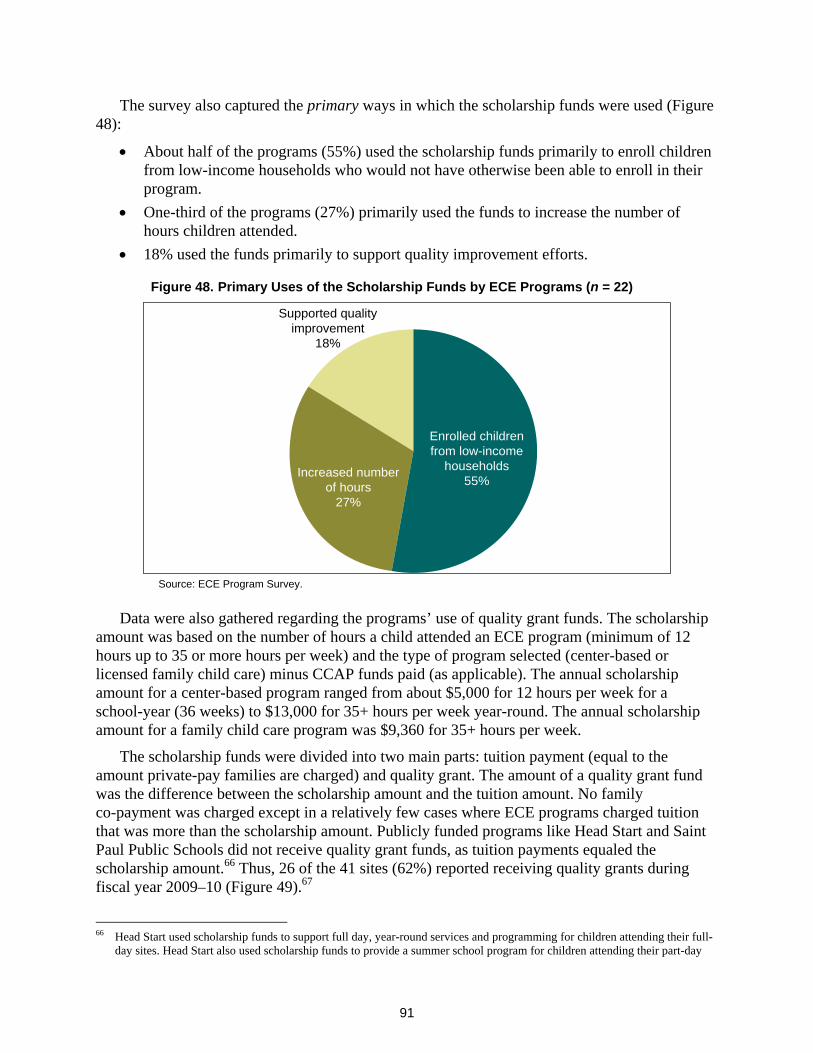
48. Primary Uses of the Scholarship Funds by ECE Programs (n = 22) .................................. 91
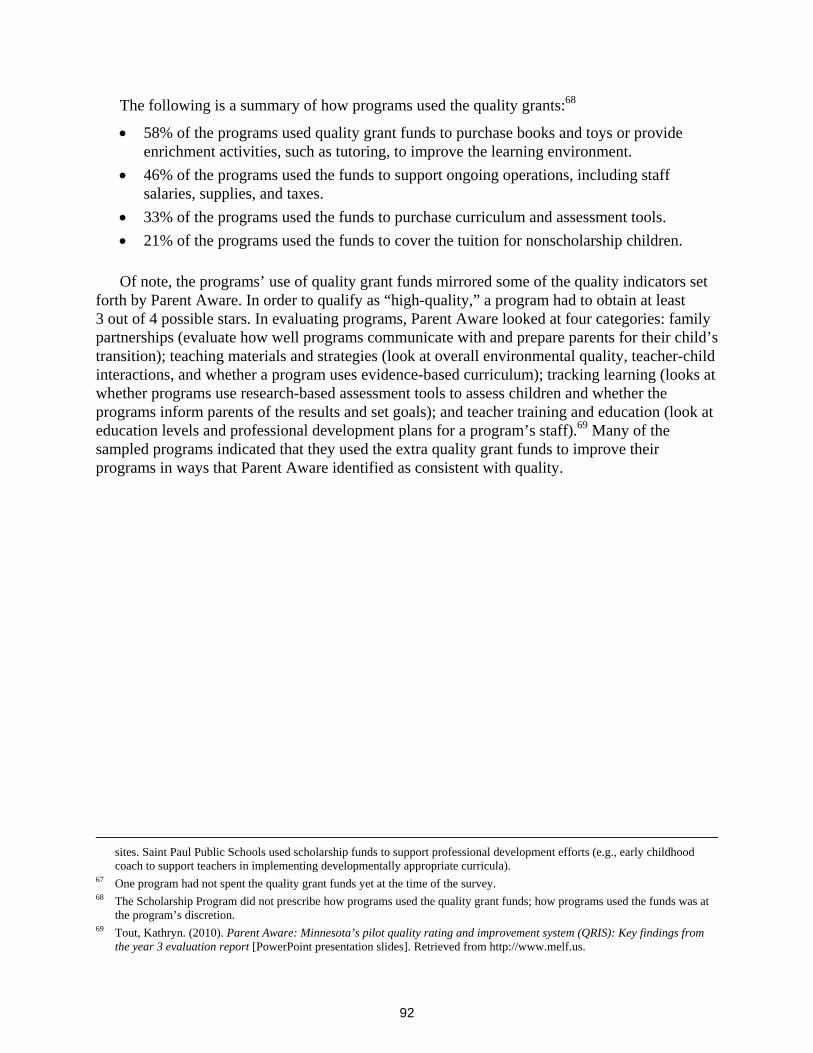
49. Uses of Quality Grant Funds by ECE Programs at Sites (n = 26 sites) ............................. 93
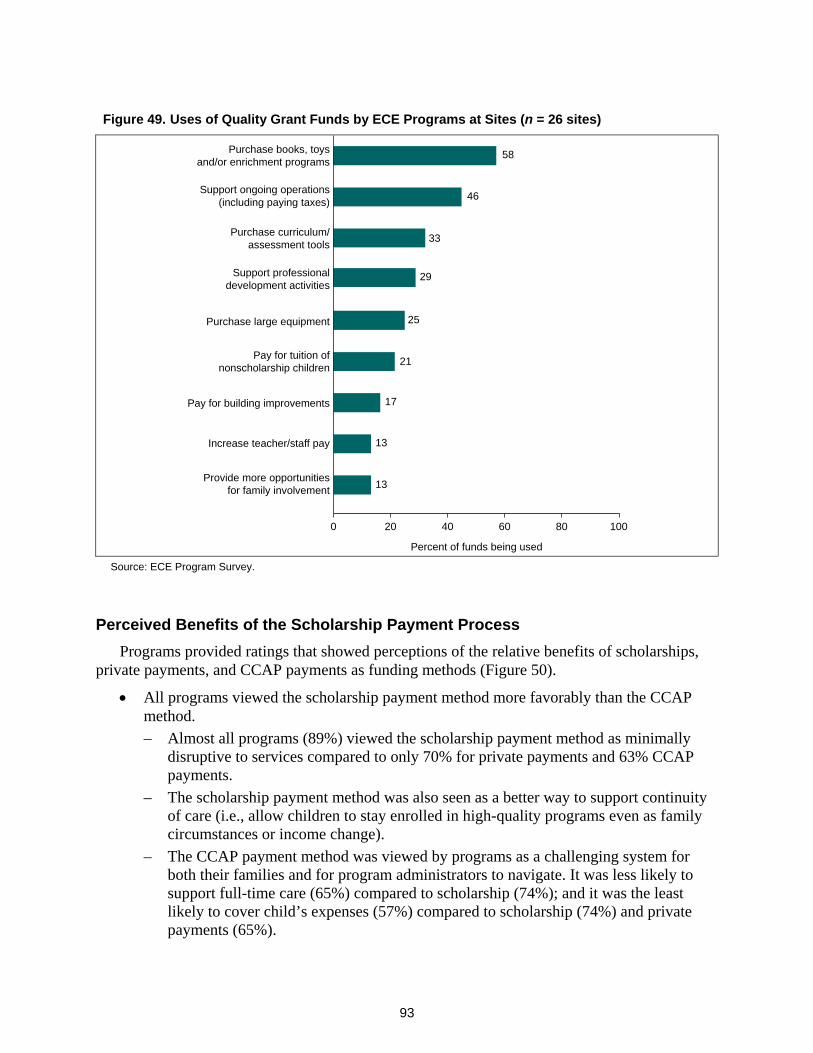
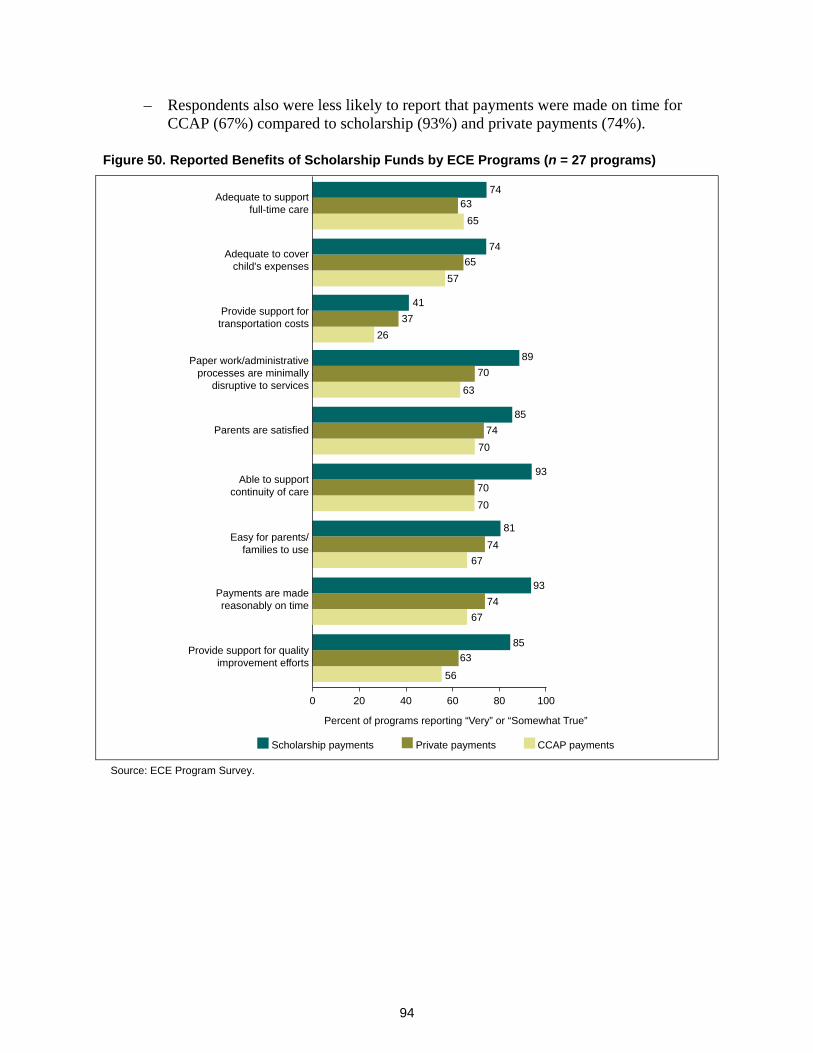
50. Reported Benefits of Scholarship Funds by ECE Programs (n = 27 programs) ................ 94
vi
Executive Summary
This is the fourth and final report about the evaluation of the pilot of the Saint Paul Early Childhood Scholarship Program. In this report, data are presented about how the scholarship model was implemented and what was learned about its effects on children, families, early childhood education programs, and the targeted community (i.e., the targeted pilot areas in Saint Paul, Minnesota). A major focus of this report is the kindergarten child outcomes, both within the scholarship participants and comparing scholarship children to children who did not receive a scholarship, but who were low-income and who were entering kindergarten at the same time as the scholarship children (i.e., 2010 or 2011).
Scholarship Model Description and the Evaluation
The purpose of this evaluation was to test the effectiveness of a market-oriented early childhood scholarship model outlined by Rolnick and Grunewald (Grunewald & Rolnick, 2006; Rolnick & Grunewald, 2003) to improve school readiness outcomes for children from low-income families. This model, which views early childhood education as a wise investment in economic development terms, was built on the ever-growing early childhood research literature demonstrating the short- and long-term benefits of high-quality early education programs, particularly for children from low-income families, who often lack access to high-quality early education programs.
The guiding principles of the model are described: provision of financial resources to families, increased accountability, and parent empowerment. Based on these guiding principles, three major interventions with hypothesized impacts were implemented and evaluated.
Parent Mentoring1 through home visiting to provide parents with information about the characteristics and benefits of high-quality ECE programs
– Mentoring leads to parent empowerment. Low-income parents are given information that can help them make good choices about how best to support their children’s early learning and school readiness.
Scholarships for low-income families to use to pay for high-quality ECE programs for their preschool children
– Scholarships lead to access to markets. Low-income families are given the financial resources to enable them to access high-quality ECE programs for their children.
– If incentives to programs are increased, the market will respond (i.e., with increases in program supply and quality).
1 Parent mentoring services ended June 30, 2009, due to budget constraints.
vii
Implementation of an ECE program quality rating system, Parent Aware,2 to rate and monitor ECE program quality
– A rating system leads to increased accountability. ECE programs are accountable for producing positive results (e.g., getting children ready to be successful in school).
Data Collection Methods
Across the four-year evaluation, multiple data collection methods were used to evaluate the implementation and impacts of the Scholarship Program on children, families, early childhood education programs, and the targeted community. These included the following:
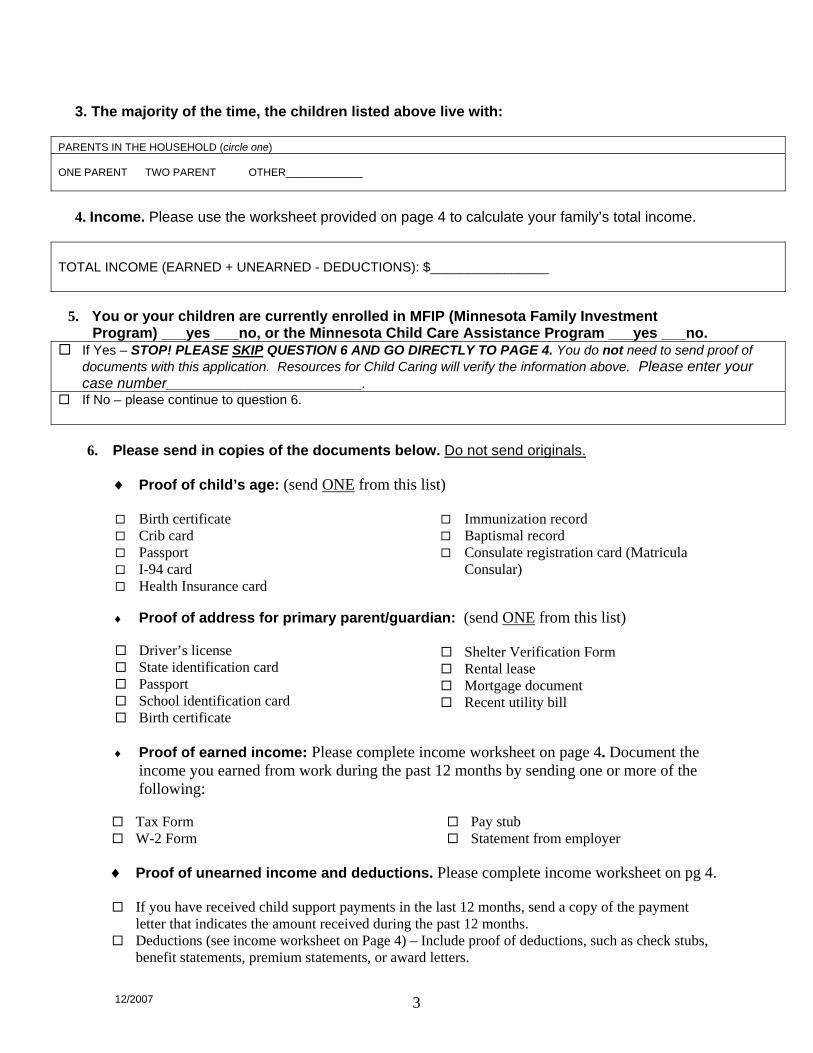
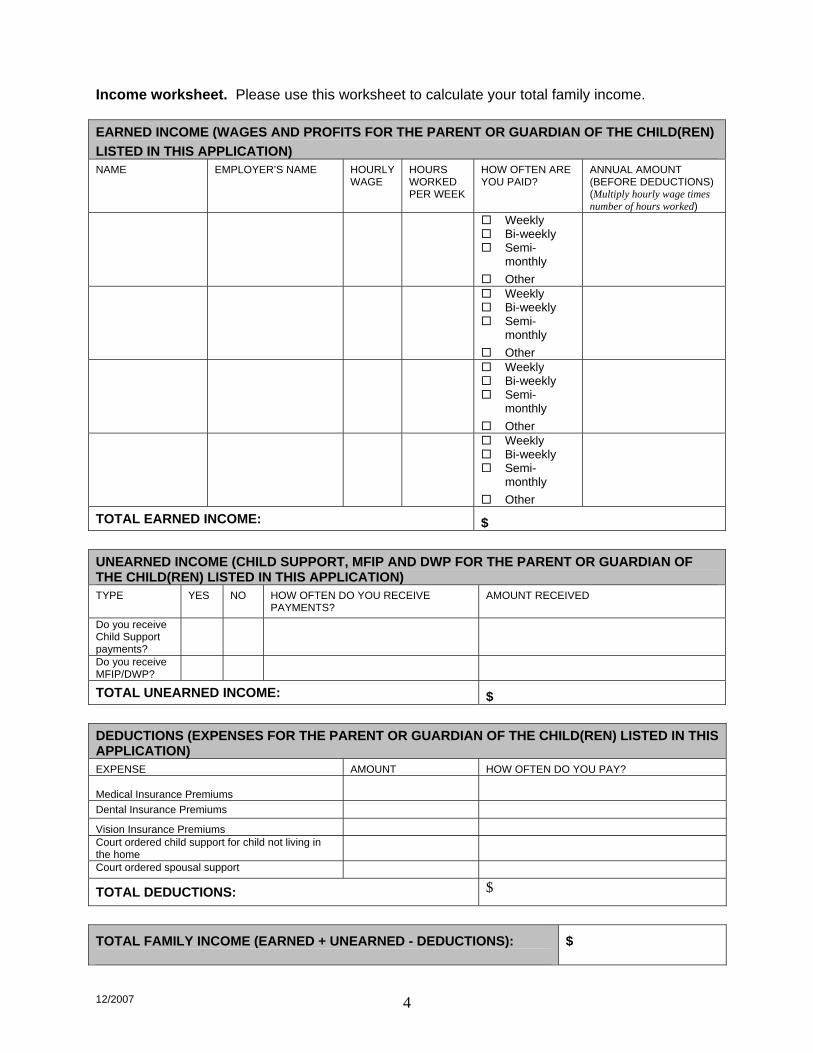
Administrative data from application forms completed by participating families and children’s ECE program participation
Parent phone interviews
Direct child assessments and teacher-completed checklists about child outcomes
Focus groups with participating families
Interviews with model developers, implementation staff, ECE program directors, and parent mentors
Interviews, record reviews, and online surveys by ECE program directors to collect data on costs and uses of scholarship funds
Sample of Participating Children and Families
The children and families participating in the Scholarship Program were in five cohorts. Of 1,100 children who were projected to participate, 652 completed an application and were deemed eligible to participate.3 The Scholarship Program provided scholarship funds to 348 (78%) of the 449 children who were age-eligible. These children used their scholarship funds at high-quality ECE programs beginning in January 2008 through August 2011. An additional 203 children were not eligible (i.e., under 3 years of age) to receive the scholarship funds during the project timeline (and prior to budget cuts in 2009). Three groups (Cohort 1 and the two infant cohorts) were not included in the evaluation.
In this final report, data are presented for Cohorts 2 and 3 only because the children in these groups participated in the outcome evaluation and were expected to have the most in-depth data, including school readiness and kindergarten outcomes, by 2011. Children in Cohorts 2 and 3 were considered fully participating in the scholarship if they were enrolled in an ECE program using their scholarship funds between January 2008 and August 2011. Of the 320 children in Cohorts 2 and 3 with approved eligible applications to participate in the Scholarship Program, 291 had signed consents to participate in the evaluation, and 257 children eventually enrolled in an ECE program using scholarship funds.
2 For detailed information about Parent Aware, go to its website at http://www.parentawareratings.org/. 3 A total of 268 children in Cohort 3 had completed applications and were deemed eligible by July 2009, but, due to budget cuts,
Cohort 3 participation and enrollment were capped at 132.
viii
Demographic data for the 257 children and families enrolled in the Scholarship Program and the evaluation (Cohorts 2 and 3 combined) showed that:
A little over half of the families reported that their primary home language was English (56%), with Karen (13%) and Hmong (9%) being the next most common home languages.
Ethnicity was not reported on the application forms for nearly half of the families (49%), but for those reporting, the majority of the families were African-American (21%) or Asian (18%).
Half of the children were male (51%) and half were female (49%).
Nearly three-fourths of families (72%) had household incomes below 100% federal poverty guidelines (FPG), although eligibility for the Scholarship Program was up to 185% of the FPG.
Summary of Major Evaluation Findings
Implementation. With regard to implementation, the programs and agencies administering and participating in the Saint Paul Early Childhood Scholarship Program worked hard for the past four years to implement the program model with fidelity for five cohorts of children. All three interventions in the scholarship model (i.e., parent mentoring, distribution and use of scholarship funds to attend high-quality ECE programs, and the Parent Aware ECE program rating system) evolved over the past four years and through unanticipated budget crises and implementation challenges that occurred. The continuing implementation and evaluation of the Saint Paul Scholarship Program model in the pilot community in 2011, the final year of the program, yielded additional and new information about how the model operated and the impacts it had for children, families, programs, and the pilot community.
Implementation data collected across the four years of the evaluation, including in the final year showed that the Scholarship Program participants (e.g., funders, administrators, ECE program directors, parent mentors, and parents) had positive experiences and reported many types of positive outcomes from the Scholarship Program’s implementation in their community. For example, from implementation briefs from the evaluation:
ECE program directors in the pilot community reported that more children from low-income families were able to enroll in high-quality ECE programs due to the availability of scholarship funds.
The scholarship implementation reported that flexibility in outreach activities and use of trusted community members to enroll families into the Scholarship Program allowed them to be successful in reaching different populations of eligible families (e.g., new immigrant groups) who may not typically enroll their children in ECE programs.
Recruitment challenges arose in the early years of the implementation, which led to a recommendation for any future replications that additional time for planning and start-up is needed in order to understand the community and identify and implement successful strategies to engage families and recruit them to participate in the Scholarship Program.
ix
The family support and other activities of the parent mentors were highly valued and had strong support from all participants in the Scholarship Program, especially from the parents.
Starting in Year 2, most respondents who were interviewed stated that they believed that parents were positively influenced by being empowered to make different choices than they would have without the scholarship funds (mentioned by both implementers and parents).
Also starting in Year 2, most respondents who were interviewed mentioned that the Scholarship Program increased community and legislative awareness about the importance and complexity of early childhood.
In the pilot, the distribution of scholarships and the implementation of the Parent Aware quality rating system occurred simultaneously. This simultaneous start-up resulted in an early shortage in the number of high-quality ECE program slots available for children with scholarship. A recommendation for future replications was that the quality rating system should be implemented at least one year prior to beginning the distribution of scholarships to allow the rating process to begin and the supply of high-quality programs to be sufficient.
The Scholarship Program model worked well across a variety of ECE program types (e.g., for-profit and nonprofit community-based ECE programs, Head Start and school-based ECE programs, family child care programs). However, future replications should consider more explicitly how the market-driven scholarship model can be best used by nontuition programs such as Head Start and school-based programs and how strategies to increase participation of family-based programs can be better implemented.
Focus groups conducted with participating parents in Years 2, 3, and 4 yielded rich data to demonstrate that parents were greatly appreciative and strongly supportive of the Scholarship Program, valuing its positive impacts on their children and on themselves.
For the most part, parents chose to participate in the Scholarship Program because it allowed them to enroll their children in higher quality early care and education (ECE) programs than they could have afforded otherwise.
Compared to Minnesota’s Child Care Assistance Program (CCAP), parents described the Scholarship Program as simple to use: simple to apply for; having broader eligibility criteria; requiring less ongoing paperwork to maintain their child’s eligibility status; and, as a result, providing more consistent and stable care for their child.
Many parents commented that the scholarship funds allowed them to access a full-day rather than a half-day high-quality program for their child.
All parents described benefits of participation in the program for their children, including exposure to school readiness skills such as reading, writing, counting, identifying colors and shapes, and learning manners and how to follow rules, as well as how to interact with other adults and children and how to behave in social situations.
Across all four years, few parents had heard of Parent Aware, and only a few of them had used the website.
While the number of home visits by parent mentors and how they helped families varied considerably, the majority of parents reported that they had worked with a parent mentor
x
at least once, and most parents expressed strong positive opinions about the parent mentors.
Parents had strong positive impressions of the quality of the ECE program their children attended, mentioning four major features almost universally:
– Curriculum and early learning environments that promote children’s school readiness skills;
– Caring, compassionate, and high-quality teachers and staff who their children liked;
– Strong parent involvement activities; and
– Safety, location, hours of operation, and extra services (e.g., dental services, speech therapy).
Parents universally expressed gratitude for the Scholarship Program and understood the importance of high-quality ECE programs in supporting their children’s learning and development (both pre-academic and social) and school readiness.
Parents also expressed strong support for continuing the Scholarship Program for other families.
Data about the impact of the implementation of the ECE program quality rating system, Parent Aware, to rate and monitor ECE program supply and quality showed positive changes over the four-year pilot program in the availability of ECE programs in and near the pilot community in Saint Paul and participation in, and improved ratings from, the Parent Aware rating system.
The number of high-quality programs (3- and 4-star rated programs) in and near the pilot area increased more than 86%, from 22 programs to 41. The additional programs included 9 center-based programs (3 nonprofit, 2 for-profit, 3 school-based and 1 Head Start site) and 10 family child care programs.
The total capacity of high-quality programs in and near the pilot area increased 116% (from 1,011 slots to 2,182 slots) between 2008 and 2011. Changes in capacity varied by the type of ECE program.
The number of programs participating in Parent Aware in and near the pilot area, including those listed as being in the process of obtaining their rating, increased 40% between 2008 and 2011, from 35 to 49 programs.
The proportion of programs receiving a rating of 3 or 4, indicating high quality, increased from 85% (22 of 26 programs) in 2008 to 91% (41 of 49 programs in 2011).
A cost study conducted by RAND in Year 3 yielded important data showing variations in cost per child across different program types.
The cost for serving each child ranged from $7,010 to $25,603 per year (based on full- time enrollment, which varied in definition based on each site’s hours of operation). Hourly per child costs ranged from $3.47 to $19.06 per hour.
Family child care programs and for-profit center-based programs had the lowest costs, and nonprofit center-based programs, Head Start, and public school-based programs had the highest costs, with half-day Head Start centers and half-day public school-based programs having the highest per hour per child costs.
xi
The majority of cost differences between family child care programs and for-profit center-based programs, and nonprofit center-based programs, Head Start, and public school-based programs, respectively, were attributable to differences in the number of nonclassroom staff employed at each site. The Head Start, public school centers, and nonprofit programs were more likely to provide a wide range of services such as parent coaches, parent coordinators, or other services, resulting in higher per child costs.
Additional survey data collected from ECE programs showed the following main findings about how programs used scholarship funds.
78% of the programs used scholarship funds to enroll children from low-income households.
74% of the programs used scholarship funds to support quality improvements.
63% of the programs used scholarship funds to serve more children.
56% of the programs used scholarship funds to serve children with different demographic characteristics (e.g., children whose families had recently immigrated) than they had previously served.
48% of the programs used scholarship funds to increase the number of hours children could attend.
26% of programs noted in an open-ended comment section of the survey that the scholarship funds supported children being able to stay enrolled in high-quality programs even as family circumstances or income changed.
Survey data also showed the primary ways in which the scholarship funds were used.
55% used the scholarship funds primarily to enroll children from low-income households who would not have otherwise been able to enroll in their program.
27% used the funds primarily to increase the number of hours children attended.
18% used the funds primarily to support quality improvement efforts.
Child outcomes for scholarship group children. Results from analyses of a variety of school readiness outcomes showed that children in the Scholarship Program made significant gains and improvements in their skills from entry into their high-quality ECE programs at age 3 to one year later and again to two years later when they entered kindergarten.
Significant improvements were found for the kindergarten child outcomes for the scholarship children for seven of nine school readiness outcomes. There were significant improvements from baseline at age 3 to kindergarten entry for receptive and expressive language (both p < .0001), early literacy p < .0001 and .008), early math (p < .04), social competence (p < .02), and attention skills (p < .04) measures.
– For the PPVT receptive language measure, the gain of 5 points in scores after one year of ECE participation is equivalent to an effect size of .33, considered to be a moderate effect size, and the gain of 9 points across two years is equivalent to an effect size of .59, which is a large gain.
– For the Picture Naming expressive language measure, the gain of 11 points across two years is equivalent to an effect size of 1.2, which is a very large gain.
xii
– For the Print Knowledge measure, the gain of nearly 9 points across two years is equivalent to an effect size of .49, which is a moderate to large gain.
– For the Phonological Awareness measure, the gain of about 5 points across two years is equivalent to an effect size of .32, which is a moderate gain.
– For the Applied Problems early math measure, the gain of about 3 points across two years is equivalent to an effect size of .23, which is a small gain.
– For the Social Competence measure, the gain of almost 4 points across two years is equivalent to an effect size of .27, which is a small gain.
– For the Attention measure, the gain of 1 point in scores across two years is equivalent to an effect size of .07, which is a very small gain.
The percentage of scholarship children with problematic scores4 decreased between baseline at age 3 and kindergarten entry for four of the nine measures.
– For the PPVT receptive language measure, the percentage of scholarship children with low scores decreased from 56% at baseline at age 3 to 37% at kindergarten entry (p < .0001).
– For the Picture Naming expressive language measure, the percentage of scholarship children with low scores decreased from 33% at baseline at age 3 to 21% at kindergarten entry (p < .0001).
– For the Print Knowledge measure, the percentage of scholarship children with low scores decreased from 30% at baseline at age 3 to 18% at kindergarten entry (p < .009).
– For the Applied Problems early math measure, the percentage of scholarship children with low scores decreased from 22% at baseline at age 3 to 8% at kindergarten entry (p < .001).
For three of the remaining measures, the percentage of scholarship children with problematic scores remained similar between baseline at age 3 and kindergarten entry for three scores. For one measure, girls, but not boys, showed significant increases in the number with problematic scores.
– For the Phonological Awareness measure, the percentage of scholarship children with low scores remained similar from 35% at baseline at age 3 to 34% at kindergarten entry.
– For the Social Competence measure, the percentage of scholarship children with low scores remained similar for both boys (24% to 33%) and girls (23% to 29%) from baseline at age 3 to kindergarten entry.
– For the Anger-Aggression measure, the percentage of scholarship children with high scores remained similar for boys (9% to 12%), but was significantly increased for girls (6% to 15%) at baseline at age 3 to 18% at kindergarten entry.
– For the Anxiety-Withdrawal measure, the percentage of scholarship children with high scores remained similar for both boys (12% to 8%) and girls (5% to 10%) from baseline at age 3 to kindergarten entry.
4 Scores that were one standard deviation or more from the mean in a problematic direction (e.g., lower language skills, higher
anger-aggression or anxiety-withdrawal scores).
xiii
– For the Attention measure, the percentage of scholarship children with low scores remained similar from 23% at baseline at age 3 to 26% at kindergarten entry.
Child outcomes for comparison group children. Results from analyses comparing the same school readiness outcomes for a comparison group of entering kindergarten children showed no significant group differences on seven of the nine child outcome measures, including for the language, early literacy, early math, and attention outcomes. On two of the behavioral outcome measures, social competence and anxiety-withdrawal, scholarship children had significantly better outcomes compared with children in the comparison group (both p < .0001). Interpretations and limitations of these comparison findings are discussed.
Implications of Scholarship Evaluation Findings
Several important implications from the cumulative data from the evaluation of the pilot of the Saint Paul Early Childhood Scholarship Program are discussed.
The implementation data collected across the four-year evaluation indicated that the scholarship model could be implemented successfully in the pilot community suggesting that the model can be replicated in other communities.
The data showed that the Scholarship Program was well received in the pilot community and that program participants (e.g., funders, administrators, ECE program directors, parent mentors, and parents) had positive experiences and outcomes. Such support from the broad range of stakeholders bodes well for the scholarship model if replications are implemented. One caution, however, is that more consideration of how to implement a market-based model with ECE programs that do not charge fees (e.g., Head Start, public school-based ECE programs) is warranted.
The implementation data also indicated that the initial recruitment and start-up activities presented some challenges that might have been addressed by having a longer planning phase for the project. More planning time could allow for sufficient time to work with the local community and orient them about the purposes of the project, to fine tune various procedures, and to establish the ECE program quality rating system.
The data showed that the supply of high-quality ECE programs and slots increased over the four years of the scholarship pilot program, and there was a steady increase over time in the number of ECE programs participating in the Parent Aware quality rating system and receiving the highest-quality ratings. It is likely that the combination of the availability of scholarships and the requirements that they only be used in the high star-rated ECE programs encouraged these increases in and near the pilot community.
The positive child outcomes at kindergarten entry for the scholarship children found in the evaluation adds to the considerable data showing that attending a high-quality ECE program can promote young children’s school readiness outcomes, particularly for children from low-income families. Many of the scholarship children went from very low performance on the outcome measures at baseline at age 3 to near or at age-level performance at kindergarten entry, most notably on language and early literacy measures as well as social competence. These are important gains as these early measures are predictive of later school achievement.
xiv
The kindergarten child outcomes for scholarship versus comparison group children showed no group differences on seven of the nine measures. Scholarship children had significantly better performance for the measures of social competence and anxiety-withdrawal. These findings are difficult to interpret for at least two reasons related to the comparability of the comparison group sample, including as follows:
– A majority of comparison group children also attended ECE programs prior to entering kindergarten and many were high-quality ECE programs.
– Fewer comparison group children came from families living in poverty and with mothers with very low educational attainment, suggesting that the comparison group was more affluent and better educated than the scholarship group, attenuating the potential intervention effects. Future replications need to consider how to implement a more rigorous causal study design (e.g., randomly assign multiple communities to scholarship versus comparison conditions because the scholarship model is a community-wide intervention).
The Scholarship Program was successful in increasing the school readiness of the participating children from low-income families The scholarship children’s developmental trajectories on important language, early literacy, early math, and social and behavioral skills improved significantly from age 3 to kindergarten entry. The kindergarten outcomes data showed that the scholarship children’s development and skills were at or near age level, giving them the boost from high-quality ECE program participation that will help them to be successful in school.
15
Introduction
This is the final report on the evaluation of the pilot of the Saint Paul Early Childhood Scholarship Program. The purpose of the report is to describe how the scholarship model was implemented and what has been learned about its effects on children, families, early childhood education programs, and the targeted community (i.e., the targeted pilot areas in Saint Paul, Minnesota). A major focus of this report is the kindergarten outcomes, both within the scholarship participants and comparing scholarship children to children who did not receive a scholarship but who were low-income and who were entering kindergarten at the same time as the scholarship children (i.e., 2010 or 2011). The report has both process and outcome components. Activities during the final year of the project included the following:
Following the second cohort of children through completion of their second year of attending an early childhood education (ECE) program
Following the second cohort of children into kindergarten and conducting assessments of their developmental progress at kindergarten entry
Continuing to track implementation of Parent Aware and the supply of early education programs and slots in and near districts 6 and 7 in Saint Paul
Continuing to monitor the implementation of the Scholarship Program (e.g., procedures, successes, challenges)
Conducting focus groups of participating scholarship families
Assisting RAND in completing the cost study of a subset of 12 ECE programs
Facilitating a technical work group that met during the end of the final year of the project to discuss the findings and their implications
The report begins with an overview of the scholarship model and the evaluation questions the report addresses. Next, we present findings about the enrollment and participation of children and families, the characteristics of participating children and families, children’s developmental outcomes, the ECE programs and the pilot community, and programs’ costs and uses of the scholarship funds. The report ends with a summary of the implications of the scholarship evaluation.
16
Overview of the Saint Paul Early Childhood
Scholarship Program Model
Model Description
The purpose of this evaluation was to test the effectiveness of a market-oriented early childhood scholarship model outlined by Rolnick and Grunewald (Grunewald & Rolnick, 2006; Rolnick & Grunewald, 2003). This model, which views early childhood education as a wise investment in economic development terms, was built on the ever-growing early childhood research literature demonstrating the short- and long-term benefits of high-quality early education programs, particularly for children from low-income families, who often lack access to high-quality early education programs.
The developers (Rolnick and Grunewald) and individuals representing the Minnesota Early Learning Foundation (MELF) were asked about the impetus for the pilot of the Scholarship Program and their vision of it addressing early childhood education issues. These respondents articulated key features of the model, including the following:
The model rests on the assumption that in a market-driven system, people behave in their best interests (i.e., parents are invested in the best interests of their children; the child care workforce and early education program administrators want to make a living).
In designing the scholarship model, the developers kept in mind three guiding principles:
– Provision of financial resources to families. Parents from low-income families must be given the financial resources that will enable them to access high-quality early childhood education (ECE) programs for their children; if incentives to programs are increased, the market will respond.
– Increased accountability. Early education programs must be held accountable for producing positive results (e.g., getting children ready to be successful in school); programs that produce positive results will be eligible to receive higher payments, in the form of scholarships for the children they serve, thus incentivizing ongoing performance. If programs are provided with incentives to produce positive results, they will respond to produce positive results.
– Parent empowerment. Parents benefit from an array of information that can help them make good choices about how best to support their children’s early learning and school readiness. If parents who are low-income are given the information about the characteristics and benefits of high-quality ECE programs for their children’s learning and school readiness and the monetary resources needed to access these programs, their empowerment will create demand, which in turn will promote long-term sustainability of the supply of high-quality early education programs.
17
In short, the model contends that the market must provide incentives for early childhood education programs to achieve high quality, programs must be accountable to parents and the public (who fund programs) for achieving positive child outcomes, and parent empowerment is predicted to drive demand for high-quality early education programs as well as promote sustainability. An additional principle is that the model should be cost-effective at a systems level; that is, the market will support those programs that achieve positive results, but those programs that do not will not be sustained or, at the very least, will not participate in a market-driven approach (i.e., not solicit scholarship funds because they do not meet high-quality standards).
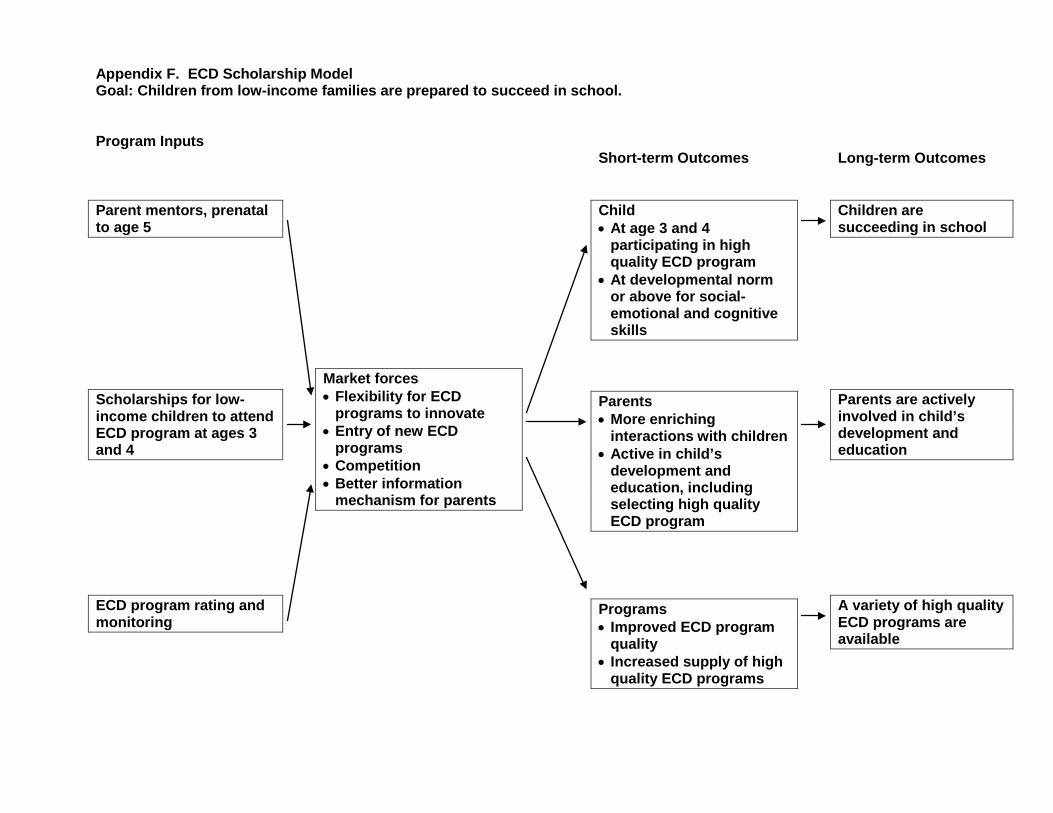
Figure 1 shows the logic model of the Scholarship Program designed by its developers. The model has three major interventions, shown as Program Inputs that map on to the three principles described above.
Parent Mentoring5 through home visiting to provide parents with information about the characteristics and benefits of high-quality ECE programs
– Mentoring leads to parent empowerment. Low-income parents are given information that can help them make good choices about how best to support their children’s early learning and school readiness.
Scholarships for low-income families to use to pay for high-quality ECE programs for their preschool children
– Scholarships lead to access to markets. Low-income families are given the financial resources to enable them to access high-quality ECE programs for their children.
– If incentives to programs are increased, the market will respond (i.e., with increases in program supply and quality).
Implementation of an ECE program quality rating system, Parent Aware,6 to rate and monitor ECE program quality
– A rating system leads to increased accountability. ECE programs are accountable for producing positive results (e.g., getting children ready to be successful in school).
5 Parent mentoring services ended June 30, 2009, due to budget constraints. 6 For detailed information about Parent Aware, go to its website at http://www.parentawareratings.org/.
18
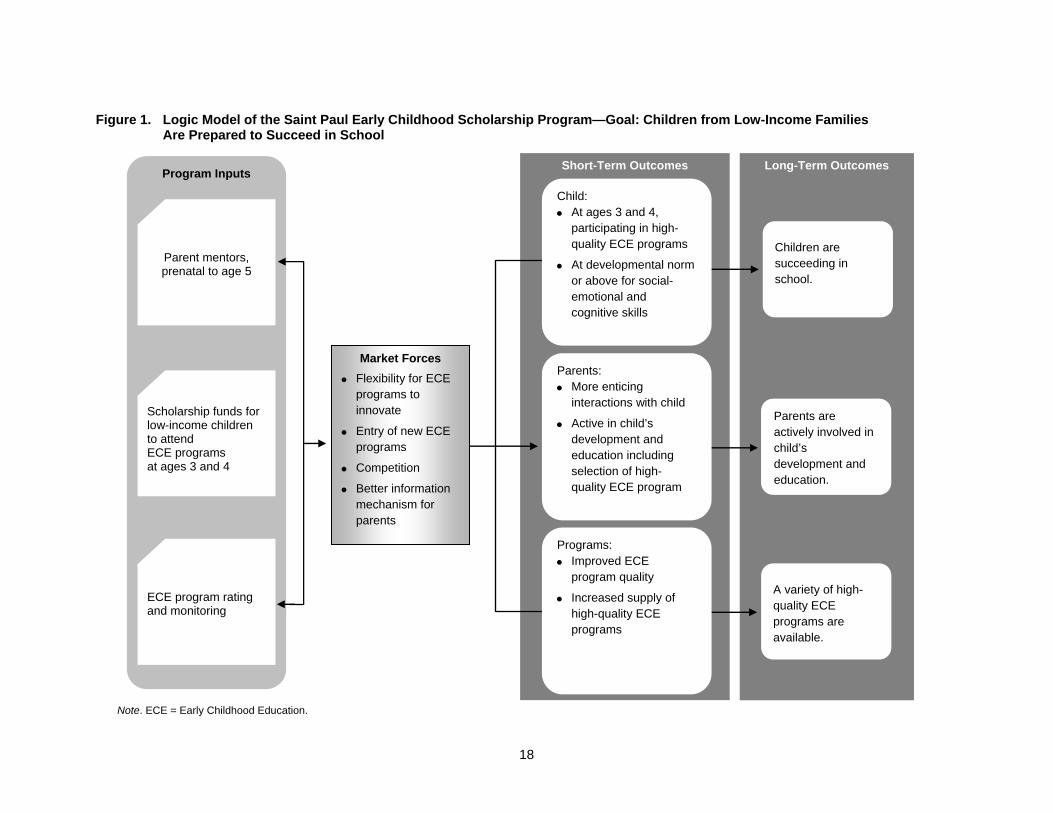
Figure 1. Logic Model of the Saint Paul Early Childhood Scholarship Program—Goal: Children from Low-Income Families Are Prepared to Succeed in School
Note. ECE = Early Childhood Education.
Long-Term Outcomes Short-Term Outcomes
Child:
At ages 3 and 4, participating in high-quality ECE programs
At developmental norm or above for social-emotional and cognitive skills
Parents:
More enticing interactions with child
Active in child’s development and education including selection of high-quality ECE program
Programs:
Improved ECE program quality
Increased supply of high-quality ECE programs
Children are succeeding in school.
Parents are actively involved in child’s development and education.
A variety of high-quality ECE programs are available.
Program Inputs
Parent mentors, prenatal to age 5
Scholarship funds for low-income children to attend ECE programs at ages 3 and 4
ECE program rating and monitoring
Market Forces
Flexibility for ECE programs to innovate
Entry of new ECE programs
Competition
Better information mechanism for parents
19
Evaluation
Evaluation Questions
The findings to be presented draw on this logic model to show how the scholarship model worked and what was been learned about its components. The qualitative and quantitative data presented in this report address key questions about the logic model.
How were the three Scholarship Program interventions shown as Program Inputs implemented (i.e., parent mentoring, receipt of scholarship funds and attendance in high-quality ECE programs, and program participation in the Parent Aware program rating system)?7
– Who were the children, families, and programs that participated in the Scholarship Program? What were the demographic and baseline developmental characteristics of children and families (ethnicity, income/SES, mobility, language, employment, etc.)? What factors did families identify that facilitate enrollment and participation in the Scholarship Program? What factors did families identify that serve as barriers to enrollment and participation in the Scholarship Program? How many programs did children attend for how many months? Did they attend part-time or full-time?
– Who participated in the parent mentoring component of the Scholarship Program? How many visits did children and families receive? What activities occurred during the visits and what topics were discussed?8
– Which types of ECE programs responded to the Scholarship Program by participating in Parent Aware and by enrolling children with scholarship funds? How many high-quality ECE programs and slots were available in and near the pilot area for families to choose for their children to use their scholarship funds? How did the supply of ECE programs and slots change over the first three years of implementation? Did new programs enter the market in and near the pilot area?
In addition to general participation data, we asked the following outcome evaluation questions.
How did the development of scholarship participants compare to expected development for children their age?
– What gains occurred in children’s development after two years of participating in the Scholarship Program and attending a high-quality ECE program?
– Did children who participated in the Scholarship Program enter kindergarten better prepared to be successful in school?
– Did more children experience improved development, competencies, and skills in dimensions identified by the National Education Goals Panel (NEGP) and how did their outcomes compare with outcomes for a comparison group of kindergarten children? These school readiness dimensions include the following:
7 These questions also provide initial data on the Short-Term Outcomes components of the logic model (e.g., children
participating in high-quality programs, improved program quality, and increased supply of high-quality programs). 8 This report does not include information on the parent mentoring. All findings related to parent mentoring were included in
the Year 2 Annual Report. Refer to Parent Mentoring report on www.co.ramsey.mn.us/ph
20
o Health and physical development
o Emotional well-being and social competence
o Approaches to learning
o Communication skills (including vocabulary)
o Cognition and general knowledge (including early literacy and math)
In addition, this report summarizes data from the RAND Cost Study and SRI’s ECE Program Survey, two studies that were conducted in 2010. These studies answered the following questions:
What were the costs associated with providing a high-quality early education experience to young children?
How did the programs that were receiving scholarship funds use the funds?
Four earlier implementation reports in September 2008, September 2009, September 2010 and September 2011 are available on the MELF website (www.melf.us). Through site visit interviews with the scholarship implementation team and key stakeholders as well as focus groups with parents, we described in the previous reports the successes and challenges of the Scholarship Program implementation during the first four years. This report summarizes information previously reported about the following process evaluation questions:
How did the market forces component of the scholarship logic model work?
How did scholarship-eligible families choose ECE programs for their children? Were parents using Parent Aware to inform their decisionmaking in selecting an ECE program for their child?
Sources of Data
The evaluation design included collection of data from multiple sources.
Monthly exports. Resources for Child Caring (RCC) sent monthly or quarterly exports of the status of all children deemed eligible and with consent to participate in the evaluation. The exports included data from the application form and information about the selected ECE program, the ECE start dates, and the child’s ECE program attendance.
Parent phone interview. Parents of children participating in the Scholarship Program were interviewed in Fall 2008, Fall 2009, and Fall 2010. For this report, we used only the baseline interview completed by parents to provide information about the background of children, parents, and families prior to their participation in the Scholarship Program.9
Direct assessments and teacher completed checklists. Children were assessed at their selected ECE programs either in the fall of 2008 (when Cohort 2 children were 3 years old) or the fall of 2009 (when Cohort 3 children were 3 years old). These data provide a baseline for children’s development prior to enrolling in a high-quality ECE program. Children were then assessed one year later at their ECE program (fall of 2009 for Cohort 2 and fall of 2010 for Cohort 3), and these data provided an assessment of children’s developmental progress following one year of enrollment in a high-quality
9 That is, for some children (Cohort 2), data from 2008 were baseline data, while for others (Cohort 3) data from 2009 were
baseline data.
21
ECE program. Finally, children were assessed two years later when they were in kindergarten (fall of 2010 for Cohort 2 and fall of 2011 for Cohort 3). In addition to assessments of scholarship children, a comparison group of kindergarten children were assessed in fall of 2010 and fall of 2011 using the same battery of assessments.
NACCRRAware. Data were also collected from NACCRRAware, a web-based public-use dataset available from the National Association of Child Care Resource and Referral Agencies that provided information about ECE programs and from the Parent Aware rating website10 that documented the changes in program quality and participation in the pilot areas over time.
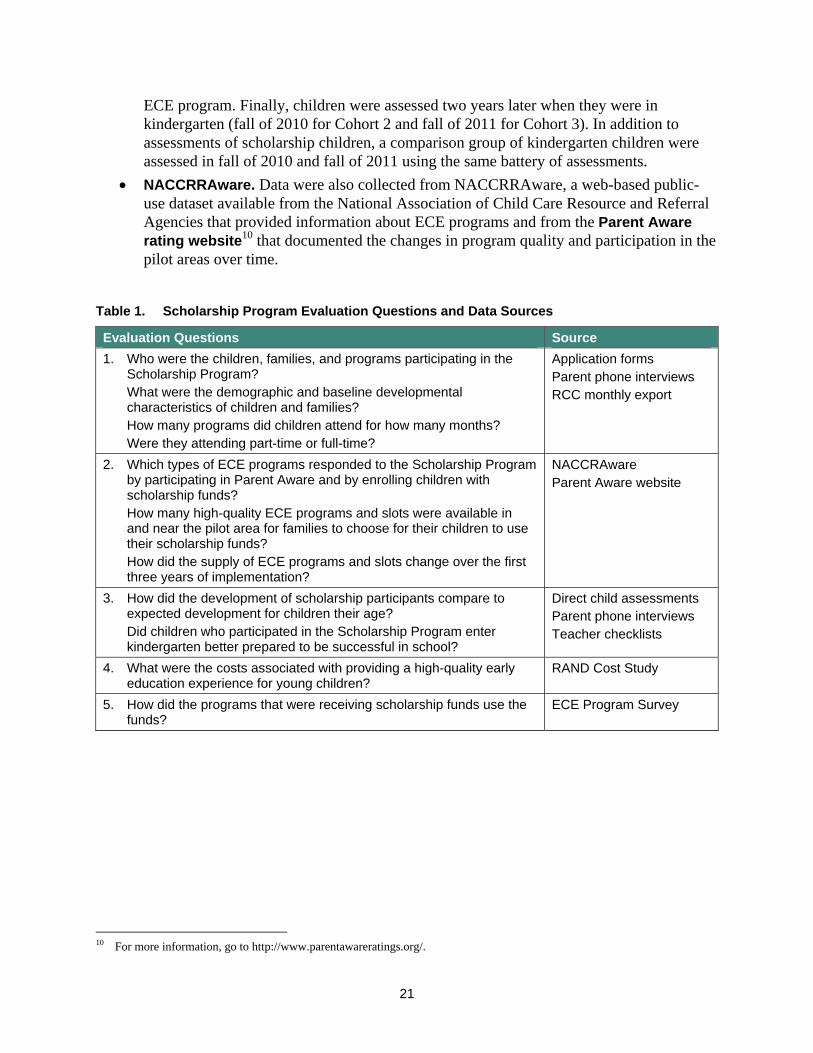
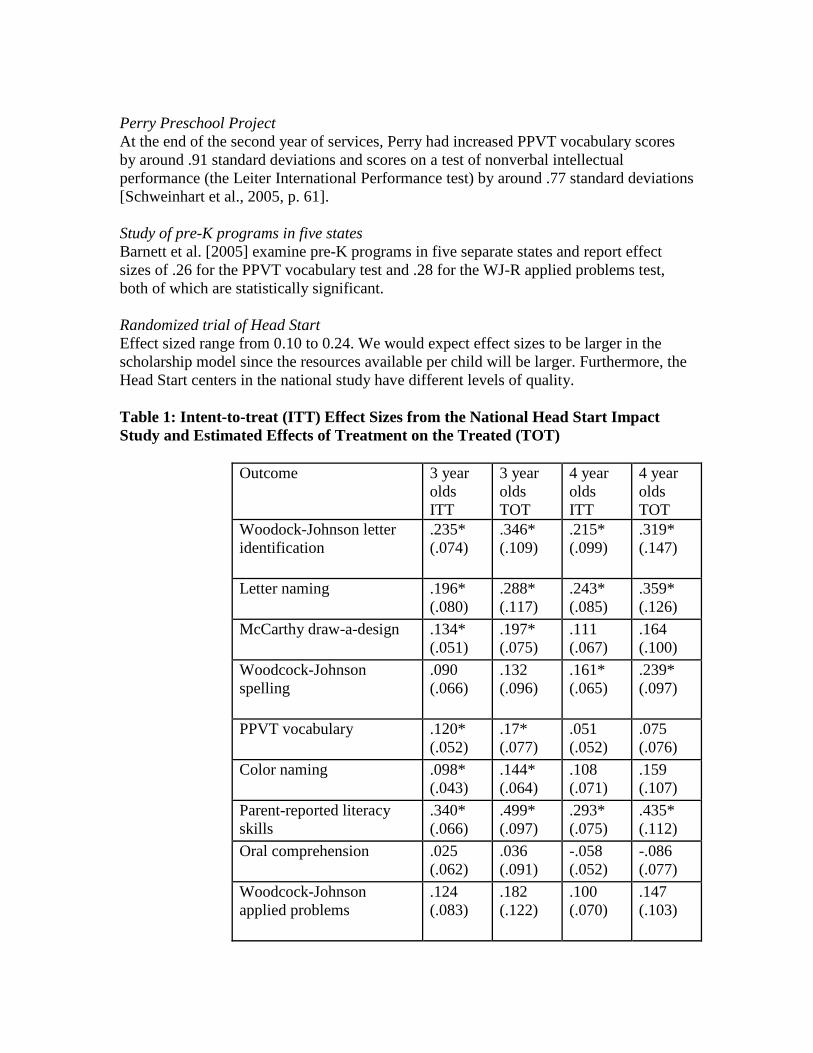
Table 1. Scholarship Program Evaluation Questions and Data Sources
Evaluation Questions Source
1. Who were the children, families, and programs participating in the Scholarship Program? What were the demographic and baseline developmental characteristics of children and families? How many programs did children attend for how many months? Were they attending part-time or full-time?
Application forms Parent phone interviews RCC monthly export
2. Which types of ECE programs responded to the Scholarship Program by participating in Parent Aware and by enrolling children with scholarship funds? How many high-quality ECE programs and slots were available in and near the pilot area for families to choose for their children to use their scholarship funds? How did the supply of ECE programs and slots change over the first three years of implementation?
NACCRAware Parent Aware website
3. How did the development of scholarship participants compare to expected development for children their age? Did children who participated in the Scholarship Program enter kindergarten better prepared to be successful in school?
Direct child assessments Parent phone interviews Teacher checklists
4. What were the costs associated with providing a high-quality early education experience for young children?
RAND Cost Study
5. How did the programs that were receiving scholarship funds use the funds?
ECE Program Survey
10 For more information, go to http://www.parentawareratings.org/.
22
Findings: Participation of Children and Families
in the Scholarship Program
Number of Participants in Scholarship Program
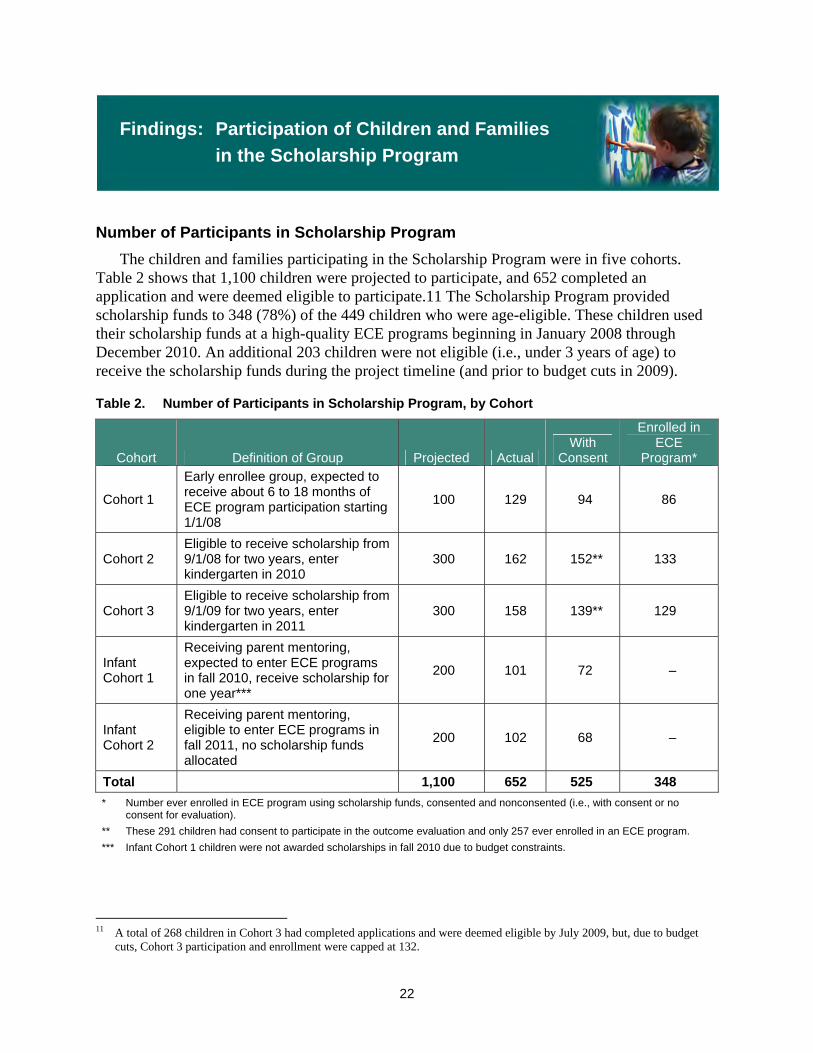
The children and families participating in the Scholarship Program were in five cohorts. Table 2 shows that 1,100 children were projected to participate, and 652 completed an application and were deemed eligible to participate.11 The Scholarship Program provided scholarship funds to 348 (78%) of the 449 children who were age-eligible. These children used their scholarship funds at a high-quality ECE programs beginning in January 2008 through December 2010. An additional 203 children were not eligible (i.e., under 3 years of age) to receive the scholarship funds during the project timeline (and prior to budget cuts in 2009).
Table 2. Number of Participants in Scholarship Program, by Cohort
Cohort Definition of Group Projected Actual With
Consent
Enrolled in ECE
Program*
Cohort 1
Early enrollee group, expected to receive about 6 to 18 months of ECE program participation starting 1/1/08
100 129 94 86
Cohort 2 Eligible to receive scholarship from 9/1/08 for two years, enter kindergarten in 2010
300 162 152** 133
Cohort 3 Eligible to receive scholarship from 9/1/09 for two years, enter kindergarten in 2011
300 158 139** 129
Infant Cohort 1
Receiving parent mentoring, expected to enter ECE programs in fall 2010, receive scholarship for one year***
200 101 72 –
Infant Cohort 2
Receiving parent mentoring, eligible to enter ECE programs in fall 2011, no scholarship funds allocated
200 102 68 –
Total 1,100 652 525 348
* Number ever enrolled in ECE program using scholarship funds, consented and nonconsented (i.e., with consent or no consent for evaluation).
** These 291 children had consent to participate in the outcome evaluation and only 257 ever enrolled in an ECE program.
*** Infant Cohort 1 children were not awarded scholarships in fall 2010 due to budget constraints.
11 A total of 268 children in Cohort 3 had completed applications and were deemed eligible by July 2009, but, due to budget
cuts, Cohort 3 participation and enrollment were capped at 132.
23
Thus, three groups (Cohort 1 and the two infant cohorts) were not included in the evaluation. There are 129 children in Cohort 1 who were eligible for a scholarship beginning on January 1, 2008. These children were considered the ramp-up cohort and could have received between 6 and 18 months of high-quality ECE program exposure depending on when the family found a program to enroll their children in and when the children could enroll. At the close of the Cohort 1 enrollment period (September 2009), 86 of these children had enrolled in a Parent Aware-rated ECE program using their scholarship funds at some time during this period (January 2008 to September 2009). Cohort 1 is not included in the outcome evaluation. The 203 children who met eligibility requirements as part of the infant cohorts had approved applications to receive parent mentoring and children in Infant Cohort 1 were set to receive scholarships in 2010 but did not due to budget constraints (N = 101). Infant Cohort 2 (N = 102) was only eligible to receive parent mentoring because the children would not have been old enough to receive a scholarship during the pilot project. Detailed outcome data are not collected for these cohorts of children either. Children in Infant Cohort 1 did not receive scholarships due to the budget cuts.
Throughout the remainder of this report, data are presented for Cohorts 2 and 3 only because the children in these groups can participate in the outcome evaluation and were expected to have the most in-depth data, including school readiness and kindergarten outcomes, by 2011. Children in Cohorts 2 and 3 were considered fully participating in the scholarship if they were enrolled in an ECE program using their scholarship funds between January 2008 and December 2010.
Cohort 2. There were 162 children eligible for a scholarship to enroll in programs beginning September 1, 2008. These children are considered the first group to receive the maximum scholarship to enable them to attend two full years of a high-quality ECE program before entering kindergarten in 2010. The majority (133, 82%) of these children enrolled in a Parent Aware-rated ECE program using their scholarship funds. Nearly all of these families (130 of 133, 98%) consented to participate in the evaluation, and detailed outcome and demographic data were collected for Cohort 2 children beginning in fall 2008.
Cohort 3. There were 158 children eligible to enroll in an ECE program using their scholarship funds beginning September 1, 2009; they also had the potential to receive the maximum scholarship and ECE program attendance (i.e., two years) and entered kindergarten in fall 2011. The majority (129, 82%) of these children enrolled in a Parent Aware-rated ECE program. Most of the participants (127 of 129, 98%) consented to participate in the evaluation and detailed outcome and demographic data were collected for Cohort 3 children beginning in fall 2009.
Figure 2 shows the participation of children in Cohorts 2 and 3.
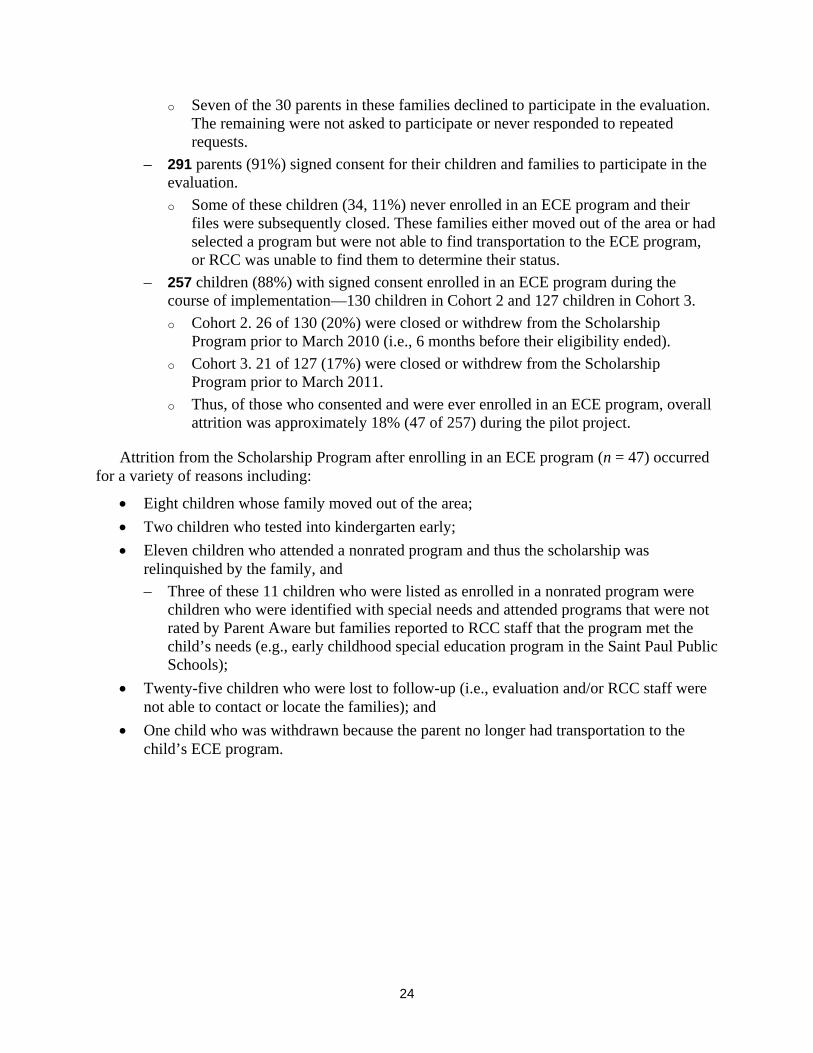
In Cohorts 2 and 3, 320 applications for scholarship funds were deemed eligible.12
Of the 320 eligible:
– 30 families (9%) did not have signed consent to participate in the evaluation.
12 Data were provided in monthly or quarterly reports from Resources for Child Caring (RCC). These data reflect the data
exported to SRI in September 2010.
24
o Seven of the 30 parents in these families declined to participate in the evaluation. The remaining were not asked to participate or never responded to repeated requests.
– 291 parents (91%) signed consent for their children and families to participate in the evaluation.
o Some of these children (34, 11%) never enrolled in an ECE program and their files were subsequently closed. These families either moved out of the area or had selected a program but were not able to find transportation to the ECE program, or RCC was unable to find them to determine their status.
– 257 children (88%) with signed consent enrolled in an ECE program during the course of implementation—130 children in Cohort 2 and 127 children in Cohort 3.
o Cohort 2. 26 of 130 (20%) were closed or withdrew from the Scholarship Program prior to March 2010 (i.e., 6 months before their eligibility ended).
o Cohort 3. 21 of 127 (17%) were closed or withdrew from the Scholarship Program prior to March 2011.
o Thus, of those who consented and were ever enrolled in an ECE program, overall attrition was approximately 18% (47 of 257) during the pilot project.
Attrition from the Scholarship Program after enrolling in an ECE program (n = 47) occurred for a variety of reasons including:
Eight children whose family moved out of the area;
Two children who tested into kindergarten early;
Eleven children who attended a nonrated program and thus the scholarship was relinquished by the family, and
– Three of these 11 children who were listed as enrolled in a nonrated program were children who were identified with special needs and attended programs that were not rated by Parent Aware but families reported to RCC staff that the program met the child’s needs (e.g., early childhood special education program in the Saint Paul Public Schools);
Twenty-five children who were lost to follow-up (i.e., evaluation and/or RCC staff were not able to contact or locate the families); and
One child who was withdrawn because the parent no longer had transportation to the child’s ECE program.
25
Figure 2. Number of Children in Cohorts 2 and 3 Participating in the Scholarship Program and Evaluation
* Dropping out early was defined as before March 1, 2010, for Cohort 2 and before March 1, 2011 for Cohort 3 participants.
n = 257Ever enrolled inan ECE program
n = 34Closed or withdrawn
Never in an ECE program
n = 291With signed consent
n = 29With no signed consent
N = 320
With approved applications/eligible
n = 1Parent unable
to transport child
n = 2Tested into
kindergarten early
n = 25Unknown or
unable to locate
n = 8Moved outof the area
n = 11Attended a
nonrated program
n = 210Did not drop out early*
n = 117Cohort 3
n = 104Cohort 2
26
Enrollment of Children and Families in Cohorts 2 and 3 in the Scholarship Program
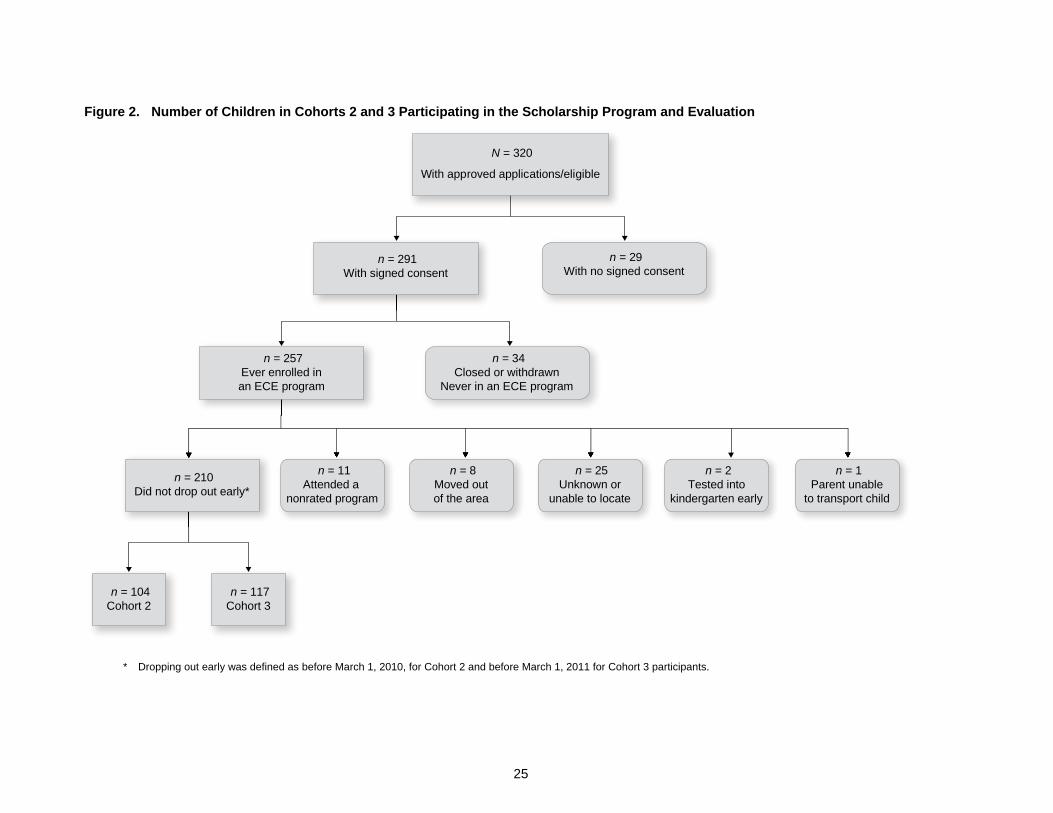
Data from the application forms for the children in Cohorts 2 and 3 indicate that families learned about or were referred to the Scholarship Program from a variety of sources (Figure 3). These children were defined as participating in the evaluation if their parents had signed an informed consent and they were ever enrolled in an ECE program using their scholarship funds (N = 257).
More than half of the families (57%) reported that they learned about the Scholarship Program from entities that receive payment from the Scholarship Program, including the Parent Mentor agencies (36%), Head Start (9%), schools (2%), and other early childhood education programs (10%).
More than one-eighth of the families (13%) learned about the Scholarship Program from community agencies (4%) or other community sources, including Resources for Child Caring (the local child care referral agency), word of mouth, mailings from the mayor’s office, or newspaper ads, and other community advertisements (9%).
For about one-fifth of the families (22%), the referral source was not reported on the application.
Figure 3. Sources of Referral to the Saint Paul Early Childhood Scholarship Program, Participating Families with Signed Consent (N = 257)
* Includes RCC, word of mouth, mailings from the mayor’s office, newspaper ads, and other community advertisements.
Source: Application forms.
36
9
9
4
10
2
9
22
Parent Mentor agencies(n = 92)
Head Start(n = 24)
Parish nurse(n = 23)
County/communityagencies(n = 10)
Early childhoodeducation programs
(n = 25)
Schools(n = 5)
Other*(n = 22)
Missing(n = 56)
Percent
0 10 20 30 40 50
27
Enrollment of Children in Cohorts 2 and 3 in High-Quality ECE Programs
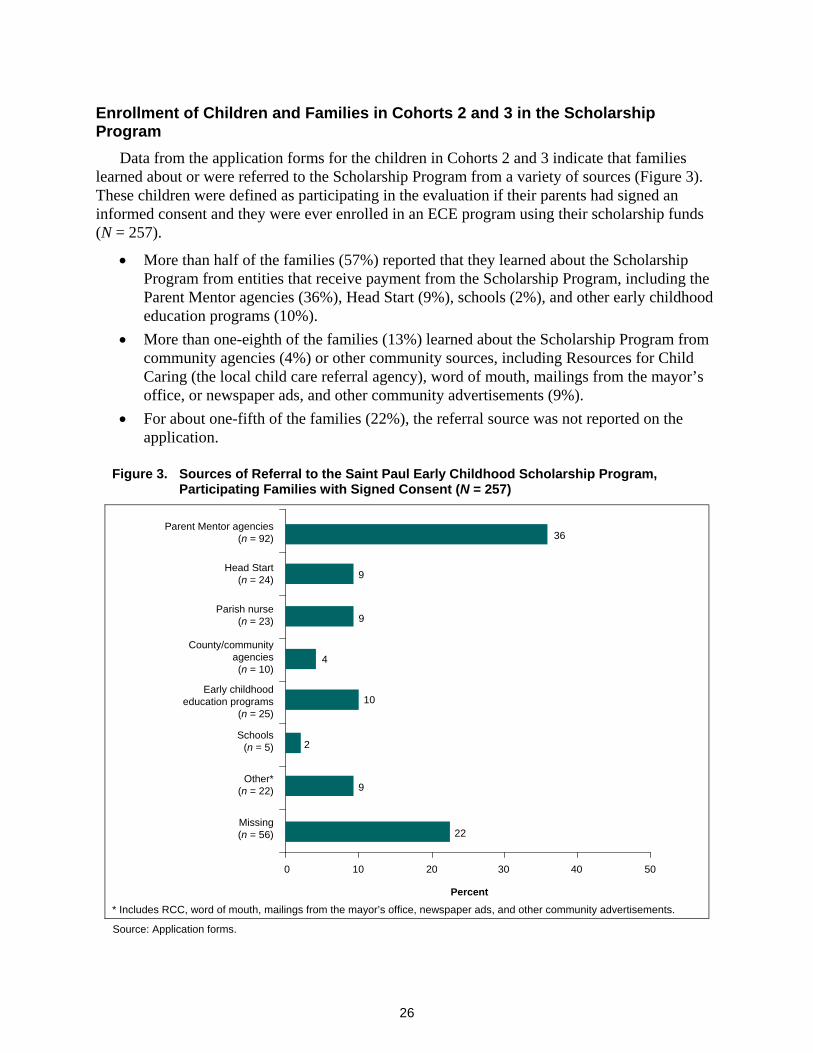
Figure 4 shows when children began to attend ECE programs using their scholarship funds.
By the end of 2009, all of the 257 scholarship-eligible children in Cohorts 2 and 3 with consent had enrolled in an ECE program.
– More than three-fourths of Cohort 2 children (106 of 130, 82%) enrolled by the end of 2008.
– Nearly all of the Cohort 3 children (123 of 127, 98%) had enrolled between July 1 and September 30, 2009.
Figure 4. Start Dates of Early Childhood Education Program Participation Using Scholarship Funds, Cohorts 2 and 3, Families with Signed Consent (N = 257)
Source: Application forms.
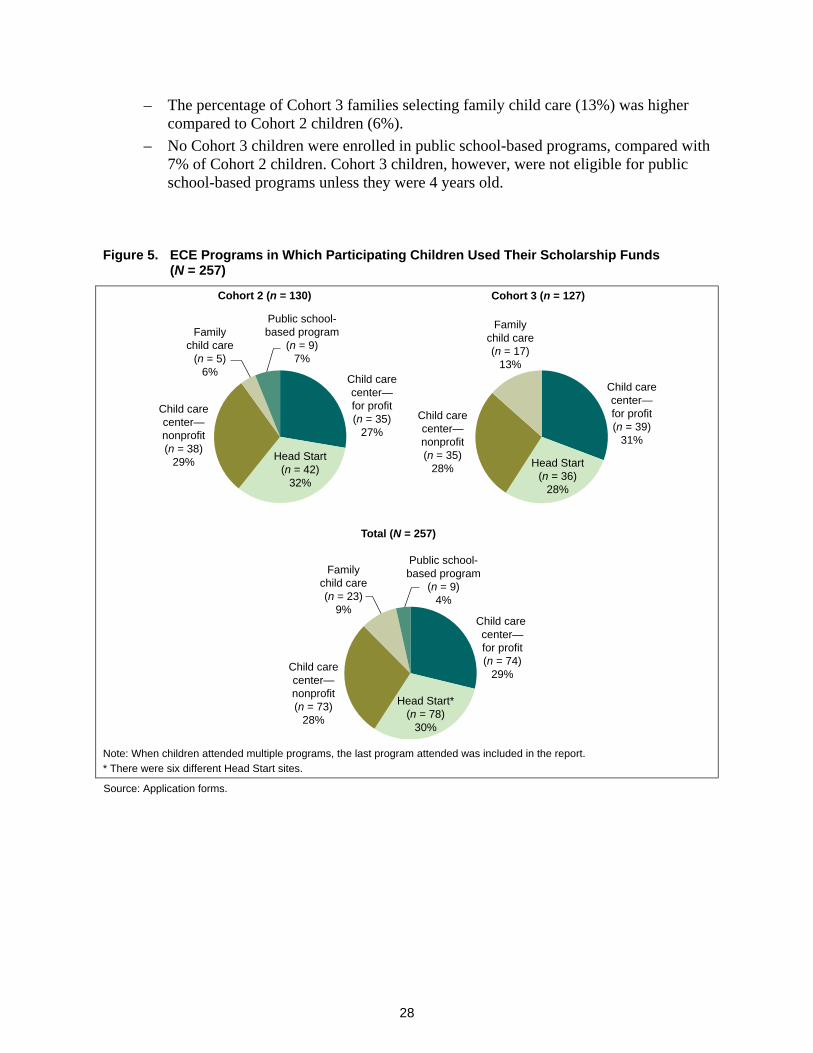
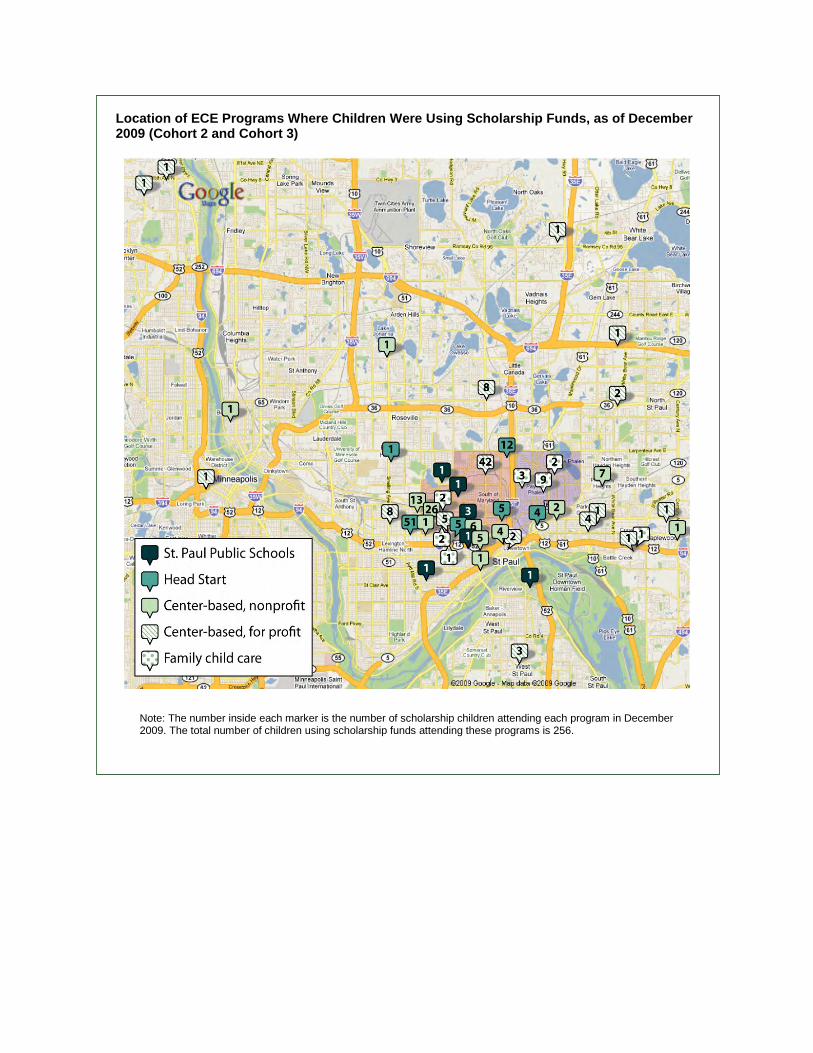
As reported in previous reports, the children in Cohorts 2 and 3 who had enrolled in an ECE program by December 2009 (N = 257) were attending a variety of types of programs (Figure 5).
Overall, center-based programs (for-profit, Head Start, and nonprofit), enrolled similar percentages of children (29%, 30%, and 28%, respectively), while family child care and public school-based programs attracted fewer children (9% and 4%).
There were some differences between the types of programs chosen by Cohort 2 and Cohort 3 families.
– Head Start was the program most often chosen by Cohort 2 families (32%), followed closely by nonprofit center-based programs (29%), and for-profit center-based programs (27%). Cohort 3 families most often chose for-profit center-based programs (31%), followed by Head Start (28%) and nonprofit center-based programs (28%).
1
27
13
54
49
<1
Per
cen
t
60
50
40
30
20
10
0(Apr 1 to
Jun 30, 2008)(n = 3)
(Jul 1 toSept 30, 2008)
(n = 70)
(Oct 1 toDec 31, 2008)
(n = 33)
(Jan 1 toMar 31, 2009)
(n = 14)
(Apr 1 toJun 30, 2009)
(n = 9)
(Jul 1 toSept 30, 2009)
(n = 127)
(Oct 1 toDec 31, 2009)
(n = 1)
Cohort 2 Cohort 3
28
– The percentage of Cohort 3 families selecting family child care (13%) was higher compared to Cohort 2 children (6%).
– No Cohort 3 children were enrolled in public school-based programs, compared with 7% of Cohort 2 children. Cohort 3 children, however, were not eligible for public school-based programs unless they were 4 years old.
Figure 5. ECE Programs in Which Participating Children Used Their Scholarship Funds (N = 257)
Note: When children attended multiple programs, the last program attended was included in the report.
* There were six different Head Start sites.
Source: Application forms.
Child carecenter—for profit(n = 35)
27%
Child carecenter—nonprofit(n = 38)
29%
Public school-based program
(n = 9)7%
Familychild care
(n = 5)6%
Cohort 2 (n = 130)
Head Start(n = 42)
32%
Child carecenter—for profit(n = 39)
31%
Familychild care(n = 17)
13%
Cohort 3 (n = 127)
Head Start(n = 36)
28%
Child carecenter—nonprofit(n = 35)
28%
Child carecenter—for profit(n = 74)
29%
Public school-based program
(n = 9)4%
Familychild care(n = 23)
9%
Total (N = 257)
Child carecenter—nonprofit(n = 73)
28%
Head Start*(n = 78)
30%
29
Attendance of Children in High-Quality ECE Programs
For the final report, we also examined the mobility, attendance, and absences of scholarship children. ECE programs reported these data to RCC to document children’s enrollment and for programs to receive payment. We included both cohorts of children in this report. Because children and families’ circumstances and needs changed over time, we wanted to examine how many children were enrolled in one or more programs and the range of time children were enrolled in their programs of choice during the two years that children were expected to be enrolled (September 2008 to September 2010 for Cohort 2 and September 2009 to September 2011 for Cohort 3).
Information below reflects the 254 children in both cohorts with available attendance data. Three of the 257 children were enrolled in a nonrated program and the programs were not required to report attendance data. Cohort 3 was implemented in a more mature pilot, and we think that meant children were enrolled more quickly and stayed in the programs for a longer duration on average. However, overall, Cohorts 2 and 3 were similar on these measures of attendance.
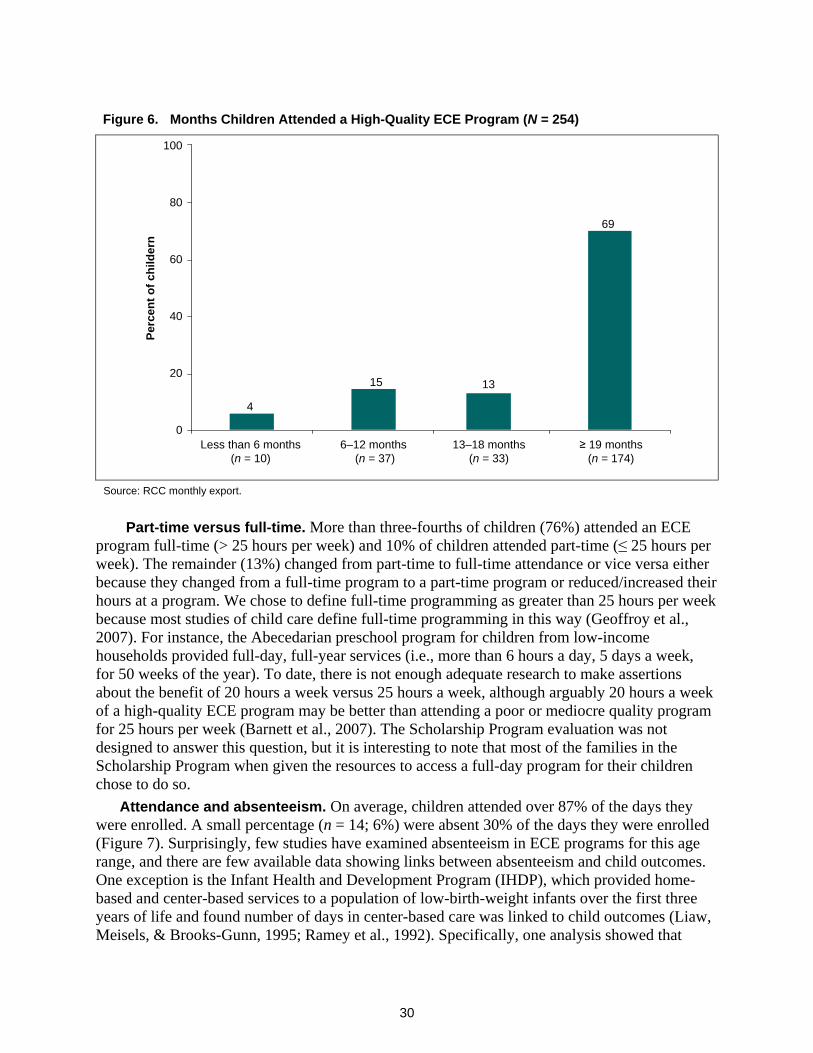
Mobility and length of participation. Three-fourths of children (n = 190, 75%) attended one program and about one-fourth (n = 64, 25%) attended two or three programs during the two-year period. On average, children attended a high-quality ECE program using their scholarship funds for 21 months, ranging from less than 6 months (n = 10, 4%) to more than 18 months (n = 174, 69%) (Figure 6). While there is a debate among early childhood researchers about whether one year or two years of a high-quality program is needed for improving school readiness outcomes, the only ECE programs demonstrating permanent gains in children’s cognitive development are those where children attend for a sustained period of time (Barnett, 1998; NICHD & Duncan, 2003; NICHD & ECCRN, 2003; Reynolds, 1995; Skibbe, Connor, Morrison, & Jewkes, 2011).
30
Figure 6. Months Children Attended a High-Quality ECE Program (N = 254)
Source: RCC monthly export.
Part-time versus full-time. More than three-fourths of children (76%) attended an ECE program full-time (> 25 hours per week) and 10% of children attended part-time (≤ 25 hours per week). The remainder (13%) changed from part-time to full-time attendance or vice versa either because they changed from a full-time program to a part-time program or reduced/increased their hours at a program. We chose to define full-time programming as greater than 25 hours per week because most studies of child care define full-time programming in this way (Geoffroy et al., 2007). For instance, the Abecedarian preschool program for children from low-income households provided full-day, full-year services (i.e., more than 6 hours a day, 5 days a week, for 50 weeks of the year). To date, there is not enough adequate research to make assertions about the benefit of 20 hours a week versus 25 hours a week, although arguably 20 hours a week of a high-quality ECE program may be better than attending a poor or mediocre quality program for 25 hours per week (Barnett et al., 2007). The Scholarship Program evaluation was not designed to answer this question, but it is interesting to note that most of the families in the Scholarship Program when given the resources to access a full-day program for their children chose to do so.
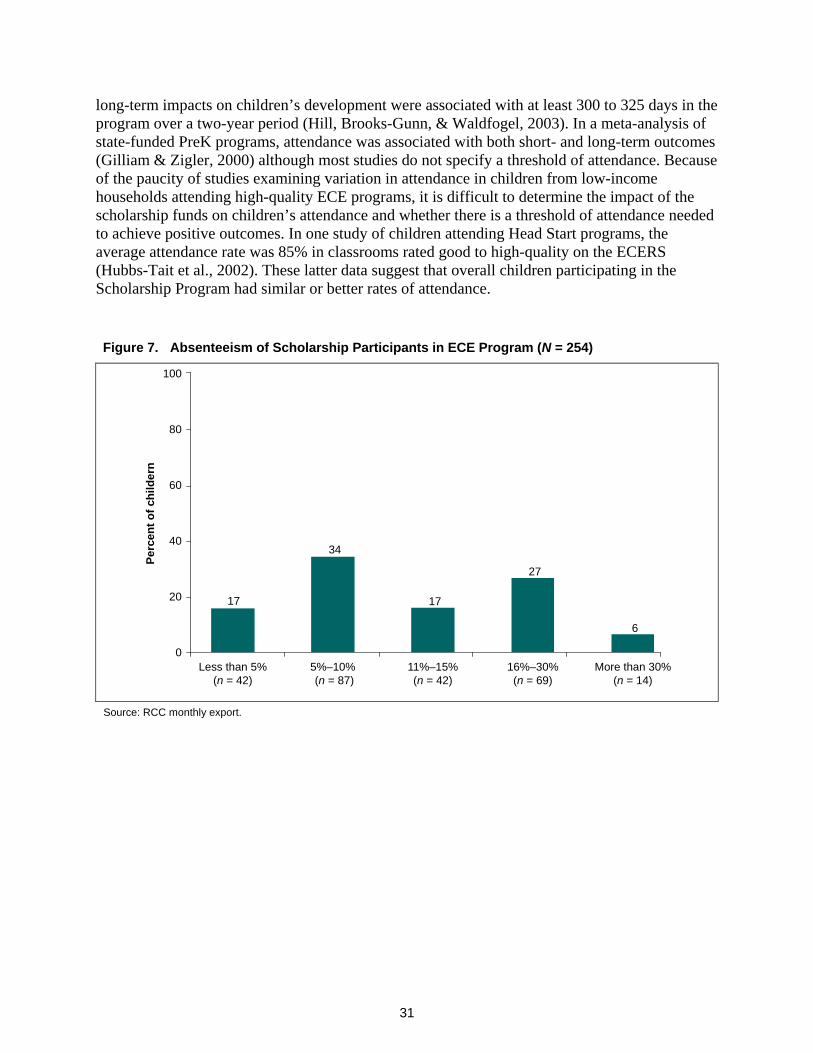
Attendance and absenteeism. On average, children attended over 87% of the days they were enrolled. A small percentage (n = 14; 6%) were absent 30% of the days they were enrolled (Figure 7). Surprisingly, few studies have examined absenteeism in ECE programs for this age range, and there are few available data showing links between absenteeism and child outcomes. One exception is the Infant Health and Development Program (IHDP), which provided home-based and center-based services to a population of low-birth-weight infants over the first three years of life and found number of days in center-based care was linked to child outcomes (Liaw, Meisels, & Brooks-Gunn, 1995; Ramey et al., 1992). Specifically, one analysis showed that
4
15 13
69
Per
cen
to
fch
ilder
n100
80
60
40
20
0Less than 6 months
(n = 10)6–12 months
(n = 37)13–18 months
(n = 33)≥ 19 months
(n = 174)
31
long-term impacts on children’s development were associated with at least 300 to 325 days in the program over a two-year period (Hill, Brooks-Gunn, & Waldfogel, 2003). In a meta-analysis of state-funded PreK programs, attendance was associated with both short- and long-term outcomes (Gilliam & Zigler, 2000) although most studies do not specify a threshold of attendance. Because of the paucity of studies examining variation in attendance in children from low-income households attending high-quality ECE programs, it is difficult to determine the impact of the scholarship funds on children’s attendance and whether there is a threshold of attendance needed to achieve positive outcomes. In one study of children attending Head Start programs, the average attendance rate was 85% in classrooms rated good to high-quality on the ECERS (Hubbs-Tait et al., 2002). These latter data suggest that overall children participating in the Scholarship Program had similar or better rates of attendance.
Figure 7. Absenteeism of Scholarship Participants in ECE Program (N = 254)
Source: RCC monthly export.
17
Per
cen
to
fch
ild
ern
100
80
60
40
20
0Less than 5%
(n = 42)5%–10%(n = 87)
11%–15%(n = 42)
16%–30%(n = 69)
More than 30%(n = 14)
17
34
27
6
32
Findings: Characteristics of Participating Children and Families
Characteristics of Children and Families
Table 3 shows the demographic characteristics of children and families enrolled in the Saint Paul Early Childhood Scholarship Program for the entire sample, (e.g., in Cohorts 2 and 3 combined). These data show the following:
A little over half of the families reported that their primary home language was English (56%), with Karen (13%) and Hmong (9%) being the next most common home languages.
Ethnicity was not reported on the application forms for nearly half of the families (49%), but for those reporting, the majority of the families were African-American (21%) or Asian (18%).
Nearly three-fourths of families (72%) had household incomes below 100% federal poverty guidelines (FPG) (e.g., below $22,000 for a family of 4 in 2008), although eligibility for the program was up to 185% of the FPG (e.g., up to $40,000 for a family of 4 in 2008).
Other data from the application forms and RCC participation data indicated the following:
Across all cohorts, nearly two-thirds of the families (64%) have one child participating in the Scholarship Program, more than one-quarter (28%) have two children participating, and about 7% have three or more children participating.
33
Table 3. Demographic Characteristics of Children and Families Enrolled in the Saint Paul Early Childhood Scholarship Program, with Consent in Cohorts 2 and 3 (N = 257)
Cohort 2 (n = 130)
Cohort 3 (n = 127)
Total (N = 257)
n (%)
Final Status
Total sample 130 (51) 127 (49) 257 (100)
Primary home language
English 77 (59) 67 (53) 144 (56)
Spanish 7 (5) 10 (8) 17 (7)
Hmong 13 (10) 9 (7) 22 (9)
Somali 2 (2) 2 (2) 4 (2)
Karen 16 (12) 17 (13) 33 (13)
Other 8 (7) 7 (6) 15 (6)
Missing 7 (5) 15 (12) 22 (9)
Ethnicity
African-American 39 (30) 14 (11) 53 (21)
Asian 29 (22) 17 (13) 46 (18)
Latino 7 (5) 5 (4) 12 (5)
White 7 (5) 2 (2) 9 (4)
Other 11 (8) 1 (<1) 12 (5)
Missing 37 (28) 88 (69) 125 (49)
Gender
Male 65 (50) 65 (52) 130 (51)
Female 65 (50) 61 (48) 126 (49)
Household Income
100–185% FPG 39 (30) 34 (27) 73 (28)
< 100% FPG 91 (70) 93 (73) 184 (72)
Source: Application forms.
Families of the children in Cohorts 2 and 3 resided in six zip codes in districts 5, 6, and 7 in
Saint Paul (Figure 8). The main difference between cohorts was that eligibility was expanded beginning in September 2009 to include families who live in district 5 or Payne-Phalen (i.e., which includes the 55106 zip code area). Thus, Cohort 3 included some children from this area of Saint Paul.
34
Figure 8. Home Zip Code for Families of Children Participating in the Saint Paul Early Childhood Scholarship Program, Cohorts 2 and 3 (N = 257)
Source: Application forms.
Many of the families in Cohorts 2 and 3 were receiving one or two forms of public assistance at the time the family completed the application to participate in the Scholarship Program (Figure 9).
About half of families (51%) were receiving financial assistance from either the Minnesota Family Investment Program (MFIP), the Child Care Assistance Program (CCAP), or from both programs.
– Almost half of the families (48%) were receiving financial assistance from MFIP (MFIP and MFIP plus CCAP).
– Almost one-fifth (17%) were receiving assistance from CCAP (CCAP and MFIP plus CCAP).
– One seventh (14%) of the families were receiving assistance from both assistance programs (MFIP and CCAP).
– Families in Cohort 3 were less likely to report MFIP only compared to Cohort 2 and more likely to report no assistance.
55117(n = 74)
57%55104
(n = 32)25%
55103(n = 18)
14%
55130(n = 5)
4%
55113(n = 1)<1%
Cohort 2 (n = 130)
55117(n = 141)
55%55104(n = 48)
19%
55103(n = 32)
13%
55130(n = 23)
9%
55106(n = 11)
4%
55113(n = 2)
1%
Total (N = 257)
55117(n = 67)
53%
55104(n = 16)
13%
55103(n = 14)
11%
55130(n = 18)
14%
55106(n = 11)
9%
55113(n = 1)<1%
Cohort 3 (n = 127)
35
Figure 9. Families’ Participation Rates in MFIP and CCAP Financial Assistance Programs, Cohorts 2 and 3, Families with Signed Consent (N = 257)
* MFIP = Minnesota Family Investment Program; CCAP = Child Care Assistance Program.
Source: Application forms.
Below we describe information from the parent phone interviews.13 Of the 257 children, 124 (48%) families completed the baseline phone interview. Data displayed below include only the families that completed the parent phone interview (n = 124, 48%). In these and subsequent data, Cohorts 2 and 3 are combined, except where indicated.14
13 Because we often did not have the final sample of participants in fall 2008 and fall 2009, SRI attempted to reach as many
families as possible even though some of the children in these families never enrolled in an ECE program. Thus, an additional 49 families from Cohorts 2 and 3 were interviewed, but did not participate in the Scholarship Program. In the annual report for Year 2, we reported on the 147 families interviewed at baseline regardless of participation. In this report, we report only parent phone interview data for the families whose children participated in the Scholarship Program.
14 Most of the interview respondents identified themselves as the biological mother (84%) or the biological father (11%). The respondents are identified interchangeably as parents or caregivers throughout the report.
Noassistance
(n = 55)44%
MFIPbeneficiary
(n = 54)42%
Both MFIP andCCAP beneficiary*
(n = 16)12%
CCAPbeneficiary
(n = 5)4%
Cohort 2 (n = 130)
Noassistance(n = 126)
49%
MFIPbeneficiary
(n = 87)34%
Both MFIP andCCAP beneficiary*
(n = 36)14%
CCAPbeneficiary
(n = 8)3%
Total (N = 257)
Noassistance
(n = 71)56%MFIP
beneficiary(n = 33)
26%
Both MFIP andCCAP beneficiary*
(n = 20)16%
CCAPbeneficiary
(n = 3)2%
Cohort 3 (n = 127)
36
Parents’ Perceptions of the Scholarship Program
In the interviews, parents were asked a series of questions about the process of completing the application for the Scholarship Program and enrolling their child in an ECE program.
Most of the parents (86%) felt the application form was easy or somewhat easy to complete.
Most of the parents (72%) reported that they completed the application by themselves and/or with their spouse or partner.
Of those parents who received help in completing the application form, 54% reported receiving help from a parent mentor or ECE program staff.
Selecting and enrolling the child in an ECE program was generally an easy process for families.
The majority of parents (86%) reported that the ECE program selected for their child was their first choice.
Most of the parents (87%) felt that it was easy or somewhat easy to find an ECE program for their child, but only 57% reported that they or their spouses or partners actually found the ECE program on their own.
– Of those parents who received help in finding an ECE program, 22% reported receiving help from preschool/ECE program staff, and 41% received help from a public health nurse, home visitor, or parent mentor.
– The majority (63%) of parents reported that they were able to find an ECE program in which to enroll their child in less than a month; about one-fourth (26%) reported 1 to 3 months to find a program.
– Once families found an ECE program, almost all of them (91%) reported that the process of enrolling their child in the program was easy or somewhat easy, with most (70%) reporting completing the process by themselves or with a spouse or partner. If they had help in enrolling, caregivers reported that parent mentors (34%) or ECE program staff (31%) helped them.
When asked where the child was being cared for prior to the Scholarship Program (Figure 10), the largest percentage (57%) described either care in the child’s home by a family member or friend (23%) or unlicensed care in another’s home (34%). Another 12% reported licensed family child care, 10% had a center-based program or preschool, and 7% attended Head Start.
37
Figure 10. Parents’ Report of Child’s Care Prior to Scholarship Program Enrollment (N = 122)
* Other included responses about the quality of child’s care without information about the type of care.
Source: Parent phone interviews.
Parents who completed the phone interview were asked several questions related to their experience in finding a program and participating in the Scholarship Program.
Parents heard about the ECE program they selected to use for the scholarship through a variety of ways.
– About one-fourth of parents (24%) learned about the program through relatives or friends, co-workers, and neighbors.
– Twelve percent heard about the ECE program through their parent mentor or home visitor.
– Thirteen percent knew of the program because the program provides care for another child in their family.
– Very few (3%) knew of the program through Parent Aware or its website, although some parents reported they learned about it through the Internet or advertisements (6%).
More than one-third of parents (34%) had heard of Parent Aware.
The main reasons parents reported selecting the ECE program are displayed in Figure 11. The most common reasons parents reported choosing the program were quality (34%) or location (i.e., the program was close to the family’s home) (27%).
– In comparison, only 21% of families in the 2009 statewide household child care survey (Chase & Valorose, 2010) chose their child’s primary child care arrangement because of quality. More than one-fifth (24%) of the parents in that sample chose the child care arrangement because of location and 20% chose for affordability.
Head Start(n = 8)
7%
Unlicensedfamily child care
(n = 41)34%
Licensed familychild care(n = 15)
12%
Center-based(n = 12)
10%
No care outsideof the home
(n = 28)23%
Other*(n = 18)
15%
38
Figure 11. Factors Parents Used to Select ECE Program for the Scholarship Funds (N = 117)
Source: Parent phone interviews.
Some family or child risk factors impact children’s learning, development, and school readiness (Figure 12).
The educational background of parents completing the phone interview ranged from less than a high school education to a bachelor’s degree and was evenly distributed across these categories. About one-third of the parents had less than a high school education (32%) and one-third (36%) had completed some additional vocational training or college following high school.
About two-fifths (42%) of the parents were married and living with a spouse at the time of the interview, and one-third (32%) were single and never married.
About two-fifths (42%) of the parents were working for pay at a job and approximately one-fifth (17%) were going to school.
Over half (54%) reported having an annual household income below $20,000.
Three-fourths (72%) of children see their father or father-figure on a daily basis.
High-quality program(n = 40)
Close to home(n = 32)
Other(n = 24)
Matched work schedule(n = 7)
Only option(n = 5)
Parent mentor told me(n = 4)
Affordability(n = 4)
Child has special needs(n = 1)
0 10 20 30 40
34
27
21
6
4
<1
3
3
Percent of parents
39
Figure 12. Demographic Characteristics at Baseline of Children and Families Participating in the Saint Paul Early Childhood Scholarship Program (N = 124)
* Some college indicates a two-year or less degree, or technical college.
** Other includes looking for work or unable to work because of disability.
Source: Parent phone interviews.
Working for payat a job(n = 50)
42%
At home fulltime (keeping house)
(n = 31)26%
Going toschool
(n = 20)17%
Other**(n = 19)
16%
Employment (n = 120)
Under$15,000(n = 49)
41%
$15,000 tounder $20,000
(n = 15)13%
$25,000 tounder $30,000
(n = 13)11%
$30,000 tounder $35,000
(n = 15)13%
Annual income (n = 119)
$35,000 or more(n = 12)
9%
$20,000 tounder $25,000
(n = 15)13%
Married,living withspouse(n = 51)
42%Single,
never married(n = 39)
32%
Single, livingwith partner
(n = 17)14%
Divorced/widowed(n = 11)
9%
Marital status (n = 121)
Married, separated(n = 3)
3%
Less thanhigh school
(n = 36)32%
Some college*(n = 42)
36%
High school graduateor GED(n = 29)
25%
Bachelor’s degree(n = 8)
7%
Maternal education (n = 115)
40
Other family or child risk factors are displayed in Figure 13 and show the following:
A small percentage of children (5%) were born to teen mothers, and a small percentage (8%) of children moved two or more times in the previous year.
Close to one-third of families feel their transportation and/or housing conditions were not meeting their needs. In particular, 35% of families reported their transportation was fair or poor.
Seven percent of caregivers rated their own overall health as fair or poor.
Figure 13. Characteristics of Families Participating in the Scholarship Program at Baseline (N = 124)
* Food insecurity is defined as sometimes or often does not have enough to eat.
Source: Parent phone interviews.
The pilot communities are considerably diverse and include a large number of new immigrant families and a variety of different immigrant groups from countries in east Africa (e.g., Sudan, Somalia, Ethiopia) and Burma/Myanmar. The application data displayed earlier showed that only 56% of households speak English at home. The parent interview also captured some of this diversity, including families’ immigrant status.
Compared to the total sample (N = 257), parents in the phone interview sample were more likely to speak English as the primary home language (68%). However, there were still 11% who spoke Karen, 7% who spoke Hmong, and 3% who spoke Spanish, among other languages. These interviews were conducted in the family’s home language when possible (i.e., Spanish, Hmong, or Karen).
5
8
28
35
10
7
Per
cent
Teen parent(n = 118)
Moved two ormore timesin last year(n = 119)
Housing isfair/poor(n = 117)
Transportationis fair/poor(n = 118)
Food insecurity *(n = 118)
Parental healthis fair/poor(n = 124)
40
35
30
25
20
15
10
5
0
41
One-third (30%) of the families who were interviewed considered themselves immigrants or from an immigrant group. However, only 7% of the children were born outside of the United States.
Some parents who completed the phone interview rated their English proficiency as fair or poor (27% for reading and writing skills, 24% for speaking skills).
The health of a child can also contribute to school readiness (Figure 14). Studies have shown that children learn better when they are healthy.
Fourteen percent of children were born at low birth weight,15 and 2% of children were rated by their caregivers as having fair or poor health.16
Four percent of children did not have any health insurance, and 2% did not have a regular health care provider. However, a much larger percentage (16%) did not have a regular place for health care.
Seven percent were reported to have a developmental delay as identified by a doctor.
In addition to these global indicators of health and health care access, 13% of parents reported the child had an illness or condition (e.g., asthma, chronic ear infections) that required regular, ongoing care, and 6% of the children were limited in their activities because of an impairment or health problem.
15 This percentage is nearly double what is typically found in national studies of the general population of young children. 16 This percentage is what is typically found in national surveys of young children.
42
Figure 14. Health Characteristics of Children Participating in the Scholarship Program at Baseline (N = 124)
Source: Parent phone interviews.
Caregivers were asked to describe any concerns they had about their children’s development, health, and behavior.
About one-third of parents (29%) reported that their child’s doctor had conducted a developmental assessment.
Seven percent of parents reported their child had a developmental delay that was identified by a doctor.
When asked if they had concerns about the child’s development, 27% of parents reported “a lot” of concern in at least one area of their children’s development (speech, vision, hearing, behavior, learning, etc.).
– Most of these parents (76%) reported concerns in multiple areas.
– Of the parents who reported “a lot” of concern in at least one area, many parents (70%) had shared their concern with a doctor, child care provider, or other professional. Nearly all of the parents who had shared their concern (96%) felt they received good help.
The neighborhoods and communities in which children and families live can also serve to put children’s development at risk or it can help protect children in a way that promotes school readiness. We asked parents to provide their perceptions of community support. The results in Figure 15 suggest that families are positive about their communities.
14
2
4
16
2
7
Pe
rce
nt
Low birth weight(n = 118)
Child healthrating of fair
or poor(n = 124)
Child with nohealth insurance
(n = 123)
No regularplace for healthcare (n = 124)
No regularhealth care
provider(n = 124)
Developmentaldelay
(n = 123)
20
15
10
5
0
43
Most parents felt a sense of belonging and acceptance in their communities (71%).
Most parents felt hopeful about their children’s future (89%).
However, only about half (57%) felt that their neighborhood had enough resources for children and that their neighborhood was a great place for young children to grow up and thrive (53%).
Figure 15. Parents’ Perceptions of Their Community Support at Baseline (N = 124)
Source: Parent phone interviews.
Families participating in the Scholarship Program have received a number of local, county, and state services including home visiting and parent education workshops and classes (Figure 16).
The most common benefit (81%) that families received was WIC (Special Supplemental Nutrition Program for Women, Infants, and Children).
Two-thirds of the families reported receiving any home visiting services (66%) or a free or reduced-price school lunch benefit (68%).
About half of parents (48%) reported receiving parent education or support, and about one-fourth (24%) reported using public housing assistance.
Feel neighborhoodis a great place foryoung children to
grow up andthrive (n = 117)
44
Figure 16. Families Participating in the Saint Paul Early Childhood Scholarship Program Who Reported Receiving Specific Services and Benefits at Baseline (N = 124)
Source: Parent phone interviews.
WIC(n = 120)
Home visiting (any)(n = 122)
Free or reduced-priceschool lunch
(n = 120)
Food stamps(n = 120)
Early education/parentingsupport (any)
(n = 123)
Medicaid/Medicare(n = 119)
Adult education/literacy classes
(n = 121)
Public housing(n = 120)
Section 8 housing(n = 115)
Social Security(n = 118)
Disability(other family member)
(n = 120)
Unemployment insurance(n = 119)
Disability (respondent)(n = 120)
Percent of parents
0 20 40 60 80 100
7
3
8
9
24
17
28
37
48
68
58
66
81
45
Findings: Baseline Data on Children’s Home Environment and Developmental Status From Parent Report
In this section, we describe information from parent phone interviews at baseline to provide more context about the participating children and families.
Sample of Children and Families
Table 4 shows the status of data collection begun in fall 2008 and continuing through 2011 for the parent phone interviews.
Of the 257 children, 124 (48%) families completed the baseline phone interview (i.e., fall of their first year of ECE program attendance). Unfortunately, less than 30% of families completed more than one follow-up interview. Thus, we do not feel the resulting data are representative of the families participating in the Scholarship Program and data from the follow-up interviews (i.e., one-year follow-up, kindergarten follow-up) are not included in this report.
Table 4. Baseline, One-Year Follow-Up, and Kindergarten Data Collection for Parent Interviews
Baseline One-Year Follow-Up Kindergarten
n (%)
Total 257 124 (48) 83 (32) 46 (18)
Cohort 2 130 68 (52) 42 (32) 28 (22)
Cohort 3 127 56 (44) 41 (32) 19 (15)
To put some of the baseline parent interview data in context, we compare the scholarship
data to a selected number of items in the Wilder Baseline Study (Wilder Research, 2008). The Wilder Baseline Study was conducted in 2007 and collected some of the same information from low-income families living in the Saint Paul pilot area that had children between 3 and 5 years old.
Home and Family Activities Promoting Early Literacy and School Readiness
Parenting practices and family activities that stimulate language and promote early literacy are essential to the success of an initiative like the Scholarship Program. Several of the items below (Figure 17 and Figure 18) are from the HOME Inventory, a well-validated, widely used measure with demonstrated sensitivity to key differences in home environments in terms of enriching activities related to child development and later academic achievement. The degree to which parents or family members read, tell stories, or sing to their children also impacts early development, and in particular, their language and literacy.
The data in Figure 17 through Figure 19 show that the majority of parents are engaging in activities and providing home environments that support the development of their children. For
46
example, Figure 17 shows that 71% of the parents reported their children had access to 10 or more books, 67% were regularly eating together as a family, and 44% visited a public library weekly or monthly in the last 12 months. When we compare these data to available data from the Wilder Baseline Study (Wilder Research, 2008), parents of children in the Scholarship Program were as likely to take their child to visit a public library as those in the baseline survey sample (45%).
Figure 18 shows that many parents are regularly reading to their children, singing songs, and talking with their children, activities that promote early literacy and language development. Parents in the scholarship sample at baseline were more likely to report these activities compared to the sample of families in the Wilder Baseline Study. For example, 45% of scholarship parents reported reading to their children every day compared to 38% in the Wilder sample. Scholarship parents also were more likely to talk or tell stories to their child every day (56% compared with 48%).
In addition, a large percentage of parents in the Scholarship Program reported working on skills and knowledge at home. Most parents reported working on number skills (97%), bringing home learning materials (93%), spending time working on creative activities (99%), and having a place for child’s books and school materials (99%).
Figure 17. Parents’ Report of Family Activities That Promote Early Literacy (N = 124)
Source: Parent phone interviews.
Weekly ormonthly(n = 54)
44%Never(n = 33)
27%
Once ortwice
(n = 21)17%
Several times(n = 15)
12%
Public library visit in last 12 months (n = 123)
Once ortwice
(n = 39)32%
Never, too young(n = 37)
30%
Severaltimes
(n = 29)24%
Weekly or monthly(n = 17)
14%
Museum visit in last 12 months (n = 122)
Daily(n = 59)
67%
Several timesper week(n = 24)
27%
Never(n = 3)
3%
Family meals (n = 88)
Monthly(n = 2)
2%
10 or more books(n = 87)
71%
3 to 9books
(n = 21)17%
1 or 2 books(n = 12)
10%
None, too young(n = 2)
2%
Number of books for child (n = 122)
47
Figure 18. Parents’ Report of Early Literacy Activities with Their Children (N = 124)
Source: Parent phone interviews.
Parent Involvement in Child’s ECE Program
Most parents reported that they engage in one or more activities with the ECE program to support their children’s learning and development (Figure 19).
About four-fifths of parents talk with their child’s teacher about behavior and accomplishments (80%), classroom rules and expectations (85%), and activities to practice at home (86%).
About one-third to half of parents sometimes or often volunteer in their child’s classroom (50%), go on class trips (53%), and participate in planning activities or trips (44%).
– A majority (85%) reported sharing stories about when the child was in school. This percentage may be lower than that for other activities because of cultural differences in the experience of many of the parents, either because of a lack of experience in the United States (32% did not complete high school) or attending school in a different country (30% reported being from an immigrant group).
Talk or tellstories to child
(n = 123)
Help child withalphabet(n = 124)
Sing songsto child
(n = 123)
Help childwith numbers
(n = 124)
Read to child(n = 124)
Help childwith colors
(n = 124)
Have child read alongand/or tell stories
(n = 123)
Help child withshapes/sizes
(n = 124)
Percent of parents
0 20 40 60 80 100
Some days (1-2 times per week)
Not at all
Every day
Most days (3-6 times per week)
56
53 26 16 5
49 23 20 8
43 35 19 3
45 35 17 3
42 36 16 7
33 29 29 8
29 28 28 15
17 21 6
48
Figure 19. Parents’ Report of Involvement in Their Child’s ECE Program (N = 124)
Source: Parent phone interviews.
We do not have comparison data for families with children in this age group (i.e., 3 to 4 years) but these data may reflect a high level of commitment by parents toward their children’s education and early learning. It may also reflect the fact that the programs were of high quality and had to have strategies in place that promoted family partnerships to receive a 3- or 4-star rating.
Often/Always Sometimes Never
Talk with teacher/child careprovider about child’s accomplishments
(n = 120)
Talk with teacher/child care providerabout how child gets along with his/her peers
(n = 119)
Talk with teacher/child care providerabout activities to practice at home
(n = 119)
Talk with teacher/child care providerabout classroom/child care rules
(n = 121)
Talk with teacher/child care providerabout child’s difficulties at school/program
(n = 120)
Talk with other parents about programor school meetings and events
(n = 121)
Go on class trips with child(n = 121)
Volunteer in child’sclassroom/program
(n = 122)
Participate in planning classroom/programactivities with the teacher/child care provider
(n = 121)
Participate in planningprogram or school trips
(n = 121)
61 19 20
56 27 18
22 31 47
11 33 56
13 31 56
15 35 50
19 43 38
48 30 23
54 31 16
57 27 16
Percent of parents
0 20 40 60 80 100
49
Parent Report of Selected Developmental Skills
According to parents, many of the children are showing proficiency at baseline with many important developmental skills (Figure 20 to Figure 22). Children at the time of the phone interview were on average 44 months old (ranging from 37 to 52 months for Cohort 2 baseline interviews and 38 to 49 months for Cohort 3 baseline interviews).
Children are expected to know most to all of their letters and to be starting to count when they enter kindergarten. At baseline, three-fifths (58%) of the children in the Scholarship Program were reported to know most or all of their letters, compared with those in the Wilder Baseline Study (44%). Nearly all of the children in the Scholarship Program (96%) were counting (Figure 20), compared with 83% of children in the Wilder Baseline Study.
With regard to gross and fine motor development, most children were walking without assistance (98%), catching large balls (96%), and tracing simple shapes (87%) (Figure 21).
About four-fifths of the children were reported to be using language to communicate simple facts (79%), ask questions (83%), and tell how old they were (81%) (Figure 21).
Figure 20. Key Child Development Indicators Important for School Readiness, for Scholarship Program Participants at Baseline (N = 124)
Source: Parent phone interviews.
None/Some
(n = 51)42%
All(n = 44)
36%
Most(n = 27)
22%
Child knows letters of the alphabet (n = 122)
Up toabout 10(n = 75)
60%
Up toabout 20(n = 32)
26%
Up to about50 or more
(n = 12)10%
Not at all(n = 5)
4%
Child can count (n = 124)
50
Figure 21. Key Child Development Indicators Important for School Readiness, for Scholarship Program Participants at Baseline (N = 124)
Source: Parent phone interviews.
Children’s social skills and approaches to learning are important aspects of school readiness (Figure 22).
Most parents reported that their children ask an adult for help (80%) and can share, take turns, and/or get along well with other children (78%).
Almost all of the parents reported their children use words to communicate (89%) and are curious and enthusiastic about learning new things (90%).
Fewer children in the Wilder Baseline Study sample were reported to be often or always asking an adult for help (64%), sharing or taking turns and getting along well with other children (69%). In addition, fewer children were reported to be using words to communicate regularly (80%) and to be curious and enthusiastic about learning new things (83%).
Walks downstairs without help(n = 123)
Catches a large, bounced ball withboth hands
(n = 123)
Names items in simple categories(e.g., animals, food)
(n = 122)
Traces at least two simple shapessuch as circle/square
(n = 119)
Tells which of two items isbigger/smaller
(n = 121)
Asks questions using “who,”“what,” and “where”
(n = 122)
Child tells how old he/sheis when asked
(n = 120)
Dresses without assistance(n = 123)
Tells what the weather is like(n = 120)
Tells one thing he/she did yesterday(n = 119)
Percent
0 20 40 60 80 100
79
81
81
81
83
85
87
90
96
98
51
Figure 22. Key Child Development Indicators Important for School Readiness, for Scholarship Program Participants at Baseline (N = 124)
Source: Parent phone interviews.
The data in this section show that parents of children receiving scholarships report strong
involvement in their children’s early learning. They also report good proficiency in many developmental skills in their children at age 3. Thus, the scholarship families may not represent or generalize to the most at-risk low-income families who may not be as involved and whose children may be developing less optimally.
0 20 40 60 80 100
Percent
Often/Always Sometimes Never
Child asks an adult for help when he or sheneeds help or has a problem with something
(n = 124)
Child takes turns, shares, and gets alongwell with other children
(n = 123)
Child is curious and enthusiastic aboutlearning new things
(n = 123)
Child uses words to communicate what he orshe needs, wants, or is thinking about
(n = 124)
80 17 3
89 9 2
90 10
78 20 2
52
Findings: Baseline and Outcome Data on Scholarship Children’s Language, Literacy, Early Math Skills, and Behavior
Baseline, One-Year, and Kindergarten Entry Child Assessment Outcome Data
The Scholarship Program logic model predicts that children in the pilot program community will make progress towards achieving age-expected school readiness skills, and that this progress will be possible because the scholarship leads to enrollment in high-quality ECE programs. The MELF Research Consortium developed a set of measures to assess school readiness. Children’s development was assessed with three different methods: parent-reported items in phone interviews (described at above at baseline on pages 48 to 50 and in Figure 20 to Figure 22), direct child assessments by trained observers, and teacher-reported measures of behavior and social skills. Parents’ reports of children’s development on key indicators of school readiness provide information about skills considered important for children to develop or be in the process of developing before they reach kindergarten. Unfortunately, we did not obtain an adequate response rate (i.e., less than 20% of families completed more than one interview) to examine changes in parent-reported developmental skills and abilities. Standardized, norm-referenced measures (i.e., the direct child assessments and teacher checklists) are helpful because they have well-documented reliability and validity and the resulting data can be used to compare participants to general populations of same-age peers. The set of measures together captures the five domains of school readiness identified by the National Education Goals Panel.17 Below we focus on the change on four of the five domains from baseline to the one-year follow-up and then to kindergarten entry in developmental trajectories as measured by standardized assessments.
Measures Used in Scholarship Evaluation
In order to examine the impact of participation in high-quality ECE programs on children’s school readiness, the standard measures are being used with the children participating in the Scholarship Program at three points in time: at baseline (shortly after they were initially enrolled in the ECE program, within 6 to 8 weeks of enrollment); one year later (referred to as the one-year follow-up), after ECE program attendance for one year and one year before enrolling in kindergarten; and finally, as they entered kindergarten (within 6 to 8 weeks of entry) after two years of ECE program participation.
Direct assessments of children using standardized tests of language and cognition were completed at the ECE programs by assessors hired and trained by the evaluation team.
Each child’s ECE teacher was asked to complete a checklist form containing two widely used measures of behavior.
Table 5 describes the measures used in the assessment protocol.
17 The five areas of school readiness are cognition and general knowledge, communicative skills, emotional well-being and
social competence, approaches to learning, and physical well-being and motor development.
53
Table 5. Child Outcomes Used in Scholarship Evaluation
Domain Measure Scale Measure Description
Language – Receptive Language – Expressive
Peabody Picture Vocabulary Test 4th edition (PPVT-4) (Dunn & Dunn, 2007) Individual Growth and Development Indicators (IGDI) (Early Childhood Research Institute on Measuring Growth and Development, 1998)
The PPVT-4 is a quick method of assessing receptive language for children over 2 years and 6 months. It is a direct standardized assessment collected by a trained assessor. A score of 100 is an average score, with a standard deviation of 15. The IGDI is a one-minute timed task measuring children’s expressive language. A child is asked to name as many pictures as he/she can in one minute. Children’s raw scores (i.e., number of words correct) were used in the analysis.
Early Literacy Test of Preschool Early Literacy (TOPEL) (Lonigan, Wagner, & Torgesen, 2007)
Print Knowledge Phonological Awareness
The TOPEL is a standardized measure of early literacy with a mean score of 100 and a standard deviation of 15. Two subtests were administered: Print Knowledge (naming letters and sounds) and Phonological Awareness (breaking up words by sounds). It takes about 20 to 30 minutes to administer both subtests.
Early Math Woodcock-Johnson III 3rd edition (WJ-III) (Woodcock, McGrew, & Mather, 2001)
Applied Problems
WJ-III is a widely used collection of tests measuring achievement in reading, mathematics, written language, and general knowledge. One subtest, Applied Problems, was used as a measure of mathematical reasoning and skills. It is a direct standardized assessment collected by a trained assessor in 10 minutes. A score of 100 is an average score, with standard deviation of 15.
Social-Emotional Social Competence and Behavior Evaluation – 30 items (SCBE-30) (LaFreniere & Dumas, 1996)
Social Competence
Anger-Aggression
Anxiety-Withdrawal
The SCBE-30 is a teacher-completed rating scale measuring the three dimensions of social competence, anxiety-withdrawal, and anger-aggression in children ages 2-1/2 to 6. It takes approximately 15 minutes to complete the items derived from the longer version of the SCBE-80. This is not a norm-referenced assessment; scores are calculated by summing the scores for each item in a subscale. SRI compared the scores for children with scholarships to a representative sample of children from the general population published by the authors of the measure.
Attention The PLBS is a measure of children’s approach to learning which includes items that ask teachers to rate children’s ability to stay on task and pay attention. The raw score is calculated by reverse-scoring some items and then summing to obtain a total (i.e., higher scores reflect more attention, concentration, etc.). The raw score was then converted to a T-score based on the author’s guidelines. In a representative sample, the mean T-score is 50 with a standard deviation of 10.
54
Below we describe the results of the assessments for baseline, one-year follow-up, and kindergarten.
Most of the scores are presented as means and standard deviations of the standard scores.
Standard scores are adjusted for age and compare a child’s performance on the assessment with children who are matched on age and thus the score is based on how the child is performing relative to his/her peers. We would expect that children who are developing on a typical trajectory to have the same score over time even though they are learning new skills and have greater knowledge.
We also present the percentage of children who scored more than one standard deviation below the mean. This percentage reflects children who are performing far below their peers and may be in need of early intervention to change their developmental growth trajectory and be ready for school.
Sample of Children and Families
Table 6 shows the status of data collection begun in fall 2008 and continuing through 2011 for the outcome evaluation (child assessments).
Of the 257 children enrolled in the Scholarship Program, 192 children (75%) had completed baseline assessments of their development (n = 77, 59% for Cohort 2 and n = 115, 91% for Cohort 3). Children ranged in age from 37 to 51 months.42 The average age at which the baseline assessment occurred was 44 months (Cohort 2 = 45 months and Cohort 3 = 43 months).
– A total of 44 children (17%) were not assessed at baseline because they were not yet enrolled in an ECE program. Most of these children (43, 98%) were in Cohort 2, and 1 child (2%) was in Cohort 3. The other 21 children missed completing the direct assessments because the children were no longer participating in the Scholarship Program by the time the assessment was attempted or were repeatedly absent or uncooperative with the testing.
Of the 257 children, 206 children (80%) had completed one-year follow-up assessments (n = 98, 75% for Cohort 2 and n = 108, 85% for Cohort 3) when the children ranged in age from 48 to 62 months. The average age of the children at the time of the one-year follow-up assessments was 55 months (Cohort 2 = 55 months and Cohort 3 = 55 months).
– A total of 51 children were not assessed during the one-year follow-up because they were no longer participating in the Scholarship Program by the time the assessment was attempted, were reported as no longer attending their selected ECE program, or were repeatedly absent or uncooperative with the testing.
Of the 257 children, 178 children (69%) had completed kindergarten follow-up assessments (n = 83, 64% for Cohort 2 and n = 95, 75% for Cohort 3) when the children ranged in age from 61 to 74 months. The average age of the children at the time of the
42 Baseline assessment took place in fall 2008 for Cohort 2 and in fall 2009 for Cohort 3. Multiple obstacles to data collection in
fall 2008 resulted in a lower response rate; several issues were resolved during 2009, including identifying participating children early and making repeated attempts to follow a subset of children as they moved from one program to another.
55
kindergarten entry follow-up assessments was 67 months (Cohort 2 = 67 months and Cohort 3 = 67 months).
– A total of 79 children were not assessed during the kindergarten follow-up because they had moved out of the area, did not indicate an elementary school, were reported as not attending their indicated elementary school, or were repeatedly absent or uncooperative with the testing.
Table 6. Scholarship Sample for Baseline, One-Year Follow-Up, and Kindergarten Entry Data Collection for Child Assessments
Half of the scholarship children (n = 128, 50%) had assessments at all three waves: baseline, one-year follow-up, and kindergarten entry assessments (Table 7).
– About two-thirds (n = 163, 63%) had both baseline and one-year follow-up assessments.
– About two-thirds (n = 161, 63%) had both one-year and kindergarten entry assessments.
– Just over half (n = 141, 55%) had both baseline and kindergarten entry assessments.
A small percentage (n = 12, 5%) of children was not assessed at any time.
Table 7. Number of Scholarship Children with Child Assessments, by Cohort and Wave of Data Collection
Missing data can cause biased findings of the impact because participants with missing data may be the least likely to show growth or change on a measure. When possible, imputing the missing values (i.e., statistically estimating what scores would have been on an assessment measure if it had been administered) provides a more precise estimate of the impact on the entire sample of children who participated in a program. To take advantage of the available
56
assessments,43 we used a within-person method for imputing missing longitudinal data. For children with two time points who were missing either the baseline, one-year follow-up, or kindergarten entry assessment, we calculated the child’s missing data point for each child assessment measure using an estimate based on the trajectory of the other two data points. This method is considered superior to other methods of imputation, and it is the recommended method when data exist for the same children at multiple times. The data presented below reflect the imputed sample. It is important to note that all analyses were conducted both ways: unimputed (i.e., for only those children with data for all three time points, we analyzed change over time on all measures) and imputed (imputing the missing data point using the within-person estimate for each child) (Engels & Diehr, 2003). The results were the same with both unimputed and imputed samples, so we present below the imputed results to take advantage of the larger available sample size.
Language and Early Literacy
Children’s receptive language (i.e., understanding of vocabulary) was measured by the Peabody Picture Vocabulary Test (PPVT-4). Figure 23 depicts the developmental progress on language development as measured by the PPVT-4 for children who had two or three assessments, with imputed data if they were missing one assessment point (n = 207).
The average PPVT-4 score at baseline was 80.0 (i.e., one and one-third standard deviations below the mean).
The PPVT-4 scores increased 5 points at the one-year follow-up assessment to 85.1 and 4 additional points at kindergarten to 89.3, significant increases form baseline to one-year follow-up, from one-year follow-up to kindergarten entry, and from baseline to kindergarten entry (all p < .0001) (Figure 23).
As described in last year’s Annual Report, more than half of the children in the Scholarship Program (56%) demonstrated below average language development at baseline. However, at the one-year follow-up assessment, children’s scores on the PPVT-4 were significantly higher, and fewer children (48%) were scoring below average on this measure (p < .001). At kindergarten entry, about one-third of children (37%) were scoring below average, significantly fewer than at baseline (p < .0001) and at the one-year follow-up (p < .0005) (Figure 24).
In examining these scores, it is important to remember the diversity of the children’s background. Table 3 on page 33 shows that the children participating in the Scholarship Program were diverse in their language/communication backgrounds. When the assessors completed the child assessments, they were asked to first complete the PPVT-4 and determine whether the child reached the minimum score to continue testing in English. Over time more children living in non-English households could complete the assessments in English.
More than one-fifth of the scholarship children assessed at baseline (22%, 41 of 186) could not complete the remainder of the battery because of their limited English skills at that time.
At the one-year follow-up assessment, 18% of the scholarship children (38 of 205) could not complete the remainder of the assessment in English.
43 On any given measure, between 65% and 82% of children had at least two of the three waves of assessment data.
57
At kindergarten entry, only 11% (20 of 178) of the children could not complete the remainder of the assessment in English.
This finding could be viewed as a positive effect of the children’s enrollment in a high-quality ECE program that not only supports their learning and development, but provided additional opportunities to learn English by speaking and interacting with the teachers, staff, and other children.
Figure 23. Change in PPVT Score From Baseline to One-Year Follow-Up to Kindergarten Entry (n = 207)
Figure 24. Percentage of Children with Low Scores on the PPVT at Baseline, One-Year Follow-Up, and Kindergarten Entry (n = 207)
p values
B to 1 yr = < .0001
1 yr to K = < .0001
B to K = < .0001
p values
B to 1 yr = .006
1 yr to K = .0005
B to K = .0001
Source: Direct child assessments.
Children’s expressive language was measured by the IGDI – Picture Naming test. Figure 25 shows the scholarship children’s raw scores on average across the three assessment waves. These data include scores for children with two or three assessments, with imputed data if they were missing one assessment point (n = 204).
The average Picture Naming score at baseline was 12.0 and it increased to 17.2 at one-year follow-up and then again to 23.3 at kindergarten entry (all p < .0001) (Figure 25).
In addition, scores for scholarship children were compared to those for a nationally representative sample of children (Roseth, Missall, & McConnell, 2011). To show children with low scores on this assessment, the percentages of scholarship children whose scores were 1 standard deviation below the mean for same-age peers in the larger sample were calculated.
Approximately one-third of the children scored 1 standard deviation below the mean at baseline and at the one-year follow-up (33% and 32%, respectively). However, at kindergarten entry, fewer children (21%) were scoring below average on this measure (p < .001) (Figure 26).
110
100
90
80
70Baseline One-year
follow-upKindergarten
entry
80.0(20.8)
89.3(15.9)
Mea
nsc
ore
s(S
D)
85.1(16.9)
56 4837
Per
cent
Baseline One-yearfollow-up
Kindergartenentry
100
80
60
40
20
0
58
Figure 25. Change in IGDI-Picture Naming Scores From Baseline to One-Year Follow-Up to Kindergarten Entry (n = 204)
Figure 26. Percentage of Children with Low Scores on the IGDI-Picture Naming at Baseline, One-Year Follow-Up, and Kindergarten Entry (n = 204)
p values
B to 1 yr = < .0001
1 yr to K = < .0001
B to K = < .0001
p values
B to 1 yr = ns
1 yr to K = .001
B to K = <.001
Children’s other early literacy skills were measured by two subtests from the TOPEL, the Print Knowledge and Phonological Awareness Subtests. Figure 27, Figure 28, Figure 29, and Figure 30 depict the developmental progress on these measures for children who had two or three assessments, with imputed data if they were missing one assessment point (n = 153).44
Children’s Print Knowledge increased significantly over time, with the average score on this subtest of 93.3 at baseline increasing to 102 at kindergarten entry (p < .0001), which is considered at grade-level performance for children of this age (Figure 27). Print Knowledge scores also increased significantly from baseline to one-year follow-up and from one-year follow-up to kindergarten entry (both p < .0001).
The average Phonological Awareness subtest score at baseline was 87.3 (i.e., about 1 standard deviation below the mean) and the average score increased significantly to 92.7 by kindergarten entry (p < .008) (Figure 29). The average gain from baseline to one-year follow-up was not significant, but the average gain from one-year follow-up to kindergarten entry was a significant increase (p < .007).
About one-third of the scholarship children had below average early literacy scores at baseline (30% for Print Knowledge, 35% for Phonological Awareness) (Figure 28 and Figure 30).
Over time from baseline to kindergarten entry, the percentage with low scores decreased significantly for Print Knowledge (Figure 28).
44 There are fewer children in these analyses reflecting the fact that some children at each assessment wave could not complete
the entire battery in English. The smaller number of children in the phonological awareness analyses occurred because we removed this subtest for the majority of children in Cohort 2 at baseline because of time constraints. The subtest was added back into the battery the following fall.
60
50
40
30
20
10
0
Mea
nsc
ores
(SD
)
Baseline One-yearfollow-up
Kindergartenentry
23.3(9.2)
17.2(7.8)
12.0(8.2)
33 32
21
Per
cent
Baseline One-yearfollow-up
Kindergartenentry
100
80
60
40
20
0
59
However, the percentage with low scores on Phonological Awareness was consistently about one-third of all children across the three waves of data collection (Figure 30), suggesting that this skill set is a more difficult development skill than print knowledge for young children.
Figure 27. Change in TOPEL-Print Knowledge Score From Baseline to One-Year Follow-Up to Kindergarten Entry (n = 153)
Figure 28. Percentage of Children with Low Scores on the TOPEL-Print Knowledge at Baseline, One-Year Follow-Up, and Kindergarten Entry (n = 153)
p values
B to 1 yr = < .0001
1 yr to K = < .0001
B to K = < .0001
p values
B to 1 yr = .02
1 yr to K = ns
B to K = .009
Source: Direct child assessments.
Figure 29. Change in TOPEL-Phonological Awareness Score From Baseline to One-Year Follow-Up to Kindergarten Entry (n = 131)
Figure 30. Percentage of Children with Low Scores on the TOPEL-Phonological Awareness at Baseline, One-Year Follow-Up, and Kindergarten Entry (n = 131)
p values
B to 1 yr = ns
1 yr to K = .007
B to K = .008
p values
B to 1 yr = ns
1 yr to K = ns
B to K = ns
Source: Direct child assessments.
Baseline One-yearfollow-up
Kindergartenentry
93.3(16.8)
97.6(14.4)
102.0(17.6)
Mea
nsc
ore
s(S
D)
110
100
90
80
70
3020 18
Per
cent
Baseline One-yearfollow-up
Kindergartenentry
100
80
60
40
20
0
Baseline One-yearfollow-up
Kindergartenentry
87.3(16.2)
89.5(12.7)
92.7(16.6)
Mea
nsc
ores
(SD
)
110
100
90
80
70
35 34 34Per
cent
Baseline One-yearfollow-up
Kindergartenentry
100
80
60
40
20
0
60
Early Math
Children’s early math development was assessed using a Woodcock-Johnson III subtest (Applied Problems). The subtest measures children’s ability to count and to perform other mathematical reasoning (e.g., children are asked to count objects on a page or asked to fill-in the missing number in a series). Figure 31 depicts the developmental progress on this subtest for the children who had two or three assessments, with imputed data if they were missing one assessment point (n = 153).
The average Applied Problems score at baseline was 95.7 and significantly increased 2.2 points at the one-year follow-up assessment to 97.9 (p = .01) (Figure 31). At kindergarten entry, the average score was 98.6, which reflects grade-level performance on this measure, increasing significantly from the average at baseline (p < .04).
At baseline, approximately one-fifth of the scholarship children (22%) performed below average (i.e., scored below 85) on Applied Problems (Figure 32). By one-year follow-up and at kindergarten entry, fewer than 10% of children were scoring below average on the Applied Problems subtest, a significant drop from baseline to the one-year follow-up (p < .0001) that was maintained to kindergarten entry (p < .001).
Figure 31. Change in Woodcock-Johnson Applied Problems Score From Baseline to One-Year Follow-Up to Kindergarten Entry (n = 153)
Figure 32. Percentage of Children with Low Scores on the Woodcock Johnson Applied Problems at Baseline, One-Year Follow-Up, and Kindergarten Entry (n = 153)
p values
B to 1 yr = .01
1 yr to K = ns
B to K = .04
p values
B to 1 yr = < .0001
1 yr to K = ns
B to K = .001
Source: Direct child assessments.
Interpretation of Language, Early Literacy, and Early Math Findings. These data show that children in the Scholarship Program were making significant and meaningful developmental progress and their developmental trajectories were different than they would have been without participating in the intervention and attending a high-quality ECE program (i.e., moving closer to age-expected performance). Figure 23 shows significant increases in receptive language (receptive vocabulary) after one year of participation in a high-quality ECE program. A gain of 5 points is equivalent to an effect size of .33, considered to be a moderate
Baseline One-yearfollow-up
Kindergartenentry
95.7(13.3)
97.9(10.1)
98.6(12.5)
Mea
nsc
ores
(SD
)
110
100
90
80
70
8
Per
cen
t
Baseline One-yearfollow-up
Kindergartenentry
22
6
100
80
60
40
20
0
61
effect size and a gain of 9 points across two years is equivalent to an effect size of .59 which is a large gain. For the expressive language measure, IGDI- Picture Naming, the two-year gain from baseline at age 3 to kindergarten entry was equivalent to an effect size of 1.2, considered to be a very large effect size.
In addition, children made significant gains on measures of early literacy with Print Knowledge showing gains from baseline to one-year follow-up and then again from one-year to kindergarten entry (Figure 27), with an effect size of .49, a moderate to large effect. Children showed the greatest and most significant growth on Phonological Awareness from one-year follow-up (i.e., when the children were on average 4.5 years old) to kindergarten entry (Figure
29), with a moderate effect size from baseline to kindergarten entry of .33. In addition to changes in mean scores in the expected direction for language and early literacy measures, fewer children were scoring in the low range at one-year follow-up and kindergarten entry.
Scholarship children also made gains in early math skills from baseline to kindergarten entry, with an effect size of .23, a small but significant effect. Interestingly, children made smaller gains in early math skills across the two years compared with gains in language and early literacy outcomes, with significant increases from baseline to one-year follow-up and from baseline to kindergarten entry, but less of an increase from one-year to kindergarten entry on the early math subtest. In addition, of notable importance, significantly fewer scholarship children had scores in low range on this measure, with 22% at baseline and less than 10% at both the one-year follow-up and kindergarten entry having low scores. These findings may highlight the stronger focus on language development and early literacy in many ECE programs. Other recent studies have suggested that early math skills may be more difficult to promote, may not be well addressed by ECE teachers, and/or are less likely to change in programs and interventions of this kind (Cross, Woods, & Schweingruber, 2009).
To put the effect size findings into perspective, comparisons can be made with other preschool evaluations of children from low-income or at-risk households that have found a range of positive effect sizes. Gormley and Gayer’s (2005) evaluation of Tulsa, Oklahoma’s pre-kindergarten program found effect sizes of 0.39 (cognitive ability) and 0.38 (language ability). Magnuson, Ruhm, and Waldfogel (2007) estimated effect sizes of 0.24 (reading) and 0.20 (math) for pre-kindergarten attendance among disadvantaged children in the Early Childhood Longitudinal Study—Kindergarten cohort. An analysis of intensive early education programs revealed an effect size of 0.97 for Perry Preschool participants and 0.62 for Abecedarian participants at age 5 on cognitive assessments (Karoly, Kilburn, & Cannon, 2005). Finally, a more recent intervention study of children with two years of a high-quality, intensive state-funded preK program in New Jersey showed an effect size on the PPVT of 0.42. Other national studies of the effects on children’s learning and development of child care with variable quality have found rather small effects sizes (0.10 to 0.15) (Bernal & Keane, 2006) with higher-quality programs having a bigger impact (Burchinal & Cryer, 2003; McCartney, Dearing, Taylor, & Bub, 2007; NICHD & Duncan, 2003; Peisner-Feinberg & Burchinal, 1997). Other data about the estimated effects of Head Start on children’s cognitive development also indicate small positive effect sizes (0.10 to 0.30) (Barnett, 2008; U.S. Department of Health and Human Services, 2005). The effect sizes found in this Scholarship Program evaluation suggest that the participating children, all from low-income families, were much closer to reaching age-appropriate levels of performance on most measures than they would have achieved without such participation.
62
Social-Emotional
The teacher-completed checklist forms were distributed during the same time period when direct assessments of children were completed at each wave of data collection. The checklist form included the SCBE-30 (Social Competence and Behavior Evaluation—30 items) and the Preschool Learning Behaviors Scale (PLBS) Attention Subscale. The SCBE-30 is a measure of children’s social competence and adjustment. The assessment data displayed here for social-emotional outcomes show three domains of behaviors: social competence, anger-aggression, and anxiety-withdrawal. This is not a norm-referenced assessment measure; scores are calculated by summing the scores for each item in a subscale.
Figure 33 shows the mean raw scores of scholarship children at baseline, one-year follow-up, and kindergarten entry on these three domains for children who had two or three assessments, with imputed data if they were missing one assessment point.
For the social competence domain, children’s scores increased from 35.5 at baseline to 37.7 at the one-year follow-up to 39.3 at kindergarten entry, with significant increases from baseline to one-year (p < .02) and baseline to kindergarten (p < .02).
For the anger-aggression or anxiety-withdrawal domains, children’s scores did not change significantly.
Figure 33. Change From Baseline to One-Year Follow-Up to Kindergarten Entry for Teacher-Reported Measures of Social-Emotional Development
p values: Social Competence
B to 1 yr = .02
1 yr to K = ns
B to K = .02
p values: Anger-Aggression
B to 1 yr = ns
1 yr to K = ns
B to K = ns
p values: Anxiety-Withdrawal
B to 1 yr = ns
1 yr to K = ns
B to K = ns Source: Teacher checklists.
In addition, scores for scholarship children were compared to those for a representative
sample of children published by the authors of the measure (LaFreniere & Dumas, 1996). To show children with problematic scores, the percentages of scholarship children whose scores significantly deviated from the average scores of this published sample of preschool children by
17.6(8.0)
35.5(14.1) 37.7
(10.2)
39.3(14.0)
Baseline One-yearfollow-up
Kindergatenentry
SCBE SocialCompetence(n = 157)
SCBE Anger-Aggression(n = 163)
60
50
40
30
20
10
0
Mea
n sc
ores
(S
D)
SCBE Anxiety-Withdrawal(n = 162)
18.2(6.4) 17.5
(7.6)
17.9(8.0)
16.7(9.3)
17.3(10.0)
63
1 standard deviation are shown in Figure 34, Figure 35, and Figure 36, compared with the representative sample separately for boys and girls. Low social competence scores are problematic, whereas high anger-aggression or anxiety-withdrawal scores are problematic.
For social competence scores (Figure 34), at baseline, 24% of boys and 23% of girls had scores that were 1 standard deviation lower than children of the same age and gender in a representative U.S. sample. There were no significant changes in this domain over time.
For anger-aggression scores (Figure 35), at baseline, 6% of girls and 9% of boys had scores that would warrant concern. The percentage of girls with high scores on this dimension more than doubled over time so that by kindergarten, 15% of girls had high scores.
For anxiety-withdrawal scores (Figure 36), 12% of boys and 5% of girls had scores that would warrant concerns, with boys decreasing to 8% and girls increasing to 10% by kindergarten entry, but the changes were not statistically significant.
Figure 34. Percentage of Children with Problematic Scores on Teacher-Reported Measures of Social-Emotional Development at Baseline, One-Year Follow-Up, and Kindergarten Entry—Social Competence
p values
Female Male
B to 1 yr = ns ns
1 yr to K = ns ns
B to K = ns ns
Note: Percentage of children with low scores (< 1 standard deviation from mean). Source: Teacher checklists.
2029 2423
Per
cent
SCBE Social Competence(female, n = 79)
SCBE Social Competence(male, n = 75)
100
80
60
40
20
0
Baseline One-year follow-up Kindergarten entry
2733
64
Figure 35. Percentage of Children with Problematic Scores on Teacher-Reported Measures of Social-Emotional Development at Baseline, One-Year Follow-Up, and Kindergarten Entry—Anger-Aggression
p values
Female Male
B to 1 yr = ns ns
1 yr to K = .008 ns
B to K = .03 ns
Note: Percentage of children with high scores (> 1 standard deviation from mean). Source: Teacher checklists.
Figure 36. Percentage of Children with Problematic Scores on Teacher-Reported Measures of Social-Emotional Development at Baseline, One-Year Follow-Up, and Kindergarten Entry—Anxiety-Withdrawal
p values
Female Male
B to 1 yr = ns ns
1 yr to K = ns ns
B to K = ns ns
Note: Percentage of children with high scores (> 1 standard deviation from mean). Source: Teacher checklists.
Pe
rce
nt
99
SCBE Anger-Agression(female, n = 85)
SCBE Anger-Agression(male, n = 76)
Baseline One-year follow-up Kindergarten entry
46
100
80
60
40
20
0
15 12
510
5
SCBE Anxiety-Withdrawal(female, n = 83)
SCBE Anxiety-Withdrawal(male, n = 77)
Pe
rcen
t
Baseline One-year follow-up Kindergarten entry
6 8
100
80
60
40
20
0
12
65
Approaches to Learning
The PLBS is a measure of children’s approaches to learning that includes items that ask teachers to rate children’s ability to stay on task and pay attention. The raw score is calculated by reverse-scoring some items and then summing to obtain a total score (i.e., higher scores reflect more and better attention and concentration). The raw score was then converted to a T-score based on the author’s guidelines. In a representative sample, the mean T-score is 50 with a standard deviation of 10.
Figure 37 shows the mean T-scores of scholarship children at baseline, one-year follow-up, and kindergarten entry on this measure of attention and Figure 38 shows the percentage with low scores for children who had two or three assessments, with imputed data if they were missing one assessment point.
Scholarship children had small but significant average gains on attention skills from baseline to kindergarten entry (p < .04) (Figure 37).
About one-fifth to one-fourth of scholarship children were rated by their teachers as having low attention (i.e., 23% of children had T-scores that were 1 standard deviation below the mean at baseline, 20% at one-year follow-up, and 26% at kindergarten entry) (Figure 38). Over time, this percentage with low attention scores did not change significantly.
Figure 37. Change From Baseline to One-Year Follow-Up to Kindergarten Entry on the Teacher-Reported Measure of Attention (n = 159)
Figure 38. Percentage of Children with Low Scores on Teacher-Reported Measures of Attention at Baseline, One-Year Follow-Up, and Kindergarten Entry (n = 159)
p values
B to 1 yr = ns
1 yr to K = ns
B to K = .04
p values
B to 1 yr = ns
1 yr to K = ns
B to K = ns
Source: Teacher checklists.
Interpretation of Social-Emotional and Approaches to Learning Findings. Based on available data from the norming samples for these measures (LaFreniere & Dumas, 1996; Schaefer, Shur, Macri-Summers, & MacDonald, 2004), scholarship children were performing well on these social and behavioral skills at all three time points. Scholarship children were comparable on mean scores to the norming sample for social competence and attention. Children
60
50
40
30
20
10
0
Mea
nsc
ores
(SD
)
Baseline One yearfollow-up
Kindergartenentry
49.1(10.1)
49.9(12.5)
49.0(12.2)
23 2026
Per
cent
Baseline One-yearfollow-up
Kindergartenentry
100
80
60
40
20
0
66
had somewhat better scores on anger-aggression and anxiety-withdrawal showing lower levels on these domains than the norming sample.
For social competence, the means in the norming sample were 35.5, 39.4, and 41.1 for 3-, 4-, and 5- year old girls, respectively, and 32.3, 36.9, and 38.6 for 3-, 4-, and 5- year old girls, respectively. The scholarship children showed comparable levels of social competence to children in the norming sample.
For anger-aggression, the means in the norming sample were 19.4, 20.0, and 16.8 for 3-, 4-, and 5- year old girls, respectively, and 24.9, 22.5, and 19.4 for 3-, 4-, and 5- year old girls, respectively. The scholarship children showed lower levels of anger-aggression, indicating better behavior than in the norming sample.
For anxiety-withdrawal, the means in the norming sample were 26.3, 22.9, and 21.0 for 3-, 4-, and 5- year old girls, respectively, and 24.1, 22.5, and 21.6 for 3-, 4-, and 5- year old girls, respectively. The scholarship children showed lower levels of anxiety-withdrawal, indicating better behavior than in the norming sample.
For attention, the mean T-score for all 3- to 5-year old children in the norming sample was 52.8. The scholarship children showed comparable levels of attention to children in the norming sample.
As an additional comparison, studies of behavioral problems in general populations of young children typically find that about 10-15% of the general population have clinically significant problems with regards to behaviors such as aggression and anxiety (Huffman, Mehlinger, & Kerivan, 2000). The scholarship children had similar or lower percentages of children with these kinds of behavioral problems.
67
Findings: Kindergarten Outcome Data on Scholarship
Versus Comparison Group on Children’s Language, Literacy, Early Math Skills, and Behavior
In consultation with the University of Minnesota Center for Early Education and Development (CEED) staff, it was decided to add to the Scholarship Program evaluation a comparison group of children (about n = 200) to be assessed at kindergarten entry with the same child assessment battery used with children who received scholarships. The purpose of adding this comparison group was to address the following question:
Are children who participated in the Scholarship Program (two years of a high-quality ECE program) better prepared for kindergarten (as assessed by the child outcomes battery) compared to low-income children in the larger community who did not receive a scholarship?
Inclusion/Exclusion Criteria
It was difficult to identify what exclusion/inclusion criteria to use to obtain a sample of children who were very similar to the children in the Scholarship Program (i.e., living in low-income households) but who had not attended the same ECE programs. Ultimately, SRI and CEED determined that the critical question was: how do children perform at kindergarten entry without the benefit of the scholarship funds? It should be noted that this was not a test of differential child outcomes due to different preschool experiences, per se, but rather a test of whether features of the Scholarship Program that affect access to high-quality ECE programs were an effective means of improving child outcomes. Given that the focus was on comparing kindergarten outcomes in children who did versus did not have access to scholarship funds, SRI, in consultation with CEED, decided to limit eligibility in the comparison sample to the following inclusion criteria:
Child living in a low-income household
Child age-eligible (i.e., scheduled to start kindergarten in fall 2010 or fall 2011)
Child living in the city of Saint Paul, Minnesota
Identifying and Recruiting Comparison Group of Children
The sample for the comparison group was recruited in 2010 and 2011, with some children assessed at kindergarten entry in fall 2010 and some children assessed at kindergarten entry in fall 2011.45 This sample was recruited using three methods:
In 2010, a sample of schools in the Saint Paul Public School district were selected because a large percentage of the student population at each school was eligible for free or reduced-price school lunches (i.e., at least 65% of the student population was low-
45 The original plan was to recruit all kindergarten comparison group children in fall 2010, but recruitment was low in 2010 so
we decided to continue recruitment again in 2011 for children entering kindergarten in fall 2011.
68
income). Principals at 11 of the schools agreed to participate in the study by having kindergarten teachers distribute consent forms in their classrooms and collect signed forms from interested parents. This strategy yielded 56 children eligible to be in the study.
In 2011, two different recruitment strategies were employed in an attempt to increase the number of comparison families who enrolled in the study.
– In addition to the 11 schools selected in 2010, 8 other schools were identified, and all were asked to allow a representative of the study to recruit incoming kindergarten families at kindergarten information events in the spring or fall of 2011. This strategy yielded 34 age-eligible children.
– With the assistance of RCC and DHS, all families receiving CCAP who lived in the city of Saint Paul were mailed information about the study. Approximately 2,300 households were mailed information about the MELF Kindergarten Study. If the parents/guardians had a child who was entering kindergarten in 2011 and were interested in having their child participate in the study, they were asked to complete the consent form and return by mail in a pre-paid envelope. This strategy yielded 99 age-eligible children.
Across these three different strategies in 2010 and 2011, the total age-eligible sample was 189 children. More than half (99, 52%) were recruited through the CCAP mailing in 2011.46
We used the same battery of child assessment measures for kindergarten children in the comparison group as was used for assessing scholarship children. We mailed a survey to participating parents to collect additional information about the children and their families. Most of the 189 children (n = 174, 92%) were assessed and about two-thirds of parents (n = 123, 65%) returned a completed survey.47
Characteristics of Children and Families in the Comparison Group
Table 8 shows the demographic characteristics of children and families in the comparison group and the scholarship group on a number of key risk factors that may influence access to high-quality ECE, school readiness skills, and academic achievement more generally. These data showed the following:
In the comparison group, nearly two-thirds of families reported that English was the language spoken most often in their home (63%) compared to 56% of families in the scholarship group.
The two groups are very similar in their ethnic backgrounds,48 and about one-third of families in each group identified themselves as being an immigrant or refugee.
46 Limitations of the recruitment approaches used and the scholarship–comparison group analyses are discussed at the end of
this section. 47 Income eligibility was obtained by parent self-report. All children recruited through CCAP were assumed to meet the low-
income criteria. For children recruited through the schools, parents were asked on the consent form whether any of their children were eligible for free- or reduced-price lunch and were provided an estimate of eligibility (e.g., a monthly income of $3,400 for a family of four). Parents were also asked more detailed questions about income on the survey.
48 Ethnicity data were missing for more than a third of the total comparison sample (71, 38%) because parents either did not return the parent survey (66, 35%) or did not indicate an ethnicity on the survey (5, 3%).
69
Many of the families in the comparison group were receiving one or two forms of public assistance at the time the family completed the parent survey.
– Almost three-quarters of the families (71%) were receiving financial assistance from either the Minnesota Family Investment Program (MFIP), the Child Care Assistance Program (CCAP), or from both programs compared to 51% in the scholarship group.
– One of the key group differences is that the comparison group families were much more likely to be receiving CCAP (54%) compared to the scholarship group families (17%), probably a result of the methods used to recruit the comparison sample.
The two groups differed on maternal education level: the comparison group had more mothers with a high school diploma or equivalent and fewer with less than a high school degree compared to the scholarship group.
The comparison group was relatively more affluent: 40% of comparison group families reported incomes less than 100% of the Federal Poverty Guidelines (FPG), while 72% of scholarship families fell into the below 100% FPG category.
Taken together, these data on demographic characteristics suggest that the comparison group, while still considered a “high risk” sample, had lower levels of sociodemographic risk than did the scholarship group, a factor that would be related to those children having better outcomes. As a result, the comparison group might be considered a rigorous sample (i.e., higher performing than expected) for evaluating the observed effects for the Scholarship Program participants.
70
Table 8. Demographic Characteristics of Children and Families in Kindergarten Comparison Versus Scholarship Groups
Comparison (N = 189) Scholarship (N = 257)
n (%)
Number of participating children 189 (100) 257 (100)
Child’s Ethnicity n = 189b n = 257c
African-American 38 (20) 53 (21)
Asian 27 (14) 46 (18)
Latino 6 (3) 12 (5)
White 17 (9) 9 (4)
Other 30 (16) 12 (5)
Missing 71 (38) 125 (49)
Child Gender n = 189 n = 257
Female 92 (47) 126 (49)
Male 97 (51) 131 (51)
Home Language n = 189a n = 257c
English 120 (63) 144 (56)
Karen 14 (7) 17 (7)
Hmong 23 (12) 22 (9)
Spanish 13 (6) 4 (2)
Somali 3 (2) 33 (13)
Other 15 (8) 15 (6)
Missing 1 (1) 22 (9)
Immigrant Status1 n = 118/121b n = 112/121d
From an immigrant or refugee group 36 (31) 34 (30)
Child born outside the U.S. 18 (15) 8 (7)
Household Income n = 189b n = 257c
100–185% FPG 100 (53) 73 (28)
< 100% FPG 75 (40) 184 (72)
Missing 14 (7) –
Maternal Education n = 111b n = 115d
Less than high school 21 (19) 36 (32)
High school diploma or GED 50 (45) 29 (25)
Associate’s degree or some college 30 (27) 42 (36)
Bachelor’s degree 10 (9) 8 (7)
Financial Assistance Participation n = 123b n = 257c
CCAP only 29 (24) 8 (3)
MFIP only 21 (17) 87 (34)
Both CCAP and MFIP 37 (30) 36 (14)
No assistance 36 (29) 126 (49)
Source: a consent form; b comparison parent survey; C scholarship application form; d scholarship parent interview. 1 These two items have different numbers of respondents.
71
Families of the children in the comparison group resided in zip codes all across the city of Saint Paul (Figure 39). However, almost three-fourths (73%) lived in the same six zip codes as the families in the Scholarship Program (55103, 55104, 55106, 55113, 55117, and 55130).
Figure 39. Home Zip Codes of Kindergarten Comparison Group Families (n = 187)
Figure 40. Home Zip Codes of Scholarship Group Families (n = 256)
* Other includes 5516, 55109, 55101, 55114, 55042, 55105, 55108, 55121, 55127, and 55129.
Source: comparison group consent form
Source: scholarship application form
Based on data on the consent form and parent surveys, if completed, a majority of the comparison group children (77%) attended a center-based program prior to kindergarten and the other 23% did not.
At least one-third of the entire comparison group sample (34%) attended high-quality ECE programs as rated by Parent Aware: at least 10% at Head Start, at least 12% at SPPS School Readiness programs; and another 12% at center-based programs that some of the scholarship children also attended.
The remainder of the parents who reported center-based care (43% of the entire comparison group sample) did not provide enough information to categorize the type or quality of child care.
55130(n = 13)
7%
55113(n = 1)
0%
55107(n = 16)
9%
55119(n = 13)
7% 55117(n = 35)
19%
55104(n = 29)
15%
55103(n = 24)
13%
55106(n = 35)
19%
*Other(n = 21)
11%
55117(n = 141)
55%55104(n = 48)
19%
55103(n = 32)
13%
55130(n = 23)
9%
55106(n = 11)
4%
55113(n = 2)
1%
72
Figure 41. ECE Program Attendance of Comparison Group Children (n = 189)
Source: Consent Form.
Note: These data are for ECE program attendance for the year prior to kindergarten entry. FCC indicates family child care.
Comparison of Child Outcomes for Scholarship Versus Comparison Group Children
For seven of nine child outcome measures (Table 9), there were no significant differences between the average scores for the scholarship group children and the comparison group children, including the scores for the language, early literacy, early math, and attention outcomes. Of the significant group differences:
Scholarship children had significantly higher scores for social competence than did comparison group children at kindergarten entry (p < .0001).
Scholarship children had significantly lower scores for anxiety-withdrawal than did comparison group children at kindergarten entry (p < .0001).
Given the intent of recruiting and assessing this comparison group sample, we can conclude that the Scholarship Program a) contributed to improved outcomes for participating children, as evidenced by growth in norm-referenced scores on language, early literacy, early math, and social competence measures; and b) produced gains at least as good as those experienced by slightly more advantaged children receiving ECE programs and services through other mechanisms. Future analyses are needed to explore how the Scholarship Program may have contributed to enrollment in higher-quality ECE programs, greater attendance, or reduction of burden on participating families.
Center-based (includesHead Start and SPPS)
(n = 145)77%
FCC(n = 12)
6%
No careoutside the home
(n = 25)13%
Missing(n = 7)
4%
73
Table 9. Child Outcome Scores at Kindergarten Entry for Scholarship Versus Comparison Group Children
N Mean (SD) p Value
Receptive Language—PPVT
Scholarship 178 89.2 (15.3) ns
Comparison 173 89.2 (18.9)
Expressive Language—IGDI
Scholarship 177 22.5 (8.3) ns
Comparison 174 21.7 (9.1)
Early Literacy—TOPEL-Print Knowledge
Scholarship 130 100.2 (14.8) ns
Comparison 118 102.3 (13.2)
Early Literacy—TOPEL-Phonological Awareness
Scholarship 127 90.7 (15.2) ns
Comparison 118 92.8 (16.6)
Early Math—WJ-Applied Problems
Scholarship 153 97.1 (11.1) ns
Comparison 141 96.5 (11.5)
Social-Emotional—SCBE Social Competence
Scholarship 138 39.4 (11.0) < .0001
Comparison 142 28.5 (6.0)
Social-Emotional—SCBE Anger-Aggression
Scholarship 141 16.7 (9.2) ns
Comparison 142 18.1 (5.9)
Social-Emotional—SCBE Anxiety-Withdrawal
Scholarship 141 17.2 (6.7) .002
Comparison 142 19.6 (6.2)
Approaches to Learning—PLBS Attention
Scholarship 140 49.7 (11.2) ns
Comparison 140 48.5 (11.8)
Note: ns = not statistically significant.
Limitations of the Scholarship-Comparison Group Analyses
These comparisons of scholarship and comparison group children were instructive, but limited conclusions can be drawn based on these analyses. Only a causal design such as a randomized study or a regression discontinuity study, or an analytic technique such as propensity score matching allows for causal statements (e.g., group differences were caused by the intervention being examined). For a variety of reasons, it was decided during the design phase of the evaluation for the scholarship pilot program that a randomized design was not feasible. However, over time, a decision was made to add a kindergarten comparison group to the study design.
74
The goal of recruiting a comparison group was to obtain a sample with entering kindergarten children from low income families in the pilot community, but who did not participate in the Scholarship Program. The analyses aimed to determine how the child outcomes compared for those children who participated in the Scholarship Program. The cross-sectional comparisons that can be made have a number of limitations, however, even though the comparison group reflects a contemporary sample of children who were attending the same elementary schools at the same time as the children in the Scholarship Program.
More specifically, the comparison sample is limited in a number of ways. In particular, the comparison group sample has several characteristics that may influence the analyses comparing scholarship and comparison group child outcomes (i.e., not well matched on key factors that can influence the child outcomes measured).
Because half of the comparison sample was recruited through CCAP, many children attended formal and/or licensed ECE programs. Furthermore, the percentage of comparison group children enrolled in ECE programs was higher than found in the general population (i.e., typically, 60% of 3 to 5 year-old children attend a center-based ECE program).49 Thus, many comparison group children had at least one year of center-based ECE program attendance.
Although data were not available about ECE program quality for all comparison group children, a sizable percentage attended high-quality ECE programs (i.e., at least 34%) as rated by the Parent Aware rating system. Given that high-quality ECE program attendance was hypothesized to improve school readiness outcomes, such attendance by comparison group children would serve to reduce the size of the intervention effects.
The household income data available for the comparison group families indicated that this group was more affluent than the scholarship group families (e.g., 40% versus 72% were living at < 100% of the Federal Poverty Level, respectively). Living in poverty is a factor that research indicates is highly predictive of poorer child school readiness outcomes so these group differences also would serve to reduce the size of the intervention effects.50
The maternal education levels of the comparison group were higher than those of scholarship group families, and research shows that higher maternal education levels are strongly associated with better child development and school readiness outcomes.51 Once again, these group differences also would serve to reduce the size of the intervention effects.
For the comparison group families who were recruited, there are unknown self-selection factors that can bias the group comparisons on the child outcome measures. If we assume that the comparison group parents who chose to sign the consent form to participate were more highly motivated to participate in a study in which their children are assessed than are the general population of low-income parents, this factor would also serve to reduce the size of the intervention effects.
49 Based on data from the National Center for Education Statistics (U.S. Department of Education, 2011), 57% of 4 year old
children were in center-based care in 2005-06. 50 See Duncan & Brooks-Gunn, 1997; McLanahan, 2005; McLoyd, Aikens, & Burton, 2006. 51 See McLanahan, 2005.
75
Early in the recruitment of the comparison group sample, an attempt was made to recruit families whose children did not attend any ECE programs prior to entering kindergarten or who only attended ECE programs not participating in Parent Aware. This approach was discontinued because the population of children to target for the comparison group was difficult to attain and limited in their generalizability. That is, during our initial recruitment efforts, we found that of 1,000 consent forms distributed at 11 SPPS elementary schools, only about 16% of parents consented to participate in the study. Of those parents, nearly one-fifth were not low-income. An additional 10% attended a known high-quality ECE program. In our subsequent discussions with CEED and MELF, we agreed that the target sample should consist of children who were (1) representative of low-income children in the target pilot areas and (2) with the only identifiable difference being that the comparison group children were not recipients of the scholarship.
These initial recruitment results also suggest that the families who returned signed consent forms to participate may have had other self-selection factors that limit their representativeness to the entire population of low-income families. Thus, a convenience sample is not necessarily a representative sample of the population of interest. However, it may have been that both groups (scholarship and comparison) benefitted from the greater number of ECE programs rated high-quality in these communities and that one interpretation is that all children benefit from high-quality ECE programs and there are a variety of ways that children and families from low-income households access these programs.
76
Findings: ECE Program Supply and Quality
in the Pilot Communities
The third component of the Scholarship Program is implementation of an ECE program quality rating system, Parent Aware, to rate and monitor ECE program supply and quality. In this section, we describe changes in (1) the availability of ECE programs in and near districts 6 and 7 in Saint Paul and (2) participation in, and ratings from, the Parent Aware rating system. We also show the geographical span of ECE programs selected by families to enroll their children using the scholarship funds. ECE programs and providers could enroll in Parent Aware beginning in the summer and fall of 2007. (A separate evaluation of Parent Aware, funded by MELF, is being conducted by Child Trends).52 We present total supply of Parent Aware-rated programs by their quality ratings and by the number of slots available (vacancies) in each program in 2008, 2009, 2010, and 2011 to show how the supply and quality changed in these specific pilot areas.
To describe the supply of ECE programs and slots in the pilot area, maps of districts 6 and 7 and nearby areas that include four zip codes (55101, 55103, 55104, and 55117) are shown in Figures 43 and 44, and Appendix B. These zip codes were chosen to represent those that overlap with districts 6 and 7 defined throughout the report as in and near the pilot areas. These are areas in which we would expect that (1) parents of children with scholarship funds would seek out ECE programs because of their proximity and (2) programs would want to participate in Parent Aware in order to be available to families with scholarship funds. The maps were developed with data from NACCRRAware, a web-based dataset available from the National Association of Child Care Resource and Referral Agencies that provides public-use data about many ECE programs throughout the United States,53 and from the Parent Aware website.54
Data on supply (capacity and availability of slots) were obtained from NACCRRAware in September of each year.
Data on Parent Aware ratings were obtained from the Parent Aware website in December of each year.
Changes in the Supply of High-Quality ECE Programs in the Pilot Areas from 2008 to 2011
To examine whether the supply of ECE programs changed over the course of the Scholarship Program implementation, we analyzed the programs in and near the pilot area during the first year of implementation (September 2008) and again during the second, third, and fourth years of implementation (September of 2009, 2010, and 2011). Below we describe the overall change from 2008 to 2011.
52 Reports for the first 3 years of the Parent Aware evaluation are available on the MELF website at www.melf.org. 53 Data are available at http://www.naccrra.org/membership/naccrraware/. 54 Data are available at http://www.parentawareratings.org/.
77
The number of high-quality programs (3- and 4-star rated programs) in and near the pilot area increased more than 86%, from 2255 programs to 41. The additional programs included 9 center-based programs (3 nonprofit, 2 for-profit, 3 school-based and 1 Head Start site) and 10 family child care programs.
The total capacity of high-quality programs in and near the pilot area increased 116% (from 1,011 slots to 2,182 slots) between 2008 and 2011. Changes in capacity varied by the type of ECE program.
– For-profit and nonprofit center-based programs increased capacity by 91% (451 slots).
– Family child care programs increased capacity by 800% (112 slots), a fact which can be attributed partially to the fact that the number of high-quality family child care programs in and near the pilot area increased from one1 to 11.
– The number of slots in school-based programs for which capacity data is available increased 171%, from 204 slots in 2008 to 552 slots in 2011.
– Head Start sites gained an additional 240 slots when a fourth preexisting site in or near the pilot area became rated in Parent Aware.
The total number of available slots (vacancies) in high-quality programs in and near the pilot area increased more than 300% (from 95 to 296).The average vacancy rate (percentage of total slots that were available) across programs increased from 9% to 14% between September 2008 and September 2011. As shown in Figure 42, changes in the average vacancy rate at each time point varied by the type of ECE program.
– In 2011 there was a notable increase in percentage of available slots at every type of program.
– The average vacancy rate within family child care programs was more variable year-to-year than within center-based programs. From 2008 to 2011, the average vacancy rate at family programs bounced back and forth between about 30% and about 40%. Average vacancy rates within center-based programs remained relatively steady (between 14% and 18%) until jumping to 26% in September 2011.
– Because Head Start and school-based programs enroll children in the fall and do not typically have open slots for the rest of the year, these programs had few to no open slots at any time point.
55 Eight of these 22 high-quality ECE programs do not have capacity and vacancy data in NACCRRAware for 2008 and are not
represented in the following discussion of capacity and vacancy rates for that year.
78
See Appendix B for figures showing the geographical distribution of high-quality programs and the number of available slots at each program in September of 2008, 2009, 2010, and 2011.
Figure 42. Percentage of High-Quality Vacant Slots (Vacancies) In and Near the Pilot Area Across Time, by Type Of Program
* This category does not include Head Start and school-based programs since those programs have zero vacancy rates.
79
Changes in the Quality of ECE Programs in the Pilot Areas from 2008 to 2011
To examine whether the quality of ECE programs changed over the course of the Scholarship Program implementation, we analyzed the programs in and near the pilot area at the beginning of the Scholarship Program, during the first year of implementation (December 2008), and again during the second, third, and fourth years of implementation (December of 2009, 2010, and 2011). Data on quality were obtained from the Parent Aware ratings website.
Figure 43 and Figure 44 show the Parent Aware-rated programs (as of December 2008 and December 2011). Displayed are all the rated programs in and near the pilot area and their ratings. Although children can attend programs outside this area, the area was selected because we would expect that (1) parents of children with scholarship funds would seek out ECE programs because of their proximity and (2) programs would want to participate in Parent Aware in order to be available to families with scholarship funds. Figures 39a and 39b show the following:
The number of programs participating in Parent Aware in and near the pilot area, including those listed as being in the process of obtaining their rating, increased 40% between 2008 and 2011, from 35 to 49 programs.
The proportion of programs receiving a rating of 3 or 4, indicating high quality, increased from 85% (22 of 26 programs) in 2008 to 91% (41 of 49 programs in 2011).
– 12 programs increased their rating from one year to another, although this fact is accounted for mostly by a policy decision in 2009 that automatically changed the 10 school-based programs from 3-star provisional to 4-star ratings.56
– Head Start sites received an automatic 4-star rating because programs accredited by an approved body and Head Start programs that are in compliance with the Program Review Instrument for Systems (PRISM) can apply for an automatic 4-star rating in Parent Aware.
In 2011, 4 of 49 programs (8%) received a rating of 1 or 2. Two of these programs were family child care programs and 2 were nonprofit center-based programs.57
Between 2008 and 2011, 12 programs increased their rating, and 25 programs became rated for the first time.
In December 2011, 4 programs were in the process of becoming rated.
Five programs, which had 1-, 2-, or 3-star ratings in 2008, discontinued participation in Parent Aware before December 2011.
While there was turnover year-to-year with some programs becoming rated, dropping out, then becoming rated again, this snapshot provides further evidence that overall participation in Parent Aware has increased steadily since 2008. Family child care programs in particular have chosen to participate in Parent Aware in increasing numbers.
Between 2008 and 2011, family child care programs accounted for nearly half (48%) of the 25 newly-rated programs, and increased from representing only 4% of highly-rated programs in 2008 to more than one-fourth (27%) of programs rated highly in 2011.
56 Definitions of the four rating categories are contained in a report about the evaluation of Parent Aware conducted by Child
Trends, available on the MELF website (http://melf.us), Parent Aware Year 1 Evaluation Report. 57 In 2008, 15% (four of 26 programs) had 1- or 2-star ratings; three were family child care, one was a nonprofit.
80
Figure 43. Location of Parent Aware-Rated ECE Programs In and Near Districts 6 and 7 and Parent Aware Ratings, as of December 2008
Note: These are the 26 programs in and near the original pilot area of districts 6 and 7. Ten school-based programs that had 3-star provisional ratings on this map were upgraded to 4-star ratings in 2009 due to a policy decision, not to a measured change in quality. This change is reflected on the following map.
81
Figure 44. Location of Parent Aware-Rated ECE Programs In and Near Districts 6 and 7 and Parent Aware Ratings, as of December 2011
Note: These are the 49 programs in and near the original pilot area of districts 6 and 7. Ten school-based programs that had 3-star provisional ratings on the previous map were upgraded to 4-star ratings in 2009 due to a policy decision, not to a measured change in quality.
82
ECE Programs Selected by Children and Families with Scholarship Funds During 2008, 2009, and 2010
See Appendix B for maps of program locations in 2008, 2009, and 2010.
Between December 2008 and December 2009, the number of children participating in the Scholarship Program more than tripled, increasing from 81 to 257 children, attending 15 programs in 2008 and 47 programs in 2009.58
Of the 15 programs that children attended in 2008, 11 (73%) were in the pilot area. However, by 2010, of the 44 programs that children attended, only 20 (45%) were in the pilot area.
Another way to analyze the location of the ECE programs that children attended is to look at the percentage of children who attended programs outside of the original pilot area. In 2008, 10% of the children (8 of 81) attended high-quality ECE programs outside of the defined pilot areas. In 2009, more than one-fourth (70 of 257, 27%) attended programs outside the original pilot area. In 2010, nearly two-fifths (45 of 114, 39%) attended programs outside the original pilot area. These variations in program location may reflect mobility of families, but could also reflect the flexibility families had in choosing a high-quality program regardless of location (i.e., children could use their scholarship outside of the pilot area as long as the program was a 3- or 4-star rated program in Parent Aware).
– These changes in 2009 and 2010 also reflect changes in the catchment area for the Scholarship Program. In 2009, 30 of the 70 children (12% of the total 257) attended 7 programs in zip code 55106, which covers the Payne-Phalen pilot area that began participation in the Scholarship Program in that year. In 2010, 25 of the 45 children (22% of the total 114) attended 10 programs in that zip code.
58 In 2010, 114 of the 257 children were still participating in the Scholarship Program: 130 children from Cohort 2 had moved
on to kindergarten, 2 children from Cohort 3 had tested into kindergarten a year early, and 10 Cohort 3 children had dropped out of the Scholarship Program.
83
Elementary Schools Selected by Children and Families with Scholarship Funds During Their Kindergarten Year (2010 and 2011)
Figure 45 shows the location of elementary schools that children who had received scholarship funds attended during kindergarten (as of fall 2010 for Cohort 2 and fall 2011 for Cohort 3). Families of scholarship children took advantage of the many different school choices available in Saint Paul and the surrounding areas. Of the 257 children:
205 children whose choice of school was known (80%) attended 58 schools in and around Saint Paul.
– The majority of these children (80%) attended one of 30 schools in the Saint Paul Public Schools district (SPPS). Of the 165, 36 children attended one of seven neighborhood schools and 129 children attended one of 23 magnet or citywide schools.
– Ten percent of the children attended one of 17 schools in other public school districts.
– Nine percent attended 1of 11 charter, parochial, or other schools.
– 46% of the children attended an elementary school in the pilot area.
One-fifth (51, 20%) of the scholarship children had moved out of the Saint Paul area or were unreachable when we collected school information.
One family chose to have their child continue to attend preschool for an additional year.
Although scholarship children attended a total of 58 schools, the distribution was uneven.
Nearly a third of the children (30%) attended one of only four schools (7% of schools). All four of the schools were in SPPS, and were located in the pilot area.
The other 54 schools (93%), each had fewer than 10 scholarship children in attendance.
– The majority of these schools (50, 90%) had fewer than 5 children in attendance, and nearly half (24, 44%) had only 1 scholarship child in attendance.
84
Figure 45. Location of Elementary Schools Selected by Children and Families with Scholarship Funds During their Kindergarten Year (2010 and 2011)
Note: The number inside each marker is the number of scholarship children who attended each elementary school. This map represents the 205 scholarship children whose school choice was known, across 58 schools.
85
Elementary Schools Selected by Children in the Comparison Group During their Kindergarten Year (2010 and 2011)
Figure 46 shows the location of elementary schools that children in the comparison group attended during kindergarten (fall 2010 or fall 2011). Of the 189 children in the comparison group:
186 children whose choice of school was known (98%) attended 48 schools in and around Saint Paul.
– The majority of these children (87%) attended one of 29 schools in SPPS. Of the 161, 50 children attended 1 of 9 neighborhood schools, and 111 children attended 1 of 20 magnet or citywide schools.
– Five percent of the children attended 1 of 7 schools in other public school districts.
– Eight percent attended 1 of 12 charter, parochial, or other schools.
Three of the families (2%) did not indicate their selected school on the consent form and were unreachable for follow-up.
Although the children attended a total of 48 schools, the distribution was uneven.
More than half of the children (51%) attended one of only seven schools (15% of schools). All seven of the schools were in SPPS, and all but one had worked with us directly to recruit families into the study.
The other 41 schools (85%) each had fewer than 10 comparison children in attendance.
– Nearly half of these schools (18, 44%) had only 1 comparison child in attendance.
86
Figure 46. Location of Elementary Schools Selected by Families of Children in the Comparison Group During their Kindergarten Year (2010 and 2011)
Note: The number inside each marker is the number of comparison group children who attended each elementary school. This map represents 186 comparison group children whose school choice was known across 48 schools
87
Summary of ECE Program Supply and Quality
Data showing families’ selection of ECE programs over time and ECE programs’ participation in Parent Aware provide a window into the market forces that are operating in the pilot area.
Figure 47 shows a summary of changes in supply, including the following:
At baseline in 2008, 221 programs were licensed to provide care in and near the pilot areas. Prior to the Parent Aware Rating system, the only indicator of quality was licensure, which provided information only about whether the program was compliant with very basic health and safety standards. We used this number as a proxy for available programs that were eligible to participate in Parent Aware and subsequently enroll children with scholarship funds if the program was deemed high quality.
In September 2008, 22 programs were deemed high-quality and had 95 available slots to accommodate children with scholarship funds. In September 2011, 41 programs were deemed high-quality and had 296 available slots to accommodate children with scholarship funds. Thus, approximately 10 to 20% of possible ECE programs (N = 221) in and near the pilot areas were participating in Parent Aware at that time.
High-quality ECE program supply (as defined by the number of programs) increased over 4 years of the Scholarship Program implementation, with family child care programs increasing the most.
ECE programs’ participation in Parent Aware increased from 2008 to 2011.
Other findings indicate the flexibility in families’ choices of programs at which to use scholarship funds (i.e., families could use the scholarship funds in any high-quality program). In 2008, 10% of families were using the scholarship for programs outside of the pilot area, compared to 27% in 2009 and 39% in 2010. 59
59 The percentage for 2010 includes only Cohort 3 children whose ECE program was known (n = 114), since Cohort 2 children
no longer attended ECE programs.
Figure 47. Changes in Number of High-Quality ECE Programs in the Pilot Area, from 2008 to 2011
88
Findings: ECE Program Costs and Uses of the
Scholarship Program
Part of the Saint Paul Early Childhood Scholarship Program evaluation included an analysis of the costs associated with providing a high-quality early childhood education and an analysis of how the pilot programs used the scholarship funds. This section addresses these two aspects of the evaluation (also described in the previous Annual Report).
Costs Associated with Providing a High-Quality ECE Experience
To examine cost data, SRI International contracted with RAND Labor and Population to collect and analyze program expenditure data of programs participating in the Scholarship Program.60 RAND conducted in-person semistructured interviews with program directors. Twelve of the 47 sites that had received scholarship funding during the program implementation were selected as the sample.61 The programs were selected to represent the variety of types of programs that have received scholarship funds. Specifically, the sample was selected to include each type of participating program—family child care programs, for-profit and nonprofit centers, Head Start, and public school preschools—and each type of program structure—full-day and half-day programs that operate year-round or for the academic year. These 12 programs collectively served two-thirds of the total children whose families received a scholarship in 2010.
Information was gathered using a modified version of the resource cost model approach62 and included information about each site’s expenditures, staffing, program structure and other in-kind resources such as volunteer hours, donated supplies, or subsidized building space. Data were also gathered regarding each site’s services. Services and program features varied across the 12 sites, from hours of operation to the types of services available, such as transportation, vision and hearing screening, mental health consultation, literacy coaching, and other services. Total enrollment capacity for each program site ranged from fewer than 20 to over 100 children.
These data, together with information regarding revenue sources for each of the sites (scholarship payments, government subsidies, donations, parent fees), were analyzed using a modified version to understand the costs involved with serving a child at each of the various types of programs and the revenue sources. The following is a summary of findings regarding costs and site features:
60 For more information, refer to the RAND Labor and Population technical report, and the RAND Labor and Population
research brief, available at http://www.rand.org/pubs/technical_reports/TR947.html and http://www.rand.org/pubs/research_briefs/RB9581.html.
61 In total, 33 programs received scholarship funding. Some programs provided ECE services at multiple sites, bringing the total number of sites to 47.
62 The resource cost model approach accounts for the value of all the “ingredients” or resources used to provide the program’s services, including ingredients that incur cash costs (e.g., paid staff, rent, and utilities), as well as ingredients that are provided in kind (e.g., volunteer labor, donated space, or subsidized utilities).
89
The cost for serving each child ranged from $7,010 to $25,603 per year (based on full- time enrollment, which varied in definition based on each site’s hours of operation). Hourly per child costs ranged from $3.47 to $19.06 per hour. Family child care programs and for-profit center-based programs had the lowest costs, and nonprofit center-based programs, Head Start, and public school-based programs had the highest costs, with half-day Head Start centers and half-day public school-based programs having the highest per hour per child costs.
The majority of cost differences between family child care programs and for-profit center-based programs, and nonprofit center-based programs, Head Start, and public school-based programs, respectively, were attributable to differences in the number of nonclassroom staff employed at each site. The Head Start, public school centers, and nonprofit centers were more likely to provide a wide range of services such as parent coaches, parent coordinators, or other services, resulting in higher per child costs.63
The following is a summary of the revenue sources:
At least half of the children enrolled at each of the 12 sites were receiving financial assistance.64 In contrast, a 2006 survey of child care programs in the metro area found that 10% of enrollees qualified for the state’s child care assistance program (Policy Studies Inc., 2006). Thus, the 12 programs surveyed served a poorer-than-average population.
Most of the sites relied on scholarship funds, government subsidies, donations, or other forms of support for the majority of their revenue, with only one site deriving the majority of its revenue from parent fees (Table 10).
Nine out of twelve of the sampled sites were receiving scholarship funds at the time the data were gathered; of these sites, scholarship funds accounted for one to 79% of total revenue.
63 For a full breakdown of costs and program features, refer to the RAND Labor and Population technical report, and the RAND
Labor and Population research brief, available at http://www.rand.org/pubs/technical_reports/TR947.html. 64 Financial assistance could include government subsidies such as CCAP funds, or other forms of assistance.
90
Table 10. Sources of Support for Sampled ECE Sites Participating in the Saint Paul Early Childhood Scholarship Program
Family Child Care
Homes For-Profit Centers Nonprofit Centers Head Start
Centers
Public Prescho
ols A B C D E F G H I J K L
Share of revenue and other support (%)
Scholarship payments
79 9 1 8 36 14 4 11 0 25 0 0
Government subsidies (includes CCAP, federal funds, etc.)
21 19 76 ** 45 30 9 8 88 69 86 100
Parent fees 1 63 11 ** 9 6 42 30 0 0 0 0
Donations * 0 9 11 ** 9 50 45 51 12 6 14 0
Notes: To further protect the anonymity of the programs, they are sorted at random within their program type in this table. Support shares may not add to 100 because of rounding.
Source: Authors’ analysis of data collected from 12 programs.
* Includes grants as well as donated space and services.
** Information not available, or not available at a disaggregated level and included with another line item. The program aggregates all of the sources of support and could not report the share for the separate sources. See full report for more detail.
† Payments to part day Head Start and Saint Paul Public Schools were discontinued on September 1, 2009.
Saint Paul Early Childhood Scholarship Programs’ Use of Scholarship Funds
SRI administered a survey to the 33 participating programs representing 47 sites to obtain information on how scholarship funds were used.65 Of those programs that received a survey, 27 programs (82%) responded: Head Start (7%), for-profit center-based programs (26%), nonprofit center-based programs (48%), public school-based programs (4%), and family child care programs (15%). Below are highlights of the overall survey results:
78% of the programs used scholarship funds to enroll children from low-income households.
74% of the programs used scholarship funds to support quality improvements.
63% of the programs used scholarship funds to serve more children.
56% of the programs used scholarship funds to serve children with different demographic characteristics (e.g., children whose families had recently immigrated) than they had previously served.
48% of the programs used scholarship funds to increase the number of hours children could attend.
26% of programs noted in an open-ended comment section of the survey that the scholarship funds supported children being able to stay enrolled in high-quality programs even as family circumstances or income changed.
65 The full Brief Report can be found at www.melf.us.
91
The survey also captured the primary ways in which the scholarship funds were used (Figure 48):
About half of the programs (55%) used the scholarship funds primarily to enroll children from low-income households who would not have otherwise been able to enroll in their program.
One-third of the programs (27%) primarily used the funds to increase the number of hours children attended.
18% used the funds primarily to support quality improvement efforts.
Figure 48. Primary Uses of the Scholarship Funds by ECE Programs (n = 22)
Source: ECE Program Survey.
Data were also gathered regarding the programs’ use of quality grant funds. The scholarship
amount was based on the number of hours a child attended an ECE program (minimum of 12 hours up to 35 or more hours per week) and the type of program selected (center-based or licensed family child care) minus CCAP funds paid (as applicable). The annual scholarship amount for a center-based program ranged from about $5,000 for 12 hours per week for a school-year (36 weeks) to $13,000 for 35+ hours per week year-round. The annual scholarship amount for a family child care program was $9,360 for 35+ hours per week.
The scholarship funds were divided into two main parts: tuition payment (equal to the amount private-pay families are charged) and quality grant. The amount of a quality grant fund was the difference between the scholarship amount and the tuition amount. No family co-payment was charged except in a relatively few cases where ECE programs charged tuition that was more than the scholarship amount. Publicly funded programs like Head Start and Saint Paul Public Schools did not receive quality grant funds, as tuition payments equaled the scholarship amount.66 Thus, 26 of the 41 sites (62%) reported receiving quality grants during fiscal year 2009–10 (Figure 49).67
66 Head Start used scholarship funds to support full day, year-round services and programming for children attending their full-
day sites. Head Start also used scholarship funds to provide a summer school program for children attending their part-day
Supported qualityimprovement
18%
Increased numberof hours
27%
Enrolled childrenfrom low-income
households55%
92
The following is a summary of how programs used the quality grants:68
58% of the programs used quality grant funds to purchase books and toys or provide enrichment activities, such as tutoring, to improve the learning environment.
46% of the programs used the funds to support ongoing operations, including staff salaries, supplies, and taxes.
33% of the programs used the funds to purchase curriculum and assessment tools.
21% of the programs used the funds to cover the tuition for nonscholarship children.
Of note, the programs’ use of quality grant funds mirrored some of the quality indicators set
forth by Parent Aware. In order to qualify as “high-quality,” a program had to obtain at least 3 out of 4 possible stars. In evaluating programs, Parent Aware looked at four categories: family partnerships (evaluate how well programs communicate with and prepare parents for their child’s transition); teaching materials and strategies (look at overall environmental quality, teacher-child interactions, and whether a program uses evidence-based curriculum); tracking learning (looks at whether programs use research-based assessment tools to assess children and whether the programs inform parents of the results and set goals); and teacher training and education (look at education levels and professional development plans for a program’s staff).69 Many of the sampled programs indicated that they used the extra quality grant funds to improve their programs in ways that Parent Aware identified as consistent with quality.
sites. Saint Paul Public Schools used scholarship funds to support professional development efforts (e.g., early childhood coach to support teachers in implementing developmentally appropriate curricula).
67 One program had not spent the quality grant funds yet at the time of the survey. 68 The Scholarship Program did not prescribe how programs used the quality grant funds; how programs used the funds was at
the program’s discretion. 69 Tout, Kathryn. (2010). Parent Aware: Minnesota’s pilot quality rating and improvement system (QRIS): Key findings from
the year 3 evaluation report [PowerPoint presentation slides]. Retrieved from http://www.melf.us.
93
Figure 49. Uses of Quality Grant Funds by ECE Programs at Sites (n = 26 sites)
Source: ECE Program Survey.
Perceived Benefits of the Scholarship Payment Process
Programs provided ratings that showed perceptions of the relative benefits of scholarships, private payments, and CCAP payments as funding methods (Figure 50).
All programs viewed the scholarship payment method more favorably than the CCAP method.
– Almost all programs (89%) viewed the scholarship payment method as minimally disruptive to services compared to only 70% for private payments and 63% CCAP payments.
– The scholarship payment method was also seen as a better way to support continuity of care (i.e., allow children to stay enrolled in high-quality programs even as family circumstances or income change).
– The CCAP payment method was viewed by programs as a challenging system for both their families and for program administrators to navigate. It was less likely to support full-time care (65%) compared to scholarship (74%); and it was the least likely to cover child’s expenses (57%) compared to scholarship (74%) and private payments (65%).
Purchase curriculum/assessment tools
33
Support professionaldevelopment activities
29
0 20 40 60 80 100
Provide more opportunitiesfor family involvement
Increase teacher/staff pay
Pay for building improvements
Purchase large equipment
Pay for tuition ofnonscholarship children
Support ongoing operations(including paying taxes)
Purchase books, toysand/or enrichment programs
58
46
25
21
17
13
13
Percent of funds being used
94
– Respondents also were less likely to report that payments were made on time for CCAP (67%) compared to scholarship (93%) and private payments (74%).
Figure 50. Reported Benefits of Scholarship Funds by ECE Programs (n = 27 programs)
Source: ECE Program Survey.
0 20 40 60 80 100
CCAP paymentsPrivate paymentsScholarship payments
Provide support for qualityimprovement efforts
Payments are madereasonably on time
Easy for parents/families to use
Able to supportcontinuity of care
Parents are satisfied
Paper work/administrativeprocesses are minimally
disruptive to services
Provide support fortransportation costs
Adequate to coverchild's expenses
Adequate to supportfull-time care
7463
65
74
65
57
41
37
26
89
70
63
85
74
70
93
70
70
81
74
67
74
67
93
85
63
56
Percent of programs reporting “Very” or “Somewhat True”
95
Summary of Cost Study
As described above, the costs associated with providing a high-quality ECE experience varied widely from site to site, with Head Start and public school-based centers having the highest annual cost and hourly costs per child. RAND attributed these differences at least partially to the increased number of nonteacher staff available at Head Start and public school-based centers. Of the sampled sites, revenue sources also varied widely, but overall, at least half of the students served by the 12 sites were low-income, a fact consistent with the finding that most of the sites relied heavily on scholarships, donations, and funds other than parent fees to support their programs.
Programs used the scholarship funds in multiple ways, but primary uses included increasing enrollment and improving quality: enrolling children from low income homes (55%), extending hours (27%), and improving program quality (15%). Quality grant funds, in particular, were often allocated to expanding access for low-income children or quality-improvement measures, such as improving the learning environment (58%), purchasing curriculum and assessment tools (33%), and covering the tuition for nonscholarship children (21%).
96
Findings: Focus Group Data About Perspectives
of Participating Parents
In this section, data from focus groups with participating parents that were held in Years 2, 3, and 4 (2009, 2010, and 2011)70 are summarized to address three major questions:
How did the Scholarship Program empower parents?
Because of the Scholarship Program, were parents able to make more informed decisions about the quality of early care and education for their children?
What was learned about the implementation and effectiveness of the Scholarship Program from participating parents?
– How were the three Scholarship Program interventions implemented (i.e., parent mentoring, receipt of scholarship funds and attendance in high-quality ECE programs, and program participation in the Parent Aware71 program rating system)?
– What factors did families identify that facilitated enrollment and participation in the Scholarship Program?
– What factors did families identify that served as barriers to enrollment and participation in the Scholarship Program?
– How did scholarship-eligible families choose ECE programs for their children? Were parents using Parent Aware to inform their decisionmaking in selecting an ECE program for their child?
– What did parents identify as the benefits of participating in the Scholarship Program for them and their children?
– From the parents’ perspectives, did children who participated in the Scholarship Program enter kindergarten better prepared to be successful in school?
Focus Groups Samples
Four focus groups with parents of participating children were conducted in Years 2, 3, and 4 of the evaluation, held at different ECE program sites. Each focus group lasted about 1 hour and included a range of parents whose children were using scholarship funds to attend the ECE program.
70 Additional information about parent focus groups is contained in the previous two Annual Reports and a 2011 Brief Report,
including the logistics and protocols used. 71 Some parents may know the name of the rating system as Parent Aware, or may use the Parent Aware website, while other
parents may know about the rating or stars associated with ECE programs more generally, but do not know that the system is called Parent Aware.
97
In Year 2, between late May and early August 2009, SRI staff conducted four focus groups at three different ECE program sites.
Parents of all ethnicities and language groups were invited to attend, though all final participants were comfortable speaking in English and did not require interpreters.
Group size ranged from 5 to 9 parents, for a total of 27 parents or relatives representing 25 families.
Most parents had 4-year-old children who had been in the program about a year.
In Year 3, between August and November 2010, SRI staff conducted four focus groups at four different ECE program sites in either English or Karen. Group size of the four focus groups ranged from 2 to 7 parents, for a total of 19 parents or relatives representing 18 families.
At three of four programs, parents had 4-year-old children who had been in the Scholarship Program for about 1 year. Parents at the fourth program had children who were a year older and were starting kindergarten in fall of 2010. Thus, the 2010 focus groups included more parents/families from Cohort 3 than Cohort 2.
Parents of all ethnicities and home language groups were invited to attend. Parents at one focus group required a Karen-speaking interpreter, but all parents at the other three focus groups were comfortable speaking English and did not require interpreters.
Group size ranged from 2 to 6 parents, for a total of 18 parents or relatives representing 18 families.
In Year 4, between June and August 2011, SRI staff conducted four focus groups at the Rice Street Public Library that were open to any parents whose children used Scholarship funds to attend a high-quality ECE program.
Two focus groups were with parents whose children had participated in the Scholarship Program, attended a high-quality ECE program for an average of 2 years, and had completed their first year of kindergarten in spring 2011 (i.e., Cohort 2 children who began their program participation in September 2008 and will be referred to as kindergarten families/children throughout the findings).
Two other focus groups were with parents currently using scholarships to attend an ECE program and scheduled to enroll in kindergarten in September 2011 (i.e., Cohort 3 children who began their program participation in September 2009 and will be referred to as ECE families/children).
Parents of all ethnicities and home language groups were invited to attend. However, all final participants were comfortable speaking English and did not require interpreters.
Group size ranged from 3 to 9 parents, with a total of 19 parents across the four focus groups representing 18 families.
Participants included 7 parents of children who had completed kindergarten in spring 2011 (kindergarten parents) and 12 parents of children who will be starting kindergarten in fall 2011(ECE parents).
98
Key Parent Focus Group Findings
The focus group findings are organized around the questions that parents answered, summarized across all 3 years. For those parents with children in kindergarten in Year 4, several additional questions were asked.
How did parents hear about the Scholarship Program?
Parents learned about the Scholarship Program in several different ways.
Common sources of information about the program included a letter from the mayor’s office describing the program, from staff members at the child’s preschool program, from staff at county offices, including public health and human service departments, and from flyers at WIC offices.
Word of mouth was another way parents heard about the Scholarship Program. Several parents mentioned hearing about the program through friends, family, or coworkers.
A small number of parents mentioned learning about the Scholarship Program from a parent mentor, home visitor, or case manager.
A few parents heard about the program while taking classes through the Saint Paul Public School’s Early Childhood Family Education (ECFE) program.
A few parents reported that someone came to their home or called on the phone to tell them about the program.
Why did you choose to participate in the Scholarship Program?
For the most part, parents chose to participate in the Scholarship Program because it allowed them to enroll their children in higher-quality early care and education (ECE) programs than they could have afforded otherwise.
Compared to Minnesota’s Child Care Assistance Program (CCAP), parents described the Scholarship Program as simple to apply for, having broader eligibility criteria, requiring less ongoing paperwork to maintain their child’s eligibility status, and, as a result, providing more consistent and stable care for their child.
In describing the simplicity of participating in the Scholarship Program, several parents contrasted it with aspects of the CCAP program that were difficult for them. Examples of what parents said included the following:
– “If you’re looking for work, they [CCAP] cover fully. If you find a job, you get a transition year, but if you have a job and a low wage, there is a 2-year waiting list. How can you wait 2 years for assistance when you have a job?”
– “I hate it [CCAP] because it’s canceled monthly due to paper work. Caseworkers are always changing. The co-pay rocketed from $40 to $60. Then they said I made too much money even though my job never changed. It’s really hard because so much is not communicated back from the paperwork. When I got cut off, my kid couldn’t go to school.”
– “I don’t like that you have to turn in daily activity logs of 35 hours per week of activities or they [CCAP] shut you off. With the scholarship, you don’t have to worry about that, you can go peacefully without worry your kid will be cut off.”
99
Some parents noted that because the scholarship funds were guaranteed, participation allowed them to pursue educational and employment opportunities they might not have been able to pursue otherwise. For example, parents said the following:
– “[The scholarship] is really, really helpful. It helps me continue my education, and I don’t have any words to explain how beneficial it was for our family.”
– “The scholarship was for me, too. I put my daughter in school and I was able to go to school to improve my English too.”
– One parent described that she was in school and not working enough hours and so was not eligible for CCAP, but could now further her education and training. She noted how much she appreciated the Scholarship Program because it allowed her to stay in school and have her child attend a high-quality program at the same time, adding that “the county [referring to CCAP] is not as dedicated to helping parents and kids.”
Parents also reported that participation in the Scholarship Program relieved parental stress related to the financial pressures of paying for child care, paperwork, and concerns about child care quality. For example, parents said the following:
– “[The Scholarship Program] helped me so I could go to work and not worry that my kids are at someone’s house and I don’t know what she’s doing. I am worry-free now and I can focus on working so that I can pay my bills.”
– “[A benefit of the Scholarship Program] is peace of mind, not having to worry about stuff…just peace of mind, based on not having to deal with county assistance and CCAP; that’s critical. [I don’t have to] turn in all this paperwork. Nobody is hounding me.”
– “[The Scholarship Program] is like an angel from heaven to help me. I just got divorced and had no way to send my little princess to day care. That letter somehow jumped on my doorstep and she got in the Program, no worries. I send her to daycare, well, not just to daycare. She is learning. She is ready for school.”
Many parents commented that the scholarship funds allowed them to access a full-day high-quality program for their child (particularly common from the Year 3 focus groups in which all four programs offered full-day ECE programming and for parents who worked).
– Some parents commented that the alternative was to find a half-day program like Head Start and use CCAP if they could manage it.
Many of the parents answered the question in terms of how they chose the ECE program their child was attending rather than why they chose to participate in the Scholarship Program. When we asked where their children would be if they did not have the Scholarship Program, many parents described a less desirable, alternative child care arrangement.
One parent said, “[My child would be] in someone’s basement, watching TV all day with 10 other children.” That was what the parent could afford. One other stated that “he’d be at home running around all day” and another stated that the child would “being passed around from friend to friend.”
100
How did the Scholarship Program help your child?
All parents described benefits of participation in the program for their children, including exposure to school readiness skills such as reading, writing, counting, identifying colors and shapes, and learning manners and how to follow rules, as well how to interact with other adults and children and how to behave in social situations. For example, parents said the following:
– “If my son didn’t get this, he would be behind when he got to kindergarten. But he is very ready now.”
– “Our child didn’t speak at 2 years old. We didn’t teach him how to speak because we were tired when we came home from work and didn’t pay attention to him. When he got into school, he still did not know any words, not even in our home language. But he then started getting words because friends at the [pre]school communicate and he talks a lot more. Without [the scholarship] he would watch Curious George and not talk.”
– “Our son is the only child at home and he didn’t know other kids his age. He learned a lot in preschool. Also helped him build a personality. He is now ready for kindergarten.”
– “My kid developed a lot. I thought he was going to be slow because he was quiet. But now he’s one of the top on the assessments. He knows a lot.”
– “I can see the benefit when I compare my older and younger daughters. The first one didn’t get a scholarship. She cannot read at the same level as the younger daughter [who did get a scholarship]. My younger daughter learned more things.”
When asked where their children would be during the day if they did not have the Scholarship Program, most parents said that the child would likely be at home (e.g., “home watching TV”) or with friends or relatives (e.g., “bounced around wherever we could find care”).
– One parent said, “We are grateful for the opportunity and wish everyone could have a scholarship—so children won’t stay at home and watch soaps with mom all day.”
How did you choose an ECE program for your child?
Nearly all parents described that the process of finding an ECE program was easy.
Parents relied on a variety of sources of information to make informed choices in selecting an ECE program.
– Parents described using “star ratings” to make informed choices. Most parents received a printed list of ECE programs with star ratings. Only a few parents, however, reported using a website to check the ECE program quality.
– Many parents knew which program they wanted their child to attend because the child’s sibling had attended previously, they had recommendations from other parents, or they had heard about the ECE program’s reputation.
– Some parents visited ECE programs before choosing a program for their child.
– Parents wanted their children to attend high-quality programs that offered a “school-like setting” that were staffed by “professionals trained to teach” academic and social skills.
101
– Some parents looked for a program with a low staff to child ratio.
– A few parents described characteristics related to the ECE programs’ philosophy as important in their decisionmaking (e.g., Montessori, Head Start, Christian, or inclusive).
– Additional factors that parents took into consideration when choosing an ECE program included location, transportation, hours of operation (including the provision of full- or half-day programs), and a sense of safety.
All of the parents knew that their children attended a high-quality, “star-rated” ECE program and understood that the Scholarship Program required that the ECE program selected was of high quality.
How was Parent Aware helpful to you?
Across all 3 years, few parents had heard of Parent Aware, and only a few of them had used the website.
– One mother who used the website said, “It was a great guide. The site did all the research for you, broke it down by stars. It’s less research that we [parents] have to do.”
Although name recognition for Parent Aware was low among the focus group participants across all years, many parents provided comments about their child’s program’s star rating and thus were aware of the quality rating system.
– For example, one parent said, “The stars were great. They made me sure that a school will make a child ready.”
How did your parent mentor help you?
While the number of home visits by parent mentors and how they helped families varied considerably, the majority of parents reported that they had worked with a parent mentor at least once.
Regardless of the number of parent mentor home visits received, most of the parents expressed strong positive opinions about the parent mentors, noting that they were beneficial to their children and families. Further, all parents commented that they were saddened that the parent mentor component had been cut in Year 3.
– Many parents described the books and other materials (e.g., backpacks, crayons) provided by parent mentors that they said were helping their children “learn their letters,” “write their names,” and “be ready for school.”
– One parent said, “[The mentor] came to the house and brought gobs of books, brought copies of the alphabet and colors. We really enjoyed it. My child got introduced to reading. We didn’t have books at home and it’s hard to get to the library. But with books at home, she can read.”
Some parents described how parent mentors helped them at first with parenting concerns that were higher priorities than finding an ECE program.
– For example, one parent eloquently described how the parent mentor worked with her to help develop better interactions with her son and how his behavior had improved considerably.
102
– Another parent appreciated the positive affirmations she received from the mentors that she and her husband were “doing a good job.”
What do you like/dislike about the ECE program your child attends?
When asked to describe what they liked about their child’s ECE program, parents described ECE program features that they either learned about the program before enrolling or observed first-hand once their child began attending the ECE program. These features included the following:
– Curriculum and early learning environments. Many parents said that they liked the ECE program because it was “like school” and was preparing their child for kindergarten (e.g., “wanted him to start to write, learn shapes and colors”). Parents liked both the academic (e.g., counting, writing, colors) and the social (e.g., getting along with others, positive behaviors) skill building; and several parents described the staff-to-child ratio as being important to them (e.g., “having two or more teachers in the room at the same time”). One parent explained that the preschool her son was attending was “very different from day care;” she said, “[My son is] learning to read and will be totally prepared for kindergarten. Day care keeps them safe, meals, and play, that’s it. They are not trained to teach them.” One parent of a child with special needs commented that having the “scholarship put her in an inclusive classroom, at the starting line like everyone else, and I can’t believe she will be in mainstream kindergarten.” One parent advocate72 explained how the child’s parents were amazed by their child’s English language skills—their son had gone from one word to full sentences in 1 year. Another parent liked the different activity centers in her daughter’s classroom.
– Caring, compassionate, and high-quality teachers and staff who their children like. Parents commonly reported qualities of the program’s staff, describing how their children liked their teachers, talked about them at home, and were eager to go to school each day. Some parents also commented that the teachers and staff were really committed to their children as they could tell from their observations (e.g., all staff knew all of the children’s names, gave children individual attention, etc.). One parent said, “We just love it there. We’re close to the teachers and the director. They really put themselves out there for the children and they make sure they’re involved.” Another parent shared her appreciation for how the ECE program staff helped her child access speech therapy services and how her child was now in an inclusive classroom.
– Parent involvement. Parents appreciated that ECE programs allowed them to visit the program and observe, and communicate with them frequently. Parents also appreciated that teachers provided feedback (including daily reports at some programs) about their children and offered suggestions for ways parents can support and be involved in their children’s education at home (e.g., “that’s what we want—to hear from the teacher about what we should do at home.”) One parent liked that her child’s ECE program offered evening and weekend parent education programs on a
72 The parent advocate was a representative for one family who did not speak English and attended the focus group on their
behalf.
103
variety of topics including positive discipline, establishing routines, and promoting child independence. Another parent liked that the program provided after-school activities for the family.
– Safety, location, hours of operation, and extra services. A few parents reported that they like qualities of the ECE structure itself including safety, cleanliness, and availability of sunlight (“e.g., it’s close to home and a safe place”). A few mentioned liking the nutritious food supplied. Other qualities parents reported liking included that the ECE program was close to their home or on their regular commute route, and that it offered hours of care that matched their schedules. A parent whose child attended a Head Start program appreciated the additional services provided and specifically liked that her daughter received dental services through the program.
In general, across all focus groups for all 3 years, parents were hesitant to describe any negative aspects of their child’s ECE program.
– The most common suggestions were that parents would have liked transportation services to be provided.
– Additionally, each of the following features of the ECE programs were identified by a few parents as qualities they would like to see changed: (1) adding more services, like Head Start, (2) removing the mandate that children must go outside every day regardless of weather, (3) spending more hours on school readiness skills and less in play, and (4) adding additional staff that speak a language other than English.
How did you choose an elementary school for your child? [Parents of kindergarten children only, in fall 2011]
Parents used multiple sources of information to choose an elementary school for their child to attend kindergarten.
– Many parents knew the school they wanted their child to attend because the child’s sibling or other family relatives had attended previously.
– Many parents based their decision on the school’s reputation for having high-quality teachers or for having the same teacher for pre-K and kindergarten.
– A few parents asked for recommendations from other parents.
– One parent reported that the parent mentor helped her make the choice.
– Parents also considered other factors in making their decisions including location, the provision of a half-day (or full-day) kindergarten class, size of the school, and the language of instruction.
– One parent reported, “I closed my eyes and picked.”
What do you like/dislike about the elementary school your child attends? [Parents of kindergarten children only, in fall 2011]
Generally, parents liked the elementary school that their child attended. Qualities of schools specifically noted included that (1) a full range of subjects were taught, (2) a schedule similar to what the child will have in later years was followed, (3) children wear uniforms, and (4) the school had a strong reputation for teaching reading and had high student reading achievement.
104
Nearly all parents commented that their child was well prepared by the Scholarship Program and their child’s ECE program to succeed in kindergarten. As a result, parents were able to describe multiple aspects of kindergarten that were easy for their child.
– One parent said, “The scholarship was a great advantage. When I think of my daughter having no preschool, I think that going into kindergarten would have been difficult. She wouldn’t have been ready and would have been behind. But she learned to count to 50, know colors, the alphabet, and multiplication. Being in a [preschool] program at an early age was a great advantage.”
– When asked about her daughter’s experience in kindergarten, one parent said, “She liked it. She made new friends. She likes her teacher and likes when the teacher teaches.”Another parent said, “She is enjoying it. She is learning a lot. Toward the end of the year, she could read and write.”
When asked about other areas of their child’s development, parents were more likely to describe social and behavioral aspects of kindergarten that were difficult for their child than they were to identify academic skills. Some children who had difficulties with social-emotional or behavioral issues in preschool or who had other special needs continued to experience those difficulties in kindergarten. But as described above, nearly all parents felt their child was well prepared for school.
Parents provided only a few examples of aspects of their child’s school that they would like to see improved.
– One parent wanted more help from the teacher on how to support her child’s learning at home.
– One parent worried about the child losing the manners she learned in preschool because the school was less structured.
– One parent said that she would prefer that her child attend a school that offers K–12 rather than only K–8.
– One parent felt that the culture of the teaching staff, and thus the teaching and disciplinary practices used, did not match that of the student and family population. She said, “Kids of color are different from suburban white kids. People at the school don’t know how to handle their problems.”
What else would you like to tell us?
During all focus groups in all 3 years, parents made a number of closing statements that suggested their universal support and gratitude for the Scholarship Program. Parents’ comments also indicated that they were aware of the importance of high-quality early education programs in supporting their children’s learning and school readiness.
A majority of parents recommended making the Scholarship Program more widely available and doing a better job at advertising it to families.
Parents made many comments about how much they value their participation in the Scholarship Program and understand the importance of high-quality ECE programs in supporting their children’s learning and development (both pre-academic and social) and school readiness.
105
– “[The Scholarship Program] helped my child a lot. I hope they don’t end it because it could help other kids. When my daughter starts kindergarten, she will be so ready. I couldn’t have asked for a better program.”
– “I would recommend the Scholarship Program to anyone.”
– “I think a lot of parents out there really need [a scholarship] and are looking for that kind of help. They don’t want their kids to be home all day watching TV and doing nothing.”
– “I think it’s crazy [the Scholarship Program] got cut. They’re cutting so much school stuff. What happened to No Child Left Behind? Think of how many are getting left behind—like kids with language barriers, kids who can’t move on because they don’t speak English.”
When asked about their messages to the legislators, the comments are best summed up in the comment of one parent: “Tell them we’re old. . .we want the next generation to be well-educated.” “They [the children] are the next legislators. . . decisionmakers. . .we want them to be good leaders.”
Conclusions
The qualitative data from parent focus groups provide important information about how parents perceive the scholarship model and its effects on their children and families. Overall, the participating parents’ comments show their enthusiastic support for the Scholarship Program and how easy it was to use, their keen understanding of the value of high-quality ECE programs for their children’s school readiness, and their grateful appreciation of the scholarship funds that allowed their children to attend high-quality ECE programs that might not have been available to them otherwise.
106
Summary and Implications
The data in this final report about the evaluation of the pilot of the Saint Paul Early Childhood Scholarship Program describe how the scholarship model was implemented and what was learned about its effects on children, families, early childhood education programs, and the targeted community (i.e., the targeted pilot areas in Saint Paul, Minnesota). A major focus of this report was the kindergarten outcomes, both within the scholarship participants and comparing scholarship children to children who did not receive a scholarship, but who were low-income and who were entering kindergarten at the same time as the scholarship children (i.e., 2010 or 2011).
Summary of Major Evaluation Findings
Implementation. With regard to implementation, the programs and agencies administering and participating in the Saint Paul Early Childhood Scholarship Program worked hard for the past four years to implement the program model with fidelity for five cohorts of children. All three interventions in the scholarship model (i.e., parent mentoring, distribution and use of scholarship funds to attend high-quality ECE programs, and the Parent Aware ECE program rating system) evolved over the past three years and through unanticipated budget crises and implementation challenges. The continuing implementation and evaluation of the Saint Paul Scholarship Program model in the pilot community in 2011, the final year of the program, yielded additional and new information about how the model operated and the impacts it had for children, families, programs, and the pilot community.
Implementation data collected across the four years of the evaluation, including in the final year, showed that the Scholarship Program participants (e.g., funders, administrators, ECE program directors, parent mentors, and parents) had positive experiences and reported many types of positive outcomes from the Scholarship Program’s implementation in their community. For example, from implementation briefs from the evaluation showed:
ECE program directors in the pilot community reported that more children from low-income families were able to enroll in high-quality ECE programs due to the availability of scholarship funds.
The scholarship implementation reported that flexibility in outreach activities and use of trusted community members to enroll families into the Scholarship Program allowed them to be successful in reaching different populations of eligible families (e.g., new immigrant groups) who may not typically enroll their children in ECE programs.
Recruitment challenges arose in the early years of the implementation which led to a recommendation for any future replications that additional time for planning and start up is needed in order to understand the community and identify and implement successful strategies to engage families and recruit them to participate in the Scholarship Program.
107
The family support and other activities of the parent mentors were highly valued and had strong support from all participants in the Scholarship Program, especially from the parents.
Starting in Year 2, most respondents who were interviewed stated that they believed that parents were positively influenced by being empowered to make different choices than they would have without the scholarship funds (mentioned by both implementers and parents).
Also starting in Year 2, most respondents who were interviewed mentioned that the Scholarship Program increased community and legislative awareness about the importance and complexity of early childhood.
In the pilot, the distribution of scholarships and the implementation of the Parent Aware quality rating system occurred simultaneously. This resulted in an early shortage in the number of high-quality ECE program slots available for children with scholarship. A recommendation for future replications was that the quality rating system should be implemented at least one year prior to beginning the distribution of scholarships to allow the rating process to begin and the supply of high-quality programs to be sufficient.
The scholarship model worked well across a variety of ECE program types (e.g., for-profit and nonprofit community-based ECE programs, Head Start and school-based ECE programs, family child care programs). However, future replications should consider more explicitly how the market-driven scholarship model can be best used by nontuition programs such as Head Start and school-based programs and how strategies to increase participation of family-based programs can be better implemented.
Focus groups conducted with participating parents in Years 2, 3, and 4 yielded rich data to demonstrate that parents were greatly appreciative and strongly supportive of the Scholarship Program, valuing its positive impacts on their children and on themselves.
For the most part, parents chose to participate in the Scholarship Program because it allowed them to enroll their children in higher quality early care and education (ECE) programs than they could have afforded otherwise.
Compared to Minnesota’s Child Care Assistance Program (CCAP), parents described the Scholarship Program as simple to use: simple to apply for; having broader eligibility criteria; requiring less ongoing paperwork to maintain their child’s eligibility status; and, as a result, providing more consistent and stable care for their child.
Many parents commented that the scholarship funds allowed them to access a full-day rather than a half-day high-quality program for their child.
All parents described benefits of participation in the program for their children, including exposure to school readiness skills such as reading, writing, counting, identifying colors and shapes, and learning manners and how to follow rules, as well as how to interact with other adults and children and how to behave in social situations.
Across all four years, few parents had heard of Parent Aware, and only a few of them had used the website.
While the number of home visits by parent mentors and how they helped families varied considerably, the majority of parents reported that they had worked with a parent mentor
108
at least once, and most parents expressed strong positive opinions about the parent mentors.
Parents had strong positive impressions of the quality of the ECE program their children attended, mentioning four major features almost universally:
– Curriculum and early learning environments that promote children’s school readiness skills;
– Caring, compassionate, and high-quality teachers and staff who their children liked;
– Strong parent involvement activities; and
– Safety, location, hours of operation, and extra services (e.g., dental services, speech therapy).
Parents universally expressed gratitude for the Scholarship Program and understood the importance of high-quality ECE programs in supporting their children’s learning and development (both pre-academic and social) and school readiness.
Parents also expressed strong support for continuing the Scholarship Program for other families.
Data about the impact of the implementation of the ECE program quality rating system, Parent Aware, to rate and monitor ECE program supply and quality showed positive changes over the four-year pilot program in the availability of ECE programs in and near the pilot community in Saint Paul and participation in, and improved ratings from, the Parent Aware rating system.
The number of high-quality programs (3- and 4-star rated programs) in and near the pilot area increased more than 86%, from 22 programs to 41. The additional programs included 9 center-based programs (3 nonprofit, 2 for-profit, 3 school-based and 1 Head Start site) and 10 family child care programs.
The total capacity of high-quality programs in and near the pilot area increased 116% (from 1,011 slots to 2,182 slots) between 2008 and 2011. Changes in capacity varied by the type of ECE program.
The number of programs participating in Parent Aware in and near the pilot area, including those listed as being in the process of obtaining their rating, increased 40% between 2008 and 2011, from 35 to 49 programs.
The proportion of programs receiving a rating of 3 or 4, indicating high quality, increased from 85% (22 of 26 programs) in 2008 to 91% (41 of 49 programs in 2011).
A cost study conducted by RAND in Year 3 yielded important data showing variations in cost per child across different program types.
The cost for serving each child ranged from $7,010 to $25,603 per year (based on full- time enrollment, which varied in definition based on each site’s hours of operation). Hourly per child costs ranged from $3.47 to $19.06 per hour.
Family child care programs and for-profit center-based programs had the lowest costs, and nonprofit center-based programs, Head Start, and public school-based programs had the highest costs, with half-day Head Start centers and half-day public school-based programs having the highest per hour per child costs.
109
The majority of cost differences between family child care programs and for-profit center-based programs, and nonprofit center-based programs, Head Start, and public school-based programs, respectively, were attributable to differences in the number of nonclassroom staff employed at each site. The Head Start, public school programs, and nonprofit centers were more likely to provide a wide range of services such as parent coaches, parent coordinators, or other services, resulting in higher per child costs.
Additional survey data were collected from ECE programs showed the following main findings about how programs used scholarship funds.
78% of the programs used scholarship funds to enroll children from low-income households.
74% of the programs used scholarship funds to support quality improvements.
63% of the programs used scholarship funds to serve more children.
56% of the programs used scholarship funds to serve children with different demographic characteristics (e.g., children whose families had recently immigrated) than they had previously served.
48% of the programs used scholarship funds to increase the number of hours children could attend.
26% of programs noted in an open-ended comment section of the survey that the scholarship funds supported children being able to stay enrolled in high-quality programs even as family circumstances or income changed.
Survey data also showed the primary ways in which the scholarship funds were used.
55% used the scholarship funds primarily to enroll children from low-income households who would not have otherwise been able to enroll in their program.
27% used the funds primarily to increase the number of hours children attended.
18% used the funds primarily to support quality improvement efforts.
Child Outcomes for Scholarship Group Children. Results from analyses of a variety of school readiness outcomes showed that children in the Scholarship Program made significant gains and improvements in their skills from entry into their high-quality ECE programs at age 3 (baseline) to one year later and again to two years later when they entered kindergarten.
Significant improvements were found for the kindergarten child outcomes for the scholarship children for seven of nine school readiness outcomes. There were significant improvements from baseline to kindergarten entry for receptive and expressive language (both p < .0001), early literacy (p < .0001 and = .008), early math (p = .04), social competence (p = .02), and attention skills (p = .04) measures.
– For the PPVT language measure, the gain of 5 points in scores after one year of ECE participation is equivalent to an effect size of .33, considered to be a moderate effect size, and the gain of 9 points across two years is equivalent to an effect size of .59, which is a large gain.
– For the Picture Naming expressive language measure, the gain of 11 points across two years is equivalent to an effect size of 1.2, which is a very large gain.
110
– For the Print Knowledge measure, the gain of nearly 9 points across two years is equivalent to an effect size of .49, which is a moderate to large gain.
– For the Phonological Awareness measure, the gain of about 5 points across two years is equivalent to an effect size of .32, which is a moderate gain.
– For the Applied Problems early math measure, the gain of about 3 points across two years is equivalent to an effect size of .23, which is a small gain.
– For the Social Competence measure, the gain of almost 4 points across two years is equivalent to an effect size of .27, which is a small gain.
– For the Attention measure, the gain of 1 point in scores across two years is equivalent to an effect size of .07, which is a very small gain.
The percentage of scholarship children with problematic scores73 decreased between baseline at age 3 and kindergarten entry for four of the nine measures.
– For the PPVT language measure, the percentage of scholarship children with low scores decreased from 56% at baseline to 37% at kindergarten entry (p < .0001).
– For the IGDI-Picture Naming measure, the percentage of scholarship children with low scores decreased from about one-third at baseline to 21% at kindergarten entry (p < .001).
– For the Print Knowledge measure, the percentage of scholarship children with low scores decreased from 30% at baseline to 18% at kindergarten entry (p < .009).
– For the Applied Problems early math measure, the percentage of scholarship children with low scores decreased from 22% at baseline to 8% at kindergarten entry (p < .001).
For three of the remaining measures, the percentage of scholarship children with problematic scores remained similar between baseline at age 3 and kindergarten entry for three scores. For one measure, girls, but not boys, showed significant increases in the number with problematic scores.
– For the Phonological Awareness measure, the percentage of scholarship children with low scores remained similar from 35% at baseline to 34% at kindergarten entry.
– For the Social Competence measure, the percentage of scholarship children with low scores remained similar for both boys (24% to 33%) and girls (23% to 29%) from baseline to kindergarten entry.
– For the Anger-Aggression measure, the percentage of scholarship children with high scores remained similar for boys (9% to 12%), but was significantly increased for girls (6% to 15%) at baseline to 18% at kindergarten entry.
– For the Anxiety-Withdrawal measure, the percentage of scholarship children with high scores remained similar for both boys (12% to 8%) and girls (5% to 10%) from baseline to kindergarten entry.
– For the Attention measure, the percentage of scholarship children with low scores remained similar from 23% at baseline to 26% at kindergarten entry.
73 Scores that were one standard deviation or more from the mean in a problematic direction (e.g., lower language or social
competence skills, higher anger-aggression or anxiety-withdrawal scores).
111
Child Outcomes for Comparison Group Children. Results from analyses comparing the same school readiness outcomes for a comparison group of entering kindergarten children showed no significant groups differences on seven of the nine child outcome measures, including for the language, early literacy, early math, and attention outcomes. On two of the behavioral outcome measures, social competence and anxiety-withdrawal, scholarship children had significantly better outcomes compared with children in the comparison group (both p < .0001).
The goal of recruiting a comparison group was to obtain a sample with entering kindergarten children from low income families in the pilot community, but who did not participate in the Scholarship Program. The data on the demographic characteristics suggest that the comparison group, while still considered a “high risk” sample, had lower levels of sociodemographic risk than did the scholarship group, a factor that would be related to children having better outcomes. As a result, the comparison group might be considered a rigorous sample (i.e., higher performing than expected) for evaluating the observed effects for the scholarship participants. Recruitment results also suggest that the comparison group families who returned signed consent forms to participate may have had other self-selection factors that limit their representativeness to the entire population of low income families. Thus, a convenience sample is not necessarily a representative sample of the population of interest. However, it may have been that both groups (scholarship and comparison) benefitted from the greater number of ECE programs rated high-quality in these communities and that one interpretation is that all children benefit from high-quality ECE programs and there are a variety of ways that children and families from low-income households access these programs.
Implications of Scholarship Evaluation Findings
Important implications from the cumulative data from the evaluation of the pilot of the Saint Paul Early Childhood Scholarship Program include the following:
The implementation data collected across the 4-year evaluation indicated that the scholarship model was implemented successfully in the pilot community suggesting that the model can be replicated in other communities.
The data showed that the Scholarship Program was well received in the pilot community and that program participants (e.g., funders, administrators, ECE program directors, parent mentors, and parents) generally had positive experiences and outcomes. Such support from the broad range of stakeholders bodes well for the scholarship model if replications are implemented. One caution, however, is that more consideration of how to implement a market-based model with ECE programs that do not charge fees (e.g., Head Start, public school-based ECE programs) is warranted.
The implementation data also indicated that the initial recruitment and start-up activities presented some challenges that might have been addressed by having a longer planning phase for the project, which could have included more planning time to work with the local community and orient them about the purposes of the project, to fine tune various procedures, and to establish the ECE program quality rating system.
The data showed that the supply of high-quality ECE programs and slots increased over the 4 years of the scholarship pilot program, and there was a steady increase over time in the number of ECE programs participating in the Parent Aware quality rating system and
112
receiving the highest quality ratings. It is likely that the combination of the availability of scholarships and the requirements that they only be used in the high star-rated ECE programs encouraged these increases in and near the pilot community.
The positive child outcomes at kindergarten entry for the scholarship children found in the evaluation adds to the considerable data showing that attending a high-quality ECE program can promote young children’s school readiness outcomes, particularly for children from low income families. Many of the scholarship children went from very low performance on the outcome measures at baseline at age 3 to near or at age level performance at kindergarten entry, most notably on language and early literacy measures as well as social competence. These are important gains as these early measures are predictive of later school achievement.
The kindergarten child outcomes for scholarship versus comparison group children showed no group differences on seven of the nine measures. Scholarship children had significantly better performance for the measures of social competence and anxiety-withdrawal. These findings are difficult to interpret for at least two reasons related to the comparability of the comparison group sample, including as follows:
– A majority of comparison group children also attended ECE programs prior to entering kindergarten and many were high-quality ECE programs.
– Fewer comparison group children came from families living in poverty and with mothers with very low educational attainment, suggesting that the comparison group was more affluent and better educated than the scholarship group, attenuating the potential intervention effects. Future replications need to consider how to implement a more rigorous causal study design (e.g., randomly assign multiple communities to scholarship versus comparison conditions because the scholarship model is really a community-wide intervention).
The Scholarship Program was successful in increasing the school readiness of the participating children from low-income families Their developmental trajectories on important language, early literacy, early math, and social and behavioral skills improved significantly from age 3 to kindergarten entry. The kindergarten outcomes data show that the scholarship children’s development and skills were at or near age level, giving them the boost from ECE program participation that will help them to be successful in school.
113
References
Barnett, W. S. (1998). Long term effects on cognitive development and school success. In W. S. Barnett & S. S. Boocock (Eds.), Early care and education for children in poverty: Promises, programs and long-term results (pp. 11-44). Albany, NY: SUNY Press.
Barnett, W. S. (2008). Preschool education and its lasting effects: Research and policy implications. Retrieved from http://epicpolicy.org/publication/preschool-education
Bernal, R., & Keane, M. P. (2006). Child care choices and children's cognitive achievement: The case of single mothers. [Working Paper WP-06-09]. Evanston, IL: Institute for Policy Research, Northwestern University.
Burchinal, M. R., & Cryer, D. (2003). Diversity, child care quality, and developmental outcomes. Early Childhood Research Quarterly, 18(4), 401-426.
Chase, R., & Valorose, J. (2010). Child care in Minnesota: Report of the 2009 statewide household child care survey. [DHS-6278-ENG 11-1]. Saint Paul, MN: Minnesota Department of Human Services.
Cross, C. T., Woods, T. A., & Schweingruber, H. (2009). Mathematics learning in early childhood: Paths toward excellence and equity. Washington, DC: The National Academies Press.
Duncan, G. J., & Brooks-Gunn, J. (1997). Consequences of growing up poor. New York: Russell Sage Foundation.
Dunn, L. M., & Dunn, L. M. (2007). Peabody Picture Vocabulary Test IV (4th ed.). Circle Pines, MN: American Guidance Service.
Early Childhood Research Institute on Measuring Growth and Development. (1998). Research and development of individual growth and development indicators for children between birth and age eight. [Technical Report No. 4]. Minneapolis, MN: Center for Early Education and Development, University of Minnesota.
Engels, J. M., & Diehr, P. (2003). Imputation of missing longitudinal data: A comparison of methods. Journal of Clinical Epidemiology, 56, 968-976.
Geoffroy, M.-C., Cote, S. M., Borge, A. I. H., Larouche, F., Seguin, J. R., & Rutter, M. (2007). Association between nonmaternal care in the first year of life and children's receptive language skills prior to school entry: The moderating role of socioeconomic status. Journal of Child Psychology and Psychiatry, 48(5), 490-497.
Gilliam, W. S., & Zigler, E. F. (2000). A critical meta-analysis of all evaluations of state-funded preschool from 1977 to 1998: Implications for policy, service delivery and program evaluation. Early Childhood Research Quarterly, 15, 441-473.
Gormley, W. T., Jr., Gayer, T., Phillips, D., & Dawson, B. (2005). The effects of universal pre-k on cognitive development. Developmental Psychology, 41(6), 872-884.
Grunewald, R., & Rolnick, A. (2006). A proposal for achieving high returns on early childhood development. Minneapolis, MN: Federal Reserve Bank of Minneapolis.
Hill, J. L., Brooks-Gunn, J., & Waldfogel, J. (2003). Sustained effects of high participation in an early intervention for low-birth-weight premature infants. Developmental Psychology, 39(4), 730-744.
114
Hubbs-Tait, L., Culp, A. M., Huey, E., Culp, R., Starost, H.-J., & Hare, C. (2002). Relation of Head Start attendance to children's cognitive and social outcomes: Moderation by family risk. Early Childhood Research Quarterly, 17, 539-558.
Huffman, L. C., Mehlinger, S. L., & Kerivan, A. S. (2000). Risk factors for academic and behavioral problems at the beginning of school. Bethesda, MD: The Child Mental Health Foundations and Agencies Network. Available at http://www.ce-credit.com/articles/95-80/riskfactorsacademic.pdf
Karoly, L. A., Kilburn, M. R., & Cannon, J. S. (2005). Early childhood interventions: Proven results, future promise. Santa Monica, CA: RAND.
LaFreniere, P. J., & Dumas, J. E. (1996). Social competence and behavior evaluation in children ages 3 to 6 years: The short form (SCBE-30). Psychological Assessment, 8(4), 369-377.
Liaw, F.-R., Meisels, S. J., & Brooks-Gunn, J. (1995). The effects of experience of early intervention on low birth weight, premature children: The infant health and development program. Early Childhood Research Quarterly, 10(4), 405-431.
Lonigan, C. J., Wagner, R. K., & Torgesen, J. K. (2007). Test of Preschool Early Literacy (TOPEL). Dallas, TX: PRO-ED.
Magnuson, K. A., Ruhm, C., & Waldfogel, J. (2007). Does prekindergarten improve school preparation and performance? Economics of Education Review, 26, 33-51.
McCartney, K., Dearing, E., Taylor, B. A., & Bub, K. L. (2007). Quality child care supports the achievement of low-income children: Direct and indirect pathways through caregiving and the home environment. Journal of Applied Developmental Psychology, 28, 411-426.
McDermott, P. A., Green, L. F., Francis, J. M., & Stott, D. H. (2000). Preschool Learning Behaviors Scale. Philadelphia, PA: Edumetric and Clinical Science.
McLanahan, S. (2005). School readiness: Closing racial and ethnic gaps. The Future of Children, 15(1).
McLoyd, V. C., Aikens, N. L., & Burton, L. M. (2006). Childhood poverty, policy, and practice. In K. A. Renninger & I. E. Sigel (Eds.), Handbook of child psychology: Vol. 4. Child psychology in practice (6th ed., pp. 700-775). Hoboken, NJ: John Wiley and Sons.
NICHD, & Duncan. (2003). Modeling the impacts of child care quality on children's preschool cognitive development. Child Development, 74(5), 1454-1475.
NICHD, & ECCRN. (2003). Does amount of time spent in child care predict socioemotional adjustment during the transition to kindergarten? Child Development, 74(4), 976-1005.
Peisner-Feinberg, E. S., & Burchinal, M. R. (1997). Relations between preschool children's childcare experiences and concurrent development: The cost, quality, and outcomes study. Merrill-Palmer Quarterly, 43(3), 451-477.
Policy Studies Inc. (2006). Cost of providing center-based child care in Minnesota. [DHS-4845-ENG 8-06]. Saint Paul, MN: Minnesota Department of Human Services.
Ramey, C. T., Bryant, D. M., Wasik, B. H., Sparling, J. J., Fendt, K. H., & La Vange, L. M. (1992). Infant health and development program for low-birth-weight, premature-infants: Program elements, family participation, and child intelligence. Pediatrics, 89(3), 454-465.
Reynolds, A. J. (1995). One year of preschool intervention or two: Does it matter? Early Childhood Research Quarterly, 10, 1-31.
115
Rolnick, A., & Grunewald, R. (2003). Early childhood development: Economic development with a high public return. The Region (Supplement), 17(4), 6-12.
Roseth, C. J., Missall, K. N., & McConnell, S. R. (2011). Early literacy Individual Growth and Development Indicators (EL-IGDIs): Growth trajectories for U.S. preschoolers without identified risk. [Unpublished manuscript]. Minneapolis, MN: University of Minnesota.
Schaefer, B. A., Shur, K. F., Macri-Summers, M., & MacDonald, S. L. (2004). Preschool children's learning behaviors, concept attainment, social skills, and problem behaviors: Validity evidence for preschool learning behaviors scale scores. Journal of Psychoeducational Assessment, 22(1), 15-32. doi: 10.1177/073428290402200102
Skibbe, L. E., Connor, C. M., Morrison, F. J., & Jewkes, A. M. (2011). Schooling effects on preschoolers' self-regulation, early literacy, and language growth. Early Childhood Research Quarterly, 26, 42-49.
Tout, K. (2010). Parent Aware: Minnesota’s pilot quality rating and improvement system (QRIS): Key findings from the year 3 evaluation report [PowerPoint presentation slides]. Retrieved from http://www.melf.usU.S. Department of Education, National Center for Education Statistics. (2011). Digest of education statistics, 2010. [NCES 2011-015].
U.S. Department of Health and Human Services, Administration for Children and Families. (2005). Head Start impact study: First year findings. Washington, DC: Author. Available at http://www.acf.hhs.gov/programs/opre/hs/impact_study/reports/first_yr_finds/first_yr_finds.pdf
Wilder Research. (2008). Early learning conditions: Low-income families in Minneapolis and Saint Paul. Saint Paul, MN: Wilder Research. Available at http://www.wilder.org/reportsummary.0.html?&no_cache=1&tx_ttnews[tt_news]=2060
Woodcock, R. W., McGrew, K. S., & Mather, N. (2001). Woodcock-Johnson III Tests of Achievement. Itasca, IL: Riverside Publishing.
Appendices
Appendix A. Saint Paul Early Childhood Scholarship Program Pilot Manual (updated August 2011)
Appendix B. Maps: ECE Program Locations, 2008 Through 2010
Appendix C. ECE Program Survey
Appendix A
Saint Paul Early Childhood Scholarship Program Pilot Manual (updated August 2011)
Page 1 12/19/2011
Saint Paul Early Childhood Scholarship Program Pilot Manual
2011
Page 2 12/19/2011
Table of Contents Background Information ………………………………………………………… 3 Eligibility and Recruitment ……………………………………………………… 5 Parent Mentoring ………………………………………………………………... 10 Scholarships ……………………………………………………………………… 18 Definition of Terms ………………………………………………………………. 27
Appendix A. Membership of Implementation Team and Advisory groups
Appendix B. Map of North End (Saint Paul Planning District 6)
Appendix C. Map of Thomas-Dale (Saint Paul Planning District 7)
Appendix D. General Scholarship Program Description for Community
Appendix E. Cost of Quality
Appendix F. Logic Model
Appendix G. Logic Model Explanation
Appendix H. Preliminary Power Analysis
Appendix I. Saint Paul Early Childhood Scholarship Pilot Cohorts
Appendix J. Annual Age Eligibility and Service by Cohort
Appendix P. Payments to St. Paul Public Schools after Sept. 1, 2009
Appendix Q. Payments to Head Start after Sept. 1, 2009
Page 3 12/19/2011
Background Information The Minnesota Early Learning Foundation (MELF) was established as a 501(c)(3) not-for-profit organization in 2005. MELF was created through a partnership of leaders from the foundation, corporate, and civic sectors to address growing concerns about the lack of school readiness among many children entering kindergarten, and the significant impact this was having now, and would have in the future, on Minnesota’s economy and quality of life. While early childhood research shows that well-focused early childhood development (ECE) investments can produce high public returns, particularly for children living in families with low income levels, questions remain about the mechanism(s) that will most effectively bring ECE to a larger scale. As part of its strategy, MELF has designed a pilot project to test the effectiveness of a market-oriented scholarship model based on a model proposed by Art Rolnick and Rob Grunewald from the Federal Reserve Bank of Minneapolis. The Scholarship Program provides scholarships to low-income families in Saint Paul’s Planning Districts 6 & 7 (see map of pilot area in Appendices B & C) to allow children to attend a high-quality Early Childhood Education (ECE) program at ages 3 and 4. Families select from area public and private ECE programs that meet quality standards set by MELF’s pilot Parent Aware rating system and program approval at the Minnesota Department of Education, or provisional rating set forth by the Minnesota legislation. The Scholarship Program also includes a parent mentoring component beginning as early as prenatal that provides families guidance on selecting an ECE program, skills and knowledge necessary to promote school readiness throughout their child’s early years, and information about health, child development, and community resources to support their family’s needs. The City of Saint Paul has included the Saint Paul Early Childhood Scholarship Program as part of its larger education initiative and will provide leadership and coordination. Through this pilot, MELF’s goal is to provide parent mentoring and/or scholarships for approximately 1,100 low-income children by 2011. Program Development Process A working group named the Scholarship Pilot Implementation Team (Implementation Team - see Appendix A for membership) met regularly for the year prior to program implementation to develop the guidelines outlined in the Scholarship Program Manual. The Implementation Team met with the Scholarship Advisory Group (see Appendix A for membership) and various other organizations, including Resources for Child Caring (RCC), Saint Paul-Ramsey County Public Health (Public Health), and the Parent Aware development team to solicit input and guidance.
Page 4 12/19/2011
The following decision values were applied in making determinations regarding policy and administration for the Scholarship Program:
• Ease of use for families • Administrative simplicity • Consistency with early childhood development theory • Consistency with economic theory
The primary content of Scholarship Program Manual is presented in the following three sections. Eligibility and Recruitment discusses the requirements families must meet in order to participate in the program and the outreach strategies recommended for informing and recruiting families into the program. Parent Mentoring presents the goals and content of parent mentoring and how to use and coordinate existing home visiting programs. Scholarships discusses ECE program eligibility, the dosage and price of scholarships, and the timing of payments made to ECE programs. Each section begins with a description of policies and activities followed by the administrative duties required to carry them out. Words in bold are included in a Definition of Terms section at the end.
Page 5 12/19/2011
Family Eligibility and Recruitment Family Eligibility Family eligibility for parent mentoring and scholarships is based on child age, residence, and income. The parent mentoring component provides home visits from prenatal through kindergarten entry. Scholarships are available from age 3 until kindergarten entry. Families’ roles and responsibilities are outlined in the application. Families that apply are required to meet the eligibility requirements discussed below. The eligibility requirements are verified once at program entry; families are not required to re-verify later in the program. Once a family is accepted, they are in the program until the child reaches kindergarten. Child age Age cut-offs for both parent mentoring and scholarship eligibility occur on September 1 of the scholarship intake year. Families eligible for parent mentoring must have a pregnant mother or child less than 1 year old on September 1 of the intake year. Parent mentoring starts on a rolling enrollment basis; once families are deemed eligible, parent mentoring will begin shortly thereafter. (See Appendices I and J for details on annual cohorts.) Families eligible for scholarships must have a child 3 years old on September 1 of the intake year. Only in the first year of the Scholarship Program do children age 3 on September 1, enroll in a program on a rolling enrollment basis. That is, once a child is deemed eligible, he or she can be enrolled in an ECE program. In subsequent years, the scholarship is applied as of Sept. 1 of that year, not on the day the child turns 3. Families must show proof of child’s age at intake. Pregnant mothers entering their child in the prenatal-age 1 cohort are excluded from this requirement. Proof of age The following documents can be used to verify child age Birth certificate • Crib Card • Passport • Consulate registration card (Matricula Consular) • I-94 Card • Immunization record • Baptismal record • Health Insurance card
Eligible children must enroll in an ECE program by either Aug. 31, 2008 during the Ramp-up Year, or by January 15th in subsequent years. See Appendix J for clarification.
Page 6 12/19/2011
Address Families must reside in Saint Paul Planning Districts 6 or 7 at enrollment of program.1 The following methods may be used to verify residence: Driver’s license State identification card Passport School identification card Birth certificate Shelter Verification form Rental lease Mortgage document Recent utility bill Verification by a Public Health nurse Selective service registration
If families move from Districts 6 or 7, they are still eligible to receive parent mentoring and scholarships provided they remain in Ramsey or Hennepin County. However, a family move from Districts 6 or 7 may result in an interruption in service if parent mentoring services and/or a scholarship-eligible ECE program are not available in the family’s new location.
Income Families living at up to 185% of the Federal Poverty Guidelines (FPG) are eligible to apply for the program. Table 1 shows the Federal Poverty Guidelines for 100% FPG and 185% FPG.
Table 1. Federal Poverty Guidelines*
Family Income Family Size
100% FPG 185% FPG
$14,570 $26,955 2
$18,310 $33,874 3
$22,050 $40,793 4
$25,790 $47,712 5
$29,530 $54,631 6
$33,270 $61,550 7
$37,010 $68,469 8 Add $3,740 for each additional family member to determine 100% FPG. Multiply this number by 1.85 to determine 185% of FPG.
* Updated annually Source: Federal Register, Jan. 2009.
1 For cohort 3 the eligibility area included city planning district 5, the Payne-Phalen neighborhood, in order to facilitate a potential increase in enrollment. However, only a few children were enrolled from this neighborhood.
Page 7 12/19/2011
Proof of Income The following methods can be used to verify income:
• Tax Form • W-2 Form • Pay Stub • Statement from Employer
Income verification will also include:
• Child Support Payments/Letter • Deductions including medical, dental, and visual insurance premiums, court-
ordered child support paid for children not living in the home, and court-ordered spousal support
Families who are currently enrolled in MFIP (Minnesota Family Investment Program) or the Minnesota Child Care Assistance Program may have RCC verify the child’s age and address through Ramsey County in lieu of sending in above documents. In addition, a photo copy from Public Health of a list that includes birth dates and addresses can be used as verification. Children in foster care Children in the foster care system are eligible to receive scholarships if the child’s foster care family is located within a pilot area. If the child’s biological parent or parents are actively working in partnership with the foster care family to provide for the child’s well-being, the application should be completed by the child’s biological parent or parents in partnership with the foster care family and county worker. If the child’s biological parent or parents are not working in partnership with the foster care family, the county may apply on behalf of the child. The income of the child’s biological parent or parents should be used to determine income eligibility. If the child’s parent is unwilling, unable or unavailable to provide proof of income, the county may be able to share this information with you as part of the welfare system, similar to the way data is shared for purposes of CCAP and MFIP. Use the number of family members in the child’s biological family to determine household size, not the foster care family. If the parent has abandoned the child and the county has no information about the family’s income level, the child’s family income should be considered $0. Service agreement Parents accepted into the program will be required to complete an application to receive parent mentoring and scholarships. The application includes expectations that a family
Page 8 12/19/2011
must follow in order to participate in the program. Note that families will only be allowed to receive a maximum of two years of scholarship. If families choose to wait an extra year to send their child to kindergarten (i.e., the child would enter kindergarten at age 6), the Scholarship Program will not pay for the additional year of scholarship. The Implementation Team reviewed service agreements from Invest Early in Itasca County and a number of Head Start centers. By completing and signing the application, families agree to the following:
• Enroll their children in a program that provides child care/early education for at least 12 hours per week.
• Select a child care/early education program that has achieved 3 or 4 stars or a provisional rating through Parent Aware, or provisional approval through the Minnesota Department of Education or Minnesota Department of Human Services.
• Give the child care/early education program a two week notice if they move or decide to transfer the child to another program.
• Meet with their assigned parent mentor on a regular basis. Population Statistics Table 2 shows the estimated number of eligible children in Districts 6 & 7 in a given year based on 2000 Census data. Note that according to recent research by Social Compact (www.socialcompact.org), the Census often underestimates the population count in urban areas. Table 2. Approximate Number of Eligible Children in Planning Districts 6 & 7 % FPG (1999 Income) Annual Total # of Eligible 3
and 4 Year Old Children 100 % 498 125% 604 175% 870 185% 924 Table 3 includes Ramsey County data from December 2006 showing a total of 467 families in the two ZIP codes encompassing most of Planning Districts 6 & 7 were receiving some form of child care assistance. Table 3. Ramsey County Child Care Assistance Data by ZIP Code* Zip Code Basic
Sliding Fee MFIP Transition Year
55103 42 100 14 55117 111 145 55 TOTAL 153 245 69 *not all families include child of 3 or 4 years.
Page 9 12/19/2011
Family Recruitment Eligible families will be identified through a number of channels. Parent mentors will serve as one of the frontline organizations for recruiting. In addition, families will be identified by hospitals, social service agencies, WIC offices, and medical clinics. In addition, information on parent mentoring and scholarships will be placed in neighborhood newspapers, community centers, and faith-based organizations. Head Start and Public schools will also be likely recruiting partners, as will Resources for Child Caring (RCC). The children currently enrolled in each of these programs, as well as the children on any of their waiting lists, could all be screened to determine their eligibility for the Scholarship Program. The Implementation Team will create relationships with other recruiting partners (hospitals, prenatal care providers, FFN providers, pediatricians, social workers, ECE programs, faith-based organizations, and other community-based organizations serving the target areas). These partners will be informed about eligibility requirements, application procedures, and program components of the Scholarship Program. Once identified, a family will complete the necessary paperwork and will be screened for eligibility into the Scholarship Program. Family Eligibility and Recruitment Administration The City of Saint Paul will implement a system for ongoing marketing of the program to families and work with the Implementation Team to create and revise the parent brochure, scholarship application, program policies, and program procedures. RCC will process applications, determine eligibility, and manage waiting lists (if needed). Below are considerations for each of these administrative tasks. Marketing The City of Saint Paul will oversee a broad ongoing strategy to make information available to parents. The Scholarship Implementation Team initially developed marketing materials to be used in each partnering organization. These materials are translated into languages most appropriate for the community. Receiving applications and determining eligibility RCC will send out applications to interested families and receive and review completed applications. If eligible, RCC will notify the family of eligibility via a letter from Mayor Coleman and communicate the next steps for the family. If a family’s eligibility is unclear or incomplete RCC will follow-up with the family to collect missing information. Waiting lists RCC will create a waiting list if needed. If a waiting list develops, families will be prioritized on a first come first served basis. A slot that opens is filled as long as the child who left is not going to be 5 years old on Sept. 1 of the current year.
Page 10 12/19/2011
Brochure for parents A parent brochure explains the parent mentoring and scholarship components of the Scholarship Program, program eligibility guidelines, and the application process. When Family Ends Scholarship Program
• Family moves outside of Ramsey or Hennepin County. • Continual non-response from family enrolled in parent mentoring. See page 21. • Continual absence from ECE program. ECE program and parent mentor will work
with the family to improve attendance, but at some point, on a case by case basis, RCC will determine the date when a child is no longer part of the Scholarship Program.
• Family chooses to exit the Scholarship Program. In each of these cases RCC will inform the family that they are no longer eligible or enrolled in the Scholarship Program.
Page 11 12/19/2011
Parent Mentoring Parent mentors visit the homes of enrolled families beginning prenatally until children enter kindergarten. The primary goal of parent mentoring is that each participating parent is provided with information necessary to select a high quality ECE program and be involved in the program’s activities and the child’s education. Secondary goals of parent mentoring include the following: 1) parents have skills and knowledge necessary to promote school readiness throughout their child’s early years (birth to 5); and 2) parents have access to community resources to support their family’s education and health needs. In summary, parent mentoring provides a continuum of contact and service prenatal-age 5 to help keep parents engaged in their children’s development and education prior to their children reaching age eligibility for scholarships (age 3) and beyond. The primary goal requires fewer financial resources to accomplish than the secondary goals; nevertheless, providing parents with information to select a high quality ECE program is central to the Scholarship Program’s logic model (see Appendices F and G). That is, without information on selecting a high quality ECE program, parents are less likely to select the best setting for their child, and parents are less likely to be as involved in their child’s educational experience.2 The secondary goals of building and enhancing parent skills to promote school readiness and access to community resources address two fundamental reasons for establishing the Parent Mentoring and Scholarship Program. First, the early years of life are essential to child brain development prior to the age of 3 when children are eligible for scholarships. The parent mentoring component is designed to improve early health, nutrition, bonding, and interactions between the child and the parents. Because of the connection to parent mentors, families who start parent mentoring prenatally or up to the child’s first birthday will hopefully be more likely to have their children enter the scholarship phase at an appropriate developmental level. Second, low-income families face barriers to participating in opportunities for their children. These barriers include unemployment, lack of transportation, chemical dependency, and mental health issues, among others. The mentoring component is not expected to address these barriers directly, but to connect the family to resources to alleviate these problems. Content Parent mentoring involves home visitors trained to work with parents of infants, toddlers, and preschoolers. Parent mentoring employs a strengths-based approach, building on family assets and involving parents in the decision-making and planning process. Mentoring services will focus on various family needs, including:
• Assistance with choosing a quality ECE program, including family friend and neighbor (FFN) care for children younger than age 3;
• Encouraging preventative health, including check-ups, immunizations, and early
2 Families eligible for scholarships can only choose among high quality ECE programs; nevertheless, parent mentors can help families make choices based on the characteristics of the ECE programs.
Page 12 12/19/2011
screenings • Education about child development, including health, nutrition and early literacy • Assisting families in accessing other community resources necessary to meet
basic needs (financial, food, etc.) Dosage The mentoring relationship includes more frequent visits during the first few months and years of a child’s life and less frequent visits as the child grows older, particularly at ages 3 and 4. In addition, an intake screening by Public Health of the family will be used to determine the necessary amount of parent mentoring. After Public Health assigns a family to a home visiting agency, the home visiting agency should meet with the family within four weeks of receiving the assignment. A family with relatively more challenges would receive more frequent visits relative to a family with fewer challenges. Ideally, a parent mentor will develop a relatively long-term relationship with a family, but when parent mentors change, a smooth transition will be planned to minimize disruption. A more detailed discussion of dosage levels for each age cohort is listed below.
Cultural Diversity Mentoring will be culturally appropriate, language-appropriate, and responsive to the unique needs of families.
Eligible home visiting programs As part of the MELF’s commitment to building capacity and leveraging existing resources rather than creating new programs, the Scholarship Program will use existing home visiting programs to deliver mentoring services to participating families. Home visiting programs submitted a response to an RFP released by Saint Paul-Ramsey County Department of Public Health (Public Health) and will enter into a contract relationship. A number of children eligible for parent mentoring in Districts 6 & 7 currently receive home visits from these organizations. The Scholarship Program will harness the resources these programs provide. Parent Mentor Training General Home visitors are trained to work with parents of infants, toddlers, and preschoolers on issues including health, nutrition, child development, and education. Home visitors include early childhood professionals and public health nurses. The Scholarship Program does not provide general training on parent mentoring. The Program does, however, provide training on the Scholarship Program components, the Selecting Quality Early Education and Care Module (see below). Home visiting programs that provide parent mentoring for the Scholarship Program should staff accordingly. Participating programs are expected to provide families with experienced, well-trained mentors.
Page 13 12/19/2011
Selecting Quality Early Education and Care Module3 The Scholarship Program does provide training to parent mentors on how to select a high-quality ECE program when their children are eligible for scholarships at ages 3 and high-quality ECE settings prior to age 3. The training includes the following elements:
• Providing parents with information about the importance of quality early care and education.
• Guiding parents on how to select quality child care using Parent Aware ratings. If parents select family, friend, and neighbor (FFN) care or an informal ECE program prior to age 3, providing guidance on elements that are important to consider.
• For families with children less than age 1 born between Sept. 2, 2006 and Sept. 1, 2007, informing parents about the scholarships that will be available when their children turn 3.
• Informing about and assisting parents in enrolling in CDBG programs/CCAP. • For parents with children ages 3 and 4, informing parents about the ECE
programs available for their children and helping parents select an ECE program. • Collecting data from home visits for Scholarship Program evaluation. • Recruiting families into the Scholarship Program based on contacts developed
through home visits. That is, parent mentors serve as on-the-ground recruiters in District 6 & 7 neighborhoods.
Staff from home visiting agencies received training on the Module and include it in their curriculum. Home visiting organizations will be compensated for delivering the Module (see Contracts section below). Foundational Mentoring Funds for Foundational Mentoring are available to home visiting agencies that provide services to eligible families not already enrolled in a home visiting agency’s program. When such a child is enrolled in the Scholarship Program, the home visiting agency serving the family will receive Foundational Mentoring funds, as listed below. The level of service (number of visits, length of visits, etc.) the home visiting agency provides for families receiving Foundational Mentoring in the Scholarship Program can differ from the level of service the home visiting agency provides as part of its program. Administration Public Health will administer the parent mentoring component, including the following tasks: Family recruitment and start time Family recruitment is outlined in the previous section of the manual. Public Health will play a strong role in recruiting families with pregnant mothers and children younger than
3 Training module developed by RCC and Minnesota Child Care Resource and Referral Network.
Page 14 12/19/2011
age 1. About half of eligible families in Districts 6 & 7 would have likely come into contact with Public Health’s home visiting program without the presence of the Scholarship Program. Parent mentors will play an on-the-ground role in recruiting families into the program for both age cohorts. An intensive recruitment process will start in the fall of each year (beginning in 2007). Some families will already be receiving home visiting. Families with children less than age 1 born between Sept. 2, 2006, and Sept. 1, 2007, will be eligible for scholarships when their children turn 3 in 2010. Therefore recruiting this particular group is a priority because the children will receive the entire continuum of services – parent mentoring and one year of a scholarship. Additional families could begin receiving home visiting during the fall. Children born after Sept. 1, 2007, will not receive scholarships unless the Scholarship Program is extended. Assigning parent mentors to families Once a family is enrolled in the Scholarship Program, a parent mentor will be assigned to the family. Public Health developed a system to determine which home visiting organization is the best match for the families entering the Scholarship Program with children prenatal to age 1 and at age 3. For all families, an intake visit will occur to assess the best match for a parent mentor and to determine the initial level of the intensity of parent mentoring required. After Public Health assigns a family to a home visiting agency, the home visiting agency should meet with the family within four weeks of receiving the assignment. For families entering the Scholarship Program with children age 3, parent mentoring will be less frequent and focus on maintaining stability and engagement with their child’s ECE program. Contracts with and payments to home visiting organizations Public Health will administer contracts with area home visiting agencies. Home visiting agencies will sign contracts to deliver the following services:
• Provide the Selecting Quality Early Education and Care Module for families currently receiving their home visiting services.
• Provide Foundational Mentoring to additional families; also deliver the Module. The payment amounts listed below will be provided on a per family basis. A home visiting agency has discretion regarding how they spread payments out over the families they provide services. That is, some families may require more resources than the given payment amount while other families may require less. Payment Amounts Selecting Quality Early Education and Care Module $400 per family annually, or $100 quarterly Frequency of visits: Either including content in the home visiting agency’s current schedule of foundational parent mentoring visits (see below) and/or adding visits to cover the content. On average, it should take the equivalent of three to four home visits to deliver the Module.
Page 15 12/19/2011
Prenatal-Age 1 • Provide parents with information about the importance of quality care. This
information will likely be more pertinent when the child is closer to age 1. • Guide parents on how to select quality child care using Parent Aware ratings. If
parents select FFN care prior to scholarship age, provide guidance on elements that are important to consider.
• For families with children less than age 1 born between Sept. 2, 2006 and Sept. 1, 2007, inform parents the child will be eligible for a scholarship at age 3.
• Inform about and assist parents in enrolling in MFIP/CCAP. (For all age groups) • Collect data from home visits for Scholarship Program evaluation. (For all age
groups) Age 1-Age 2
• Reinforce the importance of quality care. • Guide parents on how to select quality child care using Parent Aware ratings. If
parents select FFN care prior to scholarship age, provide guidance on elements that are important to consider.
Age 2-Age 3
• Same information as above and begin helping parents enroll in ECE program: • Provide parents a list of ECE programs. • Possibly make site visits with parents. • Parents select program for their child.
Age 3-Age 4
• Help families when they move to ensure they stay connected with current ECE program or move to another program.
• Encourage parent involvement in ECE program. Age 4-Age 5
• Help families when they move to ensure they stay connected with current ECE program or move to another program.
• Encourage parent involvement in ECE program. • Around the time of kindergarten enrollment, check with family to ensure they are
involved in the process. Foundational Mentoring Home visiting agencies identify children who are funded through their regular program and children who are not and therefore are eligible for Foundational Mentoring funds. Home visiting agencies will receive the following payments on a per child basis.4
4 The payment amounts listed below refer to the amount paid per child. However, there were often more than one scholarship child per family. Therefore, a reduced payment mechanism could be adopted for families with multiple children. For example, families with two scholarship children could be reimbursed at the full amount for the child with the highest level of reimbursement plus half the amount of the child with the lowest level of reimbursement.
Page 16 12/19/2011
Table 4. Budget for Foundational Parent Mentoring by Child Age Less than one $1,900 1-year-olds $1,400 2-year-olds $900 3-year-olds $400 4-year-olds $400
For each age group, visits should include the information that the home visiting agencies already provide to families. The topics listed below serve as guidelines. Prenatal-Age 1: $1,900 per family annually, or $475 quarterly Frequency of visits: Every other week to once per month Topics:
• Maternal and child health and nutrition • Child/parent bonding and interactions • Information on community resources (For all age groups)
Age 1-Age 2: $1,400 per family annually, or $350 quarterly Frequency of visits: Every other week to once per month Topics:
• Maternal and child health and nutrition • Child/parent bonding and interactions
Age 2-Age 3: $900 per family annually, or $225 quarterly Frequency of visits: Once per month to every 6 or 7 weeks Topics:
• Maternal and child health and nutrition • Child/parent bonding and interactions
Age 3-Age 4: $400 per family annually, or $100 quarterly Frequency of visits: For some families check in every 3 to 5 months, while others more
frequently, especially when child attendance slips or if the family moves.
Topics: • Coach and encourage parent involvement in child’s education at home, and
perhaps reinforce activities child participated in at the ECE program. Age 4-Age 5: $400 per family annually, or $100 quarterly Frequency of visits: For some families check in every 3 to 5 months, while others more
frequently during occasions when child attendance slips or if the family moves.
Topics: • Coach and encourage parent involvement in child’s education at home, and
perhaps reinforce activities child participated in at the ECE program.
Page 17 12/19/2011
Payment schedule Payments will be made on a quarterly basis beginning with an Advance payment to enable home visiting agencies to staff up. In order to calculate quarterly payments, the home visiting agency provides Public Health with the number of months X number of families received the Module (families that are enrolled in the home visiting agency’s program) and the number of months X number of families received Foundational Mentoring and the Module. Below is an example of a potential payment schedule. February 2007 Advance payment April 1, 2008 Payment for 1st quarter depending on
how many families are served July 1, 2008 Payment for 2nd quarter October 1, 2008 Payment for 3rd quarter January 1, 2009 Payment for 4th quarter Evaluation In working with SRI, the Implementation Team and Public Health may balance allowing flexibility in home visiting models and prescriptive elements to provide consistency for evaluation. The evaluation will look at child outcomes at age 3 to assess the effect of the parent mentoring program prior to children entering the scholarship component. Additional outcomes to measure include school readiness at kindergarten and parent involvement in selecting and participating in parent programs at an ECE program. Budget The enclosed spreadsheet allows for changing assumptions on the number of families currently served by home visiting agencies. Using conservative assumptions, the 4-year total would cost about $3.1 million, not including administration costs incurred by Public Health. Minimum number of visits for payment Home visiting programs are reimbursed based on the number of families they are serving, not on a per visit basis. Therefore, home visiting programs allocate their resources over the balance of the families they serve based on family needs. That is, some families may require more visits than others. Home visiting programs are expected to generally follow the visit frequency guidelines in the manual. The lower limits presented below denote the base number of visits required to receive payment in the quarter. If visits are less than the limit, the home visiting program can't count the family for quarterly reimbursement. Also note that after Public Health assigns a family to a home visiting agency, the home visiting agency should meet with the family within four weeks of receiving the assignment. Home visiting agencies should contact Public Health with questions regarding required number of visits.
Page 18 12/19/2011
Prenatal-Age 1 Lower limit: Program meets with family 3 times per quarter. Age 1-Age 2 Lower limit: Program meets with family 2 times per quarter. Age 2-Age 3 Lower limit: Program attempts to meet with family at least 1 time per quarter. Succeeds in meeting with family 1 time in 6 month period. Age 3-Age 5 Lower limit: Program meets with family 2 times per year. Cessation of parent mentoring by parents Parents originally sign a service agreement to participate in parent mentoring services. If a family decides to refuse parent mentoring services prior to their child turning 3 years of age, the child won't be guaranteed a scholarship at age 3. The family can apply for a scholarship when their child turns 3, but will receive one based on availability. However, if a family decides to refuse parent mentoring services after the child has enrolled in an ECE program at age 3, the refusal won't affect the child's scholarship. Families who enter during pregnancy through age 1, but drop out prior to their child’s first birthday, can be replaced with a family in the same cohort who's child is less than age 1 with permission by MELF. Families that drop out of mentoring with a child older than age 1 are not replaced. A parent mentoring agency should end service to a family if there has been no response after two months since the time of referral to the parent mentoring agency or three months after a parent mentoring agency’s last contact with a family, and three documented attempts to contact/see client using options of phone, letter and drop in visit, with one of the three attempts being a drop in visit. Mentoring agencies must notify Public Health as soon as this service ends via e-mail. Public Health will inform RCC through an e-mail and make a notation on the shared list when a family’s parent mentoring case has been closed. If the family has not enrolled in an ECE program, RCC then sends the family a letter explaining that their scholarship has been closed and that they would need to re-apply for the scholarship program. If the family has enrolled in an ECE program, scholarship funds continue to be paid to the ECE program. Total number of children See Appendices I and J for the annual number of children enrolled each year. 1,100 families will receive 1 to almost 4 years of parent mentoring.
Page 19 12/19/2011
Final consideration Home visiting services often differ based on the unique training, funding, mission, and/or capacity of an organization. Because of this service variety, agencies may not have consistent contact or coordination with other home visiting organizations. A secondary goal of this pilot is to improve coordination and learning among home visiting agencies while increasing access to parent mentoring.
Page 20 12/19/2011
Scholarships Scholarships are available to families living below 185% FPG in Saint Paul Planning Districts 6 & 7 when their children are 3 and 4 years old (see Family Eligibility and Recruitment for details). Parents may choose between a half-day and full-day ECE program for their child. Only ECE programs that meet eligibility standards can enroll children with scholarships. This section presents policies regarding ECE program eligibility, the scholarship dosage and amount, and administrative tasks.
ECE programs eligible for scholarships: To access a scholarship, the ECE program must have a Parent Aware rating of 3 or 4 or receive a provisional rating by either the Minnesota Department of Human Services or the Minnesota Department of Education. Programs must also sign a program agreement form with Resources for Child Caring (see Appendix L).
Eligible programs may include: • Private or non-profit child care centers • Licensed family child care programs • Private or non-profit preschools • Public school-based programs • Head Start programs
Location ECD program location is restricted to the Parent Aware pilot area: the City of Saint Paul, neighborhoods in North Minneapolis and Blue Earth and Nicollet Counties. However, accredited programs in the 7-county metropolitan area may apply to be a part of Parent Aware. Any of the above ECE programs may apply to participate in the Scholarship Program.
Maintaining approval status ECE programs must maintain approval status via Parent Aware. Scholarship Dosage and Amount Research doesn’t definitively set the specific amount of time per day and days per year that achieve school readiness outcomes for low-income children. Some therapeutic preschools offer intensive center-based experiences, but only a few hours per day and not all five days per week. Studies in Oklahoma, Michigan and New Jersey show that high-quality half-day programs 2 ½ to 3 hours per day, 4 or 5 days per week, demonstrate large effects on school readiness. In addition, high-quality child care programs that engage children 8 or more hours per day 5 days per week have shown positive school readiness outcomes. Research does point to the elements of a program that achieve school readiness outcomes, reflected in the Parent Aware rating too. Furthermore, high-quality ECE programs often cost more than lower quality ECE programs. For example, in order to attract and retain well-trained teachers, high-quality ECE programs may pay higher salaries.
Page 21 12/19/2011
Goals for scholarships: • Remove financial barriers to families choosing high-quality child care and early
education opportunities. • Provide resources for ECE programs to provide high-quality services that produce
improved school readiness outcomes for low-income children. • Provide incentives to the ECE market to spur new entrants and expansion among
current ECE programs.
Dosage and scholarship amounts Half-day program Eligible half-day ECE programs include private and publicly funded child care programs, Head Start and Saint Paul Public School programs that provide services 12 hours to 17 hours per week. Payment rates are tiered at two levels of service, 12 to 14 hours per week and 15 to 17 hours per week. When an ECE program applies to participate in the pilot, it declares which level(s) of service it provides. Half-day ECE programs will be paid up to $140 per week for a 12 to 14 hour program and $160 per week for a 15 to 17 hour program. All programs will be paid on a 4-week reimbursement basis. Example reimbursement set-up:
Hours per Week Weekly Rate Annual 4-week Reimbursement
12 to 14 $140 $7,280 $560
15 to 17 $160 $8,320 $640 Full-day program Eligible full-day programs include center-based and family-based child care programs, as well as half-day programs listed above that provide wrap-around care. The minimum hours of service is 35, which mirrors the minimum number of hours a program needs to provide services in order to qualify for a CCAP weekly reimbursement rate. Center-based programs will be paid up to $250 per week and family-based programs will be paid up to $180 per week. The difference in the two rates matches the difference in Ramsey County’s child care subsidy reimbursement rates between a center-based and family-based program. As described in the Manual, programs will be paid on a 4-week reimbursement basis.
Page 22 12/19/2011
Example reimbursement set-up:
35 Hours Weekly rate Annual 4-week Reimbursement
Center-based $250 $13,000 $1,000
Family-based $180 $9,360 $720 ECE programs that offer 18 to 34 Hours ECE programs that offer more than a half-day (12 to 17 hours per week) but less than a full-day (35 or more hours per week) will be reimbursed on the following scales for center-based and family-based programs. Fractional weekly hours are rounded down to the nearest hour (for example, 29.5 hours = 29 hours on the payment scale).
Center-based Programs, 18 to 34 Hours per Week
Hours
Weekly
rate Annual
4-week
Reimbursement
18 $165 $8,580 $660
19 $170 $8,840 $680
20 $175 $9,100 $700
21 $180 $9,360 $720
22 $185 $9,620 $740
23 $190 $9,880 $760
24 $195 $10,140 $780
25 $200 $10,400 $800
26 $205 $10,660 $820
27 $210 $10,920 $840
28 $215 $11,180 $860
29 $220 $11,440 $880
30 $225 $11,700 $900
31 $230 $11,960 $920
32 $235 $12,220 $940
33 $240 $12,480 $960
34 $245 $12,740 $980
Page 23 12/19/2011
Family-based Programs, 18 to 34 Hours per Week
Hours
Weekly
rate Annual
4-week
Reimbursement
18 to 23 $165 $8,580 $660
24 to 29 $170 $8,840 $680
30 to 34 $175 $9,100 $700 Scholarship Payment Schedule This subsection presents the payment schedule first for private early childhood care and education programs and then separately for Head Start programs and public school pre-kindergarten programs. Private early childhood care and education programs Scholarship funds flow directly to ECE programs and include three parts: Advance, Tuition, and Quality Grant. Advance: An upfront payment when child enrolls equal to 2 weeks of the program’s tuition. The Advance can be paid up to 2 weeks in advance of the start of a child’s participation in the ECE program. The Advance serves as a deposit to cover the last 2 weeks of a child’s tuition at the ECE program.5 Tuition: Every 4 weeks the Scholarship Program pays the ECE program the same tuition the ECE program charges private pay parents minus CCAP payments made on behalf of the family to the ECE program. For a child on CCAP, the Tuition payment covers the gap between the CCAP payments and full tuition (including family co-payment and absent day charges).6 Quality Grant: Every 12 weeks (and for the fourth payment period in the year 16 weeks) the Scholarship Program pays the ECE program a Quality Grant to enhance and maintain quality. Quality Grants are made based on the aggregate number of scholarship children enrolled at an ECE program. The formula used to calculate the Quality Grant is as follows. (4-week reimbursement rate)*(# of 4-week blocks7 of scholarship children served) - Tuition payments and CCAP payments received = Quality Grant
5 If the child is eligible for CCAP payments, the final two weeks can’t be billed for CCAP reimbursement since it is paid for with the Advance. 6 For administrative simplicity, the Pilot would make payments every 4 weeks. If a child started during the previous 4 week period, the Tuition payment would be reduced accordingly. 7 If the program has weeks that do not divide evenly into four week blocks, then the faction should be added on to the number of four week blocks (i.e., five weeks served = 1.25, 10 weeks served = 2.5, etc.).
Page 24 12/19/2011
Head Start and public school-based programs (Note: Beginning Sept. 1, 2009, Head Start and public school-based programs are no longer paid to provide preschool to children enrolled in their half-day programs and Head Start is paid at the same rates as CCAP for children enrolled in its full-day program. However, Head Start and public school-based programs are paid $50 per child each semester in their half-day programs to defray costs of providing data and facilitating visits by child evaluators. MELF made this change due to fundraising constraints during the economic downturn and since Head Start and public school-based programs had public funds available to provide these services.8 See Appendices P and Q.) Payments to Head Start centers and public school-based programs will follow the same schedule and rates as payments to private ECE programs. The Advance and Tuition payments to Head Start centers and public school-based programs will equal the maximum amount available minus CCAP payments since neither organization in general charges parents for services (although some School Readiness programs might charge a parent fee). This also means a Quality Grant will not be paid to these programs since the Advance and the 4-week reimbursement Tuition payment will equal the total scholarship amount. Reporting requirements Because Head Start centers and public school-based programs receive public funds to pay for operating costs and they are not backed out of the scholarship amount as they are for CCAP payments, both Head Start and public school-based programs are required to submit a Program Plan and a Year-End Report. (Private ECE programs are not required to submit these reports for the Scholarship Program.) The Program Plan is designed to show how these programs will use scholarship funds received that are above private pay tuition based on the number of children enrolled. The Program Plan deadline can be set after ECE programs begin providing services to children with scholarships. 1. Program Plan Head Start and Public School-Based programs are required to complete a Program Plan based on different levels of potential enrollment. The three categories of acceptable expenditure beyond private pay tuition include:
• Expand the number of children to whom services are provided. • Increase duration of services provided. Here the ECE program could expand the
amount of time children are served. • Increase current quality levels. Quality improvements include staff training,
curricula, infrastructure
8 A more nuanced approach would include paying Head Start and public school-based programs if they demonstrate that the scholarship funds are used to increase the number of openings at their programs. That is, scholarship funds do not supplant other public funding sources in providing education to scholarship children.
Page 25 12/19/2011
Principles: • Scholarship funds can benefit children who don’t have scholarships; that is, the
funds don’t have to be targeted only to children with scholarships. • Scholarship funds must be spent by Nov. 1, 2011, but can pay for improvements
that will benefit children in subsequent years. • Scholarship funds must first be used to cover any parent fees or charges.
Review:
• A Review Team that includes members the Implementation Team and MELF reviews the Program Plans and offers feedback to ECE programs.
2. Year-end Report At the end of each program year, ECE programs are required to submit a 2 to 3 page report on how scholarship funds were used in the following three areas:
• Expand the number of children to whom services are provided: How many children were provided services due to the scholarship funds compared with the number of children provided services if the ECE program didn’t receive scholarship funds)?
• Increase duration of services provided: How many children received a longer
duration of services due to the scholarship funds and for how much longer?
• Increase current quality levels: How were funds used to boost quality and which quality supports did the funds finance?
This report will be developed in cooperation with SRI to reduce duplication in data collection. Review
• The Review Team reviews the Final Report and offers feedback to ECE programs.
ECE Collaboration Programs ECE programs can work together to provide a full-day option for families. For example, a half-day preschool program may collaborate with a child care program to offer full-day services to a family. Both of the programs must have a 3- or 4-star or provisional rating on Parent Aware. Each collaboration program must offer a minimum of 12 hours/week to the child. The two programs must complete the Collaboration ECE Program Application and submit it to RCC in order to establish a payment schedule. The two programs must indicate on the Collaboration ECE Program Application how the total payments are to be split between the two programs and the fee schedule both ECE programs would charge private pay families for the same services provided. Attendance records and payments are submitted to RCC by each program separately. RCC writes two checks, one for each of the programs based on how the funds are split
Page 26 12/19/2011
between the two programs (as indicated on the Collaboration ECE Program Application). The ECE program’s private pay fee schedule is used to account for CCAP payments and determine Quality Grant amounts. Here are the steps two programs should take to offer a collaboration program:
1. Select days and hours the collaboration program is offered. 2. Determine whether the collaboration program will provide transportation between
the two programs. Scholarship funds can be used for transportation. 3. Determine how funds will be split between the two programs. For example, if the
collaboration program offers 40 hours per week total, the two programs must determine how to divide the $1,000 4-week payment. Two programs could divide the total amount between the programs based on the proportional number of hours each program provides, the private pay fees one or both of the programs charge, and/or the cost of services the programs agree to pay for (such as transportation). The programs indicate on the ECE Program Collaboration Application how to divide payments between the two programs.
RCC provides information to the City of St. Paul about collaboration ECE programs. The City of St. Paul publishes a complete list of available collaboration ECE programs on its Web site. In addition, RCC includes collaboration ECE programs.
Parent choice limited to one program Parents may send their child(ren) to two programs that are not listed as a collaboration, but may use their scholarship funds to pay for only one of those programs. However, as mentioned above, two ECE programs can work together to provide full-day services as a collaboration. Parents and parent mentors can encourage ECE programs to collaborate, but ECE programs must ultimately take the necessary steps to create a collaboration.
Child Enrollment Start Dates and Child Move For children currently enrolled in an ECE program ECE programs can enroll a child by one of these methods:
1. Provide to RCC a faxed copy of the parent’s award letter plus the hours per week the child is attending and if the child is receiving CCAP; or fax to RCC the parent’s and child’s names, the hours per week the child is attending and indicate if the child is receiving CCAP,
2. E-mail RCC the parent’s and child’s names, the hours per week the child is attending, and if the child is receiving CCAP, or
3. Call RCC; however a fax or e-mail with the above information must be sent to RCC within two weeks. Payment will not be released until RCC receives documentation.
The payment start date will be the date of the fax, e-mail, or phone call, provided the ECE program has signed a Program Agreement Form. If an ECE program has not signed a Program Agreement Form, the start date will be delayed until the ECE program has submitted a Program Agreement Form. The Advance will be sent within 2 weeks of the start date. Note that scholarship payments do not apply to fees charged or costs of service incurred prior to this date.
Page 27 12/19/2011
For children with a future start date ECE programs can enroll a child by one of these methods:
1. Provide to RCC a faxed copy of the parent’s award letter plus the hours per week the child will attend, the child’s projected start date, and if the child is expected to receive CCAP; or fax to RCC the parent’s and child’s names, the hours per week the child will attend, projected start date, and indicate if the child is expected to receive CCAP,
2. E-mail RCC the parent’s and child’s names, hours per week the child will attend, projected start date, and if the child is expected to receive CCAP, or
3. Call RCC; however a fax or e-mail with the above information must be sent to RCC within two weeks. Payment will not be released until RCC receives documentation.
The payment start date will be the date of the fax, e-mail, phone call, or child’s actual start date, whichever is later provided the ECE program has signed a Program Agreement Form. If an ECE program has not signed a Program Agreement Form, the start date will be delayed until the ECE program has submitted a Program Agreement Form. The Advance will be sent within 2 weeks of the start date indicated by the ECE program. Scholarship Tuition payments will begin after the child starts attending the ECE program, as indicated on the claim form ECE programs submit to RCC every four weeks. ECE programs that charge higher fees than scholarship payments ECE programs that charge higher fees than scholarship payments can charge parents for the difference. However, ECE programs must inform parents about the cost before they enroll in the ECE program. Child move from an ECE program ECE programs receive a 2 week notice before scholarship funding is terminated due to a child move. The 2 weeks of service is covered by the Advance. A child move is established on the following conditions:
• Family provides written notice to ECE program or RCC. • Parent mentor informs ECE program or RCC. (RCC confirms with family) • A social service agency informs ECE program or RCC. (RCC confirms with
family) • Consistent absence from ECE program. ECE program and parent mentor will
work with the family to improve attendance, but at some point, on a case by case basis, RCC will determine the date when a child’s scholarship has ended and the child is no longer enrolled at the ECE program.
Time limit for child to reenroll in an ECE program after a move Once a child has been determined to have moved from an ECE program, the family has 60 days to reenroll and have the child start attending at another or the same ECE program. If reenrollment and attending does not begin within 60 days, the child’s scholarship ends.
Page 28 12/19/2011
Payments to ECE Programs that drop out of Parent Aware ECE programs drop out of the Parent Aware system by choosing not be rerated.9 If a program chooses not to be rerated, any scholarship payments to that program stop when their rated status has concluded. The Advance payment covers the following two weeks of service to children. After the two-week period, parents have 60 days to find a new program. Payments to ECE Programs that drop below 3-stars If an ECE program’s rating drops below 3-stars, payments for scholarship children attending the program can continue if the program decides to pursue a rerating. However, new scholarship children will not be allowed to enroll in the program during the rerating process. If such an ECE program receives a rating below 3-stars after the rerating process, payments to the program stop when the new rating is assigned. The Advance payment covers the following two weeks of service to children. After the two-week period, parents have 60 days to find a new program. Note that the 60 day period is the time allowed for parents to search for and enroll their child in a new ECE program. If a child is not enrolled in a new program within 60 days, the family loses the scholarship. Recruitment and Communication with ECE Programs The Implementation Team has proposed a number of strategies to recruit ECE programs to participate in the Scholarship Program and for ongoing communication. Marketing and communication will work in conjunction with the Parent Aware pilot team, Minnesota Child Care Resource and Referral Network, and RCC. Some strategies include:
• News and forms on websites of MELF, City of Saint Paul, Resources for Child Caring, and the Minnesota Child Care Resource and Referral Network
• Joint Parent Aware and Scholarship kick-off event for ECE programs in July 2007 • Brochure for ECE programs • Site visits to eligible ECE programs (see Family Recruitment, above) • Outreach to community leaders • Informational community events for ECE programs about Parent Aware
Administration of Scholarships This section presents a number of administrative tasks regarding the scholarships that will largely be conducted by RCC. Implement recruitment and communication strategies with ECE programs These strategies will be coordinated by the City of Saint Paul, Parent Aware, and RCC.
9 As of April 2011, DHS suspended rerating programs in Parent Aware. ECE programs that would have been scheduled for review can remain eligible for scholarship payments by indicating to DHS that they intend to go through the rerating process if DHS restarts rerating programs.
Page 29 12/19/2011
Administer contracts and payments with ECE programs ECE programs sign a contract to participate in the Scholarship Program (see Appendix L.). ECE programs agree to the following:
• Declare whether program is half-day (12 to 14 hours or 15 to 17 hours) or full-day (at least 35 hours per week)
• Maintain and provide Scholarship Program daily attendance records every 4 weeks
• Maintain and provide Scholarship Program CCAP reimbursement records every 4 weeks
• Maintain approval status through Parent Aware • Provide specified child information to parent mentor as needed • MELF reserves the right to review financial records relevant to the Scholarship
payments RCC agrees to the following: (See Appendix L)
• Make Advance, Tuition and Quality Grant payments as outlined above • Provide at least two weeks notice before a child leaves the program and payment
ends
RCC developed a payment mechanism for calculating payments to ECE programs and delivering funds. The payment calculation requires an application that converts child enrollment data and program tuition rates into Advance, Tuition, and Quality Grant payments. Payments may be set up for electronic direct deposit transfer. The Scholarship Program is also responsible for determining a child move.
Page 30 12/19/2011
Definition of Terms
approval status: reached when ECE program achieves a Parent Aware rating of 3 or 4; or provisional rating from the Minnesota Department of Education or Minnesota Department of Human Services. child move: the day Scholarship Program determines a child will be or is no longer enrolled at an ECE program. City of Saint Paul – Mayor Coleman’s office is responsible for providing overall coordination of the Saint Paul Early Childhood Scholarship Program. ECE program: includes private or non-profit child care centers, licensed family child care programs, private or non-profit preschools, Saint Paul school-based programs and Head Start programs. national accreditation: An ECE program accredited through an accrediting body included in rate differential statute. Parent Aware: Provides ratings of early child care and education programs and also provides resources to programs to improve quality. The 3-year pilot of the Parent Aware Rating Tool will include licensed child care providers/early educators in five locations: Blue Earth and Nicollet Counties, the City of Saint Paul, neighborhoods of North Minneapolis, and the Wayzata School District. Accredited programs in the 7-county metro area may apply to be included in Parent Aware. http://www.parentawareratings.org Resources for Child Caring (RCC): Organization responsible for determining family eligibility, child moves from ECE programs, and administrating payments to ECE programs. Saint Paul-Ramsey County Department of Public Health: Organization responsible for administrating the parent mentoring, including contracting with existing parent mentoring organizations, assessing families, and referring families to these organizations for parent mentoring services. Scholarship Program: refers to the Saint Paul Early Childhood Scholarship Program Pilot project or administration. SRI: Organization evaluating the Saint Paul Early Childhood Scholarship Program.
Page 31 12/19/2011
For additional information, please contact: Vallay Varro Education Director Office of Mayor Christopher B. Coleman 390 City Hall Saint Paul, MN 55102 Tele: 651-266-8516 Email: [email protected]
Appendix A: Implementation Team and Advisory Groups Saint Paul Policy Implementation Team City of Saint Paul Mayor’s Office Federal Reserve Bank of Minneapolis Federal Reserve Bank of Minneapolis Minnesota Early Learning Foundation (contractor) Minnesota Department of Education Minnesota Department of Human Services Saint Paul Administration Implementation Team City of Saint Paul Mayor’s Office Federal Reserve Bank of Minneapolis Resources for Child Caring Saint Paul-Ramsey County Department of Public Health Scholarship Advisory Group Lisa Cariveau City of Saint Paul – Office of Mayor Coleman Vallay Varro City of Saint Paul – Office of Mayor Coleman Ericca Maas Federal Reserve Bank of Minneapolis Rob Grunewald Federal Reserve Bank of Minneapolis Cathy Arentsen Head Start CAP-RW Barb Yates Minnesota Early Learning Foundation Laurie Davis Minnesota Early Learning Foundation Sandy Myers Resources for Child Caring Vicki Barker Shirley G. Moore Laboratory School – University of Minnesota Sandy Heidemann Saint Paul Foundation Anne Lovrien Saint Paul Public Schools, Project Early K Deb Hendricks Saint Paul - Ramsey County Department of Public Health Kate Horst SEEDS of School Readiness (literacy curriculum) Mike Newman Travelers Foundation
Appendix B
The North End neighborhood is part of Council Ward 5
North End Planning Council (this page uses java)
http://www.stpaul.gov/maps/north2.html
Appendix C
Thomas - Dale is part of Council Ward 1
http://www.stpaul.gov/maps/thomas2.html
12/21/2011
Appendix D Saint Paul Early Childhood Scholarship Program
The Saint Paul Early Childhood Scholarship Program is a 4-year pilot proposed by the Federal Reserve Bank of Minneapolis, funded by the Minnesota Early Learning Foundation, and coordinated by City of Saint Paul Mayor Chris Coleman’s office. The Scholarship Program provides families with information and resources to help them choose, pay for, and stay in high-quality early childhood education (ECE) programs. In turn, ECE programs can use scholarship resources to increase and sustain quality programming. What services do families receive? Parent Mentoring
• Families with a pregnant woman or a child under 1 year of age receive free home visits from a parent mentor. Visits continue until the child enters kindergarten.
• Parent mentors make home visits to encourage family health, give information about child development and choosing quality child care and early education, and help families access community resources.
Scholarships
• At age 3, children receive a 2-year scholarship to pay for full- or part-time, center or family-based child care and early education services starting when a child is 3 years old. The scholarship will cover a family’s co-payments to attend the ECE program.
• Parent mentors help families choose the best ECE program for their child. Who can be in the program?
• Families who have a child who will be 3 years old on or before September 1 of the current year. Families with a pregnant woman or a child under 1 year of age may receive parent mentoring.
• Families who live in the Frogtown or North End neighborhoods. • Families who have an annual income less than 185% of the Federal Poverty Guideline,
about $38,000 for a family of four.
Families apply to the program only one time. Children who get scholarships keep them even if their family’s income changes or if their family moves (as long as they stay in Ramsey or Hennepin counties). Parents may choose a half-day or a full-day ECE program for their child.
12/21/2011
How do ECE programs benefit? 1) Financial benefit – Scholarship funds go to ECE programs selected by families. Programs will be paid the following amounts on an annual basis:
Hours per Week
Annual Amount*
12 to 14 $7,280
15 to 17 $8,320 35 hours
center-based $13,000 35 hours
family-based $9,360 *ECE programs are paid on a 4-week reimbursement basis. A 2-week advance is provided the week a child enrolls in an ECE program. 2) Continuity – Family eligibility is assessed once prior to entry into the program. If the family’s income or address changes, they still remain in the program. ECE programs eligible for scholarships: To access a scholarship, the ECE program must have a Parent Aware rating of 3 or 4 or receive a provisional rating by either the Minnesota Department of Human Services or the Minnesota Department of Education. Eligible programs may include:
• Private or nonprofit child care centers • Licensed family child care programs • Private or nonprofit preschools • Public school-based programs • Head Start programs
ECE programs must meet eligibility standards in order to enroll children with scholarships. To receive a Parent Aware rating of a 3 or 4, ECE programs must participate in the Minnesota Early Learning Foundation’s pilot of Parent Aware, a quality rating system that provides parents with information about ECE program quality and resources for ECE programs to improve their quality. Other programs must participate and reside in the Parent Aware pilot areas located in the entire city of Saint Paul, neighborhoods in north Minneapolis, and the Wayzata school district. Accredited ECE programs within the 7-county metropolitan area are eligible to participate.
12/21/2011
Total number of children Families enter the program either when a mother is pregnant up until the child is age 1 or when a child reaches age 3 on or before September 1 of the program year. About 1,100 families will receive 1 to almost 4 years of parent mentoring and/or scholarships. Estimated Number of Children Served Annual number of children Ramp-up Year Year 1 Year 2 Year 3 Jan ’08-Aug ’08 Sep ’08-Aug ’09 Sep ’09-Aug ’10 Sep ’10-Aug ’11 Less than 1 200 200 *0 *0 1-year-olds 0 200 200 0 2-year-olds 0 0 200 200 3-year-olds 100 300 300 **200 4-year-olds 0 100 300 300
*Would bring a new cohort into Pilot if funding is available to continue the program. **This cohort of children started when they were less than 1 in the Ramp-up Year. Administration The City of Saint Paul is responsible for providing overall coordination of the Scholarship Pilot project. Resources for Child Caring is the organization responsible for determining family eligibility, child moves from ECE programs, and administrating payments to ECE programs. Saint Paul-Ramsey County Public Health is responsible for administrating the parent mentoring, including contracting with existing parent mentoring organizations, assessing families, and referring families to these organizations for parent mentoring services. Who to contact if you have questions about… General project information: Lisa Cariveau, City of Saint Paul Office of Mayor Christopher B. Coleman 651-266-8536 [email protected] Parent Aware: Valerie Peterson - Minnesota Child Care Resource and Referral Network 651-290-9704 Extension 107 [email protected] or visit www.parentawareratings.org Scholarship payment/family enrollment: Resources for Child Caring 651-644-6604 [email protected] “If properly funded and managed, investments in early childhood development yield an extraordinary return, far exceeding the return on most investments, private or public.”
- Federal Reserve Bank of Minneapolis
1
Appendix E. Dosage Levels and Scholarship Prices for MELF ECD Scholarship Program Pilot July 17, 2007
This paper provides a framework to determine dosage levels and scholarship prices for the Minnesota Early Learning Foundation’s (MELF) ECD Scholarship Program Pilot in St. Paul.
Research doesn’t definitively set the specific amount of time per day and days per year that achieve school readiness outcomes for low-income children. Some therapeutic preschools offer intensive center-based experiences, but only a few hours per day and not all five days per week. Studies in Oklahoma, Michigan and New Jersey show that high-quality half-day programs 2 ½ to 3 hours per day, 4 or 5 days per week, demonstrate large effects on school readiness. In addition, high-quality child care programs that engage children 8 or more hours per day 5 days per week have shown positive school readiness outcomes.
Research does point to the elements of a program that achieve school readiness outcomes, as developed by MELF’s QRS team. Furthermore, high-quality ECD (Early Childhood Development) programs cost more than lower quality ECD programs. For example, in order to attract and retain well-trained teachers, high-quality ECD programs pay higher salaries.
This analysis considers the following two goals of the ECD Scholarship Program in forming recommendations for dosage and scholarship amounts.
1. Provide resources for ECD programs to provide high-quality services that
produce improved school readiness outcomes for low-income children.
This goal focuses on the necessary resources to achieve intended results, that is, improved outcomes for children from low-income families. A starting point is to look at prices for ECD programs that parents pay for child care or preschool. These rates are reached through the dynamics of supply and demand in the early childhood market. There are two reasons why the scholarship amount should be higher than rates charged in the market for child care and preschool, particularly for at-risk children.
First, early education produces positive externalities, or external benefits, that are not captured by participating children or their parents but rather spill over onto other members of society. Children who arrive at kindergarten prepared to succeed are more likely to attain higher achievement levels in school, require less remedial services, graduate from high school, pay more in taxes and commit fewer crimes than children who are not prepared to succeed. These benefits accrue to the public as well as participating children and their parents. Like with other positive externalities, it is likely that the value of the benefits enjoyed by the public from investments in early childhood are not included in the tuition charged to the family. The result is an undersupply of high-quality early childhood services.
Second, the external benefits to investments in early childhood are higher for children with identified risk factors, such as low-income, low parent education levels, and exposure to violence, abuse or neglect. These children are more at risk for requiring remedial education and social services and committing crime. An ECD program that successfully prepares a child from a low-income family for kindergarten achieves on
2
average higher levels of external benefits than serving a child from a middle-income or high-income family. Therefore, an efficient ECD scholarship amount for a child from a low-income family is on average not only higher than rates set in the private markets, but also higher than amounts for children from middle- and high-income families.
In addition, the costs of providing services for children who are at-risk are on average higher than children from low- and middle-income families. In other words, when tuition is only based on private benefits, average tuition is set at a level that does not support high-quality early childhood services. For example, at-risk children may require more attention by teachers and classroom assistants compared with low-risk children, and thus lower staff to child ratios.
An ECD scholarship system is intended to shift the goal, perception and function of the ECD market from a system that provides child care and education that only benefits participating children and their families, to a system with the primary goal, perception and function to ensure that all children thrive and are prepared for kindergarten, which benefits all of society. The school readiness frame includes the external benefits that everyone in society enjoys from children prepared to succeed in kindergarten.
2. Provide incentives to the ECD market to spur new entrants and expansion
among current ECD programs.
The second goal implies that the scholarship amount should be set high enough to encourage ECD programs to improve quality and expand in order to serve more scholarship children, and to encourage new ECD programs to enter the market. Directors of existing ECD programs or potential new entrants will weigh the cost of improving quality, expanding, or starting an ECD program against projected revenue from scholarships and other revenue sources over a 4-year period.
The exact number of scholarship children an ECD program will serve during the pilot time period is uncertain since parents select the ECD program for their children. However, ECD program directors can access information on the number of children with scholarships in the study area and the number of other eligible ECD programs. With this information ECD programs can strategize on quality improvement, expansion, curriculum and marketing.
The length of the pilot will likely influence the incentive of the scholarships. For example, a 4-year pilot likely provides more incentive to ECD programs to improve quality and expand than a 2-year pilot, but likely less than a 10-year pilot. Increasing the scholarship amount could mitigate the time limitation of the pilot, although the optimum level of this premium is difficult to estimate.
An additional incentive provided by scholarships is payment continuity irrespective of CCAP eligibility. CCAP eligibility often fluctuates as employment status changes among parents, and therefore payments to ECD programs can fluctuate. Once a family loses eligibility for CCAP, the family often drops out of the ECD program. The scholarship system ensures children remain enrolled and payments continue to flow despite changes in CCAP eligibility. Refer to the manual for half-day and full-day rates.
3
Detailed information on programs surveyed Half-Day Amounts ------------------------- State-Sponsored Preschool State-sponsored preschool programs are primarily for 4-year-old children and sometimes include 3-year-olds. A full-day program is about 6 to 6.5 hours per day, while a half-day program is about 2.5 to 3.5 hours per day. Programming typically runs during the school year. Often state sponsored preschool programs allow participating schools or centers to provide wrap around care that families pay for or receive child care subsidies as reimbursement. The enclosed spreadsheet provides a detailed summary of state preschool programs that allow for parent choice and often a diverse delivery system of programs, however, funding is almost always through the program, not following parent choice as in the scholarship system. ------------------------- National Institute for Early Education Research (NIEER) researchers compare the cost of providing preschool with the cost of providing K-12 education by determining salary parity for teachers; that is, the cost of preschool when teachers are paid similar salaries as K-12 teachers. They estimate that at a cost of $8,090 per low-income 4-year-old in Minnesota, cost per child in preschool would reach parity with K-12 spending. Spending for a full-day program does not necessarily cost twice the amount as a half-day program. Barnett, Steven & Robin, Kenneth. How Much Does Quality Preschool Cost? http://nieer.org/resources/research/CostOfEffectivePreschool.pdf ------------------------- In New Jersey, state preschool is required by law in some districts. A 1998 state Supreme Court ruling mandated that high quality preschool be offered to all 3- and 4-year-olds in the state’s highest poverty districts. To meet the standards set out by the Court, the state spends $9,300 per child in the Abbott program. State spending per child in New Jersey’s Abbott program is the highest in the nation and is considered by NIEER to have a high level of quality. Participants participate in either a full-day or half-day program. The annual cost for the full-day Abbott program is estimated at $11,022 during the school year. ------------------------- The Milwaukee Parental Choice Program, which began in the 1990-91 school year, provides low-income Milwaukee parents the opportunity to enroll their children in participating nonpublic schools. Eligible schools that choose to offer the half-day classes for 4-year-olds receive 50 percent of the standard state per-pupil contribution (currently $4,557) or 60 percent if the school also offers parent support.
4
------------------------- Model Programs This section includes costs for ECD programs included in model studies and examples of programs in ECD programs in Minnesota with unique circumstances. ------------------------- Perry Preschool Project The preschool program comprised a daily 2.5 hour classroom session on weekday mornings and a weekly 1.5 hour home visit to each mother and child on weekday afternoons. Children attended to 30 weeks during the year. Total cost per child annually was $10,421. I used a rough estimate that 17 percent of the cost of the program was devoted to the home visiting component of the program, therefore, total costs devoted to preschool were probably closer to $8,650. The child to teacher ratio ranged from 5 to 6.25, probably lower than needed, but set up this way so that teachers could visit the homes of their respective students. If the ratio was increased to 8, the cost would have likely dropped to about $6,185. Hourly preschool costs ranged from about $16.50 to $23.00. ------------------------- Chicago Child-Parent Program The preschool program ran 3 hours per day, five days per week during the 9-month school year, and usually included a 6-week summer program. The program also included parent activities at the center. The average cost per child annually would be $6,700 in Minnesota, according to Robert Lynch in Enriching Children, Enriching the Nation. Assuming the summer program is slightly less intensive than the school year program, hourly preschool costs are about $10. ------------------------- Abecedarian Early Childhood Intervention Participants included 111 young, at-risk, predominately African-American children living in poverty in a university city in North Carolina. Children attended from just a few months old through age 4. The curriculum emphasized cognitive, language, perceptual-motor, social, and pre-literacy skills. Families were encouraged to become involved with their children’s educational experiences. The annual cost per child is about $15,000 for infants, toddlers and preschoolers, therefore the preschool average is likely to be lower than $15,000. The per hour cost is $7.21.
5
Masse, Leonard N. & Barnett, Steven W. A Benefit-Cost Analysis of the Abecedarian Early Childhood Intervention. National Institute for Early Education Research. 2002. ------------------------- Wilder Child Development Center A high-quality full-day program in St. Paul Based on the program director’s comments, the cost per week for preschoolers is $217 ($11,284 annual cost). Average enrollment is estimated at 70 (licensed for 78, actual on 1/29 was 68) Tuition revenue/year (any source – private pay/CCAP – assume no unpaid, which is unlikely) is $767,312. In addition, Wilder subsidies the program about $400,000 per year. Including the subsidy increases the per child cost to $17,166 annually. Hourly costs without the subsidy are about $5.50; with the subsidy costs may range as high as $10, but its unclear how these dollars are allocated. ------------------------- Invest Early, Itasca County Invest Early combines private, Head Start, and state-funded school readiness dollars to offer preschool programming to low-income families in Itasca County, Minnesota. The program provides three, 6 hours days of structured preschool programming per week and offers families the option of choosing wrap around care to fill additional childcare needs. The average cost per child is $9,127. This figure does not include in-kind support provided by the local school districts. Invest Early staff estimate that inclusion of the in-kind support would push the average per child cost to $10,000 or more. Treating the preschool and wrap-around components together as a full-day program, hourly costs are about $4.80. ------------------------- Strong Beginnings Strong Beginnings was developed by Hennepin County staff and community early childhood professionals in 1992. Each Strong Beginnings child care center includes elements that research consistently confirms are needed for quality programs, including developmentally appropriate curriculum, knowledgeable teachers, small class sizes and parent engagement. There are 10 Strong Beginnings child care centers in Hennepin County. All Strong Beginnings child care centers are nationally accredited, meet program guidelines and serve at least 65 percent low-income, special needs children. From Carol Miller: Generally I would say they are about 30% above accredited rates. I know that a preschooler costs are nearly $15,000 full time for this year.
6
Hourly costs are about $7.20. ------------------------- Head Start – Ramsey County For a half-day, 4-day per week, school year program, funding tends to fall around $7,000. For a full-day, 5-day per week program the cost is closer to $11,000 to $12,000. (Washington/Ramsey County) ------------------------- Full-day amounts High quality center-based child care programs in the ECD Scholarship Program are nationally accredited or have at least a 3 rating on the QRS. The analysis and examples below help frame the cost for a full-day program. ------------------------- Tiered Reimbursement Tiered reimbursement in Minnesota pays a 15 percent premium for child care subsidies to a child care center with national accreditation. Tiered reimbursement is designed to provide an incentive to improve quality, a similar goal as the ECD Scholarship Program. In Ramsey County, the child care subsidy rate is $188.74 weekly for preschoolers, $9,814 annually. A 15 percent premium for accreditation increases the subsidy to $217.05 weekly, $11,287 annually. The MELF scholarship will exceed this amount. For comparison, a 20 percent premium is $11,776 and a 25 percent premium is 12,268. Hourly costs, Ramsey County child care subsidy rate: $4.72
15 percent premium for accreditation: $5.43 20 percent premium for accreditation: $5.66 25 percent premium for accreditation: $5.90
------------------------- Minnesota Department of Human Services. “The Cost of Providing Center-Based Child Care in Minnesota.” Prepared by Policy Studies Inc. August 2006. Based on surveys of 42 child care centers in the metro area, the median tuition charged for preschoolers was $187 per week, or $9,724 per year. Metro child care centers that serve more that 10 percent of capacity with subsidized preschoolers charged $197 on average per week ($10,244 annually) compared with $195 per week ($10,140 annually)
7
for child care centers with 10 percent or less. (I doubt the difference is statistically significant.) The study also surveyed 7 purposefully selected centers that completed similar surveys, including financial information. Two-thirds of these centers were accredited compared with just over one-third among the 86 sampled throughout Minnesota. The purposefully selected centers also served a higher proportion of subsidized children and on balance provide more services. The annual estimated cost to provide services for all children (infants through school age) at the purposefully selected centers was about 60 percent higher than the total sample ($12,581 compared with $7,780). While there isn’t a specific statistical finding to take from this result, it reinforces the point that the cost of providing early education and care in an accredited center is more expensive. ------------------------- Center for Research on Women. “The Cost and Quality of Full Day, Year-round Early Care and Education in Massachusetts: Preschool Classrooms.” http://www.wcwonline.org/earlycare/executivenm.pdf In 2000, the Department of Education, Early Learning Services, contracted with Wellesley College Center for Research on Women and Abt Associates to conduct a study of the cost and quality of early care and education in Massachusetts. Higher labor costs were somewhat off-set by lower non-labor costs at a given center. As a result, combined total costs for centers in the 4.5 to 5.49 range were only 9 percent higher than total costs for centers rated below 4.5 on the ECERS-R, a difference that is not statistically significant. However, the total costs for care rated 5.5 or higher were an estimated 27 percent higher than for care rated below 4.5, even when centers off-set higher labor costs with lower non-labor costs. As mentioned above, a 25 percent premium on top of a Ramsey County child care subsidy is $12,268. ------------------------- Stebbins, Helene & Langford, Barbara H. “Guide to Calculating the Cost of Quality Early Care and Education.” The Finance Project. May 2006. http://www.financeproject.org/publications/costguide.pdf Provides a framework for determining the cost of quality in a local area. The Finance Project facilitated in Kansas City illustrates how one locality calculated the cost of increasing the quality of early care and education services. The findings show a cost of $6,943 per preschool slot at a center and $6,967 per preschool slot at a home-based child care program in Kansas City. However, the salaries calculated per director and teacher in the program were relatively low. -------------------------
8
Golin, Stacie Carloyn, Mitchell, Anne W., & Gault, Barbara. “The Price of School Readiness: A Tool for Estimating the Cost of Universal Preschool in the States.” Institute for Women’s Policy Institute. Using a tool to estimate the cost of changing a child care center into an Illinois Preschool site, the authors estimate the total annual cost per child, full-day, full-year at $8,558 in 2000. The estimate breaks out personnel and non-personnel costs in detail. ------------------------- More from State Pre-Kindergarten Survey Connecticut pg. 19 of School Readiness and Child Day Care Grant Program Full Day/Full Year Program 5 days per week, 10 hours per day, 50 weeks. $8,025 School Day/School Year 5 days per week, 7 hours per day, 180 days. $6,000 Part Day/Part Year 2.5 hours per day, 5 days per week, 180 days. $4,500
Appendix F. ECD Scholarship Model Goal: Children from low-income families are prepared to succeed in school. Program Inputs Parent mentors, prenatal to age 5 Scholarships for low-income children to attend ECD program at ages 3 and 4 ECD program rating and monitoring
Market forces • Flexibility for ECD
programs to innovate • Entry of new ECD
programs • Competition • Better information
mechanism for parents
Short-term Outcomes Child • At age 3 and 4
participating in high quality ECD program
• At developmental norm or above for social-emotional and cognitive skills
Parents • More enriching
interactions with children • Active in child’s
development and education, including selecting high quality ECD program
Programs • Improved ECD program
quality • Increased supply of high
quality ECD programs
Long-term Outcomes Children are succeeding in school Parents are actively involved in child’s development and education A variety of high quality ECD programs are available
Appendix G. Explanation of the Logic Model The following section provides a discussion of contextual issues, detailed descriptions of the logic model components, assumptions and external factors. Context of ECD Scholarship Program pilot The ECD Scholarship Program pilot will occur in neighborhoods with a relatively high proportion of low-income families. Parents from low-income families lack funds to send children to a high quality ECD program. Because the benefits of attending a high quality ECD program accrue not only to children and their parents but to society as a whole, scholarships for low-income children more accurately reflect the societal demand for these services. In a market system, easily accessible and accurate information is vital for consumers and business people to make sound decisions. However, information about early childhood development and the value of a high quality ECD program are often less available to parents from low-income families. The parent mentor program will help bridge the information gap by providing parent education and information on available financial, health and human services, and guidance on selecting an ECD program. In neighborhoods with a high proportion of low-income families, there tends to be a shortage of high quality ECD programs relative to children who need them most. The scholarships will guarantee an eligible participating ECD program a rate that is significantly higher than the current average market rate. ECD programs will likely respond to this incentive by improving quality and expanding access to their services. Program Inputs
Parent mentors, prenatal to age 5 A parent mentor component that provides parent education and information on available financial, health and human services, and guidance on selecting an ECD program may begin prenatally. The parent mentor component will include home visits from professionals trained to work with parents of infants, toddlers and preschoolers on issues including health, nutrition, child development and education. Home visitors will likely be a combination of early childhood professionals and public health nurses. Parent mentors will be available for families with children living in poverty until age 5. Bilingual parent mentors or translators will be available for families who primarily speak a language other than English.
Scholarships for low-income children to attend ECD program at ages 3 and 4 Families with a 3- or 4-year-old child living in poverty will receive a scholarship that covers tuition at a qualified area ECD program. The scholarship can only be used at qualified ECD programs (see ECD program rating and monitoring below); actual payments will flow to the family-chosen ECD program. The scholarship will guarantee the eligible participating ECD program a rate that is significantly higher than the current average market rate. A partial scholarship can be layered on top of existing funding streams that ECD programs currently receive. The scholarship will increase the availability and number of quality ECD programs, and boost the quality of the programs in order to achieve school readiness outcomes. The scholarship will also serve to fill gaps in eligibility for public funding sources, particularly child care subsidies. Financial incentives will be rewarded for superior performance in child outcomes on measures of cognitive and social-emotional progress.
ECD program rating and monitoring MELF will set the quality standards required for programs to qualify to receive children with scholarships. The standards will align with the Quality Rating System (QRS), also being piloted by the MELF. The QRS ratings will help determine whether a program qualifies to accept scholarships. Programs will be evaluated on performance outcomes to determine continued eligibility and will receive financial incentives for superior performance. While providing infrastructure supports to improve ECD program quality is not the focus of the scholarship program, QRS does provide ECD programs information about available infrastructure supports, such as providers of teacher and staff training, facility financing and curriculum resources.
Market forces • Flexibility for ECD programs to innovate • Entry of new ECD programs • Competition • Better information mechanism for parents
Each of the program inputs will impact aspects of the ECD market so that the forces in the ECD market drive the outcomes. Economic theory shows that market activity tends to result in efficient outcomes. Choices among families (demand) and ECD programs (supply) shape the allocation of goods and services in markets. Economic theory also describes the conditions in which markets work efficiently and when they suffer from market failure. For example, the benefits to investments in ECD accrue not only to children and their parents, especially low-income families, but to the public as a whole due to reductions in remedial education costs, crime and increased tax revenue. These spillover benefits, or positive externalities, lead to an underinvestment in ECD in private markets.
By providing ECD scholarships to low-income families, the demand for ECD services will reflect the benefits received not only to the families, but also the spillover benefits to the public. Furthermore, ECD programs have an incentive to increase supply and quality. The market-oriented approach allows new ECD programs from the public and private sectors to enter the market, and flexibility for ECD programs to innovate within parameters set by standards. In addition, competition will develop in the market among ECD providers to provide high quality services as parents choose programs and financial bonuses are offered for superior performance. An important condition for well-functioning markets is readily available and transparent information. Parent mentors and parent activities at ECD programs will help improve the flow of information to parents from low-income families about parent education, available health and human services and guidance in selecting an ECD program. The ECD program rating and monitoring component will also improve the availability of information on ECD program quality. Short-term Outcomes
Child • At age 3 and 4 participating in high quality ECD program • At developmental norm or above for social-emotional and cognitive skills
Child outcomes include participation levels and impact on social-emotional and cognitive skills. Participation levels measure the impact the ECD Scholarship Program has on the number of children attending high quality ECD programs. A recent study conducted by the Minnesota Department of Education documented that only 50% of children entering kindergarten were fully prepared to do so. The intent of the Scholarship Program is to provide children at-risk with quality early childhood educational experiences to improve their school readiness skills, particularly their social-emotional and cognitive/linguistic skills. A measurement model, which will focus on measures most likely to demonstrate children’s progress and readiness for school, is currently being developed for the evaluations conducted on all MELF-funded projects, including the ECD Scholarship Program. (Note that the Minnesota Department of Education has created an instrument, the Kindergarten Readiness Assessment, based on the Work Sampling System. This instrument is currently the de facto standard for “school readiness” assessment in Minnesota, and includes a focus on the range of social-emotional, cognitive and linguistic skills that comprise school readiness.)
Parents • More enriching interactions with children • Active in child’s development and education, including selecting high
quality ECD program
Parent outcomes include enriched interactions with their children and involvement in their development and education. The well-known maxim “parents are their child’s best teacher” and the data linking positive parent-child relationships and better child outcomes provide the impetus for strengthening parenting skills of parents with young children. Parents who create trusting relationships with their young children, who are able to respond to their needs for comfort and stimulation, and provide them with opportunities to explore and play, are most likely to support children’s school readiness skills. Parents may do so in many different ways, through a host of everyday activities that include routine care giving, reading, singing, counting, story telling, cooking, etc. Measuring parent-child interactions through on-site observers will likely be beyond the scope of the evaluation, but parent mentor and parent surveys or interviews may provide indications of parent-child interactions. The scholarships are intended to empower parents to select a high quality ECD program. Once parents choose an ECD program, they are more likely to be invested in that program, benefit from the resources it provides, and use what they learn to support their child’s learning and development through all stages of their child’s development. Parent and ECD program staff surveys, interviews or program data can provide indications of parent participation in ECD program activities.
Programs • Improved ECD program quality • Increased supply of high quality ECD programs
Outcomes at the program level include improved quality and increased supply. Measures of quality will align with the Quality Rating System. Increased supply can arise either from increased capacity among existing ECD programs or new entrants into the market. The evaluation would also study ECD programs’ process of change, that is, how programs adapt business plans to accommodate for children with scholarships. Questions for investigation may include:
• Do ECD programs shift their business plans to include a few additional children with scholarships or do they provide services predominately to children with scholarships?
• How does the time frame for the pilot project affect ECD program behavior? That is, does a 4-year commitment to scholarships provide enough incentive to improve quality and expand access?
• Have programs that reached higher levels of quality maintained those levels, e.g. higher staff qualifications, less staff turnover, smaller ratios and better parent-provider relationships?
Assumptions
• Markets tend to provide the most efficient allocation of goods and services. • A large proportion of eligible families will chose to participate in the parent
mentoring program and use the scholarship. • ECD programs will respond to the incentive of scholarship funds and quality
standards by improving quality and creating more openings. External factors
• Low-income families are highly mobile, which may affect the ability of families to participate consistently in the ECD Scholarship Program.
• The QRS pilot in the area may have an impact on program quality independent of the ECD Scholarship Program.
• St. Paul Public Schools offers 4-year-old preschool in several neighborhoods. An expansion of 4-year-old preschool might coincide with the implementation of ECD Scholarship Program.
Note: The framework for the logic model was adapted from “Enhancing Program Performance with Logic Models.” University of Wisconsin Extension. October 2002. http://www.uwex.edu/ces/lmcourse/# (retrieved on Nov. 15, 2006).
Appendix H. Preliminary Statistical Power Analysis for ECD Scholarship Program Pilot
The formative and summative evaluations of the ECD Scholarship Program Pilot will investigate effects on child outcomes, parent involvement, access to and quality of ECD programs and other effects in the community. The evaluator will lay out procedures for the formative and summative evaluations, but to estimate statistical power, I’ve made some assumptions about those procedures. Also, I disclaim that I’m not a highly trained statistician, but offer these comments as a starting point for determining the sample size required for statistical power. The formative evaluation will provide a number of quantitative and qualitative measures to inform the implementation of the pilot. The summative evaluation will assess the impact of the program and will likely occur during the third and fourth years of the pilot. The formative evaluation will help determine what measures to use in the summative evaluation. For statistical power, it seems MELF should be concerned with the sample size required for the summative evaluation. Of the four categories of effects listed (child, parent involvement, access/quality of ECD programs and other effects), I’ve limited the power analysis to child and parent involvement outcomes, but offer some thoughts on the access/quality of ECD programs at the end. Other effects in the community will likely be descriptive. The summative evaluation for child outcomes would likely run from Sept. 1, 2009 to Sept. 1, 2011, which would provide one class of children who receive two years of an ECD program and one class of children who would receive one year (at age 3) of an ECD program. The summative evaluation for parent involvement could run from Sept. 1, 2008 to Sept. 1, 2011 in order to track one cohort (200) of home-visiting for three years (prenatal/birth to age 3) which would reflect the home visiting model articulated by the 7-county Metro Alliance Healthy Families. (Metro Alliance will likely have some evaluation goals of its own and perhaps could partner and/or fund this leg of the evaluation.) Here are the questions I’ve posed and responded to:
• What sample size of children and parents below 185% of FPG is large enough to reflect the total population of children and parents below 185% of FPG in Districts 6 & 7?
• What measures will be used for child and parent involvement outcomes? • What are the anticipated effect sizes if these measures were used in the pilot
evaluation? • What is the sample size required to achieve a statistical power of 0.8 assuming an
alpha of 0.05?
What sample size of children and parents below 185% of FPG is large enough to reflect the total population of children and parents below 185% of FPG in Districts 6 & 7? Population size for one age cohort in Districts 6 & 7. <100% FPG: 179 <185% FPG: 462 The pilot will select 200 families to participate in parent mentoring and receive scholarships at age 3 to attend a high quality early learning program. All children in families below 185% of FPG are eligible to participate with priority given to children in families below 100% of FPG. (The priority for below 100% of FPG will disrupt the random draw from the population below 185% FPG.) Using the following calculator: http://www.nss.gov.au/nss/home.NSF/pages/Sample+size+calculator?OpenDocument, with 200 children and parent units, 43% of eligible children and parents in the population will receive parent mentoring and scholarships, providing a confidence interval of +/– 0.052. A sample of 100 would provide a confidence interval of +/–0.087 What measures will be used for child and parent involvement outcomes? What are the anticipated effect sizes if these measures were used in the pilot evaluation? Child outcomes Studies of early childhood programs use somewhere between four and 10 child outcome measures. For example, the randomized study of Head Start used nine. Below I list examples of studies that list child outcome measures and associated effect sizes. The effect sizes range from low to moderate effect sizes for the randomized study of Head Start (0.1 to 0.24 for Intent to Treat and 0.13 to 0.35 for Treatment on the Treated) and more robust effect sizes in model programs, such as Perry and Abecedarian (0.7 to 0.9) and state pre-K programs (0.26 to 0.79). Larger effect sizes were generally attributed to participating low-income children, although effect sizes for Head Start were lower. Since the scholarship pilot is focused on low-income children, the results should lean toward the higher end of effect sizes. However, the scholarship pilot is testing a system to bring access to ECD Programs to scale across multiple locations, which may result in smaller effect sizes compared with those found in model programs on single sites. This isn’t a given, but multiple sites creates more uncertainty relative to the Perry Preschool, for example. In general, a conservative predication would call for effect sizes in the range of 0.4 to 0.5. As related to specific measures:
• Woodcock-Johnson letter-word identification: 0.4 to 0.6 • PPVT vocabulary 0.4 to 0.6 • Woodcock-Johnson spelling 0.3 to 0.5 • Woodcock-Johnson applied problems: 0.2 to 0.4
Parent involvement It seems that the Home Observation for Measurement of the Environment (HOME) is a widely cited instrument that would measure the impact of parent mentoring on the home environment.
Still in process Calculation of statistical power Child Outcomes Using the following calculator at http://www.danielsoper.com/statcalc/calc09.aspx, I entered effect sizes 0.1 to 0.6 to determine the sample size required for a statistical power of 0.8 using multiple regression with 15 parameters and alpha = 0.05. The table below shows the sample size required with associated effect sizes. If the summative evaluation surveys 200 children from Sept. 1, 2009 to Sept. 1, 2011, there should be enough statistical power to show the expected effect sizes of 0.4 to 0.5, and even for somewhat small effect sizes.
Effect Size
Sample Size
0.1 201 0.2 107 0.3 76 0.4 61 0.5 52 0.6 46
Examples of child outcome effect sizes and measures
Effect sizes are discussed in Future of Children Web site: http://www.futureofchildren.org/information2827/information_show.htm?doc_id=389441 Tulsa Pre-K Study (http://www.crocus.georgetown.edu/reports/oklahoma9z.pdf) shows effect sizes of 0.38 to 0.79 based on Woodcock-Johnson Achievement test scores. The authors found test impacts of 3.00 points (0.79 of the standard deviation for the control group) for the letter-word identification score; 1.86 points (0.64 of the standard deviation of the control group) for the spelling score; and 1.94 points (0.38 of the standard deviation of the control group) for the applied problems score.
Discussion in “The Benefits and Costs of Head Start,” Jens Ludwig & Deborah A. Phillips Working Paper 12973 http://www.nber.org/papers/w12973
Perry Preschool Project At the end of the second year of services, Perry had increased PPVT vocabulary scores by around .91 standard deviations and scores on a test of nonverbal intellectual performance (the Leiter International Performance test) by around .77 standard deviations [Schweinhart et al., 2005, p. 61]. Study of pre-K programs in five states Barnett et al. [2005] examine pre-K programs in five separate states and report effect sizes of .26 for the PPVT vocabulary test and .28 for the WJ-R applied problems test, both of which are statistically significant. Randomized trial of Head Start Effect sized range from 0.10 to 0.24. We would expect effect sizes to be larger in the scholarship model since the resources available per child will be larger. Furthermore, the Head Start centers in the national study have different levels of quality. Table 1: Intent-to-treat (ITT) Effect Sizes from the National Head Start Impact Study and Estimated Effects of Treatment on the Treated (TOT)
Outcome 3 year olds ITT
3 year olds TOT
4 year olds ITT
4 year olds TOT
Woodock-Johnson letter identification
.235* (.074)
.346* (.109)
.215* (.099)
.319* (.147)
Letter naming .196* (.080)
.288* (.117)
.243* (.085)
.359* (.126)
McCarthy draw-a-design .134* (.051)
.197* (.075)
.111 (.067)
.164 (.100)
Woodcock-Johnson spelling
.090 (.066)
.132 (.096)
.161* (.065)
.239* (.097)
PPVT vocabulary .120* (.052)
.17* (.077)
.051 (.052)
.075 (.076)
Color naming .098* (.043)
.144* (.064)
.108 (.071)
.159 (.107)
Parent-reported literacy skills
.340* (.066)
.499* (.097)
.293* (.075)
.435* (.112)
Oral comprehension .025 (.062)
.036 (.091)
-.058 (.052)
-.086 (.077)
Woodcock-Johnson applied problems
.124 (.083)
.182 (.122)
.100 (.070)
.147 (.103)
First and third columns reproduce ITT impact estimates for all cognitive outcomes reported in Westat’s Executive Summary of the first year findings report from the National Head Start Impact Study, reported as effect sizes, i.e. program impacts divided by the control group standard deviation (Puma et al., 2005). Standard errors are shown in parentheses also in effect size terms; these were not included in the Westat report but were generously shared with us by Ronna Cook of Westat. Second and fourth columns are our own estimates for the effects of treatment on the treated (TOT) derived using the approach of Bloom (1984), which divides the ITT point estimates and standard errors by the treatment-control difference in Head Start enrollment rates. For 3 year olds the adjustment is to divide ITT by (.894 - .213) = .681, for 4 year olds adjustment is to divide ITT by (.856 - .181) = .675 (see Exhibit 3.3, Puma et al., 2005, p. 3-7). * = Statistically significant at the 5 percent cutoff. Discussion in Reynolds, A & Temple, J. (2006) “Economic Returns of Investments in Preschool Education.” In A Vision for Universal Preschool Education, Eds. Zigler, E, Gilliam, W.S., Jones, S.M., Cambridge. The following table on Page 57 provides effect sizes for various programs using a variety of school readiness measures.
Examples of parent involvement/home environment effect sizes and measures
Still in process
Appendix I. Saint Paul Early Childhood Scholarship Pilot Cohorts
Begin Kindergarten this School Year: Child's Birthday (for assigning to cohort):
2013-2014 Sept 1 2008 Aug 2008 Jul 2008 Jun 2008 May 2008 Apr 2008 Mar ### Feb 2008 Jan 2008 Dec 2007 Nov 2007 Oct 2007 Sept 2 2007
2012-2013 Sept 1 2007 Aug 2007 Jul 2007 Jun 2007 May 2007 Apr 2007 Mar ### Feb 2007 Jan 2007 Dec 2006 Nov 2006 Oct 2006 Sept 2 2006
2011-2012 Sept 1 2006 Aug 2006 Jul 2006 Jun 2006 May 2006 Apr 2006 Mar ### Feb 2006 Jan 2006 Dec 2005 Nov 2005 Oct 2005 Sept 2 2005
2010-2011 Sept 1 2005 Aug 2005 Jul 2005 Jun 2005 May 2005 Apr 2005 Mar ### Feb 2005 Jan 2005 Dec 2004 Nov 2004 Oct 2004 Sept 2 2004
2009-2010 Sept 1 2004 Aug 2004 Jul 2004 Jun 2004 May 2004 Apr 2004 Mar ### Feb 2004 Jan 2004 Dec 2003 Nov 2003 Oct 2003 Sept 2 2003
Cohort 2 Start as baby, receive parent mentoring 3 yrs, no scholarship Cohort 1 Start as baby, receive parent mentoring 2 yrs 9 mo, scholarship with mentoring 1 yr**Cohort 3 Start as 3 yr old, receive parent mentoring 2 yrs, scholarship with mentoring 2 yrs Cohort 2 Start as 3 yr old, receive parent mentoring 2 yrs, scholarship with mentoring 2 yrs Cohort 1 Start as 3 yr old, receive parent mentoring with scholarship 1 yr 9 mos.
*Goal is to help families get signed up in a scholarship program. May 1st seems about the time to start this process, but mentoring could begin earlier or later.
Parent Mentor Service
Scholarship Service
Program Enroll Deadline
Appendix J: Annual Age Eligibility and Service by CohortYear Ramp up Year 1 2 3 4*
Child's age<12 months 200 200 Date of birth 9/2/06-9/1/07 9/2/07-9/1/0812-23 months 200 20024-35 months 200 200
1st Yr SCH 36-47 months 100 300 300 200 200
Date of birth 9/2/03-9/1/04 9/2/04-9/1/059/2/05-9/1/06
9/2/06-9/1/07
2nd Yr SCH 48-59 months 100 300 300 2005 years old (k) 100 300 3001st grade 100 3002nd grade 100
Ramp-up Year Scholarship CohortRamp-up Year < 12 months Parent Mentor Cohort (Start with 100 through Year 2 and add 100 3-year-olds in Year 3)Year 1 < 12 months Parent Mentor CohortYear 1 & 2 Scholarship Cohorts (For Evaluation)
*Depending on funding.
Cost EstimatesParent Mentoring Scholarship
Ramp-up to Year 3 2,514,000$ 14,147,147$ Ramp-up to Year 4 2,810,000$ 17,669,932$
Appendix K
The Saint Paul Early Childhood Scholarship Program
Helping Families get High-Quality Child Care and Early Education
Mail your completed application to: Resources for Child Caring
10 Yorkton Ct St Paul, MN 55117
Fax to: 651-645-0990 (if faxed, please mail in the original at your earliest convenience)
If you want help with this application, please call: 651-641-6604
If you would like to talk about this application with someone who speaks Hmong, Somali or Spanish, please call the Language Access Line at 651-665-0150 or 1-888-291-9811.
Si necesita ayuda en español para llenar esta forma, por favor llame al siguiente numero de teléfono: 651-665-0150 ama 1-888-291-9811.
Yog koj xav tau kev pab los yog muaj lus nug txog daim ntawv thov nyiaj no, thov hu rau tus xov tooj 651-665-0150 1-888-291-9811.
Hadii aad dooneysid in aad kala hadasho arjigan aad codsatay qof ku hadla afka Soomaliga, Fadlan wac: 651-665-0150 1-888-291-9811.
This information is also available in other forms to people with disabilities. For TDD/TTY users, contact this program through the Minnesota Relay at 711 or (800) 627-3529. For the Speech-to-Speech Relay, call (877) 627-3848.
To qualify, your family must: • Be income eligible • Live within Saint Paul City Planning Districts 6 or 7 (North End or Frogtown) • Have a child who will be 3 years old on September 1st of the current year. Women who are
pregnant or have a child who is under 1 year-old on Sept 1st of the current year may be eligible to receive Parent Mentoring Services and when the child is 3, they may be eligible for the scholarship.
• Have a parent or legal guardian of the child(ren) complete this application.
Instructions• Print your answers in ink. • Read all instructions carefully and answer all questions completely. • Attach additional sheets of paper if you need more space. • Sign and date the application • Mail, fax or bring the completed application and all other needed items to the address listed above. • If you have questions about completing this application or have problems getting the information you need,
call the number above.
After your application has been processed, you will receive written notice of your eligibility.
12/2007 1
1. Applicant. Tell us about you and where you live.
PARENT 1: LAST NAME
FIRST NAME MIDDLE NAME BIRTH DATE
OTHER NAMES YOU MIGHT BE KNOWN AS
PARENT 2: LAST NAME
FIRST NAME MIDDLE NAME BIRTH DATE
ADDRESS OF THE PARENT WHERE CHILD LIVES THE MAJORITY OF THE TIME
CITY STATE ZIP CODE
MAILING ADDRESS (if different)
CITY STATE ZIP CODE
HOME PHONE
WORK PHONE OTHER PHONE IF YOU DO NOT HAVE A PHONE, WHAT THE IS BEST WAY TO GET A HOLD OF YOU? (Example – name and phone number of a friend or family member)
PREFERRED LANGUAGE (optional) PREFERRED WRITTEN LANGUAGE (optional) DO YOU NEED AN INTERPRETER? (circle one) YES NO
Additional Languages spoken at home: (circle ALL that apply) optional
Arabic English Hmong Karen Khmer (Cambodian) Laotian Oromo Russian Serbo- Croatian (Bosnian) Somali Spanish Vietnamese Other (please specify)______________
WHERE DID YOU HEAR ABOUT THIS PROGRAM? (circle one) Lifetrack Resources Minnesota Literacy Council Neighborhood House Saint Paul Early Childhood Family Education(ECFE) Saint Paul Ramsey County Department of Public Health School: (name) __________________________ County Worker Child care/early education program: (name) _______________ Community agency: (name) __________________ Library
2. Children living with you for which you are the parent or legal guardian.
NAMES OF CHILDREN (LAST, FIRST, MIDDLE) DATE OF BIRTH
GENDER (male or female) (optional)
RACE OR ETHNICITY (optional)
12/2007 2
12/2007 3
3. The majority of the time, the children listed above live with:
PARENTS IN THE HOUSEHOLD (circle one)
ONE PARENT TWO PARENT OTHER_____________
4. Income. Please use the worksheet provided on page 4 to calculate your family’s total income.
TOTAL INCOME (EARNED + UNEARNED - DEDUCTIONS): $________________
5. You or your children are currently enrolled in MFIP (Minnesota Family Investment Program) ___yes ___no, or the Minnesota Child Care Assistance Program ___yes ___no. If Yes – STOP! PLEASE SKIP QUESTION 6 AND GO DIRECTLY TO PAGE 4. You do not need to send proof of
documents with this application. Resources for Child Caring will verify the information above. Please enter your case number________________________.
If No – please continue to question 6.
6. Please send in copies of the documents below. Do not send originals.
♦ Proof of child’s age: (send ONE from this list)
Birth certificate
Crib card
Passport I-94 card
Health Insurance card
Immunization record
Baptismal record
Consulate registration card (Matricula Consular)
♦ Proof of address for primary parent/guardian: (send ONE from this list)
Driver’s license State identification card Passport School identification card Birth certificate
Shelter Verification Form Rental lease Mortgage document Recent utility bill
♦ Proof of earned income: Please complete income worksheet on page 4. Document the
income you earned from work during the past 12 months by sending one or more of the following:
Tax Form W-2 Form
Pay stub Statement from employer
♦ Proof of unearned income and deductions. Please complete income worksheet on pg 4.
If you have received child support payments in the last 12 months, send a copy of the payment letter that indicates the amount received during the past 12 months.
Deductions (see income worksheet on Page 4) – Include proof of deductions, such as check stubs, benefit statements, premium statements, or award letters.
Income worksheet. Please use this worksheet to calculate your total family income.
EARNED INCOME (WAGES AND PROFITS FOR THE PARENT OR GUARDIAN OF THE CHILD(REN)
LISTED IN THIS APPLICATION) NAME EMPLOYER’S NAME HOURLY
WAGE HOURS WORKED PER WEEK
HOW OFTEN ARE YOU PAID?
ANNUAL AMOUNT (BEFORE DEDUCTIONS) (Multiply hourly wage times number of hours worked)
Weekly Bi-weekly Semi-
monthly
Other
Weekly Bi-weekly Semi-
monthly
Other
Weekly Bi-weekly Semi-
monthly
Other
Weekly Bi-weekly Semi-
monthly
Other
TOTAL EARNED INCOME: $
UNEARNED INCOME (CHILD SUPPORT, MFIP AND DWP FOR THE PARENT OR GUARDIAN OF THE CHILD(REN) LISTED IN THIS APPLICATION) TYPE YES NO HOW OFTEN DO YOU RECEIVE
PAYMENTS? AMOUNT RECEIVED
Do you receive Child Support payments?
Do you receive MFIP/DWP?
TOTAL UNEARNED INCOME: $
DEDUCTIONS (EXPENSES FOR THE PARENT OR GUARDIAN OF THE CHILD(REN) LISTED IN THIS APPLICATION) EXPENSE AMOUNT HOW OFTEN DO YOU PAY? Medical Insurance Premiums
Dental Insurance Premiums Vision Insurance Premiums Court ordered child support for child not living in the home
Court ordered spousal support
TOTAL DEDUCTIONS: $
TOTAL FAMILY INCOME (EARNED + UNEARNED - DEDUCTIONS):
$
12/2007 4
12/2007 5
Important! Please read and sign this application. If I am awarded a scholarship and/or parent mentoring services, I understand:
• I must enroll my child(ren) in a program that provides child care/early education for at least 12 hours per week.
• I must select a child care/early education program that has achieved 3 or 4 stars or a provisional rating through Parent Aware, or provisional approval through the Minnesota Department of Education or Minnesota Department of Human Services.
• I must give the child care/early education program a two week notice if I move or if I decide to transfer my child to another program.
• I must meet with my assigned parent mentor on a regular basis. Release of information:
• State and federal privacy laws protect my information. If I am eligible for the Early Childhood Scholarship Program, scholarship program staff can share information about the amount of the scholarship with the child care/early education program. Scholarship program staff can share information on this application with Saint Paul-Ramsey County Department of Public Health.
I understand: • The information about the amount of the scholarship must be shared with the child care/early
education program I choose so that they know how much the scholarship program will pay. • The information on the application must be shared with Saint Paul-Ramsey County
Department of Public Health so that they can connect me with parent mentoring services. • This information can be shared only if I give my written permission or if the law allows it. • I can refuse to sign or cancel this release, but if I do, the Early Childhood Scholarship Program
may not be able to pay the child care/early education program or connect me with parent mentoring services.
• I may cancel this authorization with written notice anytime. This written notice will not affect information already released.
• The person or agency that gets my information may be able to pass it on to others. • This authorization will end one year from the date I sign it. Minnesota Data Privacy Act
(Minn. Stat., Ch. 13). By signing below:
• I agree to the sharing of information as stated on the information release above. • I declare that to the best of my knowledge the information provided in this application is
accurate and true. • If I am on currently on the Minnesota Family Investment Program and/or the Minnesota Child
Care Assistance Program, I acknowledge that Resources for Child Caring can verify my address, income, and age of my child(ren) through Ramsey County Social Services.
SIGNATURE OF APPLICANT DATE
Early ChildhoodScholarship & ParentMentoring Program
Now enrolling families in Saint Paul’s Frogtown and North End neighborhoods!
Tam si no yog lub sijhawm cuv npe koom peb rau tsev neeg nyob hauv St. Paul ob koogzej zog Frogtown thiab North End!
Imminka waxa la qorayaa qoysaska xaafadaha Frogtown iyo North End ee Saint Paul!
¡Ahora registrando a las familias de los vecindarios de Saint Paul, Frogtown y North End!
The Saint Paul
Helping Families Get High-Quality ChildCare and Early Education
What is the program?
The Saint Paul Early Childhood Scholarship & Parent MentoringProgram gives families information to help prepare their childrenfor school. The program has two parts: parent mentoring andscholarships.
Qhov program yog dabtsi?
Qhov program St. Paul Early Childhood Scholarship and Parent Mentoring Programmuab ntaub ntawv xov xwm rau tsev neeg kom pab lawv npaj lawv cov m e nyuammus kawm ntawv. Qhov program no muaj ob qhov: Kev pab niam txiv los ntawm ibtug cob qhia (parent mentoring) thiab nyiaj pab (scholarship).
Waa maxay barnaamijku?
Barnaamijka Deeq Waxbarasho oo ah Caruurrta Yaryar iyo La-talinta Waalidka eeSaint Paul (Saint Paul Early Childhood Scholarship & Parent Mentoring Program)waxa uu qoysaska siiyaa war si looga gargaaro inay caruurtooda u diyaariyaandugsiga. Barnaamijku waxa uu leeyahay laba qaybood: la-talin waalid iyo deeqwaxbarasho.
¿Qué es el programa?
El Programa Saint Paul Early Childhood Scholarship & Parent Mentoring Program lesda a las familias información para ayudarlos a preparar a sus hijos para la escuela.El programa cuenta con dos partes: la preparación de los padres de familia pormedio de padres de familia mentores y las becas escolares.
Ramsey County
S A I N TP A U L
Appendix L1
Parent Mentoring� Families with pregnant women or a child under one year of age willget free home visits from a parent mentor. Visits will last until the childenters kindergarten.
� Parent mentors will make home visits to encourage family health, giveinformation about child development and choosing quality child careand early education, and help families get community resources.
Scholarships� At age 3, children will get a two-year scholarship to pay for high-quality childcare and early education services. Families will not have to pay anything.
Kev pab uas tsev neeg yuav txais tau yog dabtsi?
Kev pab cov niam txiv los ntawm ib tug cob qhia (Parent Mentoring)� Tsev neeg uas cov niam tab tom xeeb tub los yog muaj me nyuam mos uas tseemtsi tau muaj ib xyoo yuav muaj tus cob qhia tuaj ntsib hauv tsev. Tus cob qhiayuav tuaj ntsib nej txog thaum tus menyuam mus kawm ntawv Kindergarten.
� Tus cob qhia yuav tuaj ntsib nej hauv tsev txhawb txog tsev neeg kev noj qab haushuv, muab ntaub ntawv xov xwm hais txog tus menyuam txojkev loj hlob thiab kevxaiv chaw zov menyuam kom zoo thiab kev kawm ntawv ntxov thiab pab tsevneeg kom txais tau lwm lub koom haum tej kev pab.
Cov nyiaj pab (Scholarship)� Thaum muaj hnub nyoog peb xyoos, cov menyuam yuav txais ib qhov nyiaj pab themkom puv ob xyoo rau qhov chaw zov menyuam zoo, thiab kev kawm ntawv ntxov.Tsev neeg yuav tsi tau them nyiaj dabtsi, qhov program no yog pub dawb xwb.
Waa maxay adeegyada qoysasku heli doonaan?
La-talin Waalid� Qoysaska leh haweenay uur leh ama ilmo ka yar hal sanno waxay booqasho guri-ga ah oo bilaash ah ka heli doonaan la-taliye waalid. Booqashooyin waxay socondoonaan ilaa ilmuhu ka gaadhayo dugsiga barbaradka (kindergarten).
� La-taliyeyaasha waalidku waxay sameyn doonaan booqashooyin guriga ah si loodhiirigaliyo caafimaadka qoyska, si loo bixiyo war ku saabsan korniinka ilmahaloona doorto sii-hayn ilmo iyo waxbarasho caruurnimada hore ah oo tayo leh, siqoysaska looga gargaaro inay helaan adeegyada beesha.
Deeq waxbarasho� Da’da 3 jir, waxay caruurtu heli doonaan deeq waxbarasho oo ah laba sannadoodsi loo bixiyo kharashka sii-haynta ilmaha iyo adeegyada waxbarshada caruurnima-da hore ah oo tayo sare leh. Qoysaska lagama rabo inay wax bixiyaan.
¿Qué servicios recibirán las familias?
Preparación de los padres de familia� Las familias con mujeres embarazadas o niños menores de un año de edad,recibirán gratuitamente visitas de un padre de familia mentor. Las visitas duraránhasta que el niño entre a jardín de niños.
� Los padres mentores harán las visitas para promover la salud familiar, ofrecer infor-mación acerca del desarrollo infantil y elegir cuidado infantil y educación tempranade calidad, y para también ayudar a las familias a obtener recursos comunitarios.
Becas escolares� A los 3 años, los niños obtendrán una beca durante dos años para pagar por losservicios de cuidado infantil y educación temprana de calidad. Las familias no ten-drán que pagar por nada.
Resources for Child Caring 651-641-6604
If you would like to talk about this application with someone whospeaks Hmong, Somali, or Spanish, please call the Language AccessLine- 651-665-0150 or 1-888-291-9811.
www.stpaul.gov/earlyscholarship
Yog xav koom qhov program no hu tuaj rau:
Language Access Line tus xov tooj yog 651-665-0150 los sis nkag rau hauv.
Si aad u heshid warqadda codsiga barnaamijka wac:
Wac Khadka Luqada (Language Access Line) oo ah 651-665-0150 si aad ula xidhiidhidResources for Child Caring (Illaha Sii-haynta Ilmaha)
Para obtener una aplicación del programa llame al:
Language Access Line al 651-665-0150 para ponerse en contacto con Resourcesfor Child Caring.
What services will families receive? To get a program application call:Who can be in the program?
� Women who are pregnant or have a child who is under one year ofage on September 1 of the current year.
� Families who live in the Frogtown or North End neighborhoods(see map below).
� Families who have an annual income less than 185% of the FederalPoverty Guideline, about $38,000 for a family of four.
Families apply to the program only one time. Children who get parentmentoring or scholarships will keep them even if their family’s incomechanges or if their family moves (as long as they stay in Ramsey orHennepin counties).
Now enrolling 3-year-old children in Saint Paul’s Frogtown andNorth End neighborhoods!
Tam si no yog lub sijhawm rau cov menyuam muaj hnub nyoog 3 xyoos uas nyob hauv St. Paulob koog zej zog Frogtown thiab North End cuv npe koom peb!
Imminka waxa la qorayaa ilmaha 3 sanno jirka ah ee xaafadaha Frogtown iyo North End eeSaint Paul!
¡Ahora registrando a los niños de 3 años de edad de los vecindarios de Saint Paul, Frogtowny North End!
The Saint Paul
Helping Families Get High-Quality ChildCare and Early Education
What is the program?
The Saint Paul Early Childhood Scholarship Program givesfamilies information and scholarships to help them choose, payfor, and stay in high-quality child care and early education settings.
Qhov program yog dabtsi?
Qhov program St. Paul Early Childhood Scholarship yog muab ntaub ntawv xovxwm thiab nyiaj pab rau tsev neeg xaiv, them nqi thiab koom tej chaw zovmenyuam zoo thiab kawm ntawv ntxov zoo.
Waa maxay barnaamijku?
Barnaamijka Deeq Waxbarasho ee Caruurrta Yaryar ee Saint Paul (Saint PaulEarly Childhood Scholarship Program) waxa uu qoysaska siiyaa war iyo deeqwaxbarasho si looga gargaaro inay doortaan, iska bixiyaan kharashka, islamarkaana ilmahoodu ugu jiro sii-hayn ilmo oo tayo sare leh iyo waxbarashocaruurnimada hore ah.
¿Qué es el programa?
El Programa Saint Paul Early Childhood Scholarship & Parent Mentoring Programles da a las familias información y becas escolares para ayudarlos elegir, pagary continuar con el cuidado infantil y la educación temprana de alta calidad.
Ramsey County
S A I N TP A U L
Appendix L2
� A two-year scholarship to pay for full- or part-time, center or family-based child care and early education services starting when a child is3 years old. Families will not have to pay anything.
� Home visits from a parent mentor who will help families choose thebest child care and early education setting for their child.
Kev pab uas tsev neeg yuav txais tau yog dabtsi?
� Ib qho nyiaj pab them nqi (scholarship) kom puv ob xyoos rau ib hnub los yog ibnrab hnub nyob rau hauv tej chaw zov menyuam loj (center child care), chaw zovmenyuam hauv vaj tse (family child care) thiab kev kawm ntawv ntxov pib li thaumtus menyuam muaj 3 xyoos los mus. Tsev neeg yuav tsi tau them nyiaj dabtsi, qhovprogram no yog pub dawb xwb.
� Yuav muaj ib tug neeg tuaj xyuas cov niam txiv tom tsev, yuav pab cov niam txivxaiv chaw zov me nyuam zoo thiab kev kawm ntawv thaum ntxov zoo tshaj plawsrau lawv tus me nyuam.
Waa maxay adeegyada qoysasku heli doonaan?
Barnaamijaka Barbaarinta iyo dhisita aqoonta da’da yaray� Deeq waxbarasho oo ah laba sannadood si ay iskaga bixiyaan kharashka sii-haynilmo oo ah wakhti buuxa ama wakhti badh ah oo ah xarun sii-hayn ilmo ama sii-hayn qoys iyo adeegyada waxbarashada caruurnimada hore ah taasoo bilaab-maysa marka ilmuhu jiro 3 sannadood. Qoysaska lagama rabo inay waxbixiyaan.
� Una beca de dos años para pagar totalmente o parcialmente, cuidado infantil enel hogar o en un centro, y servicios de educación temprana, iniciando cuando elniño cumple los 3 años de edad. Las familias no pagarán nada.
� Visitas en el hogar de un padre mentor que ayudará a elegir el mejor cuidadoinfantil y educación temprana para su hijo.
Resources for Child Caring 651-641-6604
If you would like to talk about this application with someone whospeaks Hmong, Somali, or Spanish, please call the Language AccessLine 651-665-0150 or 1-888-291-9811.
Families with pregnant mothers or children under one year of age mayqualify for parent mentoring. For more information, contact Resourcesfor Child Caring using the information above.
www.stpaul.gov/earlyscholarship
What services will families receive? To get a program application call:Who can be in the program?
� Families who have a child who will be 3 years old on September 1of the current year.
� Families who live in the Frogtown or North End neighborhoods (seemap below).
� Families who have an annual income less than 185% of the FederalPoverty Guideline, about $38,000 for a family of four.
Families apply to the program only one time. Children who get scholarshipswill keep them even if their family’s income changes or if their familymoves (as long as they stay in Ramsey or Hennepin counties).
All St. Paul families with 3-year-old and 4-year-old children with annualincome less than 185% of the Federal Poverty Guideline may be eligiblefor an allowance of up to $4,000. Contact Resources for Child Caring at651-641-6604 for more information.
Yog xav koom qhov program no hu tuaj rau:
Language Access Line tus xov tooj yog 651-665-0150 los sis nkag rau hauv
Tsev neeg uas cov niam tab tom xeeb tub los yog muaj menyuam mos uas tseem tsitau muaj ib xyoo yuav txais tau tej kev pab los ntawm ib tug cob qhia. Yog xavpaub ntxiv hu rau lub koom haum Resources for Child Caring uas yog tus xov toojsaum toj no.
Si aad u heshid warqadda codsiga barnaamijka wac:
Wac Khadka Luqada (Language Access Line) oo ah 651-665-0150 si aad ulaxidhiidhid Resources for Child Caring (Illaha Sii-haynta Ilmaha)
Qoysaska leh hooyo uur leh ama ilmo ka yar hal sanno waxa u banaanaan karala-talin waalid. Si aad u heshid war dheeraad ah wac Resources for Child Caringadiga oo isticmaalaya warka sare.
Para obtener una aplicación del programa llame al:
Language Access Line al 651-665-0150 para ponerse en contacto con Resourcesfor Child Caring.
Las familias con mujeres embarazadas o niños menores de un año de edad, puedencalificar para tener acceso a un padre de familia mentor. Para más información,póngase en contacto con Resources for Child Caring usando la información que seindica arriba.
Saint Paul Early Childhood Scholarship Early Childhood Program Agreement
In order to be eligible to participate in and receive payments for children receiving scholarships as part of the Saint Paul Early Childhood Scholarship Program, we agree to do the following: Complete the application for the Saint Paul Early Childhood Scholarship Program. Have received a 3 star, 4 star or a provisional rating through Parent Aware, or provisional approval
through the Minnesota Department of Education or Department of Human Services. Commit to participate in the Saint Paul Early Childhood Scholarship Program evaluation process, which
may include completing attendance forms, surveys, interviews, child and family assessments, and observations.
Contact RCC if the child has consistent unexplained absences for one week or more. This information will be used to determine if the family needs additional resources through the Scholarship-Parent Mentoring services. RCC will also use this information to verify with the family if the child has moved to a different program.
Complete monthly Saint Paul Early Childhood Scholarship Program claim forms, including all required data fields.
Complete claim forms, accurately reporting all funding received from other sources, including but not limited to child care assistance, other scholarships, or parent self payment.
Utilize the scholarship funds first to cover parent co-payments, fees, or gaps in tuition. Communicate changes in program fees or tuition with the parent and RCC. Complete quarterly requests for quality improvement dollars.
Resources for Child Caring, as administrator of the Saint Paul Early Childhood Scholarship Program, will: Provide a 2 week advance payment for scholarship eligible children enrolled in the Early Childhood
Scholarship Program. If the child leaves your early childhood program, your program will receive 2 weeks notice before scholarship funding is terminated. These 2 weeks of service are covered by this advance payment.
Provide reimbursement within 10 business days of receipt of claim form on a monthly basis for tuition not covered by other funding sources, not to exceed the maximum scholarship award.
If the scholarship amount exceeds the tuition cost, determine the program’s eligibility to receive a quality grant on a quarterly basis.
Coordinate any adjustments to the scholarship payment, based on parents’ activities and eligibility for other funding sources.
Payments will be paid using the following amounts: Hours per Week Annual 4-week Reimbursement* 12 to 14 $7,280 $560 15 to 17 $8,320 $640 35 hours center-based $13,000 $1,000 35 hours family-based $9,360 $720 *Every 4 weeks a program receives the same tuition that they charge for private pay minus CCAP payments the program has received. Therefore, 4-week reimbursement rates will vary. The difference between the scholarship amount and the tuition payment will be included in a Quality Grant paid out every 12 weeks based on the aggregate number of scholarship children in the program.
______________________________________________ ____________________ Program Director/Family Child Care Provider Date ______________________________________________ ____________________
Appendix M
Scholarship Administrator Date
Appendix N
12/21/2011
Saint Paul Early Childhood Scholarship Program
Information for Early Care and Education Programs
The Saint Paul Early Childhood Scholarship Program is a 4-year pilot proposed by the Federal Reserve Bank of Minneapolis, funded by the Minnesota Early Learning Foundation, and coordinated by City of Saint Paul Mayor Chris Coleman’s office. The Scholarship Program provides families with information and resources to help them choose, pay for, and stay in high-quality early care and education (ECE) programs. In turn, ECE programs can use scholarship resources to increase and sustain quality programming.
What do families receive? • Scholarships to use to attend ECE programs that receive high Parent Aware ratings • Home-based Parent Mentoring How does my program benefit? 1) Financial benefit – If a family chooses to send their child to your program, your program will receive the scholarship money. It will be paid in the following amounts:
Hours per Week Annual 4-week Reimbursement*
12 to 14 $7,280 $560
15 to 17 $8,320 $640 35 hours
center-based $13,000 $1,000 35 hours
family-based $9,360 $720
*Every 4 weeks a provider receives the same tuition that they charge for private pay minus any CCAP payments the provider has received for the scholarship child. Therefore, 4-week reimbursement rates will vary. The difference between the scholarship amount and the tuition payment will be included in a Quality Grant paid out every 12 weeks based on the aggregate number of scholarship children in the program. 2) Continuity – Family eligibility is assessed once prior to entry into the Scholarship Program. If the family’s income or address changes, they still remain eligible.1 How does my program get signed-up? Step 1: Enroll in Parent Aware to get your program rated. To access a scholarship, an ECE program must have a Parent Aware* rating of 3 or 4 or provisional rating by either the Minnesota Department of Human Resources (DHS) or Minnesota Department of Education (MDE). Step 2: Sign an agreement with Resources for Child Caring to set up the scholarship payments. Step 3: Scholarship families enroll their children in your program beginning January 2008.
1 If a child moves to a different program, the scholarship follows the child. However, to support program sustainability, a 2-week advance is provided when a child enrolls. If families move out of Districts 6 & 7, they remain eligible as long as they live in Ramsey or Hennepin County.
Appendix N
12/21/2011
Which families can receive a scholarship? Families who: • live in the North End or Frogtown neighborhoods (City Planning Districts 6 & 7), Note: Scholarships can be used in any ECE program in Saint Paul that receives a 3 or 4
Parent Aware rating, provisional rating, or accredited/Parent Aware program in the 7-county metro.
• have an annual income at or below 185% of poverty, and • have a 3-year-old child on September 1st. If a child is already in my program, can they get a scholarship? Yes. As long as the family meets the eligibility requirements and your program receives a 3 or 4 Parent Aware rating or provisional rating by either DHS or MDE, the child can use the scholarship. Who to contact if you have questions about… General project information: Lisa Cariveau, City of Saint Paul Office of Mayor Christopher B. Coleman 651-266-8536 [email protected] *Parent Aware: Valerie Peterson - Minnesota Child Care Resource and Referral Network 651-290-9704 Extension 107 [email protected] or visit www.parentawareratings.org Scholarship payment/family enrollment: Carolyn Veeser-Egbide - Resources for Child Caring 651-641-6647 [email protected] “If properly funded and managed, investments in early childhood development yield an extraordinary return, far exceeding the return on most investments, private or public.”
- Federal Reserve Bank of Minneapolis
FINAL – 2008
1
Appendix O: The Saint Paul Early Childhood Scholarship Program Program Plan for Early Education Programs Use this form to submit an estimate of how your early education program will use scholarships if your program receives them. This exercise is similar to the program plan for Pre-K allowances and is intended to help your program anticipate how it may use scholarship funds based on the potential number of scholarship children. The program plan will also indicate to the administrators of the scholarship program how funds will likely be spent. Programs will be required to complete a program plan at the beginning of three time periods. At the end of each period, early education programs will be required to submit a report (similar to the final report for Pre-K allowances. The scholarship program will provide a form to complete). The schedule for program plans and reports is as follows: 1) Feb. 1, 2008 - June 30, 2009: Program plan due Feb. 2008. Report due Aug. 14, 2009 2) July 1, 2009 - Aug. 31, 2010: Program plan due July 2009. Report due Oct. 2010 3) Sept. 1, 2010- Aug. 31, 2011: Program plan due Sept. 2010. Report due Nov. 2011
To complete this form, you must: • Be an early education or licensed child care program • Be approved to receive scholarships and scholarships by having obtained a 3 or 4 star rating
through Parent Aware, or having received a provisional rating
If you would like to talk about this application with someone who speaks Hmong, Somali or Spanish, please call the Language Access Line at 651-665-0150 or 1-888-291-9811. Si necesita ayuda en español para llenar esta forma, por favor llame al siguiente numero de teléfono: 651-665-0150 ama 1-888-291-9811. Yog koj xav tau kev pab los yog muaj lus nug txog daim ntawv thov nyiaj no, thov hu rau tus xov tooj 651-665-0150 1-888-291-9811. Hadii aad dooneysid in aad kala hadasho arjigan aad codsatay qof ku hadla afka Soomaliga, Fadlan wac: 651-665-0150 1-888-291-9811.
Instructions: • Print or type your answers in black ink. • Attach additional sheets of paper if you need more space. • Mail, fax or email the completed form to the address listed above. • If you have questions about completing this form or have problems getting the
information you need, use the contact information above.
FINAL – 2008
2
1. Program information: Tell us about your program. PROGRAM NAME
DIRECTOR/PROVIDER NAME
ADDRESS
CITY COUNTY STATE ZIP CODE
LICENSE NUMBER (if applicable)
PHONE NUMBER
2. Services offered: Tell us about the types of services your program offers. PROGRAM TYPE (circle one) Family child care Child care/private preschool Head Start School District’s Pre-kindergarten
SERVICE ARRANGEMENT (check all that apply)
ARRANGEMENT TYPE Check below if your program offers this.
MONTHS PER YEAR OF OPERATION
HOURS PER WEEK OF OPERATION
Half-day
Full-day
3. Service scenarios Tell us how you will provide services to children with scholarships if your program receives them. First, check whether the scholarships will be used at a half-day or full-day program. Second, indicate after paying parent fees or co-pays, which of the types of uses you will provide by answering “yes” or “no” in the box. Next, describe the scenario in a few sentences. Only complete scenarios that you think may apply to your program. SCENARIO 1
Half-day ____ Full-day ____
TO IMPROVE QUALITY? (yes or no)
TO SERVE MORE CHILDREN? (yes or no)
TO INCREASE DURATION (NUMBER OF HOURS CHILDREN ARE SERVED)? (yes or no)
10 – 20 children bring scholarships to your program
Describe:
SCENARIO 2
Half-day ____ Full-day ____
TO IMPROVE QUALITY? (yes or no)
TO SERVE MORE CHILDREN? (yes or no)
TO INCREASE DURATION (NUMBER OF HOURS CHILDREN ARE SERVED)? (yes or no)
20-30 children bring scholarships to your program
Describe:
FINAL – 2008
3
SCENARIO 3
Half-day ____ Full-day ____
TO IMPROVE QUALITY? (yes or no)
TO SERVE MORE CHILDREN? (yes or no)
TO INCREASE DURATION (NUMBER OF HOURS CHILDREN ARE SERVED)? (yes or no)
30 –50 children bring scholarships to your program
Describe:
SCENARIO 4
Half-day ____ Full-day ____
TO IMPROVE QUALITY? (yes or no)
TO SERVE MORE CHILDREN? (yes or no)
TO INCREASE DURATION (NUMBER OF HOURS CHILDREN ARE SERVED)? (yes or no)
More than 50 children bring scholarships to your program
Describe:
SCENARIO 5
Half-day ____ Full-day ____
TO IMPROVE QUALITY? (yes or no)
TO SERVE MORE CHILDREN? (yes or no)
TO INCREASE DURATION (NUMBER OF HOURS CHILDREN ARE SERVED)? (yes or no)
Other (enter number of children served)
Describe:
SCENARIO 6
Half-day ____ Full-day ____
TO IMPROVE QUALITY? (yes or no)
TO SERVE MORE CHILDREN? (yes or no)
TO INCREASE DURATION (NUMBER OF HOURS CHILDREN ARE SERVED)? (yes or no)
Other (enter number of children served)
Describe:
SCENARIO 7
Half-day ____ Full-day ____
TO IMPROVE QUALITY? (yes or no)
TO SERVE MORE CHILDREN? (yes or no)
TO INCREASE DURATION (NUMBER OF HOURS CHILDREN ARE SERVED)? (yes or no)
Other (enter number of children served)
Describe:
FINAL – 2008
4
Important! Please read and sign this form. If children bring scholarships to my program, I will:
• Sign and abide by the Saint Paul Early Childhood Provider Agreement Form If children bring scholarships to my program, I am aware that my program will:
• receive a 1099 if I receive scholarships for over $600. (For additional information about taxes consider consulting a tax attorney.)
• receive scholarship from Resources for Child Caring. • be asked to participate in an evaluation of the scholarship program.
SIGNATURE OF PROGRAM DIRECTOR OR LICENSED PROVIDER DATE
Return form to: Lisa Cariveau, Early Education Project Coordinator, Office of Mayor Christopher B. Coleman 390 City Hall Saint Paul, MN 55102
Appendix P. MELF payments to St. Paul Public Schools beginning Sept. 1, 2009
Due to fundraising constraints, the MELF board had to make a number of difficult funding decisions, including cutting payments to SPPS for providing services to children who have scholarships. Since that decision, an issue has arisen which requires clarification and modifications with payments from MELF to SPPS.
Administration reimbursement for MELF scholarship children attending half-day SPPS preschool programs. MELF’s goal is to continue to track and assess all scholarship children whose families signed consent forms as part of SRI’s evaluation of the scholarship program. This requires tracking attendance and facilitating visits by assessors to evaluate the children. Prior to Sept. 1, 2009, SPPS is paid for providing services to children attending a half-day program; part of the funds defrayed the administrative costs of tracking child attendance and submitting Claim Forms to RCC every four weeks.
After Sept. 1, 2009, SPPS will not be paid for direct service for children attending half-day programs; however, in order to defray the costs of tracking attendance and facilitating the assessors, MELF will pay SPPS $50 per child attending half-day SPPS preschool programs at the end of each of the fall and spring semesters. Here is how it will work:
RCC will send SPPS a list of scholarship children enrolled in SPPS preschool programs by Sept. 7. Please let RCC know if there is any scholarship children that you know of enrolled in SPPS preschool programs not on the list. During the semester RCC will send SPPS updates if scholarship children enroll into SPPS preschool programs after the start of the semester. After the fall and spring semesters, SPPS will generate a report (electronic format is fine) that includes the following information:
1. Child’s name 2. Start date 3. Daily attendance (number of days attending and number of days absent; don’t need to have
attendance by day, but will collect this information if readily available) 4. End date (looking for any difference from the date marking the end of the semester)
This information should be sent to Patti Kester at RCC. In addition, SPPS will be responsible for the following tasks:
1. Assisting SRI with ad hoc data collection or interviews as needed. 2. Facilitating SRI assessors to visit classrooms and conduct child assessments.
SPPS is not required to report to MELF how these funds are spent. This policy is a change from the one proposed earlier this summer, where data would have been collected every four weeks. After consulting with SRI and RCC, there isn’t an immediate need to collect this data so frequently. Information at the end of the semester is frequent enough to observe when children were enrolled and how consistently they attended.
Appendix Q. MELF payments to Head Start for children attending half-day programs beginning Sept. 1, 2009
Due to fundraising constraints, the MELF board had to make a number of difficult funding decisions, including cutting payments to Head Start for providing services to children who have scholarships. Since that decision, an issue has arisen which requires clarification and modifications with payments from MELF to Head Start.
Administration reimbursement for MELF scholarship children attending half-day Head Start programs. MELF’s goal is to continue to track and assess all scholarship children whose families signed consent forms as part of SRI’s evaluation of the scholarship program. This requires tracking attendance and facilitating visits by assessors to evaluate the children. Prior to Sept. 1, 2009, Head Start is paid for providing services to children attending a half-day program; part of the funds defrayed the administrative costs of tracking child attendance and submitting Claim Forms to RCC every four weeks.
After Sept. 1, 2009, Head Start will not be paid for direct service for children attending half-day programs; however, in order to defray the costs of tracking attendance and facilitating the assessors, MELF will pay Head Start $50 per child attending half-day Head Start programs at the end of each of the fall and spring semesters. Here is how it will work:
RCC will send Head Start a list of scholarship children enrolled in Head Start half-day programs by Sept. 7. Please let RCC know if there is any scholarship children that you know of enrolled in Head Start half-day programs not on the list. During the semester RCC will send Head Start updates if scholarship children enroll into Head Start half-day programs after the start of the semester. After the fall and spring semesters, Head Start will generate a report (electronic format is fine) that includes the following information:
1. Child’s name 2. Start date 3. Daily attendance (number of days attending and number of days absent; don’t need to have
attendance by day, but will collect this information if readily available) 4. End date (looking for any difference from the date marking the end of the semester)
This information should be sent to Patti Kester at RCC. In addition, Head Start will be responsible for the following tasks:
1. Assisting SRI with ad hoc data collection or interviews as needed. 2. Facilitating SRI assessors to visit classrooms and conduct child assessments.
Head Start is not required to report to MELF how these funds are spent. This policy is a change from the one proposed earlier this summer, where data would have been collected every four weeks. After consulting with SRI and RCC, there isn’t an immediate need to collect this data so frequently. Information at the end of the semester is frequent enough to observe when children were enrolled and how consistently they attended.
Appendix B
Maps: ECE Program Locations, 2008 Through 2011
Location of 3- and 4-Star Programs in and near Districts 6 and 7 and Vacant Slots, September 2008
Note. The number inside each marker is the number of vacancies at the program in September 2008. The total number of vacancies across all programs shown on this map is 95 slots. Programs with an asterisk did not have capacity and vacancy data in NACCRRAware at the time the data were obtained.
Location of 3- and 4-Star Programs in and near Districts 6 and 7 and Vacant Slots, September 2009
Note. The number inside each marker is the number of vacancies at the program in September 2009. The total number of vacancies across all programs shown on this map is 133 slots.
Location of 3- and 4-Star Programs in and near Districts 6 and 7 and Vacant Slots, September 2010
Note. The number inside each marker is the number of vacancies at the program in September 2010. The total number of vacancies across all programs shown on this map is 192 slots.
Location of 3- and 4-Star Programs in and near Districts 6 and 7 and Vacant Slots, September 2011
Note. The number inside each marker is the number of vacancies at the program in September 2011. The total number of vacancies across all programs shown on this map is 296 slots.
Location of Parent Aware-Rated ECE Programs in and near Districts 6 and 7 and Parent Aware Ratings, as of December 2008
Note. These are the 26 programs in and near the original pilot area of districts 6 and 7. Ten school-based programs that are rated 3-star provisional on this map were upgraded to 4-stars in 2009 due to a policy decision, not to a measured change in quality. This change is reflected on the following map.
Location of Parent Aware-Rated ECE Programs in and near Districts 6 and 7 and Parent Aware Ratings, as of December 2009
Note. These are the 31 programs in and near the original pilot area of districts 6 and 7.
Location of Parent Aware-Rated ECE Programs in and near Districts 6 and 7 and Parent Aware Ratings, as of December 2010
Note. These are the 41 programs in and near the original pilot area of districts 6 and 7.
Location of Parent Aware-Rated ECE Programs in and near Districts 6 and 7 and Parent Aware Ratings, as of December 2011
Note. These are the 49 programs in and near the original pilot area of districts 6 and 7.
Location of ECE Programs Where Children Were Using Scholarship Funds, as of December 2008 (Cohort 2 Only)
Note: The number inside each marker is the number of scholarship children attending each program in December 2008. The total number of children using scholarship funds attending these programs is 81. This map includes only Cohort 2 children because Cohort 3 children were not yet eligible.
Location of ECE Programs Where Children Were Using Scholarship Funds, as of December 2009 (Cohort 2 and Cohort 3)
Note: The number inside each marker is the number of scholarship children attending each program in December 2009. The total number of children using scholarship funds attending these programs is 256.
Location of ECE Programs Where Children Were Using Scholarship Funds, as of September 2010 (Cohort 3 Only)
Note. The number inside each marker is the number of scholarship children who attended each program. This map represents the 114 children in Cohort 3 who were still participating in the Scholarship Program as of September 2010.
Appendix C
ECE Program Survey
1
Appendix C: MELF Saint Paul Scholarship Program
ECE Program Survey
• Please take 10 minutes to complete this short survey that will help us better understand how the Minnesota Early Learning Foundation (MELF) Scholarship Program impacted your program.
• The information that you share will be kept confidential and will not affect your participation in the scholarship or any other program. Please do not use any identifying information (for example, children’s or families’ names) in this survey.
• As a small thank you for completing this survey, we will send you a $20 gift certificate.
Different Payment Methods 1. Indicate how true the following statements are for the scholarship payment method and amount:
Very True
Somewhat True
Somewhat Not True
Not True At All
The payment method provides support for quality improvement efforts and resources.
Payments are made reasonably on-time.
The payment method is easy for parents/families to use.
The payment method is able to support continuity of children's care.
Parents are satisfied with the payment method.
Paperwork and other administrative processes of the payment method are minimally disruptive to services.
The payment method supports transportation costs.
The amount provided is adequate to cover child’s expenses.
The amount provided is adequate to support children's full-time care.
2
2. Indicate how true the following statements are for the Child Care Assistance Program (CCAP) payment method and amount: If your program never has children with this payment method, you may skip this section.
Very True
Somewhat True
Somewhat Not True
Not True At All
The payment method provides support for quality improvement efforts and resources.
Payments are made reasonably on-time.
The payment method is easy for parents/families to use.
The payment method is able to support continuity of children's care.
Parents are satisfied with the payment method.
Paperwork and other administrative processes of the payment method are minimally disruptive to services.
The payment method supports transportation costs.
The amount provided is adequate to cover child’s expenses.
The amount provided is adequate to support children's full-time care.
3. Indicate how true the following statements are for the private payment method and amount:
Very True
Somewhat True
Somewhat Not True
Not True At All
The payment method provides support for quality improvement efforts and resources.
Payments are made reasonably on-time.
The payment method is easy for parents/families to use.
The payment method is able to support continuity of children's care.
Parents are satisfied with the payment method.
Paperwork and other administrative processes of the payment method are minimally disruptive to services.
The payment method supports transportation costs.
The amount provided is adequate to cover child’s expenses.
The amount provided is adequate to support children's full-time care.
3
Scholarship Program Quality Grants Now we want to ask you about how the quality grant funds were used at your program. The quality grant funds are the difference between the scholarship amount and the tuition amount. Your program received a total of $INSERT AMOUNT in scholarship quality grant funds from July 1, 2009 to June 30, 2010. 4. Of the total $INSERT AMOUNT scholarship quality grant funds your program received in this period, about
what percentage was used for the following purposes: [your best estimate is fine] [4a-4h should add to 100% total].
4b. To purchase teaching materials to improve the learning environment:
Curriculum and assessment tools?
Books and toys?
Large equipment (e.g., playground equipment)?
4c. To pay for professional development (e.g., training workshops, consultation)?
4d. To provide more opportunities for family involvement and partnerships?
4e. To pay for building improvements?
4f. To pay tuition for other children who did not have scholarships?
4g. To increase teacher/staff pay (select all that apply)?
Substitute teachers
Increased salary/benefits
Additional staff/additional staff hours
4h. For other expenditures (please describe below)
%
%
%
%
%
%
%
%
%
%
1 0 0 %
General Impressions of the Scholarship Program
5. How has the Scholarship Program affected the children and families you serve?
a. As a result of the Scholarship Program funds, are you… 1. Serving more children than you would have served without the scholarship? Yes No
2. Serving children with different demographics than you had served without the scholarship? Yes No
(for example, children with different ethnic or socioeconomic backgrounds)
b. Please provide two examples of how the scholarship program impacted your program’s ability to serve children.
Example #1:
Example #2:
4
6. Which of the following ways did the Scholarship Program affect the quality or services your program provided to children and their families? • In the first column, please mark all the ways the Scholarship Program has affected services. • In the second column, mark the primary way the Scholarship Program has affected services.
All ways the Primary way scholarships the scholarships affected services affected services (Mark ALL that apply) (Mark ONE)
a. Made it possible to enroll children from low-income households b. Supported quality improvements for my program c. Increased the number of hours that children could attend the program
d. Please provide two examples of how the scholarship program affected your program’s quality or services.
Example #1:
Example #2:
7. Was the amount of the scholarship payment enough to cover the costs for the children who had
scholarships? Yes No If it was not enough, please explain how or why:
8. Is there anything else you would like us to know about the scholarship payment process?
9. Please describe the most important benefits of participating in the Scholarship Program for your program.
10. Please describe any challenges to participating in the Scholarship Program
11. Is there anything else you would like to tell us about the Scholarship Program?
Thank you for taking the time to complete this survey.
For more information about the MELF Scholarship Program go to www.melf.us.
If you have questions about this survey please contact Kate Ferguson at (650) 859-4428 or