33
Slide 1 Sakari Uppala and Dick Dee European Centre for Medium-Range Weather Forecasts ECMWF reanalysis: present and future
| Date post: | 01-Jan-2016 |
| Category: |
Documents |
| Upload: | iona-norman |
| View: | 28 times |
| Download: | 2 times |
Slide 1
Sakari Uppala and Dick Dee
European Centre for Medium-Range Weather Forecasts
ECMWF reanalysis:
present and future

Slide 2
CONTENTS
Background
ERA-15 ERA-40 ERA-Interim
Product quality
Reanalysis plans at ECMWF
Slide 3
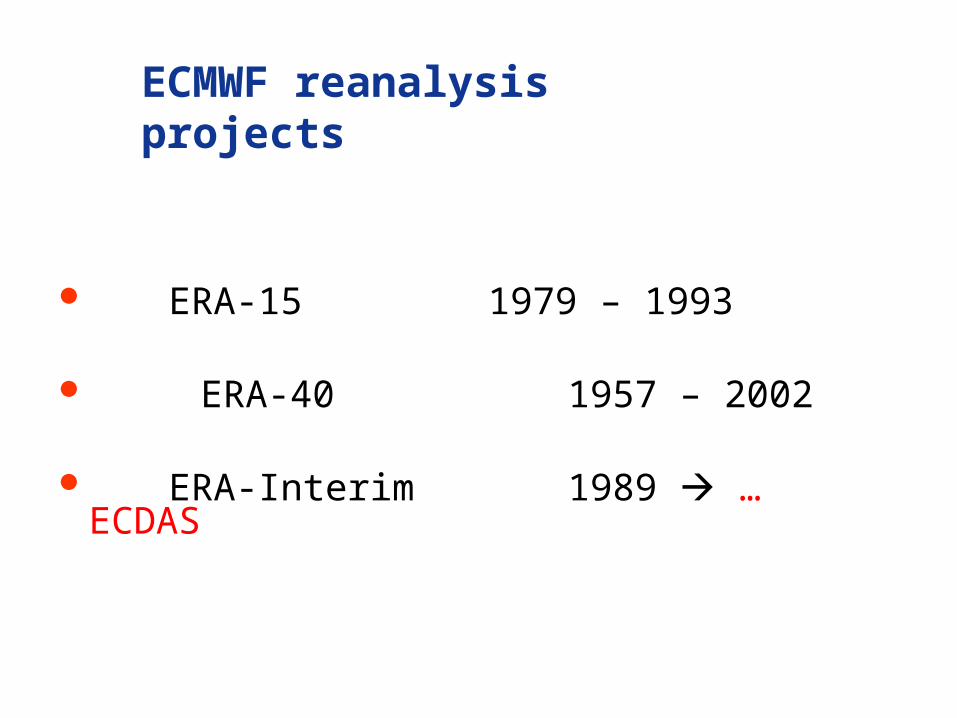
ECMWF reanalysis projects
ERA-15 1979 – 1993
ERA-40 1957 – 2002
ERA-Interim 1989 … ECDAS

Slide 4
Operational forecast performance 1980-2007
Northern Hemisphere
500 hPa geopotentialANC reaching 60%
Southern Hemisphere
500 hPa geopotentialANC reaching 60%
Tropics
850 hPa wind vectorABC reaching 70%
N.HEM LAT 20.000 TO 90.000 LON -180.000 TO 180.000
ANOMALY CORRELATION FORECAST
500hPa GEOPOTENTIAL
ECMWF FORECAST VERIFICATION 12UTC
Forecast Day MA = 12 Month Moving Average
1980 1981 1982 1983 1984 1985 1986 1987 1988 1989 1990 1991 1992 1993 1994 1995 1996 1997 1998 1999 2000 2001 2002 2003 2004 2005 20064.5
5
5.5
6
6.5
7
7.5
8
8.5
9
9.5
10
SCORE REACHES 60.00
SCORE REACHES 60.00 MA
2005200019851980 1990 1995TROPICS LAT -20.000 TO 20.000 LON -180.000 TO 180.000
ABSOLUTE CORRELATION FORECAST
850hPa VECTOR WIND
ECMWF FORECAST VERIFICATION 12UTC
Forecast Day MA = 12 Month Moving Average
1980 1981 1982 1983 1984 1985 1986 1987 1988 1989 1990 1991 1992 1993 1994 1995 1996 1997 1998 1999 2000 2001 2002 2003 2004 2005 20060
1
2
3
4
5
6
7
8
9
10
11
SCORE REACHES 70.00
SCORE REACHES 70.00 MA
2005200019851980 1990 1995S.HEM LAT -90.000 TO -20.000 LON -180.000 TO 180.000
ANOMALY CORRELATION FORECAST
500hPa GEOPOTENTIAL
ECMWF FORECAST VERIFICATION 12UTC
Forecast Day MA = 12 Month Moving Average
1980 1981 1982 1983 1984 1985 1986 1987 1988 1989 1990 1991 1992 1993 1994 1995 1996 1997 1998 1999 2000 2001 2002 2003 2004 2005 20063
4
5
6
7
8
9
10
SCORE REACHES 60.00
SCORE REACHES 60.00 MA
2005200019851980 1990 1995
Monthly time seriesMoving average
ERA-15 ERA-40ERA-Interim
Slide 5
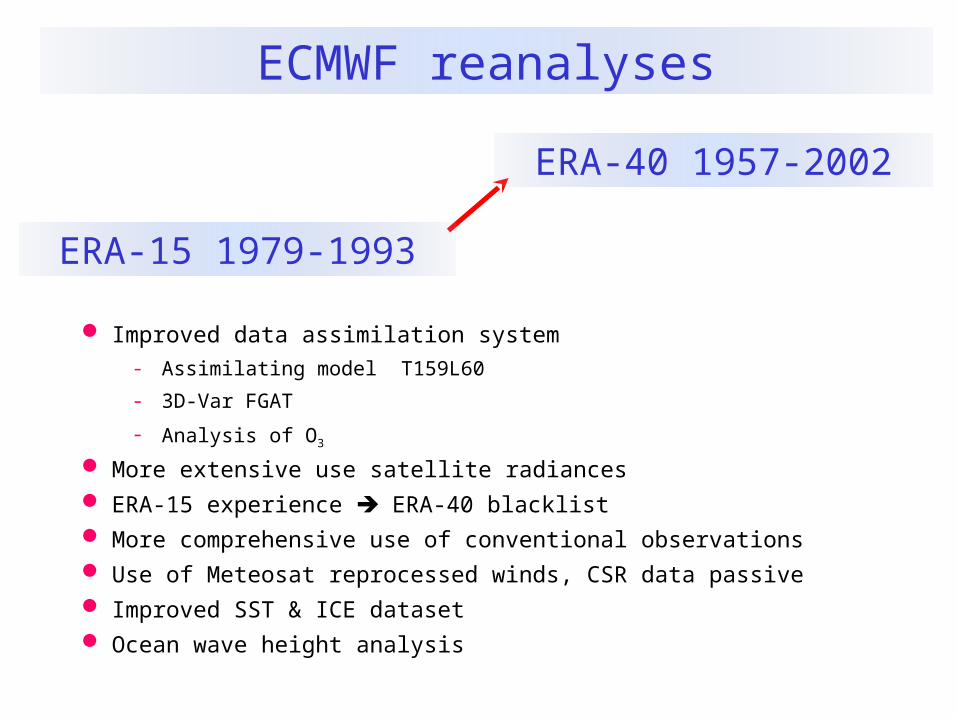
ECMWF reanalyses
ERA-40 1957-2002
ERA-15 1979-1993
Improved data assimilation system
- Assimilating model T159L60
- 3D-Var FGAT
- Analysis of O3
More extensive use satellite radiances ERA-15 experience ERA-40 blacklist More comprehensive use of conventional observations Use of Meteosat reprocessed winds, CSR data passive Improved SST & ICE dataset Ocean wave height analysis
Slide 6
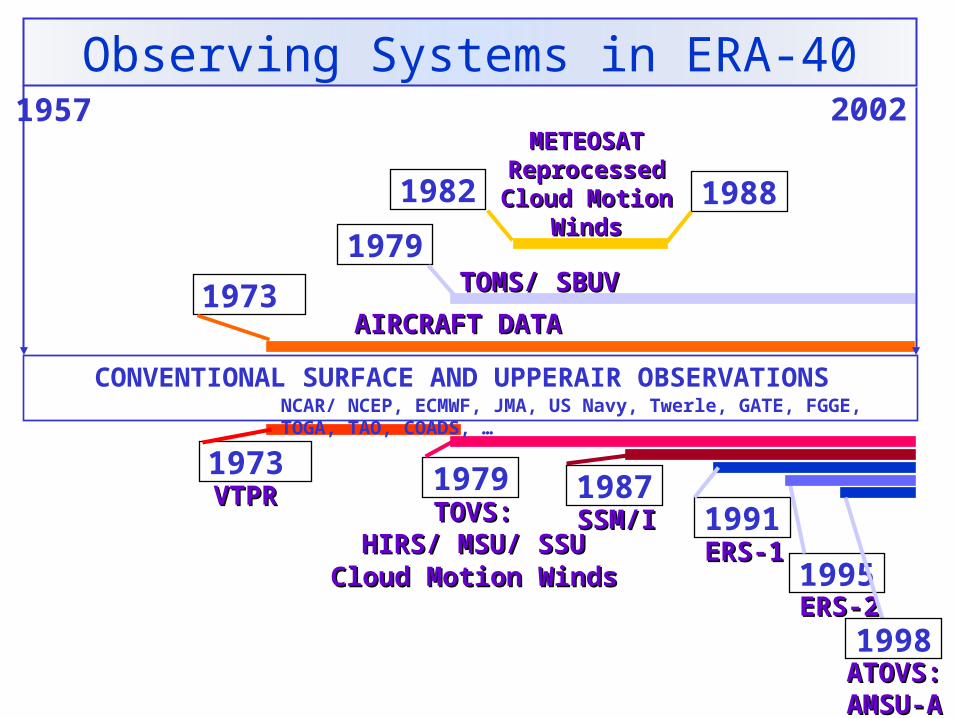
VTPRVTPR1973
TOMS/ SBUVTOMS/ SBUV1979
1979TOVS:TOVS:
HIRS/ MSU/ SSUHIRS/ MSU/ SSUCloud Motion WindsCloud Motion Winds
1987SSM/ISSM/I 1991
ERS-1ERS-11995ERS-2ERS-2
1998ATOVS:ATOVS:AMSU-AAMSU-A
METEOSAT METEOSAT ReprocessedReprocessed
Cloud Motion Cloud Motion WindsWinds
1982 1988
CONVENTIONAL SURFACE AND UPPERAIR OBSERVATIONSNCAR/ NCEP, ECMWF, JMA, US Navy, Twerle, GATE, FGGE, TOGA, TAO, COADS, …
AIRCRAFT DATAAIRCRAFT DATA1973
1957 2002
Observing Systems in ERA-40

Slide 7
Slide 8
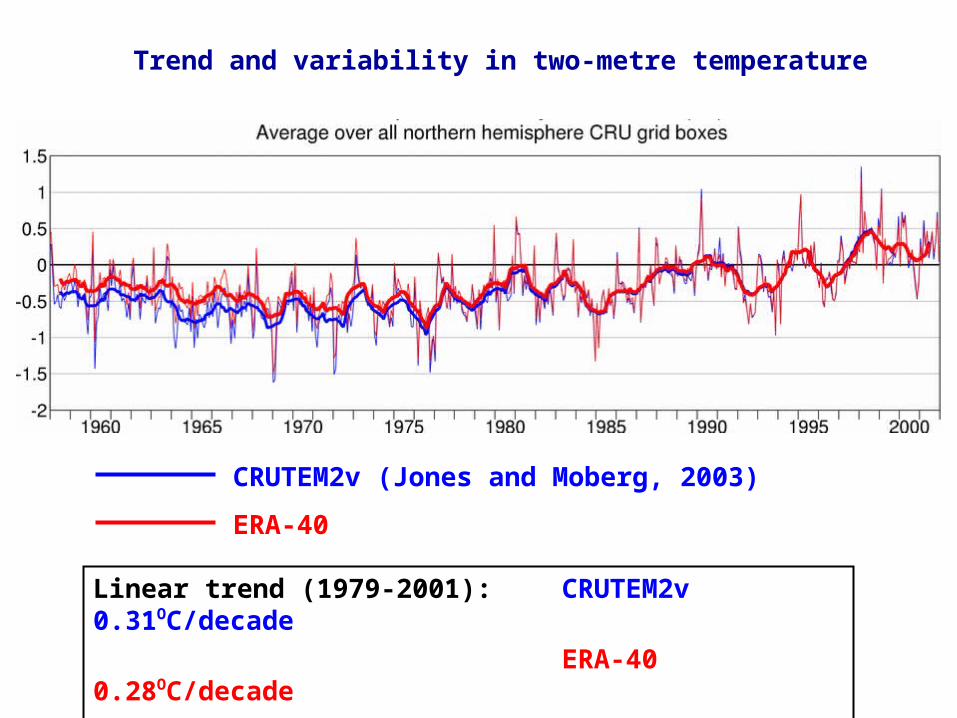
Trend and variability in two-metre temperature
CRUTEM2v (Jones and Moberg, 2003)
ERA-40
Linear trend (1979-2001): CRUTEM2v 0.31OC/decade
ERA-40 0.28OC/decade
NCEP 0.19OC/decade
Slide 9
Slide 10
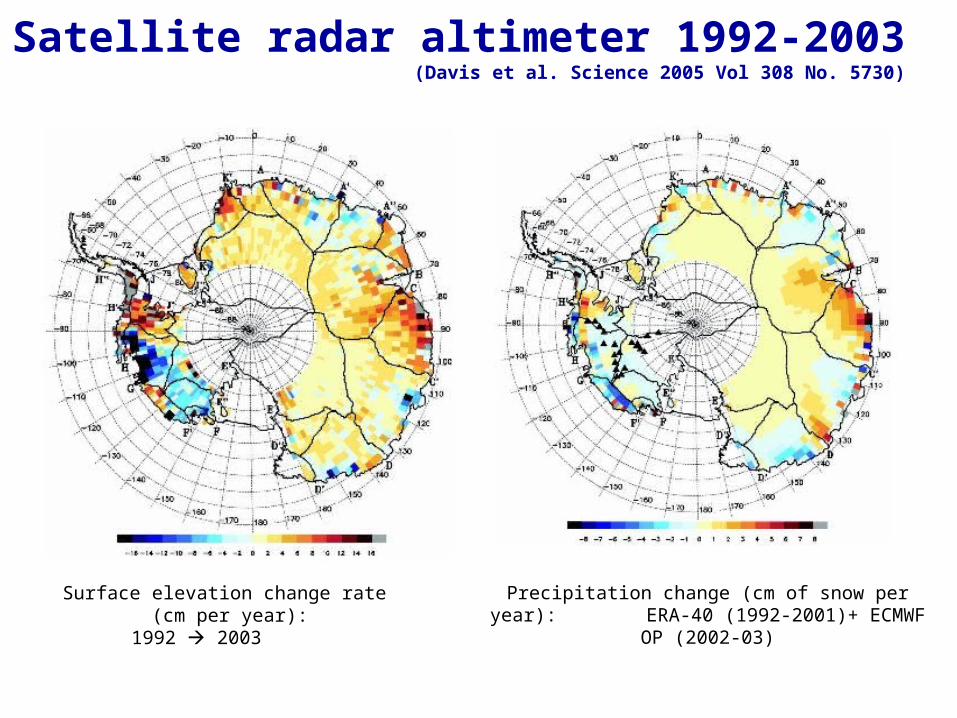
Satellite radar altimeter 1992-2003(Davis et al. Science 2005 Vol 308 No. 5730)
Surface elevation change rate (cm per year):
1992 2003
Precipitation change (cm of snow per year): ERA-40 (1992-2001)+ ECMWF OP (2002-03)

Slide 11
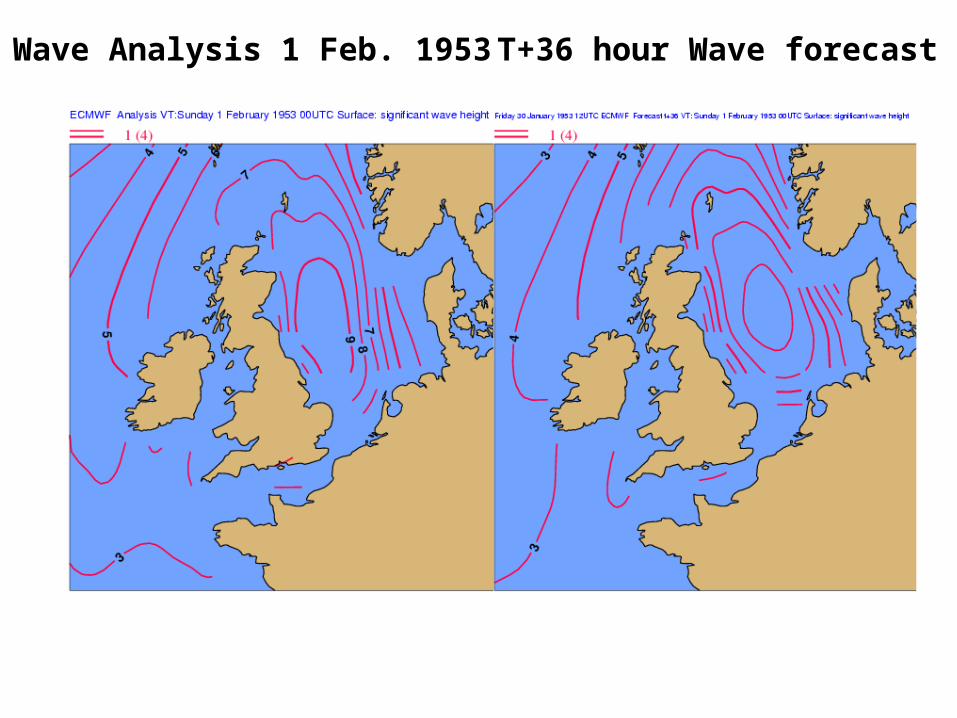
The Great Flood of 1953
The greatest surge on record for the North Sea as a whole occurred on 31 January and 1 February 1953. In the Netherlands 1,800 people drowned and in eastern England 307 people died.

Slide 12
February 1953 00UTC The 500 hPa “Carpet” donated to ECMWF by
the Netherlands

Slide 13

Slide 14
Analysis
Sunday 1 February 1953 00UTC 500 hPa geopotential

Slide 15
Forecast +7D
Analysis 1 Feb. 1953 T+168 hours
Slide 16
Wave Analysis 1 Feb. 1953 T+36 hour Wave forecast
Slide 17
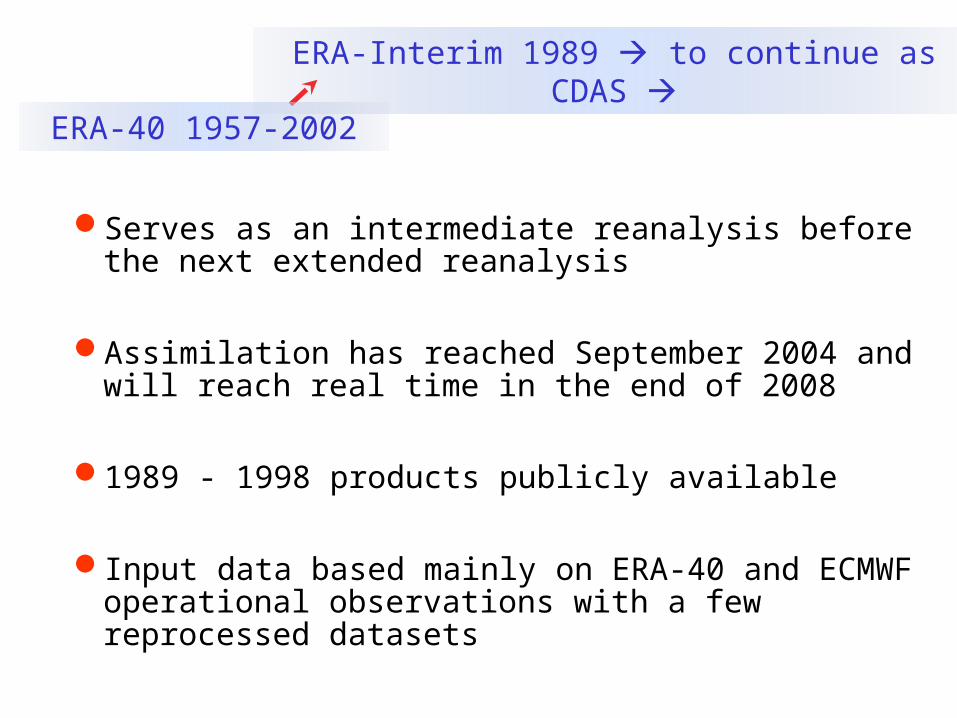
Serves as an intermediate reanalysis before the next extended reanalysis
Assimilation has reached September 2004 and will reach real time in the end of 2008
1989 - 1998 products publicly available
Input data based mainly on ERA-40 and ECMWF operational observations with a few reprocessed datasets
ERA-40 1957-2002
ERA-Interim 1989 to continue as CDAS
Slide 18
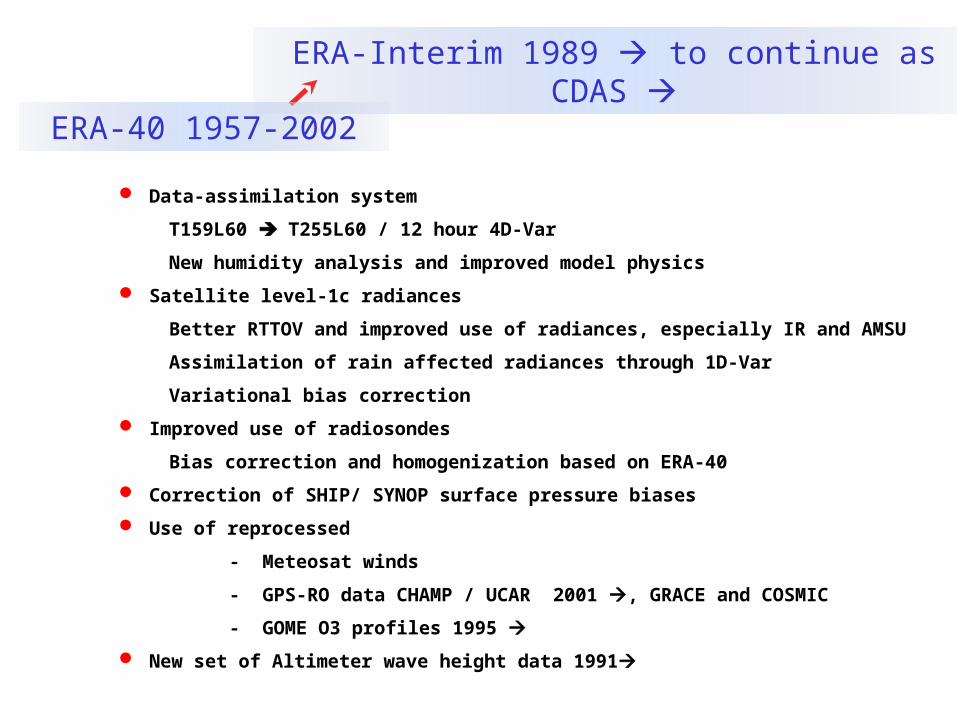
Data-assimilation system
T159L60 T255L60 / 12 hour 4D-Var
New humidity analysis and improved model physics
Satellite level-1c radiances
Better RTTOV and improved use of radiances, especially IR and AMSU
Assimilation of rain affected radiances through 1D-Var
Variational bias correction
Improved use of radiosondes
Bias correction and homogenization based on ERA-40
Correction of SHIP/ SYNOP surface pressure biases
Use of reprocessed
- Meteosat winds
- GPS-RO data CHAMP / UCAR 2001 , GRACE and COSMIC
- GOME O3 profiles 1995
New set of Altimeter wave height data 1991
ERA-40 1957-2002
ERA-Interim 1989 to continue as CDAS
Slide 19
56
54
5452
49
49
41
30
28
2321 21
19
19
18
10
87
6
301
2
3
3
5
5
6
11
11
11
11
13
18
24
24
3840
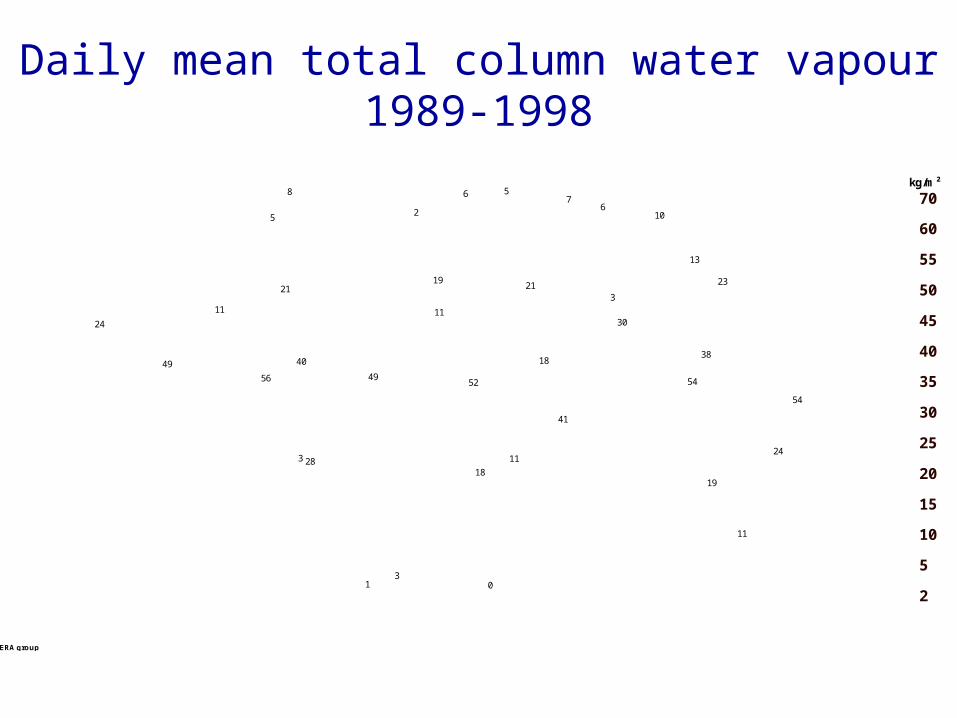
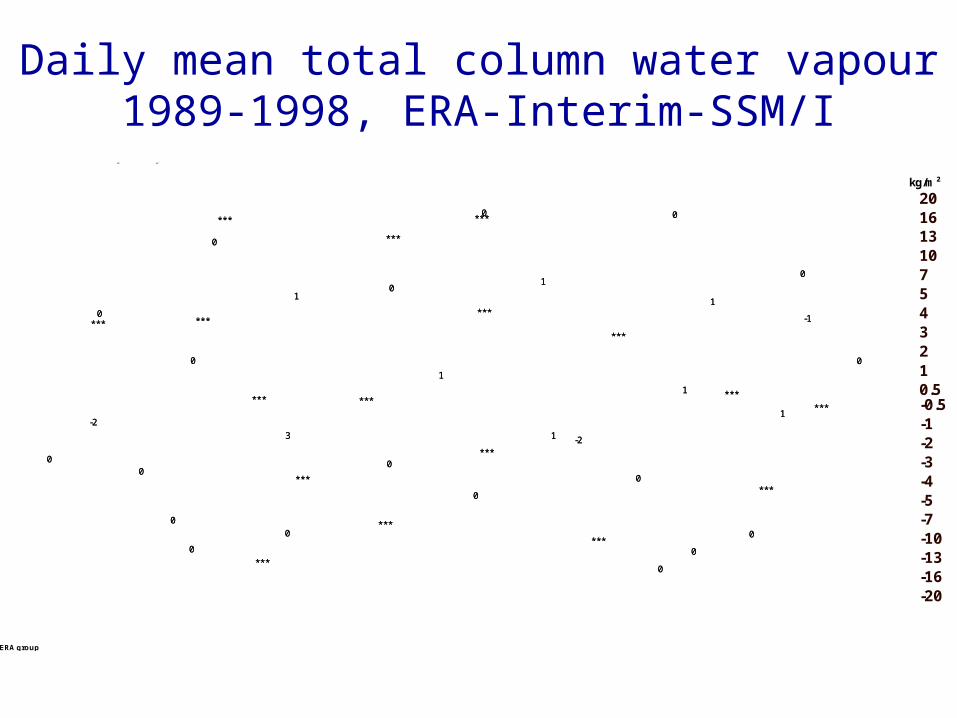
0006 monthly/daily mean 198901 to 199812total column water vapour
kg/m²
2
5
10
15
20
25
30
35
40
45
50
55
60
70
ERA group
Daily mean total column water vapour1989-1998
Slide 20
10
7
5
44
3
3
2
2
1
1
1
1
1
1
0
0
0
0
0
0
0
-1
-1
-1
-1
-1
-1
-3
-11
-11
-8
-7-7
-3
-3
-3
-3
-2
-2
-2
-2
-2-2
-2
-1
-1
-1-1
-1
-1
-1
-1
00
0
10
7
5
44
3
3
2
2
1
1
1
1
1
1
0
0
0
0
0
0
0
-1
-1
-1
-1
-1
-1
-3
-11
-11
-8
-7-7
-3
-3
-3
-3
-2
-2
-2
-2
-2-2
-2
-1
-1
-1-1
-1
-1
-1
-1
00
0
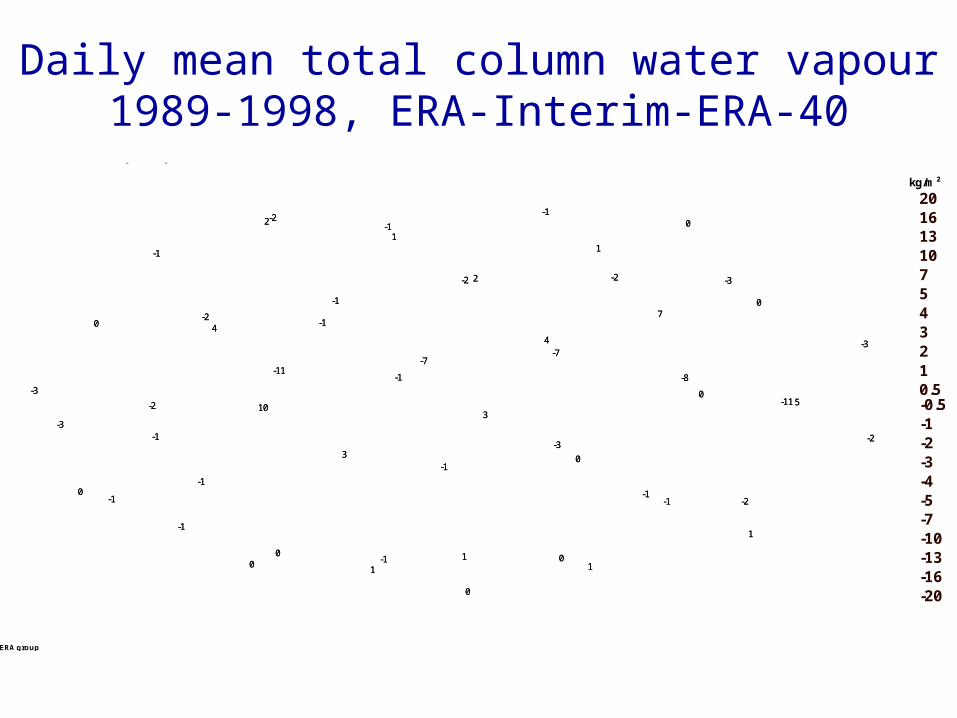
ERA40 monthly/daily mean 198901 to 199812differences to0006 monthly/daily mean 198901 to 199812total column water vapour
kg/m²
-20-16-13-10-7-5-4-3-2-1-0.50.512345710131620
ERA group
Daily mean total column water vapour1989-1998, ERA-Interim-ERA-40
Slide 21
3
11
1
1
1
1
1
0
0
0
0
0
0
0
0
0
0
0
0 0
0
0
0
0
***
***
***
***
***
***
***
***
***
***
***
***
***
***
*** ***
***
-2
-2
-1
0
0
3
11
1
1
1
1
1
0
0
0
0
0
0
0
0
0
0
0
0 0
0
0
0
0
***
***
***
***
***
***
***
***
***
***
***
***
***
***
*** ***
***
-2
-2
-1
0
0
SSM/I monthly/daily mean 198901 to 199812differences to0006 monthly/daily mean 198901 to 199812total column water vapour
kg/m²
-20-16-13-10-7-5-4-3-2-1-0.50.512345710131620
ERA group
Daily mean total column water vapour1989-1998, ERA-Interim-SSM/I
Slide 22
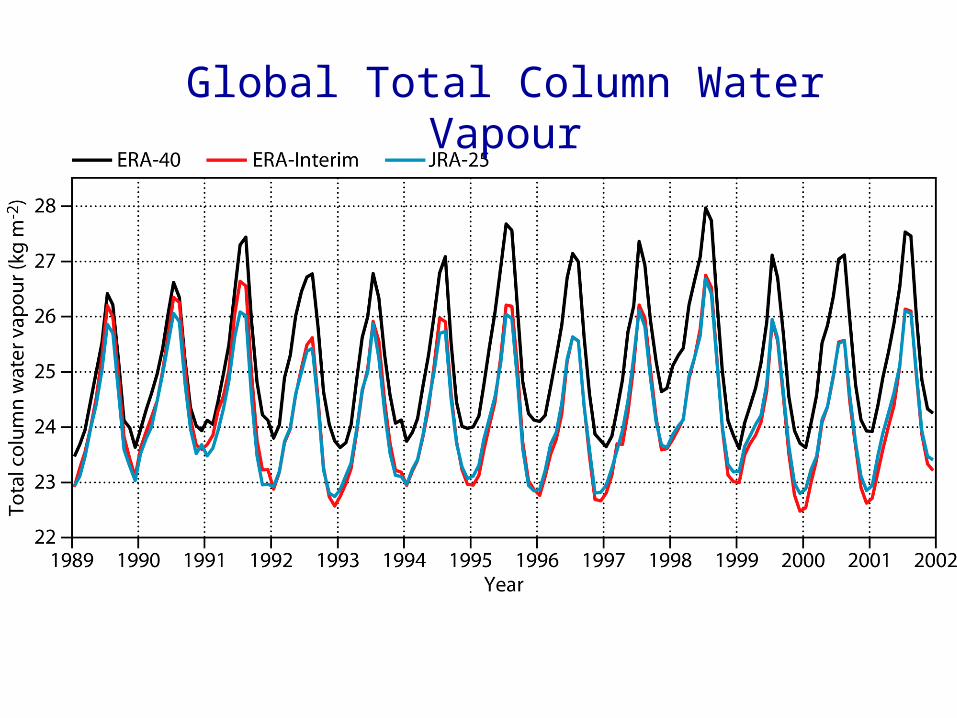
Global Total Column Water Vapour
Slide 23
29
21
1413
12
12
1110
10
9
7
6
6
6
5
4
44
3
3
3 3
3
3
2
2
2
1
1
1
0
0
0
0
0
0
0
0
0
0
11
1
1
1
1
2
2
2
2
2
2
2
3
3
3
3
3
8
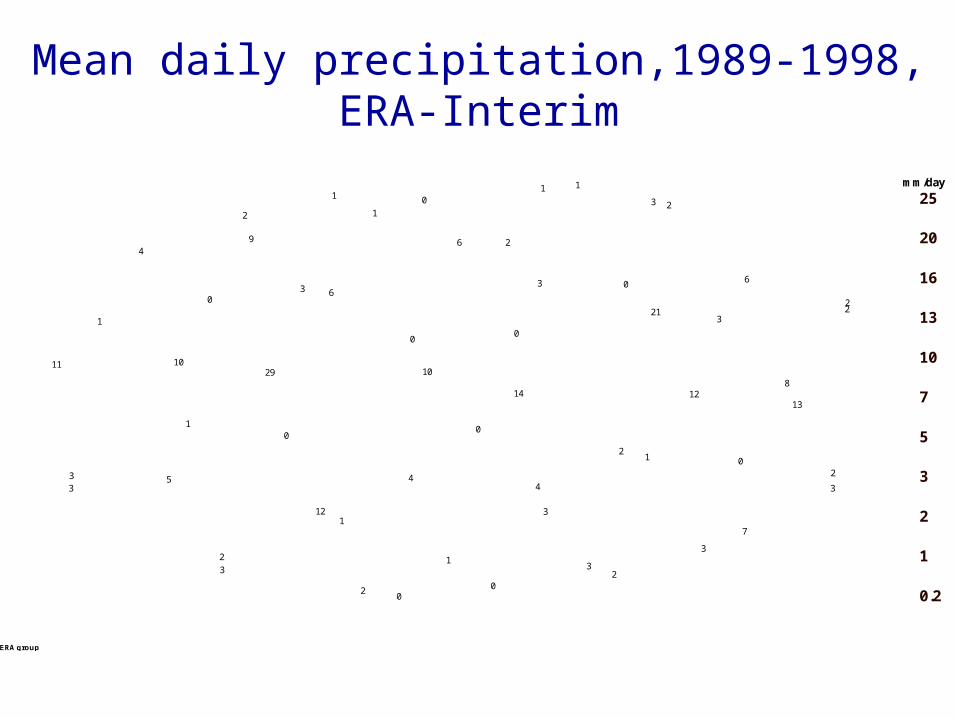
total precipitationERA-Interim. 0006 monthly/daily accumulation. +12h.
mm/day
0.2
1
2
3
5
7
10
13
16
20
25
ERA group
Mean daily precipitation,1989-1998, ERA-Interim
Slide 24
14
6
5
4
3
3
2
2
2
2
1
1
1
1
1
1
1
0
0
0
0 0
0
0
0
0
0
0
0-1 -24
-15 -14-9
-5
-4
-4
-3
-2
-1
-1
-1
-1
-1
-1
-1
0
0
0
0
0
0
0
0
0
0
0
14
6
5
4
3
3
2
2
2
2
1
1
1
1
1
1
1
0
0
0
0 0
0
0
0
0
0
0
0-1 -24
-15 -14-9
-5
-4
-4
-3
-2
-1
-1
-1
-1
-1
-1
-1
0
0
0
0
0
0
0
0
0
0
0
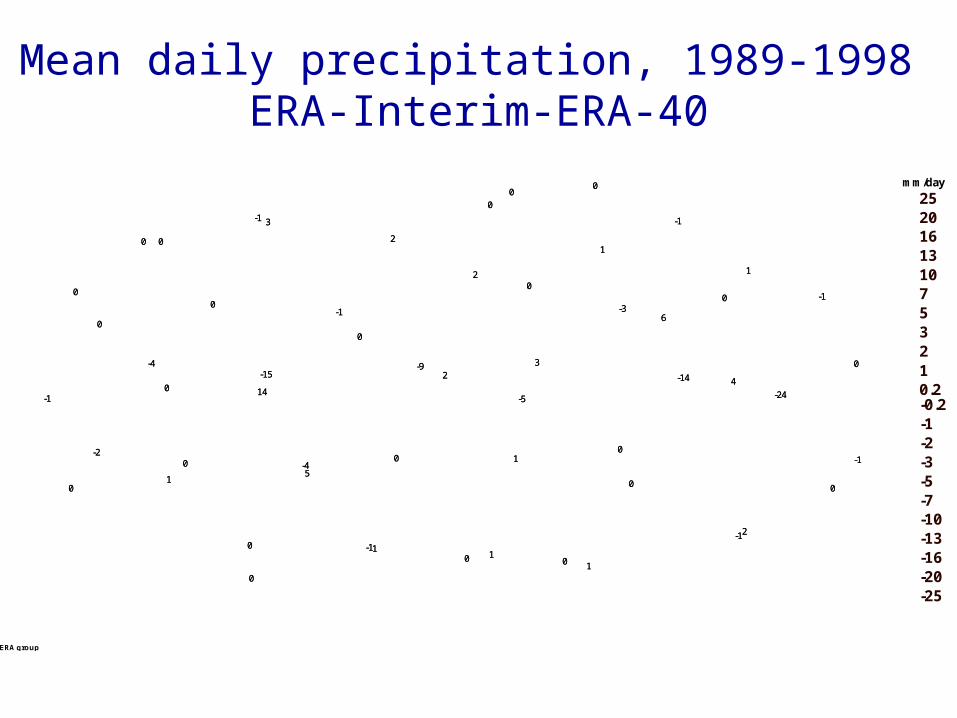
ERA40 198901 to 199812 +12hdifferences toERA-Interim. 0006 198901 to 199812 +12htotal precipitation
mm/day
-25-20-16-13-10-7-5-3-2-1-0.20.2123571013162025
ERA group
Mean daily precipitation, 1989-1998 ERA-Interim-ERA-40

Slide 25
ERA-40 +00h JRA-25 +00h RSS +00h ERA-Int +00hTotal column water vapour (Kg/m**2) Tropical Oceans
1989 1990 1991 1992 1993 1994 1995 1996 1997 1998 1999 2000 200138
40
42
44
46
48
38
40
42
44
46
48

Slide 26
Tropical Ocean areas

Slide 27
27
20
12
1110
7
66 6
6
5
5
4
3
3
3
3
2
22
1
1
1
1
0
0
0
-2
-6
-6
-5-5
-4
-4
-4
-4
-4
-3
-3-3
-2
-2
-2
-2
-1
-1
0
0
0
0
0
11
27
20
12
1110
7
66 6
6
5
5
4
3
3
3
3
2
22
1
1
1
1
0
0
0
-2
-6
-6
-5-5
-4
-4
-4
-4
-4
-3
-3-3
-2
-2
-2
-2
-1
-1
0
0
0
0
0
11
precipitation - evaporationERA-Interim. 0006 monthly/daily accumulation. +12h.
mm/day
-13
-10
-7
-5
-3
-2
-1
-0.20.2
1
2
3
5
7
10
13
16
20
25
ERA group

Slide 28
ERA-40 +12h ERA-Int +12hPrecipitation - evaporation (mm/day) The entire Globe
1989 1990 1991 1992 1993 1994 1995 1996 1997 1998 1999 2000 2001-0.2
0
0.2
0.4
0.6
0.8
-0.2
0
0.2
0.4
0.6
0.8
Slide 29
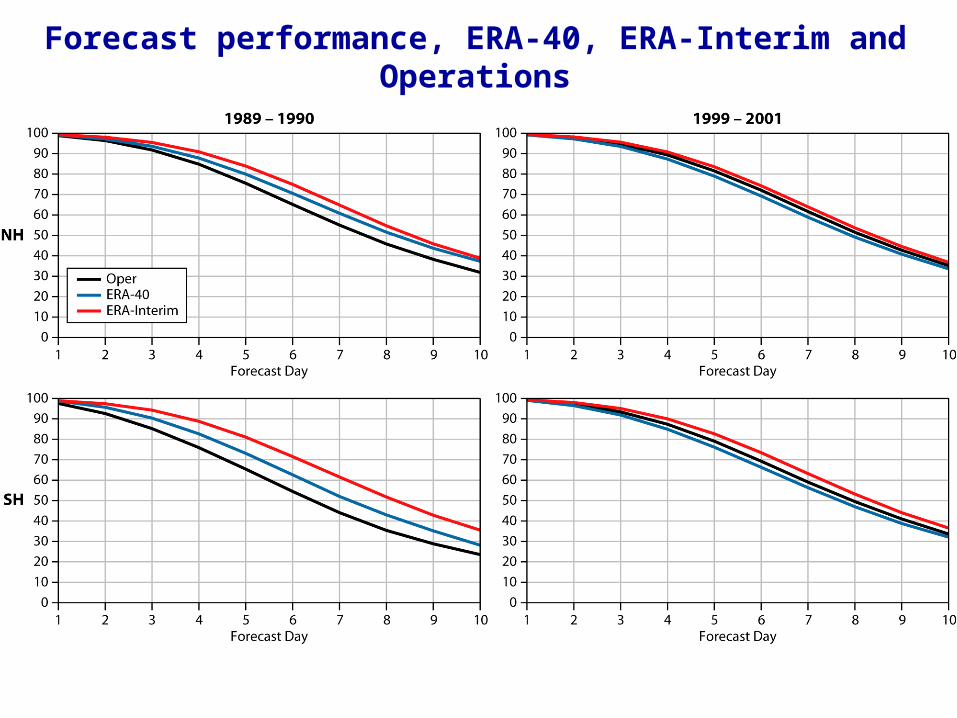
Forecast performance, ERA-40, ERA-Interim and Operations
Slide 30
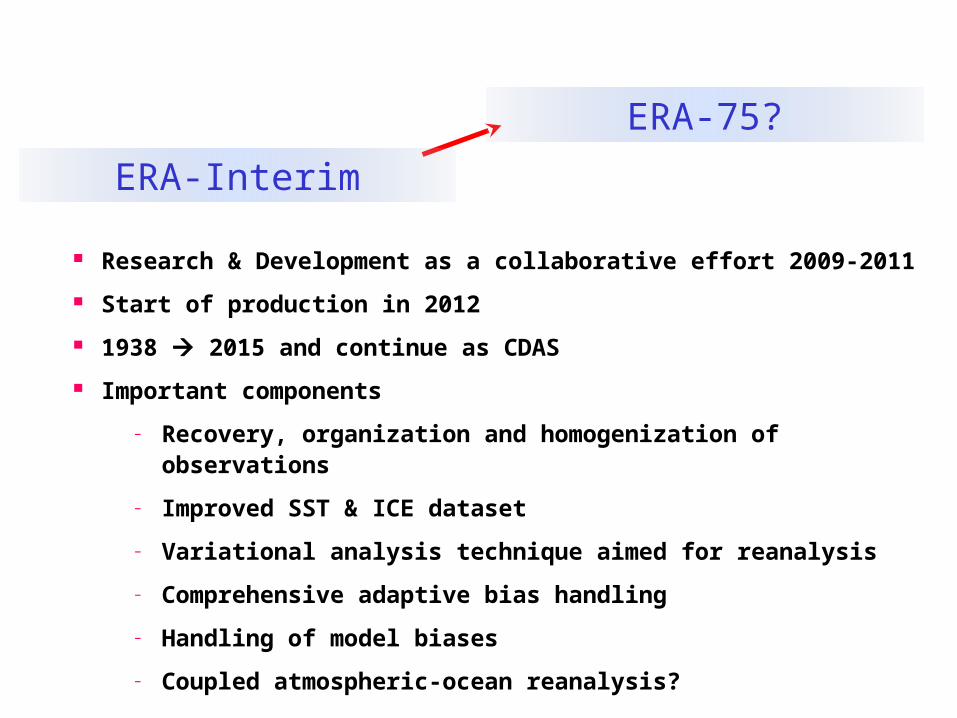
Research & Development as a collaborative effort 2009-2011
Start of production in 2012
1938 2015 and continue as CDAS
Important components
– Recovery, organization and homogenization of observations
– Improved SST & ICE dataset
– Variational analysis technique aimed for reanalysis
– Comprehensive adaptive bias handling
– Handling of model biases
– Coupled atmospheric-ocean reanalysis?
ERA-Interim
ERA-75?
Slide 31

Slide 32
Slide 33
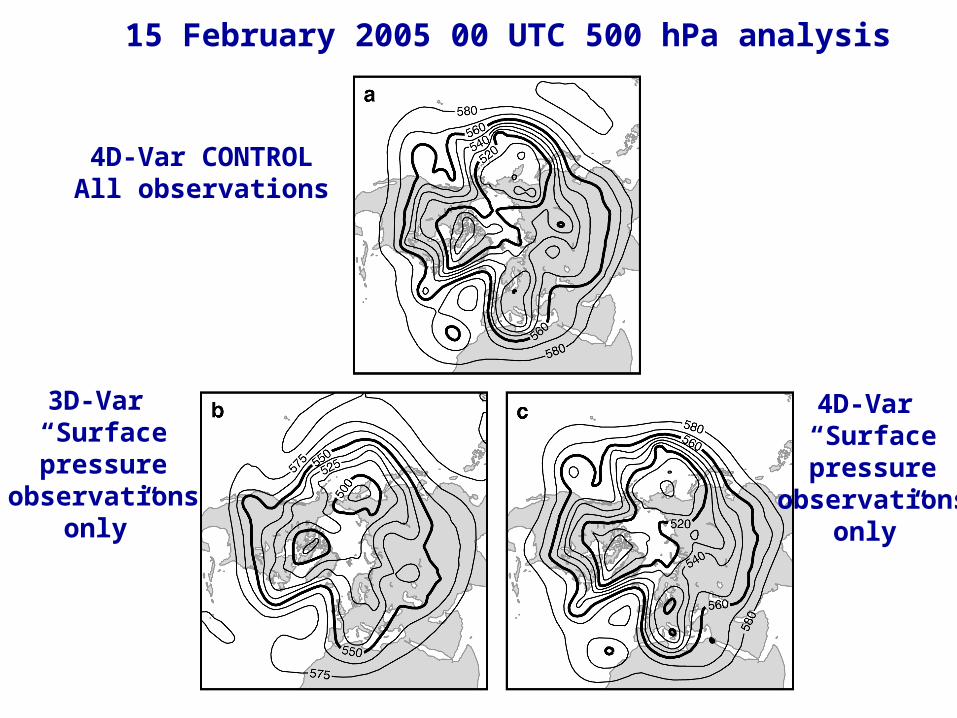
4D-Var CONTROLAll observations
3D-Var “Surfacepressure
observationsonly”
4D-Var “Surfacepressure
observationsonly”
15 February 2005 00 UTC 500 hPa analysis


