55
Sales Compensation Practices: The 2012 – 2013 Special Survey Report Concord, MA
Sales Compensation Practices:
The 2012 – 2013 Special Survey Report
Concord, MA
2 © The Wilson Group Survey of Sales Compensation Practices. All rights reserved. The information may not be duplicated or distributed in any fashion without prior permission from the Wilson Group. Please contact us at 978-371-0476. Thank you.
Table of Contents
Page
I. Overview of the Survey and Participants’ Profile 3
II. How Sales Compensation Plans Are Structured 8 A. Direct Sales Executive B. Account Manager C. Distribution/Channel Manager
III. Comparison of Sales Plan by Market Segment 38 A. By Industry B. By Company size
IV. Assessment of the Effectiveness of These Plans 49
V. Primary Conclusions and Ideas to Consider 55
Overview of the Wilson Group 56
3 © The Wilson Group Survey of Sales Compensation Practices. All rights reserved. The information may not be duplicated or distributed in any fashion without prior permission from the Wilson Group. Please contact us at 978-371-0476. Thank you.
I. Overview of the Survey and Participants’ Profile
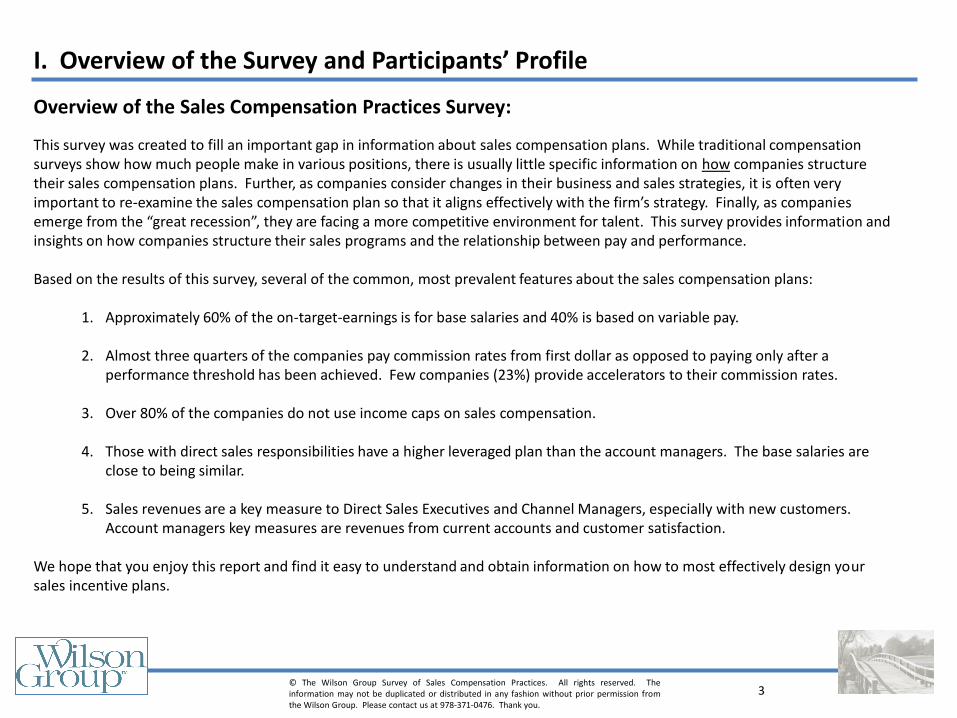
Overview of the Sales Compensation Practices Survey:
This survey was created to fill an important gap in information about sales compensation plans. While traditional compensation surveys show how much people make in various positions, there is usually little specific information on how companies structure their sales compensation plans. Further, as companies consider changes in their business and sales strategies, it is often very important to re-examine the sales compensation plan so that it aligns effectively with the firm’s strategy. Finally, as companies emerge from the “great recession”, they are facing a more competitive environment for talent. This survey provides information and insights on how companies structure their sales programs and the relationship between pay and performance. Based on the results of this survey, several of the common, most prevalent features about the sales compensation plans:
1. Approximately 60% of the on-target-earnings is for base salaries and 40% is based on variable pay. 2. Almost three quarters of the companies pay commission rates from first dollar as opposed to paying only after a
performance threshold has been achieved. Few companies (23%) provide accelerators to their commission rates.
3. Over 80% of the companies do not use income caps on sales compensation.
4. Those with direct sales responsibilities have a higher leveraged plan than the account managers. The base salaries are close to being similar.
5. Sales revenues are a key measure to Direct Sales Executives and Channel Managers, especially with new customers. Account managers key measures are revenues from current accounts and customer satisfaction.
We hope that you enjoy this report and find it easy to understand and obtain information on how to most effectively design your sales incentive plans.
4 © The Wilson Group Survey of Sales Compensation Practices. All rights reserved. The information may not be duplicated or distributed in any fashion without prior permission from the Wilson Group. Please contact us at 978-371-0476. Thank you.
Demographics: Profile of the Participating Companies
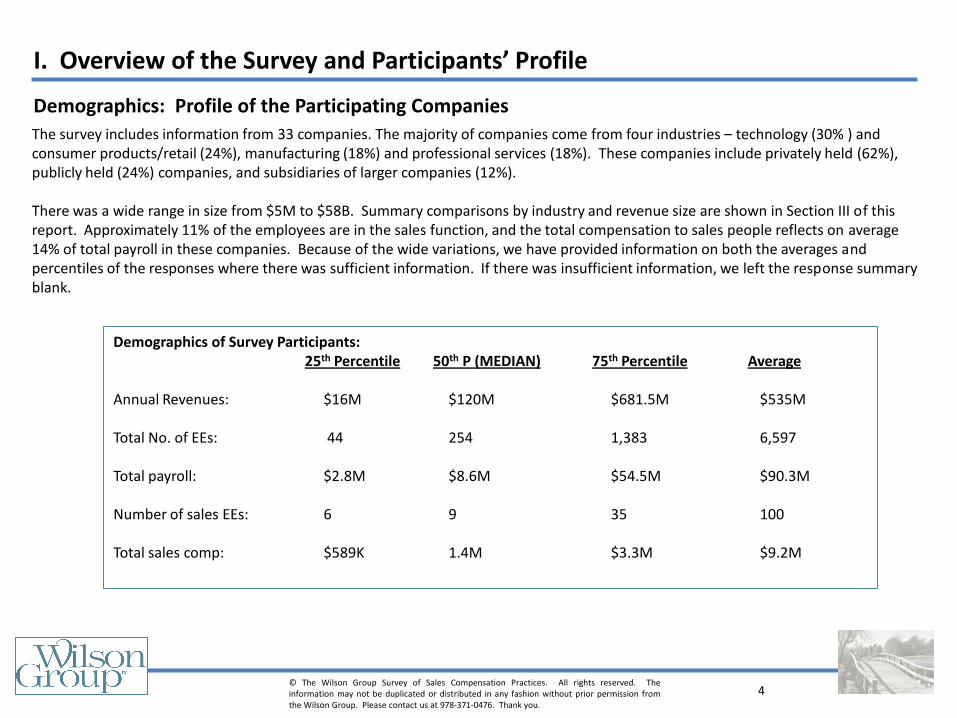
The survey includes information from 33 companies. The majority of companies come from four industries – technology (30% ) and consumer products/retail (24%), manufacturing (18%) and professional services (18%). These companies include privately held (62%), publicly held (24%) companies, and subsidiaries of larger companies (12%). There was a wide range in size from $5M to $58B. Summary comparisons by industry and revenue size are shown in Section III of this report. Approximately 11% of the employees are in the sales function, and the total compensation to sales people reflects on average 14% of total payroll in these companies. Because of the wide variations, we have provided information on both the averages and percentiles of the responses where there was sufficient information. If there was insufficient information, we left the response summary blank.
Demographics of Survey Participants: 25th Percentile 50th P (MEDIAN) 75th Percentile Average Annual Revenues: $16M $120M $681.5M $535M Total No. of EEs: 44 254 1,383 6,597 Total payroll: $2.8M $8.6M $54.5M $90.3M Number of sales EEs: 6 9 35 100 Total sales comp: $589K 1.4M $3.3M $9.2M
I. Overview of the Survey and Participants’ Profile
5 © The Wilson Group Survey of Sales Compensation Practices. All rights reserved. The information may not be duplicated or distributed in any fashion without prior permission from the Wilson Group. Please contact us at 978-371-0476. Thank you.
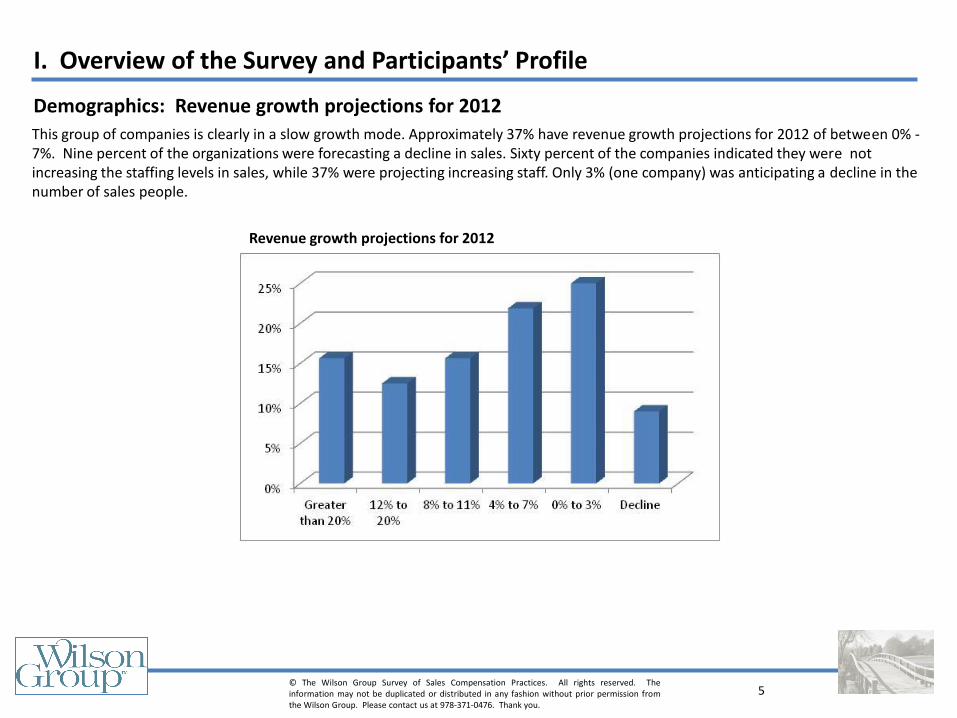
Demographics: Revenue growth projections for 2012
This group of companies is clearly in a slow growth mode. Approximately 37% have revenue growth projections for 2012 of between 0% - 7%. Nine percent of the organizations were forecasting a decline in sales. Sixty percent of the companies indicated they were not increasing the staffing levels in sales, while 37% were projecting increasing staff. Only 3% (one company) was anticipating a decline in the number of sales people.
I. Overview of the Survey and Participants’ Profile
Revenue growth projections for 2012
6 © The Wilson Group Survey of Sales Compensation Practices. All rights reserved. The information may not be duplicated or distributed in any fashion without prior permission from the Wilson Group. Please contact us at 978-371-0476. Thank you.
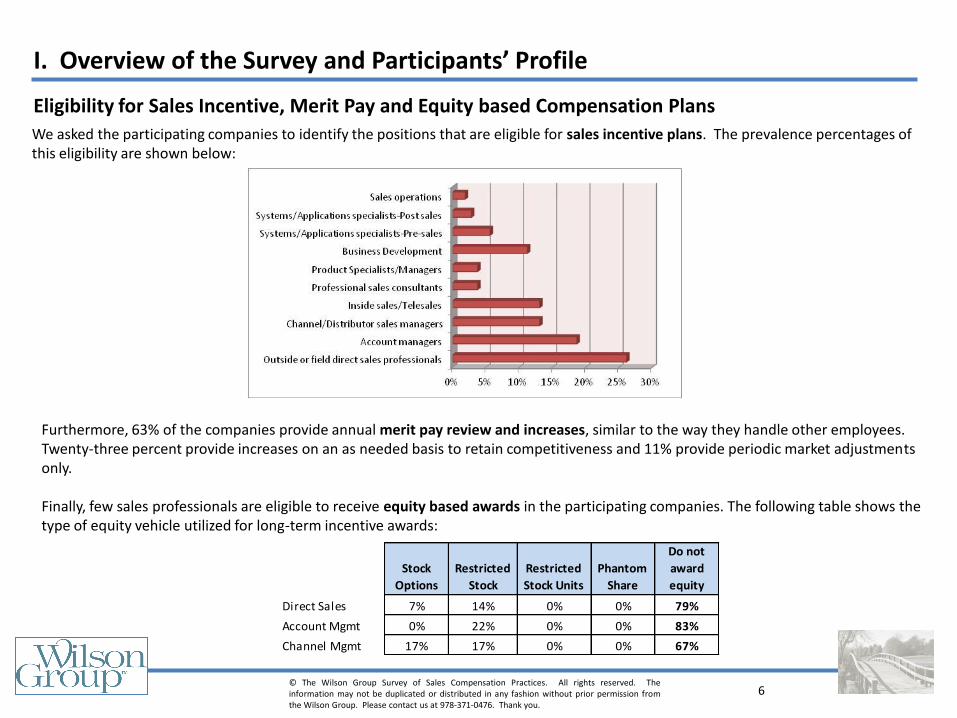
Eligibility for Sales Incentive, Merit Pay and Equity based Compensation Plans
We asked the participating companies to identify the positions that are eligible for sales incentive plans. The prevalence percentages of this eligibility are shown below:
I. Overview of the Survey and Participants’ Profile
Furthermore, 63% of the companies provide annual merit pay review and increases, similar to the way they handle other employees. Twenty-three percent provide increases on an as needed basis to retain competitiveness and 11% provide periodic market adjustments only. Finally, few sales professionals are eligible to receive equity based awards in the participating companies. The following table shows the type of equity vehicle utilized for long-term incentive awards:
Stock
Options
Restricted
Stock
Restricted
Stock Units
Phantom
Share
Do not
award
equity
Direct Sales 7% 14% 0% 0% 79%
Account Mgmt 0% 22% 0% 0% 83%
Channel Mgmt 17% 17% 0% 0% 67%
7 © The Wilson Group Survey of Sales Compensation Practices. All rights reserved. The information may not be duplicated or distributed in any fashion without prior permission from the Wilson Group. Please contact us at 978-371-0476. Thank you.
I. Overview of the Survey and Participants’ Profile
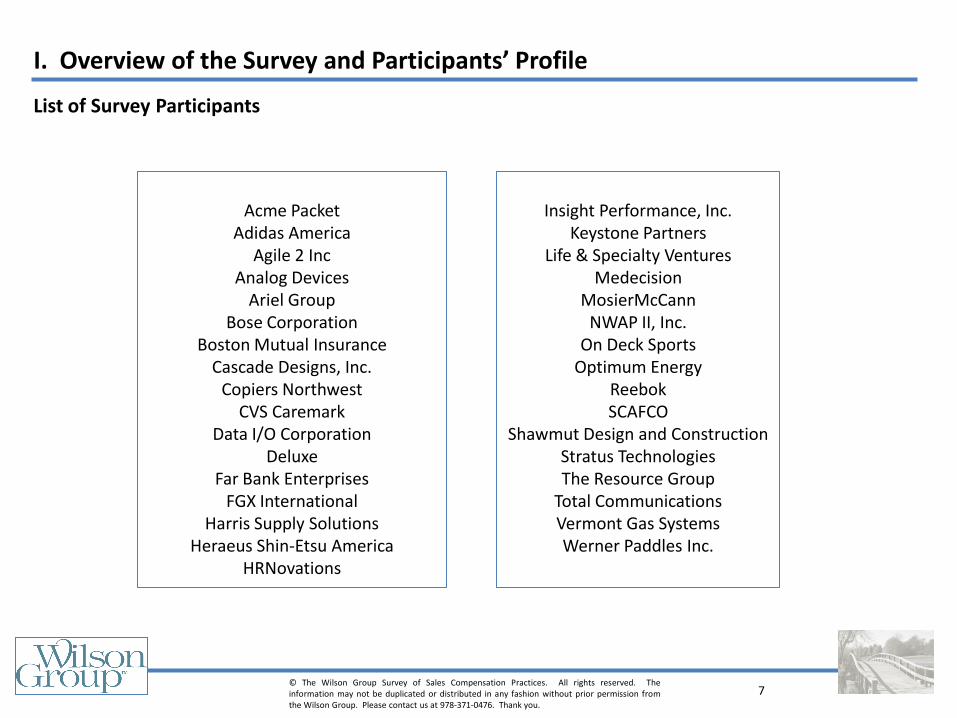
List of Survey Participants
Acme Packet
Adidas America Agile 2 Inc
Analog Devices Ariel Group
Bose Corporation Boston Mutual Insurance
Cascade Designs, Inc. Copiers Northwest
CVS Caremark Data I/O Corporation
Deluxe Far Bank Enterprises
FGX International Harris Supply Solutions
Heraeus Shin-Etsu America HRNovations
Insight Performance, Inc.
Keystone Partners Life & Specialty Ventures
Medecision MosierMcCann
NWAP II, Inc. On Deck Sports
Optimum Energy Reebok SCAFCO
Shawmut Design and Construction Stratus Technologies The Resource Group
Total Communications Vermont Gas Systems Werner Paddles Inc.
8 © The Wilson Group Survey of Sales Compensation Practices. All rights reserved. The information may not be duplicated or distributed in any fashion without prior permission from the Wilson Group. Please contact us at 978-371-0476. Thank you.
II. How Sales Compensation Plans Are Structured
This section of the report will provide a summary of the responses for all participants. The survey examined the sales practices for three (3) positions. These are:
Direct Sales Executive Account Manager Channel (Indirect) Manager
This section will examine the sales compensation design elements for each of these positions. We will first provide the job profile that was included in the survey. Participants were asked to indicate their confidence (expressed as a percentage) of their job match to the job profile. The average responses of the confidence factor exceeded 90% for each of these jobs. In the section that follows (Section III) we will examine the responses to the most critical questions, or ones where there was most variance in responses, by industry and by company size (based on revenues). We hope this information provides important insights to your company’s sales compensation practices as you compare them to the market.
Overview of this Section
9 © The Wilson Group Survey of Sales Compensation Practices. All rights reserved. The information may not be duplicated or distributed in any fashion without prior permission from the Wilson Group. Please contact us at 978-371-0476. Thank you.
The following is the position profile on which the respondents based their sales plan information:
II. How Sales Compensation Plans Are Structured – Direct Sales Executive
Direct Sales Executive: Responsible for generating new and/or existing sales from assigned territories, product lines or named accounts. Involves contacting, visiting and building relationships with prospects. Builds a network of referral sources and/or handles leads generated through the company’s marketing initiatives. Participates in analyzing the customer’s needs and opportunities, presenting products and services that can address the customer’s needs, and closing the contract agreement. Demonstrates knowledge of the organization’s products and services, and may have in-depth knowledge of a subset of products or services. This is the seasoned, mid-career level sales position. Requires a minimum of an associate's or bachelor’s degree or its equivalent with 6-9 years of experience in the field or in a related sales area. Relies on experience and judgment to plan and accomplish goals, and utilizes trained sales skills and practices consistent with the firm’s marketing and sales strategies. Typically reports to a district or regional manager or head of a unit/department.
10 © The Wilson Group Survey of Sales Compensation Practices. All rights reserved. The information may not be duplicated or distributed in any fashion without prior permission from the Wilson Group. Please contact us at 978-371-0476. Thank you.
II. How Sales Compensation Plans Are Structured – Direct Sales Executive
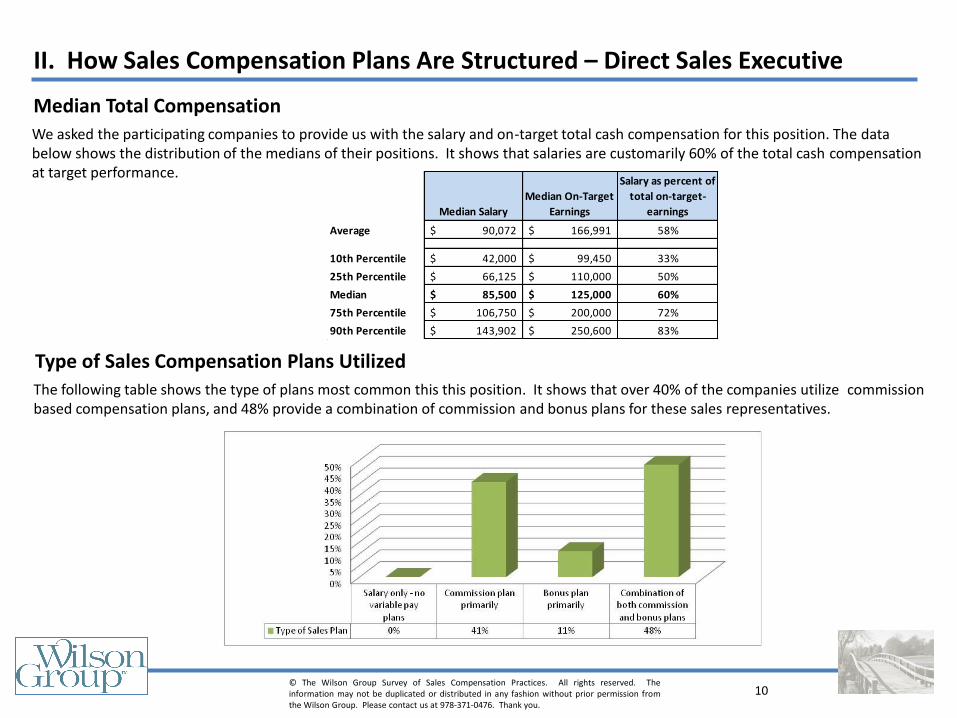
Median Total Compensation
We asked the participating companies to provide us with the salary and on-target total cash compensation for this position. The data below shows the distribution of the medians of their positions. It shows that salaries are customarily 60% of the total cash compensation at target performance.
Type of Sales Compensation Plans Utilized
The following table shows the type of plans most common this this position. It shows that over 40% of the companies utilize commission based compensation plans, and 48% provide a combination of commission and bonus plans for these sales representatives.
Median Salary
Median On-Target
Earnings
Salary as percent of
total on-target-
earnings
Average 90,072$ 166,991$ 58%
10th Percentile 42,000$ 99,450$ 33%
25th Percentile 66,125$ 110,000$ 50%
Median 85,500$ 125,000$ 60%
75th Percentile 106,750$ 200,000$ 72%
90th Percentile 143,902$ 250,600$ 83%
11 © The Wilson Group Survey of Sales Compensation Practices. All rights reserved. The information may not be duplicated or distributed in any fashion without prior permission from the Wilson Group. Please contact us at 978-371-0476. Thank you.
II. How Sales Compensation Plans Are Structured – Direct Sales Executive
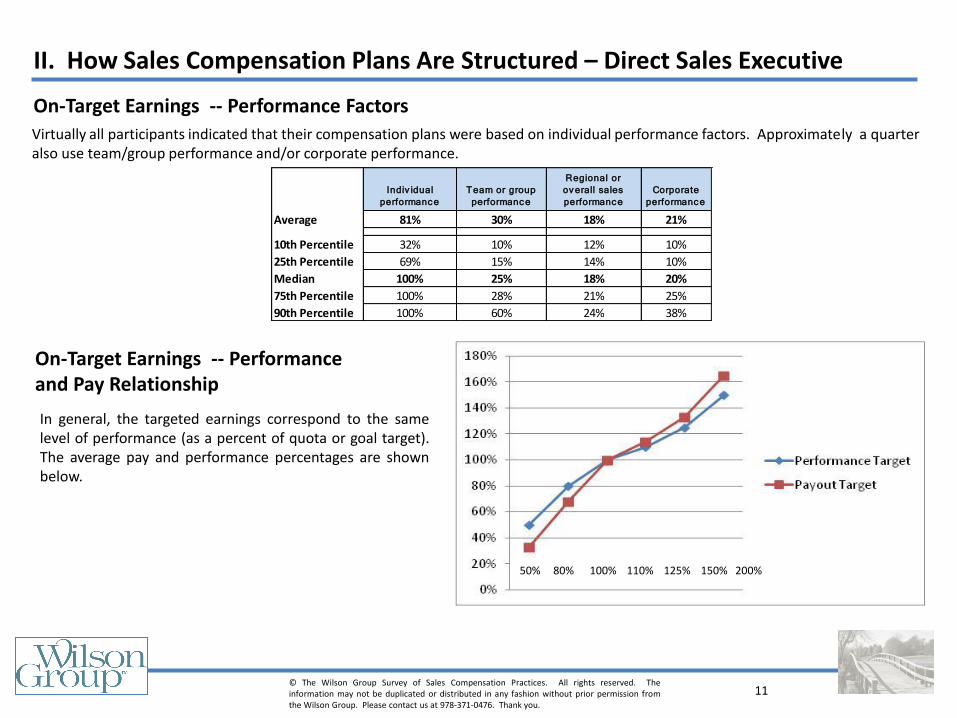
On-Target Earnings -- Performance Factors
Virtually all participants indicated that their compensation plans were based on individual performance factors. Approximately a quarter also use team/group performance and/or corporate performance.
On-Target Earnings -- Performance and Pay Relationship
In general, the targeted earnings correspond to the same level of performance (as a percent of quota or goal target). The average pay and performance percentages are shown below.
50% 80% 100% 110% 125% 150% 200%
Indiv idual
performance
Team or group
performance
Regional or
overall sales
performance
Corporate
performance
Average 81% 30% 18% 21%
10th Percentile 32% 10% 12% 10%
25th Percentile 69% 15% 14% 10%
Median 100% 25% 18% 20%
75th Percentile 100% 28% 21% 25%
90th Percentile 100% 60% 24% 38%
12 © The Wilson Group Survey of Sales Compensation Practices. All rights reserved. The information may not be duplicated or distributed in any fashion without prior permission from the Wilson Group. Please contact us at 978-371-0476. Thank you.
II. How Sales Compensation Plans Are Structured – Direct Sales Executive
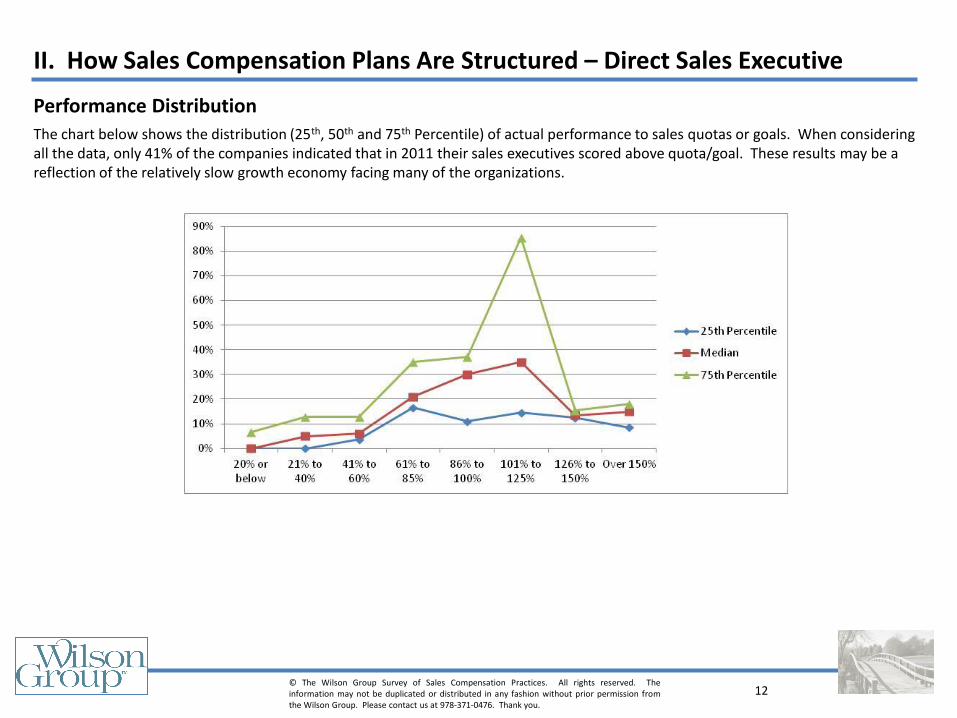
Performance Distribution
The chart below shows the distribution (25th, 50th and 75th Percentile) of actual performance to sales quotas or goals. When considering all the data, only 41% of the companies indicated that in 2011 their sales executives scored above quota/goal. These results may be a reflection of the relatively slow growth economy facing many of the organizations.
13 © The Wilson Group Survey of Sales Compensation Practices. All rights reserved. The information may not be duplicated or distributed in any fashion without prior permission from the Wilson Group. Please contact us at 978-371-0476. Thank you.
II. How Sales Compensation Plans Are Structured – Direct Sales Executive
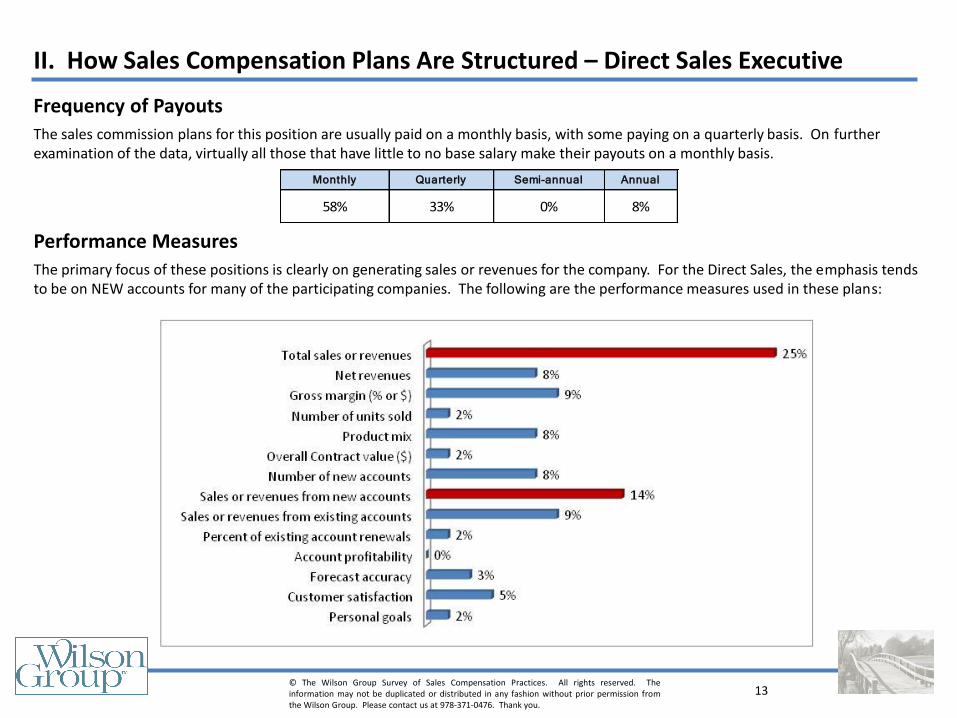
Frequency of Payouts
The sales commission plans for this position are usually paid on a monthly basis, with some paying on a quarterly basis. On further examination of the data, virtually all those that have little to no base salary make their payouts on a monthly basis.
Performance Measures
The primary focus of these positions is clearly on generating sales or revenues for the company. For the Direct Sales, the emphasis tends to be on NEW accounts for many of the participating companies. The following are the performance measures used in these plans:
Monthly Quarterly Semi-annual Annual
58% 33% 0% 8%
14 © The Wilson Group Survey of Sales Compensation Practices. All rights reserved. The information may not be duplicated or distributed in any fashion without prior permission from the Wilson Group. Please contact us at 978-371-0476. Thank you.
II. How Sales Compensation Plans Are Structured – Direct Sales Executive
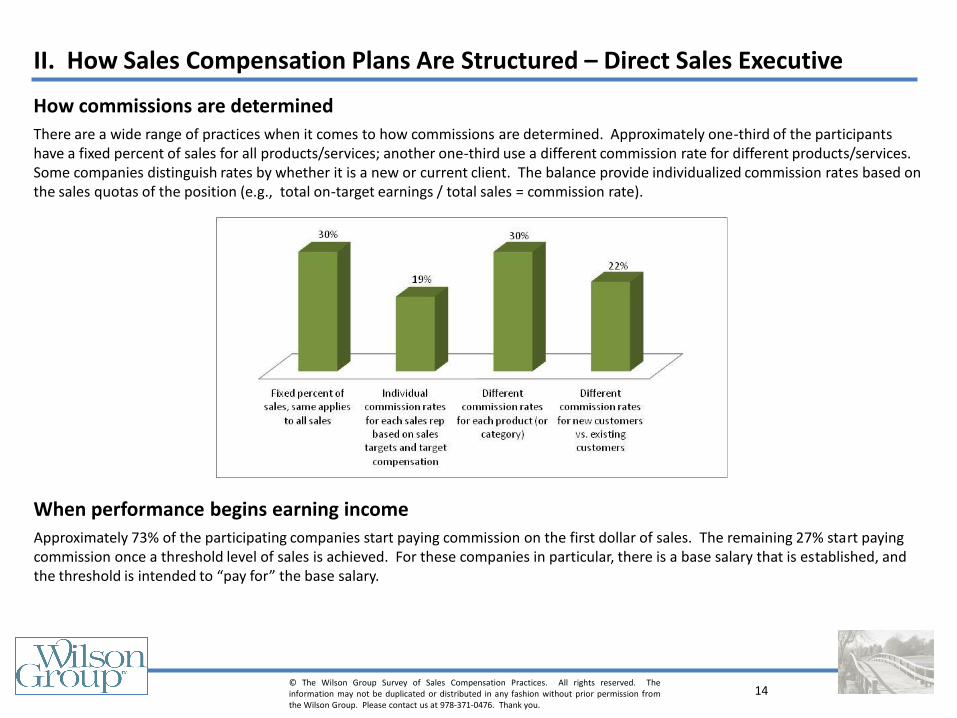
How commissions are determined
There are a wide range of practices when it comes to how commissions are determined. Approximately one-third of the participants have a fixed percent of sales for all products/services; another one-third use a different commission rate for different products/services. Some companies distinguish rates by whether it is a new or current client. The balance provide individualized commission rates based on the sales quotas of the position (e.g., total on-target earnings / total sales = commission rate).
When performance begins earning income
Approximately 73% of the participating companies start paying commission on the first dollar of sales. The remaining 27% start paying commission once a threshold level of sales is achieved. For these companies in particular, there is a base salary that is established, and the threshold is intended to “pay for” the base salary.
15 © The Wilson Group Survey of Sales Compensation Practices. All rights reserved. The information may not be duplicated or distributed in any fashion without prior permission from the Wilson Group. Please contact us at 978-371-0476. Thank you.
II. How Sales Compensation Plans Are Structured – Direct Sales Executive
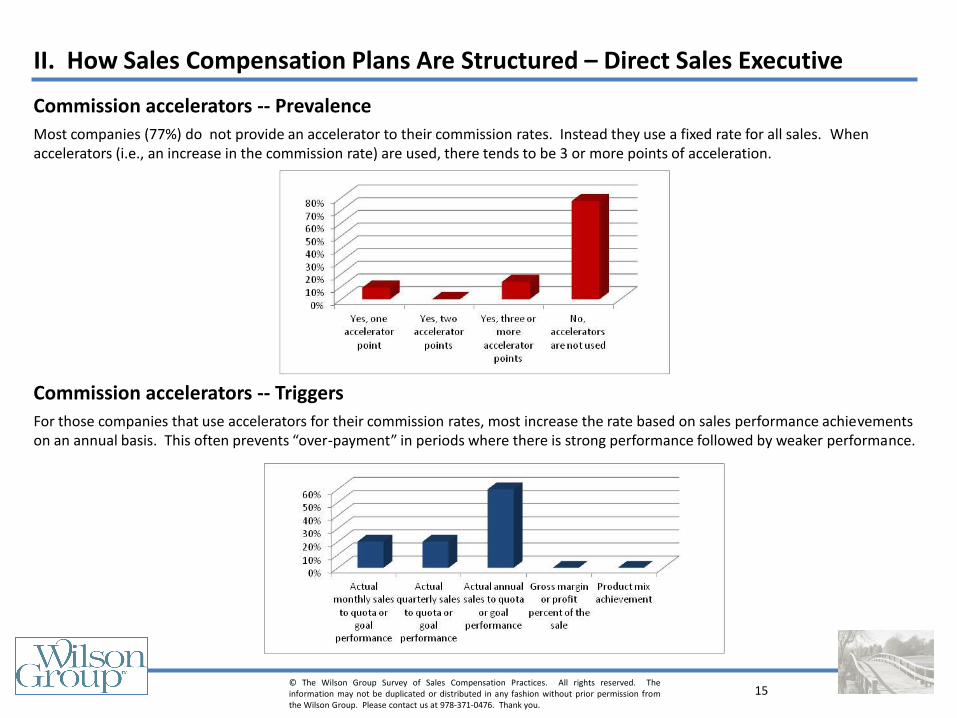
Commission accelerators -- Prevalence
Most companies (77%) do not provide an accelerator to their commission rates. Instead they use a fixed rate for all sales. When accelerators (i.e., an increase in the commission rate) are used, there tends to be 3 or more points of acceleration.
Commission accelerators -- Triggers
For those companies that use accelerators for their commission rates, most increase the rate based on sales performance achievements on an annual basis. This often prevents “over-payment” in periods where there is strong performance followed by weaker performance.
16 © The Wilson Group Survey of Sales Compensation Practices. All rights reserved. The information may not be duplicated or distributed in any fashion without prior permission from the Wilson Group. Please contact us at 978-371-0476. Thank you.
II. How Sales Compensation Plans Are Structured – Direct Sales Executive
Use of caps or decelerators on sales income
A strong majority (84%) do not use caps or limits to sales commissions. The few that do (8%) apply a decelerator (or reduced commission rate) to the earnings over defined income level.
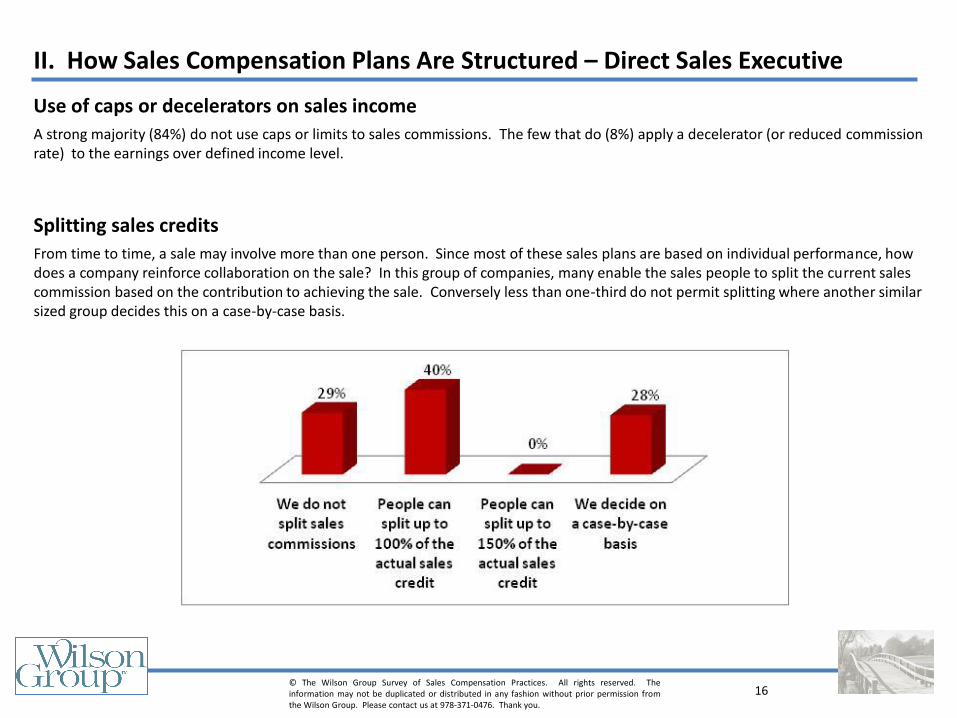
Splitting sales credits
From time to time, a sale may involve more than one person. Since most of these sales plans are based on individual performance, how does a company reinforce collaboration on the sale? In this group of companies, many enable the sales people to split the current sales commission based on the contribution to achieving the sale. Conversely less than one-third do not permit splitting where another similar sized group decides this on a case-by-case basis.
17 © The Wilson Group Survey of Sales Compensation Practices. All rights reserved. The information may not be duplicated or distributed in any fashion without prior permission from the Wilson Group. Please contact us at 978-371-0476. Thank you.
II. How Sales Compensation Plans Are Structured – Direct Sales Executive
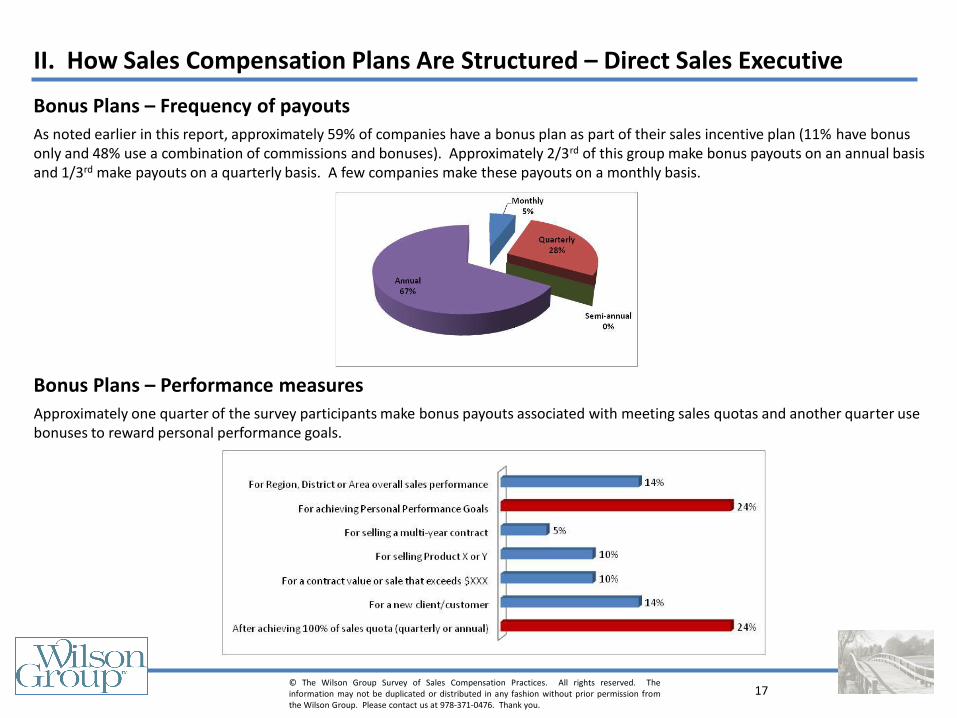
Bonus Plans – Frequency of payouts
As noted earlier in this report, approximately 59% of companies have a bonus plan as part of their sales incentive plan (11% have bonus only and 48% use a combination of commissions and bonuses). Approximately 2/3rd of this group make bonus payouts on an annual basis and 1/3rd make payouts on a quarterly basis. A few companies make these payouts on a monthly basis.
Bonus Plans – Performance measures
Approximately one quarter of the survey participants make bonus payouts associated with meeting sales quotas and another quarter use bonuses to reward personal performance goals.
18 © The Wilson Group Survey of Sales Compensation Practices. All rights reserved. The information may not be duplicated or distributed in any fashion without prior permission from the Wilson Group. Please contact us at 978-371-0476. Thank you.
II. How Sales Compensation Plans Are Structured – Direct Sales Executive
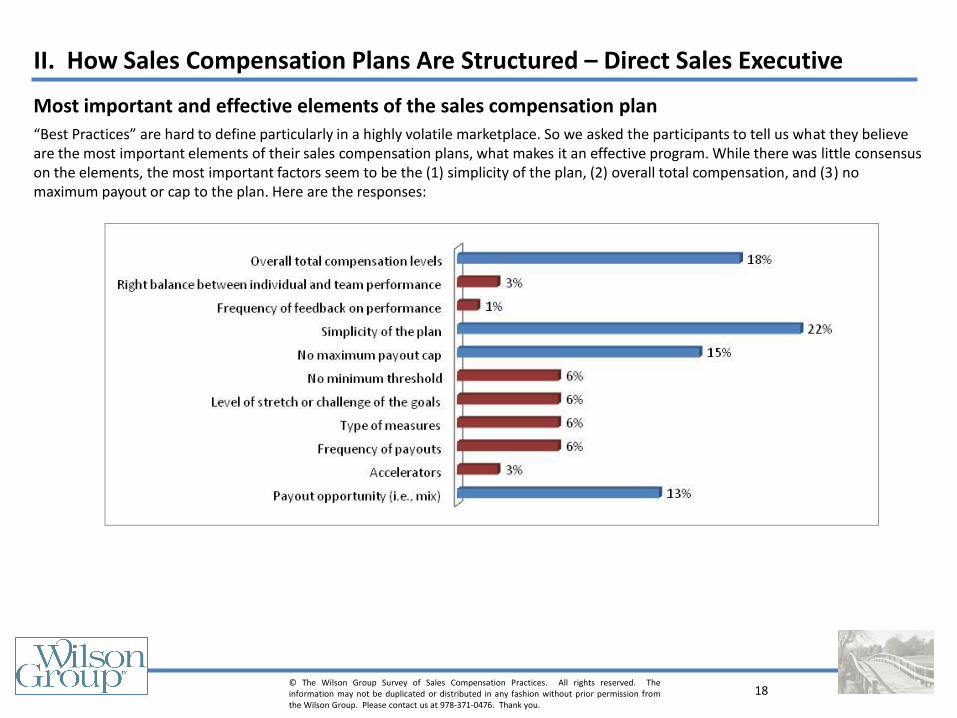
Most important and effective elements of the sales compensation plan
“Best Practices” are hard to define particularly in a highly volatile marketplace. So we asked the participants to tell us what they believe are the most important elements of their sales compensation plans, what makes it an effective program. While there was little consensus on the elements, the most important factors seem to be the (1) simplicity of the plan, (2) overall total compensation, and (3) no maximum payout or cap to the plan. Here are the responses:
19 © The Wilson Group Survey of Sales Compensation Practices. All rights reserved. The information may not be duplicated or distributed in any fashion without prior permission from the Wilson Group. Please contact us at 978-371-0476. Thank you.
The following is the position profile on which the respondents based their sales plan information:
II. How Sales Compensation Plans Are Structured – Account Manager
Sales Account Manager: Responsible for generating sales from assigned existing accounts and retaining strong favorable relationships with their customers. Is usually responsible for developing and/or expanding existing accounts within the assigned territory, and ensures that company’s products or services consistently meet customers’ needs. This job is key to the company’s strategies for customer satisfaction and experience. May be responsible for sustaining and renewing client contracts. May require a bachelor's degree and at least 3 to 5 years of experience in the field or in a related account management area. Familiar with a variety of the sales and account management concepts, practices, and procedures. Relies on extensive experience and judgment to plan and accomplish goals. May lead and direct the work of others. Typically reports to a manager of major accounts or a district or regional manager.
20 © The Wilson Group Survey of Sales Compensation Practices. All rights reserved. The information may not be duplicated or distributed in any fashion without prior permission from the Wilson Group. Please contact us at 978-371-0476. Thank you.
II. How Sales Compensation Plans Are Structured – Account Manager
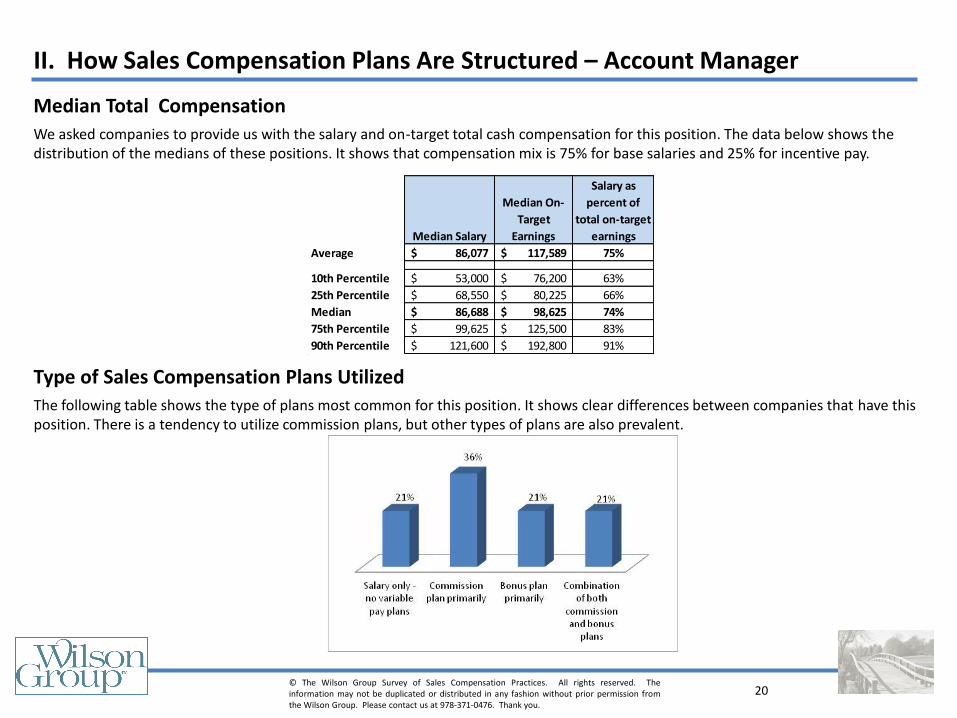
Median Total Compensation
We asked companies to provide us with the salary and on-target total cash compensation for this position. The data below shows the distribution of the medians of these positions. It shows that compensation mix is 75% for base salaries and 25% for incentive pay.
Type of Sales Compensation Plans Utilized
The following table shows the type of plans most common for this position. It shows clear differences between companies that have this position. There is a tendency to utilize commission plans, but other types of plans are also prevalent.
Median Salary
Median On-
Target
Earnings
Salary as
percent of
total on-target
earnings
Average 86,077$ 117,589$ 75%
10th Percentile 53,000$ 76,200$ 63%
25th Percentile 68,550$ 80,225$ 66%
Median 86,688$ 98,625$ 74%
75th Percentile 99,625$ 125,500$ 83%
90th Percentile 121,600$ 192,800$ 91%
21 © The Wilson Group Survey of Sales Compensation Practices. All rights reserved. The information may not be duplicated or distributed in any fashion without prior permission from the Wilson Group. Please contact us at 978-371-0476. Thank you.
II. How Sales Compensation Plans Are Structured – Account Manager
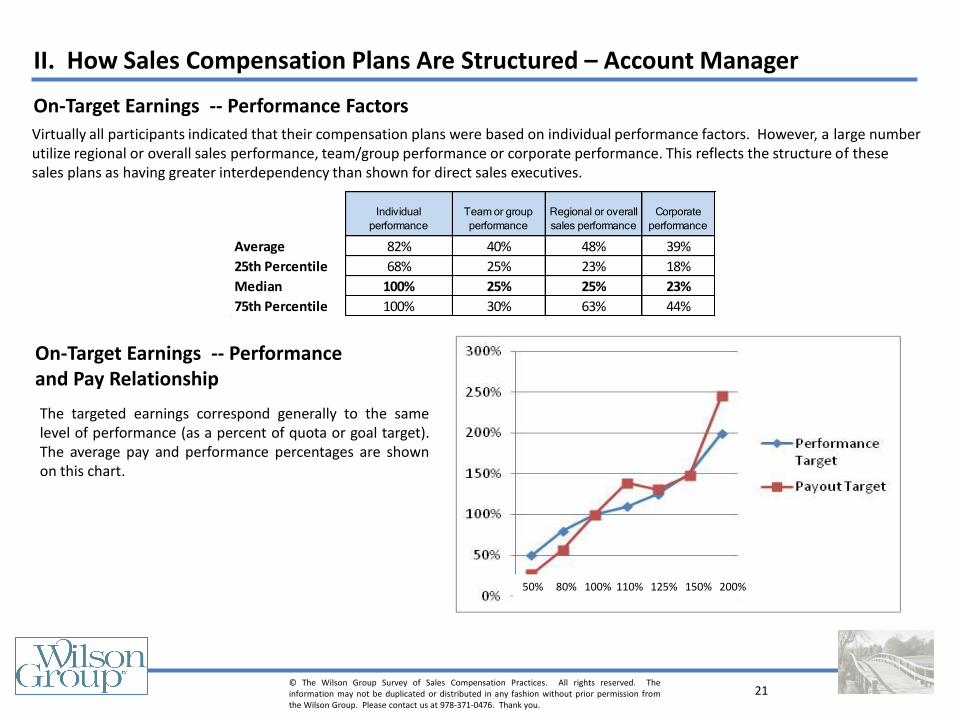
On-Target Earnings -- Performance Factors
Virtually all participants indicated that their compensation plans were based on individual performance factors. However, a large number utilize regional or overall sales performance, team/group performance or corporate performance. This reflects the structure of these sales plans as having greater interdependency than shown for direct sales executives.
On-Target Earnings -- Performance and Pay Relationship
The targeted earnings correspond generally to the same level of performance (as a percent of quota or goal target). The average pay and performance percentages are shown on this chart.
Individual
performance
Team or group
performance
Regional or overall
sales performance
Corporate
performance
Average 82% 40% 48% 39%
25th Percentile 68% 25% 23% 18%
Median 100% 25% 25% 23%
75th Percentile 100% 30% 63% 44%
50% 80% 100% 110% 125% 150% 200%
22 © The Wilson Group Survey of Sales Compensation Practices. All rights reserved. The information may not be duplicated or distributed in any fashion without prior permission from the Wilson Group. Please contact us at 978-371-0476. Thank you.
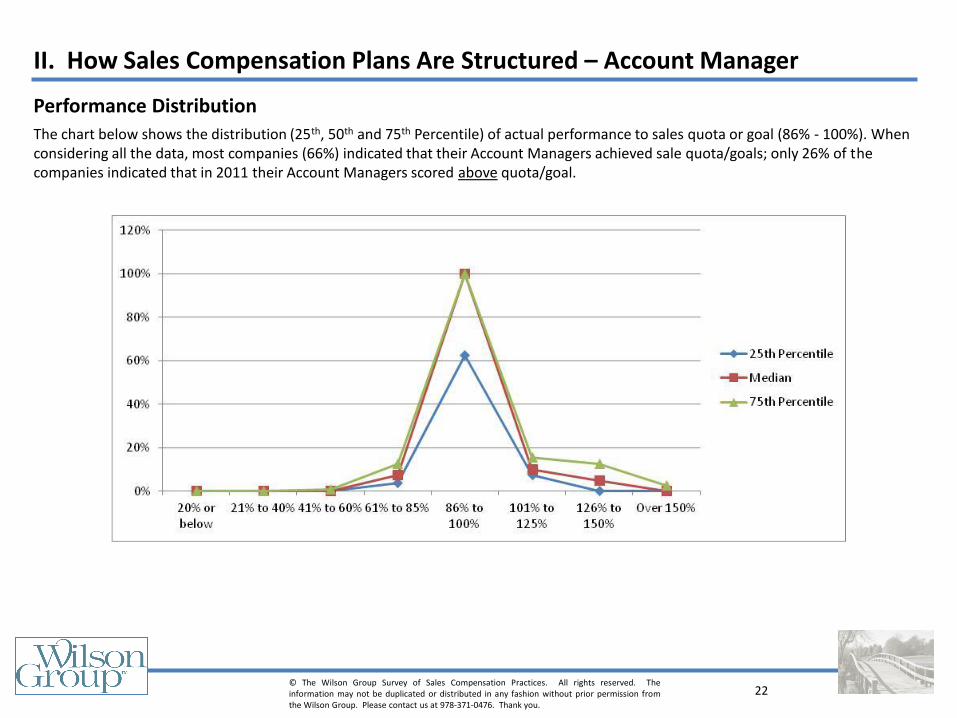
Performance Distribution
The chart below shows the distribution (25th, 50th and 75th Percentile) of actual performance to sales quota or goal (86% - 100%). When considering all the data, most companies (66%) indicated that their Account Managers achieved sale quota/goals; only 26% of the companies indicated that in 2011 their Account Managers scored above quota/goal.
II. How Sales Compensation Plans Are Structured – Account Manager
23 © The Wilson Group Survey of Sales Compensation Practices. All rights reserved. The information may not be duplicated or distributed in any fashion without prior permission from the Wilson Group. Please contact us at 978-371-0476. Thank you.
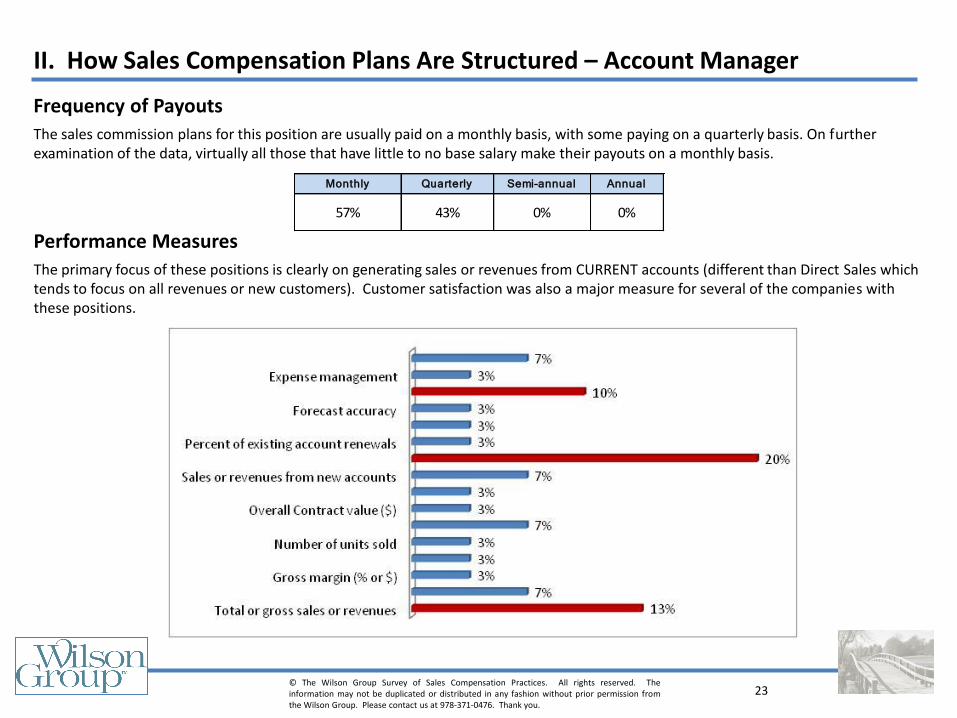
Frequency of Payouts
The sales commission plans for this position are usually paid on a monthly basis, with some paying on a quarterly basis. On further examination of the data, virtually all those that have little to no base salary make their payouts on a monthly basis.
Performance Measures
The primary focus of these positions is clearly on generating sales or revenues from CURRENT accounts (different than Direct Sales which tends to focus on all revenues or new customers). Customer satisfaction was also a major measure for several of the companies with these positions.
II. How Sales Compensation Plans Are Structured – Account Manager
Monthly Quarterly Semi-annual Annual
57% 43% 0% 0%
24 © The Wilson Group Survey of Sales Compensation Practices. All rights reserved. The information may not be duplicated or distributed in any fashion without prior permission from the Wilson Group. Please contact us at 978-371-0476. Thank you.
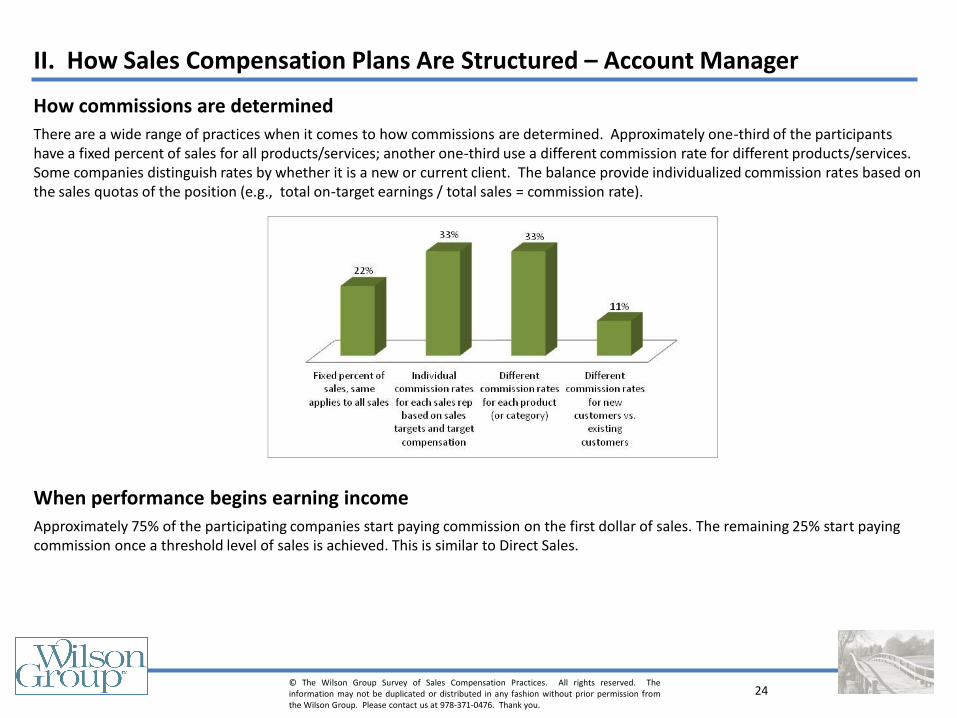
How commissions are determined
There are a wide range of practices when it comes to how commissions are determined. Approximately one-third of the participants have a fixed percent of sales for all products/services; another one-third use a different commission rate for different products/services. Some companies distinguish rates by whether it is a new or current client. The balance provide individualized commission rates based on the sales quotas of the position (e.g., total on-target earnings / total sales = commission rate).
When performance begins earning income
Approximately 75% of the participating companies start paying commission on the first dollar of sales. The remaining 25% start paying commission once a threshold level of sales is achieved. This is similar to Direct Sales.
II. How Sales Compensation Plans Are Structured – Account Manager
25 © The Wilson Group Survey of Sales Compensation Practices. All rights reserved. The information may not be duplicated or distributed in any fashion without prior permission from the Wilson Group. Please contact us at 978-371-0476. Thank you.
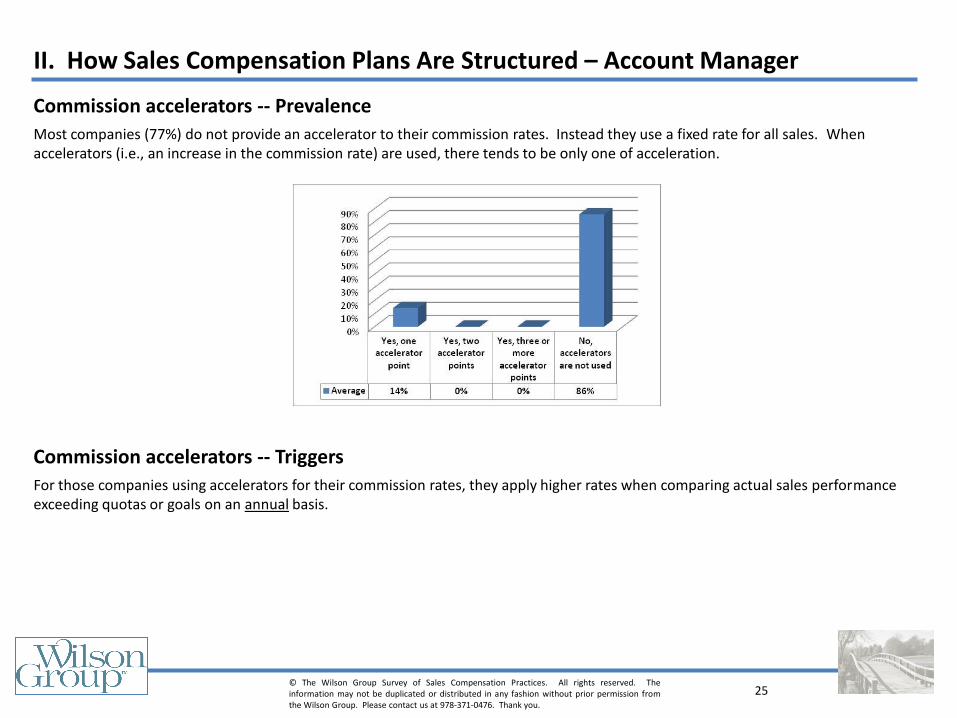
Commission accelerators -- Prevalence
Most companies (77%) do not provide an accelerator to their commission rates. Instead they use a fixed rate for all sales. When accelerators (i.e., an increase in the commission rate) are used, there tends to be only one of acceleration.
Commission accelerators -- Triggers
For those companies using accelerators for their commission rates, they apply higher rates when comparing actual sales performance exceeding quotas or goals on an annual basis.
II. How Sales Compensation Plans Are Structured – Account Manager
26 © The Wilson Group Survey of Sales Compensation Practices. All rights reserved. The information may not be duplicated or distributed in any fashion without prior permission from the Wilson Group. Please contact us at 978-371-0476. Thank you.
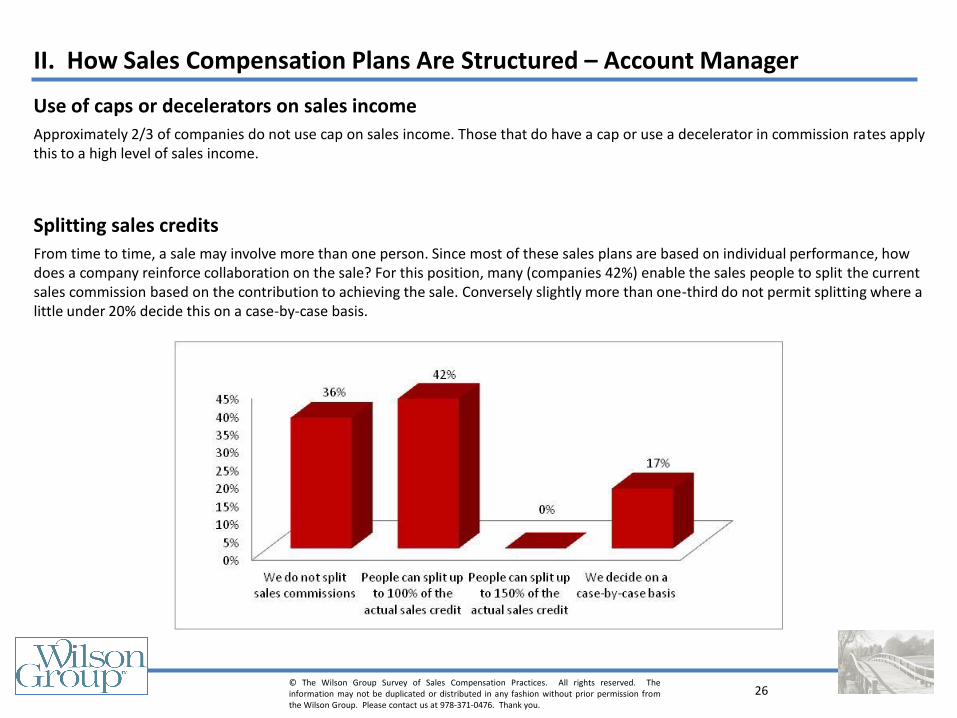
Use of caps or decelerators on sales income
Approximately 2/3 of companies do not use cap on sales income. Those that do have a cap or use a decelerator in commission rates apply this to a high level of sales income.
Splitting sales credits
From time to time, a sale may involve more than one person. Since most of these sales plans are based on individual performance, how does a company reinforce collaboration on the sale? For this position, many (companies 42%) enable the sales people to split the current sales commission based on the contribution to achieving the sale. Conversely slightly more than one-third do not permit splitting where a little under 20% decide this on a case-by-case basis.
II. How Sales Compensation Plans Are Structured – Account Manager
27 © The Wilson Group Survey of Sales Compensation Practices. All rights reserved. The information may not be duplicated or distributed in any fashion without prior permission from the Wilson Group. Please contact us at 978-371-0476. Thank you.
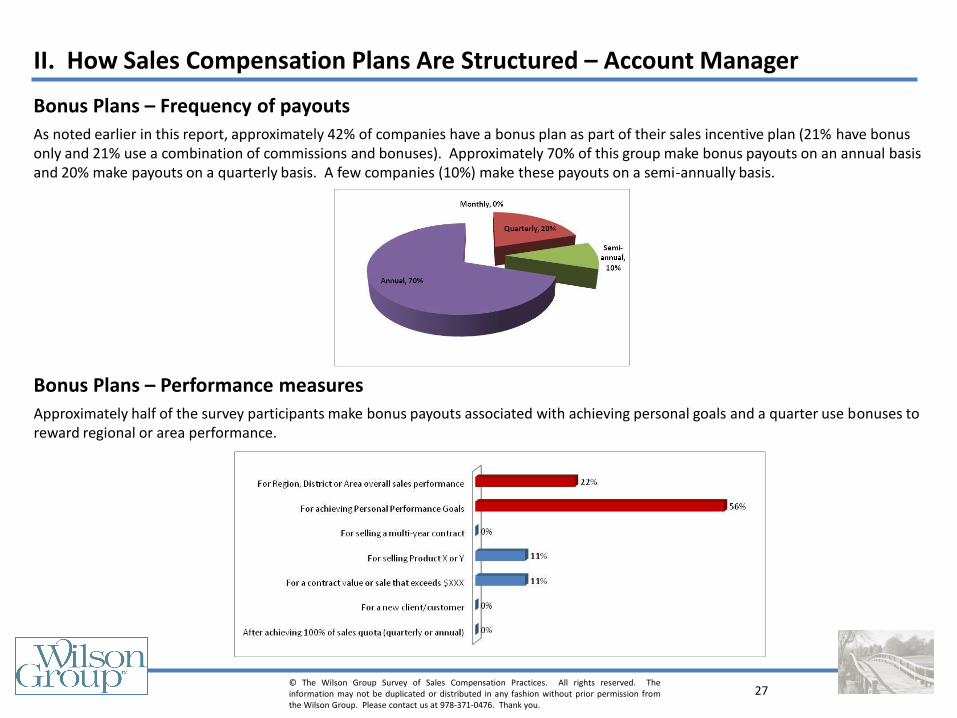
Bonus Plans – Frequency of payouts
As noted earlier in this report, approximately 42% of companies have a bonus plan as part of their sales incentive plan (21% have bonus only and 21% use a combination of commissions and bonuses). Approximately 70% of this group make bonus payouts on an annual basis and 20% make payouts on a quarterly basis. A few companies (10%) make these payouts on a semi-annually basis.
Bonus Plans – Performance measures
Approximately half of the survey participants make bonus payouts associated with achieving personal goals and a quarter use bonuses to reward regional or area performance.
II. How Sales Compensation Plans Are Structured – Account Manager
28 © The Wilson Group Survey of Sales Compensation Practices. All rights reserved. The information may not be duplicated or distributed in any fashion without prior permission from the Wilson Group. Please contact us at 978-371-0476. Thank you.
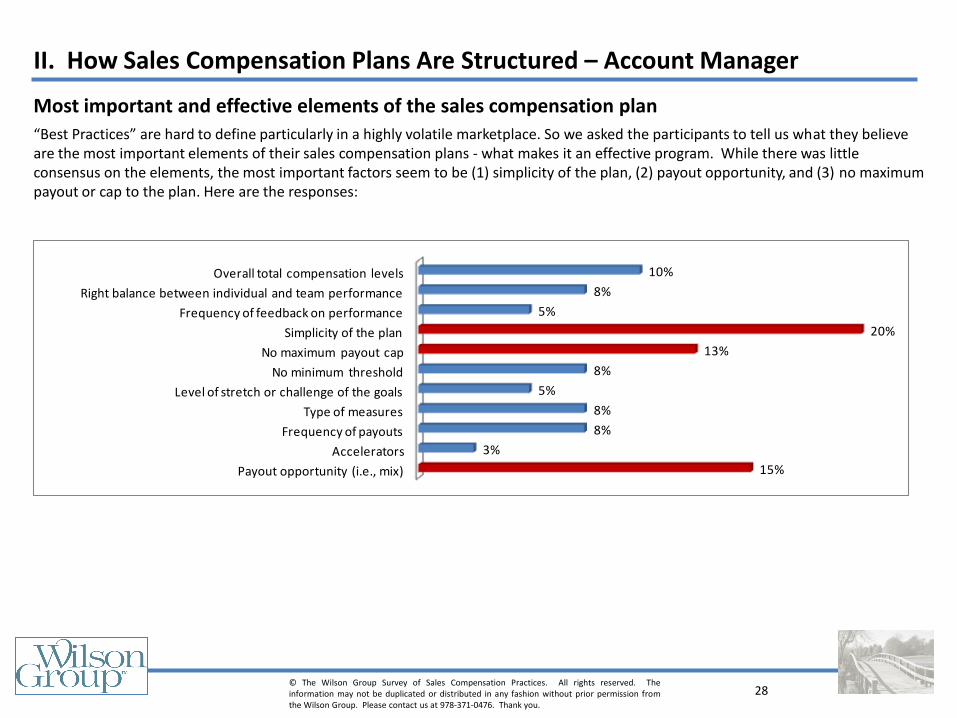
Most important and effective elements of the sales compensation plan
“Best Practices” are hard to define particularly in a highly volatile marketplace. So we asked the participants to tell us what they believe are the most important elements of their sales compensation plans - what makes it an effective program. While there was little consensus on the elements, the most important factors seem to be (1) simplicity of the plan, (2) payout opportunity, and (3) no maximum payout or cap to the plan. Here are the responses:
II. How Sales Compensation Plans Are Structured – Account Manager
Payout opportunity (i.e., mix)
Accelerators
Frequency of payouts
Type of measures
Level of stretch or challenge of the goals
No minimum threshold
No maximum payout cap
Simplicity of the plan
Frequency of feedback on performance
Right balance between individual and team performance
Overall total compensation levels
15%
3%
8%
8%
5%
8%
13%
20%
5%
8%
10%
29 © The Wilson Group Survey of Sales Compensation Practices. All rights reserved. The information may not be duplicated or distributed in any fashion without prior permission from the Wilson Group. Please contact us at 978-371-0476. Thank you.
The following is the position profile on which the respondents based their sales plan information:
II. How Sales Compensation Plans Are Structured – Channel Sales Manager
Indirect or Channel Sales Manager: Responsible for generating sales of the company’s products and services that are generated through distributor, broker channels or cooperative partners within identified name distributors, territory or industry. The incumbent does not usually directly generate sales, but is responsible for revenue generation through the management of sales reps and supervisors of another sales organization. Maintains effective communications with sales managers and representatives across the company to ensure proper handling of these indirect sales or account development activities. May participate in presenting product and services to distributors or customers if needed to benefit the sales process or customers’ needs. Usually requires six to nine years of sales experience with particular expertise in distributor sales process. Demonstrates knowledge of the company’s entire product or service lines, and may have in-depth knowledge on a subset of products, services, or industry practices.
30 © The Wilson Group Survey of Sales Compensation Practices. All rights reserved. The information may not be duplicated or distributed in any fashion without prior permission from the Wilson Group. Please contact us at 978-371-0476. Thank you.
II. How Sales Compensation Plans Are Structured – Channel Sales Manager
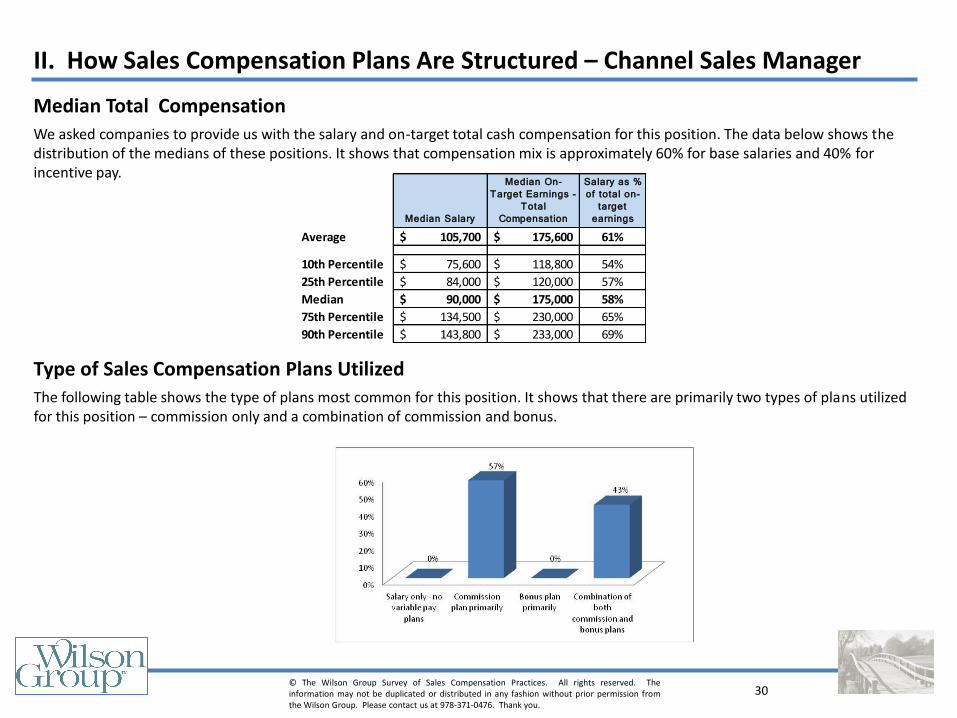
Median Total Compensation
We asked companies to provide us with the salary and on-target total cash compensation for this position. The data below shows the distribution of the medians of these positions. It shows that compensation mix is approximately 60% for base salaries and 40% for incentive pay.
Type of Sales Compensation Plans Utilized
The following table shows the type of plans most common for this position. It shows that there are primarily two types of plans utilized for this position – commission only and a combination of commission and bonus.
Median Salary
Median On-
Target Earnings -
Total
Compensation
Salary as %
of total on-
target
earnings
Average 105,700$ 175,600$ 61%
10th Percentile 75,600$ 118,800$ 54%
25th Percentile 84,000$ 120,000$ 57%
Median 90,000$ 175,000$ 58%
75th Percentile 134,500$ 230,000$ 65%
90th Percentile 143,800$ 233,000$ 69%
31 © The Wilson Group Survey of Sales Compensation Practices. All rights reserved. The information may not be duplicated or distributed in any fashion without prior permission from the Wilson Group. Please contact us at 978-371-0476. Thank you.
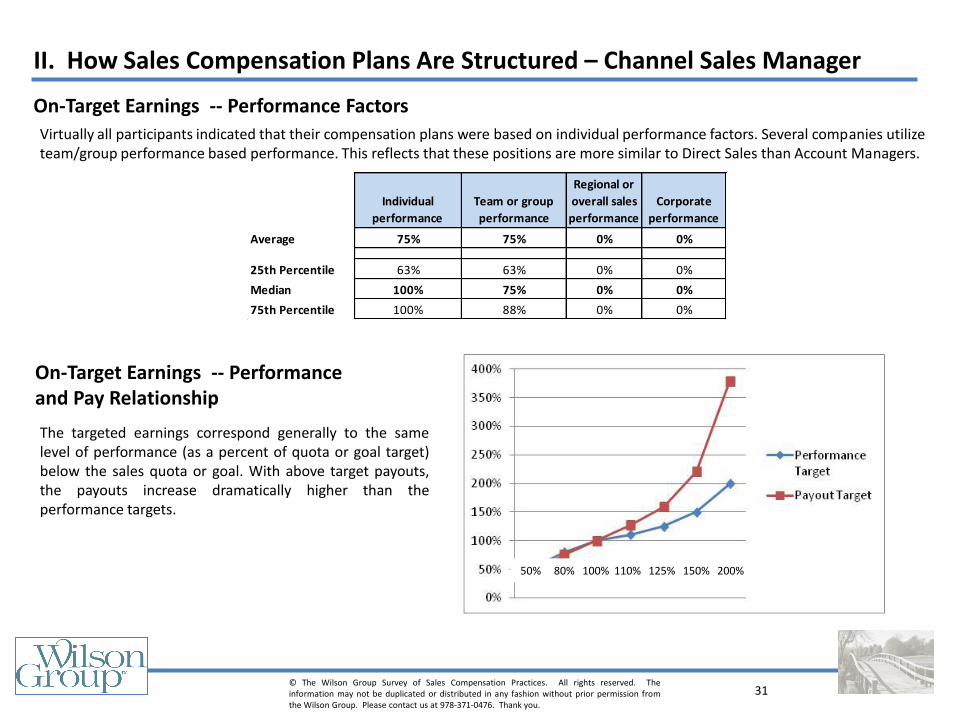
On-Target Earnings -- Performance Factors
Virtually all participants indicated that their compensation plans were based on individual performance factors. Several companies utilize team/group performance based performance. This reflects that these positions are more similar to Direct Sales than Account Managers.
On-Target Earnings -- Performance and Pay Relationship
The targeted earnings correspond generally to the same level of performance (as a percent of quota or goal target) below the sales quota or goal. With above target payouts, the payouts increase dramatically higher than the performance targets.
II. How Sales Compensation Plans Are Structured – Channel Sales Manager
50% 80% 100% 110% 125% 150% 200%
Individual
performance
Team or group
performance
Regional or
overall sales
performance
Corporate
performance
Average 75% 75% 0% 0%
25th Percentile 63% 63% 0% 0%
Median 100% 75% 0% 0%
75th Percentile 100% 88% 0% 0%
32 © The Wilson Group Survey of Sales Compensation Practices. All rights reserved. The information may not be duplicated or distributed in any fashion without prior permission from the Wilson Group. Please contact us at 978-371-0476. Thank you.
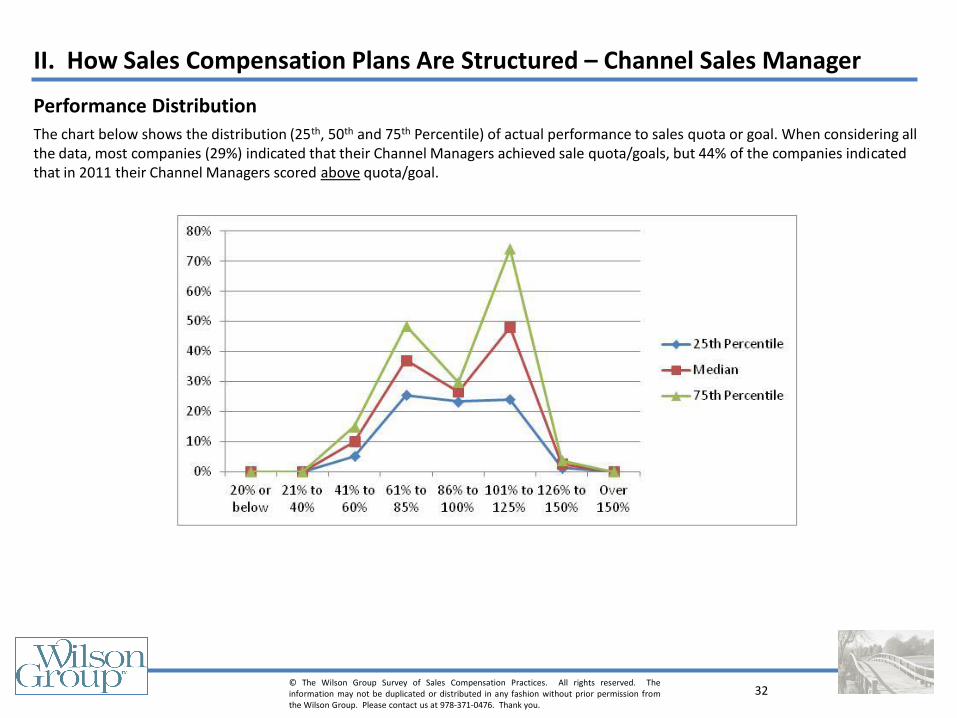
Performance Distribution
The chart below shows the distribution (25th, 50th and 75th Percentile) of actual performance to sales quota or goal. When considering all the data, most companies (29%) indicated that their Channel Managers achieved sale quota/goals, but 44% of the companies indicated that in 2011 their Channel Managers scored above quota/goal.
II. How Sales Compensation Plans Are Structured – Channel Sales Manager
33 © The Wilson Group Survey of Sales Compensation Practices. All rights reserved. The information may not be duplicated or distributed in any fashion without prior permission from the Wilson Group. Please contact us at 978-371-0476. Thank you.
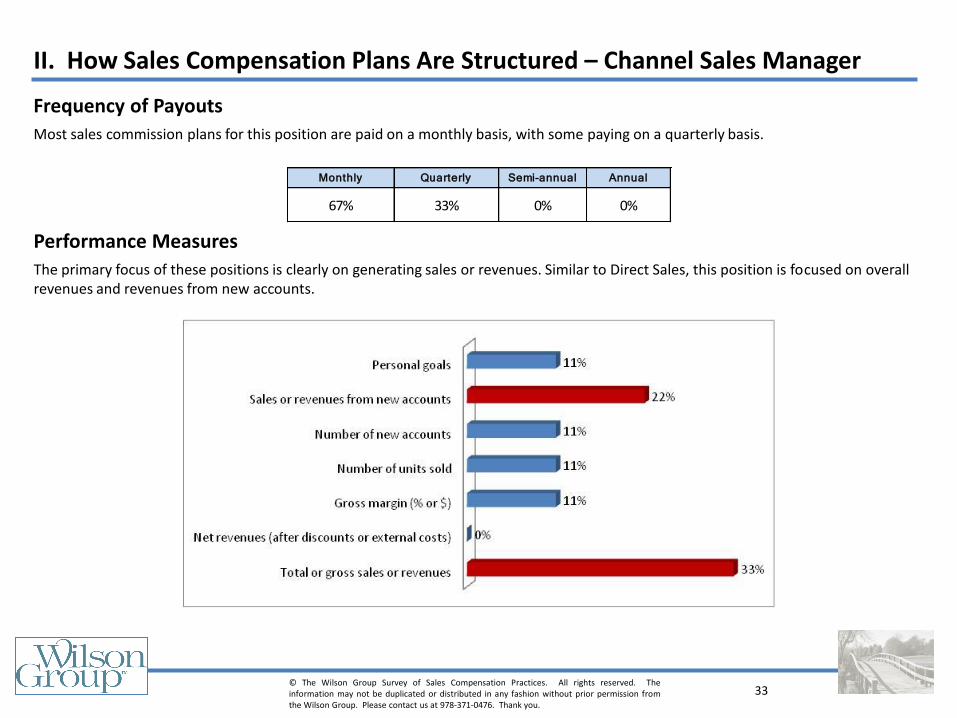
Frequency of Payouts
Most sales commission plans for this position are paid on a monthly basis, with some paying on a quarterly basis.
Performance Measures
The primary focus of these positions is clearly on generating sales or revenues. Similar to Direct Sales, this position is focused on overall revenues and revenues from new accounts.
Monthly Quarterly Semi-annual Annual
67% 33% 0% 0%
II. How Sales Compensation Plans Are Structured – Channel Sales Manager
34 © The Wilson Group Survey of Sales Compensation Practices. All rights reserved. The information may not be duplicated or distributed in any fashion without prior permission from the Wilson Group. Please contact us at 978-371-0476. Thank you.
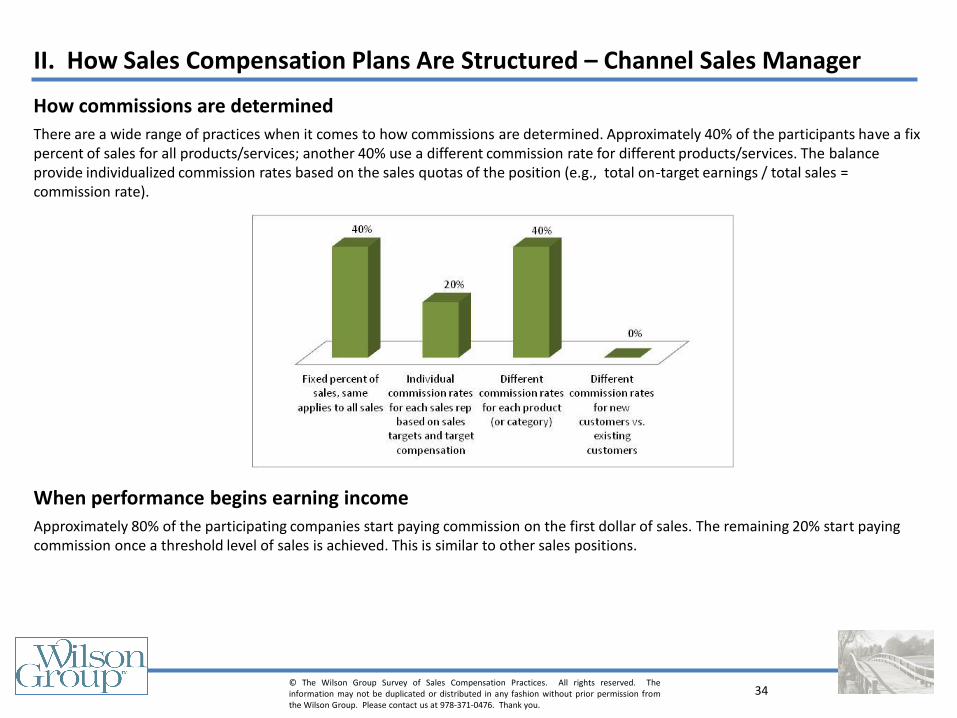
How commissions are determined
There are a wide range of practices when it comes to how commissions are determined. Approximately 40% of the participants have a fix percent of sales for all products/services; another 40% use a different commission rate for different products/services. The balance provide individualized commission rates based on the sales quotas of the position (e.g., total on-target earnings / total sales = commission rate).
When performance begins earning income
Approximately 80% of the participating companies start paying commission on the first dollar of sales. The remaining 20% start paying commission once a threshold level of sales is achieved. This is similar to other sales positions.
II. How Sales Compensation Plans Are Structured – Channel Sales Manager
35 © The Wilson Group Survey of Sales Compensation Practices. All rights reserved. The information may not be duplicated or distributed in any fashion without prior permission from the Wilson Group. Please contact us at 978-371-0476. Thank you.
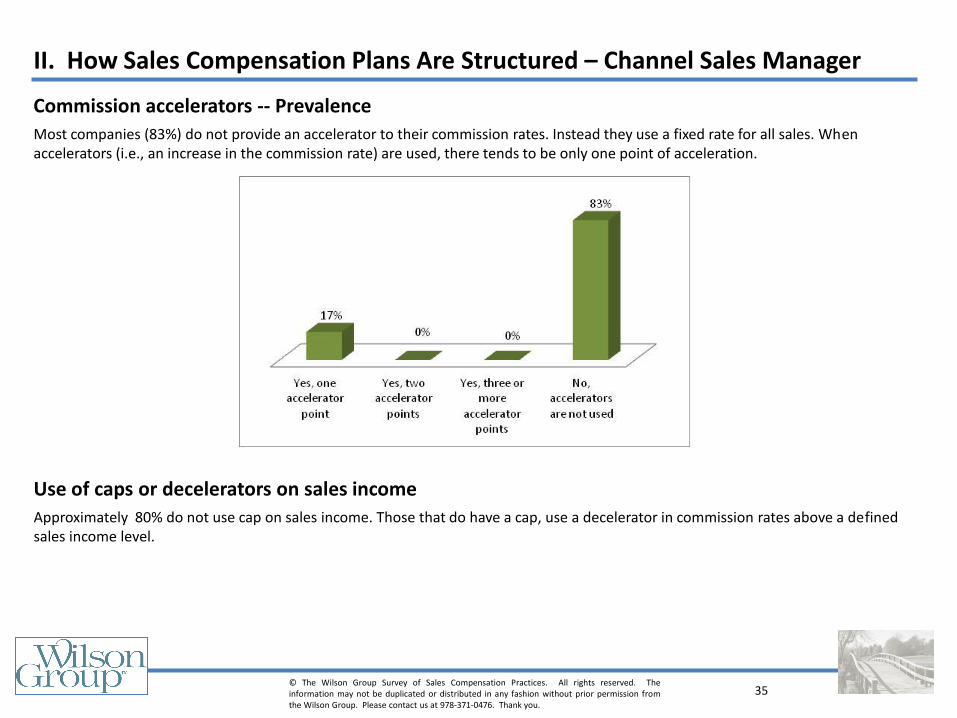
Commission accelerators -- Prevalence
Most companies (83%) do not provide an accelerator to their commission rates. Instead they use a fixed rate for all sales. When accelerators (i.e., an increase in the commission rate) are used, there tends to be only one point of acceleration.
Use of caps or decelerators on sales income
Approximately 80% do not use cap on sales income. Those that do have a cap, use a decelerator in commission rates above a defined sales income level.
II. How Sales Compensation Plans Are Structured – Channel Sales Manager
36 © The Wilson Group Survey of Sales Compensation Practices. All rights reserved. The information may not be duplicated or distributed in any fashion without prior permission from the Wilson Group. Please contact us at 978-371-0476. Thank you.
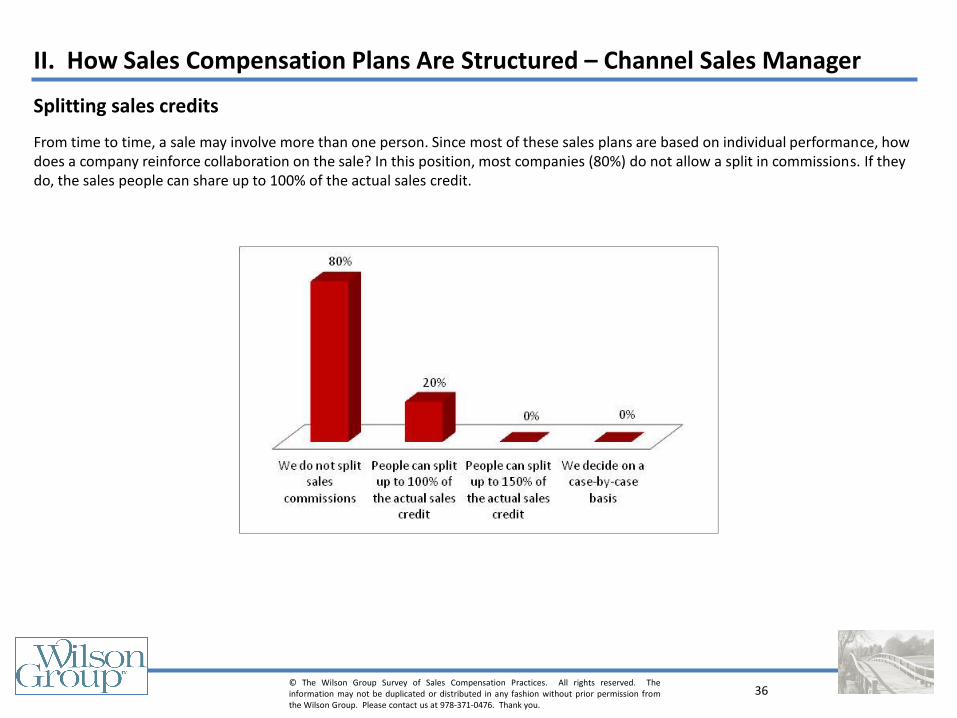
Splitting sales credits
From time to time, a sale may involve more than one person. Since most of these sales plans are based on individual performance, how does a company reinforce collaboration on the sale? In this position, most companies (80%) do not allow a split in commissions. If they do, the sales people can share up to 100% of the actual sales credit.
II. How Sales Compensation Plans Are Structured – Channel Sales Manager
37 © The Wilson Group Survey of Sales Compensation Practices. All rights reserved. The information may not be duplicated or distributed in any fashion without prior permission from the Wilson Group. Please contact us at 978-371-0476. Thank you.
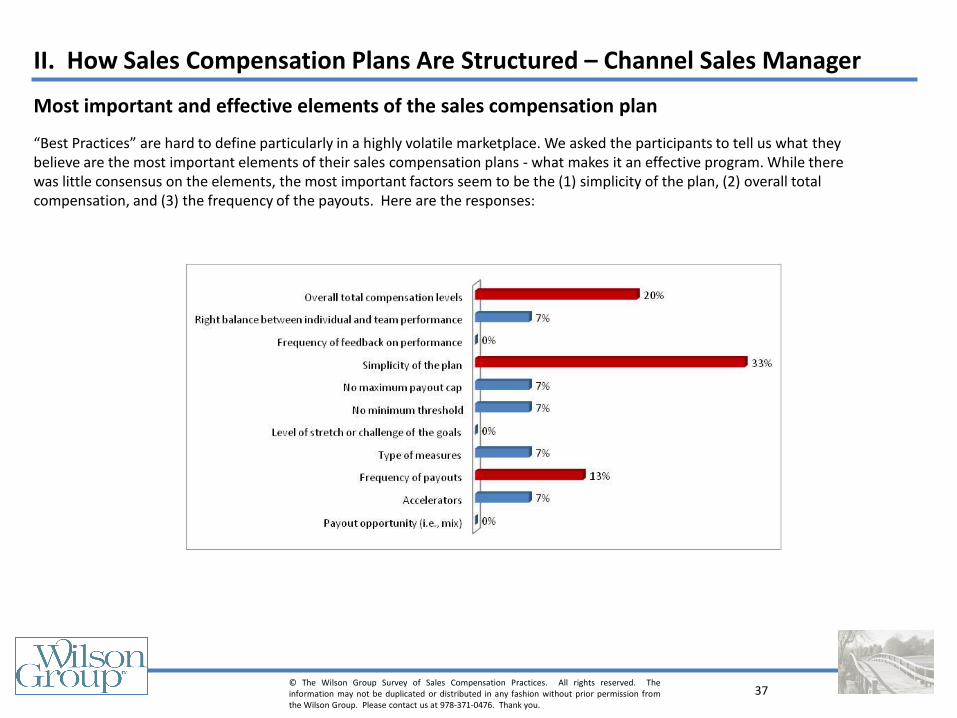
Most important and effective elements of the sales compensation plan
“Best Practices” are hard to define particularly in a highly volatile marketplace. We asked the participants to tell us what they believe are the most important elements of their sales compensation plans - what makes it an effective program. While there was little consensus on the elements, the most important factors seem to be the (1) simplicity of the plan, (2) overall total compensation, and (3) the frequency of the payouts. Here are the responses:
II. How Sales Compensation Plans Are Structured – Channel Sales Manager
38 © The Wilson Group Survey of Sales Compensation Practices. All rights reserved. The information may not be duplicated or distributed in any fashion without prior permission from the Wilson Group. Please contact us at 978-371-0476. Thank you.
Comparison of most common elements by primary industries represented in the participants
The following tables display a comparison of the companies by industry. The tables on the following pages show the responses to 7 key questions. The tables illustrate the percent of respondents that provided data for each of the questions. The information for the overall survey sample is also shown. This data is captured for each of the three (3) positions included in this survey. The key questions include: 1. Total Cash Compensation -- Base salary and on-target total compensation 2. The mix of base salary and variable compensation, where base salary is shown as a percent of total cash compensation 3. The type of sales compensation plans utilized 4. The total earnings as a percent of target earnings at 7 performance levels (50% - 200% of target) 5. How the commission rates are determined 6. When two people are involved in a sale, how companies tend to share sales credit 7. The 3 - 5 most important elements of the sales compensation plans For the blank spaces, there was insufficient responses to show response patterns and practices. This information should enable you to compare your industry’s responses with the current sales compensation plan designs within your company.
III. Comparison of Sales Plan by Market Segment – By Industry
39 © The Wilson Group Survey of Sales Compensation Practices. All rights reserved. The information may not be duplicated or distributed in any fashion without prior permission from the Wilson Group. Please contact us at 978-371-0476. Thank you.
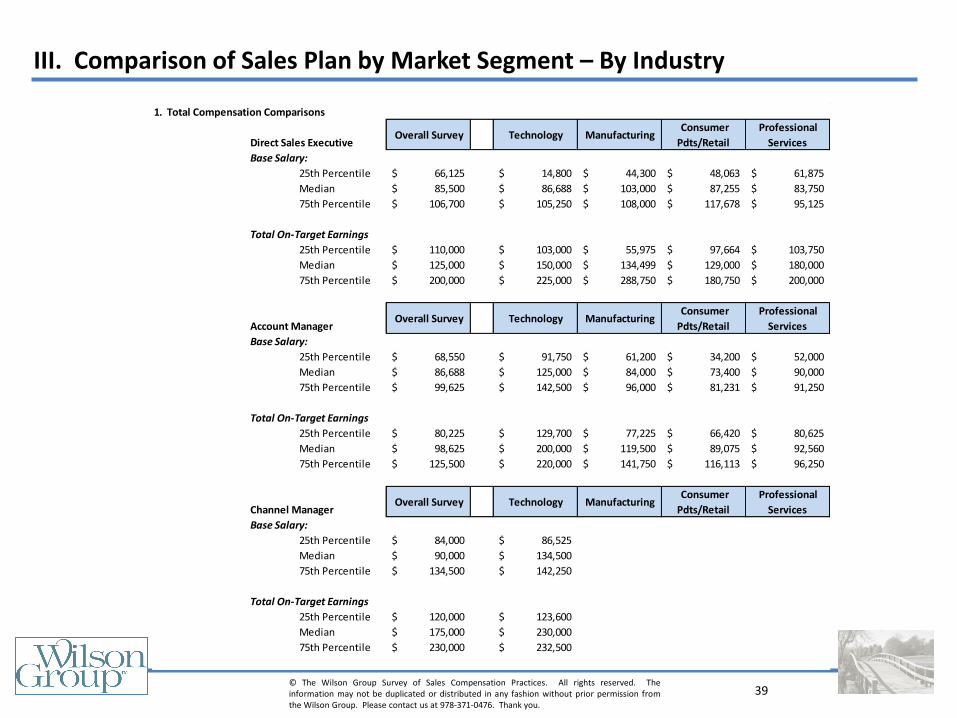
1. Total Compensation Comparisons
Direct Sales Executive Overall Survey Technology Manufacturing
Consumer
Pdts/Retail
Professional
Services
Base Salary:
25th Percentile 66,125$ 14,800$ 44,300$ 48,063$ 61,875$
Median 85,500$ 86,688$ 103,000$ 87,255$ 83,750$
75th Percentile 106,700$ 105,250$ 108,000$ 117,678$ 95,125$
Total On-Target Earnings
25th Percentile 110,000$ 103,000$ 55,975$ 97,664$ 103,750$
Median 125,000$ 150,000$ 134,499$ 129,000$ 180,000$
75th Percentile 200,000$ 225,000$ 288,750$ 180,750$ 200,000$
Account Manager Overall Survey Technology Manufacturing
Consumer
Pdts/Retail
Professional
Services
Base Salary:
25th Percentile 68,550$ 91,750$ 61,200$ 34,200$ 52,000$
Median 86,688$ 125,000$ 84,000$ 73,400$ 90,000$
75th Percentile 99,625$ 142,500$ 96,000$ 81,231$ 91,250$
Total On-Target Earnings
25th Percentile 80,225$ 129,700$ 77,225$ 66,420$ 80,625$
Median 98,625$ 200,000$ 119,500$ 89,075$ 92,560$
75th Percentile 125,500$ 220,000$ 141,750$ 116,113$ 96,250$
Channel Manager Overall Survey Technology Manufacturing
Consumer
Pdts/Retail
Professional
Services
Base Salary:
25th Percentile 84,000$ 86,525$
Median 90,000$ 134,500$
75th Percentile 134,500$ 142,250$
Total On-Target Earnings
25th Percentile 120,000$ 123,600$
Median 175,000$ 230,000$
75th Percentile 230,000$ 232,500$
III. Comparison of Sales Plan by Market Segment – By Industry
40 © The Wilson Group Survey of Sales Compensation Practices. All rights reserved. The information may not be duplicated or distributed in any fashion without prior permission from the Wilson Group. Please contact us at 978-371-0476. Thank you.
III. Comparison of Sales Plan by Market Segment – By Industry
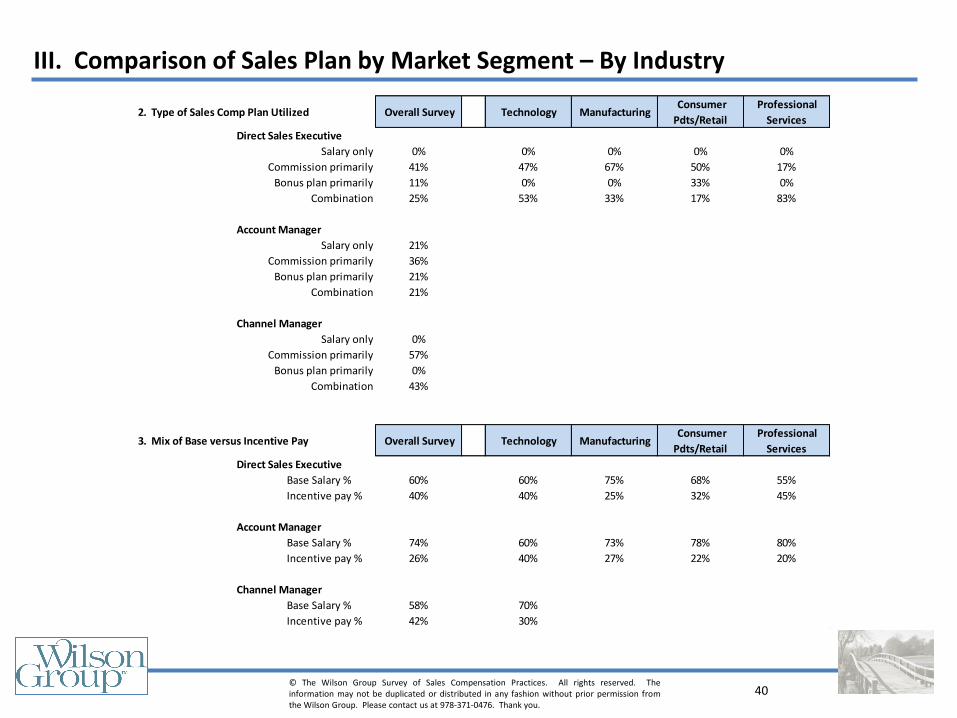
2. Type of Sales Comp Plan Utilized Overall Survey Technology Manufacturing Consumer
Pdts/Retail
Professional
Services
Direct Sales Executive
Salary only 0% 0% 0% 0% 0%
Commission primarily 41% 47% 67% 50% 17%
Bonus plan primarily 11% 0% 0% 33% 0%
Combination 25% 53% 33% 17% 83%
Account Manager
Salary only 21%
Commission primarily 36%
Bonus plan primarily 21%
Combination 21%
Channel Manager
Salary only 0%
Commission primarily 57%
Bonus plan primarily 0%
Combination 43%
3. Mix of Base versus Incentive Pay Overall Survey Technology Manufacturing Consumer
Pdts/Retail
Professional
Services
Direct Sales Executive
Base Salary % 60% 60% 75% 68% 55%
Incentive pay % 40% 40% 25% 32% 45%
Account Manager
Base Salary % 74% 60% 73% 78% 80%
Incentive pay % 26% 40% 27% 22% 20%
Channel Manager
Base Salary % 58% 70%
Incentive pay % 42% 30%
41 © The Wilson Group Survey of Sales Compensation Practices. All rights reserved. The information may not be duplicated or distributed in any fashion without prior permission from the Wilson Group. Please contact us at 978-371-0476. Thank you.
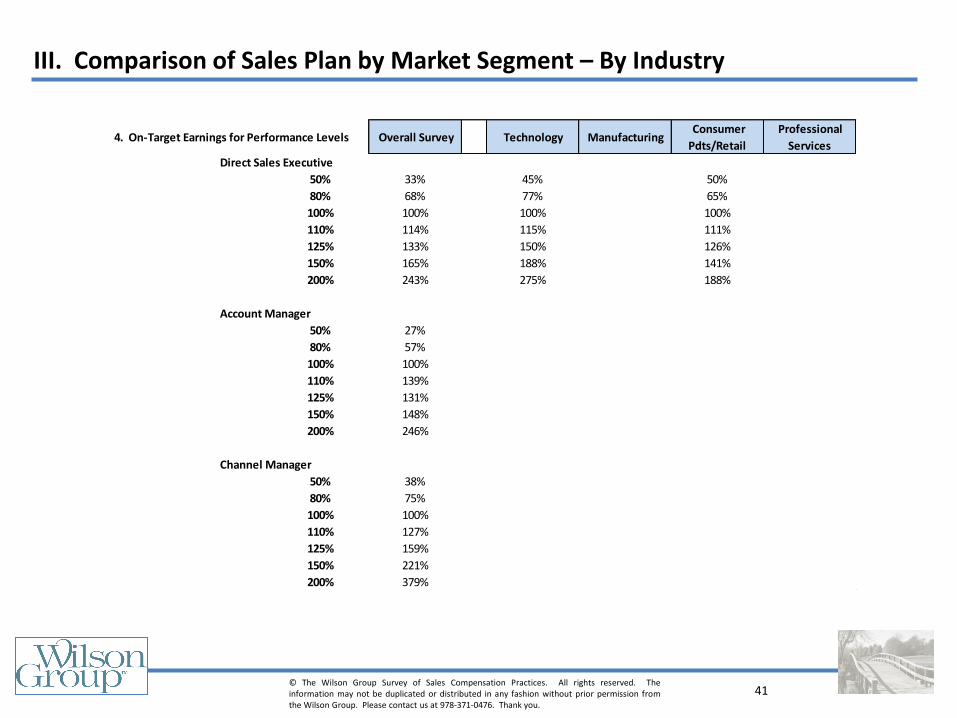
III. Comparison of Sales Plan by Market Segment – By Industry
4. On-Target Earnings for Performance Levels Overall Survey Technology Manufacturing Consumer
Pdts/Retail
Professional
Services
Direct Sales Executive
50% 33% 45% 50%
80% 68% 77% 65%
100% 100% 100% 100%
110% 114% 115% 111%
125% 133% 150% 126%
150% 165% 188% 141%
200% 243% 275% 188%
Account Manager
50% 27%
80% 57%
100% 100%
110% 139%
125% 131%
150% 148%
200% 246%
Channel Manager
50% 38%
80% 75%
100% 100%
110% 127%
125% 159%
150% 221%
200% 379%
42 © The Wilson Group Survey of Sales Compensation Practices. All rights reserved. The information may not be duplicated or distributed in any fashion without prior permission from the Wilson Group. Please contact us at 978-371-0476. Thank you.
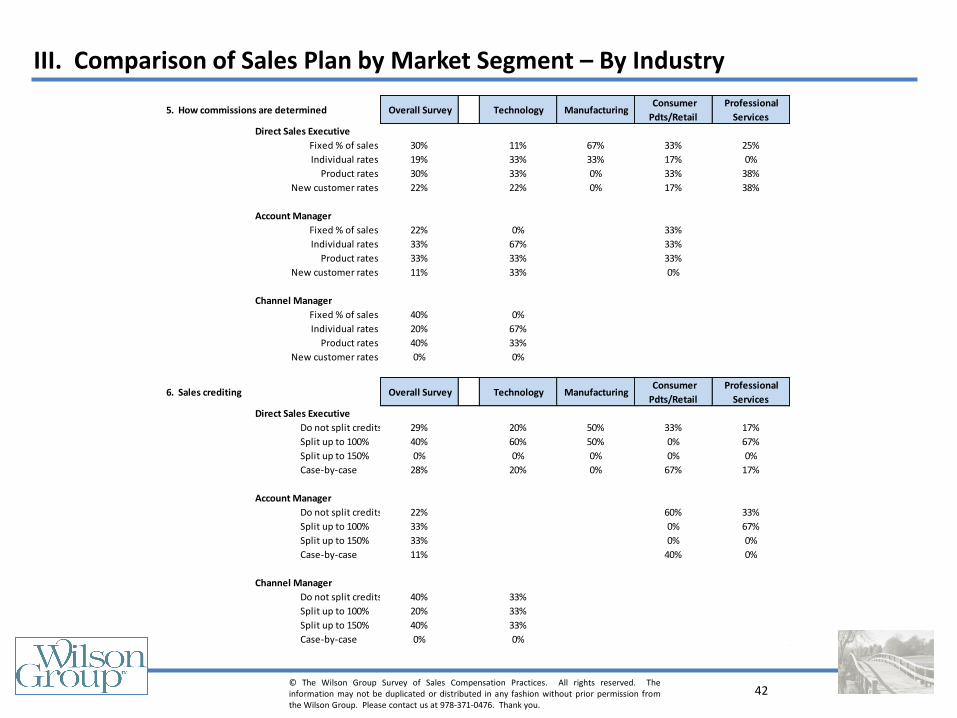
III. Comparison of Sales Plan by Market Segment – By Industry
5. How commissions are determined Overall Survey Technology Manufacturing Consumer
Pdts/Retail
Professional
Services
Direct Sales Executive
Fixed % of sales 30% 11% 67% 33% 25%
Individual rates 19% 33% 33% 17% 0%
Product rates 30% 33% 0% 33% 38%
New customer rates 22% 22% 0% 17% 38%
Account Manager
Fixed % of sales 22% 0% 33%
Individual rates 33% 67% 33%
Product rates 33% 33% 33%
New customer rates 11% 33% 0%
Channel Manager
Fixed % of sales 40% 0%
Individual rates 20% 67%
Product rates 40% 33%
New customer rates 0% 0%
6. Sales crediting Overall Survey Technology Manufacturing Consumer
Pdts/Retail
Professional
Services
Direct Sales Executive
Do not split credits 29% 20% 50% 33% 17%
Split up to 100% 40% 60% 50% 0% 67%
Split up to 150% 0% 0% 0% 0% 0%
Case-by-case 28% 20% 0% 67% 17%
Account Manager
Do not split credits 22% 60% 33%
Split up to 100% 33% 0% 67%
Split up to 150% 33% 0% 0%
Case-by-case 11% 40% 0%
Channel Manager
Do not split credits 40% 33%
Split up to 100% 20% 33%
Split up to 150% 40% 33%
Case-by-case 0% 0%
43 © The Wilson Group Survey of Sales Compensation Practices. All rights reserved. The information may not be duplicated or distributed in any fashion without prior permission from the Wilson Group. Please contact us at 978-371-0476. Thank you.
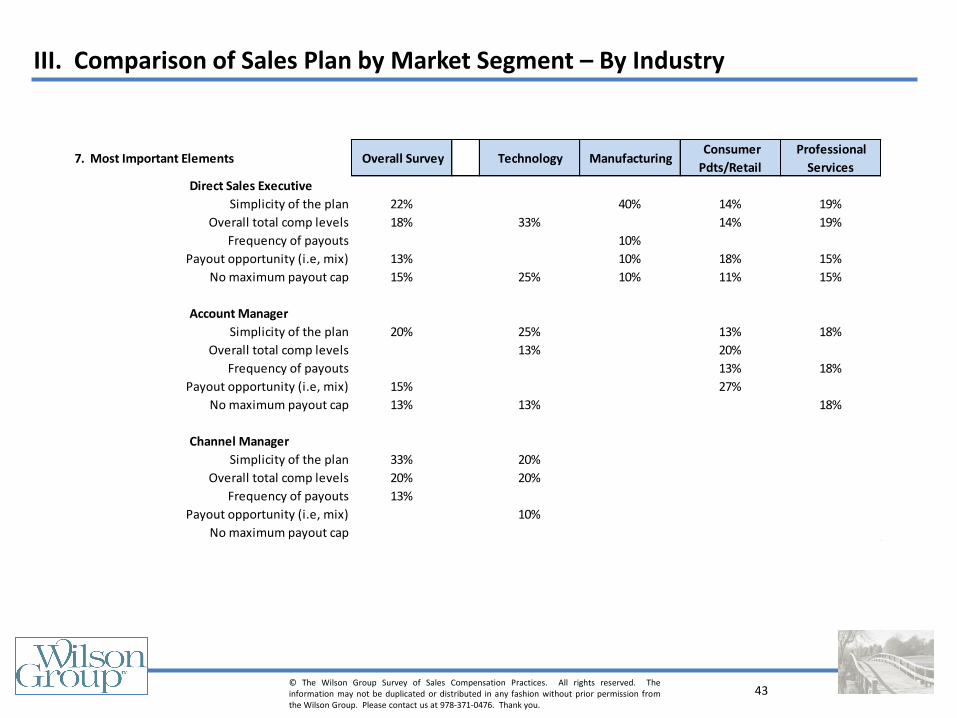
III. Comparison of Sales Plan by Market Segment – By Industry
7. Most Important Elements Overall Survey Technology Manufacturing Consumer
Pdts/Retail
Professional
Services
Direct Sales Executive
Simplicity of the plan 22% 40% 14% 19%
Overall total comp levels 18% 33% 14% 19%
Frequency of payouts 10%
Payout opportunity (i.e, mix) 13% 10% 18% 15%
No maximum payout cap 15% 25% 10% 11% 15%
Account Manager
Simplicity of the plan 20% 25% 13% 18%
Overall total comp levels 13% 20%
Frequency of payouts 13% 18%
Payout opportunity (i.e, mix) 15% 27%
No maximum payout cap 13% 13% 18%
Channel Manager
Simplicity of the plan 33% 20%
Overall total comp levels 20% 20%
Frequency of payouts 13%
Payout opportunity (i.e, mix) 10%
No maximum payout cap
44 © The Wilson Group Survey of Sales Compensation Practices. All rights reserved. The information may not be duplicated or distributed in any fashion without prior permission from the Wilson Group. Please contact us at 978-371-0476. Thank you.
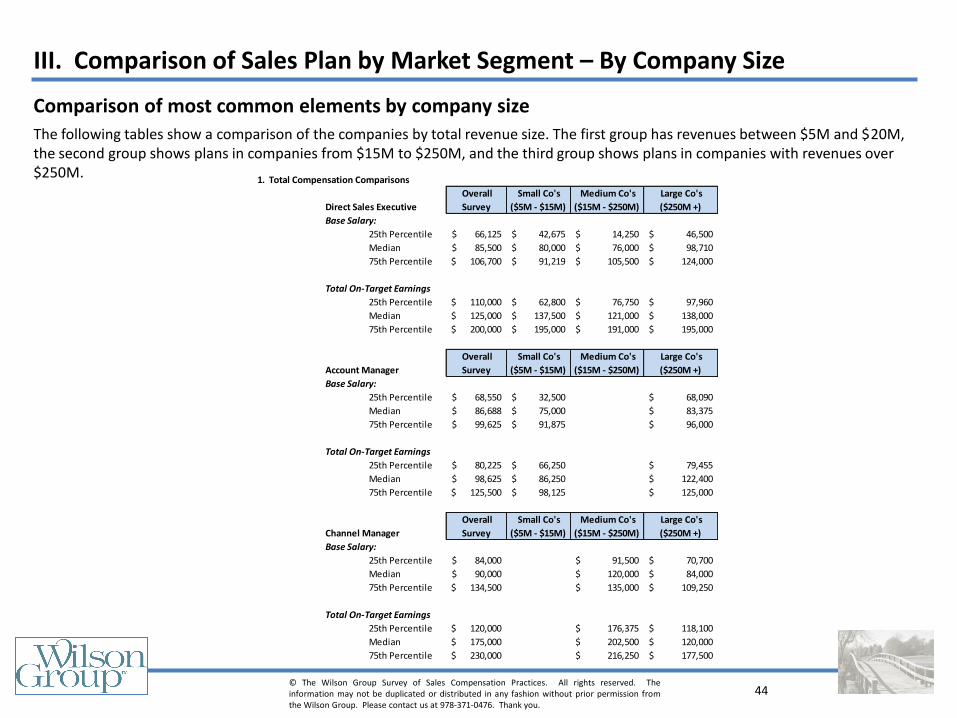
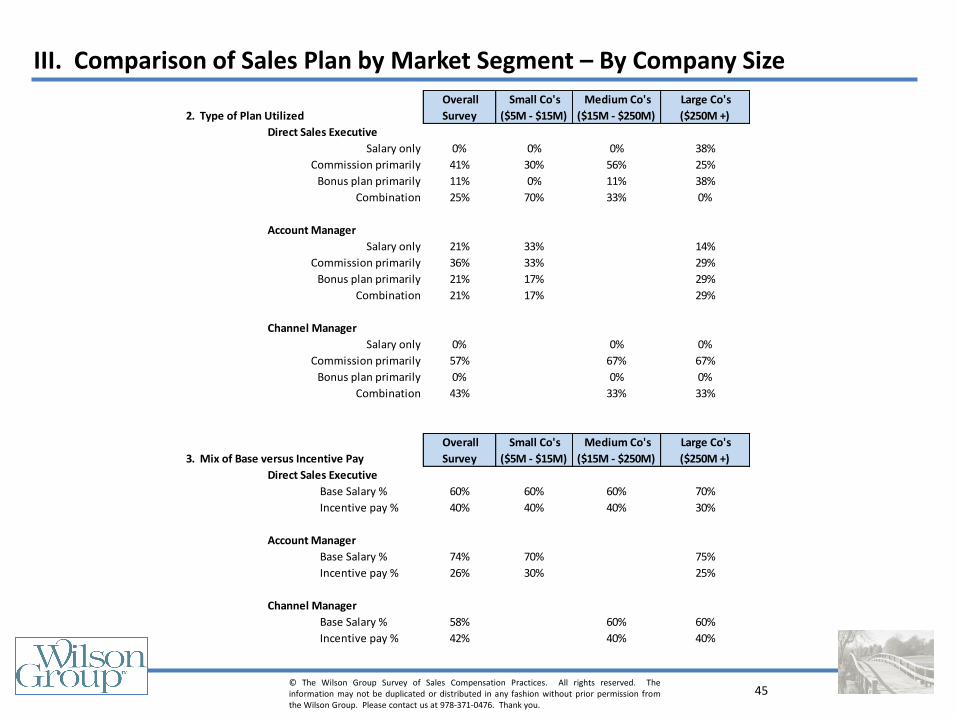
Comparison of most common elements by company size
The following tables show a comparison of the companies by total revenue size. The first group has revenues between $5M and $20M, the second group shows plans in companies from $15M to $250M, and the third group shows plans in companies with revenues over $250M.
III. Comparison of Sales Plan by Market Segment – By Company Size
1. Total Compensation Comparisons
Direct Sales Executive
Overall
Survey
Small Co's
($5M - $15M)
Medium Co's
($15M - $250M)
Large Co's
($250M +)
Base Salary:
25th Percentile 66,125$ 42,675$ 14,250$ 46,500$
Median 85,500$ 80,000$ 76,000$ 98,710$
75th Percentile 106,700$ 91,219$ 105,500$ 124,000$
Total On-Target Earnings
25th Percentile 110,000$ 62,800$ 76,750$ 97,960$
Median 125,000$ 137,500$ 121,000$ 138,000$
75th Percentile 200,000$ 195,000$ 191,000$ 195,000$
Account Manager
Overall
Survey
Small Co's
($5M - $15M)
Medium Co's
($15M - $250M)
Large Co's
($250M +)
Base Salary:
25th Percentile 68,550$ 32,500$ 68,090$
Median 86,688$ 75,000$ 83,375$
75th Percentile 99,625$ 91,875$ 96,000$
Total On-Target Earnings
25th Percentile 80,225$ 66,250$ 79,455$
Median 98,625$ 86,250$ 122,400$
75th Percentile 125,500$ 98,125$ 125,000$
Channel Manager
Overall
Survey
Small Co's
($5M - $15M)
Medium Co's
($15M - $250M)
Large Co's
($250M +)
Base Salary:
25th Percentile 84,000$ 91,500$ 70,700$
Median 90,000$ 120,000$ 84,000$
75th Percentile 134,500$ 135,000$ 109,250$
Total On-Target Earnings
25th Percentile 120,000$ 176,375$ 118,100$
Median 175,000$ 202,500$ 120,000$
75th Percentile 230,000$ 216,250$ 177,500$
45 © The Wilson Group Survey of Sales Compensation Practices. All rights reserved. The information may not be duplicated or distributed in any fashion without prior permission from the Wilson Group. Please contact us at 978-371-0476. Thank you.
III. Comparison of Sales Plan by Market Segment – By Company Size
2. Type of Plan Utilized
Overall
Survey
Small Co's
($5M - $15M)
Medium Co's
($15M - $250M)
Large Co's
($250M +)
Direct Sales Executive
Salary only 0% 0% 0% 38%
Commission primarily 41% 30% 56% 25%
Bonus plan primarily 11% 0% 11% 38%
Combination 25% 70% 33% 0%
Account Manager
Salary only 21% 33% 14%
Commission primarily 36% 33% 29%
Bonus plan primarily 21% 17% 29%
Combination 21% 17% 29%
Channel Manager
Salary only 0% 0% 0%
Commission primarily 57% 67% 67%
Bonus plan primarily 0% 0% 0%
Combination 43% 33% 33%
3. Mix of Base versus Incentive Pay
Overall
Survey
Small Co's
($5M - $15M)
Medium Co's
($15M - $250M)
Large Co's
($250M +)
Direct Sales Executive
Base Salary % 60% 60% 60% 70%
Incentive pay % 40% 40% 40% 30%
Account Manager
Base Salary % 74% 70% 75%
Incentive pay % 26% 30% 25%
Channel Manager
Base Salary % 58% 60% 60%
Incentive pay % 42% 40% 40%
46 © The Wilson Group Survey of Sales Compensation Practices. All rights reserved. The information may not be duplicated or distributed in any fashion without prior permission from the Wilson Group. Please contact us at 978-371-0476. Thank you.
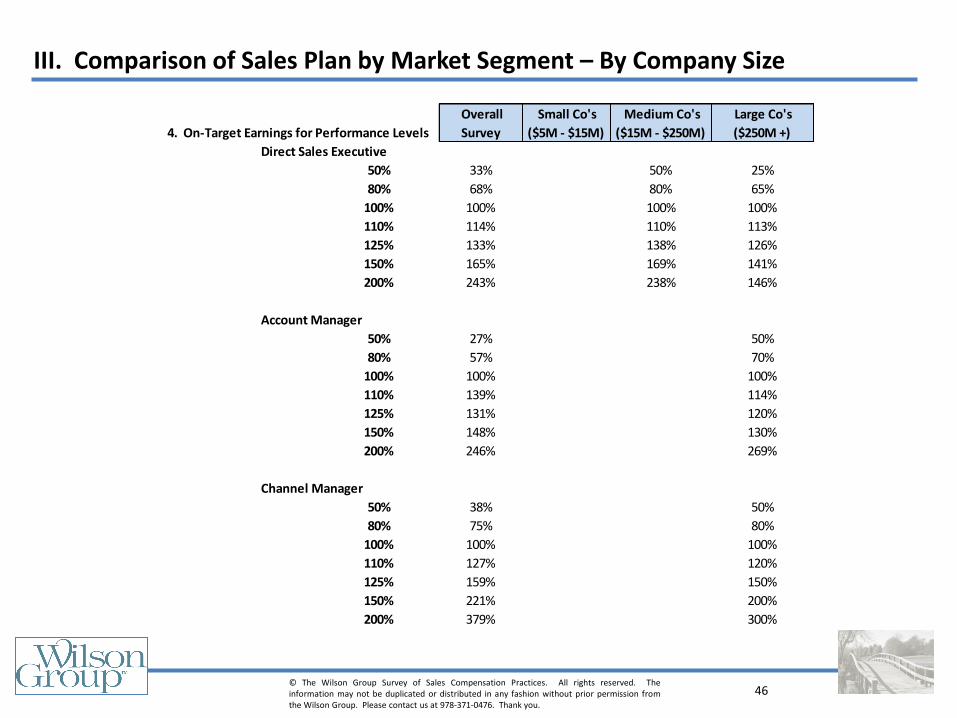
III. Comparison of Sales Plan by Market Segment – By Company Size
4. On-Target Earnings for Performance Levels
Overall
Survey
Small Co's
($5M - $15M)
Medium Co's
($15M - $250M)
Large Co's
($250M +)
Direct Sales Executive
50% 33% 50% 25%
80% 68% 80% 65%
100% 100% 100% 100%
110% 114% 110% 113%
125% 133% 138% 126%
150% 165% 169% 141%
200% 243% 238% 146%
Account Manager
50% 27% 50%
80% 57% 70%
100% 100% 100%
110% 139% 114%
125% 131% 120%
150% 148% 130%
200% 246% 269%
Channel Manager
50% 38% 50%
80% 75% 80%
100% 100% 100%
110% 127% 120%
125% 159% 150%
150% 221% 200%
200% 379% 300%
47 © The Wilson Group Survey of Sales Compensation Practices. All rights reserved. The information may not be duplicated or distributed in any fashion without prior permission from the Wilson Group. Please contact us at 978-371-0476. Thank you.
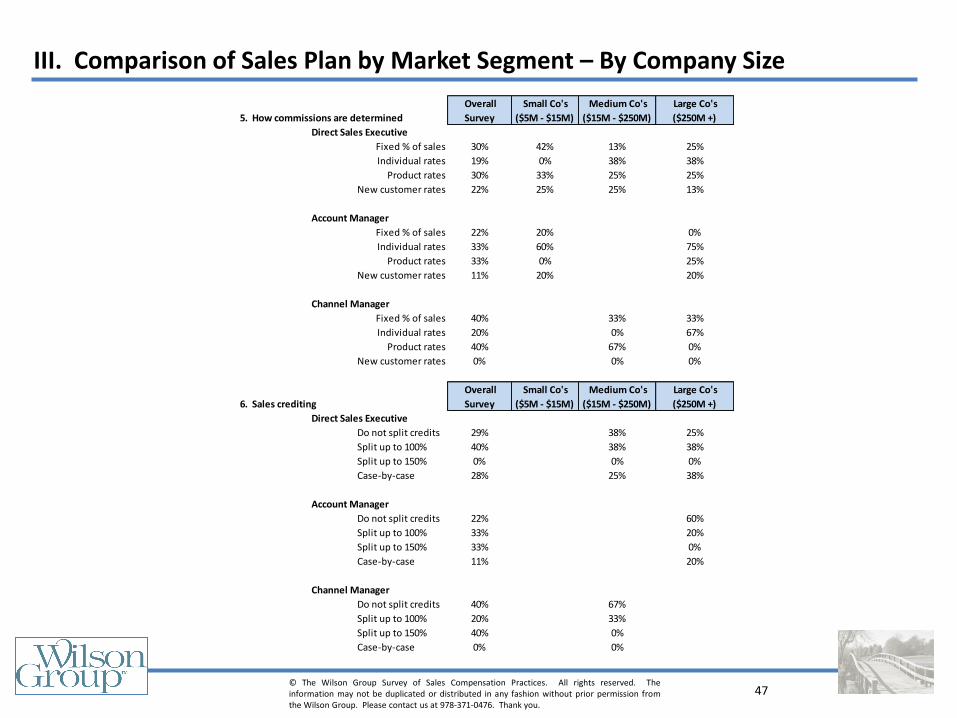
III. Comparison of Sales Plan by Market Segment – By Company Size
5. How commissions are determined
Overall
Survey
Small Co's
($5M - $15M)
Medium Co's
($15M - $250M)
Large Co's
($250M +)
Direct Sales Executive
Fixed % of sales 30% 42% 13% 25%
Individual rates 19% 0% 38% 38%
Product rates 30% 33% 25% 25%
New customer rates 22% 25% 25% 13%
Account Manager
Fixed % of sales 22% 20% 0%
Individual rates 33% 60% 75%
Product rates 33% 0% 25%
New customer rates 11% 20% 20%
Channel Manager
Fixed % of sales 40% 33% 33%
Individual rates 20% 0% 67%
Product rates 40% 67% 0%
New customer rates 0% 0% 0%
6. Sales crediting
Overall
Survey
Small Co's
($5M - $15M)
Medium Co's
($15M - $250M)
Large Co's
($250M +)
Direct Sales Executive
Do not split credits 29% 38% 25%
Split up to 100% 40% 38% 38%
Split up to 150% 0% 0% 0%
Case-by-case 28% 25% 38%
Account Manager
Do not split credits 22% 60%
Split up to 100% 33% 20%
Split up to 150% 33% 0%
Case-by-case 11% 20%
Channel Manager
Do not split credits 40% 67%
Split up to 100% 20% 33%
Split up to 150% 40% 0%
Case-by-case 0% 0%
48 © The Wilson Group Survey of Sales Compensation Practices. All rights reserved. The information may not be duplicated or distributed in any fashion without prior permission from the Wilson Group. Please contact us at 978-371-0476. Thank you.
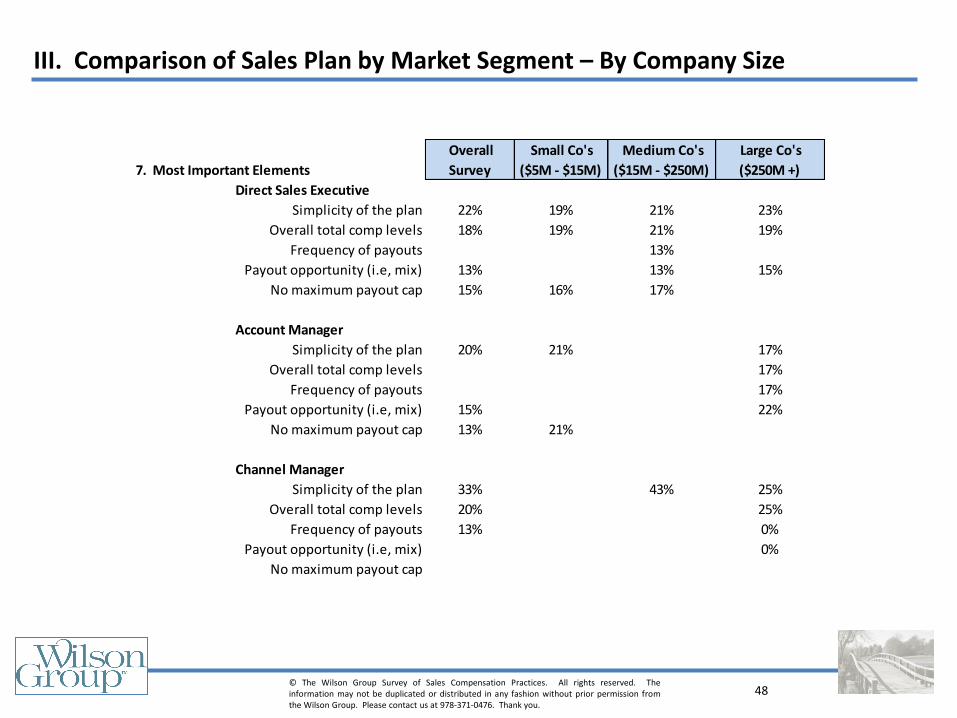
III. Comparison of Sales Plan by Market Segment – By Company Size
7. Most Important Elements
Overall
Survey
Small Co's
($5M - $15M)
Medium Co's
($15M - $250M)
Large Co's
($250M +)
Direct Sales Executive
Simplicity of the plan 22% 19% 21% 23%
Overall total comp levels 18% 19% 21% 19%
Frequency of payouts 13%
Payout opportunity (i.e, mix) 13% 13% 15%
No maximum payout cap 15% 16% 17%
Account Manager
Simplicity of the plan 20% 21% 17%
Overall total comp levels 17%
Frequency of payouts 17%
Payout opportunity (i.e, mix) 15% 22%
No maximum payout cap 13% 21%
Channel Manager
Simplicity of the plan 33% 43% 25%
Overall total comp levels 20% 25%
Frequency of payouts 13% 0%
Payout opportunity (i.e, mix) 0%
No maximum payout cap
49 © The Wilson Group Survey of Sales Compensation Practices. All rights reserved. The information may not be duplicated or distributed in any fashion without prior permission from the Wilson Group. Please contact us at 978-371-0476. Thank you.
IV. Assessment of the Effectiveness of These Plans
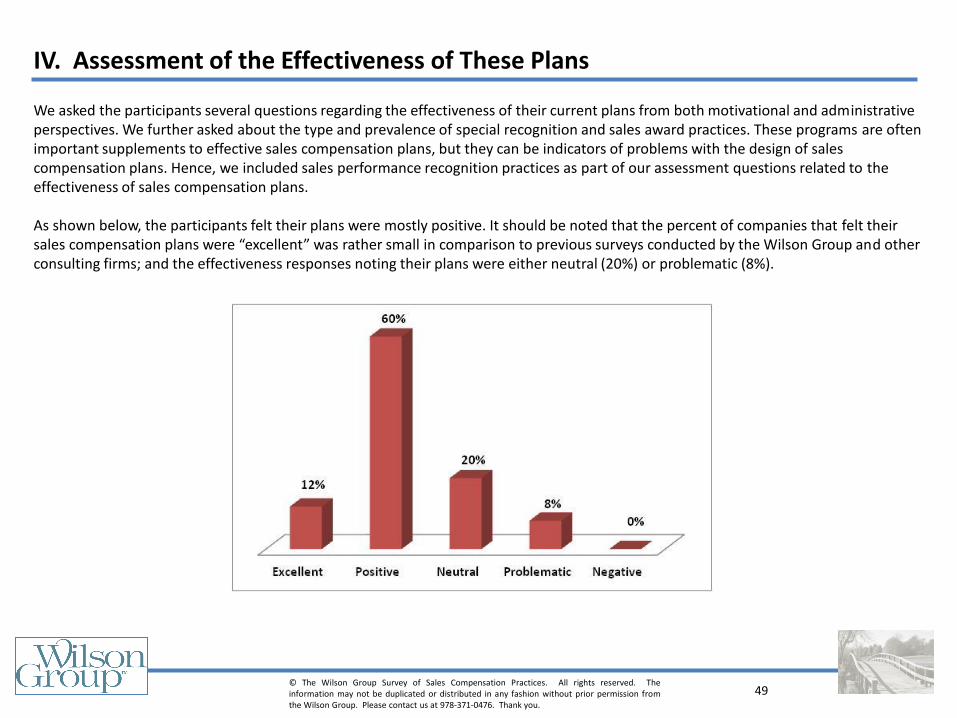
We asked the participants several questions regarding the effectiveness of their current plans from both motivational and administrative perspectives. We further asked about the type and prevalence of special recognition and sales award practices. These programs are often important supplements to effective sales compensation plans, but they can be indicators of problems with the design of sales compensation plans. Hence, we included sales performance recognition practices as part of our assessment questions related to the effectiveness of sales compensation plans. As shown below, the participants felt their plans were mostly positive. It should be noted that the percent of companies that felt their sales compensation plans were “excellent” was rather small in comparison to previous surveys conducted by the Wilson Group and other consulting firms; and the effectiveness responses noting their plans were either neutral (20%) or problematic (8%).
50 © The Wilson Group Survey of Sales Compensation Practices. All rights reserved. The information may not be duplicated or distributed in any fashion without prior permission from the Wilson Group. Please contact us at 978-371-0476. Thank you.
IV. Assessment of the Effectiveness of These Plans
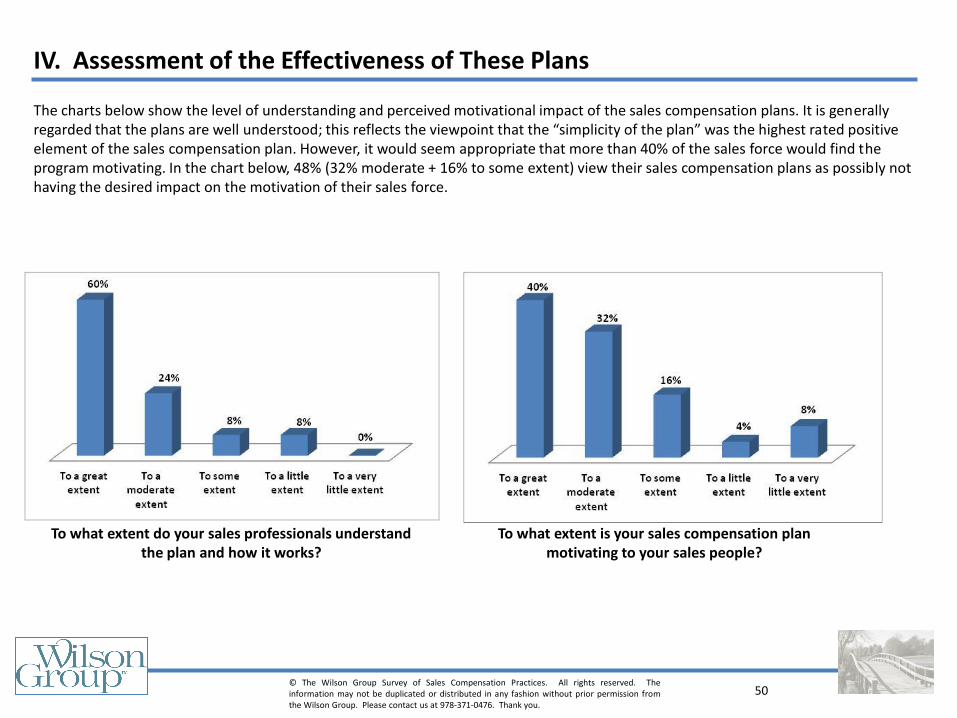
The charts below show the level of understanding and perceived motivational impact of the sales compensation plans. It is generally regarded that the plans are well understood; this reflects the viewpoint that the “simplicity of the plan” was the highest rated positive element of the sales compensation plan. However, it would seem appropriate that more than 40% of the sales force would find the program motivating. In the chart below, 48% (32% moderate + 16% to some extent) view their sales compensation plans as possibly not having the desired impact on the motivation of their sales force.
To what extent do your sales professionals understand the plan and how it works?
To what extent is your sales compensation plan motivating to your sales people?
51 © The Wilson Group Survey of Sales Compensation Practices. All rights reserved. The information may not be duplicated or distributed in any fashion without prior permission from the Wilson Group. Please contact us at 978-371-0476. Thank you.
IV. Assessment of the Effectiveness of These Plans
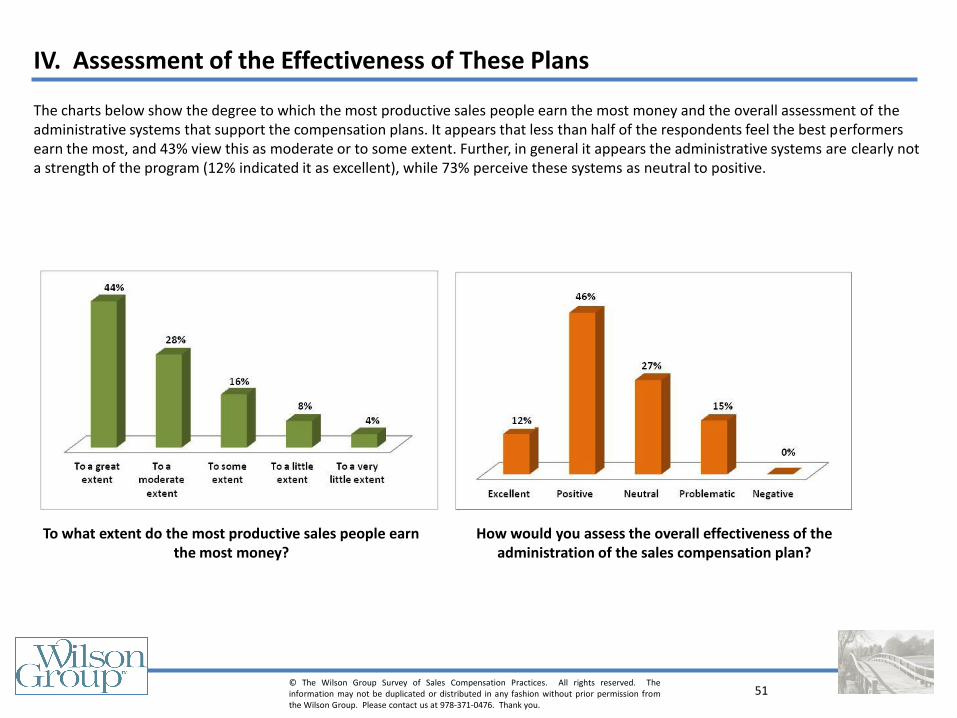
To what extent do the most productive sales people earn the most money?
How would you assess the overall effectiveness of the administration of the sales compensation plan?
The charts below show the degree to which the most productive sales people earn the most money and the overall assessment of the administrative systems that support the compensation plans. It appears that less than half of the respondents feel the best performers earn the most, and 43% view this as moderate or to some extent. Further, in general it appears the administrative systems are clearly not a strength of the program (12% indicated it as excellent), while 73% perceive these systems as neutral to positive.
52 © The Wilson Group Survey of Sales Compensation Practices. All rights reserved. The information may not be duplicated or distributed in any fashion without prior permission from the Wilson Group. Please contact us at 978-371-0476. Thank you.
IV. Assessment of the Effectiveness of These Plans
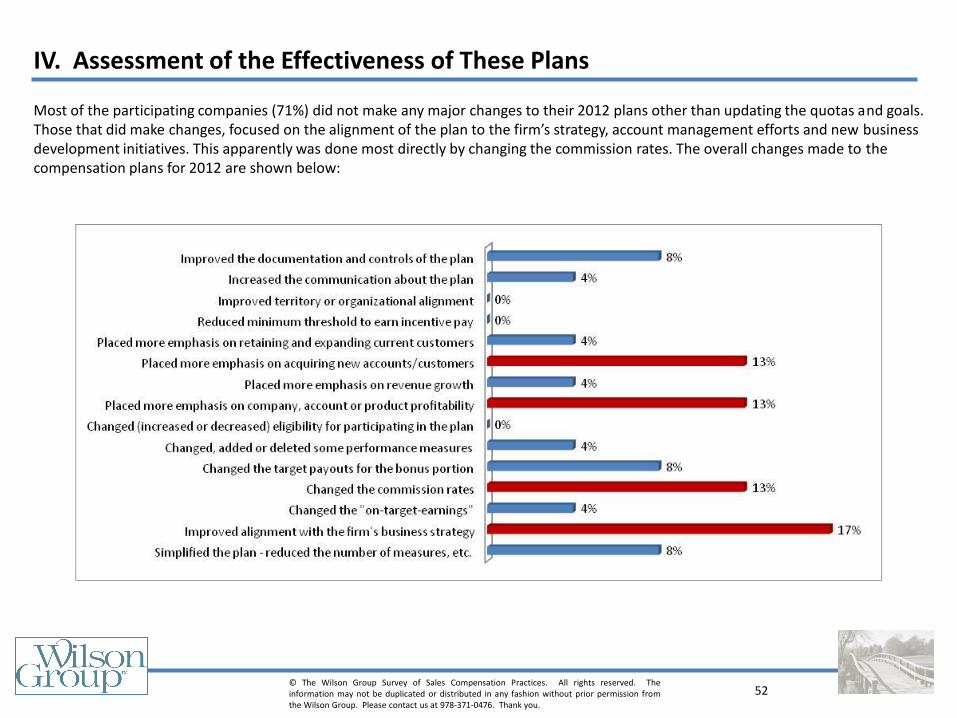
Most of the participating companies (71%) did not make any major changes to their 2012 plans other than updating the quotas and goals. Those that did make changes, focused on the alignment of the plan to the firm’s strategy, account management efforts and new business development initiatives. This apparently was done most directly by changing the commission rates. The overall changes made to the compensation plans for 2012 are shown below:
53 © The Wilson Group Survey of Sales Compensation Practices. All rights reserved. The information may not be duplicated or distributed in any fashion without prior permission from the Wilson Group. Please contact us at 978-371-0476. Thank you.
IV. Assessment of the Effectiveness of These Plans
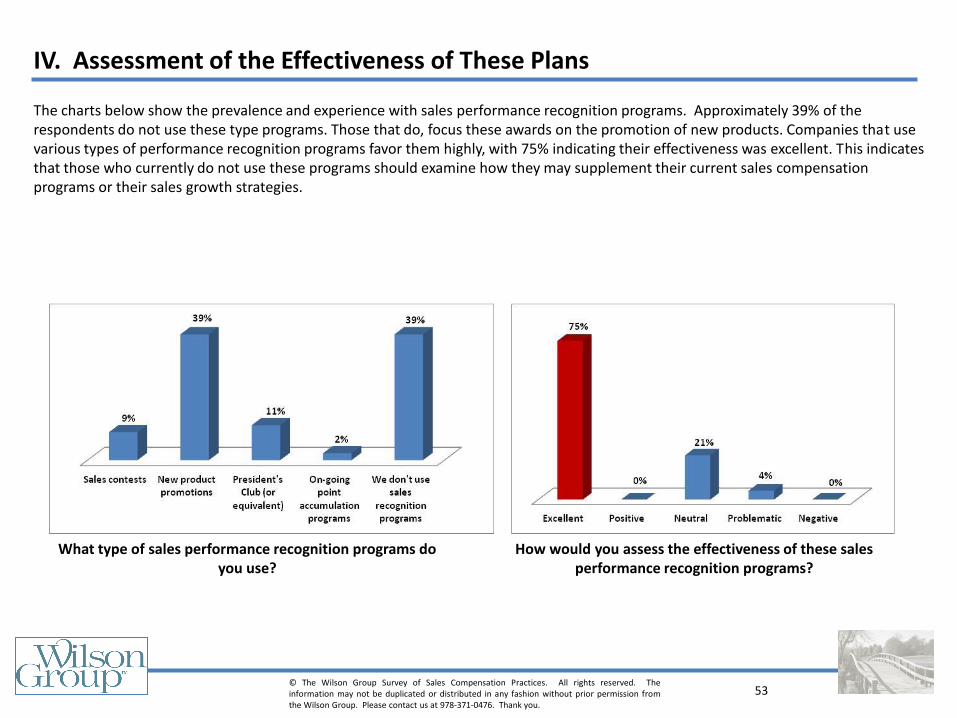
The charts below show the prevalence and experience with sales performance recognition programs. Approximately 39% of the respondents do not use these type programs. Those that do, focus these awards on the promotion of new products. Companies that use various types of performance recognition programs favor them highly, with 75% indicating their effectiveness was excellent. This indicates that those who currently do not use these programs should examine how they may supplement their current sales compensation programs or their sales growth strategies.
What type of sales performance recognition programs do you use?
How would you assess the effectiveness of these sales performance recognition programs?
54 © The Wilson Group Survey of Sales Compensation Practices. All rights reserved. The information may not be duplicated or distributed in any fashion without prior permission from the Wilson Group. Please contact us at 978-371-0476. Thank you.
IV. Assessment of the Effectiveness of These Plans
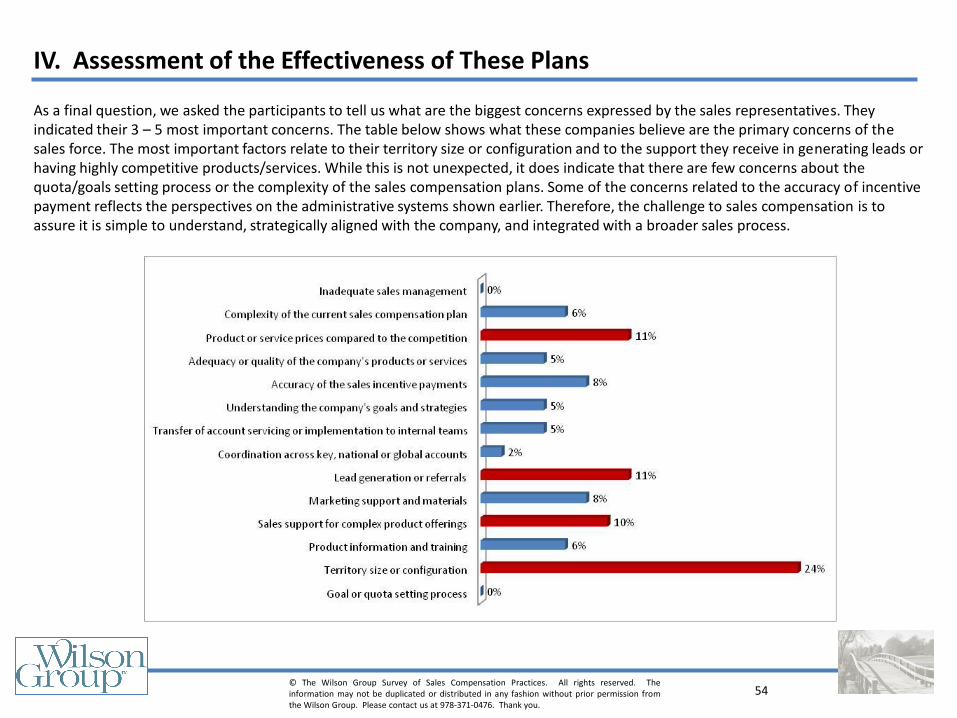
As a final question, we asked the participants to tell us what are the biggest concerns expressed by the sales representatives. They indicated their 3 – 5 most important concerns. The table below shows what these companies believe are the primary concerns of the sales force. The most important factors relate to their territory size or configuration and to the support they receive in generating leads or having highly competitive products/services. While this is not unexpected, it does indicate that there are few concerns about the quota/goals setting process or the complexity of the sales compensation plans. Some of the concerns related to the accuracy of incentive payment reflects the perspectives on the administrative systems shown earlier. Therefore, the challenge to sales compensation is to assure it is simple to understand, strategically aligned with the company, and integrated with a broader sales process.
55 © The Wilson Group Survey of Sales Compensation Practices. All rights reserved. The information may not be duplicated or distributed in any fashion without prior permission from the Wilson Group. Please contact us at 978-371-0476. Thank you.
V. Primary Conclusions and Ideas to Consider
We hope that you have enjoyed reviewing this special survey of sales compensation practices. We look forward to improving the survey information to better meet your needs for information and to establish important trends and insights on how companies are structuring their sales compensation programs. We will be doing this survey again next year. Based on the information presented in this report, we believe there are several things that are important for every organization to consider in making their sales compensation plans more effective for the organization and the sales professionals.
1. Examine the measures and assure that they are aligned with the strategy of the organization, and serve to focus and inspire sales professionals to do their very best.
2. Create opportunities to reinforce the progress people are making toward their sales goals. The survey data indicated a far less emphasis on performance recognition and performance management programs than we have seen in other organizations. Look for ways to encourage, reinforce and communicate the importance of revenue growth and goal achievement.
3. Make the performance–to–pay ratios meaningful to both the individual and the company. The company should look for ways in which the payouts reflect strong growth and profitability to the company; the individual should regard them as a meaningful “return on effort” for their achievements.
4. Keep the plan (or plans) simple but not simplistic. It is critical that people understand their compensation plans, and have confidence in the numbers and decisions. Use administrative systems to reinforce the access to timely progress information and create opportunities to reinforce achievements.
5. Identify one or two important features of the plan that will give a competitive advantage. Make sure these are important to your sales force as well. Every effective plan has unique elements – what are yours?
If you would like to talk about your sales compensation plans, and explore ways to improve their effectiveness and make a positive impact on the company, please contact us. We would enjoy working with you and building better capabilities and performance in your company.


