Saline County Baseline 1998-2007 November 1999 Social Sciences Unit University of Missouri – Columbia College of Agriculture, Food and Natural Resources 138 Mumford Hall Columbia, MO 65211 http://www.cpac.missouri.edu Community Policy Analysis Center
Transcript
Saline County Baseline 1998-2007
November 1999
Social Sciences Unit University of Missouri – Columbia
College of Agriculture, Food and Natural Resources 138 Mumford Hall
Issues for the Future............................................................................................................... 24
Saline County Baseline 1
Acknowledgements
A number of people made valuable contributions to the completion of this report. The Community Policy Analysis Center wishes to thank the Saline County Commission and the Steering Committee, who provided excellent leadership for this project. Several Saline County officials and their office staffs provided important data for the study, including Nelda Clemons (County Assessor) and Kenneth Bryant (County Clerk). CPAC would also like to thank Cynthia Crawford, Darin Starr, and Gerry Snapp from University Outreach and Extension for their leadership and commitment to the Saline County Study project. CPAC accepts full responsibility for the research findings and any errors in this report.
Saline County Commission
Presiding Commissioner - Russell Dehn
Commissioner-1st District - Richard Pemberton
Commissioner-2nd District - Mike Dillon
Saline County Study Steering Committee
Tim Simmons Wayne McReynolds Mark Belwood Marc Harris
This report describes a set of annual baseline projections on demographic, economic, and fiscal conditions through 2007 for Saline County, Missouri. Findings are based on a comprehensive statistical analysis of the most recent secondary data available, as well as important input provided by the Steering Committee. The Steering Committee reviewed earlier baseline assumptions and, using their personal knowledge of economic conditions in the county, came to a consensus on likely key growth rates. The following results are based on a projected annual growth rate of 1.4 percent per year in local employment and 1.2 percent per year in real personal income. Growth rates for employment and labor force in the surrounding counties are based on the average annual growth rates for the past ten years.
Findings • Over the next ten years Saline County's population will increase from almost 23,000 to
over 26,000 - an annual growth rate of 1.3 percent. This growth reverses the recent population decline in Saline County.
• Population growth is spurred in part by a net increase of nearly 2,000 local jobs. Job
growth is also expected to increase the available labor force in the county. • Population and employment growth will lead to almost 600 new students in Saline
County public schools. • Growth in the baseline period will also stimulate demand for almost 1,500 additional
housing units. • By the end of 2007 3,000 people will commute to local jobs from outside the county - up
from 2,100 in 1997. Outcommuting is also expected to increase by over 600 people. • Per capita income - before inflation - is projected to grow by 1.2 percent annually
through 2007. Total personal income is expected to grow by $154 million (in 1997 dollars) over this period, reflecting a real growth rate of 2.6 percent per year.
• Increased county income and employment will fuel continued growth in taxable retail
sales - from $166 million to $206 million (in 1997 dollars) in 2007. • Both county revenues and demand for expenditures are expected to grow rapidly during
the baseline period. Demand for expenditures is expected to grow faster than revenues, suggesting that the county will be challenged in the future to deliver public services more efficiently.
Saline County Baseline 3
VariablesBase
Year 1997 2007Absolute Change
Annual Growth
RateDemographics
Population 22,890 26,211 3,321 1.3%Enrollment in School District 3,945 4,517 572 1.3%
Total Revenue ($1,000) 4,329 6,019 1,690 3.55%Total Demand for Expenditures ($1,000) 4,058 6,188 2,130 4.77%Revenues minus Expenditures ($1,000)* 271 (169)
* Often, actual spending alternates from a budget surplus to a deficit. However, on average, Missouri local governments must operate from a balanced budget.
Summary TableSaline County Baseline, 1998-2007
(Reported in 1997 dollars)
4 Community Policy Analysis Center
About the Show Me Model
The Show Me Model uses statistically estimated relationships to predict changes in economic, social, and fiscal conditions for Missouri counties under alternative economic conditions or scenarios. The model considers the effects of changes in employment, labor force, property tax base, personal income, retail sales, and demographics. The Show Me Model projects changes in population, commuting patterns, unemployment, tax revenues, and county expenditures. The heart of the model is a series of labor market relationships—the demand for workers (local and nearby jobs), and the supply of workers (local and external labor forces). The labor market model allocates all members of the available labor force between local jobs, external jobs, and unemployment. The fiscal relationships are based on cross-sectional data from county governments. The model measures: 1) the costs of providing public services, 2) the demand for public services, and 3) the size of the local tax base. Together these estimates of public costs and revenues lead to predictions of changes in fiscal deficits or surpluses. The Show Me model, based on statistical relationships, generates 10 years of annual projections for a multitude of economic, fiscal, and demographic indicators. The projections are shown in a series of charts and graphs for ease of interpretation. By employing the Show Me Model, alternative scenarios can be compared to baseline projections. Baselines are typically 10-year projections that assume no changes in policy or economic trends in the community. Baseline projections are developed collaboratively with residents of the community. The basic assumptions underlying baselines and scenarios are commonly generated from sources outside the Show Me Model. Trend analysis is often used to make preliminary estimates of baselines. Input-output models such as IMPLAN are frequently used to generate estimates of total employment and income changes associated with certain scenarios.
Saline County Baseline 5
Project Overview
Regional economic growth brings both opportunities and challenges. Increased population and higher incomes will place new demands on both the public and private sectors. For example, increased housing starts in the countryside will place new pressures on water and sewage treatment systems. Local governments will need to play a more active role in developing public infrastructure for increased growth to assure drinking water quality, sufficient law enforcement, and adequate transportation and communication systems for county residents in the 21st century. The Show Me Model and the baseline projections described in this report will assist public officials and county residents in addressing the consequences of these and other future changes. The baseline does not represent a forecast of local economic performance. Rather, it is designed to help decision-makers see local economic activity as a comprehensive system that is both logically consistent and statistically valid. The baseline can then be used as a measuring tool to estimate the direct and total effects of numerous expected changes. The model does not account for changes due to the rational business cycle or other macroeconomic effects. Dollar figures are reported in constant 1997 terms, with no attempt to estimate future inflation rates. Findings in this report are discussed in six sections. The first two sections describe future demographic and workforce characteristics in Saline County, assuming no major changes in policy or economic conditions. The third section discusses the economic base in the county. Income levels are shown in the fourth section. The fifth section focuses on the fiscal characteristics of county government under these conditions. The final section presents issues facing Saline County in the future.
6 Community Policy Analysis Center
Population Characteristics The following population figures can help citizens understand trends in their community. These trends can be used to analyze future service needs for the entire population or particular age groups. Trends of particular interest are population, intensity of population change, population by age group, and public school enrollment.
Figure 1. Saline County Population, 1970-2007
0
5,000
10,000
15,000
20,000
25,000
30,000
35,000
40,000
1970
1972
1974
1976
1978
1980
1982
1984
1986
1988
1990
1992
1994
1996
1998
2000
2002
2004
2006
Year
Pers
ons
In the current baseline, county population increases from 22,890 to 26,211 between 1997 and 2007 - an annual growth rate of 1.32 percent. Figure 1 illustrates the population change in the county since 1970. During the 1970s the county essentially maintained its population. During the 1980s and early 1990s Saline County's population decreased by over 2,000 people. Population started to rebound in 1994, but has yet to regain the 1970s level. Population is projected to continue growing due to expected increases in employment opportunities.
Saline County Baseline 7
Map 1. Intensity of Population Change 1990 - 1997
Missouri as a whole has experienced a population growth rate of 0.77 percent each year during 1990-1997, slower than the U.S. growth rate of 1.04 percent. Northern Missouri experienced population decline during this period, although the decline in actual numbers was small. The city of St. Louis lost population, contributing to much of the increase that is concentrated in the suburban St. Louis metropolitan area. Other areas of growth include the Lake of the Ozarks and Truman Reservoir region. The highest rates of growth were in the Branson/Table Rock Lake region. Relative to other declining regions of the state, Saline County has experienced relatively minor decreases in population during the 1990s.
Shaded counties have lost population 1 dot = 100 person decrease Unshaded counties have gained population 1 dot = 100 person increase
8 Community Policy Analysis Center
Figure 2. Saline County Population Change by Age Cohort, 1990-1996
-
1,000
2,000
3,000
4,000
5,000
6,000
7,000
0-4 5-17 18-24 25-44 45-64 65-74 74+
Age Group
Pers
ons
1990199119921993199419951996
Figure 2 displays Saline County's population between 1990 and 1996 by age categories. These categories are meant to reflect the stages of education and workforce participation levels of the population. The first category represents toddler-aged children. The age 5-17 category is school-aged children. The next cohort characterizes the portion of the population either entering the workforce or going on to higher education. The age groups 25-44 and 45-64 portray the general working-age population. The final two age categories are those exiting or no longer participating in the workforce. In most categories the population has remained steady. In the 25-44 cohort, though, population declined in the early 1990s, then steadied. Most of the growth in the 1994-1996 period occurred in the 5-17 and 45-64 age categories.
Saline County Baseline 9
Figure 3. Saline CountyPublic School Enrollment
School Year Ending 1990-2007
0
500
1,000
1,500
2,000
2,500
3,000
3,500
4,000
4,500
5,000
5,50019
90
1991
1992
1993
1994
1995
1996
1997
1998
1999
2000
2001
2002
2003
2004
2005
2006
2007
Year
Stud
ents
Figure 3 shows the projected growth in school enrollment, corresponding to the population trends in school age children shown in Figure 2. School enrollment declined slightly in the early 1990s, and has since returned to the previously higher enrollment levels.
10 Community Policy Analysis Center
Workforce Characteristics Workforce characteristics include the labor force, employment and unemployment levels, and commuting patterns. More specific analysis of employment by industry can provide a basis for comparison or for future planning and decision-making.
Figure 4. Saline CountyLabor Force, 1990-2007
0
2,500
5,000
7,500
10,000
12,500
15,000
17,500
20,000
22,500
25,000
1990
1991
1992
1993
1994
1995
1996
1997
1998
1999
2000
2001
2002
2003
2004
2005
2006
2007
Year
Pers
ons
Figure 4 illustrates expected growth in the civilian labor force - the number of adults who live in the county and are now either gainfully employed or actively seeking work. In this baseline the labor force is expected to increase by 1,732, representing a 1.29 percent annual growth over the next ten years. This increase is composed of growth in both the local labor force and number of incommuters.
Saline County Baseline 11
Figure 5. Saline CountyEmployment by Workplace, 1990-2007
0
2,500
5,000
7,500
10,000
12,500
15,000
17,500
20,000
22,500
25,000
27,500
30,00019
90
1991
1992
1993
1994
1995
1996
1997
1998
1999
2000
2001
2002
2003
2004
2005
2006
2007
Year
Num
ber o
f Ful
l and
Par
t-Tim
e Jo
bs
Figure 5 gives the employment levels for Saline County between 1990 and 2007. Employment declined in the early 1990s, but the county recovered lost employment by 1994. Employment is projected to increase at a rate of 1.4 percent per year through 2007. The growth will add over 1,800 jobs to the local economy over the next decade.
12 Community Policy Analysis Center
Map 2. Intensity of Employment Change 1990 - 1997
Map 2 shows the employment growth and decline throughout Missouri. Statewide, Missouri has experienced a 1.6 percent annual average growth rate. Notable growth in employment has occurred in the metro areas of St. Louis and Kansas City. However, many rural areas have also experienced employment growth, especially in the smaller metro areas of Columbia, Springfield, and in the Branson/Table Rock Lake region. Saline County's annual average growth rate of 1.25 percent between 1990 and 1997 is not as high as the state average. However, it is a positive indicator since the county's population and labor force declined during this same period.
Shaded counties have lost employment 1 dot = 100 person decrease Unshaded counties have gained employment 1 dot = 100 person increase
Saline County Baseline 13
Figure 6. Saline County Number of Employees by Industry
1990 - 1996
-
500
1,000
1,500
2,000
2,500
3,000
3,500
Agric
ultu
re,
fore
stry
, fis
hing
Min
ing
Con
stru
ctio
n
Man
ufac
turin
g
Tran
spor
tatio
n &
publ
ic u
tiliti
es
Who
lesa
le tr
ade
Ret
ail t
rade
Fina
nce,
Insu
ranc
e, R
eal
Est
ate
Ser
vice
s
Gov
ernm
ent a
ndG
ov't
Ent
erpr
ises
Industry
Empl
oyee
s
1990199119921993199419951996
Figure 6 shows the number of employees by industry for the years 1990 through 1996 for Saline County. In the early 1990s, recessionary years, employment decreased in manufacturing, services, and government. These three industries and retail trade accounted for most of the growth between 1993 and 1996.
14 Community Policy Analysis Center
Figure 7. Saline CountyUnemployment, 1990-2007
0
100
200
300
400
500
600
700
800
900
1,00019
90
1991
1992
1993
1994
1995
1996
1997
1998
1999
2000
2001
2002
2003
2004
2005
2006
2007
Year
Pers
ons
Figure 7 shows the number of unemployed adults in the Saline County labor force. The 1997 unemployment rate was 4.3 percent, only slightly higher than Missouri's rate of 4.2 percent for the same year. The significant drop between 1993 and 1994, mirroring the statewide decrease in unemployment levels, can be attributed to the opening and re-opening of some local businesses.
Figure 8 represents expected changes in the number of commuters. Incommuters are people who live outside of the county, but whose place of employment is within the county. Outcommuters are residents of Saline County who work outside of the county. The projections are based on the 1990 level of incommuters and outcommuters. Both incommuters and outcommuters are expected to grow 3.4 percent per year, over the projected time period, although incommuters are still expected to outnumber outcommuters through 2007.
16 Community Policy Analysis Center
Saline County Economic Base
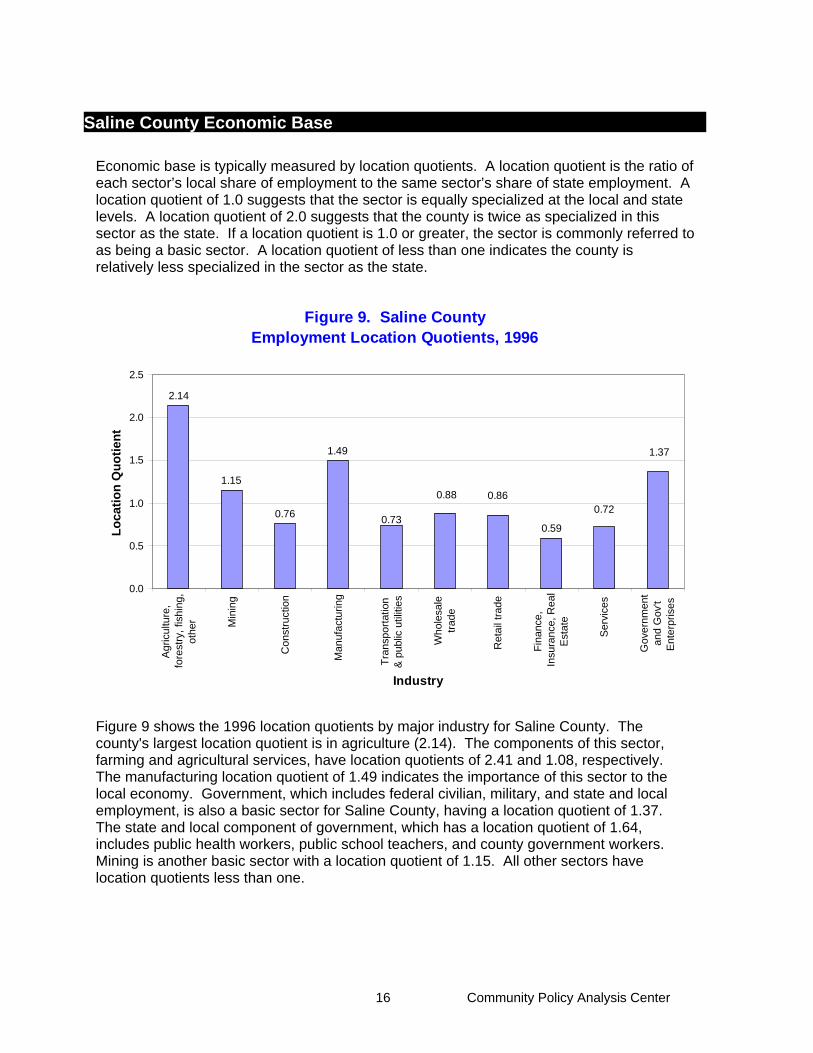
Economic base is typically measured by location quotients. A location quotient is the ratio of each sector’s local share of employment to the same sector’s share of state employment. A location quotient of 1.0 suggests that the sector is equally specialized at the local and state levels. A location quotient of 2.0 suggests that the county is twice as specialized in this sector as the state. If a location quotient is 1.0 or greater, the sector is commonly referred to as being a basic sector. A location quotient of less than one indicates the county is relatively less specialized in the sector as the state.
Figure 9 shows the 1996 location quotients by major industry for Saline County. The county's largest location quotient is in agriculture (2.14). The components of this sector, farming and agricultural services, have location quotients of 2.41 and 1.08, respectively. The manufacturing location quotient of 1.49 indicates the importance of this sector to the local economy. Government, which includes federal civilian, military, and state and local employment, is also a basic sector for Saline County, having a location quotient of 1.37. The state and local component of government, which has a location quotient of 1.64, includes public health workers, public school teachers, and county government workers. Mining is another basic sector with a location quotient of 1.15. All other sectors have location quotients less than one.
Saline County Baseline 17
Figure 10. Saline County Percent of Employment by Industry, 1996
Manufacturing19.7%
Retail Trade14.6%
Finance, Insurance, Real Estate4.0%
Services20.7%
Agriculture, forestry, fishing9.9%
Construction4.2%
Transportation and Public Utilities
4.2%
Mining0.3%Government
18.3%
Wholesale Trade4.2%
Figure 11. Missouri Percent of Employment by Industry, 1996
Manufacturing13.2%
Retail Trade17.0%Finance, Insurance, Real
Estate6.8%
Services28.8%
Wholesale Trade4.8%
Government13.4%
Mining0.2%
Transportation and Public Utilities
4.2%
Construction5.5%
Agriculture, forestry, fishing4.6%
Figures 10 and 11 show the percent of employment by industry for Saline County and Missouri. Saline County has a higher percentage of employment in government, manufacturing, and agriculture than the state as a whole. Conversely, the state is more concentrated in services and retail trade than Saline County.
18 Community Policy Analysis Center
Income Characteristics Income measures are an important part of a community's profile. All figures are standardized to 1997 dollars to discount any changes in income caused by inflation. Changes in income can give important indications about the well-being of the community.
Figure 12. Saline CountyReal Per Capita Income (1997 Dollars)
1990-2007
$0
$4,000
$8,000
$12,000
$16,000
$20,000
$24,000
$28,000
$32,000
$36,000
1990
1991
1992
1993
1994
1995
1996
1997
1998
1999
2000
2001
2002
2003
2004
2005
2006
2007
Year Figure 12 shows a steady increase in real per capita income for the next ten years. This indicator is often used to measure both local quality of life and productivity growth in a local economy. In the baseline period, real per capita income (minus inflation) grows from $23,253 to $26,199 - reflecting an annual growth rate of 1.2 percent per year.
Saline County Baseline 19
Figure 13. Saline County and MissouriEarnings By Source, 1990-1996
0.0%
10.0%
20.0%
30.0%
40.0%
50.0%
60.0%
70.0%
Wag
e/sa
lary
earn
ings
Tran
sfer
paym
ents
Div
iden
ds,
inte
rest
, ren
t
Wag
e/sa
lary
earn
ings
Tran
sfer
paym
ents
Div
iden
ds,
inte
rest
, ren
t
Source of Earnings
Perc
ent
1990199119921993199419951996
MissouriSaline County
Figure 13 shows earnings by source for Saline County and Missouri between 1990 and 1996. In 1996 Saline County residents were almost 40 percent more dependent on transfer payments for income than the average state resident. Transfer payments are made up of state and federal government payments to individuals, such as social security and unemployment payments. The decline in transfer payments as a percent of total earnings corresponds with the decline in unemployment in Saline County from 1993 to 1996. Investment earnings (dividends, interest, and rent) as percent of total earnings has been declining during this period.
20 Community Policy Analysis Center
Figure 14. Saline CountyReal Total Personal Income (1997 Dollars)
1990-2007
$0
$100,000
$200,000
$300,000
$400,000
$500,000
$600,000
$700,000
$800,000
$900,000
$1,000,00019
90
1991
1992
1993
1994
1995
1996
1997
1998
1999
2000
2001
2002
2003
2004
2005
2006
2007
Year
Thou
sand
s
Figure 14 shows total personal income (in 1997 dollars) growing through the projection period from $532 million to almost $687 million, a 2.6 percent annual growth rate. This growth is the result of increased employment as well as increased real per capita income.
Saline County Baseline 21
Fiscal Characteristics County services are funded primarily through property tax, sales tax, and intergovernmental revenues. Because of the direct link to the county financial statement, knowing the total assessed property value and retail sales levels in the county can play an important role in the planning process.
Figure 15. Saline CountyTotal Assessed Property Value (1997 Dollars)
1990-2007
$
$50,000
$100,000
$150,000
$200,000
$250,000
1990
1991
1992
1993
1994
1995
1996
1997
1998
1999
2000
2001
2002
2003
2004
2005
2006
2007
Year
Thou
sand
s
Figure 15 represents the values of assessed real and personal property in the county. Assessed valuation increased at an average rate of 0.75 percent per year between 1990 and 1998. The projected growth of assessed valuation is expected to increase by 1.2 percent per year between 1998 and 2007. The county property tax levy has increased from its 1990 level of 15 cents per $100 of assessed valuation to 18 cents in the most recent years. Property tax receipts have increase at a real average rate of 3.1 percent per year between 1990 and 1998.
Figure 16 represents the anticipated growth of taxable retail sales in the county, measured in 1997 dollars. Taxable retail sales declined in the early 1990s, rebounding in 1993 along with employment in the manufacturing and services sectors. Retail sales are expected to grow at an annual rate of 2.2 percent between 1997 and 2007. Growth in retail sales has a positive impact on county revenues. The sales tax rate for general revenues has maintained its one-half cent level.
Saline County Baseline 23
Figure 17. Saline CountyTotal Revenues and Total Demand for Expenditures
(1997 Dollars) 1990-2007
$0
$1,000,000
$2,000,000
$3,000,000
$4,000,000
$5,000,000
$6,000,000
$7,000,000
$8,000,000
$9,000,000
$10,000,000
1990
1991
1992
1993
1994
1995
1996
1997
1998
1999
2000
2001
2002
2003
2004
2005
2006
2007
Year
Revenues
Demand forExpenditures
Figure 17 represents the expected growth in both total revenue and total demand for expenditures for Saline County government in 1997 dollars. Total revenue (i.e. from county sales tax, property tax, fees, and intergovernmental transfers) is expected to grow at an annual rate of 3.6 percent per year over the next decade. At the same time, total demand for county expenditures is expected to grow annually at 4.8 percent. The jump in county revenues and expenditures from 1995 to 1996 is explained by an additional one-half cent sales tax that was implemented in 1996 (to expire in 2008) to support law enforcement. The following year's drop in revenues and expenditures is primarily due to a lower level of taxable retail sales than the previous year. County revenues and demand for expenditures will likely decrease with the expiration of the law enforcement sales tax, thereby reducing future growth rates. As demonstrated by the graph, total county revenues exceed expenditures in the base year by $271,000, but fall behind the total demand for expenditures in the projected years. Thus, the total budget deficit in the year 2007 is expected to reach $169,000 if the demand for county services is met. By Missouri law, the county is not authorized to spend more than it takes in over time. The rapid growth in demand for services suggests that county government will be challenged in the future to deliver public services even more efficiently, and generate new sources of government revenues as well. It is important to note that many of the investments needed to serve a growing population base, such as expansion for schools and water and sewer infrastructure, are managed by other local government jurisdictions.
24 Community Policy Analysis Center
Issues for the Future
Saline County seems to be entering a period of economic and population growth. This growth will increase the demands for public services, the local tax base, the demand for housing, retail sales, and employment opportunities. Growth in population will lead to land use changes, especially near the cities. The will, in turn, lead to potential land use conflicts. The demand for local government services is expected to increase faster than the growth in the tax base, leading to the need to reassess revenues, and/or make difficult choices between county public expenditures.
Notice of Nondiscrimination: CPAC and the University of Missouri-Columbia does not discriminate on the basis of race, color, religion, national origin, ancestry, sex, age, disability, or status as a disabled veteran or veteran of the Vietnam era. For more information, call Human Resource Services at (573) 882-4256, or the U.S. Department of Education, Office of Civil Rights.
The Community Policy Analysis Center provides objective analysis and policy decision support for Missouri communities. Located at the University of Missouri-Columbia, CPAC is part of the Social Sciences Unit of MU’s College of Agriculture, Food and Natural Resources. Major funding for the Center is provided by the University of Missouri Outreach and Extension.
CPAC scientists work closely with state and local government leaders, local businesses and community groups to provide research and educational programs that will inform key decisions, and assist them in understanding how policy decisions at all levels of government affect their community’s quality of life.
For further information, please contact Professor Thomas G. Johnson, Ph.D. - Director, Community Policy Analysis Center- by phone (573/882-2157), fax (573/882-2504) or by mail:
Community Policy Analysis Center 138 Mumford Hall University of Missouri-Columbia Columbia, Missouri 65211-6200