19
Salinity Gradients in the Mission-Aransas National Estuarine Research Reserve Kimberly Bittler GIS and Water Resources Fall 2011
Salinity Gradients in the Mission-Aransas National
Estuarine Research Reserve
Kimberly Bittler
GIS and Water Resources
Fall 2011
INTRODUCTION
Freshwater inflow has a widely recognized influence on estuary productivity, including the estuaries in the
Gulf of Mexico (Powell et al 2002, Langley 1994, Mallin et al 1993, Tolan 2006). Freshwater carries nutrients and
sediments into estuaries, increasing productivity, in addition to determining salinity (Langley 1994). The salinity
gradients of estuaries are determined by the freshwater inflows, as freshwater dilutes sea water resulting in areas of
brackish water of varying salinities (Montagna et al 2011). The optimal ranges of many species are determined by
these salinity gradients, including commercially important oysters, shrimp and fishes (Gunter 1961, Powell et al
2003). Areas with lower salinities also serve as important nursery habitat (Longley 1994). As freshwater resources
become increasingly scarce, interest in developing minimum freshwater flows to maintain productivity in estuaries
has increased (Powell et al 2002). Developing precise and accurate data on salinity gradients is an important step in
developing these criteria and the models that will support them.
The Mission-Aransas National Estuarine Research Reserve (Mission-Aransas NERR) was established in
2007 with a mission to “bring together scientists, landowners, policy-makers, and the public to ensure that coastal
management decisions benefit flora and fauna, water quality and people” (http://www.missionaransas.org/). There
are five System-Wide Monitoring Program (SWMP) sites established in the Mission-Aransas NERR, which collect
long term datasets. These data are collected using standardized procedures throughout the entire NERR system,
which includes 27 reserves representing most of the coastal states across the United States, and are maintained by
the Central Data Management Office (CDMO).
Salinity data is collected at each SWMP site in the Mission-Aransas NERR at 15 minute intervals, offering
a data source with high temporal resolution. Other state agencies, such as Texas Parks and Wildlife Department
(TPWD) collect salinity data within the Mission-Aransas NERR at more sites, offering a data source with high
spatial resolution but lower temporal resolution. The goals of this project were to determine on what time scale
salinity varies, the spatial scale on which salinity varies, and investigate the possibility of coupling these two types
of data to create an accurate model of salinity within the Mission-Aransas Estuary.
METHODS
STUDY SITE
The Mission-Aransas NERR was chosen as the study site for this project due to the high availability of data
within this area. The Mission-Aransas estuary is relatively healthy, with low development and a small watershed
that is influenced mainly by coastal weather (Montagna et al 2011). The primary freshwater inputs into this estuary
are from the Mission and Aransas rivers flowing into the protected Copano Bay which is connected to the ocean
through Aransas and Redfish Bays via an inlet at Port Aransas (Chen 2010). Aransas and Mesquite Bays are
influenced not only by the Copano Bay system, but by the Guadelupe/San Antonio Bay system to the north (Chen
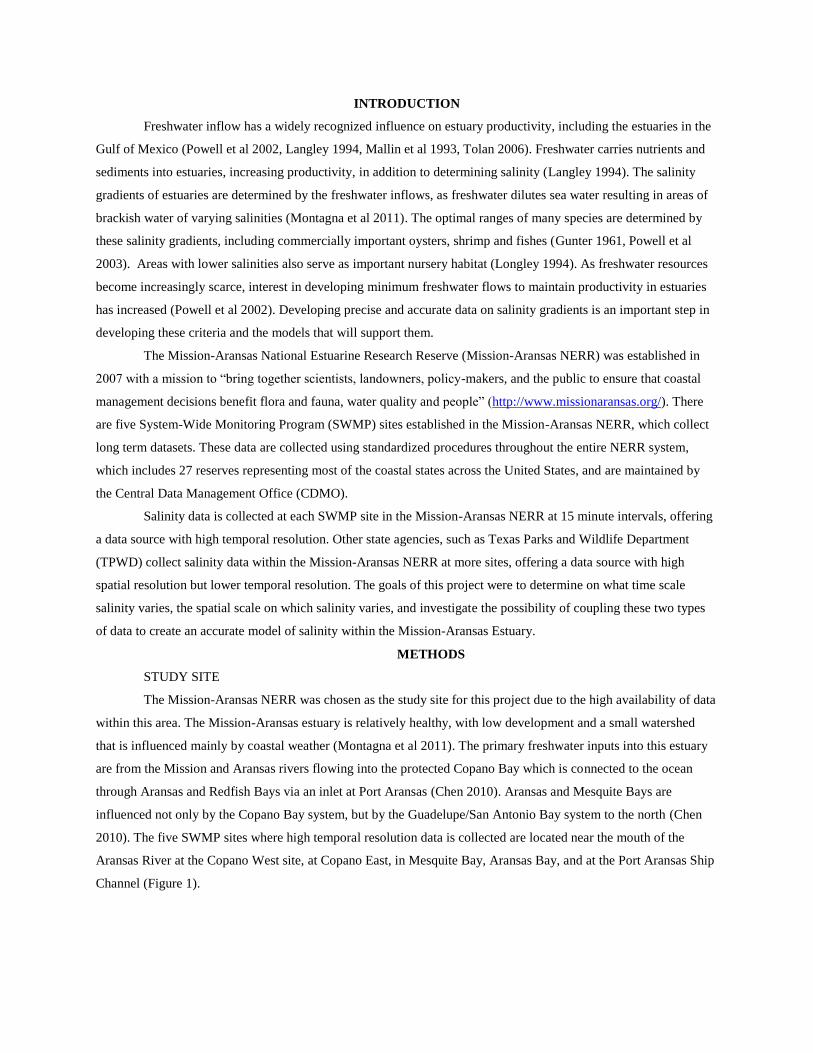
2010). The five SWMP sites where high temporal resolution data is collected are located near the mouth of the
Aransas River at the Copano West site, at Copano East, in Mesquite Bay, Aransas Bay, and at the Port Aransas Ship
Channel (Figure 1).
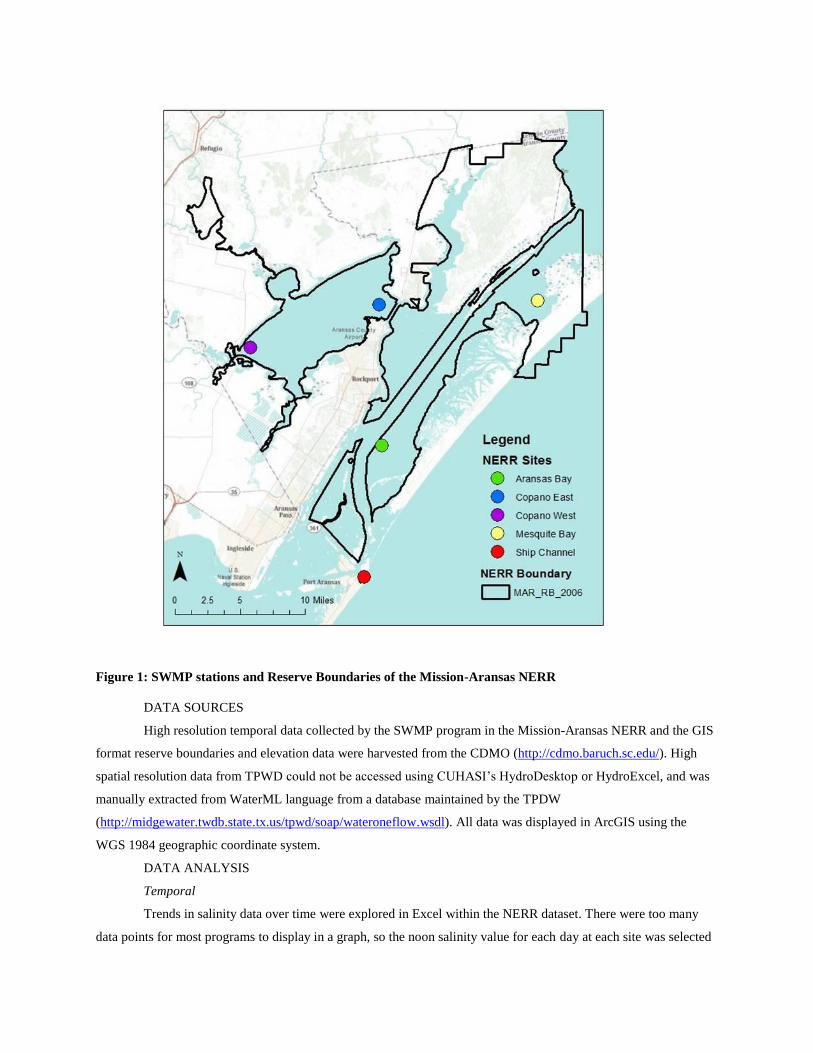
Figure 1: SWMP stations and Reserve Boundaries of the Mission-Aransas NERR
DATA SOURCES
High resolution temporal data collected by the SWMP program in the Mission-Aransas NERR and the GIS
format reserve boundaries and elevation data were harvested from the CDMO (http://cdmo.baruch.sc.edu/). High
spatial resolution data from TPWD could not be accessed using CUHASI’s HydroDesktop or HydroExcel, and was
manually extracted from WaterML language from a database maintained by the TPDW
(http://midgewater.twdb.state.tx.us/tpwd/soap/wateroneflow.wsdl). All data was displayed in ArcGIS using the
WGS 1984 geographic coordinate system.
DATA ANALYSIS
Temporal
Trends in salinity data over time were explored in Excel within the NERR dataset. There were too many
data points for most programs to display in a graph, so the noon salinity value for each day at each site was selected
to explore variation. A spatial interpretation of the temporal data was displayed using monthly averages of salinity
interpolated using the Inverse Distance Weighting (IDW) tool in ArcGIS. IDW was chosen over other methods of
interpolation due to the low density of sites. The IDW extent was set so that all water features of the estuary were
included, and a mask was established in the raster analysis environment so that only relevant areas were displayed.
Spatial
The investigation of spatial variation focused on a time period of significant changes in salinity, identified
in the temporal analysis. The high spatial resolution TPWD data was divided into several independent sets of points
based on date to minimize the confounding effects of temporal variability on spatial variability. No more than three
consecutive days of sampling were ever grouped together. This data did not always cover the entire study site, so
interpolation ranges were set only to the extent of the input points. The IDW interpolation method was used again
for consistency, and a polyline barrier (Figure 2) was used to prevent disconnected water bodies from influencing
each other in the interpolations.
Figure 2: Polyline Barrier (shown in red) used for IDW interpolations of data
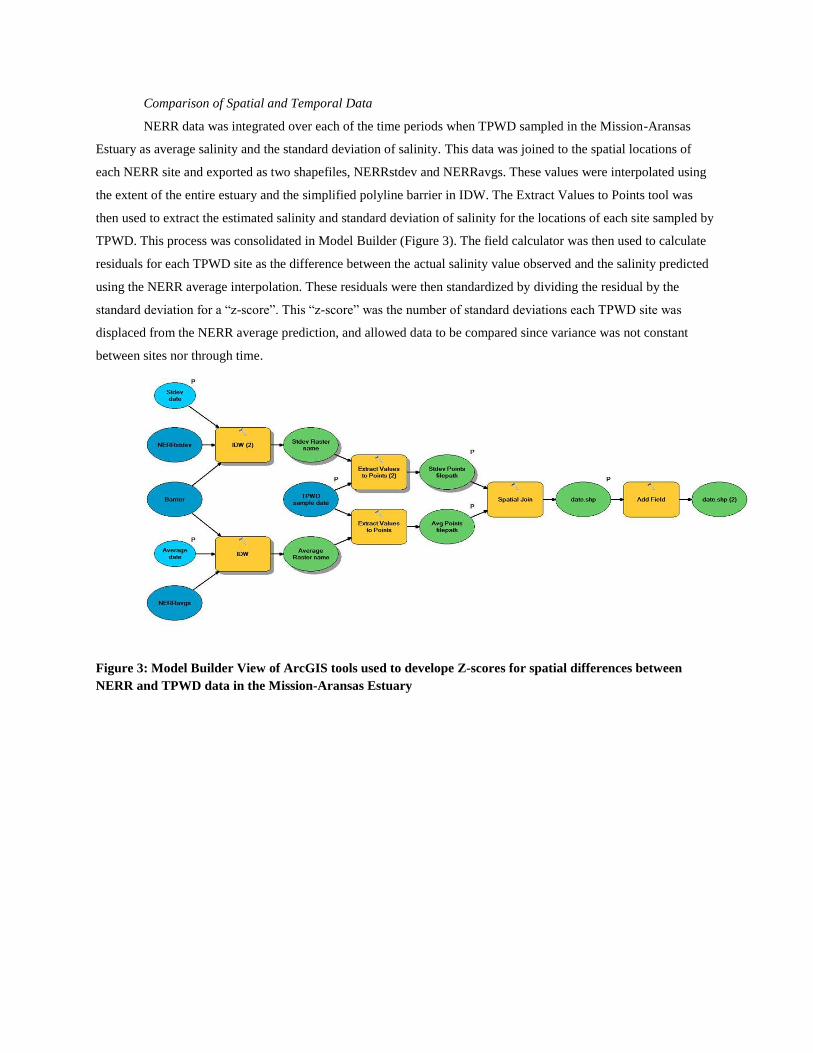
Comparison of Spatial and Temporal Data
NERR data was integrated over each of the time periods when TPWD sampled in the Mission-Aransas
Estuary as average salinity and the standard deviation of salinity. This data was joined to the spatial locations of
each NERR site and exported as two shapefiles, NERRstdev and NERRavgs. These values were interpolated using
the extent of the entire estuary and the simplified polyline barrier in IDW. The Extract Values to Points tool was
then used to extract the estimated salinity and standard deviation of salinity for the locations of each site sampled by
TPWD. This process was consolidated in Model Builder (Figure 3). The field calculator was then used to calculate
residuals for each TPWD site as the difference between the actual salinity value observed and the salinity predicted
using the NERR average interpolation. These residuals were then standardized by dividing the residual by the
standard deviation for a “z-score”. This “z-score” was the number of standard deviations each TPWD site was
displaced from the NERR average prediction, and allowed data to be compared since variance was not constant
between sites nor through time.
Figure 3: Model Builder View of ArcGIS tools used to develope Z-scores for spatial differences between
NERR and TPWD data in the Mission-Aransas Estuary
RESULTS
TEMPORAL
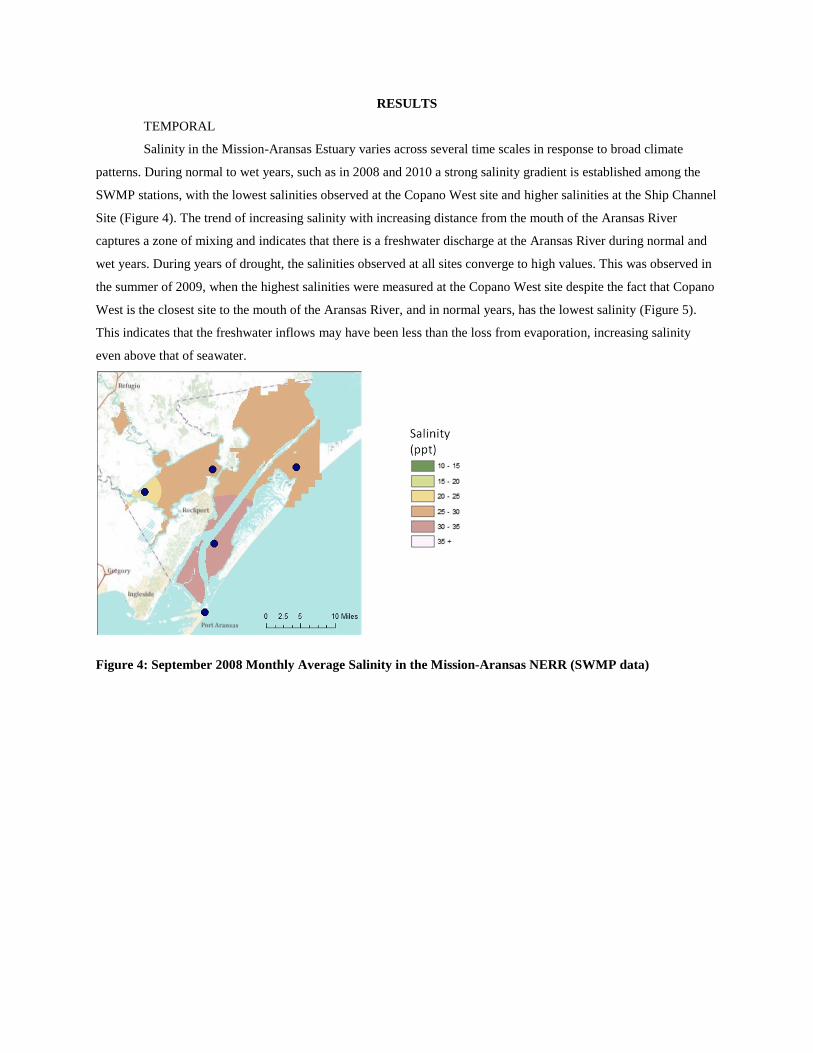
Salinity in the Mission-Aransas Estuary varies across several time scales in response to broad climate
patterns. During normal to wet years, such as in 2008 and 2010 a strong salinity gradient is established among the
SWMP stations, with the lowest salinities observed at the Copano West site and higher salinities at the Ship Channel
Site (Figure 4). The trend of increasing salinity with increasing distance from the mouth of the Aransas River
captures a zone of mixing and indicates that there is a freshwater discharge at the Aransas River during normal and
wet years. During years of drought, the salinities observed at all sites converge to high values. This was observed in
the summer of 2009, when the highest salinities were measured at the Copano West site despite the fact that Copano
West is the closest site to the mouth of the Aransas River, and in normal years, has the lowest salinity (Figure 5).
This indicates that the freshwater inflows may have been less than the loss from evaporation, increasing salinity
even above that of seawater.
Figure 4: September 2008 Monthly Average Salinity in the Mission-Aransas NERR (SWMP data)
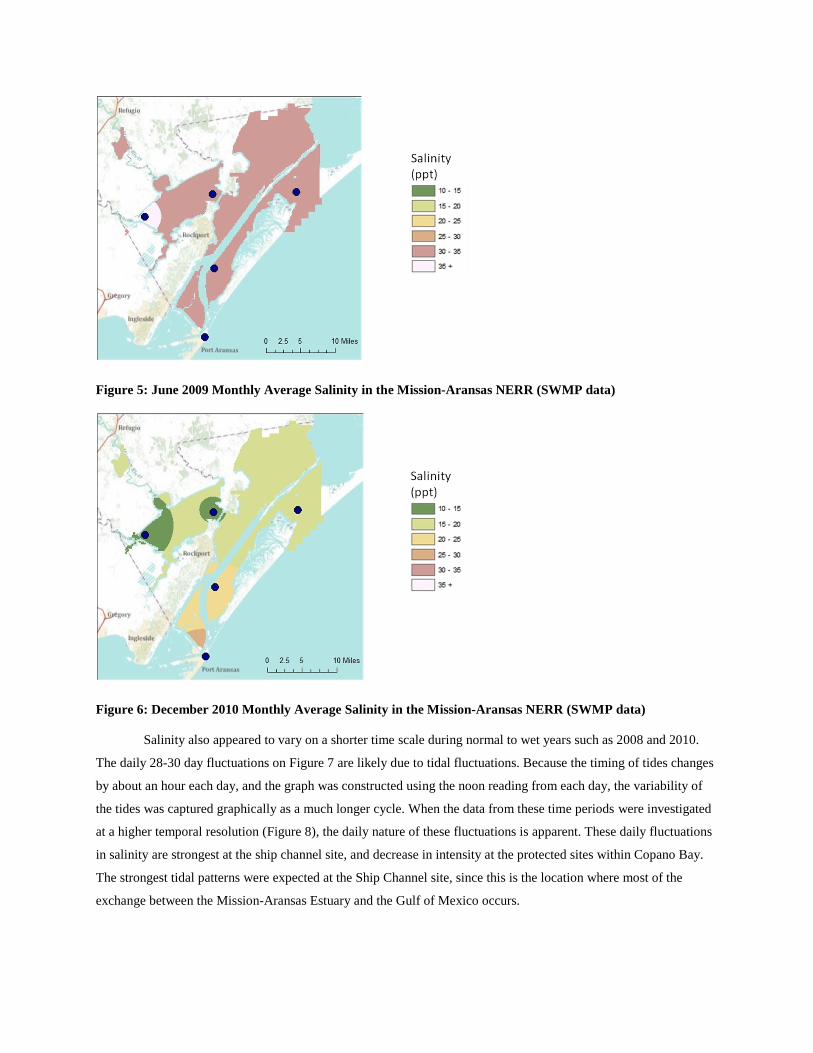
Figure 5: June 2009 Monthly Average Salinity in the Mission-Aransas NERR (SWMP data)
Figure 6: December 2010 Monthly Average Salinity in the Mission-Aransas NERR (SWMP data)
Salinity also appeared to vary on a shorter time scale during normal to wet years such as 2008 and 2010.
The daily 28-30 day fluctuations on Figure 7 are likely due to tidal fluctuations. Because the timing of tides changes
by about an hour each day, and the graph was constructed using the noon reading from each day, the variability of
the tides was captured graphically as a much longer cycle. When the data from these time periods were investigated
at a higher temporal resolution (Figure 8), the daily nature of these fluctuations is apparent. These daily fluctuations
in salinity are strongest at the ship channel site, and decrease in intensity at the protected sites within Copano Bay.
The strongest tidal patterns were expected at the Ship Channel site, since this is the location where most of the
exchange between the Mission-Aransas Estuary and the Gulf of Mexico occurs.
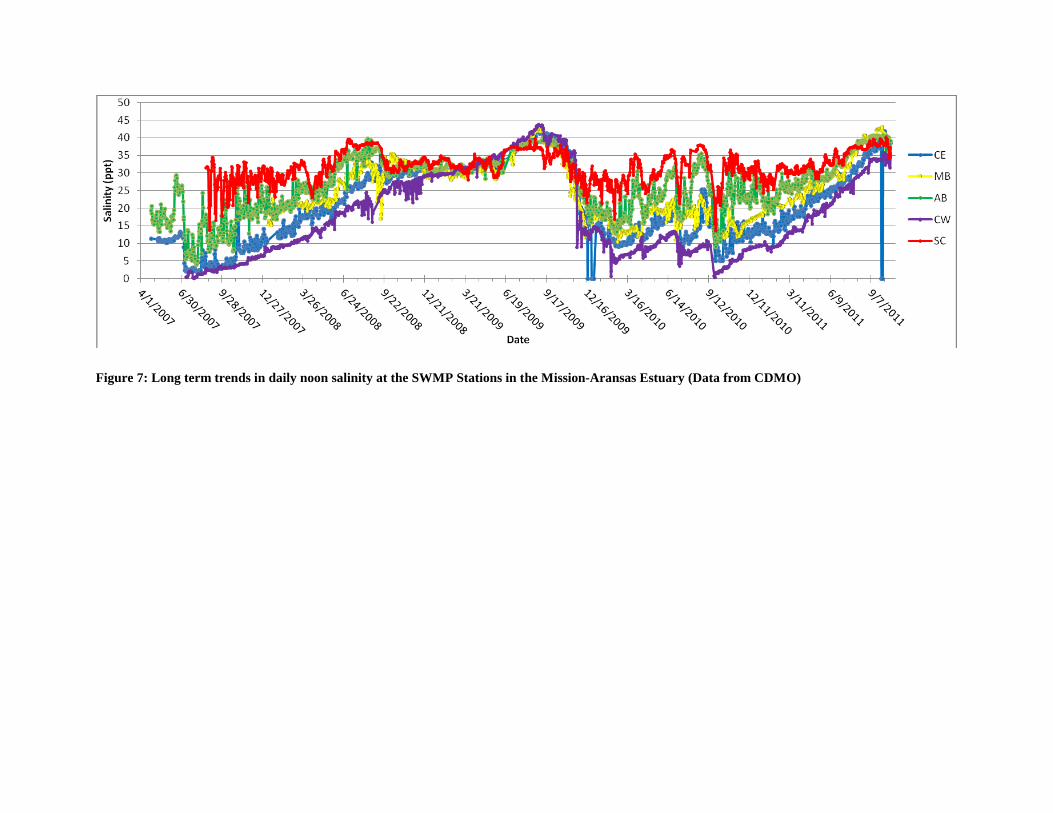
Figure 7: Long term trends in daily noon salinity at the SWMP Stations in the Mission-Aransas Estuary (Data from CDMO)
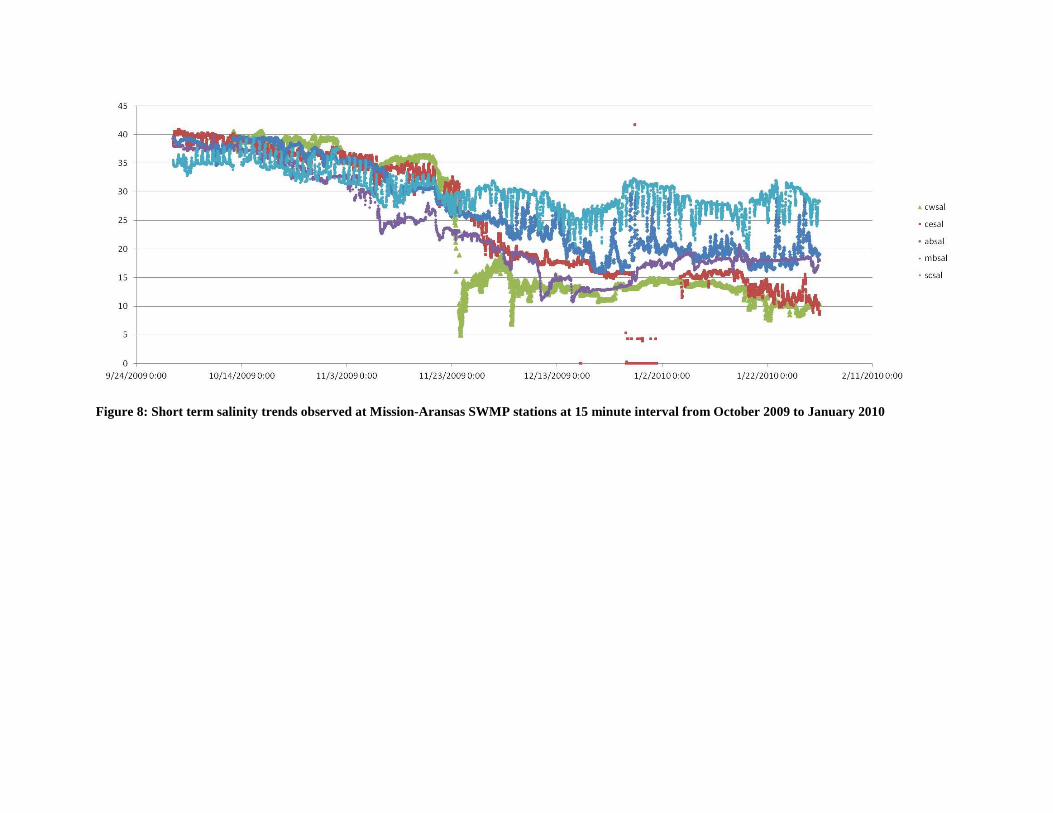
Figure 8: Short term salinity trends observed at Mission-Aransas SWMP stations at 15 minute interval from October 2009 to January 2010
In late 2009, the salinities recorded at the SWMP stations changed rapidly. When the data is observed at a
high temporal resolution between October 2009 and January 2010, there is an sharp decrease in salinity at the
Copano West site on November 23, 2009 (Figure 8). The decrease in salinity appears to be less intense at the
Mesquite Bay, Aransas Bay and Ship Channel sites. The Copano East salinity rapidly decreases starting at the same
date as the rapid decrease seen in Copano West, but this decrease is over a much longer time period. This suggests
that the Copano East and West sites are responding to the same influx of freshwater, but that mixing may have
dampened the effect of this event on sites with increasing distance from the Aransas River. Once the salinity
gradient typical of normal years is re-established (Figure 6), it is maintained for some time. This project did not
assess precipitation or stream gauge data, so our results do not indicate whether the maintenance of this gradient is
due to retention of freshwater or due to natural climatic variation. Chen (2010) reports that freshwater inflows into
the Copano Bay system are retained for long periods of time and change slowly while Tolan (2006) suggested that
the climatic variability of the El Nino Southern Oscillation explained most of the variation of salinity in Texas
estuaries, which is an effect of varying climate patterns rather than retention alone.
SPATIAL
The NERR sites capture a broad salinity gradient but miss some finer spatial variations in salinity. The
Mission-Aransas, like many estuaries in Texas, is very shallow. Vertical differences in salinity are insignificant
compared to spatial variation in salinity throughout most Texas estuaries (Powell et al 2002), so this study makes no
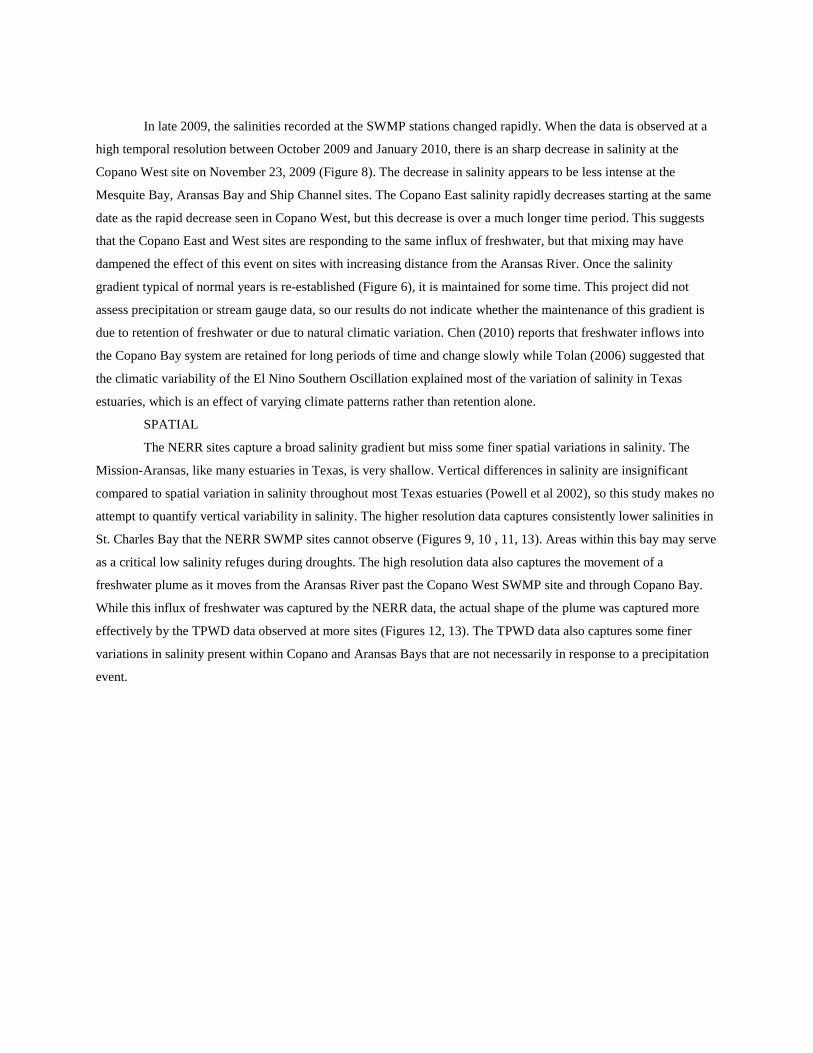
attempt to quantify vertical variability in salinity. The higher resolution data captures consistently lower salinities in
St. Charles Bay that the NERR SWMP sites cannot observe (Figures 9, 10 , 11, 13). Areas within this bay may serve
as a critical low salinity refuges during droughts. The high resolution data also captures the movement of a
freshwater plume as it moves from the Aransas River past the Copano West SWMP site and through Copano Bay.
While this influx of freshwater was captured by the NERR data, the actual shape of the plume was captured more
effectively by the TPWD data observed at more sites (Figures 12, 13). The TPWD data also captures some finer
variations in salinity present within Copano and Aransas Bays that are not necessarily in response to a precipitation
event.
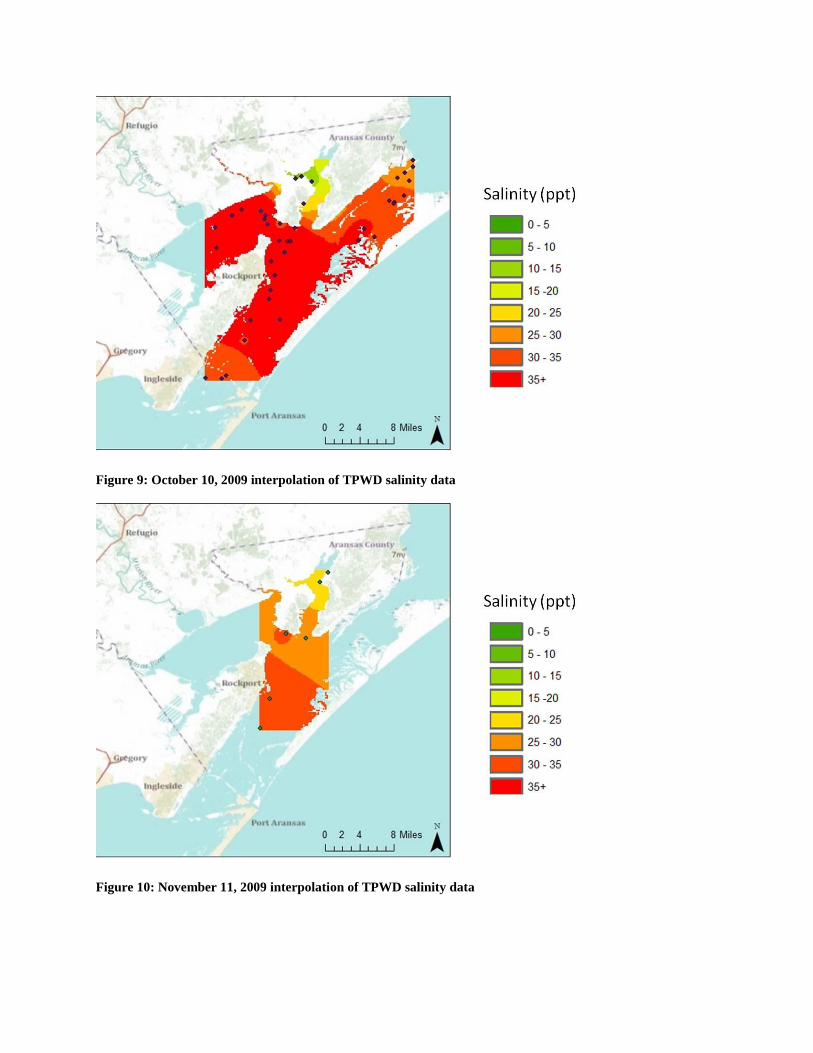
Figure 9: October 10, 2009 interpolation of TPWD salinity data
Figure 10: November 11, 2009 interpolation of TPWD salinity data
Figure 11: November 23, 2009 interpolation of TPWD salinity data
Figure 12: December 7, 2009 interpolation of TPWD salinity data
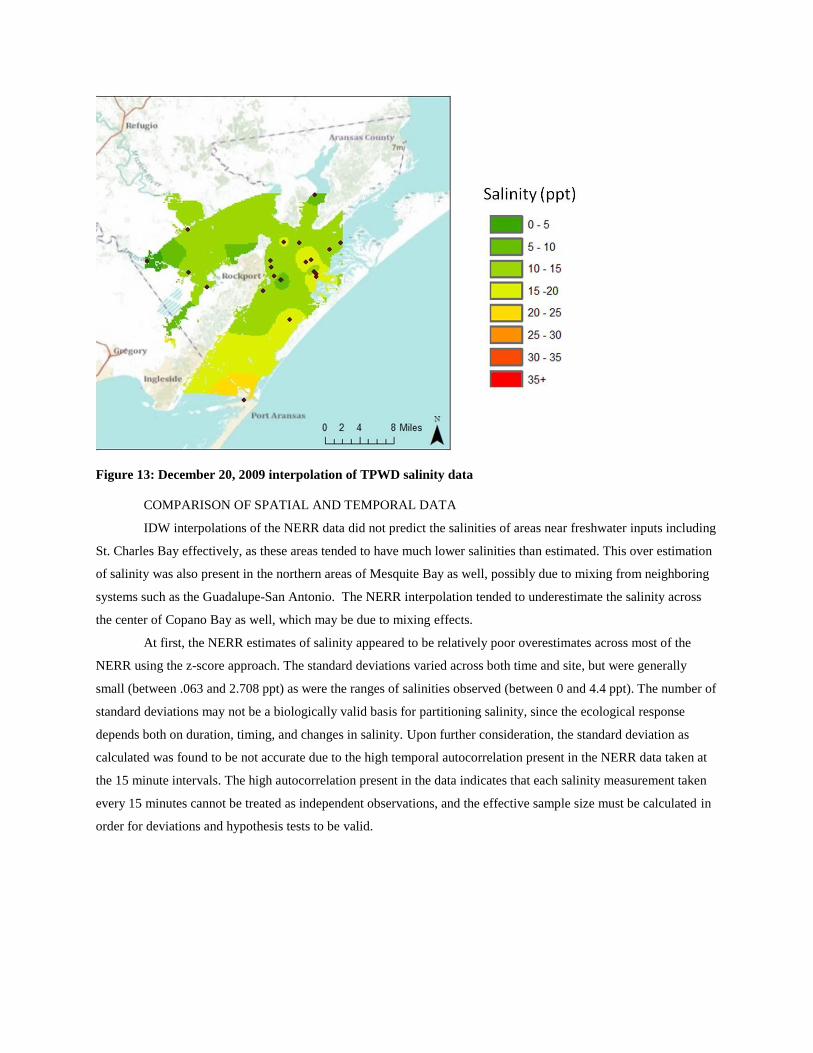
Figure 13: December 20, 2009 interpolation of TPWD salinity data
COMPARISON OF SPATIAL AND TEMPORAL DATA
IDW interpolations of the NERR data did not predict the salinities of areas near freshwater inputs including
St. Charles Bay effectively, as these areas tended to have much lower salinities than estimated. This over estimation
of salinity was also present in the northern areas of Mesquite Bay as well, possibly due to mixing from neighboring
systems such as the Guadalupe-San Antonio. The NERR interpolation tended to underestimate the salinity across
the center of Copano Bay as well, which may be due to mixing effects.
At first, the NERR estimates of salinity appeared to be relatively poor overestimates across most of the
NERR using the z-score approach. The standard deviations varied across both time and site, but were generally
small (between .063 and 2.708 ppt) as were the ranges of salinities observed (between 0 and 4.4 ppt). The number of
standard deviations may not be a biologically valid basis for partitioning salinity, since the ecological response
depends both on duration, timing, and changes in salinity. Upon further consideration, the standard deviation as
calculated was found to be not accurate due to the high temporal autocorrelation present in the NERR data taken at
the 15 minute intervals. The high autocorrelation present in the data indicates that each salinity measurement taken
every 15 minutes cannot be treated as independent observations, and the effective sample size must be calculated in
order for deviations and hypothesis tests to be valid.
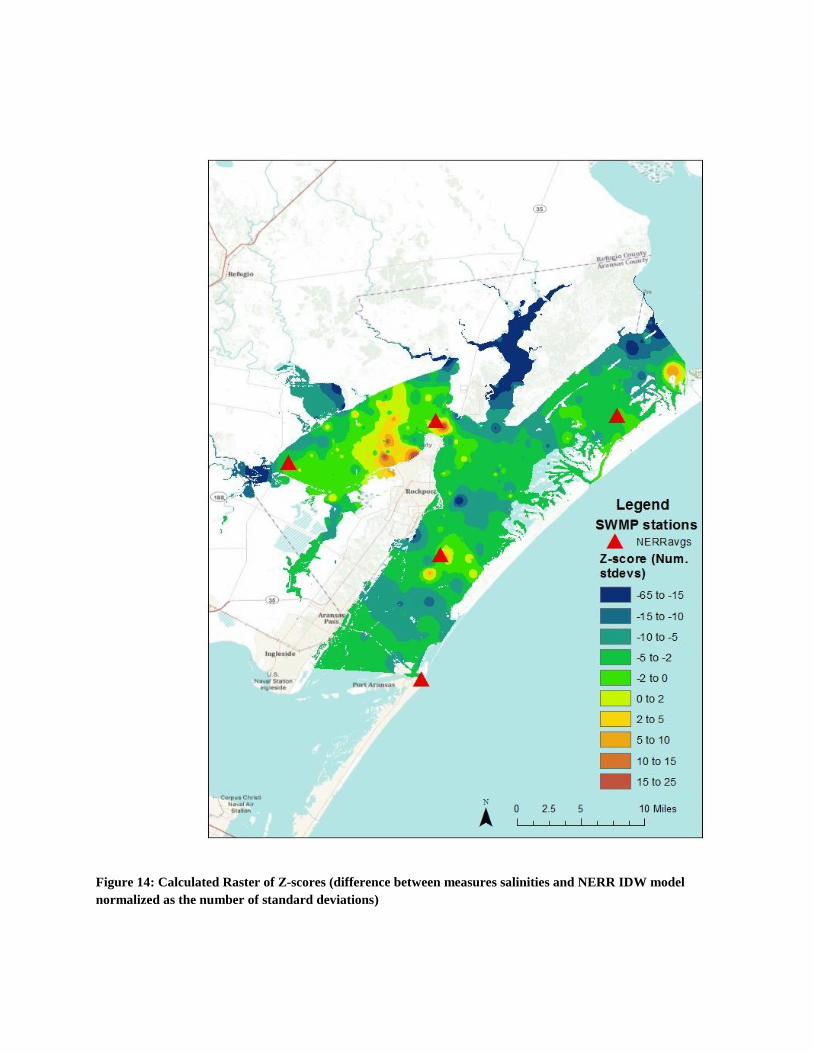
Figure 14: Calculated Raster of Z-scores (difference between measures salinities and NERR IDW model
normalized as the number of standard deviations)
A raster of the unaltered residuals was constructed as an alternative to the statistical z-score approach
(Figure 15). Most of the salinities measured in the Mission-Aransas fell within +/- 5 ppt of the IDW prediction using
NERR data alone. About half of Copano Bay and some areas around the Aransas Bay site were predicted within +/-
1 ppt by the IDW model of NERR salinities. Notable areas that were poorly predicted by the IDW interpolations of
the NERR data included St. Charles Bay, and the mouths of rivers and streams. This suggests that the NERR data
covers a salinity gradient that effectively represents most of the open water areas of the Mission-Aransas Estuary,
although there are finer variations and freshwater influences that are not captured.
To assess the statistical significance of the distribution of the residuals a Moran’s I test was performed.
Moran’s I tests for spatial autocorrelation between numerical values of sites, the residuals in this analysis, calculated
as the difference between actual salinity measured by the TPWD and the salinity predicted by an IDW interpolation
of the NERR data (Figure 16). There was no significant autocorrelations across most of Aransas Bay, indicating that
there may not be patterns of salinity in the area that can be predicted more effectively than the standard IDW
interpolation by the NERR data alone. There was significant clustering of lower salinity values in St. Charles Bay
and at some freshwater inputs. Since the salinities in these areas were lower than predicted by the NERR IDW
model alone, the significant clustering (p<0.01) may suggest that there is some pattern in the residuals. If there is a
pattern in the residuals, there is potential that they could be predicted with a model using the NERR data collected at
the SWMP stations, although more data and analysis is necessary to determine if this is feasible. There was also
significant clustering of high residual values in mid-Copano Bay. While the magnitude of the residuals were modest,
the clustering of these values was significant, again indicating a pattern that has potential to be modeled. The higher
salinities than predicted by an IDW interpolation of the sites on either side of this area was surprising, and may be
an effect of mixing processes in the Bay (Figure 15).
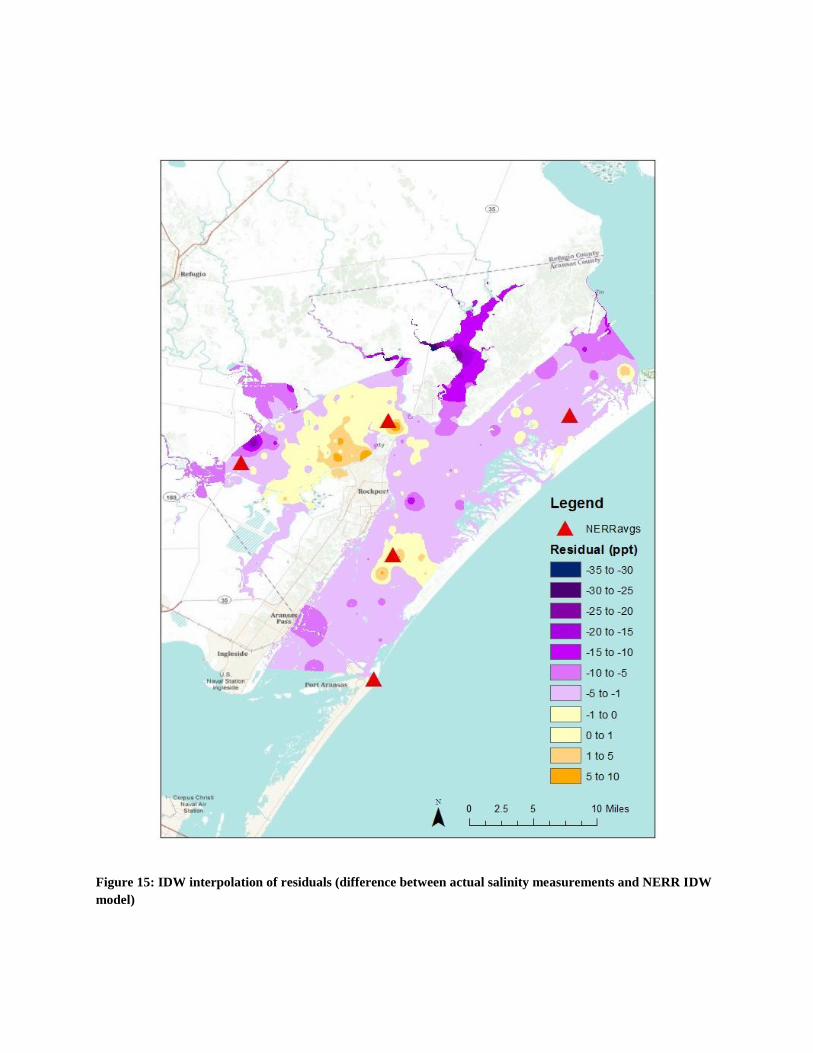
Figure 15: IDW interpolation of residuals (difference between actual salinity measurements and NERR IDW
model)
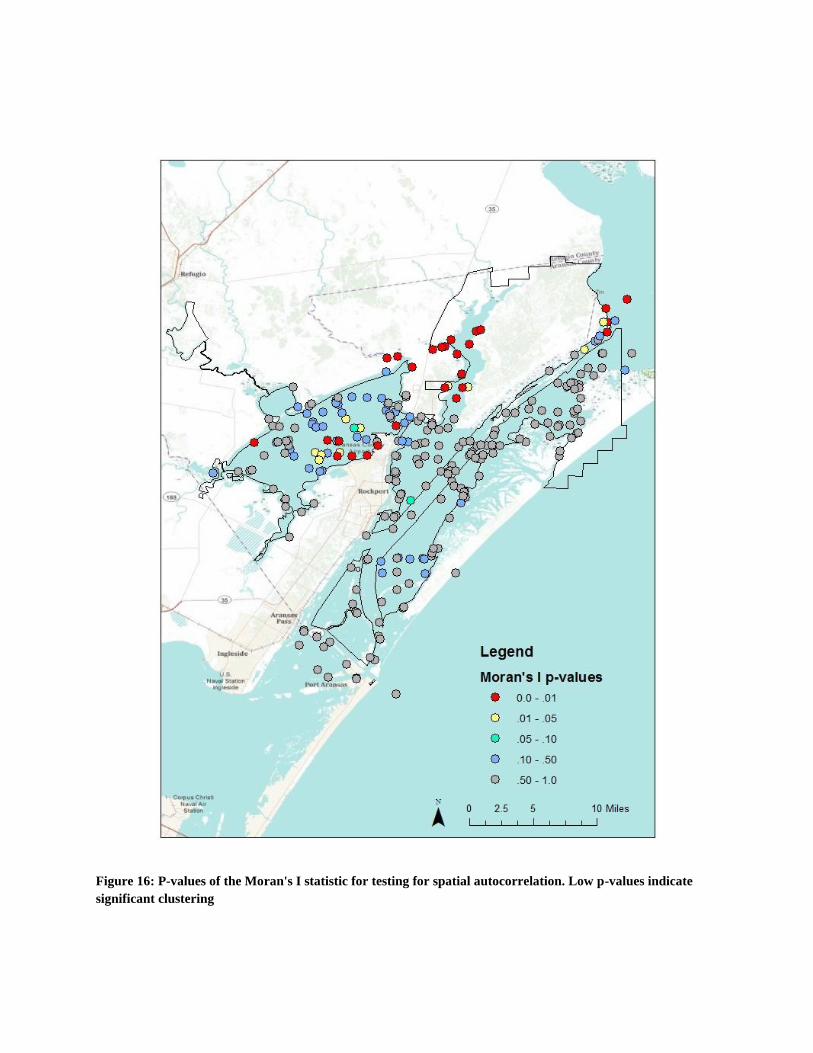
Figure 16: P-values of the Moran's I statistic for testing for spatial autocorrelation. Low p-values indicate
significant clustering
CONCLUSIONS
Salinity varies both spatially and temporally in the Mission-Aransas Estuary. Salinity varies at daily,
seasonal, and climatic scales and can be forced by individual events as well. The variability of salinity is not
constant between sites nor across time. There are finer spatial variations in salinity that are not easily predicted using
the SWMP stations at the NERR, especially within other protected bodies of water such as St. Charles Bay. Future
analysis should continue this method across a wider time frame, and make appropriate statistical adjustments for
both spatial and temporal autocorrelation. There is potential for using NERR data to predict finer spatial trends in
salinity, but more data is necessary to continue this analysis and develop models, and these models may have to
include additional climatic, precipitation, or stream gauge data to become useful. Future studies should focus on
expanding this rich dataset, calibrating salinity models, and developing ecologically meaningful precision limits.
REFERENCES
CDMO 2011. Central Data Management Office. http://cdmo.baruch.sc.edu/
Chen, G.F. 2010. Freshwater inflow recommendation for the Mission-Aransas Estuarine System. TPWD.
Gunter, G. 1961. Some relations of estuarine organisms to salinity. Limnology and Oceanography 6: 182-190.
Longley, W. 1994. Freshwater inflows to Texas Bays and Estuaries. TWDB and TPWD.
Montagna, P, J. Brenner, J. Gibeaut, S. Morehead. 2011. Chapter 4: Coastal Impacts. In: The Impact of Global
Warming on Texas. Texas Climate Initiative.
http://www.texasclimate.org/Books/ImpactofGlobalWarmingonTexas/tabid/481/Default.aspx
Mallin, M., H. Paerl, J. Rudek, P. Bates. 1993. Regulation of estuarine primary production by watershed rainfall
and river flow. Mar. Eco. Prog. Ser. 93: 199-203.
Powell, G. J. Matsumoto, D. Brouck. 2002. Methods for determining minimum freshwater inflow needs for texas
bays and estuaries. Estuaries 25: 1262-1274.
Tolan, J.M. 2006. El Nino-Southern Oscillation impacts translated to to the watershed scale: Estuarine salinity
patterns along the Texas Gulf Coast, 1982 to 2004. Estuarine, Coastal and Shelf Science 72: 247-260.


