45
1 YEAR-END REPORT Q4 JANUARY-DECEMBER 2019 SAMHÄLLSBYGGNADSBOLAGET I NORDEN AB (PUBL)

1
YEAR-END REPORT
Q4 JANUARY-DECEMBER 2019
SAMHÄLLSBYGGNADSBOLAGET I NORDEN AB (PUBL)

2
79,5 Properties’ value, SEK billion
20,04 EPRA NAV, SEK/share
FULL-YEAR Year in brief • Rental income increased to SEK 1,996m (1,680). • The operating surplus increased to SEK 1,265m (1,071). • Cash flow from operating activities before changes in working capital totalled SEK 745m (248). • Profit before tax amounted to SEK 3,137m (1,904), of which:
– Profit from property management was SEK 645m (321). The profit from property management includes costs for early redemption of loans and other non-recurring costs of SEK -300m (-147).
– Unrealized changes in value on properties are included at SEK 2,453m (1,575), of which unrealized changes in value as a result of building rights are included at SEK 338m (177).
• Profit for the period amounted to SEK 2,624m (1,690) after deduction of deferred tax of SEK -479m (-212) and current tax of SEK -34m (-2), corresponding to earnings per ordinary A and B share of SEK 2.97 (2.07) before dilution.
• The value of the property portfolio amounted to SEK 79.5 billion (25.2). • Long-term net asset value (EPRA NAV) increased to SEK 24,855m (8,736), corresponding to SEK 20.04 (11.55) per
share. • SBB’s average interest rate in the past 12 months decreased from 2.44 percent to 1.76 percent. • The company’s board of directors proposes an initial dividend of SEK 0.60 (0.25) per ordinary A and B share, a
dividend of SEK 2 (2) per D share and dividend of SEK 35 per preference share to be paid quarterly.
FOURTH QUARTER Important events during the fourth quarter
• On 15 November, SBB made a recommended public takeover bid to the shareholders of Hemfosa Fastigheter AB (publ) to acquire all shares of Hemfosa. At 31 December, 87.8 percent of the shares and 88.1 percent of the votes were controlled by SBB. The consideration for the shares consisted of newly issued shares and a cash consideration.
• SBB carried out a rights issue of Class B ordinary shares, which provided SBB with SEK 1.5 billion before issue expenses. In addition to this, a targeted issue of Class B ordinary shares was made to a volume of SEK 400m to Gösta Welandson.
• SBB acquired 1,560 apartments, of which the majority were in Växjö and Ronneby, from Amasten. SBB and Amasten also form a joint venture that will build housing in Nyköping. In addition to the acquisition, SBB also acquired 20 group homes and homes for the disabled in Sweden and Finland. Agreements were signed for the acquisition of 407 apartments from the Municipality of Kävlinge and 23 school properties from SISAB (owned by City of Stockholm).
• SBB made a voluntary repurchase offer of certain outstanding SEK hybrid bonds of around SEK 1.9 billion. At the same time, new hybrid bonds were issued to an amount of SEK 1,500m with an interest rate of Stibor 3m plus a margin of 3.50 percent.
• SBB was in December included in the property index FTSE EPRA Nareit Global Real Estate Index, which is one of the most renowned and used indexes for listed property investments
1 996 Rental income, SEK m
645 Profit from property management, SEK M
2 624 Interim profit, SEK m
596 Rental income, SEK m
137 Profit from property management, SEK M
1 287 Quarterly profit, SEK m
3
Significant events after the end of the period
• After the offer to Hemfosa’s shareholders expired, SBB controlled 93.5 percent of the shares and 93.8 percent of the votes in Hemfosa. SBB has after that
called for a compulsory purchase of the shares that have not been submitted in the offer.
• SBB issued a perpetual hybrid bond of EUR 500m with a fixed coupon of 2.624 percent and an unsecured bond of EUR 750m with a fixed coupon of 1
percent and a maturity of 7.5 years. • LOI have been entered into for the sale of properties totaling SEK 11 billion.
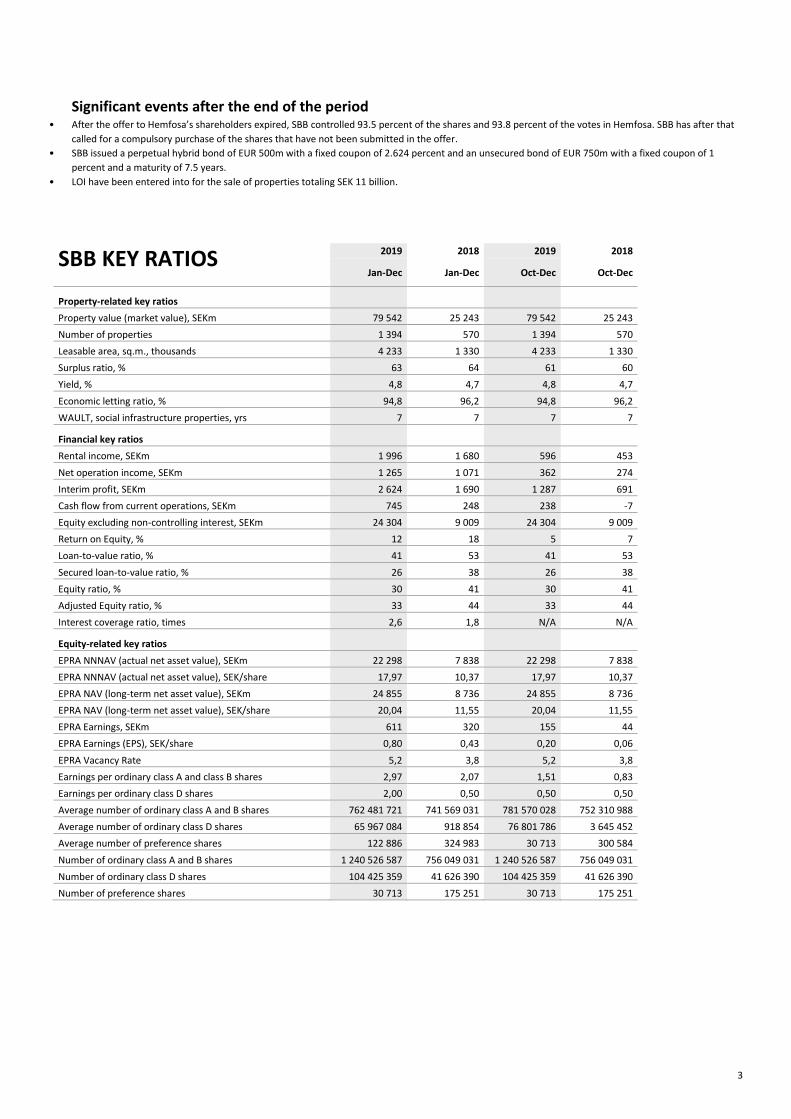
SBB KEY RATIOS 2019 2018 2019 2018
Jan-Dec Jan-Dec Oct-Dec Oct-Dec
Property-related key ratios
Property value (market value), SEKm 79 542 25 243 79 542 25 243
Number of properties 1 394 570 1 394 570
Leasable area, sq.m., thousands 4 233 1 330 4 233 1 330
Surplus ratio, % 63 64 61 60
Yield, % 4,8 4,7 4,8 4,7
Economic letting ratio, % 94,8 96,2 94,8 96,2
WAULT, social infrastructure properties, yrs 7 7 7 7
Financial key ratios
Rental income, SEKm 1 996 1 680 596 453
Net operation income, SEKm 1 265 1 071 362 274
Interim profit, SEKm 2 624 1 690 1 287 691
Cash flow from current operations, SEKm 745 248 238 -7
Equity excluding non-controlling interest, SEKm 24 304 9 009 24 304 9 009
Return on Equity, % 12 18 5 7
Loan-to-value ratio, % 41 53 41 53
Secured loan-to-value ratio, % 26 38 26 38
Equity ratio, % 30 41 30 41
Adjusted Equity ratio, % 33 44 33 44
Interest coverage ratio, times 2,6 1,8 N/A N/A
Equity-related key ratios
EPRA NNNAV (actual net asset value), SEKm 22 298 7 838 22 298 7 838
EPRA NNNAV (actual net asset value), SEK/share 17,97 10,37 17,97 10,37
EPRA NAV (long-term net asset value), SEKm 24 855 8 736 24 855 8 736
EPRA NAV (long-term net asset value), SEK/share 20,04 11,55 20,04 11,55
EPRA Earnings, SEKm 611 320 155 44
EPRA Earnings (EPS), SEK/share 0,80 0,43 0,20 0,06
EPRA Vacancy Rate 5,2 3,8 5,2 3,8
Earnings per ordinary class A and class B shares 2,97 2,07 1,51 0,83
Earnings per ordinary class D shares 2,00 0,50 0,50 0,50
Average number of ordinary class A and B shares 762 481 721 741 569 031 781 570 028 752 310 988
Average number of ordinary class D shares 65 967 084 918 854 76 801 786 3 645 452
Average number of preference shares 122 886 324 983 30 713 300 584
Number of ordinary class A and B shares 1 240 526 587 756 049 031 1 240 526 587 756 049 031
Number of ordinary class D shares 104 425 359 41 626 390 104 425 359 41 626 390
Number of preference shares 30 713 175 251 30 713 175 251

4
INFORMATION ON THE OPERATIONS IN SAMHÄLLSBYGGNADSBOLAGET I NORDEN Ilija Batljan founded SBB in March 2016 with a vision to create the best Nordic property company focused on residential and social infrastructure properties. The company’s strategy is long-term ownership, management and development of residential properties in Sweden and social infrastructure properties in the Nordics. Further, the company aims to actively carry out property development where cash flow properties can be converted into residential building rights.
Property portfolio In order to safeguard stability, a strength to act and strong cash flows, at
least 80-90 percent of the portfolio must consist of social infrastructure
properties in the Nordic region with long leases and rental apartments in
Sweden. SBB has continuously exceeded its expectations. The 24th of
September 2019 SBB presented the goal of the property portfolio
amounting to SEK 55 billion in 2021 with a BBB+ rating”. This goal has
already been exceeded with the Hemfosa transaction. SBB aims to present
updated growth goals on the Capital Markets Day in May 2020.
SBB is active in a market with stable and strong underlying driving forces.
The property portfolio of the company is characterized by high letting ratio
and long leases. Rental income is comprised of long, secure flows mainly
from national and local government and from rental apartments.
Beyond growing through acquisitions, SBB also carries out value-creating
activities, such as redevelopment and renovations of existing properties, as
well as development of building rights. As of 31 December 2019, the
property portfolio comprised 1,394 properties. The properties’ value
totalled SEK 79.5 billion, of which housing amounted to SEK 13.2 billion,
community service properties SEK 61.5 billion, and other properties SEK 4.8
billion. The total area was approximately 4,233,000 sq.m. with a 12-month
rolling rental income according to an earning capacity of SEK 5,217m.
Classification
Rental income, SEKm Total, %
Residential 774 15
Group Housing 315 6
Government 2 462 47
Indirect government 1 060 20
Other 607 12
Total 5 217 100
Organisation SBB’s management team has significant experience in development and
management of both residential and community service properties. The
organization is made up of a team of employees where the focus lies on
transactions, property development and cost effective management.
SBB works actively on improving cash flows in the existing property
portfolio through efficient property management by a locally established
management organization and an organization with extensive knowledge
and experience of property development. Since the end of March 2018,
SBB’s property management organization is in-house. SBB operates a
transaction-intensive business with the aim of creating the best long-term
return.

5
THE ACQUISITION OF HEMFOSA Transactions In November 2019, SBB made a recommended public takeover bid to the
shareholders of Hemfosa Fastigheter AB (publ) (“Hemfosa”). At 20
December 2019 when the acceptance deadline expired, SBB controlled 87.8
percent of the shares and 88.1 percent of the votes. The acceptance
deadline for the offer was extended to 29 January 2020 and after that
deadline expired, SBB controlled 93.5 percent of the shares and 93.8
percent of the votes in Hemfosa. SBB then called for compulsory
redemption of the shares that had not been turned in for the offer and, at
31 January 2020, Hemfosa was delisted from trade on Nasdaq Stockholm.
The acquisition was carried out through a mix of compensation in shares
and compensation in cash. Read more on p. 34.
About Hemfosa Hemfosa is a specialist in social infrastructure properties for public sector
offices, schools, healthcare and adapted housing, as well as the judicial
system in the Nordic region. Hemfosa is one of the largest private property
owners of social infrastructure properties in Sweden. Police officers,
teachers and doctors, among others, work in Hemfosa’s premises and
Hemfosa actively works to adapt its properties to their needs.
Hemfosa divided its social infrastructure properties into four categories –
Public Sector Offices, Healthcare and Adapted Housing, Schools and Judicial
System. Geographically, the properties are in 109 municipalities in Sweden
with an emphasis on the Stockholm, Gothenburg and Malmö region and
the Norrland coast. In Norway, since the first acquisitions in 2015, Hemfosa
has built up a portfolio located primarily in the Oslo region and Southern
Norway, but since 2017 is also in Western Norway through an acquisition in
Bergen. Finland is the third market that Hemfos established operations in
with an emphasis on the greater regions
The merged company The property value in SBB after the implementation of the acquisition of
Hemfosa amounts to nearly SEK 80 billion. The company is thereby one of
the largest listed property companies and the largest in social infrastructure
in the Nordic region. The property portfolio has a clear focus on low-risk
assets in social infrastructure with municipal and government tenants in
the largest Nordic metropolitan regions, with a particularly strong position
in Sweden. Through the acquisition, SBB will be able to realize financial and
operational synergies.
An important goal for SBB is to achieve a BBB+ rating and the company has
completed several activities after the implementation of the acquisition to
achieve this in the long term. Declarations of intent regarding the sale of
properties for a total value of around SEK 11 billion have been made, of
which a major component is office properties from Hemfosa’s portfolio –
which further strengthens SBB’s low-risk profile. Binding agreements are
expected to be reached in March 2020. In addition, SBB has repaid secured
bank loans totalling SEK 10 billion, which results in the financial costs on a
12-month rolling basis (with all else equal) decreasing by SEK 170m.
The “new” SBB is characterized by an attractive and stable property
portfolio with exposure to Nordis welfare states with long leases, high
letting ratios and a diversified base of tenants.

6
CEO ILIJA BATLJAN
”SBB is now the social infrastructure property champion in the Nordics”
CASH FLOW INCREASED BY 201 PER CENT After the acquisition of Hemfosa, Samhällsbyggnadsbolaget (SBB) is the
Nordic region’s largest and one of Europe’s largest owners of social
infrastructure. We continue to build a cash-flow machine through SBB’s
scalable platform staffed with some of the Nordic region’s most
experienced employees in the senior positions. Cash flow from operating
activities before changes in working capital increased by 201 per cent to
SEK 745m (248). Adjusted for non-recurring effects for the buyback of
expensive loans, cash flow for the year ends up at SEK 942m (375).
NET ASSET VALUE INCREASED BY 73 PER CENT In the past 12 months, the net asset value increased by SEK 16,1 billion,
corresponding to 73 per cent per ordinary A and B shares. Net asset value
EPRA NAV was SEK 20.04 per ordinary A and B share at the end of the
fourth quarter.
Profit before tax was SEK 3,137m and profit after tax was SEK 2,624m.
Adjusted for non-recurring costs for repayment of expensive loans and
deductions for profit attributable to preference shares, D shares and hybrid
bonds, earnings for the year were SEK 3.36 per ordinary A and B share.
EARNING CAPACITY FROM PROPERTY
MANAGEMENT INCREASED BY 126 PER CENT SBB’s 12-month rolling earning capacity from the management operations
amounted to SEK 2,723m (770) at the end of 2019. Considering a
theoretical cost because the company had a liquid position (available
liquidity less deposited payment for the cash component of the Hemfosa
deal) of SEK 6,930m, an adjusted earnings capacity would end up at SEK
2,845m, corresponding to an increase of 126 per cent per ordinary Class A
and B share since the end of 2018 when earnings per share was SEK 1.02
per share.
The management earnings adjusted for non-recurring costs increased,
compared with 2018, by 73 per cent to SEK 945m (468). In addition to costs
for the repayment of loans, the non-recurring costs include SEK 10m in
costs for the transition to renewable energy and SEK 10m for central
administration. The strong net operating income combined with ever lower
financial expenses are the main factors behind the strong increase in
management earnings.
We see continued strong demand for rental apartments and extensive
competition for both rental apartments and social infrastructure
properties.
SBB’s property value amounted to SEK 79.5 billion at the end of 2019. The
total area of our property portfolio is 4.2m sq.m. with a rental income of
SEK 5,217m based on a 12-month rolling earning capacity. Approximately
65 per cent of the value of our property portfolio is in the Nordic region’s
largest cities with Stockholm as the largest market (27 per cent of the
value), with an average lease length of 7 years. If we adjust for signed but
not yet closed leases, the average lease length would be nine years.
In connection with the acquisition of Hemfosa, SBB’s portfolio with building
rights under development increased by around 700,000 sq.m. GFA to a
total of 1.8m sq.m. GFA. Converted to potential for new construction, these
correspond to approximately 20,000 - 24,000 homes.
We continue to develop our joint venture collaborations. This is done both
with respect to the sale of building rights to the joint ventures, but also
focussing on having social infrastructure such as elderly homes and
properties for the disabled delivered to us. In one of our joint ventures, a
project engineering agreement has been signed with the Swedish Police
Authority for the purpose of building a new police station in Västerås on a
jointly owned property with an appraised rental value of SEK 630m during
the 15-year term in the lease intended to be signed.

7
BBB+ RATING FOCUS IN THE NEXT 12 MONTHS We are focusing on achieving a BBB+ rating in the next 12 months, which is
a prerequisite for strong growth. In the long term, the goal is to achieve an
A- rating.
We continued to strengthen equity, by SEK 20 billion during the year.
Calculated on our earning capacity on a 12-month rolling basis, the interest
coverage ratio ends up at a multiple of 4.3. At the end of the year our net
debt proforma, adjusted for upcoming property divestments, through total
capital in accordance with S&P’s definition amounted to 54 per cent.
SUSTAINABILITY – A CENTRAL PART OF OUR
BUSINESS MODEL Sustainability is a natural part of SBB’s business model and SBB strives to be
the most sustainable property company in the world. In order to achieve
this, SBB launched Vision 2030 which sets out clear goals. The overall goals
presented in Vision 2030 are:
• Govern the company’s operations in line with the UN global sustainable
goals; (5), (7), (8), (11), (13), (15)
•100 per cent climate neutral by 2030
•Minimize the risks to the company’s assets by continuously reviewing the
climate risks in the property portfolio
•Regularly improve, follow up and report on the company’s sustainability
efforts
•The company’s Code of Conduct, which is based on the UN Global
Compact, must be followed and understood by all employees and
partners
SBB provides social infrastructure by ensuring access to appropriate and
affordable premises for the most important welfare state services. As a
long-term partner to the municipalities, we invest in CSR and cooperate
with the municipalities by, for example, letting apartments to the
municipalities for social purposes. One of our important goals is to offer
summer jobs in our residential areas so that approximately 100 young
persons get the opportunity to enter the job market. We invest in our
residential areas and, together with the municipalities, we are a player in
sustainable urban planning and community development.
OUTLOOK SBB’s secure cash flows are only marginally affected by the economy and
external factors. We provide a strong earnings capacity of SEK 2.29 per
share from property management. In addition to this, we see good
conditions to continue delivering further earnings from our three value-
creating areas – renovations/investments in the existing portfolio,
development of building rights and transactions. We previously
communicated that “For 2019-2021, our assessment is that we will be able
to deliver the highest annual increase in net worth among all Swedish listed
property companies.” We now have the outcome for 2019 and it is a high
73 per cent per ordinary A and B share.
SBB is now the leading property company in the Nordic region focused on
social infrastructure. Our assessment is that we have the best conditions to
continue developing our position. SBB’s strength is clear from some of the
events after the end of the fourth quarter. First off is naturally the major
success with the offer to Hemfosa’s shareholders, where SBB by the end of
the offering period in January 2020 controlled 93.5 per cent of the shares
and 93.8 per cent of the votes in Hemfosa. In addition, SBB issued a
perpetual hybrid bond (equity) of EUR 500m with a fixed coupon of 2.624
per cent and, last, but not least, SBB's successful unsecured 7.5 year bond
of EUR 750m with a fixed coupon of 1 per cent – the largest ever for a
Nordic real estate company.
We are continuing to deliver shareholder value, good profitability and
strong cash flows. SBB’s new dividend policy entails a goal to generate a
stable increasing annual dividend. The company’s Board of Directors
proposes an initial dividend in accordance with the new dividend policy of
SEK 0.60 per ordinary A and B share for the 2019 financial year, to be paid
out with SEK 0.15 quarterly.
Ilija Batljan
CEO and Founder

8
CONSOLIDATED INCOME STATEMENT
Amount in SEKm
01-01-2019 31-12-2019
01-01-2018 31-12-2018
01-10-2019 31-12-2019
01-10-2018 31-12-2018
Rental income 1 996 1 680 596 453
Operating costs -471 -386 -145 -111 Maintenance -115 -100 -37 -35 Property administration -104 -92 -36 -27 Property tax -41 -31 -16 -6
Net operating income 1 265 1 071 362 274
Central administration -136 -102 -51 -35
Acquisition and restructuring costs -83 - -83 -
Results from associated companies/joint ventures 92 13 35 10
Profit before financial items 1 138 982 263 249
Financial items
Interest income and similar items 102 4 27 2 Interest expenses and similar items -482 -538 -157 -110 Expenses for redeemed loans in advance -197 -127 -67 -113 Translation gains/losses 91 - 76 - Leasing costs -7 - -5 -
Profit from property management 645 321 137 28
Changes in value, property 2 453 1 575 1 317 671 Changes in value, derivatives 39 8 157 1
Profit before tax 3 137 1 904 1 611 700
Tax -513 -214 -324 -9
NET PROFIT FOR THE PERIOD 2 624 1 690 1 287 691
CONSOLIDATED STATEMENT OF COMPREHENSIVE INCOME
Amount in SEKm 01-01-2019 31-12-2019
01-01-2018 31-12-2018
01-10-2019 31-12-2019
01-10-2018 31-12-2018
Net profit for the period 2 624 1 690 1 287 691 Translation gains/losses 163 -4 21 -197
COMPREHENSIVE INCOME FOR THE PERIOD 2 787 1 686 1 308 494
Earnings per ordinary share A and B before dilution 2,97 2,07 1,51 0,83
Earnings per ordinary share A and B after dilution 2,92 2,06 1,49 0,83
Earnings per ordinary share D (not subject for dilution) 2,00 0,50 0,50 0,50

9
COMMENTS ON THE INCOME STATEMENT
Net operating income Rental income during the period amounted to SEK 1,996m (1,680). Of the
rental income, SEK 707m pertained to residential properties, SEK 1,168m
community service properties and SEK 121m other properties. The
economic letting ratio at the end of the period was 94.8 percent (96.2). The
average contract length for the community service properties was seven
years (seven). Property costs amounted to SEK -731m (-609) during the
period and SEK -234m (-179) for the quarter. The costs mainly consisted of
tax-related costs, maintenance costs and management costs. The transition
made to renewable electricity in the property portfolio led to non-recurring
costs of around SEK 10m
Segment reporting For reporting and follow-up, SBB has been divided into three segments:
Residential, Social Infrastructure and Other/Property Development. The
division is based on the differences in the nature of the segments and on
the reporting the management obtains to follow up and analyse the
business, and the information obtained to make strategic decisions.
Segment reporting 01-01-2019 – 31-12-2019
SEKm Residential Community
service Other Total
Rental income 707 1 168 121 1 996
Property costs -372 -298 -61 -731
Net operating income 335 870 60 1 265
Surplus ratio 47% 74% 50% 63%
Central administration -136
Acquistion and restructuring costs -83
Profit from associated companies/JV 92
Net financials -493
Operating profit 335 870 60 645
Changes in value, property 1 188 1 143 122 2 453
Changes in value, derivatives 39
Tax -513
Profit for the period 1 523 2 013 182 2 624
Investment properties 13 230 61 547 4 765 79 542
Value per sq.m. (SEK) 15 172 20 439 13 619 18 790
Segment reporting 01-01-2018 – 31-12-2018
SEKm Residential Community
service Other Total
Rental income 565 982 133 1 680
Property costs -294 -238 -77 -609
Net operating income 271 744 56 1 071
Surplus ratio 48% 76% 42% 64%
Central administration -102
Profit from associated companies/JV 13
Net financials -661
Operating profit 271 744 56 321
Changes in value, property 834 681 60 1 575
Changes in value, derivatives 8
Tax -214
Profit for the period 1 105 1 425 116 1 690
Investment properties 6 720 16 435 2 088 25 243
Value per sq.m. (SEK) 13 381 25 338 11 650 18 979

10
Segment reporting 01-10-2019 – 31-12-2019
SEKm Residential Community
service Other Total
Rental income 193 370 33 596
Property costs -116 -101 -17 -234
Net operating income 77 269 16 362
Surplus ratio 40% 73% 48% 61%
Central administration -51
Acquistion and restructuring costs -83
Profit from associated companies/JV 35
Net financials -126
Operating profit 77 269 16 137
Changes in value, property 600 617 100 1 317
Changes in value, derivatives 157
Tax -324
Profit for the period 677 886 116 1 287
Investment properties 13 230 61 547 4 765 79 542
Value per sq.m. (SEK) 15 172 20 439 13 619 18 790
Segment reporting 01-10-2018 – 31-12-2018
SEKm Residential Community
service Other Total
Rental income 161 264 28 453
Fastighetskostnader -90 -75 -14 -179
Net operating income 71 189 14 274
Surplus ratio 44% 72% 50% 60%
Central administration -35
Profit from associated companies/JV 10
Net financials -221
Operating profit 71 189 14 28
Changes in value, property 237 441 -7 671
Changes in value, derivatives 2
Tax -9
Profit for the period 308 630 7 691
Investment properties 6 720 16 435 2 088 25 243
Value per sq.m. (SEK) 13 381 25 338 11 650 18 979

11
Profit after tax In total, the costs for central administration amounted to SEK -136m (-102)
for the year. The costs were SEK -51m (-35) for the quarter. Central
administration costs include costs for business development, transactions,
property development and financial management. As a result of activities in
the company, such as a change to Nasdaq’s main market and the
acquisition of Hemfosa, the company had some non-recurring costs during
the period. As the acquisition of Hemfosa is classified as a so-called
business combination, the transaction costs are to be recognized in profit
or loss. In total, the non-recurring costs amount to around SEK -83m. In
addition, the activities have also resulted in higher costs for central
administration, amounting to around SEK -10m. Profit from associated
companies and joint ventures was SEK 92m (13) for the period and SEK 35m
(10) for the quarter. The largest part of the profit was attributable to the
companies Klarabo Förvaltning AB and Valerum Fastighets AB, which own
and manage investment properties.
Net financial items for the year amounted to an expense of SEK -493m
(-661). Net financial items amounted to an expense of SEK -126m
(-221) for the quarter. The financial costs are interest for external financing
and other financial costs, such as arrangement fees. The financial costs
include large non-recurring charges in the form of costs for early
repayment of expensive loans of SEK -197m (-127) for the year and SEK -
67m (-113) for the quarter.
The value changes for the properties amounted to SEK 2,453m (1,575) of
which SEK -251m (58) comprised realized value changes and an SEK 2,704m
(1,517) comprised unrealized value changes. The unrealized value changes
were part of the value creation of building rights of SEK 338m (177). The
remaining part of the value changes is attributable to increased net
operating income as a result of investments and leases in the property
portfolio and reduced yield requirements. The realized value change
included a decrease of SEK -272m for the sale of DNB’s head office in Oslo.
The sale was comprised of a value corresponding to the latest appraisal
with a deduction for deferred tax, which in accounting terms leads to a
negative value change as the reversal of booked deferred tax of around SEK
184m is recognized on the tax line. The property had at the same time been
financed with a long bond loan of NOK 2,795m, which would have been
expensive to repay early given SBB’s financial development. In connection
with the sale, a solution was negotiated to lower the agreed property value
in the deal by around SEK 67m. This solution also affects the realized value
change.
The profit after tax for the year was SEK 2,624m (1,690) and was charged
SEK -513m (-214) in tax, of which SEK -34m (-2) refers to current tax and
SEK -479m (-212) refers to deferred tax related to properties and loss carry-
forwards. Around SEK 184m was recognized as a tax income as a result of
the sale of DNB's head office. The Swedish government has decided to
reduce the tax rate in two steps: first to 21.4 percent in 2019 and then to
20.6 percent in 2021. SBB has decided to calculate the deferred tax
liabilities at 20.6 percent since they are not expected to be reversed to any
significant extent in 2019 and 2020.

13
CONSOLIDATED BALANCE SHEET Amount in SEKm 31-12-2019 31-12-2018
ASSETS
Fixed assets
Intangible assets
Goodwill 6 687 24
Total intangible assets 6 687 24
Tangible assets
Investment properties 79 542 25 243
Land lease agreements 445 -
Equipment, machinery and installations 21 5
Total tangible fixed assets 80 008 25 248
Financial fixed assets
Shares in associated companies/joint ventures 909 213
Receivables from associated companies/joint ventures 1 142 583
Derivatives 73 -
Financial fixed assets at fair value 459 62
Other long-term receivables 24 11
Total financial fixed assets 2 607 869
Total fixed assets 89 302 26 141
Current assets
Current receivables
Accounts receivable 53 30
Receivables from associated companies/joint ventures - 991
Other receivables 791 290
Prepaid expenses and accrues income 158 32
Total current receivables 1 002 1 343
Short-term investments 1 041 -
Cash and cash equivalents 12 858 157
Summa omsättningstillgångar 14 901 1 500
TOTAL ASSETS 104 203 27 641
Amount in SEKm 31-12-2019 31-12-2018
EQUITY AND LIABILITIES
Equity 30 896 11 197
Long-term liabilities
Liabilities to credit institutions 22 073 5 898
Bond loans 23 720 6 598
Derivatives 25 12
Deferred tax liabilities 6 237 1 047
Liabilities leasing 445 -
Other long-term liabilities 22 25
Total long-term liabilities 52 522 13 580
Current liabilities
Liabilities to credit institutions 3 912 12
Commercial papers 4 944 1 840
Bond loans 1 442 327
Accounts payable 131 88
Current tax liablities 126 19
Other liabilities 8 822 279
Accrued expenses and prepaid income 1 408 299
Total current liabilities 20 785 2 864
TOTAL EQUITY AND LIABILITIES 104 203 27 641

14
COMMENTS ON THE BALANCE SHEET Investment properties The value of the properties amounted to SEK 79.5 billion at 31 December
2019. The value of the property portfolio has been based on external
valuations made by Newsec, JLL, Savills and Colliers Danmark. The
valuations have been based on an analysis of future cash flows for each
property, taking into account the current lease terms, market situation,
rental levels, operating, maintenance and management costs, as well as
need for investments. The return requirements used in the valuation are in
the range of 2.30 percent to 15 percent. The value of the properties
includes SEK 2,893m for building rights that have been valued by applying
the local price method, which means that the assessment of the value is
based on comparisons of prices for similar building rights. Fair value has
thus been assessed in accordance with IFRS 13 level 3. Also refer to
investment properties on p. 16.
Associated companies and joint ventures SBB's involvement in associated companies and joint ventures consists of
an ownership interest and, in some cases, financing for the companies. As
at 31 December 2019, participations in associated companies and joint
ventures amounted to SEK 909m (213) and receivables from associated
companies and joint ventures amounted to SEK 1,142m (1,574). Some of
the companies carry out property development projects, which are
described in more detail on page 19, while other companies own
investment properties. The largest part of the profit was attributable to the
companies Klarabo Förvaltning AB and Valerum Fastighets AB, which own
and manage investment properties.
Goodwill Most of the goodwill item of SEK 6,687m is attributable to the acquisition
of Hemfosa and is mostly comprised of synergies in the form of lower
financing and administration costs. In addition to this, there is a recognized
goodwill attributable to the difference between nominal tax and the
calculated estimated tax that is applied in so-called business combinations,
such as the acquisition of Hemfosa. For this accounted goodwill of SEK
2,368m there is a corresponding amount in the item deferred tax. The
smaller part of the goodwill arose through the acquisition of the company
SBB Förvaltning Sverige AB (formerly Hestia Sambygg AB) with 70
employees that was implemented in 2018. The goodwill item that arose
during the acquisition is linked to the employees.
Equity Equity amounted to SEK 30,896m (11,197) at 31 December 2019. Equity
includes issued hybrid bonds at a book value of SEK 4,629m and preference
shares in the Norwegian subsidiary Nye Barcode 121 Bidco AS and
Karlbergsvägen 77 Fastighets AB (publ) of SEK 29m. As SBB does not own all
shares in Hemfosa, there is a minority interest of SEK 1,934m.
During the period, SBB carried out a rights issue of Class B ordinary shares,
which provided SBB with SEK 1.5 billion before issue expenses. In addition
to this, a targeted issue of Class B ordinary shares was made to a volume of
SEK 400m to Gösta Welandson. The non-cash issue carried out in
connection with the acquisition of Hemfosa contributed around SEK 11
billion in equity.
The equity/assets ratio was 30 percent (41), the adjusted equity/assets
ratio was 33 percent (44) and the loan-to-value ratio was 41 percent (53).
Deferred tax Deferred tax is calculated with a nominal tax of 20.6 percent in Sweden on
differences between reported and taxable value of assets and liabilities.
The tax rates for Norway and Denmark is 22 percent and for Finland 20
percent. At 31 December 2019, the deferred tax liability amounted to SEK
6,237m (1,047) and is mainly attributable to investment properties and loss
carry-forwards. Loss carry-forwards amount to SEK 3,9 billion at 31
December 2019. The new interest deduction limitation rules that was
applied from 1 January 2019 resulted in non-deductible interest costs of
SEK 200m in the tax calculation. As SBB estimates that the carry forwards of
interest costs can be deducted in the future a reserve for deferred tax has
been accounted.
Debt and cash and cash equivalents Interest-bearing liabilities in the Group amounted to SEK 56,091m (14,675)
at the end of the period, of which SEK 25,985m (5,910) pertained to
liabilities to credit institutions, SEK 25,162m (6,925) pertained to bond
loans and SEK 4,944m (1,840) pertained to commercial paper. Also refer to
the section Financing on p. 14. Cash and cash equivalents amounted to SEK
12,858m (157). A large amount of the cash and cash equivalents consists of
a reserve for the cash compensation in the Hemfosa acquisition.

14
CONSOLIDATED STATEMENT OF CHANGES IN
EQUITY
Amount in SEKm
Share capital
Other contributed
capital Retained earnings Hybrid bonds
Non-controlling
interest Total equity
Total equity 01-01-2018 74 3 041 3 274 668 579 7 636
Share issue 6 1 374 1 380
Issue hybrid bonds 1 505 1 505
Issue warrants 9 9
Dividends -100 -87 -38 -225
Redeemed preference shares -79 -19 -98
Repurchased hybrid bonds -17 -300 -317
Repurchased warrants -93 -93
Acquired minority interests 13 13
Redeemed minority interests -10 -288 -298
Net profit for the period 1 565 87 38 1 690
Other comprehensive income -15 10 -5
Total equity 31-12-2018 80 4 345 4 585 1 873 314 11 197
Total equity 01-01-2019 80 4 345 4 585 1 873 314 11 197
Share issue 54 13 352 13 406
Issue hybrid bonds 4 600 4 600
Issue warrants 3 3
Dividends -357 -198 -1 -556
Redeemed preference shares -93 -54 -295 -442
Repurchased hybrid bonds -283 -1 873 -2 156
Acquired minority interests 1 930 1 930
Tax effects equity 51 76 127
Net profit for the period 2 421 198 5 2 624
Other comprehensive income 200 -47 10 163
Total equity 31-12-2019 134 17 658 6 512 4 629 1 963 30 896
15
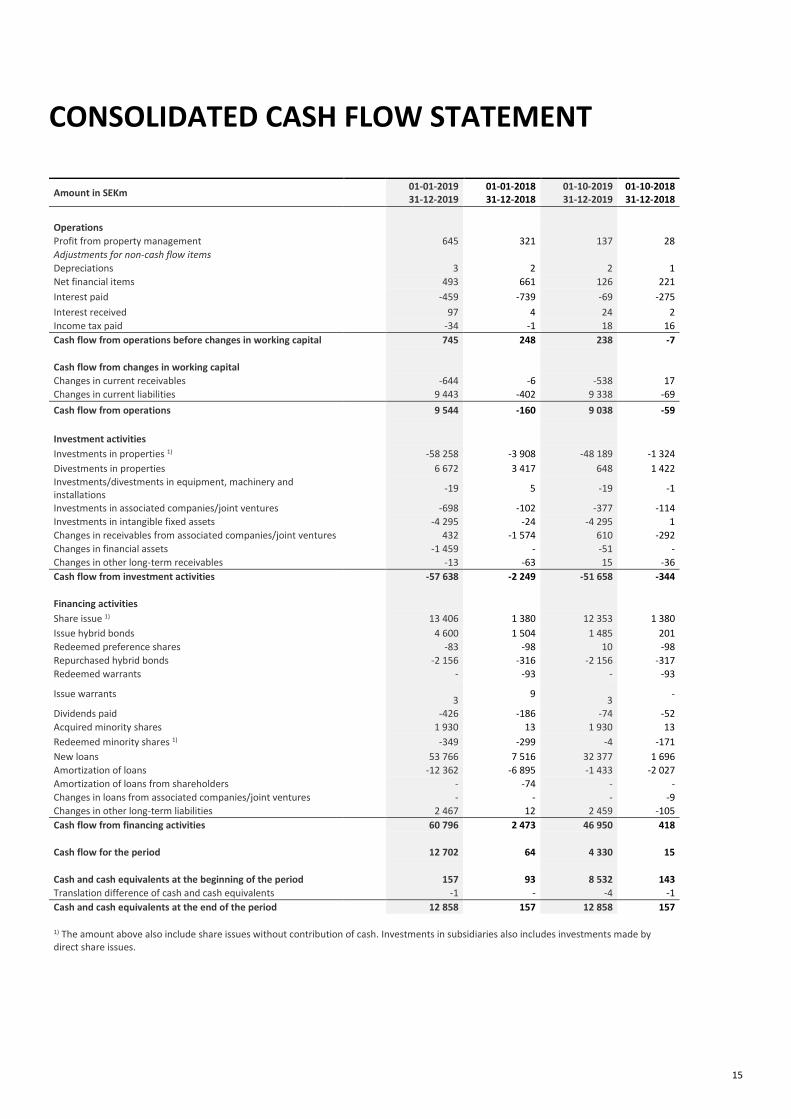
CONSOLIDATED CASH FLOW STATEMENT
Amount in SEKm 01-01-2019 31-12-2019
01-01-2018 31-12-2018
01-10-2019 31-12-2019
01-10-2018 31-12-2018
Operations
Profit from property management 645 321 137 28
Adjustments for non-cash flow items
Depreciations 3 2 2 1
Net financial items 493 661 126 221
Interest paid -459 -739 -69 -275
Interest received 97 4 24 2
Income tax paid -34 -1 18 16
Cash flow from operations before changes in working capital 745 248 238 -7
Cash flow from changes in working capital
Changes in current receivables -644 -6 -538 17
Changes in current liabilities 9 443 -402 9 338 -69
Cash flow from operations 9 544 -160 9 038 -59
Investment activities
Investments in properties 1) -58 258 -3 908 -48 189 -1 324
Divestments in properties 6 672 3 417 648 1 422
Investments/divestments in equipment, machinery and installations
-19 5 -19 -1
Investments in associated companies/joint ventures -698 -102 -377 -114
Investments in intangible fixed assets -4 295 -24 -4 295 1
Changes in receivables from associated companies/joint ventures 432 -1 574 610 -292
Changes in financial assets -1 459 - -51 -
Changes in other long-term receivables -13 -63 15 -36
Cash flow from investment activities -57 638 -2 249 -51 658 -344
Financing activities
Share issue 1) 13 406 1 380 12 353 1 380
Issue hybrid bonds 4 600 1 504 1 485 201
Redeemed preference shares -83 -98 10 -98
Repurchased hybrid bonds -2 156 -316 -2 156 -317
Redeemed warrants - -93 - -93
Issue warrants
3 9
3
-
Dividends paid -426 -186 -74 -52
Acquired minority shares 1 930 13 1 930 13
Redeemed minority shares 1) -349 -299 -4 -171
New loans 53 766 7 516 32 377 1 696
Amortization of loans -12 362 -6 895 -1 433 -2 027
Amortization of loans from shareholders - -74 - -
Changes in loans from associated companies/joint ventures - - - -9
Changes in other long-term liabilities 2 467 12 2 459 -105
Cash flow from financing activities 60 796 2 473 46 950 418
Cash flow for the period 12 702 64 4 330 15
Cash and cash equivalents at the beginning of the period 157 93 8 532 143
Translation difference of cash and cash equivalents -1 - -4 -1
Cash and cash equivalents at the end of the period 12 858 157 12 858 157
1) The amount above also include share issues without contribution of cash. Investments in subsidiaries also includes investments made by direct share issues.

16
PROPERTY PORTFOLIO
PROPERTY VALUE BY GEOGRAPHY: 65 percent of the property portfolio is in the metropolitan regions
Property value, by country
Property value, by property type
76%
15%
1%8%
Sweden Norway Denmark Finland
79 542SEKm
79%
17%
6%
Social infrastructure Residentials Other
79 542SEKm
94% Social infrastructure
65% Located in
metropolitan regions
Gothenburg
Stockholm
Malmö
Oslo
Kristiansand
Copenhagen
Bergen
Trondheim
Tampere
Helsinki
Aarhus
Turku
Major city regions

17
The business concept of Samhällsbyggnadsbolaget (SBB) is to benefit its
shareholders and society in general by:
• Being a natural and reliable cooperative partner to the public sector,
by owning, managing, renovating and building community service
properties in the Nordic region and regulated rental apartments in
Sweden (jointly called social infrastructure) in the long term.
• Conducting active work as a society builder and long-term
collaborative partner of municipalities, county councils and national
authorities in order to create building rights for social infrastructure.
SBB’s strategy is the long-term ownership, management and development
of social infrastructure. At the end of the period, community service
properties in Sweden accounted for 52 percent of the company’s property
value; 16 percent of the company’s property value was comprised of
community service properties in Norway, 8 percent of community service
properties in Finland and 1 percent of community service properties in
Denmark. 17 percent of the property value was comprised of Swedish
regulated rental apartments. The remaining 6 percent are properties
outside the company’s core holdings that were acquired in connection with
large portfolio acquisitions and are intended to be divested soon or
properties where the company conducts active property development work
where cash flow properties are converted to building rights for social
infrastructure – an important part of building social infrastructure. This
makes SBB a very important society builder in times of an extensive
demand for properties in social infrastructure.
SBB’s community service properties include properties that are used by
tenants that are tax financed by the Nordic welfare states. The tenants
conduct operations in education, elderly care, support for the disabled and
other activities for healthcare and municipal and national administration.
For example, SBB owns several municipal buildings, ministry buildings, a
large number of elderly housing units, preschools and schools and is the
Nordic region’s largest actor in properties for support of the disabled with
around 250 such properties.
SBB manages and refines homes in Swedish growth municipalities. Our
properties are located in close vicinity to the town centre and with access
to very good public transport. Community service properties, which
together with Swedish regulated rental apartments are defined as social
infrastructure, constitute SBB’s core holdings and over time shall comprise
around 90 percent of the company’s total property value. The combination
of regulated rental apartments and community service properties is unique
among listed companies in the Nordic region. They are assets with minimal
risk since the supply of rental apartments in Sweden is far below demand
due to a regulated market and a growing population, at the same time that
the need for community service properties is very extensive for
demographic reasons in combination with tenants that are financed by the
Nordic welfare states. SBB has among the longest average lease durations
in the market for community service properties, around seven years,
combined with a very low degree of relocation, which means that the
actual duration is clearly longer than seven years.
Lease duration, community service properties
7 years Average lease duration
Largest tenants
Tenants Rental
income % of total1)
Swedish state 827 20,2
Norwegian state 246 6,0
Municipality of Härnösand 129 3,2
Norwegian National Association for Hearth and Lung Diseases
112 2,7
Academedia 87 2,1
Västra Götaland County Council 66 1,6
Municipality of Boden 63 1,5
Municipality of Haninge 61 1,5
Attendo 56 1,4
Internationella Engelska Skolan 54 1,3
Total 10 largest 1 700 41,6
Other 2 392 58,4
Total rental income 4 092 100,0
1) Based on the Social infrastructure property portfolio
7%
13% 13%14%
10%
5%
3%
5%
3%4%
23%
20
20
20
21
20
22
20
23
20
24
20
25
20
26
20
27
20
28
20
29
+20
30

18
Supply and demand for social infrastructure The need for community service properties is very large. The graph below
illustrates the number of planned units of elderly housing and high-schools
until 2022 in relation to the actual need. A large supply shortage also
characterizes the market for Swedish regulated rental apartments where
the average queue time for an apartment in the Stockholm region is around
ten years.
In addition to a large shortage of properties in social infrastructure, there is
also a major rental potential in the existing portfolio. The leading property
advisor Newsec analyzed rent levels for newly produced community service
properties in Sweden in autumn 2019. The graph below shows rents in the
new production analysis in relation to average rents for SBB’s portfolio.
Need and planned community service properties Rent per sq.m. for new built compared with SBB’s existing portfolio of community service properties
Source: SKL Source: Newsec
Sensitivity analysis The property valuations are made according to accepted principles based
on certain assumptions. The table below presents how the value has been
impacted in a change of certain parameters assumed for the appraisal.
The table provides a simplified illustration as one single parameter
probably does not change in isolation.
Change Value impact
Rental value +/- 5 % SEK 3 712 /-3 714 m
Estimated interest rate +/- 0,25 % SEK-2 020 / 2 173 m
Direct return requirements +/- 0,25 % SEK-2 370 / 2 525 m
Property portfolio change Opening fair value 2019-01-01 25 243
Acquisitions 57 608
Investments 650
Sales -6 917
Translation difference 254
Unrealized changes in value 2 704
Fair value at period end 79 542
124
28
300
119
Elderly care High schools
Planned units (2019-2022)
Amount of new units needed by 2022
1 514 1 573
1 3231 147
980
2 5602 460
2 840
2 320
1 742
Health careservices
Education Group housing Elderly care Rent regulatedresidentials
SBB New built

19
ACTIVE MANAGEMENT In addition to working with traditional property management, SBB works
with further value-creating activities: property development,
investments/renovations and property transactions.
Property development SBB works actively with property development, which entails development
of building rights and participation in property development projects in
joint ventures with a limited implementation risk for SBB. The company’s
strategy is that around 10 percent of the property portfolio’s value is to be
comprised of the Other property segment, which means cash flow
properties with identified property development potential for social
infrastructure or non-strategic properties acquired in larger portfolios and
intended to be divested soon. Property development should generate
earnings of SEK 250-400m per year on average over a business cycle. The
acquisitions in property development are most often made off market after
SBB has held a dialogue with the respective municipality to ensure that the
property with the local area is prioritized for upcoming urban development.
SBB believes that sustainable urban development is based in the locations near public transport and that previously developed land is improved rather than claiming important green spaces for urban development. SBB is driven by residents of modern central housing being able to live without their own car and that transportation, local services, healthcare, schools and care are to be in the local area. Most of SBB’s development properties are within the appointed priority transportation hubs, such as commuter rail stations and important railway stations for regional service.
SBB’s property development organisation SBB has the Nordic region’s leading property development team and is led by Vice President Krister Karlsson. The organization develops 1,600,000 square metres of GFA in various phases of detailed development planning. SBB has extensive experience of initiating and implementing sales early in the planning process and has sold building rights to both cooperative companies, listed companies and public service housing companies. The organization is also responsible for project development that takes place within SBB’s property management portfolio.
Building Rights At 31 December 2019, SBB had development projects in various phases of
detailed development planning regarding a total of around 1,800,000 sq.m.
GFA. SBB divides the development process into four phases: Project
concepts (phase 1), Prior to a decision on planning notification (phase 2),
With a planning notification (phase 3) and Legally enforcible detailed
development plans (phase 4). SBB’s various projects are presented below in
table form. It should be noted that several projects in phases 1-3 already to
some extent have legally enforcible detailed development plans, but where
SBB identified potential in addition to what current detailed development
plans allow. been vacated as of 31 December 2019 as all vacating terms
(e.g. a legally enforcible detailed development plan) have not been met.
SBB assess that the value of the building right portfolio in legally enforcible
detailed development plans will exceed the externally assessed value of the
building right portfolio at 31 December 2019 by around SEK 1,5 billion,
which is illustrated by the graph on the next page.
Property development in joint ventures To contribute to urban development and to secure production resources,
SBB has in several cases entered a joint venture with the buyer of the
building rights for the development of the building rights and in some cases
joint ventures to jointly develop building rights. SBB assesses the profit
potential in these cooperative arrangements at around SEK 1.5 billion less
SBB’s own investment in the building rights. This profit potential is in
addition to described surplus values with regard to building right
development. In the joint ventures, SBB takes a very limited
implementation risk in that the other joint venture party takes
responsibility for project planning, sales, production and project
management. The profit potential of around SEK 1.5 billion relates to one
development cycle and has not been taken into account in any part of the
account closing.
Planning phase
GFA building
rights (sq.m.)
Value according to external
appraisal (SEK m)
per sq.m.
Phase 1 – Project concepts 603 052 772 1 279
Phase 2 – Prior to a decision on planning notification
70 000 119 1 705
Phase 3 – With planning notification
690 029 884 1 280
Phase 4 – Legally enforcible detailed development plans
392 462 1 118 2 849
Total 1 755 543 2 893 1 648
Sales status
GFA building
rights (sq.m.) Value, (SEK m)
per sq.m.
Sold, but not vacated building rights
444 350 1 546 3 479
Unsold building rights 1 311 193 4 411 3 364
Total 1 755 543 5 957 3 393

20
Illustrative model of SBB’s strategy for property development
Illustrative model of SBB’s current property development portfolio
Important events during the fourth quarter of 2019: • In connection with the acquisition of Hemfosa, SBB’s portfolio with
building rights under development increased by around 700,000 sq.m.
GFA.
• In a joint venture, SBB and KSA signed a project engineering
agreement with the Swedish Police Authority for the purpose of
building a new police station in Västerås on a jointly owned property
with an appraised rental value of SEK 630m during the 15-year term in
the lease intended to be signed.
• Acquisitions of large investment property portfolio in social
infrastructure in university cities in the Nordic region with an assessed
development potential of around 100,000 sq.m. GFA
• Sale of 50,000 sq.m. GFA building rights with possession after a legally
enforcible detailed development plan in Nyköping Raspen 1 to a newly
formed joint venture between Amasten and SBB.
• Sale of the development property Västerås Allmogekulturen 5
• Detailed development plan development:
– Decision on acceptance for Växjö Hov Dalbogård 3 & 4, Borlänge
Kvarnsveden 3:196-197. Totalling 28,000 sq.m. GTA
– Decision on review for Nyköping Raspen 1-3. Totalling 165,000
sq.m. GTA
– Decision on consultation for Sundsvall Härsta 9:3 and Sundsvall
Västland 26:39. Totalling 24,000 sq.m. GTA
– Decision on planning notification for Stockholm Sätra Gård 1.
Totalling 8,000 sq.m. GTA
Investments/renovations Investments and renovations are an important part of SBB's value-creating
management. With an assessed target of 600 renovated apartments per
year and an assessed renovation cost of around SEK 5,000/sq.m., around
SEK 300m of further value is created every year based on operating net
improvements due to already negotiated renovation rents. In addition to
this, value is generated through renovations of and investments in
community service properties and the earnings effect is estimated at SEK
400m annually in total.
In 2019, SBB renovated 562 apartments and at year-end, 194 apartments
had terminated leases to be able to be renovated in the first quarter of
2020. During the year, the renovation team was expanded, meaning that
SBB now has the staffing to meet a higher renovation rate in a growing
portfolio. Two energy projects in Tidaholm and Skara and one energy
project in Motala were commissioned at the end of the year. The results in
these properties show that energy consumption decreased according to the
estimates made before project start, meaning a reduction of purchased
energy by 30 percent in the properties Stensiken 1 in Tidaholm and
Yggdrasil 1 & 2 in Skara and a reduction of purchased energy by around 50
percent in the property Tellus 1 in Motala.

21
In addition to renovations in apartments, renovations of and investments in
community service properties are under way, including the construction of
a new building for the social services in central Västerås, the construction
of a school and elderly home for the Municipality of Haninge and the
conversion and extension of the municipal building in Nykvarn. As the
Nordic region’s large actor in properties for the disabled, SBB has multiple
housing units for the support of the disabled under construction.
Transaction
SBB actively works on transactions and value creation through active
portfolio management. The transaction team led by Business Development
Director Oscar Lekander has carried out transactions for nearly SEK 150
billion throughout the Nordic region since 2010, of which around half has
been with public sector clients. Since 2017, SBB has acquired and sold
properties for a total gross value of around SEK 85 billion. In addition to
this, it can be noted that Vice President Lars Thagesson’s compiled a
transaction volume over nearly 50 years in the industry of more than SEK
2,500 billion.
The property Skellefteå Perseus 6 – newly signed 50-year lease agreement with Skellefteå municipality. Closing will take place at the completion of the building,
which is expected to be in 2021.
White arkitekter

22
FINANCING
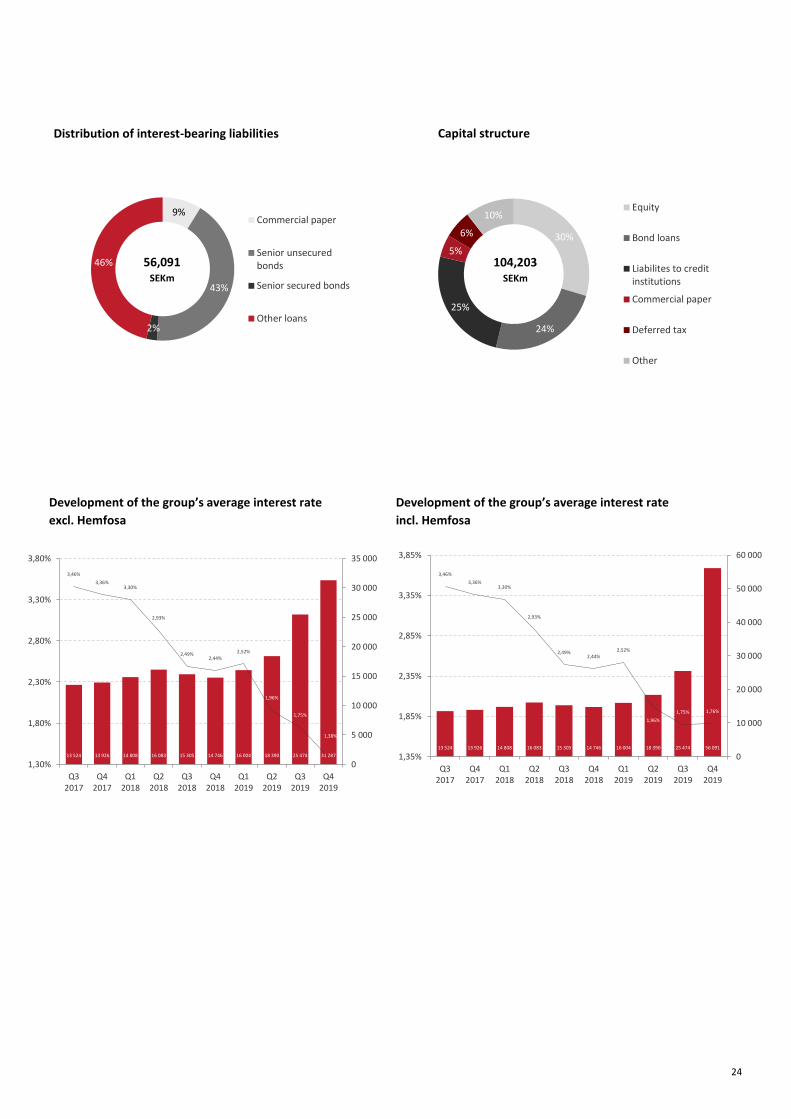
Interest-bearing liabilities Interest-bearing liabilities in the Group amounted to SEK 56,091m (14,675)
at the end of the period, of which SEK 25,985m (5,910) pertained to
liabilities to credit institutions, SEK 25,162m (6,925) pertained to bond
loans and SEK 4,943m (1,840) pertained to commercial paper. The loan-to-
value ratio was 41 percent (53). The secured loan-to-value ratio was 26
percent (38). The fair value of the liabilities and other financial instruments
as of 31 December 2019 is deemed to correspond to the carrying amount.
The average interest rate for the interest-bearing liabilities amounted to
1.76 percent (2.44). Excluding Hemfosa, SBB had an average interest rate of
1.38 percent. The average period of fixed interest for all interest-bearing
liabilities was 2.8 years (2.6) and the average period capital was tied-up was
3.4 years (4.6). Excluding Hemfosa, SBB had an average period of fixed
interest of 3.9 years and an average period capital was tied-up of 4.1 years.
The structure of tied-up capital for the interest-bearing liabilities is
presented by the tables at the right. Excluding commercial paper, SEK
5,388m falls due within one year. To manage the refinancing risks,
commercial paper has been secured through back-up facilities, which at all
times covers all outstanding commercial paper.
SBB has assets in Sweden, Norway, Finland and Denmark, which means that
the company is exposed to currency risks. SBB hedges mainly currency risks
by having assets and interest-bearing liabilities in the same currency.
At the end of the period, the proportion of capital market financing
amounted to 53 percent of the total interest-bearing liabilities. SBB has also
issued hybrid bonds of SEK 1,500m and EUR 300m, which in the balance
sheet are classified as equity.
SBB continues to work to lower the average interest rate for the interest-
bearing liabilities. At 31 December 2019, the proportion of interest-bearing
liabilities with fixed interest was 79 percent and with variable interest was
21 percent. At 31 December 2019, the proportion of interest-bearing
liabilities for SBB excluding Hemfosa with fixed interest amounted to 96
percent and with variable interest to 4 percent.
SBB has continued to repay expensive loans from credit institutions and
repurchased bonds during the year. In order to limit the interest rate risk
for loans with variable interest and increase predictability in the company’s
profit from property management, interest-rate swaps are used with a total
nominal value of SEK 17,898m with a duration of between one and ten
years. Through interest-rate swaps, caps and loans with fixed interest, SBB
has hedged 80 percent of the variable liabilities, which comprises loans
with variable interest and commercial paper, as well as liabilities that
expires within one year. SBB has entered EUR/SEK FX derivatives of EUR
300m to hedge currency risk. The interest-rate derivatives and FX
derivatives had a fair value of SEK 46m at the end of the period.
Rating SBB has a BBB- rating from Fitch (stable outlook) and Standard & Poor’s
(positive outlook).
Structure of tied-up capital (excluding commercial paper)
Maturity year Nominal amounts,
SEKm Percentage
< 1 år 5 388 10%
< 2 år 8 444 16%
< 3 år 8 063 17%
< 4 år 10 852 21%
< 5 år 6 264 12%
> 5 år 12 360 24%
Total 51 374 100%
Structure of tied-up capital (including commercial paper)
Maturity year Nominal amounts,
SEKm Percentage
< 1 år 10 332 18%
< 2 år 8 445 15%
< 3 år 8 063 15%
< 4 år 10 852 19%
< 5 år 6 265 11%
> 5 år 12 361 22%
Total 56 318 100%
FINANCING HIGHLIGHTS
41% Loan-to-value ratio
26% Secured loan-to-value
ratio
1.76% Average interest
BBB- Positive outlook (S&P)
BBB- Stable outlook

23
Significant events during the fourth quarter of 2019 SBB issued an unsecured bond of SEK 500m of two years with a variable
interest of Stibor 3 months plus 0.66 percent. This was SBB’s lowest
interest expense to-date for a loan of two years.
On 18 November 2019, Standard & Poor’s revised SBB’s rating to positive,
after the announcement of SBB’s bid for Hemfosa.
In the fourth quarter, SBB repaid all outstanding SEK hybrid bonds (ISIN
SE0010414599 and ISIN SE0011642776).
Working capital and liquidity SBB’s available liquidity amounted to SEK 12,858m and financial
investments amounted to around SEK 1,396m. In addition to this, SBB has
SEK 7,103m in the form of unutilized credit facilities. No further securities
need to be pledged for the use of the credit facilities.
Listed bonds as at 30.12.2019
Issuer Maturity SEKm Repurchased by SBB (SEKm) Interest Maturity date ISIN code Green/Secured
SBB 2017-2020 1500 1434 Stibor 3M + 6,00% 2020-04-06 SE0009805468
SBB 2018-2022 1000 904 Stibor 3M + 3,60% 2022-10-03 SE0011725514
SBB 2018-2021 474 466 Stibor 3M + 3,65% 2021-05-12 SE0010985713
SBB 2018-2021 750 710 Stibor 3M + 3,90% 2021-01-29 SE0010414581
SBB 2019-2024 500 Stibor 3M + 3,30% 2024-02-14 SE0012256741 Green
SBB 2019-2024 200 Stibor 3M + 3,25% 2024-02-19 SE0012313245
SBB 2019-2025 600 Stibor 3M + 1,90% 2025-01-14 XS1997252975
SBB 2019-2023 200 Stibor 3M + 1,40% 2023-05-22 XS2000538699
SBB 2016-2021 683 Stibor 3M + 1,85% 2021-12-23 NO963342624 Secured
SBB 2019-2022 500 Stibor 3M + 1,20% 2022-07-22 XS2021634675 Green
SBB 2019-2021 1960 Stibor 3M + 0,93% 2021-07-05 XS2022418243
SBB 2019-2023 500 Stibor 3M + 1,150% 2023-09-06 XS2050862262 Green
SBB 2019-2022 600 Stibor 3M + 0,95% 2022-10-03 XS2059787049
SBB 2019-2023 1000 Stibor 3M + 1,01% 2023-02-01 XS2066041661
SBB 2019-2022 300 0,85% 2022-03-11 XS2078676322
SBB 2019-2021 500 Stibor 3M + 0,7% 2021-11-08 XS2078691123
SBB 2019-2023 600 1,072% 2023-05-11 XS2078737306
SBB 2019-2021 800 Stibor 3M + 0,66% 2021-11-08 XS2078371486
SBB 2019-2020 400 0,80% 2020-04-14 XS2093118953
SBB 2019-2024 1000 1,66% 2024-11-28 XS2085870728
Hemfosa 2017-2020 1000 Stibor 3M + 2,75% 2020-09-01 SE0009664337
Hemfosa 2019-2022 1300 Stibor 3M + 2,40% 2022-05-16 SE0012596203 Green
Hemfosa 2019-2022 800 Stibor 3M + 2,10% 2022-10-03 SE0013109444 Green
Issuer Maturity EURm Repurchased by SBB (SEKm) Interest Maturity date ISIN code Green/Secured
SBB 2019-HYB 300 0 4,625% Hybrid XS1974894138
SBB 2019-2025 550 3 1,75% 2025-01-14 XS1993969515
SBB 2019-2026 500 0 1,125% 2026-09-04 XS2049823680
Maturity NOKm
Maturity NOKm
Maturity NOKm
Maturity NOKm Maturity NOKm Maturity NOKm Maturity NOKm Maturity NOKm
SBB 2016-2023 620 0 3,00% 2023-11-01 NO0010777683 Secured
24
Distribution of interest-bearing liabilities Capital structure
Development of the group’s average interest rate Development of the group’s average interest rate
excl. Hemfosa incl. Hemfosa
9%
43%
2%
46%
Commercial paper
Senior unsecuredbonds
Senior secured bonds
Other loans
13 524 13 926 14 808 16 083 15 305 14 746 16 004 18 390 25 474 56 091
3,46%
3,36%3,30%
2,93%
2,49%2,44%
2,52%
1,96%
1,75% 1,76%
0
10 000
20 000
30 000
40 000
50 000
60 000
1,35%
1,85%
2,35%
2,85%
3,35%
3,85%
Q32017
Q42017
Q12018
Q22018
Q32018
Q42018
Q12019
Q22019
Q32019
Q42019
13 524 13 926 14 808 16 083 15 305 14 746 16 004 18 390 25 474 31 287
3,46%
3,36%3,30%
2,93%
2,49%2,44%
2,52%
1,96%
1,75%
1,38%
0
5 000
10 000
15 000
20 000
25 000
30 000
35 000
1,30%
1,80%
2,30%
2,80%
3,30%
3,80%
Q32017
Q42017
Q12018
Q22018
Q32018
Q42018
Q12019
Q22019
Q32019
Q42019
30%
24%
25%
5%
6%
10%Equity
Bond loans
Liabilites to creditinstitutions
Commercial paper
Deferred tax
Other
56,091 SEKm
104,203 SEKm

SBB | DELÅRSRAPPORT JANUARY-DECEMBER 2019 25
Today’s society builder for tomorrow’s needs
A high rate of population growth and a increasing number of elderly in the Nordics are leading to extensive needs for modern community
service properties. Schools and elderly homes must begin to be prioritized in new
construction, at the same time that many of the existing community service properties built in the 1970s and 1980s need to be
modernized. Here, SBB is an important partner to municipalities in the Nordics.
SBB owns residentials in Sweden and community service properties
throughout the Nordic region and has the basic concept of long-term development, ownership and management. As a partner to Sweden’s
municipalities, we want to contribute to creating suitable premises for the most important welfare activities.

26
OVERALL OBJECTIVES
• Govern the company’s operations in line with the UN global sustainable development goals: (5), (7), (8), (11), (13), (15)
• 100 percent climate neutral by 2030
• Minimizing the risks to the company’s assets by continuously reviewing the climate risks in the property portfolio
• Regularly improving, following up and reporting the company’s sustainability work
• The company’s Code of Conduct, which is based on the UN Global Compact, must be followed and understood by all employees and cooperative
partners.
Ecological sustainability The climate issue is one of humanity’s greatest challenges and we have a responsibility to future generations to contribute solutions and reduce our own climate impact. We want to act strongly in the climate transformation and SBB has therefore adopted the goal of climate neutrality by 2030 in the entire value chain, as an important part of our promise to build a better society. And we want to do it together with our tenants, customers, suppliers and other stakeholders. Goals:
• 100 percent renewable electricity in the entire property portfolio and minimizing carbon dioxide emissions by reducing the emissions by at least 5 percent per year
• Continuing to contribute to innovations in environmental technology
• Responsibly and effectively using natural resources and building and managing with a life-cycle mind-set (among other things by promoting construction with wood)
• Promoting renovation instead of demolition of buildings in the management portfolio. All properties held for more than three years must be environmentally inventoried and these inventories are to be done at least every ten years
• At least 50 percent of SBB’s new production is to be comprised of buildings built of wood
• Continuing to contribute to reduced water consumption in our properties with the goal of 1 percent water savings per year
• Managing and creating housing in locations close to public transport, which contributes to reducing the transport sector’s environmental impact
• Contributing to greater biodiversity and limiting the use and spread of environmentally hazardous products
• Responsible management of waste by acting for the minimization of waste, preventing pollution and viewing waste as a resource for re-use and recycling.
Social sustainability Social sustainability is an important part of our promise to build a better society. The growing gaps in health and living conditions between different groups of society and residential areas are one of our major challenges in Sweden today. The property industry has a major impact and extensive potential to contribute solutions for greater cohesion, belief in the future, health and trust. We consider it to be crucial that our business and industry understand and can address social challenges today. Goals:
• Continuing to be a member of Public Housing Sweden and participating in the residential social work of the municipalities
• Continuing to contribute to young people’s occupation by offering at least 100 summer jobs every year to young people who live in our residential areas
• Offering adapted apartments for people with disabilities in inclusive environments and owning and managing apartments that can also be rented by people with fewer financial resources
• Annually contributing at least 10 Better Shelter refugee homes and 100 tents through the UNHCR to help improve the housing situation for refugees
• Continuing to support organizations, such as Mentor and Läxhjälpen (homework help), that contribute to giving young people a better start in life
• Being an attractive and inclusive employer for the best and most professional employees, regardless of gender or background
• Actively working to create environments where tenants and employees feel safe
Economic sustainability Our goal is to have good financial growth without it entailing consequences to the climate and the social environment. By being profitable, we create conditions for driving and developing sustainable management and construction. Through low financial and operational risk, SBB shall provide a strong, risk-adjusted growth in value with increasing cash flows and a growing dividend to its shareholders. Goal:
• SBB has the goal of achieving an investment grade rating of BBB+ in the short term and A- in the long term
SUSTAINABILITY VISION 2030
SBB owns community service properties in the Nordic region and rental apartments in growing cities in Sweden with the basic concept of long-term ownership and management. Through the company’s extensive social involvement, municipalities and other stakeholders will find a long-term partner in the company. At the UN summit in September 2015, the world’s national leaders adopted 17 global sustainable development goals. The countries of the world have committed to lead the world to a sustainable and fair future from 1 January 2016 until 2030. The 2030 Agenda for Sustainable Development covers the three dimensions of sustainability: social, economic and environmental – Eradicating extreme poverty, reducing inequality and injustice, solving the climate crisis. Sustainability is a natural part of our business model and we strive to be the most sustainable property company in the world.
27
0,00
20,00
40,00
60,00
80,00
100,00
120,00
140,00
160,00
180,00
200,00
25,00
27,00
29,00
31,00
33,00
35,00
37,00 SBB D
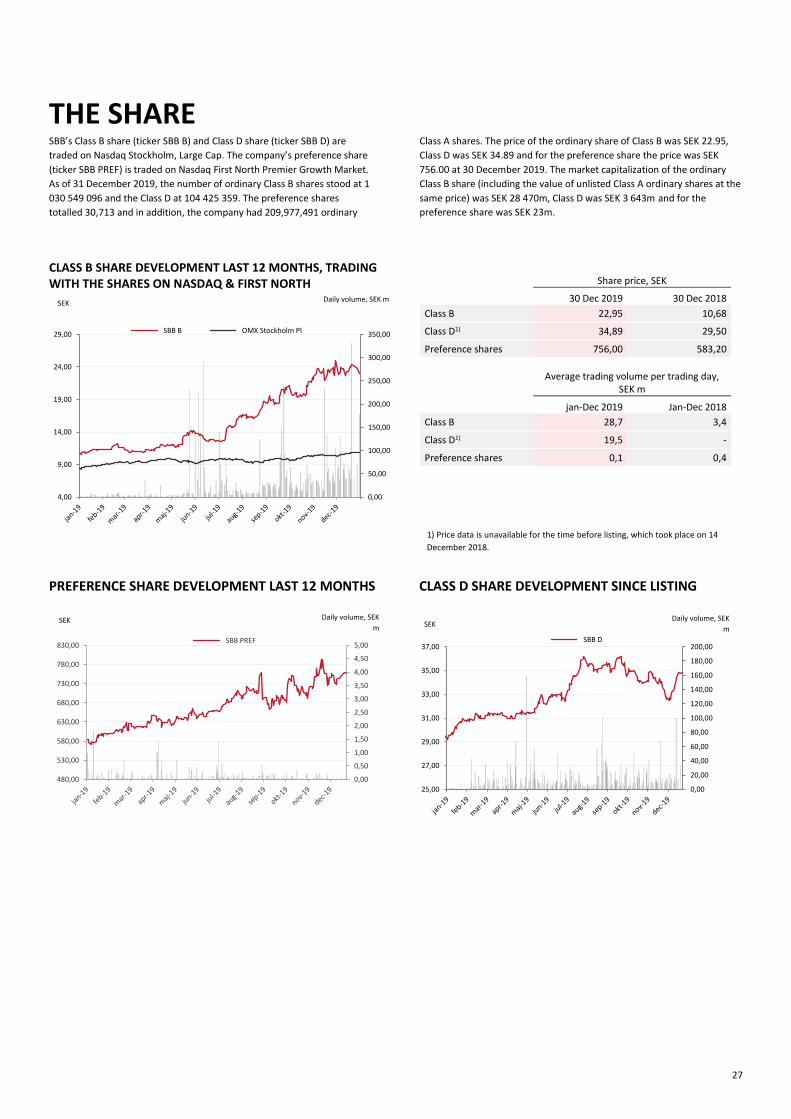
THE SHARE SBB’s Class B share (ticker SBB B) and Class D share (ticker SBB D) are
traded on Nasdaq Stockholm, Large Cap. The company’s preference share
(ticker SBB PREF) is traded on Nasdaq First North Premier Growth Market.
As of 31 December 2019, the number of ordinary Class B shares stood at 1
030 549 096 and the Class D at 104 425 359. The preference shares
totalled 30,713 and in addition, the company had 209,977,491 ordinary
Class A shares. The price of the ordinary share of Class B was SEK 22.95,
Class D was SEK 34.89 and for the preference share the price was SEK
756.00 at 30 December 2019. The market capitalization of the ordinary
Class B share (including the value of unlisted Class A ordinary shares at the
same price) was SEK 28 470m, Class D was SEK 3 643m and for the
preference share was SEK 23m.
CLASS B SHARE DEVELOPMENT LAST 12 MONTHS, TRADING WITH THE SHARES ON NASDAQ & FIRST NORTH
PREFERENCE SHARE DEVELOPMENT LAST 12 MONTHS CLASS D SHARE DEVELOPMENT SINCE LISTING
0,00
50,00
100,00
150,00
200,00
250,00
300,00
350,00
4,00
9,00
14,00
19,00
24,00
29,00 SBB B OMX Stockholm PI
Share price, SEK
30 Dec 2019 30 Dec 2018
Class B 22,95 10,68
Class D1) 34,89 29,50
Preference shares 756,00 583,20
Average trading volume per trading day,
SEK m
jan-Dec 2019 Jan-Dec 2018
Class B 28,7 3,4
Class D1) 19,5 -
Preference shares 0,1 0,4
Daily volume, SEK m SEK
Daily volume, SEK
m
Daily volume, SEK
m
SEK
SEK
1) Price data is unavailable for the time before listing, which took place on 14
December 2018.
0,00
0,50
1,00
1,50
2,00
2,50
3,00
3,50
4,00
4,50
5,00
480,00
530,00
580,00
630,00
680,00
730,00
780,00
830,00 SBB PREF

28
Ownership Share capital amounted to SEK 134,498,265.90 on 31 December 2019, with a quotient value of SEK 0.10. Shareholding entitles the holder to one vote per Class A
ordinary share and 0.1 votes per Class B ordinary share, Class D ordinary share and preference share at the General Meeting. The preference shares have a
preferential right over the ordinary shares to an annual dividend of SEK 35 per preference share divided into quarterly payments. Holders of the ordinary shares
of Class D are entitled to five times the total dividend on the ordinary shares of Class A and B, however no more than SEK 2 per share and year
Sammanställningen nedan avser ägarstrukturen exkl. de aktier som emitterades i apportemissionen vid förvärvet av Hemfosa.
Shareholders Class A shares Class B Class D shares Preference shares Share capital, %
Votes, %
Ilija Batljan (privately/ companies) 109 053 868 10 192 373 13 39,2
Dragfast & Marjan Dragicevic 27 164 652 77 285 000 11,4 12,4
AB Arvid Svensson 26 000 000 39 513 367 7,2 10,7
Sven-Olof Johansson (companies) 22 315 456 29 481 315 5,6 9
Erik Paulsson (companies) 13 919 159 16 799 507 4,9 5,6
Michael Cocozza 44 237 537 4,8 1,6
Lennart Schuss (privately/ companies) 2 634 957 17 036 419 2,2 1,6
Swedish Foundation for Strategic Research 42 651 810 4,7 1,5
Oscar Lekander 3 174 785 1 931 348 275 500 0,6 1,2
Krister Karlsson 3 174 785 53 172 0,4 1,1
Joakim Bill 1 904 871 0,4 0,7
Postens pensionsstiftelse 19 004 310 2,1 0,7
Highhill Intressenter AB 18 701 897 2 0,7
Gösta Welandson with companies 18 181 819 2,1 0,7
Avanza Pension
9 257 438 4 393 899 1613 1,5 0,5
Other 634 958 285 369 108 71 828 831 29 100 34,1 12,8
Total 209 977 491 629 696 420 76 498 230 30 713 100 100
In accordance with the decision of the Annual General Meeting 2019, the shareholders have appointed the following persons: Mia Batljan (chairman), Rikard
Svensson, Sven-Olof Johansson and Lennart Schuss to constitute nomination committee for the time until a new nomination committee has been appointed
according to the mandate from the Annual General Meeting 2020.
29
INCOME STATEMENT OF PARENT COMPANY
Amount in SEKm
01-01-2019 31-12-2019
01-01-2018 31-12-2018
01-10-2019 31-12-2019
01-10-2018 31-12-2018
Net sales - - - -
Personnel costs -31 -24 -9 -7
Other operation expenses -147 -43 -105 -15
Operating profit -178 -67 -114 -22
Financial items Profit from shares in group companies -44 7 -44 - Interest income and similar items 831 240 319 117 Interest expenses and similar items -626 -249 -199 -163 Changes in value, derivatives 21 - 103 -
Profit after financial items 4 -69 65 -68
Appropriations 453 73 451 73
Profit before tax 457 4 516 5
Tax -81 1 -93 -18
NET PROFIT FOR THE PERIOD 376 5 423 -13
STATEMENT OF COMPREHENSIVE INCOME OF
PARENT COMPANY
Amount in SEKm
01-01-2019 31-12-2019
01-01-2018 31-12-2018
01-10-2019 31-12-2019
01-10-2018 31-12-2018
Net profit for the period 376 5 423 -13 Other comprehensive income - - - -
COMPREHENSIVE INCOME FOR THE PERIOD 376 5 423 -13
30
BALANCE SHEET OF PARENT COMPANY
Amount in SEKm 31-12-2019 31-12-2018
ASSETS
Fixed assets
Financial fixed assets
Shares in group companies 24 232 3 700
Receivables from group companies 18 822 7 948
Receivables from associated companies/joint ventures - 156
Deferred tax assets 45 1
Financial fixed assets at fair value 239 62
Derivatives 21 -
Other long-termm receivables 1 1
Total financial fixed assets 43 360 11 868
Total fixed assets 43 360 11 868
Current assets
Current receivables
Accounts receivable - 1
Other receivables 18 10
Prepaid expenses and accrues income 5 2
Total current receivables 23 13
Short-term investments 1 041 -
Cash and cash equivalents 11 664 6
Total current assets 12 728 19
TOTAL ASSETS 56 088 11 887
Amount in SEKm 31-12-2019 31-12-2018
EQUITY AND LIABILITIES
Equity 22 917 7 226
Untaxed reserves - 2
Long-term liabilities
Liabilities to credit institutions - 150
Bond loans 20 387 2 461
Liabilities to associated companies/joint ventures 287 -
Other long-term liabilities - 88
Total long-term liabilities 20 674 2 699
Current liabilities
Bond loans 444 -
Commercial papers 3 486 1 840
Accounts payable 12 16
Current tax liablities - 1
Other liabilities 8 103 46
Accrued expenses and prepaid income 452 57
Total current liabilities 12 497 1 960
TOTAL EQUITY AND LIABILITIES 56 088 11 887

31
STATEMENT OF CHANGES IN EQUITY OF PARENT
COMPANY
Amount in SEKm
Share capital Share premium Retained earnings
Total equity
Total equity 01-01-2018 74 4 937 23 5 034
Share issue 6 1 374 1 380
Issue hybrid bonds 1 505 1 505
Dividends -190 -190
Redeemed preference shares -98 -98
Repurchased hybrid bonds -317 -317
Repurchased warrants -93 -93
Net profit for the period 5 5
Other comprehensive income - -
Total equity 31-12-2018 80 7 211 -65 7 226
Total equity 01-01-2019 80 7 211 -65 7 226
Share issue 54 13 352 13 406
Issue hybrid bonds 4 600 4 600
Redeemed preference shares -93 -93
Dividends -569 -569
Repurchased hybrid bonds -1 873 -283 -2 156
Tax effects equity 127 127
Net profit for the period 376 376
Other comprehensive income - -
Total equity 31-12-2019 134 22 628 155 22 917
COMMENTS ON THE PARENT COMPANY'S INCOME STATEMENT AND BALANCE SHEET
The Parent Company’s operations consist of Group-wide functions, such as business development, transactions, property development and financial
management. The company has 10 employees. The costs including personnel costs during the period amounted to SEK 178m (67). As a result of the
extraordinary activities in the company, such as a switch to Nasdaq’s main market and the acquisition of Hemfosa, the company had some non-recurring costs
of around SEK 83m during the period.
During the period, SBB carried out a rights issue of Class B ordinary shares, which provided SBB with SEK 1.5 billion before issue expenses. In addition to this, a
targeted issue of Class B ordinary shares was made to a volume of SEK 400m to Gösta Welandson. The non-cash issue carried out in connection with the
acquisition of Hemfosa contributed around SEK 11 billion in equity.

32
CASH FLOW STATEMENT OF PARENT COMPANY
Amount in SEKm
01-01-2019 31-12-2019
01-01-2018 31-12-2018
01-10-2019 31-12-2019
01-10-2018 31-12-2018
Profit after financial items 4 -69 65 -68 Net financial items -205 9 -202 47 Interest paid -449 -249 -92 -174 Interest received 831 240 320 117
Cash flow from operations before changes in working capital
181 -69 91 -78
Cash flow from changes in working capital Changes in current receivables -10 2 20 81 Changes in current liabilities 8 120 95 8 137 97
Cash flow from operations 8 291 28 8 248 100
Investment activities Investments in subsidiaries -20 532 -258 - -257 Claims incurred by group companies -10 874 -6 347 -2 591 -1 750 Changes in receivables from associated companies/joint ventures 156 -156 67 -119 Changes in asset at fair value -1 239 -62 170 -62 Changes in other long-term receivables - -1 36 -1
Cash flow from investment activities -32 489 -6 824 -2 318 -2 189
Financing activities
Share issue 13 406 1 380 12 353 1 380
Issue hybrid bonds 4 600 1 505 1 485 202
Repurchased hybrid bonds -2 156 -317 - -317
Redeemed warrants - -93 - -93
Redeemed preference shares -93 -98 - -98
Group contributions 453 73 - 73
Dividend paid -419 -190 -47 -62
Changes in loans 20 065 4 539 6 386 1 005
Cash flow from financing activities 35 856 6 799 20 178 2 090
Cash flow for the period 11 658 3 26 107 1
Cash and cash equivalents at the beginning of the period 6 3 7 786 5
Cash and cash equivalents at the end of the period 11 664 6 33 893 6
1) The amount above also include share issues without contribution of cash. Investments in subsidiaries also includes investments made by direct share issues.
33
SUPPLEMENTAL INFORMATION General information Samhällsbyggnadsbolaget i Norden AB (publ) (SBB), corp. ID no. 556981-7660, with its subsidiaries conducts operations in property management and property development. The Parent Company is a limited liability company registered in Sweden and based in Stockholm. Accounting principles Principles for the consolidated accounts
The consolidated accounts have been prepared in accordance with International Financial Reporting Standards (IFRS) and interpretations issued by the IFRS Interpretation Committee (IFRIC). In addition, the Swedish Annual Accounts Act and “RFR1 Supplementary Accounting Rules for Groups” have been applied. The Parent Company applies the same accounting principles as the Group with the exceptions and additions stated in the recommendation RFR 2 Accounting for Legal Entities issued by the Swedish Financial Reporting Board. This interim report was prepared in accordance with IAS 34 Interim Reporting. The same accounting and valuation principles were applied as in the latest Annual Report; refer to SBB’s 2018 Annual Report, pages 57-142, except that stated below.
Information on new standards
IFRS 16 Leases that lessees report assets and liabilities attributable to all leases, with the exception of contracts that are shorter than 12 months and/or pertain to small amounts. Accounting for lessors will essentially remain unchanged. Upon introduction of IFRS 16 on 1 January 2019, SBB recognized a leasing asset and a lease liability in the balance sheet attributable to leaseholds. The asset is recognized in the item “Land lease agreements”. The income statement was affected by the fact that land lease payments are reported in net financial items instead of as an operating cost. SBB has chosen to apply the simplified transition method and will not apply the standard retroactively.
Pledged assets and contingent liabilities
Group 2019-12-31 2018-12-31
Pledged assets
Mortgages 101 914 26 763
Shares in subsidiaries 13 161 1 790
Total 115 075 28 553
Contingent liabilities
Guarantees for liabilities in jv/associated companies 273 -
Guarantees for commitments in jv/assoc. companies 6 -
Total 279 -
Parent company
Pledged assets
Shares in subsidiaries - -
Total - -
Contingent liabilities
Guarantees 6 014 4 713
Total 6 014 4 713

34
Hedge accounting Since 1 January 2018, the Group applies hedge accounting for currency loans. Currency loans issued in EUR have been used as hedges against net assets in
Finland. The effect of the hedge accounting is that the unrealized exchange rate differences of SEK 22m net after tax in the translation of the loan at the closing
day rate were recognized in other comprehensive income. In the Swedish Group, there is also a currency loan in NOK that is used as a hedge against net assets
in Norway. The effect of the hedge accounting is that the unrealized exchange rate differences of SEK 6m net after tax in the translation of the loan at the
closing day rate were recognized in other comprehensive income.
Related-party transactions In addition, SBB acquired the company Hestia Sambygg AB on 26 March 2018, of which 49 percent was previously owned by the principal owner Ilija Batljan
Invest AB. The purchase price paid to Ilija Batljan Invest AB was SEK 1. Until the acquisition, SBB purchased consulting services relating to financial and technical
property management from the company. The pricing for the services was based on a market-based square metre price. After the acquisition, these services are
conducted in-house.
SBB has an incentive programme for the company’s current and future employees, which comprises 20,000,000 warrants that entitle the holder to subscribe for
the corresponding number of Class B shares in the company. The subscription price for new subscription of B shares corresponds to 130 percent of the average
of the company’s B shares’ volume-weighted last price during the 10 trading days from 24 October 2017 through 6 November 2017. Subscription of B shares on
the basis of warrants may take place in the period from on 1 October 2020 until 31 October 2020.
Business Combination The acquisition of Hemfosa is classified, from an accounting point of view, as a business combination in accordance with IFRS 3. This means that assets acquired,
liabilities assumed and contingent liabilities are assumed to be measured at their fair value at the acquisition date. The difference between the cost for the
acquired assets and the real value of the acquired assets is allocated to goodwill.
As at 31 December 2019, SBB controlled 87.8 per cent of the shares and 88.1 per cent of the votes. The purchase price consisted of a consideration of SBB
common shares of series B and D amounting to SEK 10.6 billion and a cash consideration of SEK 7.9 billion. In addition, SBB purchased shares amounting to SEK
2 billion in the open market. The value of the share consideration was based on the average share price as at 20 December 2019 which was SEK 24,0533 for the
common share of series B and SEK 34,7785 for the common share of series D. The cash consideration was paid on 3 January 2020 and is reported as other
current liabilities in the year end accounts.
ACQUIRED NET ASSETS AT CLOSING
Tangible fixed assets 45 238
Leasing assets 301
Financial fixed assets 502
Account receivables and other receivables
192
Cash and cash equivalents 749
Non-controlling interests -1 930
Interest bearing liabilities -24 931
Deferred tax -4 809
Account payables and other liabilities -1 416
Identified net assets 13 896
Goodwill 6 663
Total purchase price 20 559
In connection with the acquisition, goodwill arose amounting to SEK 6 663m in terms of the difference between the acquired shares and the net assets.
Goodwill comprises of two parts. It mostly comprises of the synergy effects resulting from lowered financial- and administration costs. This part amounts to SEK
4 295m. In addition, there is a reported goodwill attributable to the difference between nominal tax that must be reported in business combinations and the
deferred tax that is calculated when acquiring properties through acquiring the shares. For this accounting goodwill amounting to SEK 2 368m there is an
equivalent amount in deferred tax.
Transaction costs related to the acquisition amounted to SEK 70m and are accounted for under the line item Acquisition- and restructuring costs in the profit
and loss accounts. The transaction costs amounting to SEK 85m and which are directly attributable to the issue of own shares have been reported against
equity.

35
THE IMPACT OF THE ACQUISITION ON THE CASH FLOW
Cash consideration 9 946
Minus:
Cash and cash consideration (acquired) -749
Net cash flow 9 197
From the acquisition date as at 23 December 2019 to 31 December 2019, Hemfosa contributed with SEK 74m to the Group’s income and SEK 31m to the
Group’s profit after tax. If the acquisition had taken place at the beginning of the financial year, SBB estimates that Hemfosa had contributed SEK 2 884m to the
Group’s revenues and SEK 2 390 to the Group’s profit after tax.
CHANGE IN GOODWILL
Opening balance 24
Acquisition 6 663
Reported value 6 687

36
The Board of Directors and CEO provide their assurance that this interim report provides an accurate overview of the operations, position and performance of
the Group and the Parent Company, and that it also describes the significant risks and uncertainty factors that affect the Parent Company and the companies
within the Group.
Stockholm, 19 February 2020
Lennart Schuss Chairman of the Board
Ilija Batljan CEO
Sven-Olof Johansson Board Member
Fredrik Svensson Board Member
Hans Runesten Board Member
Eva Swartz Grimaldi Board Member
Anne-Grete Strøm Erichsen Board Member
This information is such that Samhällsbyggnadsbolaget i Norden AB (publ) is obliged to publish in accordance with the EU Market Abuse Regulation and the
Swedish Securities Market Act. The information was submitted by the below contact persons for publication on 19 February 2020 at 8:00 a.m. CET.
Ilija Batljan, CEO, [email protected]
Marika Dimming, IR, +46 70-251 66 89, [email protected]
Certified advisor for the company’s preference share is Erik Penser Bank AB (www.penser.com).

37
DEFINITIONS Financial definitions
Actual net asset value (EPRA NNNAV), SEK
Equity attributable to the ordinary share,
excluding equity associated with preference and
D shares, non-controlling interests and hybrid
bonds, adjusted for estimated actual deferred tax
at 5.5 percent and reversal of goodwill
attributable to deferred tax. The key figure
provides an adjusted and complementary
measure of the size of equity calculated in a
manner consistent with listed property
companies.
Number of preference shares outstanding
The number of preference shares outstanding at
the end of the period.
Number of ordinary shares outstanding
The number of ordinary shares outstanding at
the end of the period.
Return on equity, %
Net profit for the period in relation to average
equity for the period.
The key figure shows SBB's return on equity
during the period.
Loan-to-value ratio, %
Net debt in relation to total assets. The key figure
is used to illustrate SBB's financial risk.
EPRA
European Public Real Estate Association is an
organization for listed property companies and
investors in Europe. EPRA sets standards
regarding financial reporting.
EPRA Earnings, SEK Profit from property
management less estimated current tax
attributable to the profit from property
management. Taxable profit from property
management refers to profit from property
management less tax deductible depreciation
and renovations. The key figure provides
information on profit from property management
calculated in a uniform manner for listed property
companies.
Profit from property management
Profit before changes in value and tax.
The key figure provides a measurement of the
operations’ profit generation regardless of value
changes.
Average number of preference shares
The number of preference shares outstanding
weighted over the period.
Average number of ordinary shares
The number of ordinary shares outstanding
weighted over the period.
Average interest, %
Weighted average contracted interest for
interest-bearing liabilities at the end of the
period excluding unutilized credit facilities. The
key figure is used to illustrate SBB's financial risk.
Average fixed interest term, years Average
remaining duration until an interest-adjustment
point for interest-bearing liabilities.
The key figure is used to illustrate SBB's financial
risk.
Adjusted equity/assets ratio, %
Reported equity including owner loans and
convertibles, with reversal of reported deferred
tax liability as a percentage of total assets. The
key figure is used to illustrate SBB's financial
stability.
Tied-up capital, year
Remaining maturity of interest-bearing liabilities.
The key figure is used to illustrate SBB's financial
risk.
Cash flow from operating activities, SEK
Cash flow from operating activities before
changes in working capital according to the cash
flow statement.
Long-term net asset value (EPRA NAV), SEK
Recognized equity attributable to the ordinary
share, excluding equity associated with
preference and D shares, non-controlling
interests and the hybrid bond, adding back
deferred tax liability, goodwill attributable to
deferred tax and interest rate derivatives. The
key figure provides an adjusted and
complementary measure of the size of equity
calculated in a manner consistent with listed
property companies.
Net debt, SEK
Interest-bearing liabilities less cash and cash
equivalents.
Earnings per ordinary share A and B, SEK Net
profit for the period after dividend to preference
shareholders and holders of D shares and
interest on hybrid bonds in relation to the
average number of ordinary shares A and B for
the period.
Interest-coverage ratio, multiple Profit from
property management (past 12 months) after
return of financial costs in relation to financial
coasts excluding costs for early repayment of
loans and leasing costs. The key figure is used to
illustrate financial risk.
Equity/assets ratio, %
Reported equity as a percentage of total assets.
The key figure is used to illustrate SBB's financial
stability.
Secured loan-to-value ratio, % Secured liabilities
as a percentage of the total assets. The key figure
is used to illustrate SBB's financial stability.

38
Property-related definitions
Number of properties
Number of properties at the end of the period
Number of sq.m.
Total area in the property portfolio at the end of
the period
GFA
Gross floor area
Net operating income, SEK
Rental income less property costs.
Economic occupancy ratio, %
Rental income in relation to rental value.
The key figure is used to illustrate the level of
return on the operating net in relation to the
value of the properties
EPRA Vacancy rate, %
The rental value of available leases divided by the
rental value of the entire portfolio.
The key figure is calculated in accordance with
the EPRA definition, which enables comparison
with other companies.
EPRA Earnings, SEK
Profit from property management less estimated
current tax attributable to the profit from
property management. Taxable profit from
property management refers to profit from
property management less tax deductible
depreciation and renovations.
The key figure provides information on profit
from property management calculated in a
uniform manner for listed property companies.
Average contract length of social infrastructure
properties, years
Remaining contract value in relation to annual
rent for social infrastructure properties.
The key figure aims to illustrate SBB's rental risk.
Rental income, SEK
Charges for the period with deductions for rental
losses.
Rental value, SEK
Contracted rents plus market value for vacant
areas.
Market value of properties, SEK
Fair value of the properties at the end of the
period.
Surplus ratio, %
Net operating income as a percentage of rental
income for the period. The key figure shows how
much of the rental income remains after direct
property costs.
Yield, %
Net operating income (rolling 12 months) in
relation to the sum of the properties fair value at
the end of the period excl. the value for building
rights.
The key figure is used to illustrate the level of
return on the net operating income in relation to
the value of the properties.

39
CALCULATION OF ALTERNATIVE PERFORMANCE MEASURES
Return on equity
Amount in SEKm 01-01-2019 31-12-2019
01-01-2018 31-12-2018
01-10-2019 31-12-2019
01-10-2018 31-12-2018
Net profit for the period 2 624 1 690 1 287 691
IB Equity 11 197 7 636 15 940 9 852
OB Equity 30 896 11 197 30 896 11 197
Average equity 21 047 9 417 23 418 10 525
Return on Equity 12% 18% 5% 7%
Loan-to-value ratio
Amount in SEKm 01-01-2019 31-12-2019
01-01-2018 31-12-2018
01-10-2019 31-12-2019
01-10-2018 31-12-2018
Liabilities to credit institutions 25 985 5 910 25 985 5 910
Bond loans 25 162 6 925 25 162 6 925
Commercial papers 4 944 1 840 4 944 1 840
Cash and cash equivalents -12 858 -157 -12 858 -157
Net debt 43 233 14 518 43 233 14 518
Total assets 104 203 27 641 104 203 27 641
Loan-to-value ratio 41% 53% 41% 53%
Economic letting ratio
Amount in SEKm 01-01-2019 31-12-2019
01-01-2018 31-12-2018
01-10-2019 31-12-2019
01-10-2018 31-12-2018
Rental income in current earnings capacity 5 217 1 585 5 217 1 585
Rental value in current earnings capacity 5 502 1 648 5 502 1 648
Economic letting ratio 94,8% 96,2% 94,8% 96,2%
EPRA Earnings
Amount in SEKm 01-01-2019 31-12-2019
01-01-2018 31-12-2018
01-10-2019 31-12-2019
01-10-2018 31-12-2018
Profit from property management 645 321 137 28
Income tax paid -34 -1 18 16
EPRA earnings 611 320 155 44

40
Adjusted equity ratio
Amount in SEKm 01-01-2019 31-12-2019
01-01-2018 31-12-2018
01-10-2019 31-12-2019
01-10-2018 31-12-2018
Equity 30 896 11 197 30 896 11 197
Deferred tax excl. deferred tax related to goodwill 3 869 1 047 3 869 1 047
Sum 34 765 12 244 34 765 12 244
Total assets 104 203 27 641 104 203 27 641
Adjusted Equity ratio 33% 44% 33% 44%
Earnings per ordinary Class A and Class B shares
Amount in SEKm 01-01-2019 31-12-2019
01-01-2018 31-12-2018
01-10-2019 31-12-2019
01-10-2018 31-12-2018
Net profit for the period 2 624 1 690 1 287 691
Net profit attributable to preference shares -11 -47 -1 -8
Net profit attributable to ordinary class D shares -150 -21 -52 -21
Net profit attributable to hybrid bonds -198 -86 -47 -35
Net profit attributable to non-controlling interet -4 - -4 -
Net profit attributable to ordinary class A and B shares 2 261 1 536 1 183 627
Average number of ordinary class A and B shares 762 481 721 741 569 031 781 570 028 752 310 988
Earnings per ordinary class A and class B shares 2,97 2,07 1,51 0,83
Interest coverage ratio, times
Amount in SEKm
01-01-2019 31-12-2019
01-01-2018 31-12-2018
Profit from property management (rolling 12 months) 645 321
Interest expenses and similar items (rolling 12 months) 482 538 Expenses for redeemed loans in advance (rolling 12 months) 197 127
Translation gains/losses (rolling 12 months) -91 -
Land lease expenses (rolling 12 months) 7 -
Sum 1 240 986
Interest expenses and similar items (rolling 12 months) 482 538
Interest coverage ratio, times 2,6 1,8
Equity ratio
Amount in SEKm 01-01-2019 31-12-2019
01-01-2018 31-12-2018
01-10-2019 31-12-2019
01-10-2018 31-12-2018
Equity 30 896 11 197 30 896 11 197
Total assets 104 203 27 641 104 203 27 641
Equity ratio 30% 41% 30% 41%

41
Net asset value Amount in SEKm 01-01-2019
31-12-2019 01-01-2018 31-12-2018
01-10-2019 31-12-2019
01-10-2018 31-12-2018
Equity exkluding non-controlling interest
Equity 30 896 11 197 30 896 11 197
Hybrid bonds -4 629 -1 873 -4 629 -1 873
Non-controlling interest -1 963 -315 -1 963 -315
Equity exkluding non-controlling interest 24 304 9 009 24 304 9 009
Equity attributable to Preference share investors -15 -88 -15 -88
Equity attributable to D-share investors -3 255 -1 244 -3 255 -1 244
Goodwill attributable to deferred tax -2 368 - -2 368 -
Reversal of deferred taxes 6 237 1 047 6 237 1 047
Deferred tax deduction (5.5%) -2 604 -886 -2 604 -886
Current net assets value (EPRA NNNAV) 22 298 7 838 22 298 7 838
Current net assets value (EPRA NNNAV), SEK/share 17,97 10,37 17,97 10,37
Derivation of derivatives -48 12 -48 12
Reversal of deferred tax deduction (5.5%) 2 604 886 2 604 886
Long-term net asset value (EPRA NAV) 24 855 8 736 24 855 8 736
Long-term net asset value (EPRA NAV), SEK/share 20,04 11,55 20,04 11,55
Number of ordinary class A and B shares 1 240 526 587 756 049 031 1 240 526 587 756 049 031
Secured Loan-to-value Amount in SEKm 01-01-2019
31-12-2019 01-01-2018 31-12-2018
01-10-2019 31-12-2019
01-10-2018 31-12-2018
Liabilities to credit institutions 25 985 5 910 25 985 5 910
Secured bond loans 1 334 4 552 1 334 4 552
Total secured loans 27 319 10 462 27 319 10 462
Total assets 104 203 27 641 104 203 27 641
Secured loan-to-value ratio 26% 38% 26% 38%
Surplus ratio
Amount in SEKm 01-01-2019 31-12-2019
01-01-2018 31-12-2018
01-10-2019 31-12-2019
01-10-2018 31-12-2018
Net operating income 1 265 1 071 362 274
Rental income 1 996 1 680 596 453
Surplus ratio 63% 64% 61% 60%

42
APPENDIX 1 – CURRENT EARNINGS CAPACITY FROM PROPERTY MANAGEMENT The current earning capacity for the Group for 12 months is presented below and takes into account the Group’s property portfolio at 31 December 2019. The
current earning capacity is not a forecast, but only to be viewed as a hypothetical snapshot and is presented only to illustrate income and expenses on an
annual basis, given the property portfolio, financial costs, capital structure and organization at a set point in time. The Group’s earning capacity does not include
the earning impact of unrealized and realized value changes.
The following information forms the basis for the calculation of the earning capacity:
– Contracted rental income on an annual basis (including supplements and rental discounts) and other property- related revenues on the
basis of current lease contracts as of 31 December 2019.
– Operating and maintenance costs are based on budget.
– The property tax is calculated from the properties current tax assessment value as of 31 December 2019.
– Cost for central administration is based on the current organization.
– No financial profit has been assumed in the net financial items. Financial expenses are based on contracted interest rates and include
interest on external loans.
THE GROUP’S EARNINGS CAPACITY
Numbers in SEKm Community service Residential Other Total Adjusted1)
Rental income 4 092 853 272 5 217 5 217
Operating costs -544 -263 -74 -881 -881
Maintenance -264 -79 -19 -362 -362
Property administration -87 -40 -13 -139 -139
Property tax -90 -15 -16 -121 -121
Net operating income 3 107 456 150 3 713 3 713
Central administration -150 -150
Result from Joint Ventures 77 77
Financial income 68 68
Financial costs -985 -8631)
Operating profit before dividend 2 723 2 845
per Class A and B shares 2,20 2,29
Result from synergies with Hemfosa 300 300
Dividend hybrid bonds -197 -197
Dividend Class D shares -209 -209
Dividend Preference shares -1 -1
Operating profit attributable to ordinary shareholders 2 616 2 738
per Class A and B shares 2,11 2,21
1) Adjusted for non-long-term surplus liquidity held by the Group at the end of the period with an estimated average interest rate of 1.75%, which is the weighted average in the debt
portfolio as of 31-12-2019.

43
APPENDIX 2 – CURRENT EARNINGS CAPACITY INCLUDING ADDITIVE RECURRING INCOME STREAMS
THE GROUP’S EARNINGS CAPACITY OF ADDITIVE RECURRING INCOME STREAMS
Numbers in SEKm Total Adjusted1)
Operating profit attributable to ordinary shareholders 2 616 2 738
per Class A and B shares 2,11 2,21
Result from property development 400 400
Result from transaction 4002) 4002)
Result from renovations/investments 600 600
Adjusted operating profit to ordinary shareholders with additive income streams 4 016 4 138
per Class A and B shares 3,24 3,34
1) Adjusted for non-long-term surplus liquidity held by the Group at the end of the period with an estimated average interest rate of 1.75%, which is the weighted average in the debt
portfolio as of 31-12-2019.
2) Based on historical profit generation from transaction of approximately SEK 700m per year
Developments & Transactions
Development & Transaction
Swedish rent regulated residentials
Community service properties (Elderly care, education, group housing for people
with disabilities,
and gov. agencies)

44
Sensitivity analysis
Return asset value and earnings including long-term value change Return asset value and earnings including long-term value change in companies that manage so-called real assets, such as properties; the profit from property management only reflects a part of the overall earnings. The definition of real assets states that they are value-protected, meaning over time and with good maintenance they have a value growth trend that compensates for inflation. The net asset value, i.e. the denominator in the return ratio profit/capital, is adjusted annually through the IFRS rules with regard to value changes. To provide a correct return, the numerator, i.e. profit, must also be adjusted in the same way. The recognized profit from management operations must accordingly be supplemented with a value change component and effective tax to provide an accurate picture of profit and return.
One problem is that value changes can vary strongly between years and quarters and entail volatile results. For a long-term actor with a stable cash flow and a
well-composed property portfolio, the long-term value change (or when lacking this, the long-term average inflation rate) can be used to adjust the numerator
in the equation. Given our brief history, we have chosen to use inflation averages for the previous ten years.
Building rights profit = SEK 250m Building rights profit = SEK 400m
Change in value Change in value
–1%point +1%point –1%point +1%point
Operating profit (rolling 12 months) 2 723 2 723 2 723 2 723 2 723 2 723
Profit from creation of building rights 250 250 250 400 400 400
Change in property value (10 years average CP) 955 159 1 750 955 159 1 750
D:o % 1,20% 0,20% 2,20% 1,20% 0,20% 2,20%
Current tax, 10% -272 -272 -272 -272 -272 -272
Profit after tax 3 655 2 860 4 451 3 805 3 010 4 601
Profit per share 2,95 2,30 3,59 3,07 2,43 3,71
Return on net asset value 14,70% 11,50% 17,90% 15,30% 12,10% 18,50%
Profit/share price 13,42% 10,04% 15,63% 13,36% 10,57% 16,15%
P/E 7 10 6 7 9 6

45
UPCOMING REPORT DATES Interim report Jan-Sept 2019 29/10/2019 Year-end report 2019 19/02/2020 Interim report Jan-March 2020 27/04/2020 CONTACT PERSONS
ILIJA BATLJAN CEO [email protected]
MARIKA DIMMING IR [email protected] +46 070 251 66 89


