Design of Porous Medium Burners by Means of Additive Manufacturing by Mykhailo SAMOILENKO THESIS PRESENTED TO ÉCOLE DE TECHNOLOGIE SUPÉRIEURE IN PARTIAL FULFILLMENT FOR A MASTER’S DEGREE WITH THESIS IN MECHANICAL ENGINEERING M.A.Sc. MONTREAL, OCTOBER 22, 2018 ÉCOLE DE TECHNOLOGIE SUPÉRIEURE UNIVERSITÉ DU QUÉBEC Mykhailo Samoilenko, 2018
Transcript
Design of Porous Medium Burners by Means of Additive Manufacturing
by
Mykhailo SAMOILENKO
THESIS PRESENTED TO ÉCOLE DE TECHNOLOGIE SUPÉRIEURE IN PARTIAL FULFILLMENT FOR A MASTER’S DEGREE
WITH THESIS IN MECHANICAL ENGINEERING M.A.Sc.
MONTREAL, OCTOBER 22, 2018
ÉCOLE DE TECHNOLOGIE SUPÉRIEURE UNIVERSITÉ DU QUÉBEC
Mykhailo Samoilenko, 2018
This Creative Commons licence allows readers to download this work and share it with others as long as the
author is credited. The content of this work can’t be modified in any way or used commercially.
BOARD OF EXAMINERS
THIS THESIS HAS BEEN EVALUATED
BY THE FOLLOWING BOARD OF EXAMINERS Mr. Patrice Seers, Thesis Supervisor Department of Mechanical Engineering at École de technologie supérieure Mr. Vladimir Brailovski, Thesis Co-supervisor Department of Mechanical Engineering at École de technologie supérieure Mr. Patrick Terriault, Thesis Co-supervisor Department of Mechanical Engineering at École de technologie supérieure Mr. Christian Belleau, President of the Board of Examiners Department of Mechanical Engineering at École de technologie supérieure Mr. Ricardo Zednik, Member of the jury Department of Mechanical Engineering at École de technologie supérieure
THIS THESIS WAS PRENSENTED AND DEFENDED
IN THE PRESENCE OF A BOARD OF EXAMINERS AND PUBLIC
27th SEPTEMBER, 2018
AT ÉCOLE DE TECHNOLOGIE SUPÉRIEURE
ACKNOWLEDGMENT
First, I would like to thank my supervisor, Professor Patrice Seers at the Department of
Mechanical Engineering, for your agreement to lead my research at École de téchnologie
supérieure. Your support, technical and very easy approach allowed me to carry out this
project.
I would also like to thank my co-supervisor, Professor Vladimir Brailovski, who inspired me
to start a master degree. I greatly appreciate your constant moral and financial support all
along this project. Your hard-working approach energized not only me but everyone in the
laboratory LAMSI.
I also want to thank my co-supervisor, Patrick Terriault, who provided valuable insights
according to the subject of the work. I am grateful for your additional support and possibility
to work on projects which helped to broaden my engineering knowledge.
I also want to thank the entire LAMSI research team, especially Anatole, Morgan, Victor,
Michio, and all the others that I have been able to meet for the last four years. A very
beautiful social life within LAMSI was possible thanks to your presence.
I also want to thank the technicians from the mechanical engineering department, in
particular, Michel Orsini, Eric Marcoux, Louis David Archambault, Radu Romanica and
Serge Plamondon for their great help and availability.
I also want to thank my parents who were the first to support me and to believe in me. None
of this would have been possible without you.
CONCEPTION ET OPTIMISATION DE BRÛLEURS POREUX PAR FABRICATION ADDITIVE
Mykhailo SAMOILENKO
RESUMÉ
La morphologie stochastique des mousses céramiques et les discordances entre spécimens du même type compliquent la création de modèles numériques lors de la conception et l'optimisation de brûleurs poreux. Une solution favorable, du point de vue de la modélisation, est l'application d’une structure cellulaire ordonnée dans une géométrie prédéfinie ultimement produite par fabrication additive. Cette solution devrait permettre d'atteindre des rendements plus élevés et des émissions de polluants plus faibles. Dans ce document, composé de deux sections principales, les procédures permettant la sélection des réseaux de diamant avec des paramètres appropriés ainsi que la comparaison des performances de brûleurs poreux avec différents matériaux et géométries sont présentées. La première section décrit la méthodologie utilisée pour l'analyse géométrique des mousses céramiques et la sélection des réseaux de diamants équivalents. Trois types de mousses en céramique SiSiC (10 PPI, 30 PPI et 60 PPI) ont été évaluées à partir de coupes transversales et de volumes 3D obtenus par tomographie aux rayons X. La combinaison d'une analyse de taille de cellule adaptée de la norme ASTM D3576-15 et d'un modèle de tétrakaidécaèdre préalablement développé a été choisie parmi d'autres méthodes pour déterminer la taille des pores. Après l’analyse des mousses céramiques, une approche de sélection des réseaux de diamant équivalents en termes de porosité et de perméabilité absolue a été proposée. En conséquence, trois échantillons ont été imprimés à partir d’un alliage de CoCr: une mousse de 10 PPI et une mousse de 60 PPI, ainsi qu'un treillis diamant équivalent à une mousse de 10 PPI. Un banc d'essai du brûleur poreux à deux sections a ensuite été conçu et assemblé, ce qui a permis de mesurer la température, les émissions de polluants et les chutes de pression des différents bruleurs. La deuxième section décrit les procédures expérimentales et les résultats de six configurations de test qui ont permis d’étudier l’influence de la géométrie et du matériau sur les propriétés effectives des bruleurs. Dans toutes les configurations, les émissions de polluants étaient faibles et à la limite de détection de l'équipement, ce qui correspond à la théorie et aux recherches antérieures. L'application du CoCr a été jugée avantageuse dans la section amont, assurant une stabilité de la flamme et une résistance structurelle plus élevée. Le réseau de diamants s'est avéré être un bon candidat pour le remplacement de la géométrie des mousses en fournissant à la fois la prévisibilité et une rigidité structurelle plus élevée. Nous recommandons que d'autres recherches soient effectuées quant à l'utilisation de la géométrie en treillis de diamants avec l’alliage CoCr dans la section amont. Mots-clés: Brûleur en milieux poreux, Fabrication additive, Treillis diamanté, Tomographie informatisée, Taille des pores
DESIGN AND OPTIMIZATION OF POROUS MEDIUM BURNERS BY MEANS OF ADDITIVE MANUFACTURING
Mykhailo SAMOILENKO
ABSTRACT
The stochastic morphology of ceramic foams and discrepancies between specimens of the same type complicate the creation of numerical models during the design and optimization of porous medium burners. A favourable solution, from the modelling point of view, is the application of an ordered diamond lattice with definite geometry produced by means of additive manufacturing, which potentially allows achieving higher efficiencies and lower pollutant emissions. This document, describes procedures in the selection of diamond lattices with proper parameters and the comparison of the porous medium burner performances with different materials and geometries.
The first section explains our methodology for geometrical analysis of ceramic foams and further selection of equivalent diamond lattices. Three acquired types of ceramic SiSiC foams (10 PPI, 30 PPI, and 60 PPI) were evaluated from image cross-sections and digital replicas that were obtained by means of X-ray computed tomography. Upon investigating, we found that pore sizes provided by a manufacturer were underestimated and discrepancies between them reached up to 100% for 60 PPI specimens. Combination of adapted cell size analysis according to ASTM D3576-15 standard and a developed tetrakaidecahedron model was favoured among other methods of pore size determination. After analysis of ceramic foams, an approach of selecting equivalent diamond lattices in terms of porosity and absolute permeability was proposed. As a result, three specimens were printed from CoCr alloy: 10 PPI and 60 PPI foams, as well as an equivalent 10 PPI diamond lattice. A test bench of the two-section porous medium burner was designed and assembled, which allowed the temperature, pollutant emissions and pressure drop measurements. The second section describes the experimental procedures and results from six different setups that compared the foam and diamond lattice geometries, and compared ceramic and metal as materials. In all setups, pollutant emissions were low and at the detection limit of the equipment, which agrees with theory and previous research. The application of CoCr material was determined as advantageous in the upstream section, ensuring higher flame stability and structural strength. A diamond lattice was found to be a good candidate for replacement of the foam geometry by providing both the predictability and higher structural stiffness. We recommend that further research should be done on using diamond lattice geometries with CoCr alloy in the upstream section, and SiSiC ceramic foam in the downstream section for the broad range of lean combustion regimes. Keywords: Porous medium burner, Additive manufacturing, Diamond lattice, Tetrakaidecahedron, Computed tomography, Pore size
CHAPTER 1 LITERATURE REVIEW ............................................................................5 1.1 Combustion fundamental principles ..............................................................................5 1.2 Basic porous foam burner ..............................................................................................8 1.3 Temperature, radiant output and thermal efficiency ....................................................14 1.4 Flammability limits and quenching .............................................................................14 1.5 Pollutant emissions ......................................................................................................19 1.6 Pressure drop and permeability ....................................................................................20 1.7 Durability of porous materials .....................................................................................22 1.8 Practical applications ...................................................................................................23 1.9 Hypothesis and objectives............................................................................................24
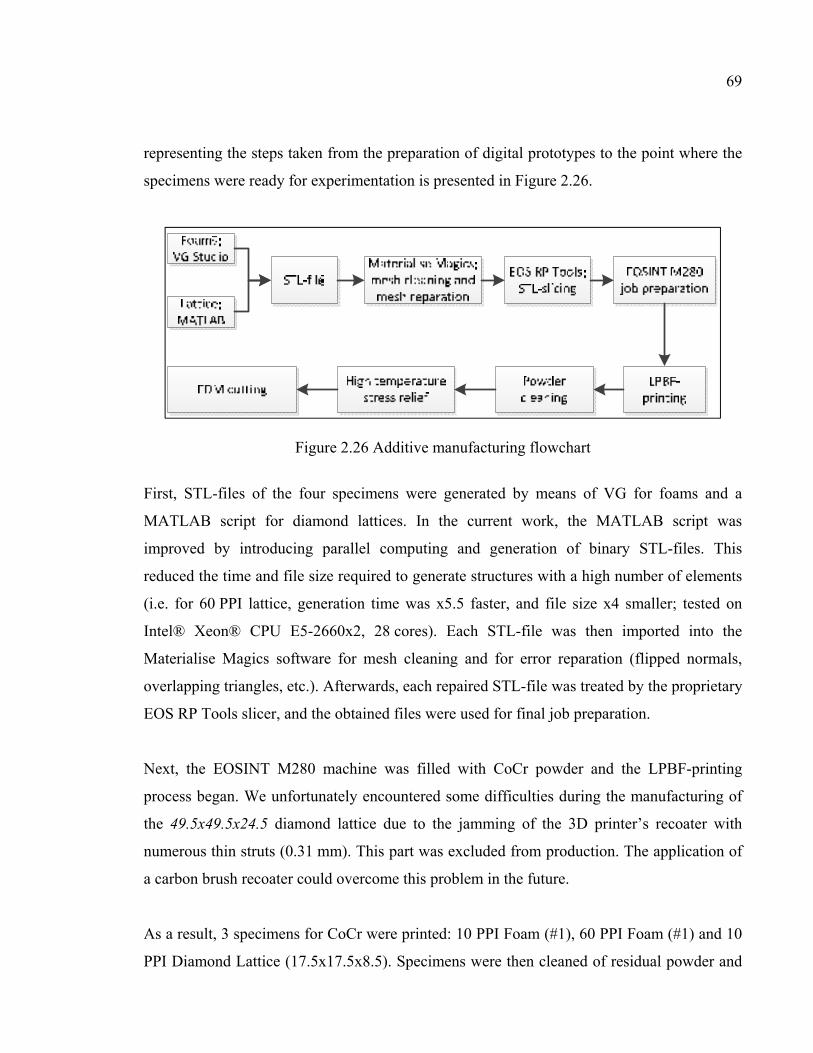
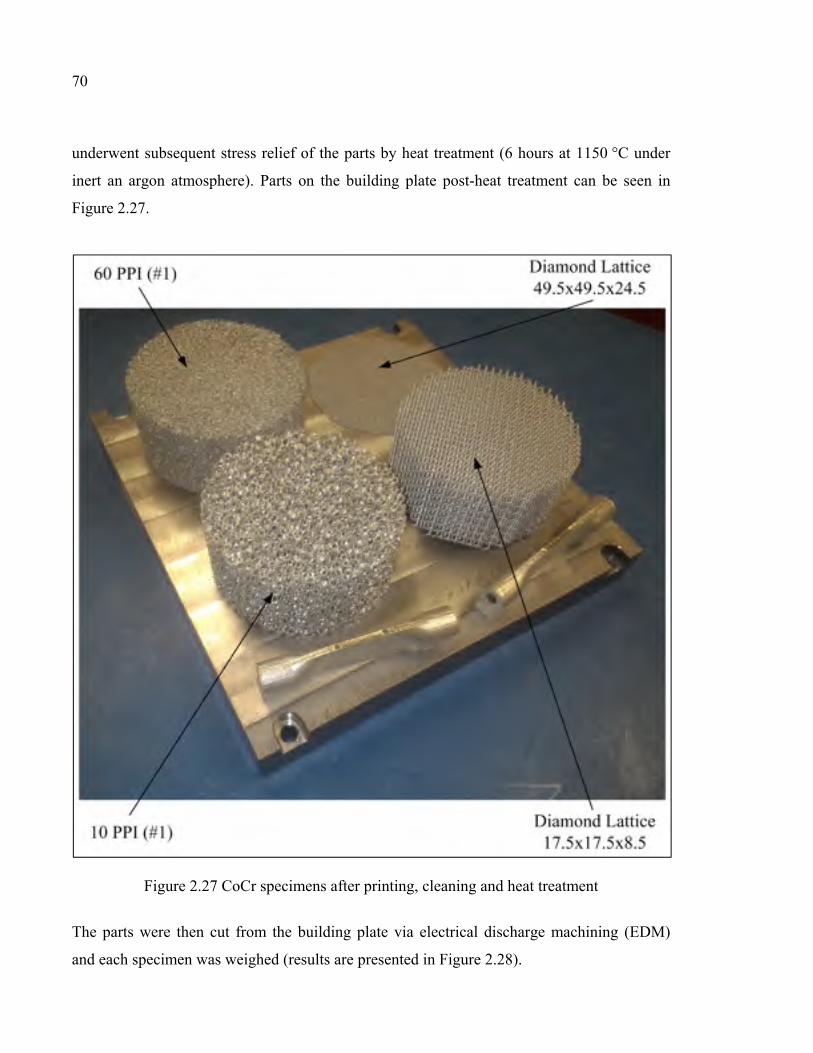
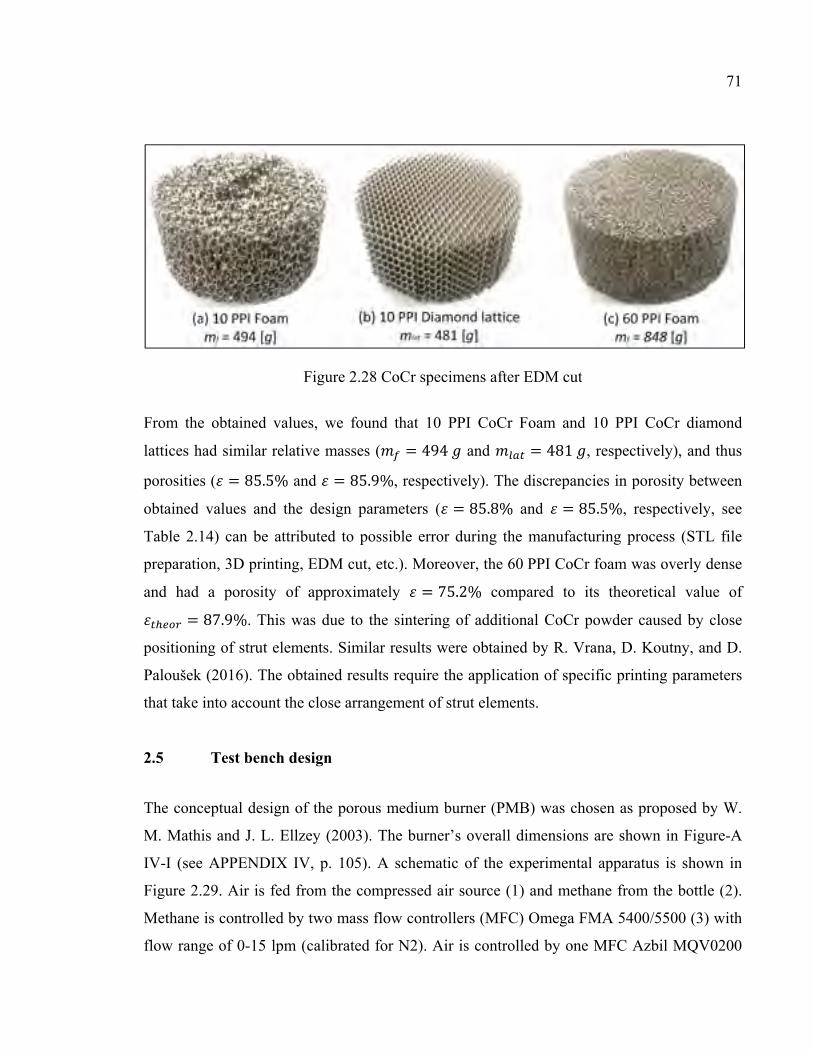
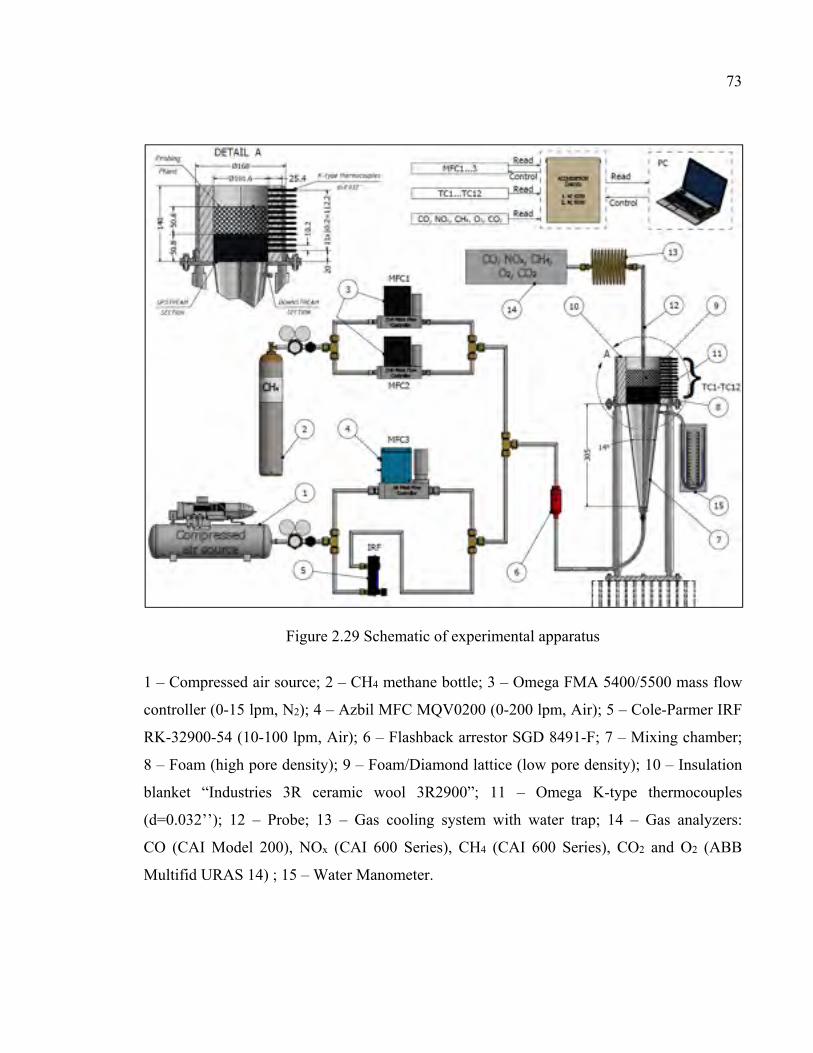
CHAPTER 2 METHODOLOGY ....................................................................................27 2.1 Selection of porous materials and definition of experimental setups ..........................27
2.1.1 Overview of ceramic foams ...................................................................... 27 2.1.2 Selection of foams and alternative ordered porous structures .................. 29 2.1.3 Definition of the experimental setups ....................................................... 32
Table 2.2 Results of measurements using Archimedes’ principle ...................................38
Table 2.3 Parameters of reconstructed solids in VG ........................................................39
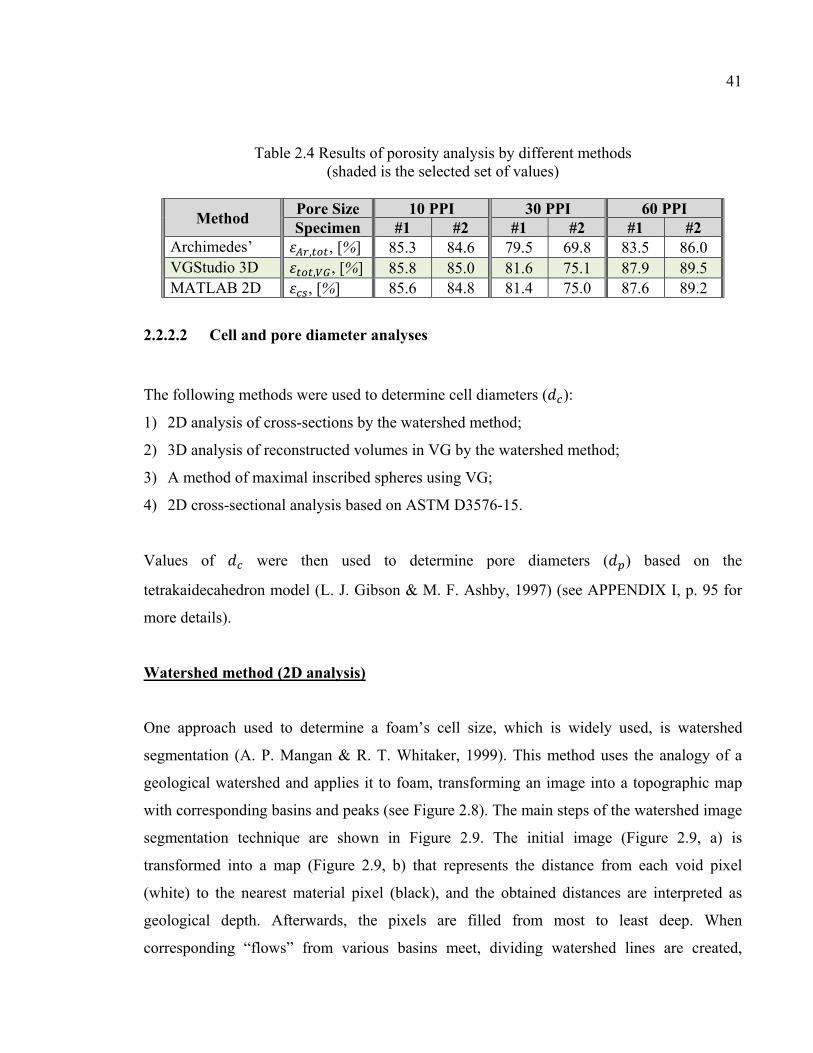
Table 2.4 Results of porosity analysis by different methods (shaded is the selected set of values) ....................................................................................................41
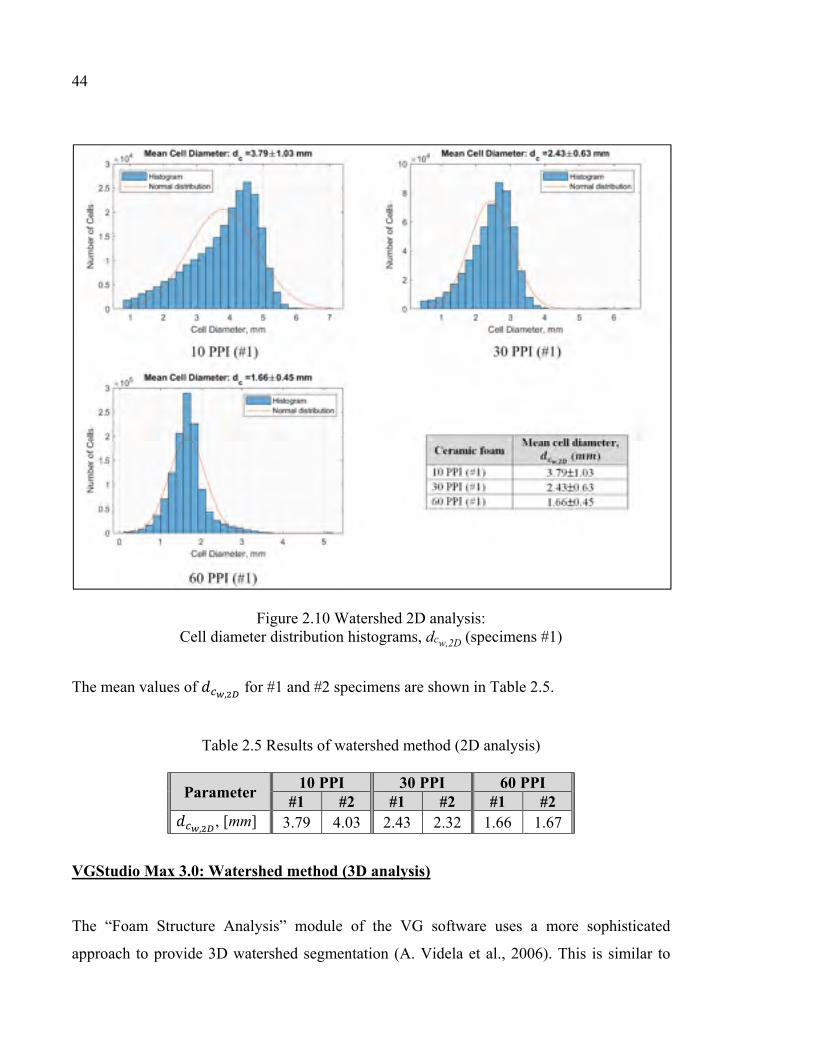
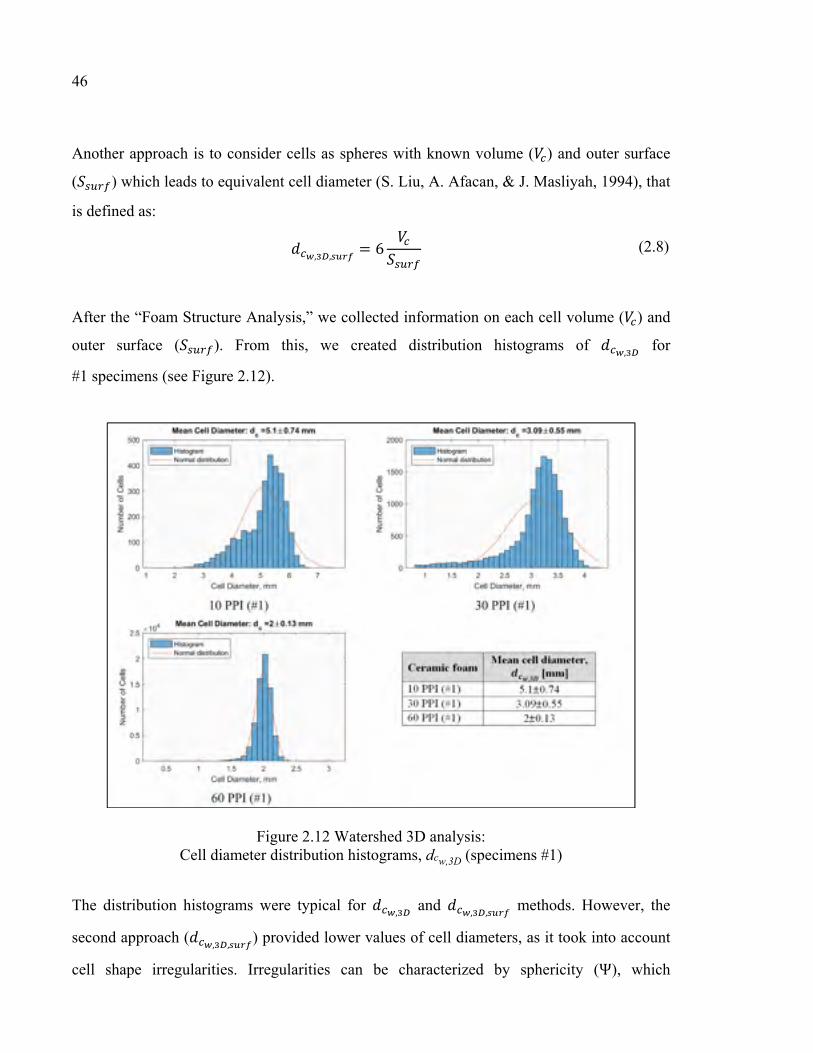
Table 2.5 Results of watershed method (2D analysis) .....................................................44
Table 2.6 Results of watershed method (3D analysis) .....................................................47
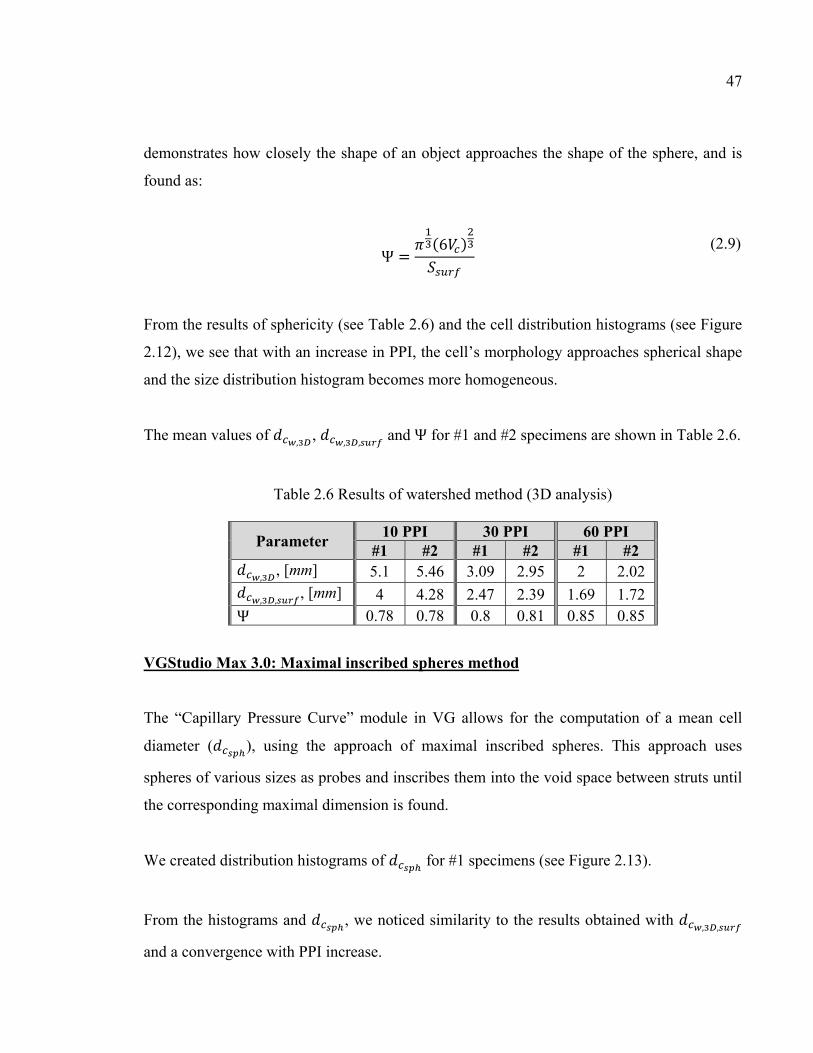
Table 2.7 Results of maximal inscribed spheres method (VG) .......................................48
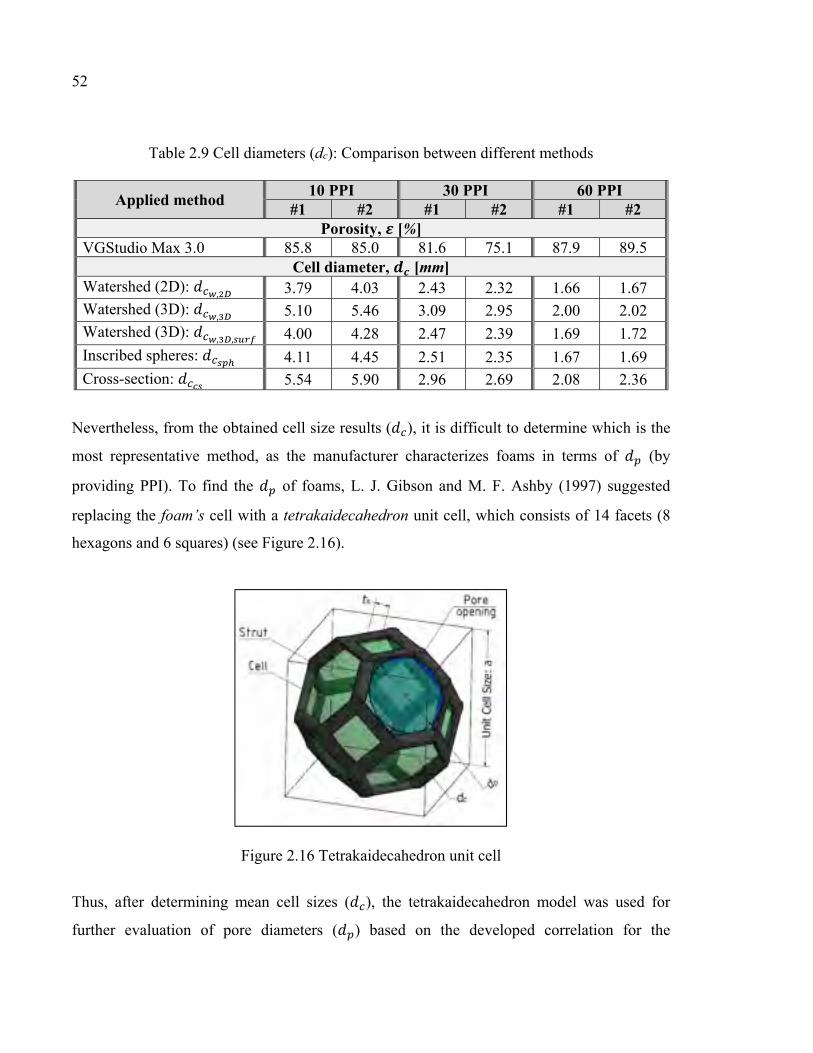
Table 2.9 Cell diameters (dc): Comparison between different methods ..........................52
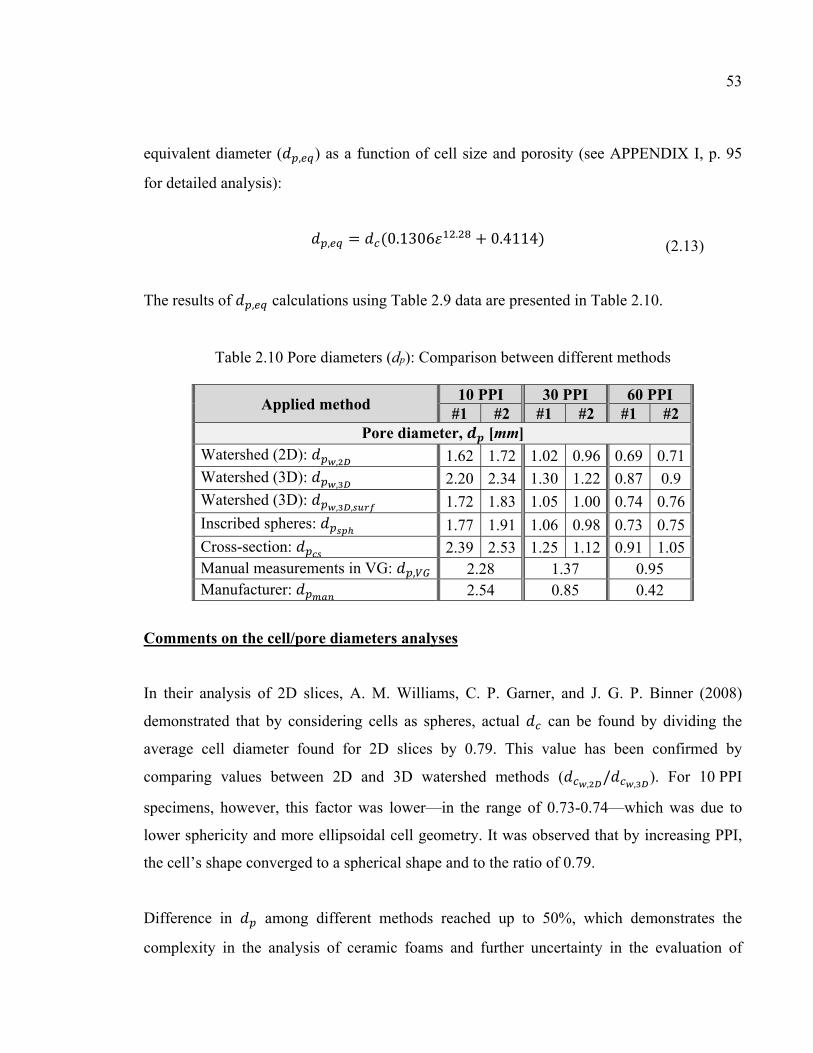
Table 2.10 Pore diameters (dp): Comparison between different methods .........................53
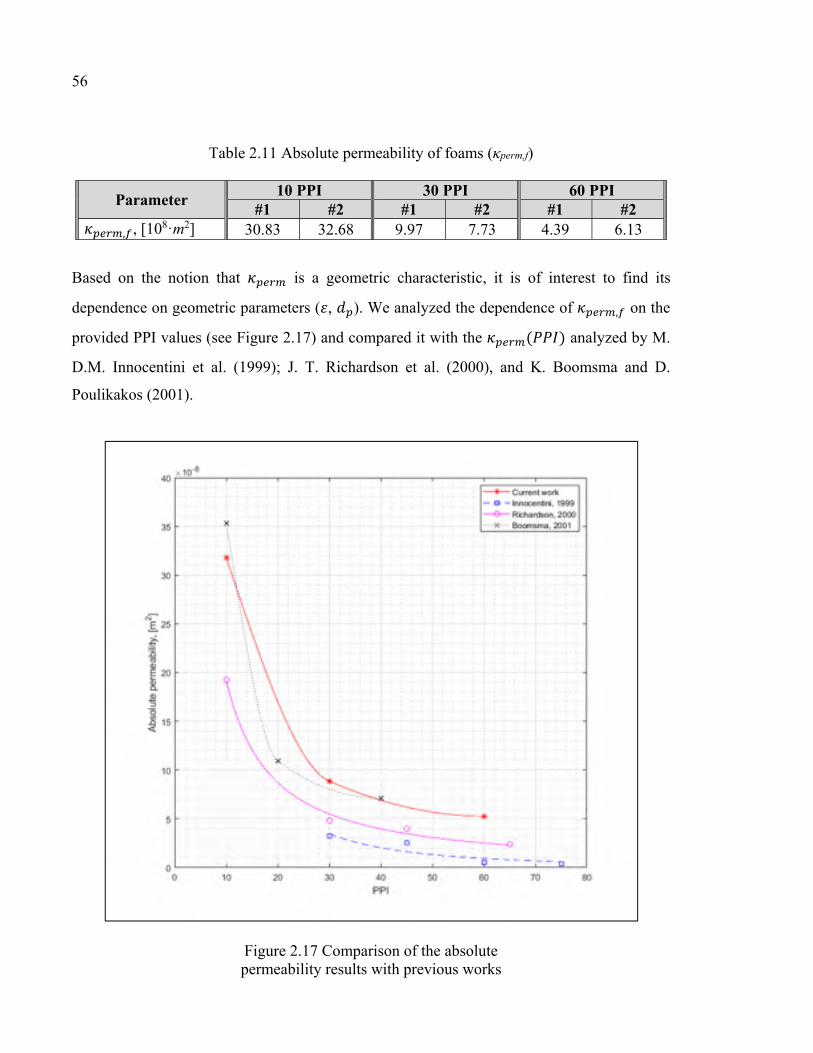
Table 2.11 Absolute permeability of foams (κperm,f) ..........................................................56
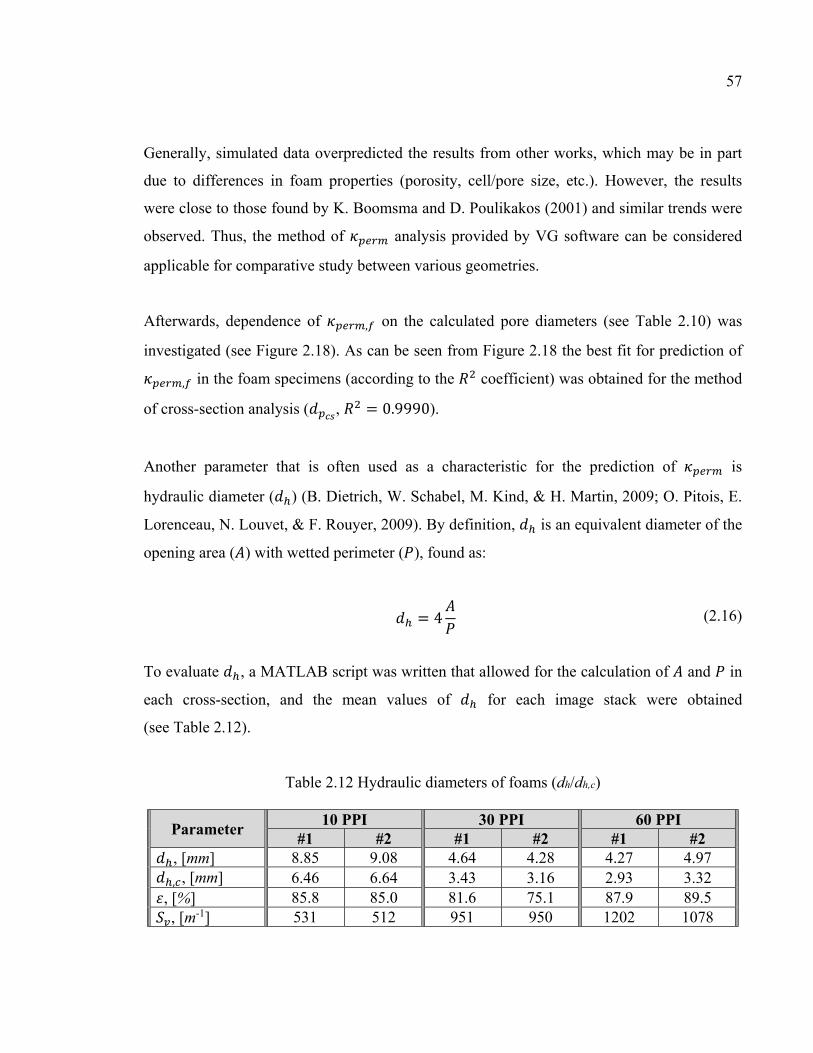
Table 2.12 Hydraulic diameters of foams (dh/dh,c) .............................................................57
Table 2.13 Parameters of equivalent diamond lattices ......................................................65
Table 2.14 Final design parameters of diamond lattices and parameters of their foam equivalents .......................................................................................................67
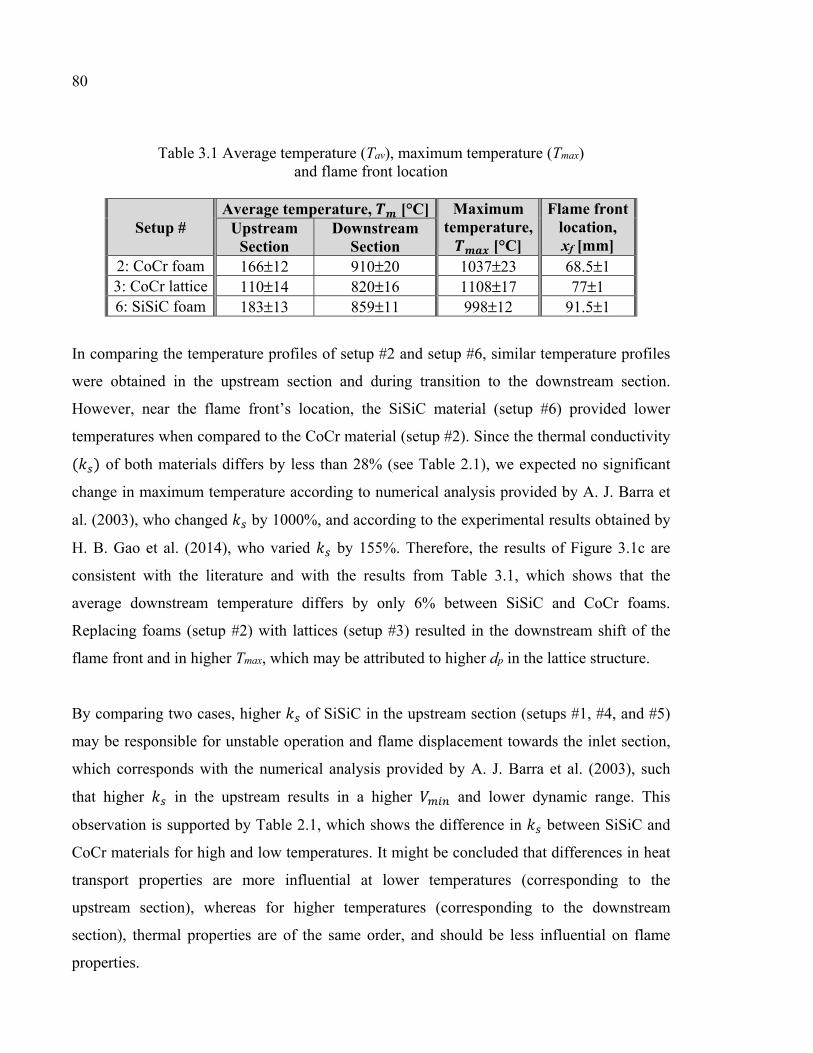
Table 3.1 Average temperature (Tav), maximum temperature (Tmax) and flame front location .............................................................................................................80
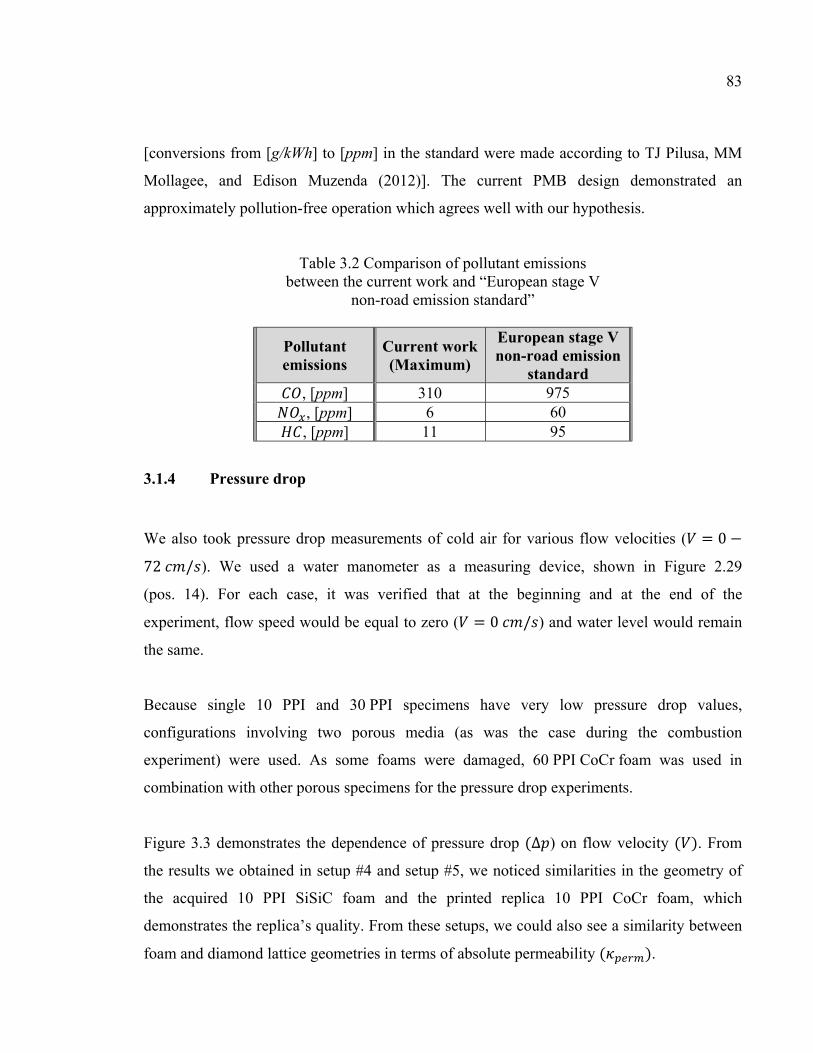
Table 3.2 Comparison of pollutant emissions between the current work and “European stage V non-road emission standard” ............................................83
Table 3.3 Pore diameters of specimens ............................................................................84
LIST OF FIGURES
Page
Figure 1.1 CH4/air mixture: influence of equivalence ratio ϕ on laminar flame speed
SL (P. Ouimette & P. Seers, 2009) and flame temperature Tad (R. Stone, A. Clarke, & P. Beckwith, 1998) ................................................6
Figure 1.2 Pollutant emissions of NOx, CO and UHC as a function of fuel/air equivalence ratio Adapted from J. B. Heywood (1988) ....................................7
Figure 1.3 Heat transport in the two-stage porous burner Taken from F. Avdic (2004) ..............................................................................9
Figure 1.4 Stability diagram for CGB and PMB (CH4/air) Adapted from S. R. Turns (2000) ....................................................................10
Figure 1.5 Section Cut of the Weinberg Burner Adapted from A. R. Jones, S. A. Lloyd, and F. J. Weinberg (1978) ...............11
Figure 1.6 Influence of various parameters on Pecr ..........................................................18
Figure 1.7 Advantages of PMB .........................................................................................24
Figure 2.1 Definition of “pore,” “cell,” and “strut” Adapted from ERG Materials and Aerospace Corp. .......................................28
Figure 2.2 Flowchart of the ceramic foam manufacturing process Adapted from A. Ortona, C. D'Angelo, et al. (2012) .......................................29
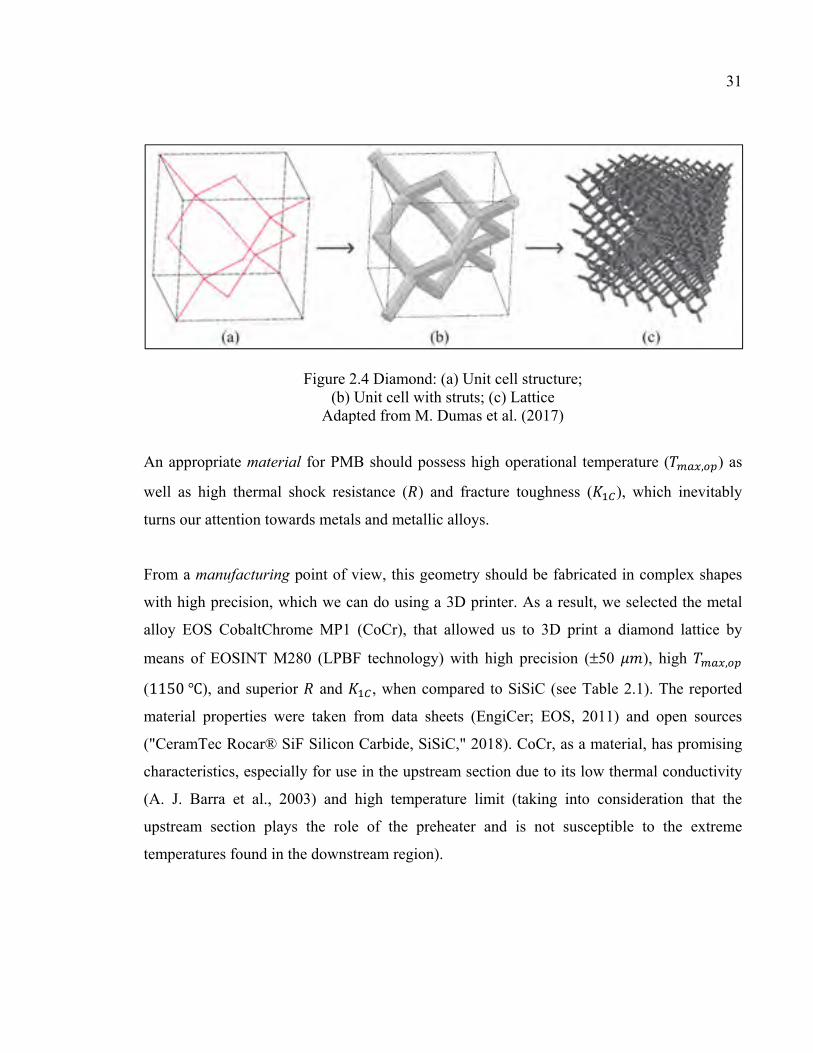
Figure 2.4 Diamond: (a) Unit cell structure; (b) Unit cell with struts; (c) Lattice Adapted from M. Dumas et al. (2017) .............................................................31
Figure 2.5 Tree of experimental setups .............................................................................33
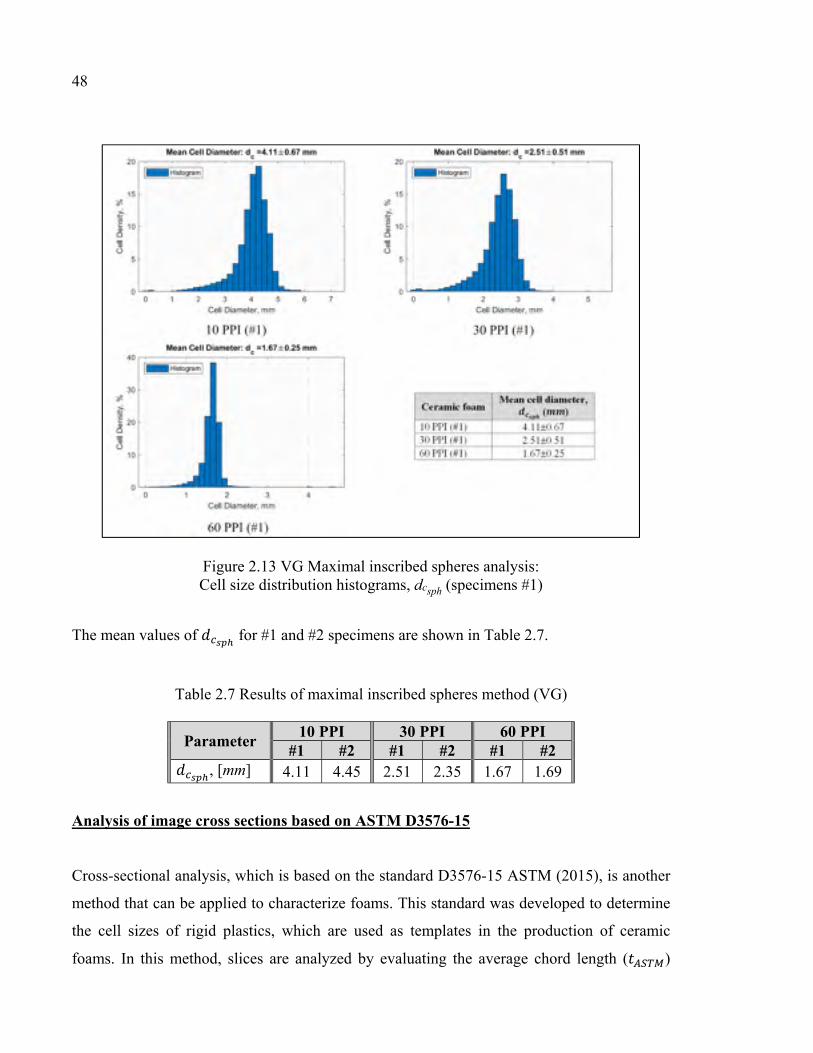
Figure 2.14 Determination of dc,ASTM according to D3576-15 ASTM (2015) (10 PPI #1 foam) ..............................................................................................49
Figure 2.15 Cross-sectional 2D analysis according to D3576-15 ASTM (2015): Cell diameter distribution histograms, dc (specimens #1) ...............................50
Figure 2.16 Tetrakaidecahedron unit cell ............................................................................52
Figure 2.17 Comparison of the absolute permeability results with previous works ...........56
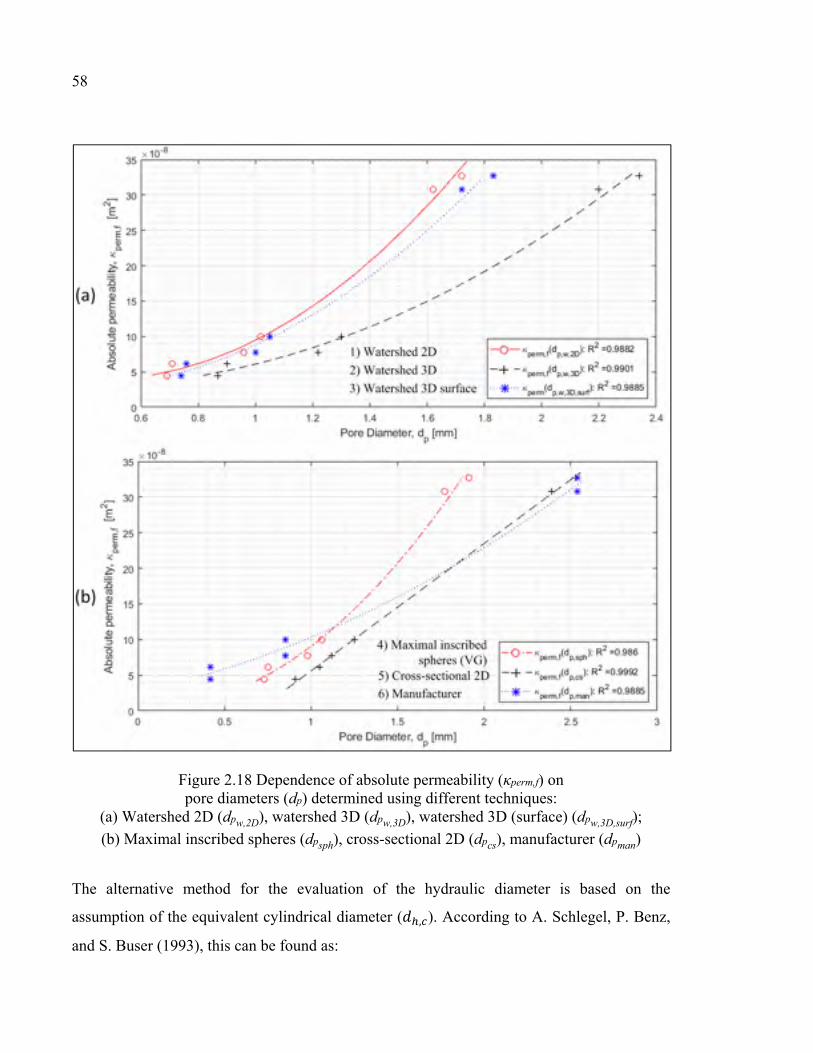
Figure 2.18 Dependence of absolute permeability (κperm,f) on pore diameters (dp) determined using different techniques: (a) Watershed 2D (dpw,2D), watershed 3D (dpw,3D), watershed 3D (surface)
Figure 2.19 Dependence of absolute permeability (κperm) on hydraulic diameters (dh) ......60
Figure 2.20 Voxelization and lattice generation : (a) Input data: volume domain and unit cell definition; (b) voxelization and voxel replacement; (c) lattice generation Adapted from B. Jetté et al. (2018) ................................61
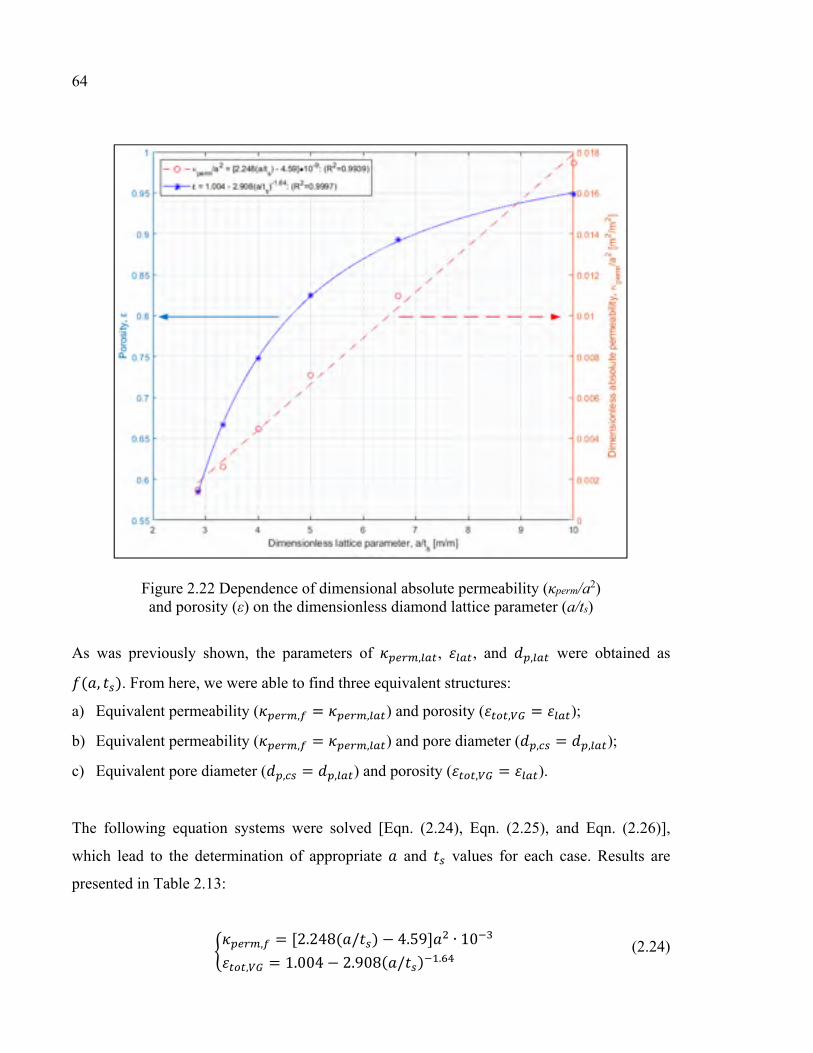
Figure 2.22 Dependence of dimensional absolute permeability (κperm/a2) and porosity (ε) on the dimensionless diamond lattice parameter (a/ts) .................64
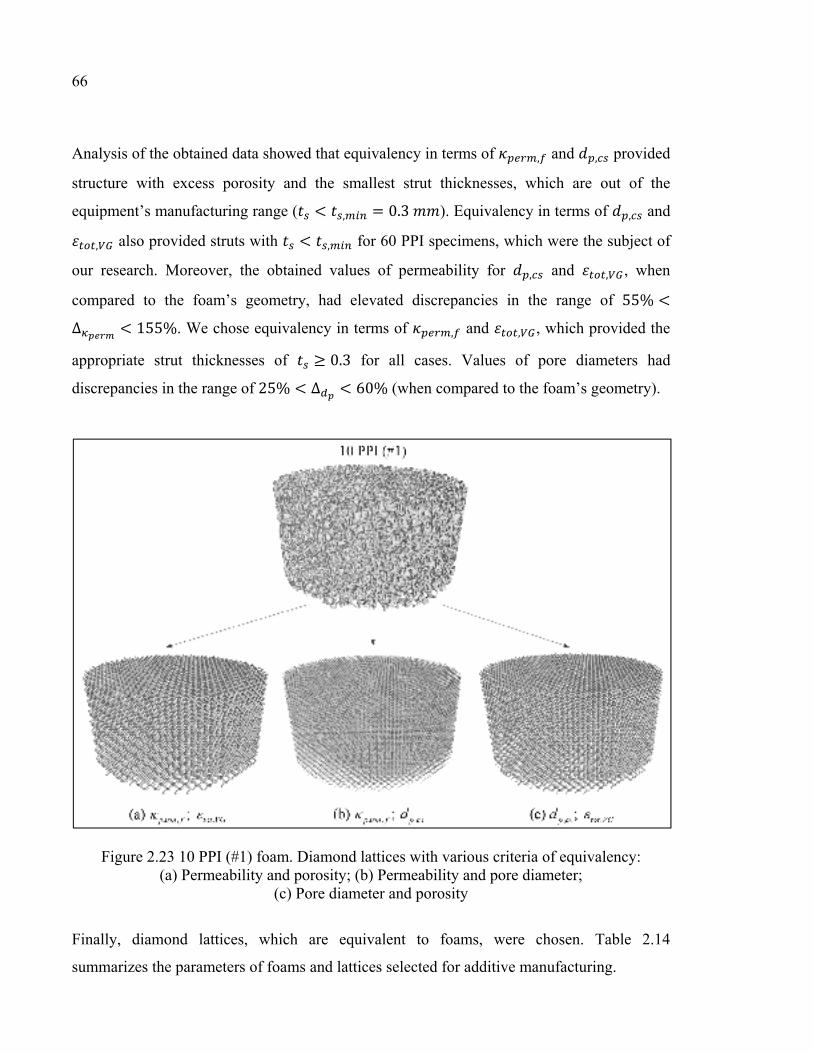
Figure 2.23 10 PPI (#1) foam. Diamond lattices with various criteria of equivalency: (a) Permeability and porosity; (b) Permeability and pore diameter; (c) Pore diameter and porosity .........................................................................66
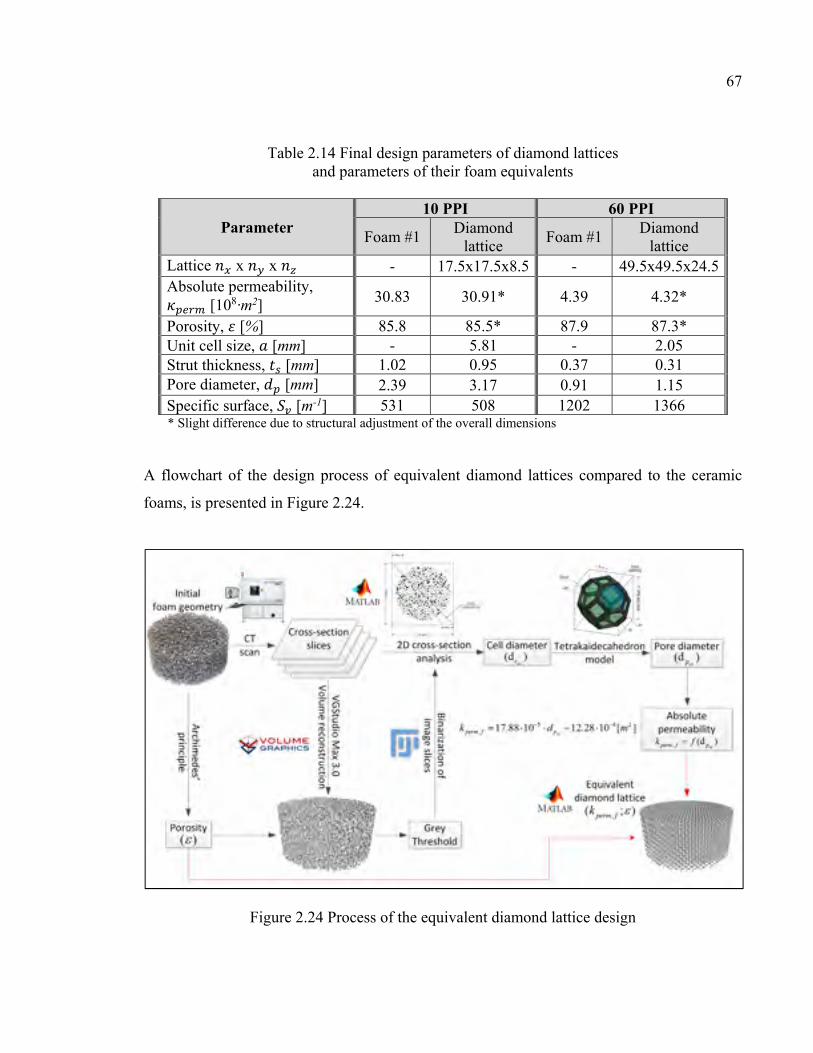
Figure 2.24 Process of the equivalent diamond lattice design ............................................67
XVII
Figure 2.25 Dependence of dimensionless absolute permeability (κperm/a2) on dimensionless specific surface (Sv·a) ...............................................................68
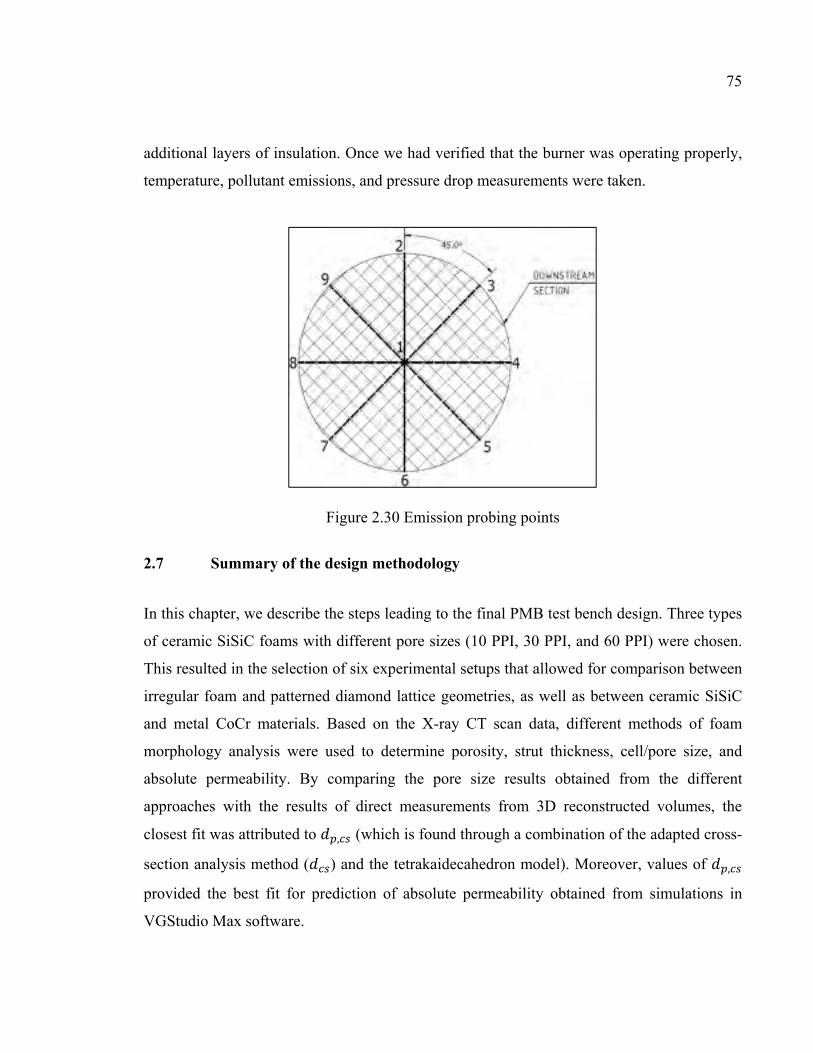
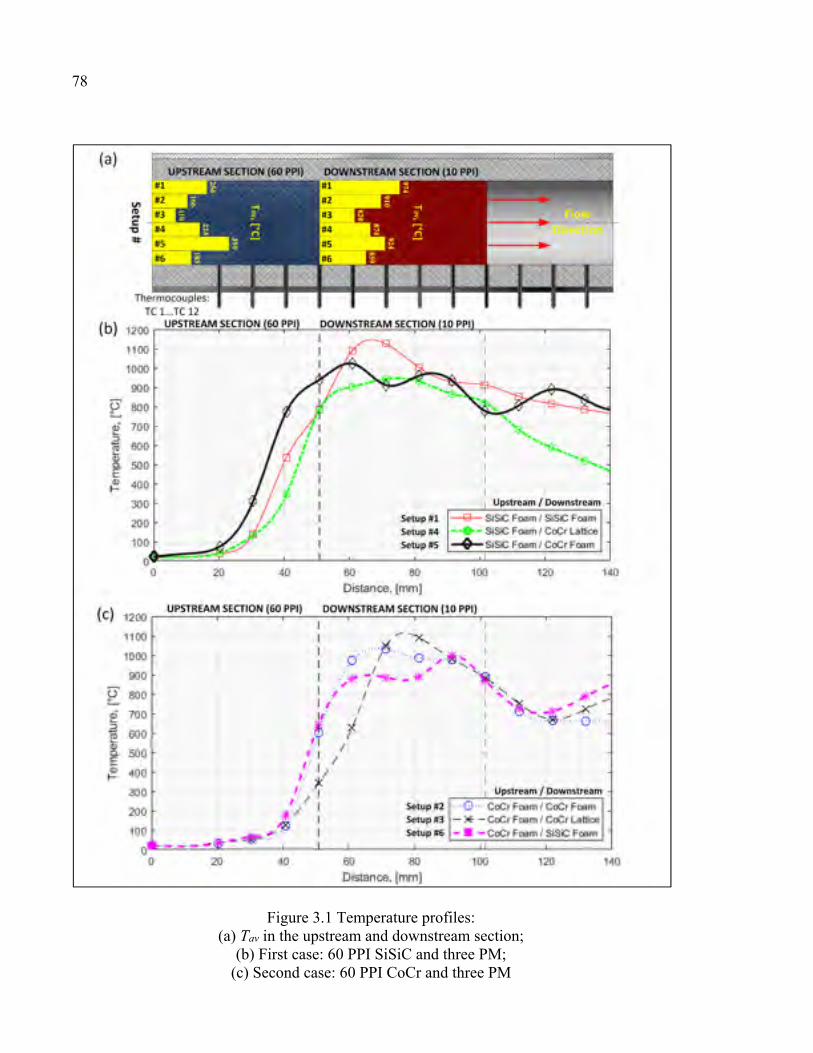
Figure 3.1 Temperature profiles: (a) Tav in the upstream and downstream section; (b) First case: 60 PPI SiSiC and three PM; (c) Second case: 60 PPI CoCr and three PM ...................................................78
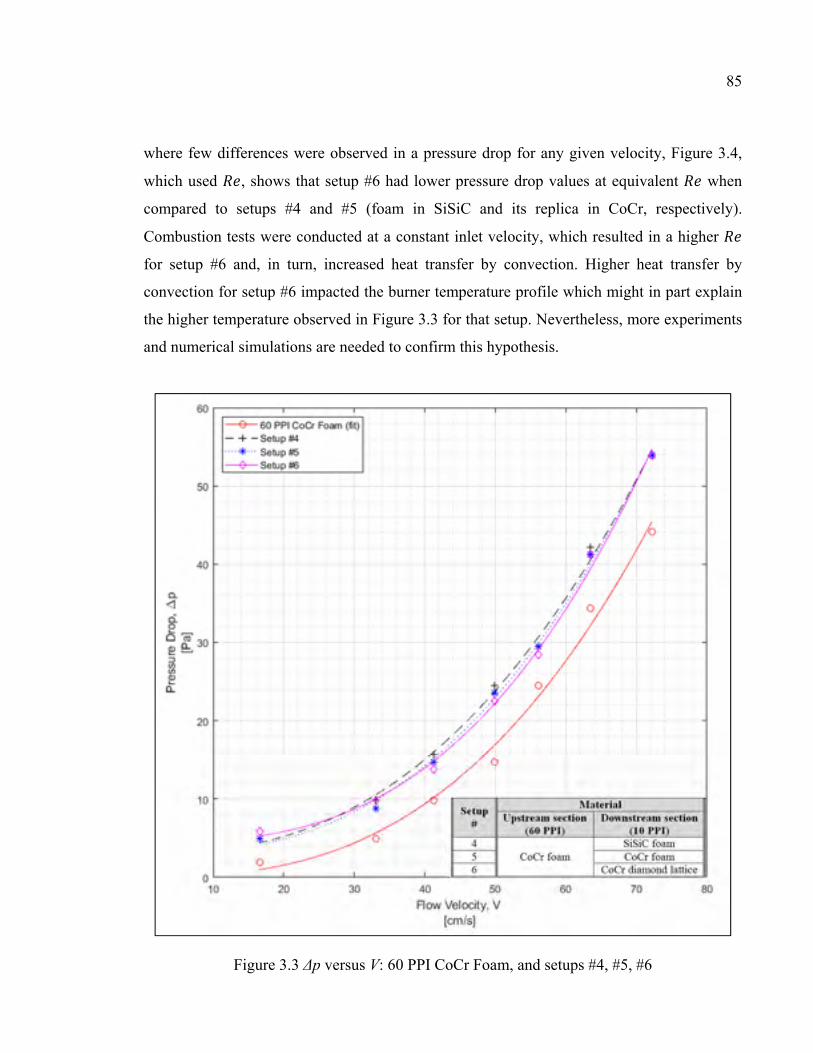
Figure 3.3 Δp versus V: 60 PPI CoCr Foam, and setups #4, #5, #6 ..................................85
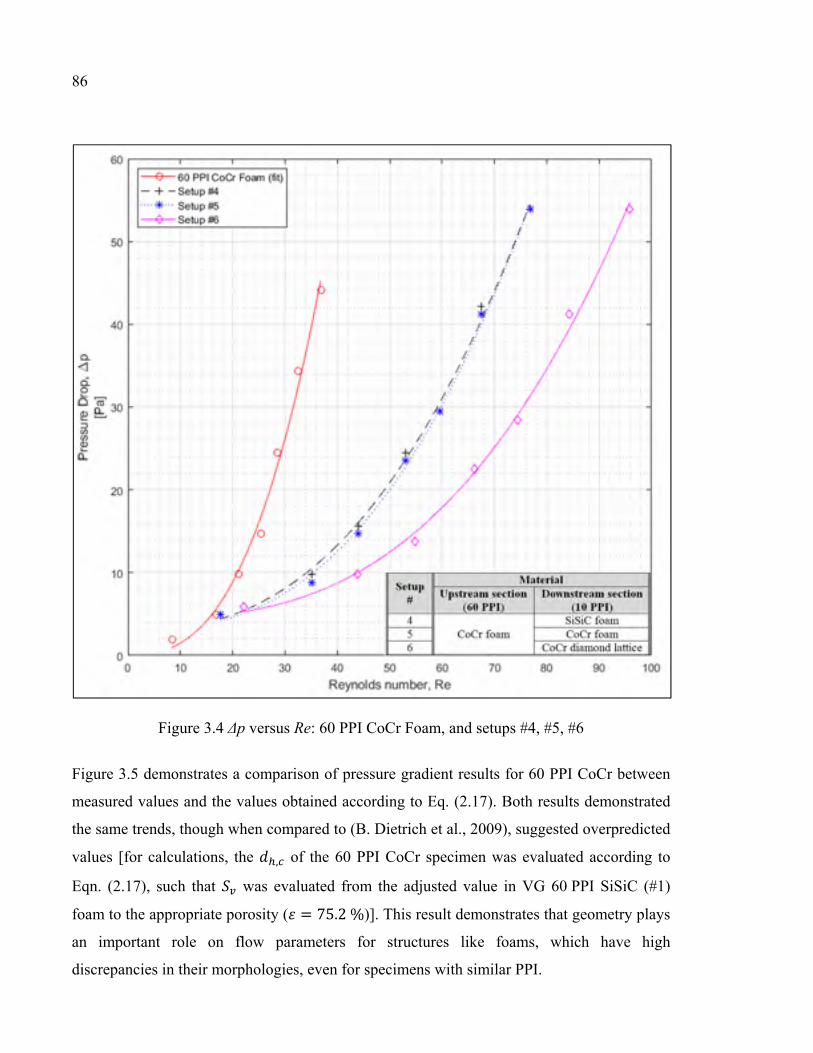
Figure 3.4 Δp versus Re: 60 PPI CoCr Foam, and setups #4, #5, #6 ................................86
Figure 3.5 Δp/L: Comparing the results of the current study and those of B. Dietrich et al. (2009) ...................................................................................87
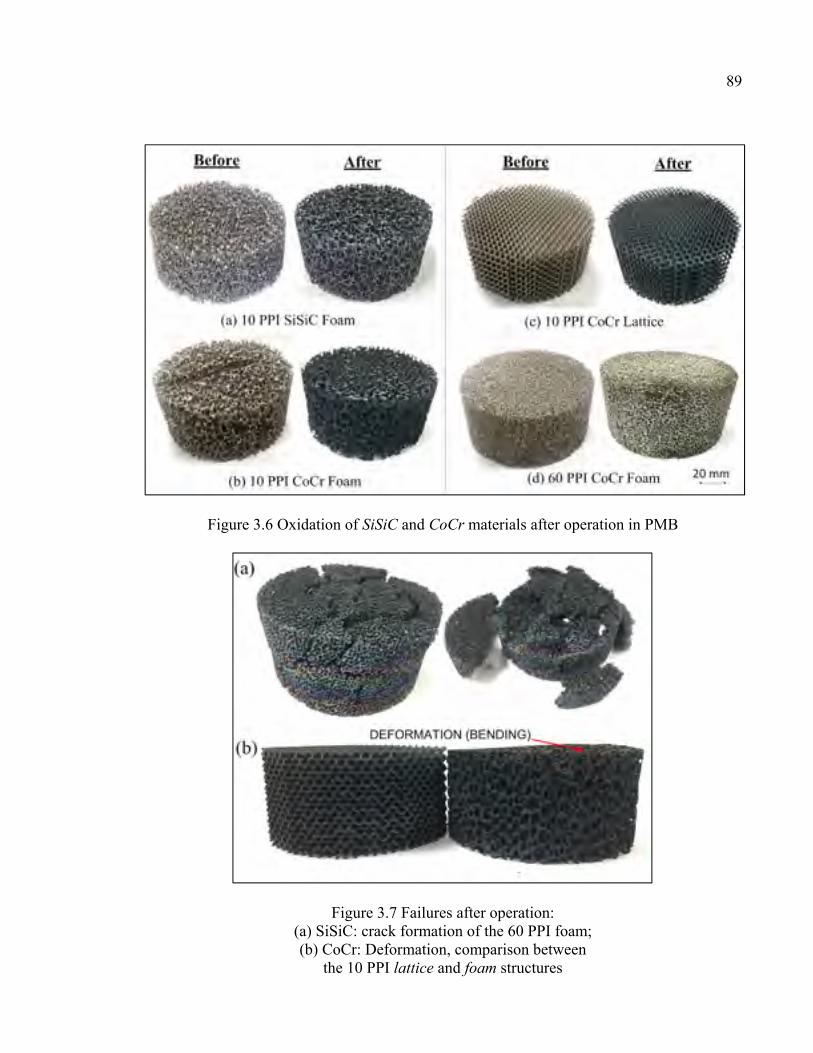
Figure 3.6 Oxidation of SiSiC and CoСr materials after operation in PMB .....................89
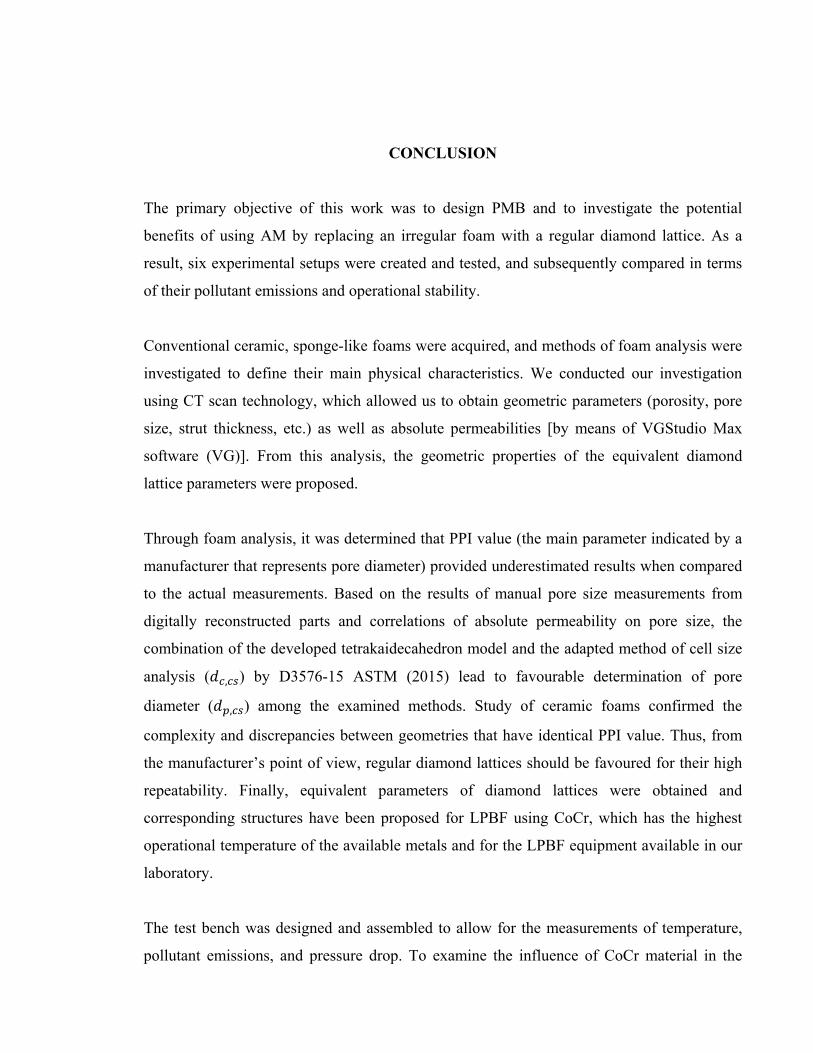
Figure 3.7 Failures after operation: (a) SiSiC: crack formation of the 60 PPI foam; (b) CoCr: Deformation, comparison between the 10 PPI lattice and foam structures ..........................................................................................................89
LIST OF ABREVIATIONS AND ACRONYMS 3D Three-dimensional
2D Two-dimensional
AM Additive manufacturing
BFG Blas furnace gas
BGG Biogas-gasified gas
CAD Computer aided design
CGB Conventional gas burner
Co Cobalt
Cr Chrome
CT Computed tomography
EDM Electrical discharge machining
GHG Greenhouse gas
HC Hydrocarbons
LCG Low calorific gas
LG Landfill gas
LPBF Laser powder bed fusion
LPG Liquefied petroleum gas
PM Porous medium
PMB Porous medium burner
PPC Pores per centimeter
PPI Pores per inch
SLM Selective laser melting
SiSiC Silicon-silicon carbide
UHC Unburned hydrocarbons
VG VGStudio Max 3.0 software
LIST OF SYMBOLS AND UNITS OF MEASUREMENT Symbols, Latin Letters
[m2] Area [m2] Cell area
A/F [-] Air-fuel ratio [m] Unit cell size [J/K] Specific heat capacity [m] Diameter [m2/s] Mass diffusivity [m] Cell diameter [m] Hydraulic diameter [m] Pore diameter [GPa] Young’s modulus
[J] Ignition energy [-] Forchheimer coefficient
[-] Flame-speed ratio ℎ [W/(m3·K)] Volumetric heat transfer coefficient [MPa·m1/2] Fracture toughness
[W/(m·K)] Thermal conductivity [m] Length
Le [-] Lewis number [m] Length of the reference line
[kg] Mass [-] Number of intersections
, , [-] Number of unit cells in x-, y-, z-direction P [m] Perimeter Pe [-] Péclet number
Based on the cross-section slice method eff Effective eq Equivalent f Foam g gas
XXIII
hex hexagon lat Diamond lattice m Mean
man Manufacturer max maximum min minimum op Open
oper operational ref reference s solid
stoic Stoichiometric ℎ Based on the maximal inscribed sphere method sq Square tetr tetrakaidecahedron tot Total uc Unit cell
Water , 2 Based on the watershed method of 2D image slices , 3 Based on the watershed method of 3D volume , 3 , Based on the watershed method of 3D volume and cell outer surface
INTRODUCTION
0.1 The problem at hand
More stringent emission standards and the depletion of natural resources require the
development of advanced combustion techniques. Through numerous research efforts, the
application of porous medium burners (PMB) has been proven as advantageous, since these
PMBs provide higher thermal efficiency, lower pollutant emissions, and use less fuel in
comparison to conventional gas burners (CGB) (M. A. Mujeebu, M. Z. Abdullah, M. Z. A.
Bakar, & A. A. Mohamad, 2011). These burners also provide the possibility of burning low-
calorific fuels and lean fuel/air mixtures, which are normally nonflammable (S. Wood & A.
T. Harris, 2008). These days, PMBs have widespread industrial (GoGas, 2008) and
household (F. Avdic, 2004) applications. The most investigated design is the two-section
PMB design composed of ceramic reticulated foams, where the upstream region with small
pores acts as a flame arrestor and a preheater of incoming gases, and the downstream section
with large pores provides flame support and heat recirculation in the porous medium (PM)
(M. A. Mujeebu et al., 2009).
Various approaches of numerical analysis have been undertaken to predict the performance
of ceramic foams and optimize their geometry (A. P. Horsman, 2010). However, non-
uniform cell size distribution (J. T. Richardson, Y. Peng, & D. Remue, 2000) and low
repeatability among specimens of the same type (J. Grosse et al., 2009) lead to difficulty in
evaluating heat transport properties and combustion processes. Though ceramic foams can
withstand high operational temperatures and provide good heat recirculation, they are subject
to thermal shock and structural failures (V. R. Vedula, D. J. Green, & J. R. Hellman, 1999),
which might influence the operational stability of the burner.
0.2 Proposed solution
For this reason, the development and application of porous structures with organized and
definite morphology represent great potential for achieving the optimum characteristics in
2
PMB designs. The diamond lattice is one such morphology which has been previously
studied in the laboratory of LAMSI (M. Dumas, P. Terriault, & V. Brailovski, 2017). For the
production of such complex shapes, it is recommended to use additive manufacturing (AM)
technology. In terms of the material, CoCr alloy, which is designed for application at
elevated temperatures (≤ 1150℃), is considered a good candidate for the replacement of
ceramics given its better resistance to thermal shock and crack propagation.
0.3 Research objective
The research objective of this study was defined as follows:
Study the impact of the material properties and porous media (PM) geometry on the
performances of additively manufactured porous medium burners.
To reach this general objective, specific project objectives were specified as follows:
1) Analyze conventional ceramic foams using advanced visualization and image treatment
techniques;
2) Design diamond lattice PM with flow characteristics similar to those of the conventional
ceramic foams
3) Manufacture the diamond lattice PM using laser powder bed fusion (LPBF) additive
manufacturing technique;
4) Compare, experimentally, the performances of the foam and diamond lattice PMBs made
of two different materials (SiSiC ceramics and CoCr metallic alloy).
0.4 Organization of the thesis
The first chapter presents a literature review which familiarizes the reader with combustion
fundamentals and introduces the principles of PMB operation. The main parameters that
emissions, etc.) are also discussed. The second chapter describes our motivation for the
selection of our experimental setups, allowing comparison between foam and diamond lattice
geometries as well as between ceramic and CoCr materials. This chapter will discuss
3
methods of foam analysis based on CT scan data and approaches in designing the equivalent
diamond lattices with further production by means of AM. We also describe the test bench
assembly and the equipment used. The third chapter explains the experimental proceedings
of six experimental setups and presents the results of temperature, pollutant emissions, and
pressure drop measurements, as well as the assessment of PM structural durability after
burning tests. The conclusion section provides a summary of the work, and the
recommendation section proposes the next steps needed for advancement in the development
of PMBs.
CHAPTER 1
LITERATURE REVIEW
1.1 Combustion fundamental principles
Combustion is a chemical reaction between a fuel and an oxidizer which normally generate
heat and light in the form of a flame. Flames can be divided into two types: premixed flames
and diffusion flames. Premixed flames are formed by mixing fuel and oxidizer prior to
entering the combustion zone, whereas diffusion flames are formed by diffusion at the border
between fuel and oxidizer, such that mixing and combustion occur simultaneously (F. El-
Mahallawy & S. El-Din Habik, 2002). This thesis only examines premixed combustion.
Moreover, in the majority of cases, methane/air ( / ) mixtures are assumed, if not
specified otherwise. This is dictated by the fact that natural gas is primarily composed of
methane, and the majority of experiments are undertaken with this gas.
An important characteristic that defines mixture composition is the equivalence ratio ( ).
This ratio indicates whether combustion occurs for the fuel-lean ( < 1), stoichiometric
( = 1), or fuel-rich ( > 1) mixtures and is represented by:
= ( / )( / ) (1.1)
where / = / is the air-fuel ratio.
Another essential feature is laminar flame speed ( ), which defines the speed of chemical
reaction between reactants, and is equal to the unburned reactants’ velocity ( ) at stationary
condition. Figure 1.1 shows the dependence of equivalence ratio on laminar flame speed
and adiabatic flame temperature ( ). Laminar flame speed is directly dependent on flame
temperature. Both and maximums are attributed for a slightly rich mixture and drop
on both sides. The flammability limit < < is the point at which combustion
6
can be sustained. Beyond these limits, the energy release of combustion is lower than the
required ignition energies ( ), and insufficient to provide self-sustaining flames (C. E.
Baukal Jr., 2012). Preheating reactants lowers the required and allows for extending
flammability limits (B. Dikici, M. L. Pantoya, & V. Levitas, 2010).
Figure 1.1 CH4/air mixture: influence of equivalence ratio ϕ on laminar flame speed SL (P. Ouimette & P. Seers, 2009) and
flame temperature Tad (R. Stone, A. Clarke, & P. Beckwith, 1998)
Another important characteristic of flame is the formation of species in combustion products.
Below is the theoretical combustion equation for stoichiometric ( = 1) Eqn. (1.2), fuel-lean
( < 1) Eqn. (1.3) and fuel-rich ( ≥ 1) Eqn. (1.4) mixtures (S. McAllister, J.-Y. Chen, &
A.C. Fernandez-Pello, 2011).
7
+ 2( + 3.76 ) → + 2 + 7.52 (1.2)
+ 2 ( + 3.76 ) → + 2 + 7.52 + 2(1 − ) (1.3)
+ 2 ( + 3.76 ) → 1 + 2 + 7.52 + (1 − 1) (1.4)
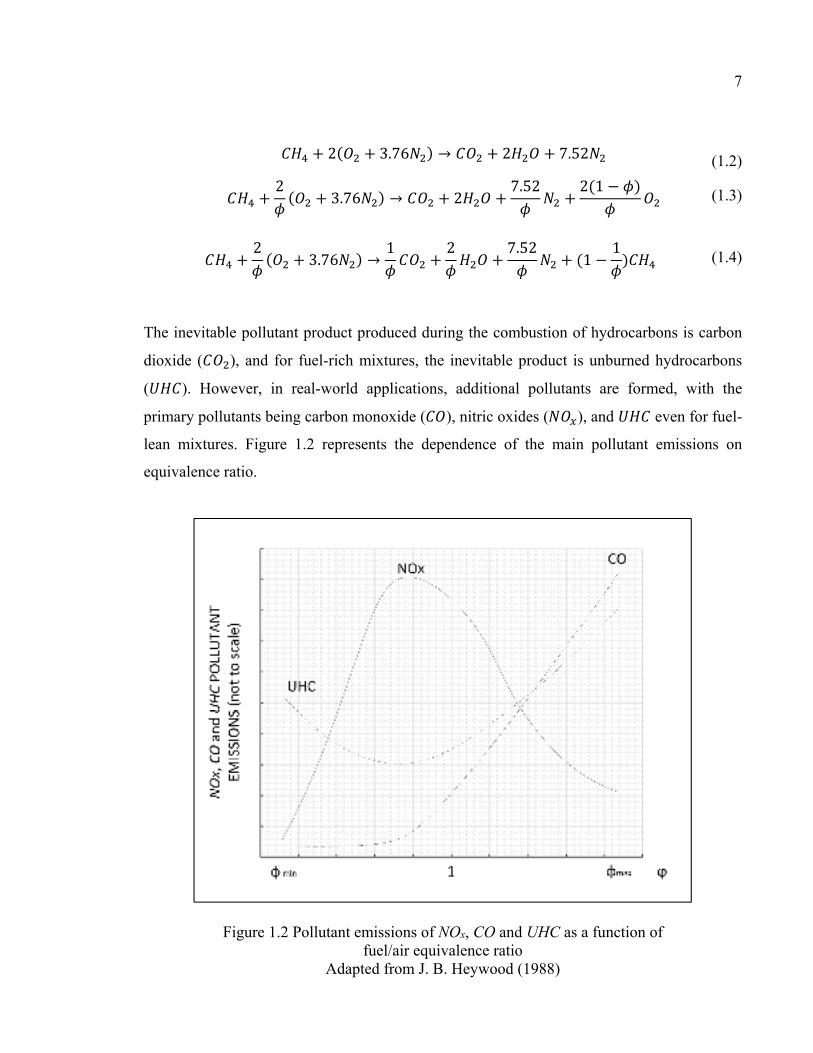
The inevitable pollutant product produced during the combustion of hydrocarbons is carbon
dioxide ( ), and for fuel-rich mixtures, the inevitable product is unburned hydrocarbons
( ). However, in real-world applications, additional pollutants are formed, with the
primary pollutants being carbon monoxide ( ), nitric oxides ( ), and even for fuel-
lean mixtures. Figure 1.2 represents the dependence of the main pollutant emissions on
equivalence ratio.
Figure 1.2 Pollutant emissions of NOx, CO and UHC as a function of fuel/air equivalence ratio
Adapted from J. B. Heywood (1988)
8
Formation of is mainly attributed to fuel-rich mixtures, and their concentration drops
considerably by burning leaner mixtures (S. R. Turns, 2000). Formation of is also
mainly attributed to fuel-rich combustion, though levels increase, while approaching
flammability limits and quenching distances (S. R. Turns, 2000). formation in the
premixed combustion of hydrocarbons is attributed for two main mechanisms. One is prompt
, which occurs at low temperatures for fuel-rich mixtures, and the other is thermal , which occurs at high temperatures ( > 1600℃) (S. R. Turns, 2000). Combustion in PMB,
due to burning leaner mixtures and high radiant emissions from the porous medium (PM),
results in lower flame temperatures and, as a result, lower formation (S. Gauthier, A.
Nicolle, & D. Baillis, 2008; A. Williams, R. Woolley, & M. Lawes, 1992).
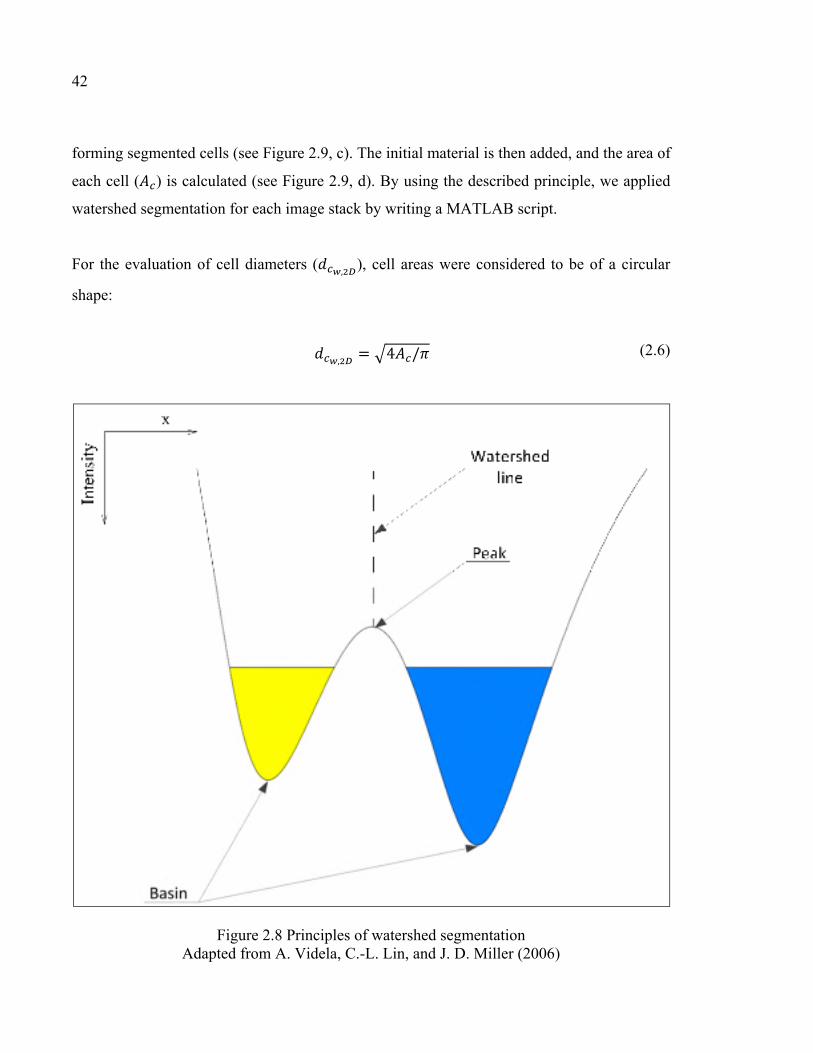
1.2 Basic porous foam burner
In this section, we present the operating principles and research findings associated with
combustion in porous medium burners.
Conventional gas burners (CGB) directly burn the incoming mixture by producing free open
flames and releasing heat through a chemical reaction between fuel and oxidizer. PMB can
be considered a modified CGB with an intermediary material allowing for the passage of the
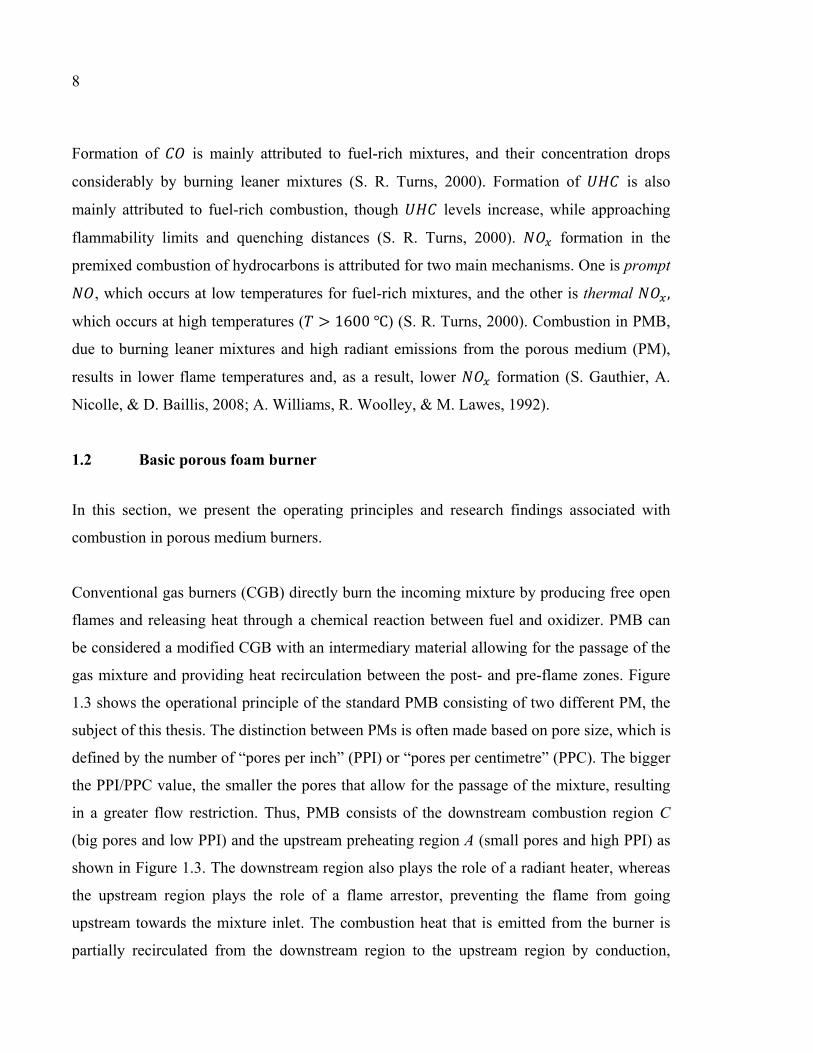
gas mixture and providing heat recirculation between the post- and pre-flame zones. Figure
1.3 shows the operational principle of the standard PMB consisting of two different PM, the
subject of this thesis. The distinction between PMs is often made based on pore size, which is
defined by the number of “pores per inch” (PPI) or “pores per centimetre” (PPC). The bigger
the PPI/PPC value, the smaller the pores that allow for the passage of the mixture, resulting
in a greater flow restriction. Thus, PMB consists of the downstream combustion region C
(big pores and low PPI) and the upstream preheating region A (small pores and high PPI) as
shown in Figure 1.3. The downstream region also plays the role of a radiant heater, whereas
the upstream region plays the role of a flame arrestor, preventing the flame from going
upstream towards the mixture inlet. The combustion heat that is emitted from the burner is
partially recirculated from the downstream region to the upstream region by conduction,
9
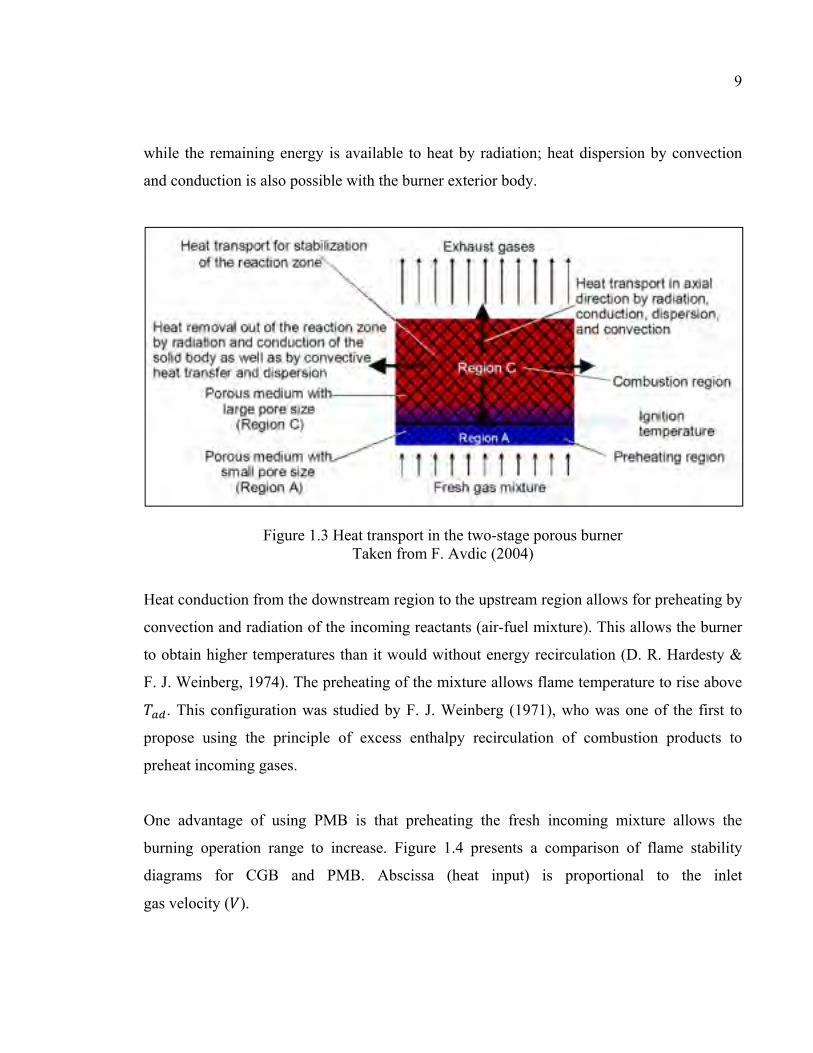
while the remaining energy is available to heat by radiation; heat dispersion by convection
and conduction is also possible with the burner exterior body.
Figure 1.3 Heat transport in the two-stage porous burner Taken from F. Avdic (2004)
Heat conduction from the downstream region to the upstream region allows for preheating by
convection and radiation of the incoming reactants (air-fuel mixture). This allows the burner
to obtain higher temperatures than it would without energy recirculation (D. R. Hardesty &
F. J. Weinberg, 1974). The preheating of the mixture allows flame temperature to rise above
. This configuration was studied by F. J. Weinberg (1971), who was one of the first to
propose using the principle of excess enthalpy recirculation of combustion products to
preheat incoming gases.
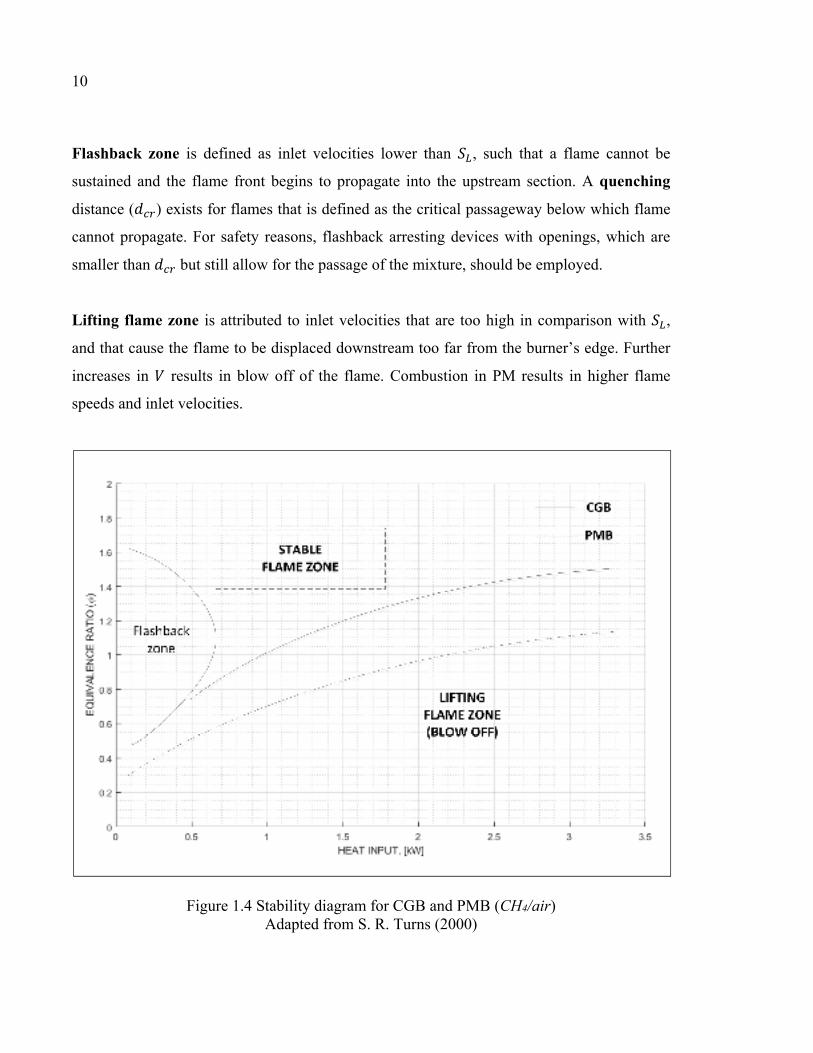
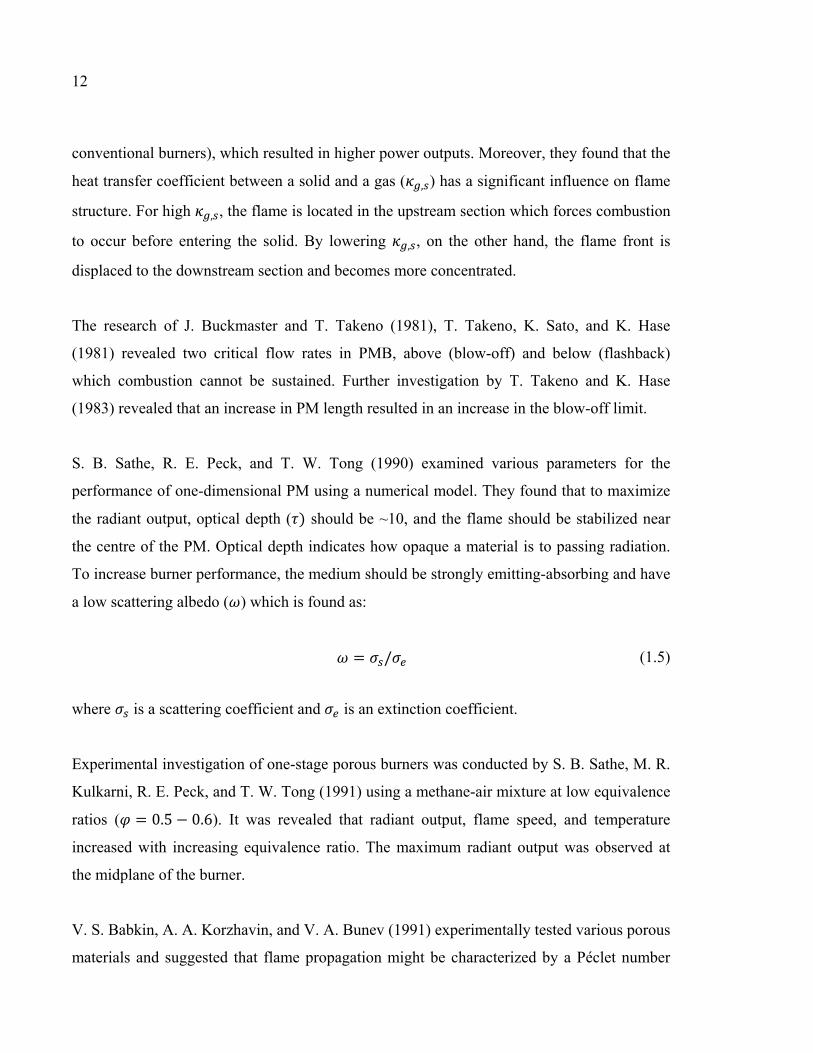
One advantage of using PMB is that preheating the fresh incoming mixture allows the
burning operation range to increase. Figure 1.4 presents a comparison of flame stability
diagrams for CGB and PMB. Abscissa (heat input) is proportional to the inlet
gas velocity ( ).
10
Flashback zone is defined as inlet velocities lower than , such that a flame cannot be
sustained and the flame front begins to propagate into the upstream section. A quenching
distance ( ) exists for flames that is defined as the critical passageway below which flame
cannot propagate. For safety reasons, flashback arresting devices with openings, which are
smaller than but still allow for the passage of the mixture, should be employed.
Lifting flame zone is attributed to inlet velocities that are too high in comparison with ,
and that cause the flame to be displaced downstream too far from the burner’s edge. Further
increases in results in blow off of the flame. Combustion in PM results in higher flame
speeds and inlet velocities.
Figure 1.4 Stability diagram for CGB and PMB (CH4/air) Adapted from S. R. Turns (2000)
11
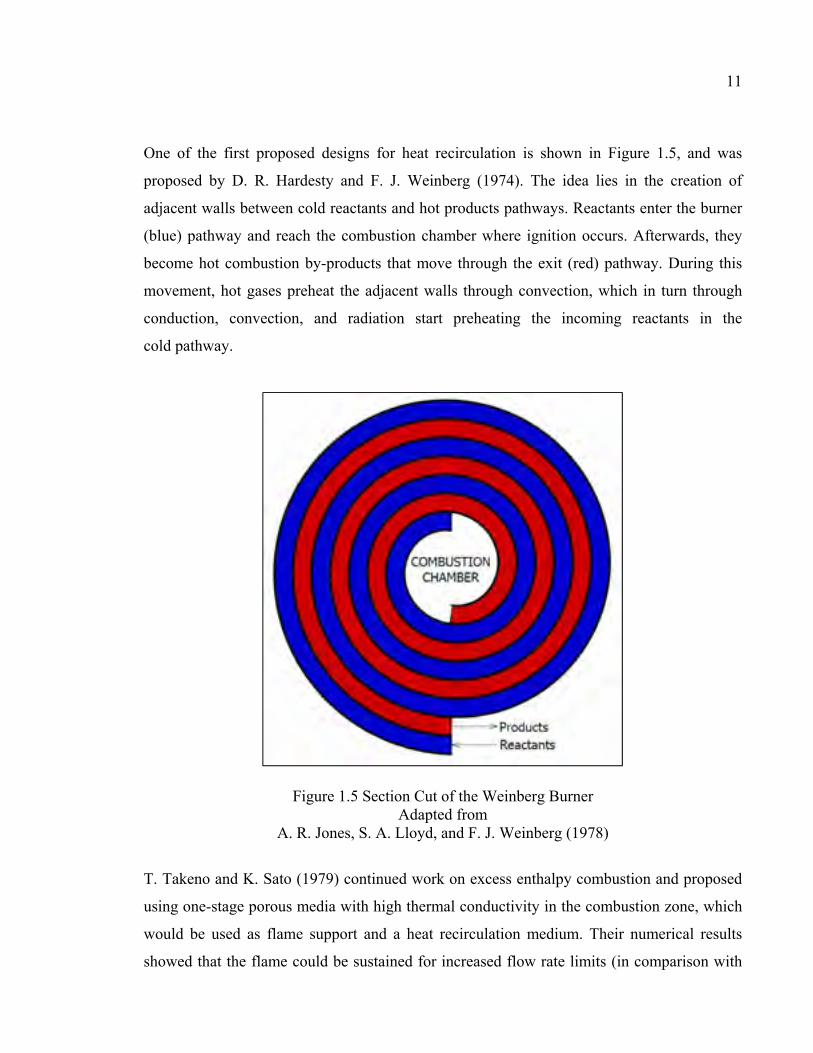
One of the first proposed designs for heat recirculation is shown in Figure 1.5, and was
proposed by D. R. Hardesty and F. J. Weinberg (1974). The idea lies in the creation of
adjacent walls between cold reactants and hot products pathways. Reactants enter the burner
(blue) pathway and reach the combustion chamber where ignition occurs. Afterwards, they
become hot combustion by-products that move through the exit (red) pathway. During this
movement, hot gases preheat the adjacent walls through convection, which in turn through
conduction, convection, and radiation start preheating the incoming reactants in the
cold pathway.
Figure 1.5 Section Cut of the Weinberg Burner Adapted from
A. R. Jones, S. A. Lloyd, and F. J. Weinberg (1978)
T. Takeno and K. Sato (1979) continued work on excess enthalpy combustion and proposed
using one-stage porous media with high thermal conductivity in the combustion zone, which
would be used as flame support and a heat recirculation medium. Their numerical results
showed that the flame could be sustained for increased flow rate limits (in comparison with
12
conventional burners), which resulted in higher power outputs. Moreover, they found that the
heat transfer coefficient between a solid and a gas ( , ) has a significant influence on flame
structure. For high , , the flame is located in the upstream section which forces combustion
to occur before entering the solid. By lowering , , on the other hand, the flame front is
displaced to the downstream section and becomes more concentrated.
The research of J. Buckmaster and T. Takeno (1981), T. Takeno, K. Sato, and K. Hase
(1981) revealed two critical flow rates in PMB, above (blow-off) and below (flashback)
which combustion cannot be sustained. Further investigation by T. Takeno and K. Hase
(1983) revealed that an increase in PM length resulted in an increase in the blow-off limit.
S. B. Sathe, R. E. Peck, and T. W. Tong (1990) examined various parameters for the
performance of one-dimensional PM using a numerical model. They found that to maximize
the radiant output, optical depth ( ) should be ~10, and the flame should be stabilized near
the centre of the PM. Optical depth indicates how opaque a material is to passing radiation.
To increase burner performance, the medium should be strongly emitting-absorbing and have
a low scattering albedo ( ) which is found as:
= / (1.5)
where is a scattering coefficient and is an extinction coefficient.
Experimental investigation of one-stage porous burners was conducted by S. B. Sathe, M. R.
Kulkarni, R. E. Peck, and T. W. Tong (1991) using a methane-air mixture at low equivalence
ratios ( = 0.5 − 0.6). It was revealed that radiant output, flame speed, and temperature
increased with increasing equivalence ratio. The maximum radiant output was observed at
the midplane of the burner.
V. S. Babkin, A. A. Korzhavin, and V. A. Bunev (1991) experimentally tested various porous
materials and suggested that flame propagation might be characterized by a Péclet number
13
( ), which is a ratio of thermal energy convected to the fluid to thermal energy conducted
within a fluid, and is given by Eqn. (1.6):
= ∙ , ∙ , ∙ = ,
(1.6)
where , is an effective pore diameter, , is gas specific heat capacity, is gas
density, is gas thermal conductivity, and is gas thermal diffusivity.
Its critical value ( ) was found to be around 65, such that for ≥ 65, flame
propagation was observed, while for < 65, the flame was quenched.
Numerical and experimental investigation of two-stage PMB with high PPI in the upstream
section and small PPI in the downstream section was performed by P.-F. Hsu, W. D. Evans,
and J. R. Howell (1993). This conceptual design is the main configuration investigated in the
literature, where upstream (region A) and downstream (region C) sections act in tandem as
preheating and stable combustion regions (see Figure 1.3). In their experiments, the
flammability limits of / combustion were investigated at different equivalence ratios.
When a two-stage PMB was used, in comparison with free flame, they found higher
maximum flame speeds and lower equivalence ratios at which flame could be sustained.
From the above-mentioned works and the information in section 1.1, we can conclude that
there is promising potential in the burning of lean mixtures in PMB, which leads to higher
flammability limits, higher heat outputs, and lower pollutant emissions (due to the possibility
of stable burning at low equivalence ratios). Therefore, the following investigations were
mainly focused on lean combustion and in particular: Temperature distribution, flammability
limits and quenching, pollutant emissions, pressure drop and permeability, durability of
porous materials, and the practical applications of PMB.
14
1.3 Temperature, radiant output and thermal efficiency
The experiment conducted by V. Khanna, R. Goel, and J. L. Ellzey (1994) revealed that with
increasing equivalence ratio ( = 0.6 − 0.87) and increasing flame speed, maximum
temperature ( ) and heat output ( ) also increase. However, the radiant thermal
efficiency ( ) increased with both lowering and lowering . Various PMB designs were
tested in heat exchangers and overall efficiency of the system was found to be more than
90% (D. Trimis & F. Durst, 1996), (F. Avdic, 2004).
1.4 Flammability limits and quenching
Flammability limits
The flammability limits of PMB were experimentally studied by P.-F. Hsu et al. (1993), who
observed that maximum flame speed ( ) in PMB was much higher in comparison to
adiabatic laminar flame speed ( ). With an increase in equivalence ratio, also
increased, whereas minimum flame speed ( ) was not substantially affected by
equivalence ratio. By decreasing pore size (and increasing PPI) in the downstream section,
they observed a decrease in and an increase in , which resulted in a lower dynamic
range (∆ = − ) of the PMB.
In another design of a two-stage porous burner, authors (R. Mital, J. P. Gore, & R. Viskanta,
1997) observed flashback tendencies resulted from higher-than-expected preheating and a
broader reaction zone. In analyzing the dimensions of the chosen porous foams, they
hypothesized that this may have been due to their insufficient upstream and downstream
thicknesses. (A. J. Barra & J. L. Ellzey, 2004) investigated burners with different foam
lengths. They found that for circular radiant configuration, the safe and reasonable ratio of
the foam’s length ( ) to its diameter ( ) is / ≥ 0.5.
15
The influences of various parameters were numerically examined by A. J. Barra, G.
Diepvens, J. L. Ellzey, and M. R. Henneke (2003). It was determined that and
were mainly controlled by upstream and downstream sections, respectively. By varying
different parameters to maximize dynamic range, it was found beneficial to use material with
low thermal conductivity ( ) and high volumetric heat transfer coefficient (ℎ ) in the
upstream section. In the downstream section, on the other hand, it is advantageous to use
materials with high and high ℎ . A high radiative extinction coefficient ( ) was found
to be important in the upstream section, which corresponds to small pore size. Additionally,
with increasing , they observed an increase in the burner’s dynamic range (∆ = −).
(N. Djordjevic, P. Habisreuther, & N. Zarzalis, 2012a) investigated the influence of air inlet
temperature on firing rate limits. By preheating the air, they found that they could burn leaner
mixtures with higher firing rates. By comparing two ceramic materials, and ,
they found that SiSiC demonstrated better flame stabilization due to its higher heat transport
properties, but had a lower temperature operation limit.
Investigation of the operational ranges of different porous materials and pore sizes was made
by H. B. Gao, Z. G. Qu, X. B. Feng, and W. Q. Tao (2014). in the downstream section
was not sensitive to material; however, increased in the order of , , ,
, which correlates with each material’s thermal conductivity. By increasing pore size
in the downstream section, increased, and that increase was accompanied by a
simultaneous decrease in resulting in a decrease of total dynamic range (Δ ).
Quenching
(V. S. Babkin et al., 1991) experimentally confirmed that flame extinction is characterized by
critical Péclet number ( ) equal to 65, such that for < , flame quenches, and for > , flame propagates. After examining Eqn. (1.6), they concluded that for a given
mixture ( ) and flow regime ( ), a corresponding critical pore diameter ( , ) exists.
16
= ∙ ,
(1.7)
This fact motivates to the determination of materials with appropriate pore diameters in the
upstream and downstream regions, satisfying flame quenching and flame propagation
conditions, respectively. However, in the case of high temperature in the medium ( ), flame
propagation is possible, which is attributed to the fact that reactions are not extinguished by
cold walls. This process is called filtration combustion.
A number of research efforts were undertaken to verify the criterion = 65. (D. Trimis
& F. Durst, 1996) investigated for sphere packing at stoichiometric regime ( = 1, = 40 / ) by varying pebble diameters ( ), and found the critical value ( ) to be 9 , which fit well with the criterion = 65. Pore diameter of sphere packing in this
case was evaluated based on the assumption of flame quenching in the narrow tubes with a
diameter equal to the maximum pores (G. A. Lyamin & A. V. Pinaev, 1987):
= 2.77 (1.8)
(D. Trimis & K. Wawrzinek, 2004) continued experiments with spheres. In their work, three
different pebble diameters were chosen and the equivalence ratio varied by reaching fuel-lean
( ) and fuel-rich ( ) limits until quenching occurred. Variation in resulted in
variation of (see Figure 1.1), such that two different critical Péclet numbers were found,
corresponding to lean ( , ≈ 38) and rich ( , ≈ 92) limits, which resulted in mean = 65 ± 27. Another important discovery was the influence of mixture type on the
by Lewis-number ( ), which is the ratio of thermal ( ) to mass ( ) diffusivity:
= = , (1.9)
17
Evaluation of for various mixtures and equivalence ratios is described by J. K. Bechtold
and M. Matalon (2001) and P. Ghanbari-Bavarsad (2008). For / at various ,
might be considered constant and equal to unity (D. Lapalme, R. Lemaire, & P. Seers, 2017),
whereas for certain gases, changes with equivalence ratio. It should be taken into account
that for ≥ 1, the value of was found to be approximately equal to 65, and that for
gases with < 1, decreases. As an example, for fuel-rich / ( ≈ 0.8),
fuel-lean / ( ≈ 0.4), and fuel-lean / / ( ≈ 0.3) mixtures were found to
be 27, 17, and 6.5, respectively.
The influence of various configurations of porous materials on flame quenching and flame
propagation was investigated by H. I. Joo, K. Duncan, and G. Ciccarelli (2006). Flame
arresting properties were compared between various ceramic mediums, and their efficiencies
order from most to least effective as follows: Drilled plates, packed spheres, and foams. The
criterion of effectiveness was evaluated based on (with the higher being the better). It
was found that packed spheres had superior (28% better) flame arresting properties in
comparison to ceramic foams, which was attributed to the foam’s higher void fraction.
Additionally, they confirmed the existence of two corresponding to lean and rich limits.
In various resources with experimental data, authors combine flashback and quenching
results together which complicates analysis. P.-F. Hsu et al. (1993) indicated that flame
during flashback was possible to quench only by means of 65 PPI PSZ foam at = 0.55,
which corresponded to ≈ 1.4. Such low value might be attributed to filtration
combustion due to increased temperature in the medium after continuous preheating. In
contrast, W. M. Mathis and J. L. Ellzey (2003) provided results of flashback, which
corresponded to ≈ 14 and H. B. Gao et al. (2014) to ≈ 4.5 − 13.5 (in both cases,
downstream region was considered critical). However, it was not specified whether the flame
was quenched or not.
Represented discrepancies in calculated were also analyzed by N. Djordjevic, P.
Habisreuther, and N. Zarzalis (2011), who proposed a method where two Péclet-numbers,
18
based on laminar flame speed ( ) and on minimum velocity corresponding to blow off in
PMB ( ), were taken into account:
= (1.10)
= (1.11)
Linear correlations of log = (log[ ]) for and PMs were obtained.
However, certain coefficients should be determined for each burner separately. Figure 1.6
amalgamates the information from the various resources and demonstrates that for the chosen
porous material and mixture type, critical Péclet-number and critical pore diameter can be
found by defining lean and rich flammability limits. However, after reviewing the literature,
we found discrepancies in the evaluation of , and further research in this field needs to
be conducted. During operation, flame velocity should be set to an appropriate level such that
the foam’s temperature ( ) at the upstream section does not increase to the level when flame
propagation towards the inlet region occurs.
Figure 1.6 Influence of various parameters on Pecr
Pecr
Type of the PM(foam, spheres, drilled plates, etc.)
φ(lean, rich)
Le(mixture type)
Ts(filtration combustion)
dp,cr
Material of the PM(FeCrAl, Al2O3, SiSiC, etc.)
19
1.5 Pollutant emissions
CO emission
(V. Khanna et al., 1994) experimentally investigated a two-stage burner with a /
mixture. It was found that emissions mainly increased with increasing . However, for
fixed , the minimum value of emission was found at the intermediary flame speeds
located between and . Maximum emission was found for . Under these
conditions, the flame front was located at the downstream exit plane and provided less time
for oxidation. Similar results were obtained by M. T. Smucker and J. L. Ellzey (2004)
and C. Keramiotis, B. Stelzner, D. Trimis, and M. Founti (2012).
F. Avdic (2004) compared a conventional natural gas burner with PMB in a household
application (using a boiler). This experiment showed considerable emission reduction in
the PMB at the tested power ranges.
The majority of investigations were made with / mixtures and several attempts were
made to burn other fuels. G. J. Rørtveit, K. Zepter, Ø. Skreiberg, M. Fossum, and J. E.
Hustad (2002) investigated the addition of to in a number of PMB designs, and
found no considerable effect of fuel type on emission levels. S. K. Alavandi and A. K.
Agrawal (2008) tested and addition (in the same proportion) to the mixture and
observed a slight decrease in emission with a higher concentration of in the fuel. This
experiment also investigated the dependence of emission in the transverse location, and
found that pollution concentration was lower at the centre (corresponding to higher
temperatures) and higher near the walls (corresponding to lower temperatures).
N. Djordjevic, P. Habisreuther, and N. Zarzalis (2012b) investigated the influence of the
adiabatic flame temperature ( ) of / mixture and found that emission increased
with increasing , a finding that agrees with supported theory. By investigating
20
emission in the axial direction, authors found that emission decreased from the burner
exit, which was attributed to the post-flame oxidation.
In the majority of experiments, emission was low and less than 60 ppm.
emission
In lean combustion, thermal is the main source of pollutant formation. In the experiment
conducted by V. Khanna et al. (1994), the authors found that was less sensitive to flame
speed, but mainly increased with equivalence ratio, which was in direct relation to . C.
Keramiotis et al. (2012) and D. Trimis and F. Durst (1996) confirmed these results through
their own research. In the majority of cases, emissions were less than 30 ppm and often even
less than 5 ppm or below the equipment detection limits.
UHC emission
R. Mital et al. (1997) investigated that emission increased in proportion to an increase
in equivalence ratio, and a decrease in firing rate. The same finding was observed by W. M.
Mathis and J. L. Ellzey (2003). In the majority of cases, this value was low (less than 15
ppm). In the work of H. B. Gao et al. (2014), who used a perforated plate and
3 mm balls in the upstream section, high values of emission (500-2500 ppm) were
obtained at a low equivalence ratio ( = 0.6). emission decreased with increasing
flame speed. Increased flame speed leads to higher flame temperatures that lower the
formation at low .
1.6 Pressure drop and permeability
Pressure drop through the foam is important to understand the flow regime and energy
dissipation mechanisms, and to evaluate heat transfer/reaction rates (N. Dukhan, Ö. Bağcı, &
M. Özdemir, 2014). J. T. Richardson et al. (2000) investigated pressure drop for various
foams and found that they follow the Forchheimer equation:
21
Δ = + (1.12)
where Δ is pressure drop, is the length of the medium, is the flow velocity, and and
are constants.
The constants and were taken from Sabri Ergun and A. A. Orning (1949) and required
correlations depending on the obtained pore diameter ( ) and porosity ( ). As predicted,
pressure drop increased with flow velocity and pore size (PPI).
Comparison between cold states and operational states in PMB was provided by M. T.
Smucker and J. L. Ellzey (2004). Pressure drop (Δ ) was higher for a hotter reaction flow (as
opposed to a cold flow) and in all cases, Δ increased with and flow speed. However, for
the reacting flow at high velocities (> 70 / ), pressure drop experienced a plateau.
H. B. Gao et al. (2014) also observed higher Δ in hot states, though the difference between
the two states in this research was not as prominent as the difference in M. T. Smucker and J.
L. Ellzey (2004). By comparing Δ for foams with 10 PPI and 30 PPI, the latter had a
slightly higher Δ . J. A. Wharton, J. L. Ellzey, and D. G. Bogard (2005) compared pressure
drop for 10 PPI and 60 PPI foams at various velocities. They reported that with the 60 PPI
foam, they observed a much higher Δ and higher non-linearity with increasing .
Pressure drop through metal foam and various flow regimes was studied by N. Dukhan et al.
(2014). They distinguished four flow regimes: Pre-Darcy, Darcy, Forchheimer, and turbulent.
The modified Forchheimer equation was used:
Δ = + (1.13)
where Δ / is reduced pressure drop, is viscosity, is the permeability coefficient
measured in Darcy regime, is density, and is the Forchheimer coefficient. From this
equation, reduced pressure drop becomes a linear function and dependent only on , which
22
allows for the determination of permeability and the Forchheimer coefficient, which define
and characterize porous medium structure.
1.7 Durability of porous materials
The main materials used in PMB for flame support and heat recirculation are ceramic foams.
Due to their high temperature operation limits ( > 1400℃) and high thermal
conductivity. However, ceramics are brittle materials by nature and prone to crack formation
when exposed to high temperature gradients (P. J. Elverum, J. L. Ellzey, & D. Kovar, 2005)
and thermal shocks (F. R. A. Mach, F. V. Issendorff, A. Delgado, & A. Ortona, 2009). These
are the primary disadvantages of using ceramic materials in PMB designs. J. A. Wharton et
al. (2005) investigated a two-stage PMB design, and after extensive use found that the foam
degraded in the upstream section (small pore size, high PPI). This might be attributed to the
fact that small foam struts are more susceptible to failure during thermal shocks and
temperature gradients. Authors V. R. Vedula et al. (1999) confirmed this assumption, and
determined that damage in ceramic foams is generally due to the propagation of pre-existing
cracks and is strongly dependent on cell size, such that with a decrease in cell size the
probability of damage increases.
The main parameters that characterize the capability of the material to withstand structural
failure are thermal shock resistance parameter ( ) and fracture toughness ( ).
characterizes the ability of the material to withstand crack propagation (X.-K. Zhu & J. A.
Joyce, 2012), whereas characterizes the ability of the material to withstand temperature
gradients and is found, according to J. W. Zimmermann, G. E. Hilmas, and W. G.
Fahrenholtz (2008), as:
= (1 − )∙ (1.14)
where is tensile strength, is Poisson’s ratio, is Young’s modulus, and is the thermal
expansion coefficient.
23
The higher the and the higher the , the more a material can withstand extreme
temperature gradients and maintain structural consistency. According to N. R. Bose (2013),
“Ceramic materials have a greater thermal shock sensitivity than metals and can suffer
catastrophic failure due to thermal shock because of their unfavourable ratio of stiffness and
thermal expansion to strength and thermal diffusivity, and their limited plastic deformation”.
This leads to the hypothesis that the application of metal foams in the upstream section (the
region of average temperatures and high temperature gradients) might be advantageous, since
these materials have a higher resistance to crack propagation.
1.8 Practical applications
The best proof of PMB feasibility is its practical application in heat exchangers, which has
been investigated by D. Trimis and F. Durst (1996). Trimis and Durst demonstrated: High
efficiency ( > 90%), high dynamic range (20:1), low pollutant emissions, more stable
combustion, and much smaller size of PMB as compared to conventional burners. In the
work of F. Durst, D. Trimis, and K. Pickenäcker (1997), the authors enhanced the power
output and elaborated the porous burner integrated with the heat exchanger, which worked in
the wide dynamic range (3-30 kW) with low and emission. Application of PMB was
demonstrated in one-piston and three-piston engines developed by S. Mößbauer, F. Durst, D.
Trimis, and T. Haas (2001). F. Avdic (2004) presented an elaborated design of a PMB in a
boiler system with both high efficiency and low pollutant emissions. Comparison of PMB
with conventional burners in the household application was provided by M. A. Mujeebu et al.
(2011). Once again, it demonstrated high efficiency and significant fuel savings (up to 80%)
with much lower emissions. However, their design yielded higher CO emissions for
PMB, but still within the range of global standards.
PMB application in stationary gas turbines was investigated by N. Djordjevic et al. (2012b)
and N. Djordjevic et al. (2012a). These experiments demonstrated extremely low and
concentrations, as well as a wide range of stable firing rates.
24
Such works demonstrate important potential for the development of future PMB designs.
1.9 Hypothesis and objectives
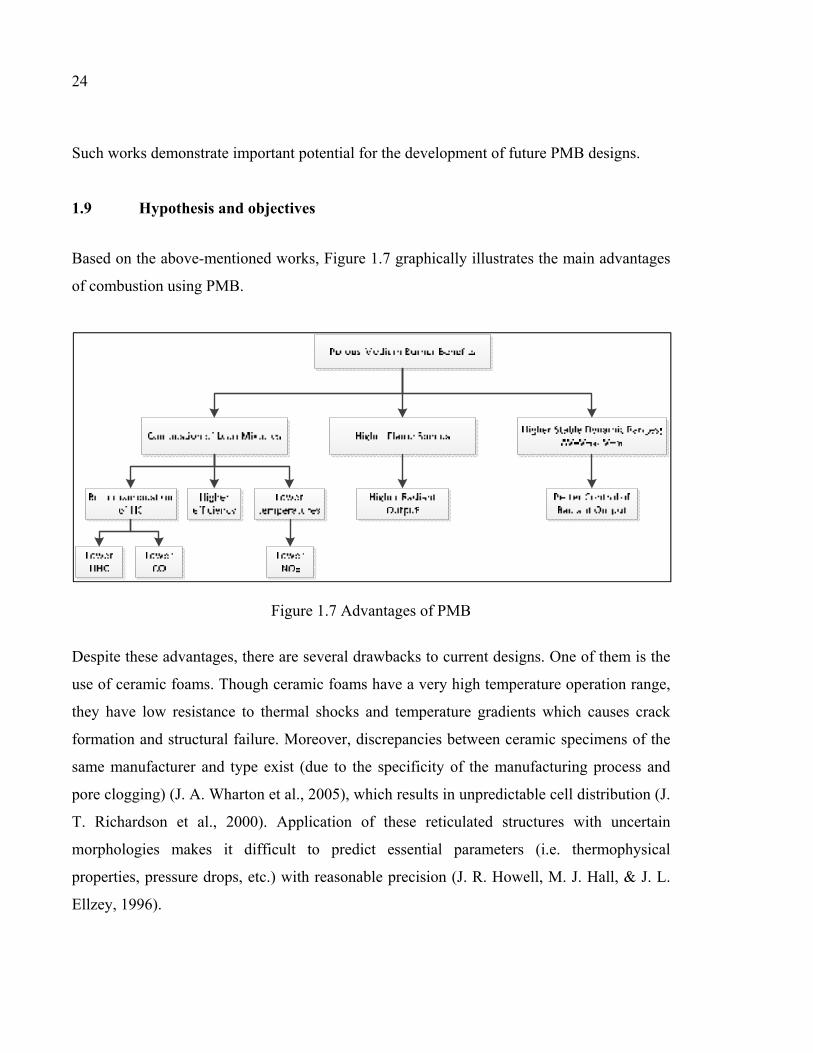
Based on the above-mentioned works, Figure 1.7 graphically illustrates the main advantages
of combustion using PMB.
Figure 1.7 Advantages of PMB
Despite these advantages, there are several drawbacks to current designs. One of them is the
use of ceramic foams. Though ceramic foams have a very high temperature operation range,
they have low resistance to thermal shocks and temperature gradients which causes crack
formation and structural failure. Moreover, discrepancies between ceramic specimens of the
same manufacturer and type exist (due to the specificity of the manufacturing process and
pore clogging) (J. A. Wharton et al., 2005), which results in unpredictable cell distribution (J.
T. Richardson et al., 2000). Application of these reticulated structures with uncertain
morphologies makes it difficult to predict essential parameters (i.e. thermophysical
properties, pressure drops, etc.) with reasonable precision (J. R. Howell, M. J. Hall, & J. L.
Ellzey, 1996).
25
One of the proposed solutions is to use lattice structures with high open porosity (A. Ortona,
C. D'Angelo, S. Gianella, & D. Gaia, 2012), (S. Gianella, 2013). The application of diamond
lattices provides simplicity for numerical simulation during preliminary design, so that the
results obtained for a limited number of unit cells might be extrapolated to the whole uniform
structure (A. Ortona, S. Pusterla, et al., 2012).
It may also be beneficial to use metal materials in the upstream section with low thermal
coefficients ( ), high volumetric heat transfer coefficients (ℎ ), and large radiative extinction
coefficients ( ) (A. J. Barra et al., 2003).
Hence, the application of additive manufacturing, in particular laser powder bed fusion
(LPBF) of metals, may be beneficial in creating optimized porous materials with desired and
predictable parameters. This approach would potentially allow for the improvement of
PMBs’ efficiency and reduce their pollutant emissions.
It was demonstrated that the selection of an appropriate plays a crucial role in determining
flammability limits and in the safety of the equipment. However, in the literature review no
satisfactory methods were found to determine applicable , with a sufficient level of
accuracy. Moreover, based on experimental results, the criterion of = 65 for /
mixtures should be verified, and so additional research in this field is necessary. Nonetheless,
the determination of is out of the scope of the current research which is limited only to
the determination of in porous materials.
Thus, let’s recall the general objective that was defined in section 0.3:
Study the impact of the material properties and porous media geometry on the performances
of additively manufactured porous medium burners.
To reach this general objective, specific project objectives were specified as follows:
1) Analyse conventional ceramic foams using advanced visualization and image treatment
techniques;
26
2) Design diamond lattice PM with flow characteristics similar to those of the conventional
ceramic foams
3) Design and manufacture the diamond lattice PMB using selective laser melting additive
manufacturing technique;
4) Compare, experimentally, the performances of the foam and diamond lattice PMBs made
of two different materials (SiSiC ceramics and CoCr metallic alloy).
CHAPTER 2
METHODOLOGY
This section describes the process of selecting and characterizing ceramic foams, as well as
the approach used to design diamond lattice structures. We present methods of geometric
analysis of ceramic foams and propose an approach of selecting patterned porous media
(PM) with flow characteristics similar to those of the foam. This section also describes the
experimental setups and the nature of the tests that were performed.
2.1 Selection of porous materials and definition of experimental setups
This subsection explains how we selected suitable PMB ceramic foams and explains our
decision to replace the foam’s geometry with the diamond lattice structure. Moreover, this
section also discusses the motivations for selecting our experimental setups.
2.1.1 Overview of ceramic foams
To establish a clear understanding of what a ceramic foam is, it is necessary to define a few
basic terms, as there is some ambiguity around the definition of “pore”. To avoid
uncertainty, the definition used by manufacturers is employed in this thesis, where a “pore”
is defined as the 2D opening, and a “cell” is defined as the 3D space surrounding the pore
(D883-17 ASTM, 2017) (see Figure 2.1).
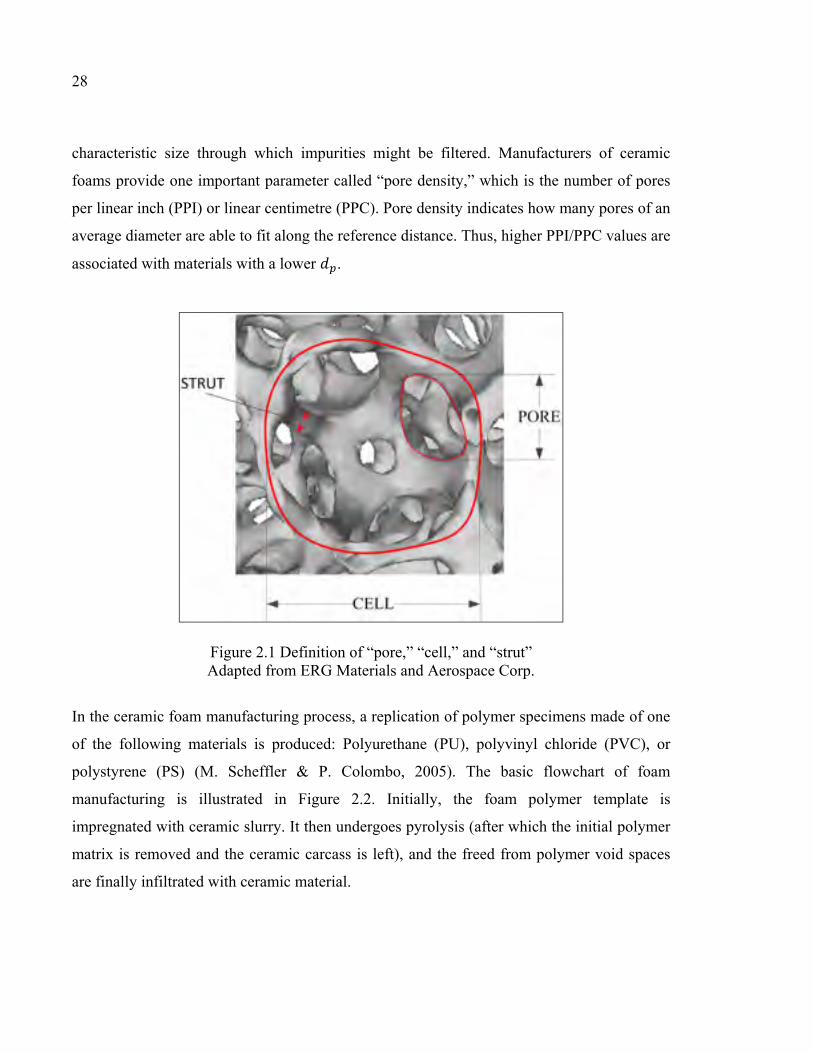
Foams have complex morphologies with widespread cell and pore size distributions (K. M.
Lewis, I. Kijak, K. B. Reuter, & J. B. Szabat, 1996). According to one of the leading ceramic
foam manufacturers (ERG Materials and Aerospace Corp.), one cell consists of
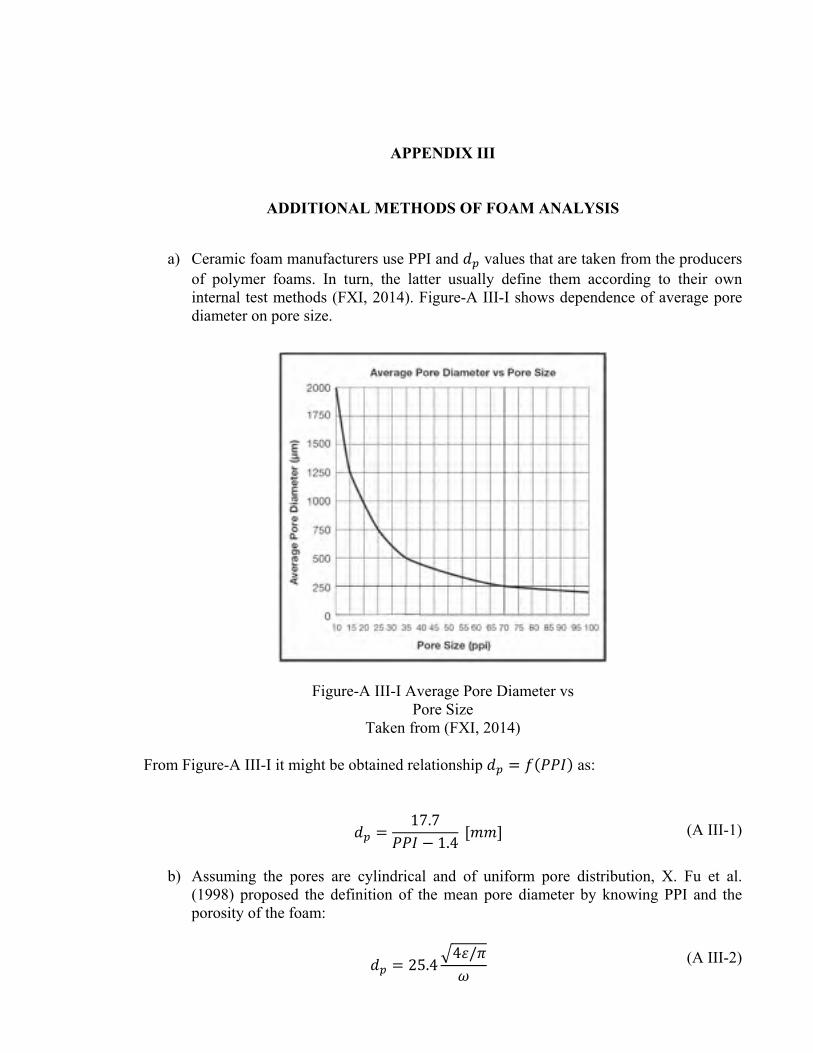
approximately 14 pores of various shapes and sizes. This is simplified by averaging pores to
find a mean diameter ( ) of an equivalent circular pore. Initially, ceramic foams were
applied in the filtering of molten metals. As a result, it was logical to define as a
28
characteristic size through which impurities might be filtered. Manufacturers of ceramic
foams provide one important parameter called “pore density,” which is the number of pores
per linear inch (PPI) or linear centimetre (PPC). Pore density indicates how many pores of an
average diameter are able to fit along the reference distance. Thus, higher PPI/PPC values are
associated with materials with a lower .
Figure 2.1 Definition of “pore,” “cell,” and “strut” Adapted from ERG Materials and Aerospace Corp.
In the ceramic foam manufacturing process, a replication of polymer specimens made of one
of the following materials is produced: Polyurethane (PU), polyvinyl chloride (PVC), or
polystyrene (PS) (M. Scheffler & P. Colombo, 2005). The basic flowchart of foam
manufacturing is illustrated in Figure 2.2. Initially, the foam polymer template is
impregnated with ceramic slurry. It then undergoes pyrolysis (after which the initial polymer
matrix is removed and the ceramic carcass is left), and the freed from polymer void spaces
are finally infiltrated with ceramic material.
29
Figure 2.2 Flowchart of the ceramic foam manufacturing process Adapted from A. Ortona, C. D'Angelo, et al. (2012)
Unfortunately, the main drawback of ceramic foam production is that the final specimen’s
geometry inevitably varies between specimens, even if they are produced by the same
manufacturer (X. Fu, X. F. Viskanta, & J. P. Gore, 1998). This is due primarily to variability
among the parent templates used, and at the stage of slurry coating. The latter occasionally
results in the formation of closed pores (J. A. Wharton et al., 2005) that prevent fluid flow.
This fact might be crucial for combustion, and informs research of alternative shapes that can
be used with more predictable and controllable open-cellular structures.
2.1.2 Selection of foams and alternative ordered porous structures
This section explains the reasoning behind our choices of foam media for PMBs. SiSiC
foams from EngiCer SA were selected based on their higher thermal conductivity compared
to other ceramics (S. Gianella & A. Ortona, 2010). They were also selected based on their
availability and successful applications by other researchers N. Djordjevic, P. Habisreuther,
and N. Zarzalis (2009); J. Kiefer et al. (2009).
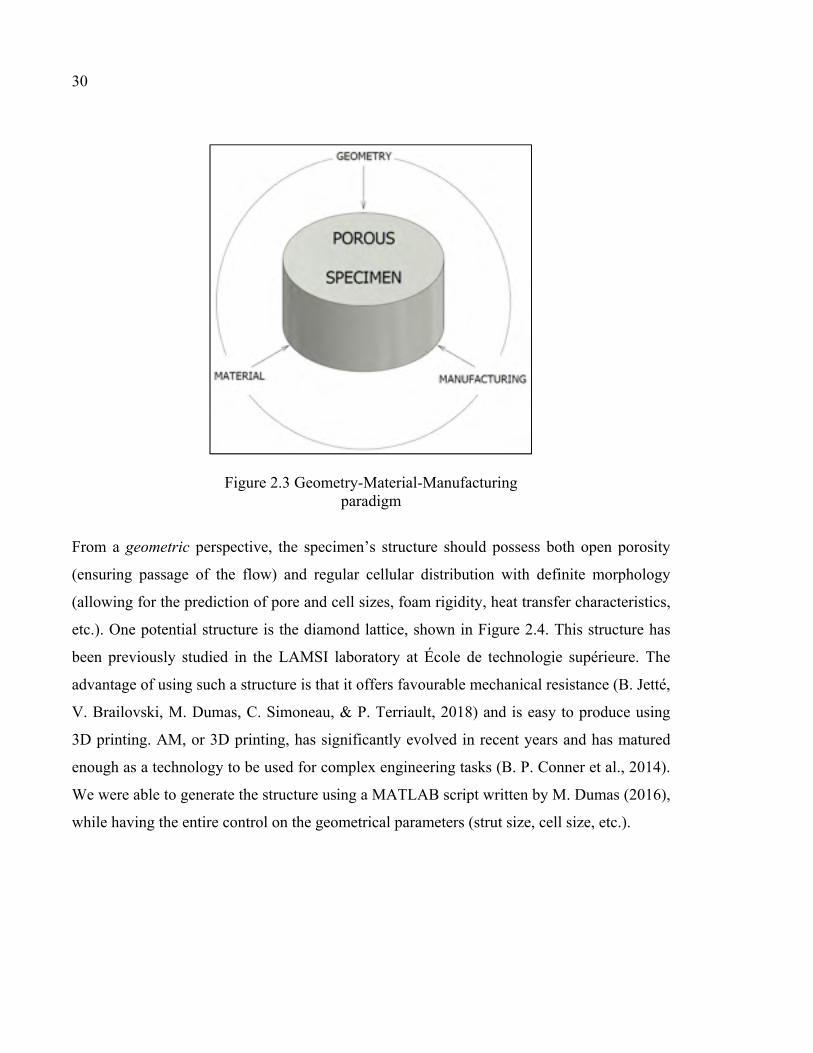
As mentioned in the previous section, ceramic foams have complex morphologies with
widespread cell size distribution and low repeatability. The resulting inconsistencies have
motivated the investigation of structures with open porosity—similar to the foam—but with
definite geometry. In our case, regularly distributed porous structures represent an interesting
alternative. To define such an alternative structure, we use the Geometry-Material-
Thermal shock resistance parameter, R [K] 150a) 271a)
Fracture toughness, K1C [MPa·m1/2] 2.5b) 100c) a) See Eqn. (1.14). b) (Z. Fu, L. Schlier, N. Travitzky, & P. Greil, 2013) c) (E. Ahearne, S. Baron, S. Keaveney, & G. Byrne, 2015)
2.1.3 Definition of the experimental setups
From our survey of the literature, a two-staged radial PMB configuration with a foam of high
PPI in the upstream section (acting as flame arrestor) and low PPI in the downstream section
(acting as flame support) was the most commonly investigated design and, as a result, was
chosen in the current work. To conduct our research, we selected six experimental setups
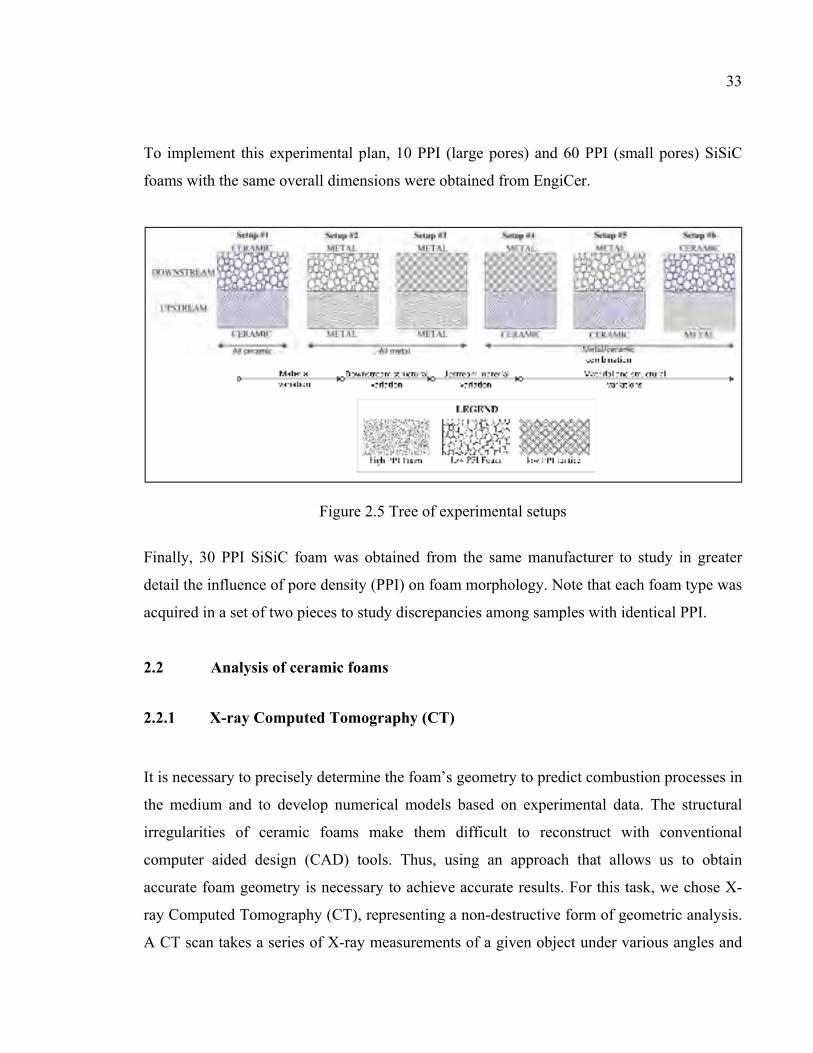
which are illustrated in Figure 2.5.
Setup #1 is considered a reference, and is commonly seen in the literature as a representation
of two ceramic foams in the upstream and downstream regions. Setup #2 allowed us to
investigate how using metal material (CoCr) instead of ceramics influenced the burning
parameters. In setup #3, the same metal material was used, however reticulated foam was
replaced by a diamond lattice. Setup #3 allowed us to understand the influence of the pore
organization (ordered or random) on combustion. Finally, setups #4, #5, and #6 represent
various arrangements of metal/ceramic materials and random/regular pore geometries in the
downstream and upstream sections.
33
To implement this experimental plan, 10 PPI (large pores) and 60 PPI (small pores) SiSiC
foams with the same overall dimensions were obtained from EngiCer.
Figure 2.5 Tree of experimental setups
Finally, 30 PPI SiSiC foam was obtained from the same manufacturer to study in greater
detail the influence of pore density (PPI) on foam morphology. Note that each foam type was
acquired in a set of two pieces to study discrepancies among samples with identical PPI.
2.2 Analysis of ceramic foams
2.2.1 X-ray Computed Tomography (CT)
It is necessary to precisely determine the foam’s geometry to predict combustion processes in
the medium and to develop numerical models based on experimental data. The structural
irregularities of ceramic foams make them difficult to reconstruct with conventional
computer aided design (CAD) tools. Thus, using an approach that allows us to obtain
accurate foam geometry is necessary to achieve accurate results. For this task, we chose X-
ray Computed Tomography (CT), representing a non-destructive form of geometric analysis.
A CT scan takes a series of X-ray measurements of a given object under various angles and
34
combines the results into cross-sectional images (an image stack) with the further possibility
of recreating the object’s volume (S. L. Wellington & H. J. Vinegar, 1987).
The main steps undertaken during CT scan of foam specimens are described below:
1) The specimen was installed into Nikon XT H 225 X-ray μ-CT system (Nikon, Brighton,
MI, USA). Data was obtained with 220 kV tube voltage and 350 µA current, and
complemented with a 1 mm-thick copper filter.
2) Obtained volume was reconstructed using the CT Pro 3D software (Nikon, Brighton, MI,
USA) and a stack of image slices was obtained for each foam.
3) The image stack was imported afterwards into VG Studio MAX 3.0 (VG) software
(GmbH Volume Graphics, 2016). Surface, based on the greyscale threshold, was
determined and the volume was recreated.
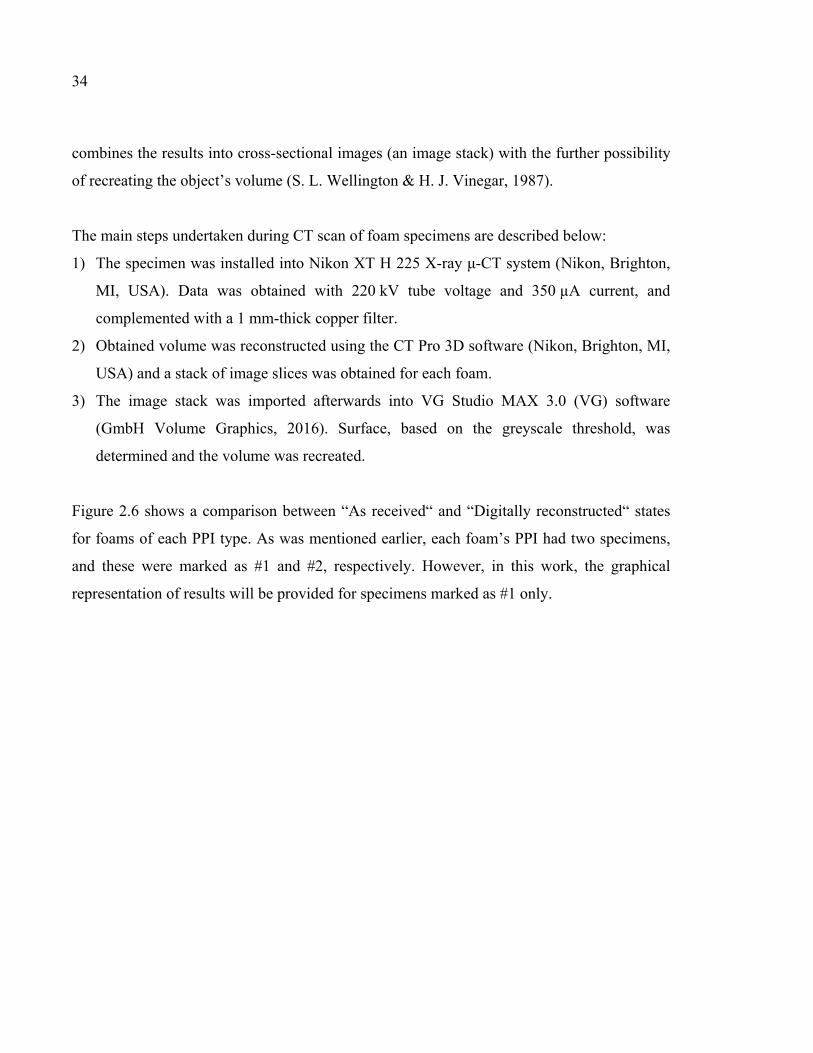
Figure 2.6 shows a comparison between “As received“ and “Digitally reconstructed“ states
for foams of each PPI type. As was mentioned earlier, each foam’s PPI had two specimens,
and these were marked as #1 and #2, respectively. However, in this work, the graphical
representation of results will be provided for specimens marked as #1 only.
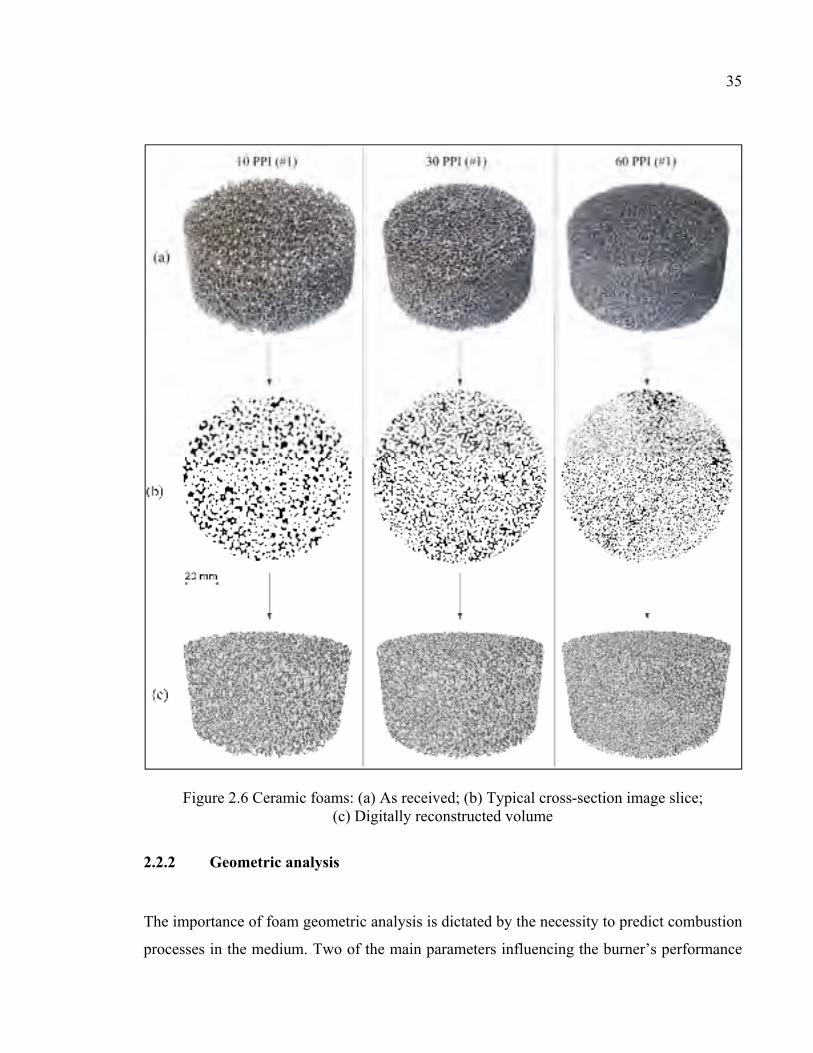
To evaluate the porosity of foams with high PPI, for which the application of Archimedes’
principle failed, VGStudio Max 3.0 software (VG) was employed to analyze the
reconstructed volumes from the CT scan data. During reconstruction, there were two main
parameters that influenced the final 3D model: “Pixel resolution” and “grey threshold” value.
Pixel resolution is a scaling factor, defined during the generation of the image stack or
calculated from a cross-section image as the ratio of known physical length to its length in
pixels. Each pixel of the greyscale image has its value, and by applying a given grey
threshold, the pixel’s domain becomes separated on the void and solid phases. Application of
“pixel resolution” and “grey threshold” values result in volume recreation with correct
overall dimensions and creates a correctly reconstructed shape.
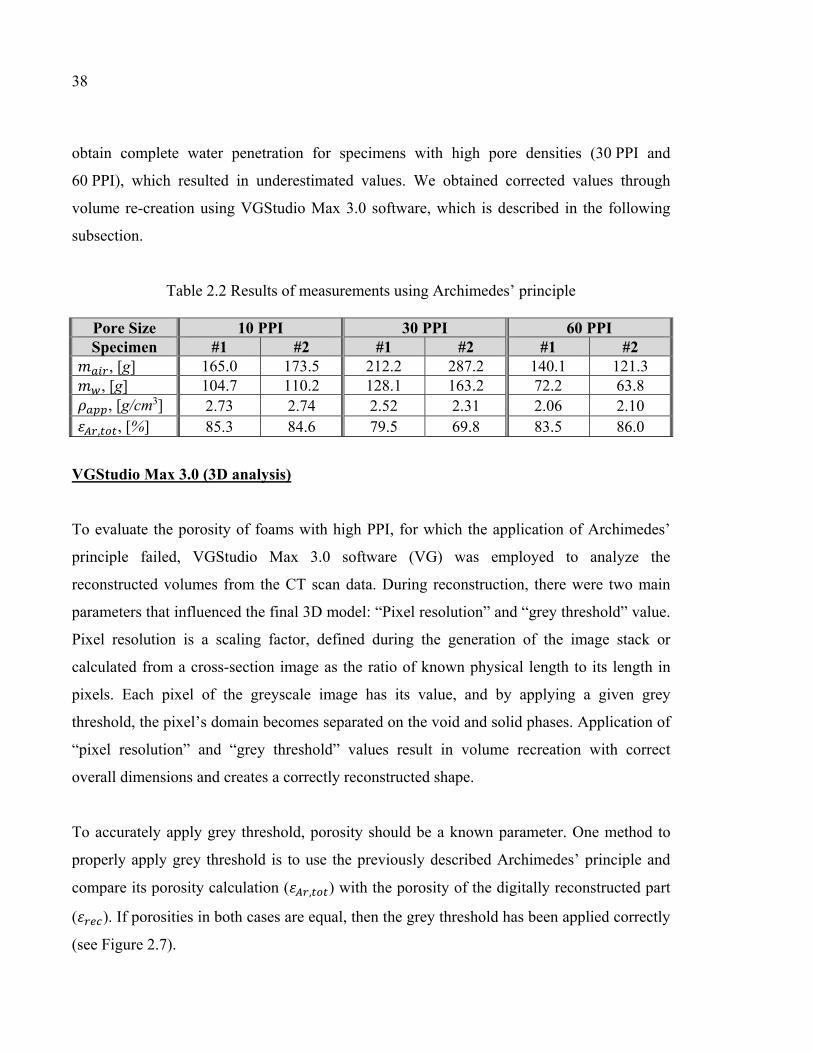
To accurately apply grey threshold, porosity should be a known parameter. One method to
properly apply grey threshold is to use the previously described Archimedes’ principle and
compare its porosity calculation ( , ) with the porosity of the digitally reconstructed part
( ). If porosities in both cases are equal, then the grey threshold has been applied correctly
(see Figure 2.7).
39
Figure 2.7 Adjusting grey threshold to an image stack
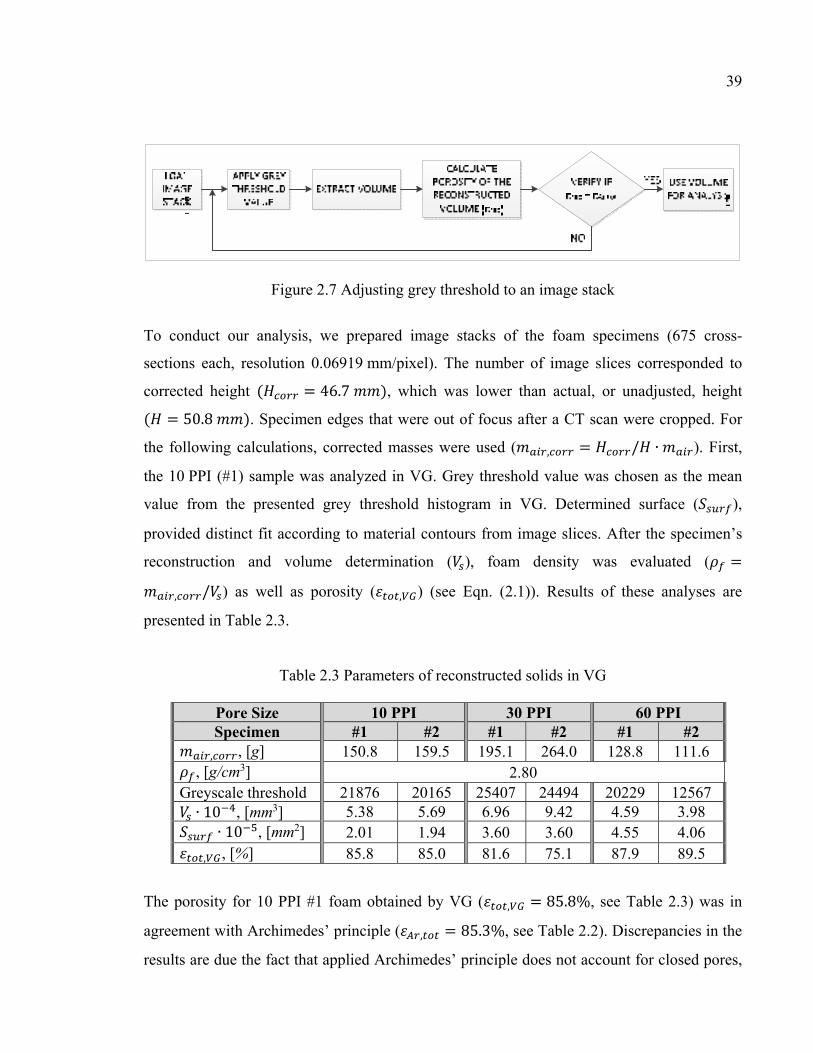
To conduct our analysis, we prepared image stacks of the foam specimens (675 cross-
sections each, resolution 0.06919 mm/pixel). The number of image slices corresponded to
corrected height ( = 46.7 ), which was lower than actual, or unadjusted, height ( = 50.8 ). Specimen edges that were out of focus after a CT scan were cropped. For
the following calculations, corrected masses were used ( , = / ∙ ). First,
the 10 PPI (#1) sample was analyzed in VG. Grey threshold value was chosen as the mean
value from the presented grey threshold histogram in VG. Determined surface ( ),
provided distinct fit according to material contours from image slices. After the specimen’s
reconstruction and volume determination ( ), foam density was evaluated ( =, / ) as well as porosity ( , ) (see Eqn. (2.1)). Results of these analyses are
presented in Table 2.3.
Table 2.3 Parameters of reconstructed solids in VG
Pore Size 10 PPI 30 PPI 60 PPI Specimen #1 #2 #1 #2 #1 #2 , , [g] 150.8 159.5 195.1 264.0 128.8 111.6
The porosity for 10 PPI #1 foam obtained by VG ( , = 85.8%, see Table 2.3) was in
agreement with Archimedes’ principle ( , = 85.3%, see Table 2.2). Discrepancies in the
results are due the fact that applied Archimedes’ principle does not account for closed pores,
40
which were detected in small amount for 10 PPI specimens from image slices. Eventually, it
was decided to use the reconstructed volume of the 10 PPI (#1) foam with , = 85.8%.
The specimen’s density ( ) was found to be 2.8 / , which was in excellent agreement
with what was indicated by the manufacturer (see Table 2.1).
During volume reconstruction of the other specimens, obtained was considered constant.
By knowing the masses of each specimen, target volumes were calculated according to the
relationship / = / , where and corresponded to values for the 10 PPI (#1)
foam specimen and , for the target part. After determining target volumes for all other
specimens, we adjusted appropriate grey threshold values and calculated corresponding
porosities.
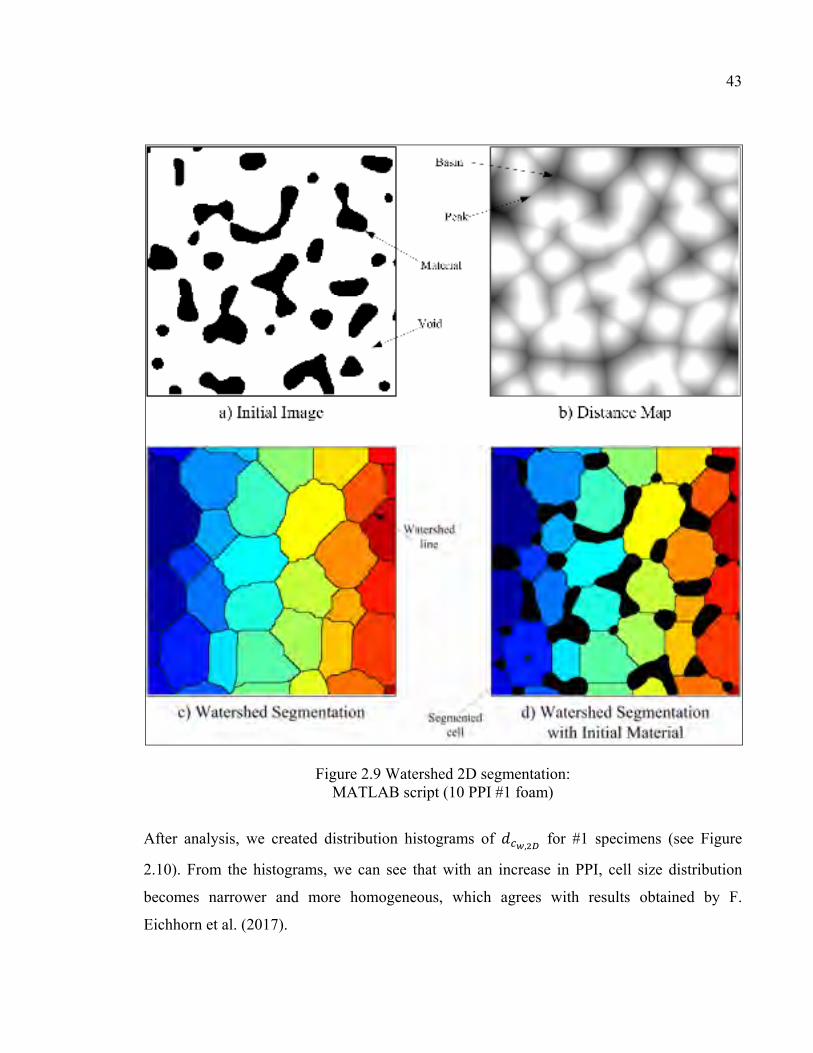
Cross-section slices (2D analysis)
Porosities of cross-section slices ( ) were evaluated primarily for comparative analysis with , . The same image stacks used for volume reconstruction were binarized (converted
into black and white images) with the same grey threshold values by means of the image-
processing software Fiji (J. Schindelin et al., 2012). Afterwards, a MATLAB script was
written to treat each image stack and to calculate the corresponding mean porosities.
Table 2.4 summarizes the porosity values obtained by different methods. Archimedes’
principle ( , ) was useful for only 10 PPI specimens with large pores, whereas for 30 PPI
and 60 PPI samples it provided slightly underestimated values. The obtained values of
provided slightly underestimated values in comparison to volumetric porosity ( , ), but
were in the range of reasonable discrepancy. Finally, for further analysis, values of porosity
obtained in VG ( , ) were taken as a reference.
41
Table 2.4 Results of porosity analysis by different methods (shaded is the selected set of values)
Method Pore Size 10 PPI 30 PPI 60 PPI Specimen #1 #2 #1 #2 #1 #2
Analysis of image cross sections based on ASTM D3576-15
Cross-sectional analysis, which is based on the standard D3576-15 ASTM (2015), is another
method that can be applied to characterize foams. This standard was developed to determine
the cell sizes of rigid plastics, which are used as templates in the production of ceramic
foams. In this method, slices are analyzed by evaluating the average chord length ( )
49
found as the division of randomly drawn reference line length ( ) by the number of
intersections with walls ( ):
= (2.10)
Finally, the value of the cell size ( , ) is proposed to be found based on the relatively
uniform distribution of cells with spherical shape:
, = (1.623) (2.11)
Figure 2.14 Determination of dc,ASTM according to D3576-15 ASTM (2015) (10 PPI #1 foam)
The MATLAB script was written such that for specific cross-section images with
pixels, a number of intersections with struts ( ) and corresponding mean strut thickness
( ) can be calculated by drawing a reference line (one pixel thick) passing through the disk’s
50
centre (see Figure 2.14). We repeated the operation of drawing a reference line through
rotation, according to the disk’s centre, in consecutive increments of one pixel at the image
border ( ) until finally the whole image had been covered. The total number of reference
lines is represented by , = 1 + 2 − 2 (for investigated images, it corresponded to ≈3000 reference lines per slice). By applying this approach to each image stack of foam
specimens, we calculated the corresponding values of and strut thicknesses ( ). To
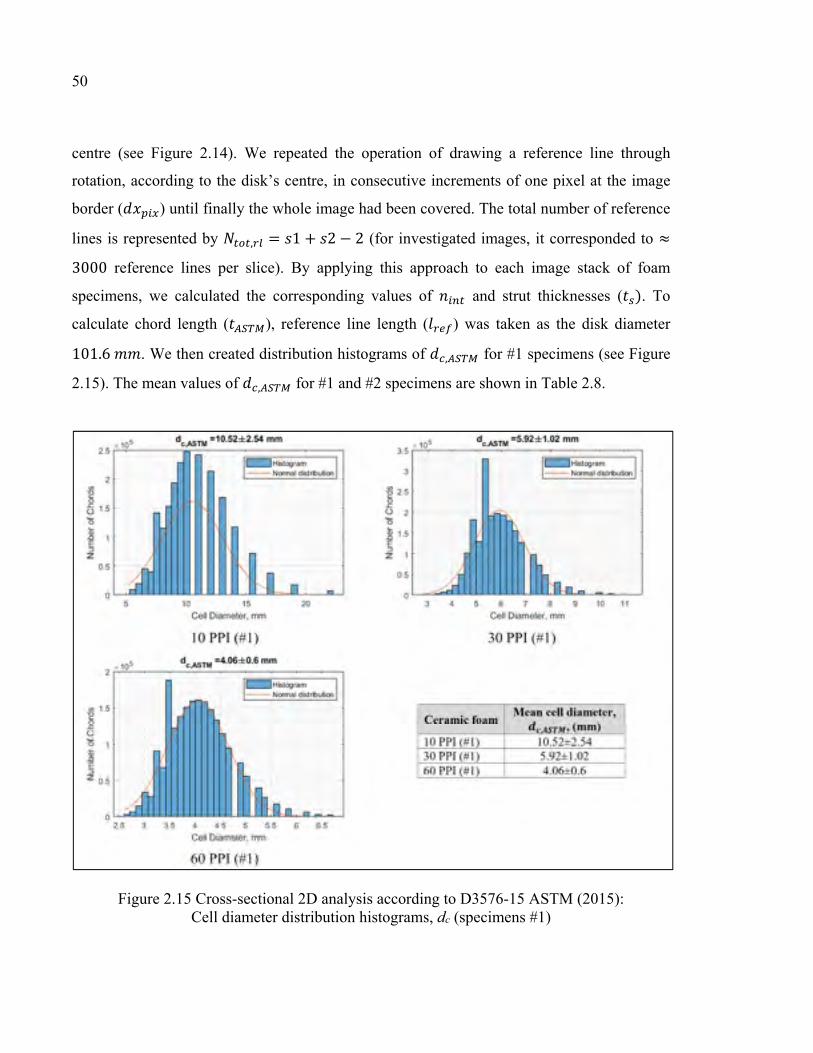
calculate chord length ( ), reference line length ( ) was taken as the disk diameter 101.6 . We then created distribution histograms of , for #1 specimens (see Figure
2.15). The mean values of , for #1 and #2 specimens are shown in Table 2.8.
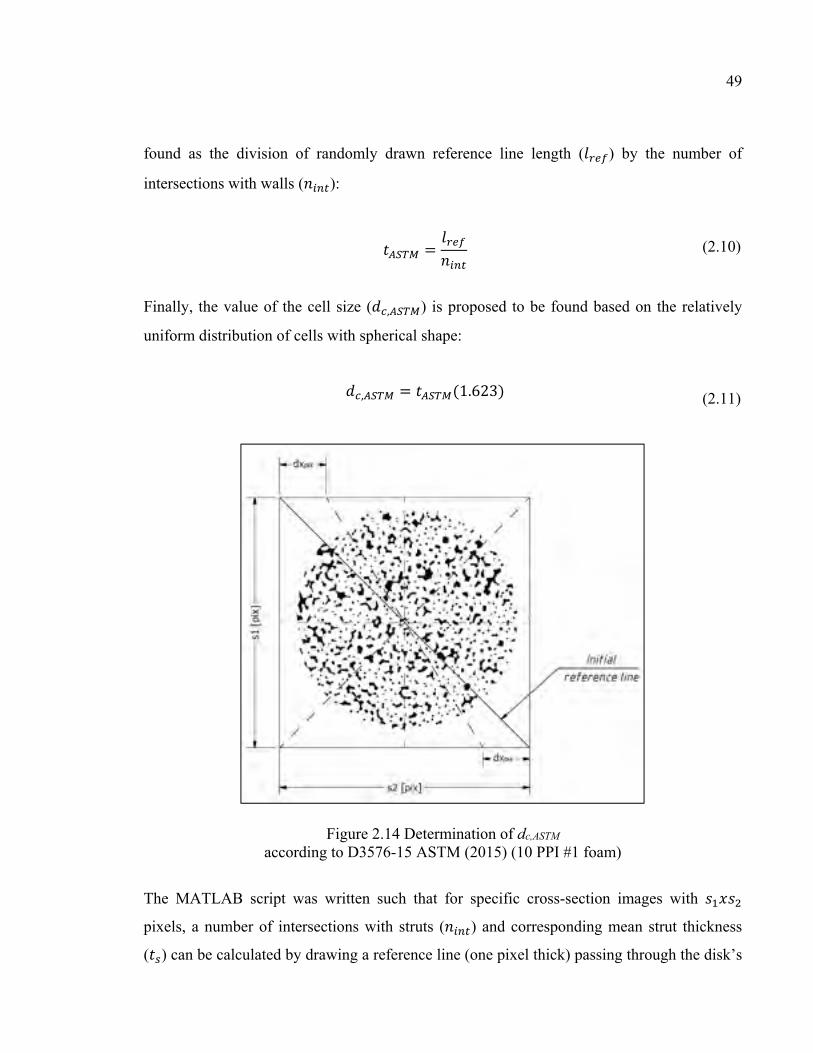
Figure 2.15 Cross-sectional 2D analysis according to D3576-15 ASTM (2015): Cell diameter distribution histograms, dc (specimens #1)
51
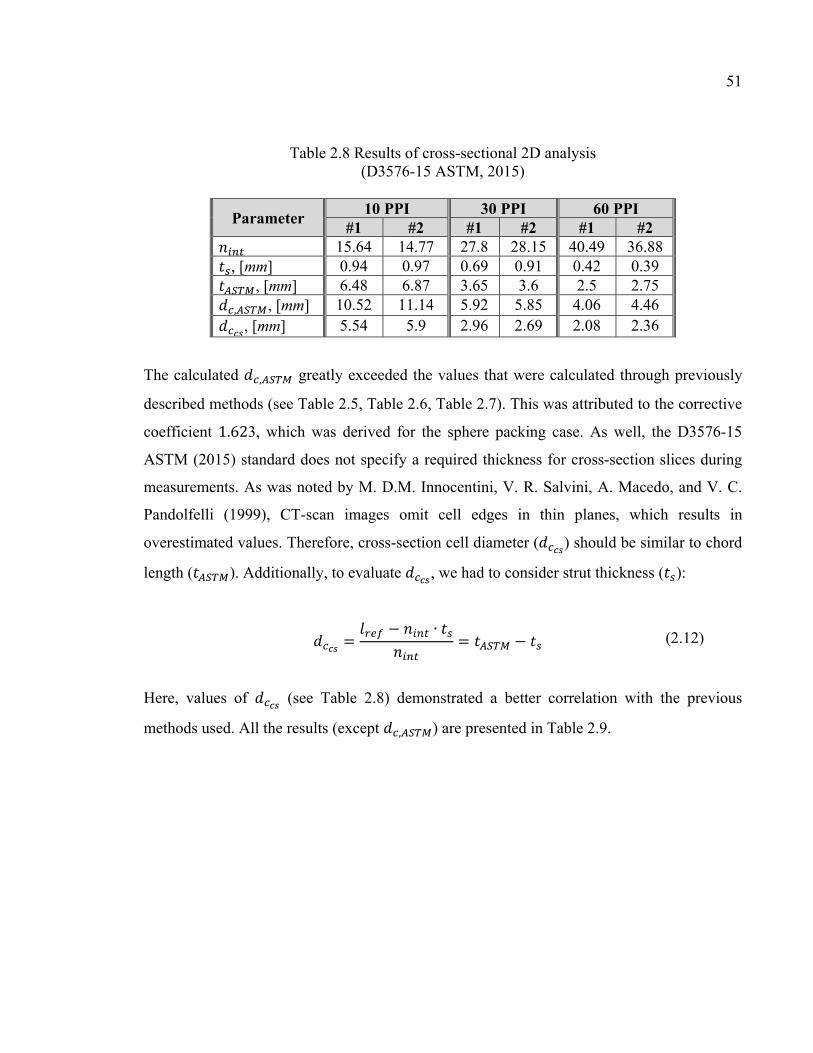
Table 2.8 Results of cross-sectional 2D analysis (D3576-15 ASTM, 2015)
Based on the notion that is a geometric characteristic, it is of interest to find its
dependence on geometric parameters ( , ). We analyzed the dependence of , on the
provided PPI values (see Figure 2.17) and compared it with the ( ) analyzed by M.
D.M. Innocentini et al. (1999); J. T. Richardson et al. (2000), and K. Boomsma and D.
Poulikakos (2001).
Figure 2.17 Comparison of the absolute permeability results with previous works
57
Generally, simulated data overpredicted the results from other works, which may be in part
due to differences in foam properties (porosity, cell/pore size, etc.). However, the results
were close to those found by K. Boomsma and D. Poulikakos (2001) and similar trends were
observed. Thus, the method of analysis provided by VG software can be considered
applicable for comparative study between various geometries.
Afterwards, dependence of , on the calculated pore diameters (see Table 2.10) was
investigated (see Figure 2.18). As can be seen from Figure 2.18 the best fit for prediction of , in the foam specimens (according to the coefficient) was obtained for the method
of cross-section analysis ( , = 0.9990).
Another parameter that is often used as a characteristic for the prediction of is
hydraulic diameter ( ) (B. Dietrich, W. Schabel, M. Kind, & H. Martin, 2009; O. Pitois, E.
Lorenceau, N. Louvet, & F. Rouyer, 2009). By definition, is an equivalent diameter of the
opening area ( ) with wetted perimeter ( ), found as:
= 4 (2.16)
To evaluate , a MATLAB script was written that allowed for the calculation of and in
each cross-section, and the mean values of for each image stack were obtained
The alternative method for the evaluation of the hydraulic diameter is based on the
assumption of the equivalent cylindrical diameter ( , ). According to A. Schlegel, P. Benz,
and S. Buser (1993), this can be found as:
59
, = 4 = 4 (2.17)
where = / is the specific surface.
By investigating pressure drops in porous foams with various PPI, (B. Dietrich et al., 2009)
proposed the next correlation of the Forchheimer equation:
Δ = 110 ∙ , + 1.45 ∙ , (2.18)
From which we can see that:
, = ∙ ,110 (2.19)
Figure 2.19 demonstrates the dependence of absolute permeability on hydraulic diameters.
Results of obtained from 2D image slices did not correlate well with , for 30 PPI
and 60 PPI specimens. Due to this, it might be assumed that high PPI foams require image
slices with higher resolution that allow for a more accurate determination of and [see
Eqn. (2.16)]. Considering results for , , they provided a better fit for the prediction of
and a good convergence between VG and the correlation proposed by B. Dietrich et al.
(2009).
Finally, pore diameters found using the cross-sectional analysis method provided the best fit
(based on the coefficient) to predict , . Thus, was considered as the
characteristic parameter of the foam specimens and was selected to design equivalent
diamond lattices. Hence, correlation for , = ( ) was found as:
, = 17.88 ∙ 10 ∙ − 12.28 ∙ 10 [ ] (2.20)
60
Figure 2.19 Dependence of absolute permeability (κperm) on hydraulic diameters (dh)
Discrepancy among specimens of the same PPI was evaluated based on parameter and
represented 5.9 %, 11.6 %, and 15.4 % for 10 PPI, 30 PPI and 60 PPI foams, respectively.
From these values it might be concluded that discrepancy among specimens having the same
61
porosity increases with increasing PPI. This result suggests that control over pore size
becomes more difficult as pore size decrease. This observed discrepancy favourably supports
our approach of using diamond lattice to obtain controlled and predictable foam geometry for
PMB.
2.3 Diamond lattice design and analysis
Figure 2.20 illustrates three main phases of the diamond lattice structure generation using a
MATLAB script written by M. Dumas et al. (2017). Two sets of input data are used (Figure
2.20a): 1. an STL-file of a body to be filled with lattices, which, in our case, corresponds to
the disk-like ∅101.6x50.8 mm volumes, and 2. a series of data related to the diamond lattice
structure: the strut thickness (ts), the size of a single diamond unit cell (a), and the replication
number of unitary cells in x-, y-, and z-directions (nx, ny, nz). Next, voxelization of the
volumetric domain takes place (Figure 2.20b), and, finally, the voxels are replaced by
diamond cells to form a disk-shaped specimen filled with diamond lattices of a given
geometry (Figure 2.20c).
Figure 2.20 Voxelization and lattice generation : (a) Input data: volume domain and unit cell definition; (b) voxelization and voxel
replacement; (c) lattice generation Adapted from B. Jetté et al. (2018)
62
Prior to analysis, the geometry of the diamond lattice was investigated and relationships of
interest were found (see APPENDIX II, p. 99). This allowed us to find all the required
geometric parameters ( , nx, ny, nz, etc.) by defining unit cell size (a) and strut thickness (ts).
To find the equivalent to the foam lattice design, three criteria of equivalency were
established: the first being absolute permeability ( , ), which characterizes flow
behaviour, and the second and third being porosity ( , ) and pore diameter ( , ),
respectively, which characterize overall lattice geometry.
By treating a unit cell size “ ” as a scaling factor, we obtained solutions for a structure with = 1 and the dimensionless parameter / . Further, the results could easily be expanded
into a general form by applying the corresponding scaling factor “ ”.
Figure 2.21 Characteristic diamond lattice volume for absolute permeability analysis
63
For our analysis, we used a diamond lattice with unit cell size = 1 and 8.5 8.5 8.5 unit
cells (see Figure 2.21). Geometric parameters varied by varying strut thickness ( ). After
geometries with different / parameters were modelled, they were imported into VG and
the corresponding absolute permeabilities , = ( , ), porosities = ( , ) and
pore diameters , = ( , ) were evaluated:
, = 2.248( ) − 4.59 ∙ 10 [ ] (2.21)
= 1.004 − 2.908 . (2.22)
, = 0.744 − 1.217 (2.23)
Figure 2.22 demonstrates the influence of “ / ” on dimensionless absolute permeability
( / ) and ( ). Higher / values are characteristic of geometries with more open
porosities and, as a result, higher permeabilities.
64
Figure 2.22 Dependence of dimensional absolute permeability (κperm/a2) and porosity (ε) on the dimensionless diamond lattice parameter (a/ts)
As was previously shown, the parameters of , , , and , were obtained as ( , ). From here, we were able to find three equivalent structures:
a) Equivalent permeability ( , = , ) and porosity ( , = );
b) Equivalent permeability ( , = , ) and pore diameter ( , = , );
c) Equivalent pore diameter ( , = , ) and porosity ( , = ).
The following equation systems were solved [Eqn. (2.24), Eqn. (2.25), and Eqn. (2.26)],
which lead to the determination of appropriate and values for each case. Results are
Analysis of the obtained data showed that equivalency in terms of , and , provided
structure with excess porosity and the smallest strut thicknesses, which are out of the
equipment’s manufacturing range ( < , = 0.3 ). Equivalency in terms of , and
, also provided struts with < , for 60 PPI specimens, which were the subject of
our research. Moreover, the obtained values of permeability for , and , , when
compared to the foam’s geometry, had elevated discrepancies in the range of 55% <Δ < 155%. We chose equivalency in terms of , and , , which provided the
appropriate strut thicknesses of ≥ 0.3 for all cases. Values of pore diameters had
discrepancies in the range of 25% < Δ < 60% (when compared to the foam’s geometry).
Figure 2.23 10 PPI (#1) foam. Diamond lattices with various criteria of equivalency: (a) Permeability and porosity; (b) Permeability and pore diameter;
(c) Pore diameter and porosity
Finally, diamond lattices, which are equivalent to foams, were chosen. Table 2.14
summarizes the parameters of foams and lattices selected for additive manufacturing.
67
Table 2.14 Final design parameters of diamond lattices and parameters of their foam equivalents
Parameter 10 PPI 60 PPI
Foam #1 Diamond
lattice Foam #1
Diamond lattice
Lattice x x - 17.5x17.5x8.5 - 49.5x49.5x24.5 Absolute permeability,
[108·m2] 30.83 30.91* 4.39 4.32*
Porosity, [%] 85.8 85.5* 87.9 87.3* Unit cell size, [mm] - 5.81 - 2.05 Strut thickness, [mm] 1.02 0.95 0.37 0.31 Pore diameter, [mm] 2.39 3.17 0.91 1.15 Specific surface, [m-1] 531 508 1202 1366 * Slight difference due to structural adjustment of the overall dimensions
A flowchart of the design process of equivalent diamond lattices compared to the ceramic
foams, is presented in Figure 2.24.
Figure 2.24 Process of the equivalent diamond lattice design
68
Figure 2.25 demonstrates that dimensionless absolute permeability ( / ) is dependent
on dimensionless specific surface ( ∙ ). A higher ∙ corresponds to a structure with a
higher outer surface, and might be considered to be a frictional parameter that prevents the
passage of the flow.
Figure 2.25 Dependence of dimensionless absolute permeability (κperm/a2) on dimensionless specific surface (Sv·a)
2.4 Additive manufacturing
After the geometric parameters of equivalent diamond lattices were determined, the next step
was to prepare four specimens for additive manufacturing (see Table 2.14). A flowchart
69
representing the steps taken from the preparation of digital prototypes to the point where the
specimens were ready for experimentation is presented in Figure 2.26.
Figure 2.26 Additive manufacturing flowchart
First, STL-files of the four specimens were generated by means of VG for foams and a
MATLAB script for diamond lattices. In the current work, the MATLAB script was
improved by introducing parallel computing and generation of binary STL-files. This
reduced the time and file size required to generate structures with a high number of elements
(i.e. for 60 PPI lattice, generation time was x5.5 faster, and file size x4 smaller; tested on
Intel® Xeon® CPU E5-2660x2, 28 cores). Each STL-file was then imported into the
Materialise Magics software for mesh cleaning and for error reparation (flipped normals,
overlapping triangles, etc.). Afterwards, each repaired STL-file was treated by the proprietary
EOS RP Tools slicer, and the obtained files were used for final job preparation.
Next, the EOSINT M280 machine was filled with CoCr powder and the LPBF-printing
process began. We unfortunately encountered some difficulties during the manufacturing of
the 49.5x49.5x24.5 diamond lattice due to the jamming of the 3D printer’s recoater with
numerous thin struts (0.31 mm). This part was excluded from production. The application of
a carbon brush recoater could overcome this problem in the future.
As a result, 3 specimens for CoCr were printed: 10 PPI Foam (#1), 60 PPI Foam (#1) and 10
PPI Diamond Lattice (17.5x17.5x8.5). Specimens were then cleaned of residual powder and
70
underwent subsequent stress relief of the parts by heat treatment (6 hours at 1150 °C under
inert an argon atmosphere). Parts on the building plate post-heat treatment can be seen in
Figure 2.27.
Figure 2.27 CoCr specimens after printing, cleaning and heat treatment
The parts were then cut from the building plate via electrical discharge machining (EDM)
and each specimen was weighed (results are presented in Figure 2.28).
71
Figure 2.28 CoCr specimens after EDM cut
From the obtained values, we found that 10 PPI CoCr Foam and 10 PPI CoCr diamond
lattices had similar relative masses ( = 494 and = 481 , respectively), and thus
porosities ( = 85.5% and = 85.9%, respectively). The discrepancies in porosity between
obtained values and the design parameters ( = 85.8% and = 85.5%, respectively, see
Table 2.14) can be attributed to possible error during the manufacturing process (STL file
preparation, 3D printing, EDM cut, etc.). Moreover, the 60 PPI CoCr foam was overly dense
and had a porosity of approximately = 75.2% compared to its theoretical value of = 87.9%. This was due to the sintering of additional CoCr powder caused by close
positioning of strut elements. Similar results were obtained by R. Vrana, D. Koutny, and D.
Paloušek (2016). The obtained results require the application of specific printing parameters
that take into account the close arrangement of strut elements.
2.5 Test bench design
The conceptual design of the porous medium burner (PMB) was chosen as proposed by W.
M. Mathis and J. L. Ellzey (2003). The burner’s overall dimensions are shown in Figure-A
IV-I (see APPENDIX IV, p. 105). A schematic of the experimental apparatus is shown in
Figure 2.29. Air is fed from the compressed air source (1) and methane from the bottle (2).
Methane is controlled by two mass flow controllers (MFC) Omega FMA 5400/5500 (3) with
flow range of 0-15 lpm (calibrated for N2). Air is controlled by one MFC Azbil MQV0200
72
(4) with flow range of 0-200 lpm, and one Cole-Parmer impact-resistant flowmeter (IRF)
RK-32900-54 (5) with flow range of 10-100 lpm (both calibrated for air). The flashback
arrestor SGD 8491-F (6) was installed prior to the mixing chamber (7). Two porous mediums
were installed in the upstream (8) and downstream (9) sections with respectively high and
low pore densities.
Porous materials were wrapped in the “Industries 3R ceramic wool 3R2900” insulation
blanket (10) and inserted into the stainless steel case. On the one side of the case, holes were
drilled to insert twelve Omega K-type thermocouples (d=0.032’’) (11) which, in turn, were
inserted into ceramic sleeves and pierced through the insulation blanket. Above the burner, a
probe was placed (12) so that the sampling path first leads to the cooling system with the
water trap (13) and then to the gas analyzers (14) measuring CO, NOx, CH4, O2, and CO2
emissions. Accuracy and operation ranges of the equipment used are presented in Table-A
V-1 (APPENDIX V, p. 107), and concentrations of calibration gases for gas analyzers are
presented in Table-A V-2 (APPENDIX V, p. 107).
Prior to the upstream section of the burner, we installed a water manometer (15) for pressure
drop measurements. The operational program was written in LabVIEW to control and read
MFC’s flow rates for various equivalence ratios to read the corresponding data from the
thermocouples and gas analyzers. The test bench wiring diagram is shown in Figure-A VI-I
(APPENDIX VI, p. 111). During each experiment, the corresponding data was written into a
log file in 1-second intervals.
73
Figure 2.29 Schematic of experimental apparatus
1 – Compressed air source; 2 – CH4 methane bottle; 3 – Omega FMA 5400/5500 mass flow
(d=0.032’’); 12 – Probe; 13 – Gas cooling system with water trap; 14 – Gas analyzers:
CO (CAI Model 200), NOx (CAI 600 Series), CH4 (CAI 600 Series), CO2 and O2 (ABB
Multifid URAS 14) ; 15 – Water Manometer.
74
2.6 Testing procedures
Temperature profiles and pollutant emissions of the / mixture for all six setups (see
Figure 2.5) were examined at the same flow regime. Parameters of the flow ( = 0.6; =34.6 cm/s) were chosen based on our review of the literature and the range of stable
operation limits (M. T. Smucker & J. L. Ellzey, 2004). Flame speed ( ) was taken according
to V. Khanna et al. (1994) and assumed as a ratio of total flow rate ( ) to the cross-section
area ( ) of the porous material:
= (2.27)
Each experiment was preceded by preparative measures, such as a leak test, an equipment
warm-up phase (2.5 hours), and the calibration of gas analyzers. and emissions were
measured for various to check for correct composition of the / mixture controlled
by LabVIEW. The measured values of the products agreed with theoretical values. After
undergoing these preparative procedures, each experiment began with the preheating of the
burner at = 0.75 − 0.8 for 10-20 minutes. The flame front at these conditions was located
near the edge of the downstream section. 50 lpm of air was provided at a constant rate during
each test. After the preheating phase, equivalence ratio and total flow rate steadily decreased,
until the flow was stabilized at = 0.6 and = 34.6 cm/s. The location of the flame front
was observed just downstream from the interface of the two sections.
After reaching a steady-state regime, a probe took samples at 9 critical points just above the
downstream section (centre and around the perimeter, see Figure 2.30). Each point was
probed for a period of 1 minute to measure pollutant deviations. During our first attempt of
measurements, we detected an increase in emission level at several points around the
perimeter. Upon examination, we found that this was due to the to measure these deviations
tight insulation wrapping around the porous material. We corrected for this by adding
75
additional layers of insulation. Once we had verified that the burner was operating properly,
temperature, pollutant emissions, and pressure drop measurements were taken.
Figure 2.30 Emission probing points
2.7 Summary of the design methodology
In this chapter, we describe the steps leading to the final PMB test bench design. Three types
of ceramic SiSiC foams with different pore sizes (10 PPI, 30 PPI, and 60 PPI) were chosen.
This resulted in the selection of six experimental setups that allowed for comparison between
irregular foam and patterned diamond lattice geometries, as well as between ceramic SiSiC
and metal CoCr materials. Based on the X-ray CT scan data, different methods of foam
morphology analysis were used to determine porosity, strut thickness, cell/pore size, and
absolute permeability. By comparing the pore size results obtained from the different
approaches with the results of direct measurements from 3D reconstructed volumes, the
closest fit was attributed to , (which is found through a combination of the adapted cross-
section analysis method ( ) and the tetrakaidecahedron model). Moreover, values of ,
provided the best fit for prediction of absolute permeability obtained from simulations in
VGStudio Max software.
76
Based on the results of foam analysis, equivalent diamond lattices were designed in terms of
their porosity and absolute permeability. As a result, three specimens (10 PPI foam, 10 PPI
diamond lattice, and 60 PPI foam) were printed from CoCr material by means of the LPBF
method. 10 PPI foam and lattice specimens had the anticipated porosities and geometries,
whereas the porosity of the 60 PPI foam was lower than what was predicted, due to sintering
of additional material during manufacturing and the resulting smaller pores. Adapting the
AM for the production of diamond lattices with high PPI could solve this discrepancy.
Finally, the test bench was assembled and the required equipment was connected by tubing
and wiring. The control program was written in LabVIEW, which allowed us to read and
control the parameters of the flowmeters, thermocouples, and gas analyzers.
CHAPTER 3
EXPERIMENTAL RESULTS
This section presents our experimental results. The primary goal was to compare reference
setup #1 (SiSiC foams in the upstream and downstream sections) and setups with 3D-printed
CoCr porous specimens in terms of their temperature profiles, pollutant emissions, and stable
operation. Additionally, we investigated the structural durability of porous materials.
3.1 Experimental results
3.1.1 Temperature
Temperature measurements were taken by inserting 12 thermocouples into ceramic sleeves
and piercing them through an insulation blanket (see Figure-A IV-I, APPENDIX IV, p. 105).
All temperature measurements—due to thermal equilibrium between the thermocouple hot
junction, the gas, and the solid phase—should be understood as a mean value between the
gas and solid phases (R. W. Francisco Jr., F. Rua, M. Costa, R. C Catapan, & A. A. M.
Oliveira, 2009; R. Huang, L. Cheng, K. Qiu, C. Zheng, & Z. Luo, 2016). Results of the
temperature profiles represent the same moment corresponding to 10-minute intervals after
the flame had been stabilized near the interface of the upstream and downstream sections.
Figure 3.1 provides information on average temperatures ( ; Figure 3.1a) and temperature
profiles for all six setups. The setups are divided in two categories for the upstream section
namely SiSiC foam in Figure 3.1b and CoCr foam in Figure 3.1c.
78
Figure 3.1 Temperature profiles: (a) Tav in the upstream and downstream section;
(b) First case: 60 PPI SiSiC and three PM; (c) Second case: 60 PPI CoCr and three PM
79
The first case (Figure 3.1b; setups #1, #4, and #5) represents 60 PPI SiSiC foam in the
upstream section and three porous media (10 PPI SiSiC foam (#1), 10 PPI CoCr lattice (#1),
and 10 PPI CoCr foam) in the downstream section. It is difficult to make a certain conclusion
based on temperature profiles in the first case, as after approximately 10 minutes of stable
operation, the flame front tended to shift towards the upstream section without quenching and
produced flashback. This phenomenon corresponds to filtration combustion, which was also
observed by P.-F. Hsu et al. (1993). One might conclude that the operational regime ( =0.6; = 34.6 cm/s) that was chosen from the literature was unstable for the setup with
ceramic 60 PPI SiSiC foam in the upstream section, and may require a higher flame speed ( ) at the chosen equivalence ratio of = 0.6. However, the general trend that was
observed, is that reference setup #1 (all-ceramic) provided the highest Tmax in comparison
with setups #4, and #5 which had CoCr specimens in the downstream section. Such result
might be explained by higher ks of SiSiC compared to CoCr.
The second case (Figure 3.1c; setups #2, #3, and #6) represents 60 PPI CoCr foam in the
upstream section with the same three porous materials in the downstream section at the same
flow conditions ( = 0.6; = 34.6 cm/s) that were seen in the first case. From the
experiment, by replacing SiSiC with CoCr in the upstream, we observed a general trend
where the flame front shifted towards the centre of the downstream region. Moreover, it was
observed that after stabilization, the flame front stayed at the same position without
temperature fluctuation for an extended period of time (>20 minutes). Table 3.1 summarizes
information on the Tav, Tmax and flame front position (xf) with standard deviations calculated
on a 10-minute interval of stable operation. Variation in temperature measurements and
flame location did not exceed 3% and for that reason were considered as stable operation
regime.
80
Table 3.1 Average temperature (Tav), maximum temperature (Tmax) and flame front location
In comparing the temperature profiles of setup #2 and setup #6, similar temperature profiles
were obtained in the upstream section and during transition to the downstream section.
However, near the flame front’s location, the SiSiC material (setup #6) provided lower
temperatures when compared to the CoCr material (setup #2). Since the thermal conductivity ( ) of both materials differs by less than 28% (see Table 2.1), we expected no significant
change in maximum temperature according to numerical analysis provided by A. J. Barra et
al. (2003), who changed by 1000%, and according to the experimental results obtained by
H. B. Gao et al. (2014), who varied by 155%. Therefore, the results of Figure 3.1c are
consistent with the literature and with the results from Table 3.1, which shows that the
average downstream temperature differs by only 6% between SiSiC and CoCr foams.
Replacing foams (setup #2) with lattices (setup #3) resulted in the downstream shift of the
flame front and in higher Tmax, which may be attributed to higher dp in the lattice structure.
By comparing two cases, higher of SiSiC in the upstream section (setups #1, #4, and #5)
may be responsible for unstable operation and flame displacement towards the inlet section,
which corresponds with the numerical analysis provided by A. J. Barra et al. (2003), such
that higher in the upstream results in a higher and lower dynamic range. This
observation is supported by Table 2.1, which shows the difference in between SiSiC and
CoCr materials for high and low temperatures. It might be concluded that differences in heat
transport properties are more influential at lower temperatures (corresponding to the
upstream section), whereas for higher temperatures (corresponding to the downstream
section), thermal properties are of the same order, and should be less influential on flame
properties.
81
3.1.2 Flame stability
During operation, various flame instabilities were observed prior to finding operational
regimes. For SiSiC in the upstream region, we detected undesirably high energy recirculation
to the upstream section, which resulted in steady flame propagation towards the inlet section.
This phenomenon was not observed with CoCr in the upstream region. The obtained result
confirmed what was numerically predicted by A. J. Barra et al. (2003) in terms of an
advantageous application of the material with low thermal conductivity ( ) and high
radiative extinction coefficients ( ) in the upstream section. As a result of the lower and
slightly higher , which according to P.-F. Hsu and J. R. Howell (1992) is higher for
lower pore diameters, printed 60 PPI CoCr foam had superior flame arresting and
stabilization properties.
3.1.3 Pollutant emissions
In all cases, emission profiles were close to the detection limit of the equipment. , ,, and emissions are presented in Figure 3.2.
emissions were at the detection limit of the equipment, and did not exceed 325 ppm. We
would suggest using more precise equipment to improve measurement precision. This might
explain why, depending on the setup configuration, obtained values were higher than or
similar to what was reported in previous research with different foams (H. B. Gao et al.,
2014; C. Keramiotis et al., 2012). Lower values of were obtained for setups with 60 PPI
CoCr foam in the upstream region, which corresponded to lower average temperature of the
downstream region (see Table 3.1). Lower temperatures in the downstream region can also
be linked to lower , as seen in H. B. Gao et al. (2014).
We also took pressure drop measurements of cold air for various flow velocities ( = 0 −72 / ). We used a water manometer as a measuring device, shown in Figure 2.29
(pos. 14). For each case, it was verified that at the beginning and at the end of the
experiment, flow speed would be equal to zero ( = 0 / ) and water level would remain
the same.
Because single 10 PPI and 30 PPI specimens have very low pressure drop values,
configurations involving two porous media (as was the case during the combustion
experiment) were used. As some foams were damaged, 60 PPI CoCr foam was used in
combination with other porous specimens for the pressure drop experiments.
Figure 3.3 demonstrates the dependence of pressure drop (Δ ) on flow velocity ( ). From
the results we obtained in setup #4 and setup #5, we noticed similarities in the geometry of
the acquired 10 PPI SiSiC foam and the printed replica 10 PPI CoCr foam, which
demonstrates the replica’s quality. From these setups, we could also see a similarity between
foam and diamond lattice geometries in terms of absolute permeability ( ).
84
Through comprehensive foam and diamond lattice analysis, mean pore diameters were
evaluated, which allowed us to study the dependence of Reynolds number ( ) on pressure
drop (Δ ) (see Figure 3.4). was found as:
= ∙ (3.1)
where is flow velocity, is pore diameter, and is air viscosity.
Table 3.3 shows the pore sizes used during evaluation of . Pore diameter of 60 PPI CoCr
foam was adjusted to = 75.2% according to Eq. (A I-10) and Eq. (A I-11), assuming unit
cell size to be constant. Pore diameters of setup #4, setup #5, and setup #6 were taken as
mean diameters between the two foams in the setup.
Table 3.3 Pore diameters of specimens
Specimen , [mm]
60 PPI CoCr foam 0.75 10 PPI SiSiC foam 2.39 10 PPI CoCr foam 2.39 10 PPI CoCr lattice 3.17
Operational regime during the experiment ( = 0.6; = 34.6 cm/s) provided similar
pressure drop values (Δ ≈ 11 ) for setups #4, #5, and #6 (see Figure 3.3). Pressure drop
is often presented in this way in the literature, since average pore diameter is usually
unknown. However, thanks to based on the average pore diameter—the advanced
measurement technique used herein—this number was used to illustrate the difference in the
geometric characteristics of each porous media (PM) on flow.
The convenience in considering rather than velocity is that flow characteristics in PM are,
in general, characterized and identified by , which allows us to distinguish between
different flow regimes (Darcy, Forchheimer, etc.). Thus, Figure 3.4 illustrates the same
results as Figure 3.3, but shows pressure drop as a function of . Contrary to Figure 3.3,
85
where few differences were observed in a pressure drop for any given velocity, Figure 3.4,
which used , shows that setup #6 had lower pressure drop values at equivalent when
compared to setups #4 and #5 (foam in SiSiC and its replica in CoCr, respectively).
Combustion tests were conducted at a constant inlet velocity, which resulted in a higher
for setup #6 and, in turn, increased heat transfer by convection. Higher heat transfer by
convection for setup #6 impacted the burner temperature profile which might in part explain
the higher temperature observed in Figure 3.3 for that setup. Nevertheless, more experiments
and numerical simulations are needed to confirm this hypothesis.
Figure 3.3 Δp versus V: 60 PPI CoCr Foam, and setups #4, #5, #6
86
Figure 3.4 Δp versus Re: 60 PPI CoCr Foam, and setups #4, #5, #6
Figure 3.5 demonstrates a comparison of pressure gradient results for 60 PPI CoCr between
measured values and the values obtained according to Eq. (2.17). Both results demonstrated
the same trends, though when compared to (B. Dietrich et al., 2009), suggested overpredicted
values [for calculations, the , of the 60 PPI CoCr specimen was evaluated according to
Eqn. (2.17), such that was evaluated from the adjusted value in VG 60 PPI SiSiC (#1)
foam to the appropriate porosity ( = 75.2%)]. This result demonstrates that geometry plays
an important role on flow parameters for structures like foams, which have high
discrepancies in their morphologies, even for specimens with similar PPI.
87
Figure 3.5 Δp/L: Comparing the results of the current study and those of B. Dietrich et al. (2009)
3.1.5 Structural durability
After the burning tests, specimens were examined based on their structural differences.
Material oxidation was observed under high temperature conditions. Results from before and
after the tests are presented in Figure 3.6. Due to oxidation, material degradation in the CoCr
materials resulted in the formation of residual particles. In SiSiC specimens, oxidation was
88
characterized only by a change in the colour of the material. 60 PPI CoCr foam, however,
was not susceptible to deterioration, since it was not exposed to high temperatures.
Figure 3.7a demonstrates that ceramic foams with small pores (60 PPI) were subject to
structural damage as a result of thermal shock during unstable operation and flame
propagation towards the inlet section, in contrast to the undamaged specimens with large
pores (10 PPI). This finding agrees with the results obtained by V. R. Vedula et al. (1999),
where it was found that ceramic foams with small pores are more susceptible to structural
failure.
Table 2.1 demonstrates a comparison between SiSiC and CoCr materials in terms of thermal
shock resistance ( ) and fracture toughness ( ). Although 60 PPI CoCr foam was not
subject to high temperatures during the experiments, perhaps the CoCr alloy possesses
superior properties for resisting thermal shock ( for CoCr is almost twice that of SiSiC) and
crack propagation (the of CoCr is 50 times higher than the of SiSiC). Thus, CoCr
material might be beneficial for application in the upstream section to reduce the possibility
of structural damage. This theory should be examined in future research.
After burning tests due to temperature gradients, 10 PPI CoCr foam became distorted,
whereas the 10 PPI CoCr Diamond lattice kept its original form (see Figure 3.7b). According
to the findings of (N. A. Fleck, 2004), this is due to the higher stiffness and higher initial
yield strength of the diamond lattice when compared to foam-like structures.
89
Figure 3.6 Oxidation of SiSiC and CoСr materials after operation in PMB
Figure 3.7 Failures after operation: (a) SiSiC: crack formation of the 60 PPI foam; (b) CoCr: Deformation, comparison between
the 10 PPI lattice and foam structures
90
By comparing the structural durability of the diamond lattice with that of conventional
ceramic foams, we found that the diamond lattice geometry made of the metal CoCr material
provided higher structural stiffness and superior resistance to thermal shock and crack
propagation. However, due to CoCr oxidation under extreme temperatures, its application
might be limited exclusively to the upstream region.
3.2 Summary of the experimental results
This chapter described our PMB combustion experiment through our six setups, which had
the same operational regime ( = 0.6; = 34.6 / ). This regime examined the
applicability of tailored diamond lattice geometries and metal CoCr materials. We examined
this by taking measurements of the temperature, pollutant emissions, and pressure drop.
From our experiments, we found that CoCr had a more beneficial application in the upstream
section than ceramic SiSiC, and resulted in a more stable and safer operation. Setup with
SiSiC material in the upstream section resulted in flame propagation towards the inlet section
without being quenched, which resulted in flashback. Moreover, CoCr provided higher
resistance to thermal shock. Experimentally, we found that after operation the diamond
lattice had no distortions when compared to the foam geometry, which demonstrated its
higher structural rigidity. Through pressure drop measurements, we found that absolute
permeability for foam and diamond lattice geometries was similar. However, it was
determined that in terms of flame stabilization, Reynolds number ( ) [which is a function
of pore diameter ( )] plays a crucial role, and should be taken into consideration during the
design of diamond lattices.
An important part of the research was to provide measurements of , , and levels
which demonstrated an almost pollution-free operation in all experimental setups. This
finding supports the results of previous research experiments (C. Keramiotis et al., 2012; W.
M. Mathis & J. L. Ellzey, 2003). Our findings also suggested emission levels which were
lower than those of open-flame burners (C.-Y. Wu, K.-H. Chen, & S. Y. Yang, 2014).
CONCLUSION
The primary objective of this work was to design PMB and to investigate the potential
benefits of using AM by replacing an irregular foam with a regular diamond lattice. As a
result, six experimental setups were created and tested, and subsequently compared in terms
of their pollutant emissions and operational stability.
Conventional ceramic, sponge-like foams were acquired, and methods of foam analysis were
investigated to define their main physical characteristics. We conducted our investigation
using CT scan technology, which allowed us to obtain geometric parameters (porosity, pore
size, strut thickness, etc.) as well as absolute permeabilities [by means of VGStudio Max
software (VG)]. From this analysis, the geometric properties of the equivalent diamond
lattice parameters were proposed.
Through foam analysis, it was determined that PPI value (the main parameter indicated by a
manufacturer that represents pore diameter) provided underestimated results when compared
to the actual measurements. Based on the results of manual pore size measurements from
digitally reconstructed parts and correlations of absolute permeability on pore size, the
combination of the developed tetrakaidecahedron model and the adapted method of cell size
analysis ( , ) by D3576-15 ASTM (2015) lead to favourable determination of pore
diameter ( , ) among the examined methods. Study of ceramic foams confirmed the
complexity and discrepancies between geometries that have identical PPI value. Thus, from
the manufacturer’s point of view, regular diamond lattices should be favoured for their high
repeatability. Finally, equivalent parameters of diamond lattices were obtained and
corresponding structures have been proposed for LPBF using CoCr, which has the highest
operational temperature of the available metals and for the LPBF equipment available in our
laboratory.
The test bench was designed and assembled to allow for the measurements of temperature,
pollutant emissions, and pressure drop. To examine the influence of CoCr material in the
92
upstream and downstream sections on the burner’s pollutant emissions and operational
stability, as well as to verify equivalency between foam and diamond lattice geometries,
three specimens were prepared and printed: 10 PPI foam, 10 PPI equivalent diamond lattice,
and 60 PPI foam.
Through our obtained data, we confirmed a PMB operation with low pollutant emissions and
detailed the potential applications of AM (or 3D printing) in PMB design. The replacement
of foam geometry with that of a diamond lattice might better predict the combustion
processes by numerical methods. From the operational point of view, high PPI metal (CoCr)
material was favourable in the upstream section. During experiments at steady state
conditions, using high PPI SiSiC material in the upstream section resulted in a constant
temperature increase in the medium followed by flame propagation towards the upstream
region. This was attributed to the high thermal conductivity of the SiSiC matrix and
excessive heat transfer from the downstream section to the upstream section. In contrast,
using high PPI CoCr material in the upstream section resulted in better performance as a
flame arrestor (as it did not allow flame propagation towards the upstream section) and better
operational stability, since it shifted the flame front towards the downstream section. For the
downstream region, applying low PPI SiSiC material was favourable because of the
material’s high temperature operational limit and higher heat transfer properties.
RECOMMENDATIONS
1) From the above-mentioned results, we recommend using AM to produce diamond lattices
with high PPI metal (CoCr) material in the upstream section and low PPI ceramic (SiSiC)
material in the downstream section. We recommend manufacturing high PPI CoCr
diamond lattice using the LPBF method. Low PPI SiSiC diamond lattice, on the other
hand, might be manufactured using a hybrid method: firstly, 3D-print its shape from the
polymer and then apply the conventional ceramic replication technique (A. Ortona, C.
D'Angelo, et al., 2012).
2) Another field of improvement in PMB design lies in the development of a multi-stage
structure with gradient pore size distribution. Appropriate numerical models should be
devised to find the optimized diamond lattice parameters. In this case, AM represents the
optimal solution for the production of such complex geometries with a high level of
accuracy.
3) Future research could investigate lattices of various unit cell types. A tetrakaidecahedron
is a structure that has promising potential for future research. One of its advantages, in
comparison with the diamond lattice, is that it has a higher specific surface and the same
pore size, which is favourable for both flame quenching and heat transfer.
4) Current research is limited to one operational regime (flame velocity and equivalence
ratio), thus the determination of stability limits at various equivalence ratios should fuel
future research.
5) CoCr material in the upstream section was found to be beneficial, and ensured better
flame stability. It would be interesting to verify the assumption of higher CoCr durability
to thermal shock and crack propagation by exposing it to high temperature gradients in
the upstream section.
94
6) The measured values of pollutant emissions were at the detection limits. More precise
equipment would help us to investigate the influence of material types and geometric
parameters.
7) Permeability results and derived correlations were based on VGStudio Max software, and
discrepancies between various research efforts were observed. Therefore, it is of interest
to validate the obtained data with the experimental data. To reduce the cost, we propose
printing experimental structures from polymer materials, and only afterwards taking
pressure drop measurements.
APPENDIX I
TETRAKAIDECAHEDRON MODEL
Figure-A I-I Tetrakaidecahedron unit cell
This section explains the main relationships characterizing tetrakaidecahedron unit cells. (W. Xu et al., 2008) defines pore size as an equivalent pore diameter ( ) of the circle with an area, equal to the hexagon opening: = 4 / (A I-1)
In this approach, however, additional square openings are not considered ( ), and so a better correlation was obtained by using: , = 4 / (A I-2)
where, = 8 + 614 (A I-3)
Analytically it might be found that:
96
= 2√3 √34√2 − 2
(A I-4)
= 2√2 − (A I-5)
And finally:
, = 6 2√2 − + 16√3 √38 − 2
(A I-6)
Correlations for porosity ( ), cell diameter ( ) and equivalent pore diameter ( , ) were obtained as functions of unit cell size and strut thickness ( ). This approach was based on the combination of CAD modelling and MATLAB’s “Curve fitting tool”. Correlations were carried out for porosities ≥ 0.7, which lie in the range of investigated ceramic foams. Solid volume of the tetrakaidecahedron unit cell is found from / = ( / ) as: = 3.421 .
(A I-7)
Thus porosity of the unit cell is found as: = 1 − 3.421 .
(A I-8)
Volume of the tetrakaidecahedron cell (not to be confused with the unit cell) is found as:
= ( − 0.5) (A I-9)
If we consider the volume of the sphere to be equal to the volume of the cell, then the cell diameter ( ) is found as: = 6( − 0.5)
(A I-10)
Equivalent pore diameter , is found from , = ( ) as:
, = (0.1306 . + 0.4114) (A I-11)
97
In cases where the measurements are limited only by porosity (0.7 < < 0.94) and strut
thickness, equivalent pore diameter might be found from , = ( ) as:
, = (0.0869 . + 1.995 ∙ 10 . ) (A I-12)
It should be noted that solutions were obtained for struts with circular cross-sections, so coefficients for other geometries may vary slightly.
For evaluation purposes, the number of pores in the tetrakaidecahedron lattice might be found as: , = 14 − ( + + − 3) (A I-13)
where , , – number of unit cells in x-, y-, z-directions.
APPENDIX II
DIAMOND LATTICE MODEL
Figure-A II-I a) Diamond unit cell; b) Diamond “unit cell” with “cell” and “demi-cells”
This section explains the primary relationships characterizing a diamond lattice unit cell. Assumptions according to are the same as in APPENDIX I (p. 95). The MATLAB code, which generated our diamond lattice structure, was taken from the works of (M. Dumas, 2016). For this structure (see Figure-A II-I) hexagonal cross-sections of struts were used. Additionally, a distinction between “unit cell” (which represents a cubic repetitive volume in lattice) and “cell” (which is represented as inscribed between struts volume) should be understood. In a diamond lattice, each “unit cell” consists of a total of four “cells” (one inscribed in the centre, and six demi-cells, which are required for filling the volume during patterning).
100
Therefore, the total number of cells ( , ) might be defined as: , = 4 (A II-1)
where , , and are the number of unit cells in the x-, y-, and z-directions. For the evaluation of fully enclosed cells in the structure ( , , ) without considering open edges, the solution was found as: , , = 4 − 2 + + + ( + + ) (A II-2)
Each cell consists of four pores, and so by knowing the total number of cells, the total number of pores ( , ) in the diamond lattice can be evaluated as: , = 4 , , (A II-3)
Total volume of the diamond lattice solid ( , , ) is found as: , , = , ∙ , (A II-4)
where , is the solid volume of the unit cell and , is the total number of “unit cells”, which found as: , = 2 [3√2 sec − 7 tan ]√3 (A II-5)
, = (A II-6)
where – strut thickness and = tan (√ ) By assuming that cell volume equals to the volume of the sphere, cell diameter is found as: = 6 / (A II-7)
where, = ( − , )/4 (A II-8)
Porosity ( ) of the whole structure is found as: = 1 − , (A II-9)
101
Simplified relationship for porosity in terms of cell size and strut thickness: = 1.004 − 2.908 .
(A II-10)
The total volume of the diamond lattice finally might be found as , = , ∙ , (A II-11)
Applying the principles described in APPENDIX I (p. 95), pore diameter ( , ) is found
from , = ( ) as:
, = 0.744 − 1.217 (A II-12)
Dependence of the outer surface for unit cell is found as: , = 8.94 . − 1.07 ∙ 10 [ ] (A II-13)
The outer surface of the rectangular diamond lattice is found as: = 8.94 . − 1.07 ∙ 10 [ ] (A II-14)
Specific surface = / is found as: = 0.02083 − 0.5697 + 5.643[ ] (A II-15)
Therefore, by defining the number of unit cells in x-,y-,z-direction, unit cell size and strut thickness ( ), the main geometric parameters of diamond lattice may be obtained.
APPENDIX III
ADDITIONAL METHODS OF FOAM ANALYSIS
a) Ceramic foam manufacturers use PPI and values that are taken from the producers of polymer foams. In turn, the latter usually define them according to their own internal test methods (FXI, 2014). Figure-A III-I shows dependence of average pore diameter on pore size.
Figure-A III-I Average Pore Diameter vs Pore Size
Taken from (FXI, 2014) From Figure-A III-I it might be obtained relationship = ( ) as:
= 17.7− 1.4[ ] (A III-1)
b) Assuming the pores are cylindrical and of uniform pore distribution, X. Fu et al.
(1998) proposed the definition of the mean pore diameter by knowing PPI and the porosity of the foam:
= 25.4 4 /
(A III-2)
104
c) Assuming the tetrakaidecahedron unit cell with triangular strut cross-section, L. J. Gibson and M. F. Ashby (1988) proposed the definition of based on strut thickness ( ) and porosity ( ):
= [1 − 0.971(1 − ) . ]0.5338(1 − ) . (A III-3)
d) According to J.-F. Despois and A. Mortensen (2005) is defined as:
= − 0.641.08
(A III-4)
Table-A III-1 Comparison of various methods for finding pore diameters
a) 2.0 0.619 0.302 b) 2.66 2.64 0.86 0.82 0.45 0.45 c) 2.93 2.92 1.74 1.74 1.48 1.53 d) 2.48 2.59 1.19 0.85 0.97 1.14
a) (FXI, 2014) b) (X. Fu et al., 1998) c) (L. J. Gibson & M. F. Ashby, 1988) d) (J.-F. Despois & A. Mortensen, 2005) e) VGStudio MAX 3.0 (see section 2.2.2.1). f) Analysis of image cross-sections (see section 2.2.2.2).
APPENDIX IV
TEST BENCH: OVERALL DIMENSIONS
Figure-A IV-I Test bench overall dimensions
APPENDIX V
USED EQUIPMENT AND UNCERTAINTY ANALYSIS
Uncertainty analysis of equipment ( ) has been calculated according to R. S. Figliola and D. E. Beasley (2011) as: = + +⋯+
(A V-1)
where is the uncertainty of some k-element of error. List of used equipment with corresponding instrumental uncertainties is presented in Table-A V-1. Uncertainties for each gas analyzer were calculated according to Eqn. (A V-1) based on linearity and repeatability errors. List of used concentrations of span gases is presented in Table-A V-2.
Table-A V-1 List of equipment’s operation range and accuracy
Parameter Equipment Full scale Instrument uncertainty* Mass flow controllers
Gaz analyzers CO CAI Model 200 0–10 % ± 0.17 % NOx CAI 600 Series 0-50 ppm ± 0.43 ppm CH4 CAI 600 Series 0-200 ppm ± 1.73 ppm CO2
ABB Multifid URAS 14 0–30 % ± 0.45 %
O2 0–100 % ± 1.73 ppm Thermocouples
Temperature Omega K-type (d=0.032’’) 273-1523 K max ± 9.4 K
108
Uncertainties according to flame speed ( ) and equivalence ratio ( ) were calculated according to H. Gao, Z. Qu, W. Tao, Y. He, and J. Zhou (2011) as: = + /
Gas type Equipment Span gas CO CAI Model 200 0.24 % NOx CAI 600 Series 39.8 ppm CH4 CAI 600 Series 160 ppm CO2
ABB Multifid URAS 14 30 %
O2 20.95 %
APPENDIX VI
WIRING DIAGRAM
Figure-A VI-I Test bench wiring diagram
DGND
MFC 3:Air
15
9
17
18
19
2
3
4
1
24VP0.23
AO 1
AI 2
GND
MFC 2:CH4
1
2
3
8
10
12
5
7
MFC 1:CH4
1
2
3
8
10
12
5
7AI 3
GND
AI 3
GND
DGND
AO 2
AO GND12V
P0.28
DGND
AO 3
AO GND
P0.30
AI 1
AI 9
AI 2
AI 10
AI 3
AI 11
AI 4
AI 12
TC 1
TC 2
TC 3
TC 4
AI 5
AI 13
AI 6
AI 14AI 7
AI 15
TC 5
TC 6
TC 7
CH4O2CO
NOxCO2
AI 16
AI 24
AI 17
AI 25
AI 18
AI 26AI 19
AI 27
AI 20
AI 28
TC 8
TC 9
TC 10
TC 11
TC 12
AI 21
AI 22
AI 23
AI 29
AI 30
AI GND
TC 1...TC 12: Omega K-type ThermocouplesMFC 1, MFC 2: Omega FMA 5400/5500 MFCMFC 3: Azbil MFC MQV0200CH4: CAI 600 SeriesCO2, O2: ABB Multifid URAS 14CO: CAI Model 200NOx: CAI 600 Series
LIST OF BIBLIOGRAPHICAL REFERENCES
Ahearne, E., Baron, S., Keaveney, S., & Byrne, G. (2015). An Assessment of Medical Grade Cobalt Chromium Alloy ASTM F1537 as a Difficult-to-Cut (DTC) Material. Paper presented at the Proceedings of Machine Tool Technology Research Foundation.
Alavandi, S. K., & Agrawal, A. K. (2008). Experimental study of combustion of hydrogen–syngas/methane fuel mixtures in a porous burner. International journal of hydrogen energy, 33(4), 1407-1415.
ASTM International. (2015). Standard Test Methods for Density of Compacted or Sintered Powder Metallurgy (PM) Products Using Archimedes’ Principle. Standard ASTM B962-15. West Conshohocken, PA: ASTM International.
ASTM International. (2015). Standard Test Method for Cell Size of Rigid Cellular Plastics. Standard ASTM D3576-15. West Conshohocken, PA: ASTM International.
ASTM International. (2017). Standard Terminology Relating to Plastics. Standard ASTM D883-17. West Conshohocken, PA: ASTM International.
Avdic, F. (2004). Application of the porous medium gas combustion technique to household heating systems with additional energy sources. (PhD), Universität Erlangen-Nürnberg.
Babkin, V. S., Korzhavin, A. A., & Bunev, V. A. (1991). Propagation of Premixed Gaseous Explosion Flames in Porous Media. Combustion and flame, 87, 182-190.
Barra, A. J., Diepvens, G., Ellzey, J. L., & Henneke, M. R. (2003). Numerical study of the effects of material properties on flame stabilization in a porous burner. Combustion and flame, 134(4), 369-379.
Barra, A. J., & Ellzey, J. L. (2004). Heat recirculation and heat transfer in porous burners. Combustion and flame, 137(1), 230-241.
Baukal Jr., C. E. (2012). The john zink hamworthy combustion handbook: Volume 1-Fundamentals: CRC press.
Bechtold, J. K., & Matalon, M. (2001). The dependence of the Markstein length on stoichiometry. Combustion and flame, 127(1), 1906-1913.
Boomsma, K., & Poulikakos, D. (2001). The Effects of Compression and Pore Size Variations on the Liquid Flow Characteristics in Metal Foams. Journal of Fluids Engineering, 124(1), 263-272.
114
Bose, N. R. (2013). Thermal shock resistant and flame retardant ceramic nanocomposites Ceramic Nanocomposites (pp. 3-50): Elsevier.
Buckmaster, J., & Takeno, T. (1981). Blow-Off and Flashback of an Excess Enthalpy Flame. Combustion Science and Technology, 25, 153-158.
CeramTec Rocar® SiF Silicon Carbide, SiSiC. (2018). Retrieved from http://www.matweb.com/search/datasheet.aspx?MatGUID=8d3ace18a3074b6fae4bd7b435df3956
Conner, B. P., Manogharan, G. P., Martof, A. N., Rodomsky, L. M., Rodomsky, C. M., Jordan, D. C., & Limperos, J. W. (2014). Making sense of 3-D printing: Creating a map of additive manufacturing products and services. Additive Manufacturing, 1-4, 64-76.
Despois, J.-F., & Mortensen, A. (2005). Permeability of open-pore microcellular materials. Acta Materialia, 53(5), 1381-1388.
Dietrich, B., Schabel, W., Kind, M., & Martin, H. (2009). Pressure drop measurements of ceramic sponges—Determining the hydraulic diameter. Chemical Engineering Science, 64(16), 3633-3640.
Dikici, B., Pantoya, M. L., & Levitas, V. (2010). The effect of pre-heating on flame propagation in nanocomposite thermites. Combustion and flame, 157(8), 1581-1585.
Djordjevic, N., Habisreuther, P., & Zarzalis, N. (2009). Experimental study on the influence of the pore size of SiSiC sponge on the flame stabilization in a porous burner. Paper presented at the 4th European Combustion Meeting.
Djordjevic, N., Habisreuther, P., & Zarzalis, N. (2011). A numerical investigation of the flame stability in porous burners employing various ceramic sponge-like structures. Chemical Engineering Science, 66(4), 682-688.
Djordjevic, N., Habisreuther, P., & Zarzalis, N. (2012a). Experimental Study on the Basic Phenomena of Flame Stabilization Mechanism in a Porous Burner for Premixed Combustion Application. Energy & Fuels, 26, 6705–6719.
Djordjevic, N., Habisreuther, P., & Zarzalis, N. (2012b). Porous Burner for Application in Stationary Gas Turbines: An Experimental Investigation of the Flame Stability, Emissions and Temperature Boundary Condition. Flow, Turbulence and Combustion, 89(2), 261-274.
Dukhan, N., Bağcı, Ö., & Özdemir, M. (2014). Metal foam hydrodynamics: Flow regimes from pre-Darcy to turbulent. International journal of heat and mass transfer, 77, 114-123.
115
Dumas, M. (2016). Modélisation et simulation du comportement d'une tige fémorale poreuse. (M.A.Sc.), École de technologie supérieure, Montréal.
Dumas, M., Terriault, P., & Brailovski, V. (2017). Modelling and characterization of a porosity graded lattice structure for additively manufactured biomaterials. Materials & Design, 121, 383-392.
Durst, F., Trimis, D., & Pickenäcker, K. (1997). Compact porous medium burner and heat exchanger for household applications. Contract No. JOE3-CT95-0019, University of Erlangen-Nuremberg.
Eichhorn, F., Biggemann, J., Kellermann, S., Kawai, A., Kato, K., Kakimoto, K., & Fey, T. (2017). Influence of Cell Size on Mechanical and Piezoelectric Properties of PZT and LNKN Ceramic Foams. Advanced Engineering Materials, 19(10), 1700420.
El-Mahallawy, F., & El-Din Habik, S. (2002). Fundamentals and technology of combustion: Elsevier.
Elverum, P. J., Ellzey, J. L., & Kovar, D. (2005). Durability of YZA ceramic foams in a porous burner. Journal of Materials Science, 40(1), 155-164.
EngiCer. Material Data Sheet: SiSiC. Retrieved from http://www.engicer.com/wp-content/uploads/materialdatasheet/EngiCer_Material_Data_Sheet_SiSiC.pdf
EOS. (2011). Material data sheet: EOS CobaltChrome MP1. Retrieved from http://ip-saas-eos-cms.s3.amazonaws.com/public/4b839242298b3d77/721463526ca053889c9784ec989f3c88/EOS_CobaltChrome_MP1_en.pdf
ERG Materials and Aerospace Corp. The Basics of Duocel® Foam. Retrieved from http://ergaerospace.com/technical-data/the-basics-of-duocel-foam/
Ergun, S., & Orning, A. A. (1949). Fluid Flow through Randomly Packed Columns and Fluidized Beds. Industrial & Engineering Chemistry, 41(6), 1179-1184.
Figliola, R. S., & Beasley, D. E. (2011). Theory and design for mechanical measurements: John Wiley & Sons, Inc.
Fleck, N. A. (2004). An overview of the mechanical properties of foams and periodic lattice materials. Cell Met Polym, 3-7.
Francisco Jr., R. W., Rua, F., Costa, M., Catapan, R. C., & Oliveira, A. A. M. (2009). On the combustion of hydrogen-rich gaseous fuels with low calorific value in a porous burner. Energy & Fuels, 24(2), 880-887.
116
Fu, X., Viskanta, X. F., & Gore, J. P. (1998). Measurement and correlation of volumetric heat transfer coefficients of cellular ceramics. Experimental thermal and fluid science, 17(4), 285-293.
Fu, Z., Schlier, L., Travitzky, N., & Greil, P. (2013). Three-dimensional printing of SiSiC lattice truss structures. Materials Science & Engineering A: Structural Materials: Properties, Microstructure and Processing, 560, 851-856.
FXI. (2014). Function Sheet: Filtering. Retrieved from http://fxi.com/assets/pdf/FS_MEC4.pdf
Gao, H., Qu, Z., Tao, W., He, Y., & Zhou, J. (2011). Experimental study of biogas combustion in a two-layer packed bed burner. Energy & Fuels, 25(7), 2887-2895.
Gao, H. B., Qu, Z. G., Feng, X. B., & Tao, W. Q. (2014). Methane/air premixed combustion in a two-layer porous burner with different foam materials. Fuel, 115, 154-161.
Gauthier, S., Nicolle, A., & Baillis, D. (2008). Investigation of the flame structure and nitrogen oxides formation in lean porous premixed combustion of natural gas/hydrogen blends. International journal of hydrogen energy, 33(18), 4893-4905.
Ghanbari-Bavarsad, P. (2008). Modeling stretched methane-air flame growth. (M.A.Sc.), University of Windsor, Windsor, Ontario, Canada.
Gianella, S. (2013). Porous Ceramics for CSP Applications: New opportunities to increase solar absorber efficiency. Retrieved from http://www.engicer.com/wp-content/uploads/presentations/Porous_Ceramics_for_CSP_Workshop_2013.pdf
Gianella, S., & Ortona, A. (2010). Si-SiC Reticulated Foams for High Temperature Applications. Paper presented at the CELLMAT 2010: Cellular Materials, Dresden, Germany.
Gibson, L. J., & Ashby, M. F. (1988). Cellular Solids: Structure And Properties (Vol. 9).
Gibson, L. J., & Ashby, M. F. (1997). Cellular Solids: Structure and Properties (2 ed.). Cambridge: Cambridge University Press.
GoGas. (2008). Porous Burner - A New Approach to Infrared. Retrieved from http://www.superiorradiant.com/sites/default/files/product_documents/SRP-GoGaS-RADIMAX.pdf
Grosse, J., Dietrich, B., Garrido, G. I., Habisreuther, P., Zarzalis, N., Martin, H., . . . Kraushaar-Czarnetzki, B. (2009). Morphological characterization of ceramic sponges for applications in chemical engineering. Industrial & engineering chemistry research, 48(23), 10395-10401.
117
Hardesty, D. R., & Weinberg, F. J. (1974). Burners Producing Large Excess Enthalpies. Combustion Science and Technology, 8(5-6), 201-214.
Heywood, J. B. (1988). Internal combustion engine fundamentals.
Horsman, A. P. (2010). Design Optimization of a Porous Radiant Burner. (M.A.Sc.), University of Waterloo, Waterloo, Ontario, Canada.
Howell, J. R., Hall, M. J., & Ellzey, J. L. (1996). Combustion of Hydrocarbon Fuels within Porous Inert Media Progress in Energy and Combustion Science, 22(2), 121-145.
Hsu, P.-F., Evans, W. D., & Howell, J. R. (1993). Experimental and numerical study of premixed combustion within nonhomogeneous porous ceramics. Combustion Science and Technology, 90(1-4), 149-172.
Hsu, P.-F., & Howell, J. R. (1992). Measurements of Thermal Conductivity and Optical Properties of Porous Partially Stabilized Zirconia. Experimental Heat Transfer, 5(4), 293-313.
Huang, R., Cheng, L., Qiu, K., Zheng, C., & Luo, Z. (2016). Low-Calorific Gas Combustion in a Two-Layer Porous Burner. Energy & Fuels, 30(2), 1364-1374.
Innocentini, M. D. M., Salvini, V. R., Macedo, A., & Pandolfelli, V. C. (1999). Prediction of ceramic foams permeability using Ergun's equation. Materials Research, 2, 283-289.
Jetté, B., Brailovski, V., Dumas, M., Simoneau, C., & Terriault, P. (2018). Femoral stem incorporating a diamond cubic lattice structure: Design, manufacture and testing. Journal of the Mechanical Behavior of Biomedical Materials, 77, 58-72.
Jones, A. R., Lloyd, S. A., & Weinberg, F. J. (1978). Combustion in heat exchangers. Proceedings of the Royal Society of London. A. Mathematical and Physical Sciences, 360(1700), 97-115. doi:10.1098/rspa.1978.0059
Joo, H. I., Duncan, K., & Ciccarelli, G. (2006). Flame-Quenching Performance of Ceramic Foam. Combustion Science and Technology, 178(10-11), 1755-1769.
Keramiotis, C., Stelzner, B., Trimis, D., & Founti, M. (2012). Porous burners for low emission combustion: An experimental investigation. Energy, 45(1), 213-219.
Khanna, V., Goel, R., & Ellzey, J. L. (1994). Measurements of Emissions and Radiation for Methane Combustion within a Porous Medium Burner. Combustion Science and Technology, 99(1-3), 133-142.
Kiefer, J., Weikl, M. C., Seeger, T., von Issendorff, F., Beyrau, F., & Leipertz, A. (2009). Non-intrusive gas-phase temperature measurements inside a porous burner using dual-pump CARS. Proceedings of the Combustion Institute, 32(2), 3123-3129.
118
Lapalme, D., Lemaire, R., & Seers, P. (2017). Assessment of the method for calculating the Lewis number of H2/CO/CH4 mixtures and comparison with experimental results. International journal of hydrogen energy, 42(12), 8314-8328.
Lewis, K. M., Kijak, I., Reuter, K. B., & Szabat, J. B. (1996). An image analysis method for cell-size and cell-size distribution measurement in rigid foams. Journal of Cellular Plastics, 32(3), 235-259.
Liu, S., Afacan, A., & Masliyah, J. (1994). Steady incompressible laminar flow in porous media. Chemical Engineering Science, 49(21), 3565-3586.
Lyamin, G. A., & Pinaev, A. V. (1987). Combustion regimes for gases in an inert porous material. Combustion, explosion, and shock waves, 22(5), 553-558.
Mach, F. R. A., Issendorff, F. V., Delgado, A., & Ortona, A. (2009). Experimental Investigation of the Oxidation Behaviour of SiSiC Foams Advances in Bioceramics and Porous Ceramics: Ceramic Engineering and Science Proceedings, Volume 29, Issue 7 (pp. 299-311): John Wiley & Sons, Inc.
Mangan, A. P., & Whitaker, R. T. (1999). Partitioning 3D surface meshes using watershed segmentation. IEEE Transactions on Visualization and Computer Graphics, 5(4), 308-321.
Mathis, W. M., & Ellzey, J. L. (2003). Flame stabilization, operating range, and emissions for a methane/air porous burner. Combustion Science and Technology, 175(5), 825-839.
McAllister, S., Chen, J.-Y., & Fernandez-Pello, A. C. (2011). Fundamentals of Combustion Processes: Springer.
Mital, R., Gore, J. P., & Viskanta, R. (1997). A study of the structure of submerged reaction zone in porous ceramic radiant burners. Combustion and flame, 111(3), 175-184.
Mößbauer, S., Durst, F., Trimis, D., & Haas, T. (2001). Zero Emission Engine : A Novel Steam Engine for Automotive Applications((NCS-3)Novel Combustion Systems 3-Homogeneous Charge, Premixed Charge Compression Ignition Engines). Paper presented at the Proceedings The 5th International Symposium on Diagnostics and Modeling of Combustion in Internal Combustion Engines (COMBURA 2001), Nagoya.
Mujeebu, M. A., Abdullah, M. Z., Abu Bakar, M. Z., Mohamad, A. A., Muhad, R. M. N., & Abdullah, M. K. (2009). Combustion in porous media and its applications – A comprehensive survey. Journal of environmental management, 90(8), 2287-2312.
Mujeebu, M. A., Abdullah, M. Z., Bakar, M. Z. A., & Mohamad, A. A. (2011). A Mesoscale Premixed LPG Burner with Surface Combustion in Porous Ceramic Foam. Energy sources. Part A, Recovery, utilization, and environmental effects, 34(1), 9-18.
119
Ortona, A., D'Angelo, C., Gianella, S., & Gaia, D. (2012). Cellular Ceramics Produced by Rapid Prototyping and Replication. Materials Letters, 80, 95-98. doi:10.1016/j.matlet.2012.04.050
Ortona, A., Pusterla, S., D’Angelo, C., Barbato, M., Gianella, S., & Gaia, D. (2012). Si-SiC reticulated macroporous foams: processing, properties, and applications. Paper presented at the MCARE, Clearwater Beach.
Ouimette, P., & Seers, P. (2009). Numerical comparison of premixed laminar flame velocity of methane and wood syngas. Fuel, 88(3), 528-533.
Pilusa, T., Mollagee, M., & Muzenda, E. (2012). Reduction of vehicle exhaust emissions from diesel engines using the whale concept filter. Aerosol and Air Quality Research, 12(5), 994-1006.
Pitois, O., Lorenceau, E., Louvet, N., & Rouyer, F. (2009). Specific Surface Area Model for Foam Permeability. Langmuir, 25(1), 97-100.
Richardson, J. T., Peng, Y., & Remue, D. (2000). Properties of ceramic foam catalyst supports: pressure drop. Applied catalysis A: General, 204(1), 19-32.
Rørtveit, G. J., Zepter, K., Skreiberg, Ø., Fossum, M., & Hustad, J. E. (2002). A comparison of low-NOx burners for combustion of methane and hydrogen mixtures. Proceedings of the Combustion Institute, 29(1), 1123-1129.
Sathe, S. B., Kulkarni, M. R., Peck, R. E., & Tong, T. W. (1991). An experimental and theoretical study of porous radiant burner performance. Symposium, International, on Combustion, 23(1), 1011-1018.
Sathe, S. B., Peck, R. E., & Tong, T. W. (1990). A numerical analysis of heat transfer and combustion in porous radiant burners. International journal of heat and mass transfer, 33(6), 1331-1338.
Scheffler, M., & Colombo, P. (2005). Cellular Ceramics: Structure, Manufacturing, Properties and Applications: Wiley-VCH Verlag GmbH & Co. KGaA.
Schindelin, J., Arganda-Carreras, I., Frise, E., Kaynig, V., Longair, M., Pietzsch, T., . . . Cardona, A. (2012). Fiji - an Open Source platform for biological image analysis. Nature methods, 9(7).
Schlegel, A., Benz, P., & Buser, S. (1993). Wärmeübertragung und Druckabfall in keramischen Schaumstrukturen bei erzwungener Strömung. Wärme - und Stoffübertragung, 28(5), 259-266.
Shao, Z., & Dallmann, T. (2016). European Stage V non-road emission standards. The International Council on Clean Transportation.
120
Smucker, M. T., & Ellzey, J. L. (2004). Computational and Experimental Study of a Two-Section Porous Burner. Combustion Science and Technology, 176(8), 1171-1189.
Stone, R., Clarke, A., & Beckwith, P. (1998). Correlations for the Laminar-Burning Velocity of Methane/Diluent/Air Mixtures Obtained in Free-Fall Experiments. Combustion and flame, 114(3), 546-555.
Takeno, T., & Hase, K. (1983). Effects of Solid Length and Heat Loss on an Excess Enthalpy Flame. Combustion Science and Technology, 31, 207-215.
Takeno, T., & Sato, K. (1979). An Excess Enthalpy Flame Theory. Combustion Science and Technology, 20, 73-84.
Takeno, T., Sato, K., & Hase, K. (1981). A theoretical study on an excess enthalpy flame. Symposium, International, on Combustion, 18(1), 465-472.
Trimis, D., & Durst, F. (1996). Combustion in a Porous Medium-Advances and Applications. Combustion Science and Technology, 121(1-6), 153-168.
Trimis, D., & Wawrzinek, K. (2004). Flame Stabilization of Highly Diffusive Gas Mixtures in Porous Inert Media. In J. Vad, T. Lajos, & R. Schilling (Eds.), Modelling Fluid Flow: The State of the Art (pp. 107-121). Berlin, Heidelberg: Springer Berlin Heidelberg.
Turns, S. R. (2000). An introduction to combustion : concepts and applications, second edition: McGraw-Hill Co.
Vedula, V. R., Green, D. J., & Hellman, J. R. (1999). Thermal shock resistance of ceramic foams. Journal of the American Ceramic Society, 82(3), 649-656.
Videla, A., Lin, C.-L., & Miller, J. D. (2006). Watershed Functions Applied to a 3D Image Segmentation Problem for the Analysis of Packed Particle Beds. Particle & Particle Systems Characterization, 23(3‐4), 237-245.
Volume Graphics, G. (2016). VGStudio MAX 3.0. Reference Manual
Vrana, R., Koutny, D., & Paloušek, D. (2016). Impact resistance of different types of lattice structures manufactured by SLM. MM Science Journal, 2016(06), 1579-1585. doi:10.17973/MMSJ.2016_12_2016186
Weinberg, F. J. (1971). Combustion Temperatures: The Future? Nature, 233(5317), 239-241.
Wellington, S. L., & Vinegar, H. J. (1987). X-ray computerized tomography. Journal of Petroleum Technology, 39(08), 885-898.
121
Wharton, J. A., Ellzey, J. L., & Bogard, D. G. (2005). An experimental study of turbulence intensities and non-uniformities in the exit flow from a porous combustor. Experiments in Fluids, 38(6), 701-707.
Williams, A., Woolley, R., & Lawes, M. (1992). The formation of NOx in surface burners. Combustion and flame, 89(2), 157-166.
Williams, A. M., Garner, C. P., & Binner, J. G. P. (2008). Measuring pore diameter distribution of gelcast ceramic foams from two-dimensional cross sections. Journal of the American Ceramic Society, 91, 3113-3116.
Wood, S., & Harris, A. T. (2008). Porous burners for lean-burn applications. Progress in Energy and Combustion Science, 34(5), 667-684.
Wu, C.-Y., Chen, K.-H., & Yang, S. Y. (2014). Experimental study of porous metal burners for domestic stove applications. Energy conversion and management, 77, 380-388.
Xu, W., Zhang, H., Yang, Z., & Zhang, J. (2008). Numerical investigation on the flow characteristics and permeability of three-dimensional reticulated foam materials. Chemical Engineering Journal, 140(1), 562-569.
Zhu, X.-K., & Joyce, J. A. (2012). Review of fracture toughness (G, K, J, CTOD, CTOA) testing and standardization. Engineering Fracture Mechanics, 85, 1-46.
Zimmermann, J. W., Hilmas, G. E., & Fahrenholtz, W. G. (2008). Thermal shock resistance of ZrB2 and ZrB2–30% SiC. Materials Chemistry and Physics, 112(1), 140-145.