WQPBWQM-011 Version 6.0 Sample Collection and Laboratory Analysis of Chlorophyll-a Standard Operation Procedure December 21, 2011 Approvals: Mindy McCarthy, QA Officer, MDEQ/WQPB Date Michael Suplee, Ph. D., Water Quality Standards, MDEQ/WQPB Date Rosie Sada, Water Quality Standards, MDEQ/WQPB Date
Transcript
WQPBWQM-011 Version 6.0
Sample Collection and Laboratory Analysis of Chlorophyll-a Standard Operation Procedure
December 21, 2011 Approvals: Mindy McCarthy, QA Officer, MDEQ/WQPB Date Michael Suplee, Ph. D., Water Quality Standards, MDEQ/WQPB Date Rosie Sada, Water Quality Standards, MDEQ/WQPB Date
Sample Collection and Laboratory Analysis of Chlorophyll-a Standard Operation Procedure
12/21/11 Final i
REVISION HISTORY
Revision No.
Date Modified By
Sections Modified
Description of Changes
1
2
3 2006 M. Bostrom
Multiple Required the use of 11-transect system for assessing wadeable stream sites; required use of hoop, template or core as base Chla field methods.
4 6/05/2008 C. Shirley Section 6 Details on Chla analysis coefficients for different extraction solutes. Section added on compositing individual Chla samples, by method.
5 2/14/2011 M. Suplee Mainly 1, 2; also 3.1.3 and 6.2.4
Clarified field sampling methods. Added Appendix A, describing overall statistical confidence in average algae density (mg/m2) derived using the SOP method. Added Appendix B (updated Aquatic Plant Tracking Form).
6 12/21/2011 M. Suplee, R. Sada
Section 1; New
Section 7 & appendices
C ,D,E.
Clarified wadeable stream sample frame, added large river Chla sample frame. Updated Appendix B. Added visual/photo documentation method for Chla. Moved aquatic plant visual assessment methods to this SOP, rather than in periphyton SOP.
Sample Collection and Laboratory Analysis of Chlorophyll-a Standard Operation Procedure
12/21/11 Final ii
Sample Collection and Laboratory Analysis of Chlorophyll-a Standard Operation Procedure – Table of Contents
12/21/11 Final iii
TABLE OF CONTENTS
Acronyms ...................................................................................................................................................... v 1.0 Chlorophyll-a ........................................................................................................................................... 1
4.3.1 Sample Extraction (note: first 3 bullets will normally have been done in field) ....................... 15 4.4 Phytoplankton Samples .................................................................................................................... 15
Sample Collection and Laboratory Analysis of Chlorophyll-a Standard Operation Procedure – Table of Contents
5.1 Correction for phaeophytin-a ........................................................................................................... 16 5.2 Calculation to area ............................................................................................................................ 17
5.2.1 Area of Hoops ............................................................................................................................ 18 5.2.2 Area of Cores ............................................................................................................................. 18 5.2.3 Area of Templates ..................................................................................................................... 18 5.2.4 Reach Wide Chla Composite Calculation .................................................................................. 18
6.0 Determination of Chla by HPLC ............................................................................................................ 19 7.0 Sample Collection Methods-Qualitative ............................................................................................... 19
7.1 Visual Estimation of Benthic Algal Chla ............................................................................................ 19 7.2 Aquatic Plant Visual Assessment Form ............................................................................................. 20
8.0 Reporting Results .................................................................................................................................. 21 9.0 References ............................................................................................................................................ 21 Appendix A – Statistical Confidence in DEQ’s Benthic Algae Chla Sampling ............................................ A-1 A.1. Datasets, Averages, Coefficients of Variation ................................................................................... A-1 A.2. Estimation of the Confidence Level and Interval Width for DEQ’s Benthic Algae Sampling Protocol .... .................................................................................................................................................................. A-5 Appendix B – Aquatic Plant Tracking Form ................................................................................................ B-1 Appendix C – Example photos depicting benthic algae levels of 50 mg Chla/m2 or less. ......................... C-1 Appendix D – Aquatic Plant Visual Assessment Form .............................................................................. D-1 Appendix E – Example algae photos depicting different color and growth conditions, per categories in the aquatic plant visual assessment form ................................................................................................. E-1
LIST OF TABLES
Table 5-1. Approved Solvents and Absorbance Correction Factors. .......................................................... 17 Table A-1. List of Datasets Available for Use in this Analysis. ................................................................... A-2 Table A-2. Field Duplicated Sampling Events for Benthic Algal Chla. ....................................................... A-7
LIST OF FIGURES
Figure 1-0. Diagram of Chla sampling frame (wadeable streams & rivers). ................................................. 3 Figure 1-1. Diagram of Chla sampling frame for large rivers. Wadeable zones have a depth of ≤ 1m. ....... 4 Figure 2-1 Illustration of Core Sample Collection Process. ........................................................................... 9 Figure 2-2 Extruding a Core Sample. ........................................................................................................... 10 Figure A-1. Scatterplot between mean benthic Chla and Corresponding CVs. ........................................ A-4 Figure A-2. Histogram of CVs for the 218 benthic Chla sampling events. ................................................ A-5
Sample Collection and Laboratory Analysis of Chlorophyll-a Standard Operation Procedure - Acronyms
12/21/11 Final v
ACRONYMS
ACF Absorbance Correction Factors AFDW Ash-Free Dry Weight APHA American Public Health Association ARM Administrative Rules of Montana CV Coefficient of Variation DEQ Department of Environmental Quality (Montana) EDD Electronic Data Deliverable EMAP EPA Environmental Monitoring and Assessment Program EPA Environmental Protection Agency (US) FERC Federal Energy Regulation Commission GF/F Glass Fiber Filters GPS Global Positioning System HPLC High-performance liquid chromatography MDEQ Montana Department of Environmental Quality QAPP Quality Assurance Project Plan SAP Sampling and Analysis Plan SOP Standard Operating Procedures STORET EPA STOrage and RETrieval database SVF/COC Site Visit Form/ Chain of Custody Form TMDL Total Maximum Daily Load WQPB Water Quality Planning Bureau (DEQ) WQX EPA's Water Quality Exchange System
Sample Collection and Laboratory Analysis of Chlorophyll-a Standard Operation Procedure - Acronyms
12/21/11 Final vi
Sample Collection and Laboratory Analysis of Chlorophyll-a Standard Operation Procedure
12/21/11 Final 1
1.0 CHLOROPHYLL-A
Chlorophyll-a (Chla) is measured as a means of estimating algae (periphyton or phytoplankton) biomass in a body of water. It is expressed as either mass/area for periphyton (mg/m2), or as mass/volume for plankton species (µg/L). Heavy growths of algae generally indicate inferior water quality. Excess algae growth may clog water filters and irrigation equipment, cause taste and odor problems in water supplies, reduce dissolved oxygen levels, interfere with fish spawning, degrade macroinvertebrate habitat, trap sediment, deflect stream flows, and impair the overall aesthetics and recreational value of a stream.
1.1 SCOPE AND APPLICABILITY
This method is developed for use in water quality assessment decision-making. The sampling methods described in Sections 1.0 through 6.0 are largely for streams and rivers. The phytoplankton sampling procedure may be used in low-flow conditions, including disconnected series of pools, and in lakes and reservoirs. These sampling methods are designed to produce a quantitative measure of algae growth by relating the total mass of Chla pigment to a known area or volume. Qualitative visual assessment techniques that apply to wadeable streams are provided in Section 7.0.
1.2 SAMPLING DESIGN CONSIDERATIONS
1.2.1 Index period Periphyton growth is controlled by season, nutrient concentrations, velocity of the current, days of accrual, shading, water temperature, and other factors. Because of this, sampling designs using Chla must be inclusive of the times when stable flows have been achieved, as well as times when diversity and standing crop are peaking. Intensive sampling may include multiple visits to show the water body’s baseline condition, period of high growth potential, and subsequent return to baseline conditions. The summer and early fall period of July 1st to September 30th is generally the time of maximum growth potential in western Montana (mountainous region). A somewhat longer sampling index period (June 16th to September 30th) is recommended for some plains ecoregions (Suplee, et al., 2008).
1.2.2 Recent conditions Sampling events planned in advance must consider the possibility that current or recent weather patterns could influence the sampling outcome. An example of this is recent rainfall that has significantly increased the flow, scouring the substrate. If the water body has had recent significant rainfall or is currently experiencing a significant rainfall event, consider the effect of scouring and reschedule sampling event, as needed.
1.2.3 Site Locations Selection of sampling locations depends largely on the data quality objectives (DQOs) of the water quality study. The study design necessary to satisfy these DQOs must be documented in a project plan (QAPP, SAP, or equivalent documentation). The project plan should have sufficient detail to allow minor adjustments of pre-selected sites in the field, due to unforeseen events such as site inaccessibility.
Sample Collection and Laboratory Analysis of Chlorophyll-a Standard Operation Procedure
12/21/11 Final 2
If sampling locations are to be determined in the field, field guidance should include a rationale for site selection. This is critical when different sampling crews select representative locations based on professional judgment.
1.2.4 Geo-locating site The first measurement collected is a geo-reference for the study site. The location to be recorded is the F transect (layout of the sampling frame is discussed in Section 1.2.5). This is consistent with the approach used in EPA’s Environmental Monitoring and Assessment Program (EMAP) studies (Lazorchak, et al., 1998) as well as DEQ’s Reference Project. The “F” location will be used for geo-referencing the site for EPA’s STORET/WQX database. Once the site is located in the field, use a GPS receiver and record the latitude/longitude on the Site Visit Form. Always use Datum NAD83 coordinates.
1.2.5 Sampling Frame A sampling frame will consist of 11 transects, with the total frame length equal to 40 times the average wetted width at the F site (Figure 1.0). Small streams must use 40 wetted widths or a minimum of 150 meters, whichever is larger. The procedure for determining the average wetted width at the F site is: measure the wetted width at 5 places around the F site (2 upstream, 2 downstream, and 1 at the F site), average the five readings, and round to the nearest 1 m. Since some wadeable streams and rivers can be quite wide, 40 wetted widths could entail kilometers, which is unmanageable. Therefore, if the sampling frame would exceed approximately 500 meters then it is acceptable to switch to the single-transect method. This entails taking transect samples across the channel at a defined point (“F” in Figure 1-0)1. Samples taken at each location within the frame are single collections using the appropriate collection technique for the substrate encountered (listed in Section 2 - Sample Collection Methods). The starting point right (R), left (L), or center (C) should be randomly selected at the most downstream transect (transect A). Place the remaining sampling locations progressing upstream following the R, L, C pattern. (Note: If a duplicate sampling event is desired, repeat the entire process but commence the duplicate’s pattern at transect A at one of the two remaining transect starting points [e.g., if R was used for the first sampling, use L or C]. Follow the pattern upstream accordingly.) The overall statistical confidence in benthic Chla averages derived from an 11-replicate sampling frame as outlined above is provided in Appendix A. It has been found that for a typical wadeable stream benthic Chla sampling event that has followed this SOP, DEQ is confident that at least 80% of the time the measured Chla average will be within ± 30% of the true average.
1 Other approaches for sampling wadeable rivers (i.e., those that are not large) are being evaluated. Future
versions of this SOP will likely include other alternatives.
Sample Collection and Laboratory Analysis of Chlorophyll-a Standard Operation Procedure
12/21/11 Final 3
K oFlow
J o
I o
H o
G o
F
E o
D o
C o
B o
Right
Bank A o Left Bank
Transect Geolocate frame to F (middle) transect. Minimum Frame length 150 m
® ® ® ® ® o ® ® ® ® ® 4 times
mean
wetted
width
40 times
mean
wetted
width
o - Designates sample locations, wadeable streams and rivers.
® - Designates sample locations, wadeable streams/rivers for which longitudinal frame would be > 500 m.
Figure 1-0. Diagram of Chla sampling frame (wadeable streams & rivers). If the sampling frame exceeds about 500 m, switch to the single-transect method (eleven evenly spaced samples taken across the river/stream at site F.) Work on large rivers (Flynn and Suplee, 2010; Flynn and Suplee, 2011) has shown that an adequate number of samples needs to be collected in the wadeable region. Data collected in this manner lends itself well to computer simulation modeling (Flynn and Suplee, 2011) and other purposes. As of this SOP, it is recommended that 16 samples be collected across a large-river transect; 11 samples in the wadeable zone, and 5 samples in the non-wadeable zone (if possible). A water depth of 1 m can be used to separate wadeable from non-wadeable zones. Wadeable samples should be equitably distributed out from the R and L banks, to the degree possible, and equally spaced. The five non-wadeable samples can be collected via boat using an Ekman grab or similar device and should be equitably spaced (Figure 1-1).
Sample Collection and Laboratory Analysis of Chlorophyll-a Standard Operation Procedure
12/21/11 Final 4
Figure 1-1. Diagram of Chla sampling frame for large rivers. Wadeable zones have a depth of ≤ 1m.
1.2.6 Sampling Quality Control The appropriate Quality Control samples to assess field collection activities must be designated in the project planning documents (QAPP, SAP). Because the designated sampling frame is a multi–transect sampling, information about the variability among measurements is inherent to the collection design. Therefore, duplicate samples do not generally need to be collected unless project DQOs require a high degree of defensibility. Documentation of the approach intended to be used to evaluate the results should be described in the quality control section of the project planning document(s).
1.2.7 Data Review and Evaluation Data interpretation is based upon the arithmetic mean of the eleven individual results. If samples are composited according to type (core, hoop, template), a weighted average Chla value (Section 5.2.4) is obtained based on the number of transects per collection method.
2.0 SAMPLE COLLECTION METHODS-QUANTITATIVE
Periphyton standing crop may be quantified by measuring the amount of accrual on natural substrates at the study site. The sampling of artificial substrates is not recommended. There are three methods for collecting attached algae (periphyton) from streams and rivers – the hoop, the core, and the template. A single sampling using one of the listed collection techniques is performed at each transect. The substrate and conditions encountered at the sampling locale on the transect determine the collection technique. At each of the 11 sampling locales, the algae sample collected should represent conditions prevalent in an approximately 1 m2 area around the transect. For example, if the sample is to be collected at transect D, Right (Figure 1-0), the sampler should observe the algae conditions that prevail from the right wetted edge to 1m out along and a half a meter up- and downstream of the transect line. The sampler then selects the appropriate sampling method (hoop, core, template) and samples the most representative point. For Center samples, observe 0.5 m on four sides of the channel centerpoint (upstream, downstream, towards river R, towards river L) and then sample the representative point. Using the form in Appendix B, track the transect sampling point (R, L, C), method used, number of templates and filters used, and the dominant algae observed at the sample site. When finished, inventory the samples in the box in the upper right corner of the form in Appendix B.
Wadeable zone, right bank Non-wadeable zone Wadeable zone, left bank
FLOWRig
ht
Ban
k
Left B
ank
Sample Collection and Laboratory Analysis of Chlorophyll-a Standard Operation Procedure
12/21/11 Final 5
The 11 transect sampling frame (Section 1.2.5) is required for all collections. It has been demonstrated that this design will generally encounter one to three extreme values; thus the relatively high coefficient of variation (73%) typically associated with the 11 samples (Appendix A). Analyzing each of the 11 samples separately allows the assessor to understand the patchiness of algal growth and to calculate the replicates’ coefficient of variation (CV) for the sampling event. However, whether the data were each analyzed separately, or composited (discussed below), the sampling event’s average is what is typically compared to recommended or adopted Chla stream-impairment endpoints2. If the water is too deep (greater than 2-3 feet) in the location you are sampling (R, L, or C), adjust the sample location to the subsequent sampling locale in the pattern. Resume the normal sampling pattern (as originated at transect A) as soon as practicable. The form in Appendix B will aide in this. Sample Compositing: Sample compositing may be used to reduce the costs associated with the 11 samples collected as part of the sampling frame described in Section 1.2.5. Sample compositing will, in effect, return results of each collection method as a mean when the composite Chla concentration is calculated to the sum of the areas collected. THE LABORATORY WILL DO THE COMPOSITING. In the field, the sampler should keep each of the 11 samples separate, but needs to check the “Composite at Lab” box on the DEQ’s Site Visit Form/Chain of Custody (SVF/COC). (More on filling out this form is in Section 3.2.) LABORATORY CONTRACTORS PLEASE NOTE THAT ONLY SAMPLES COLLECTED BY THE SAME FIELD TECHNIQUE CAN BE COMPOSITED! There are three sampling techniques used in this method (Hoop, Core, and Template). Therefore, there may be up to three composite samples resulting from an 11-transect sampling event.
2.1 TEMPLATE SAMPLING METHOD
The template method is used for sampling transects with substrate dominated by small boulders, cobble, and gravel without heavy filamentous growth.
2.1.1 Method Summary A template with a 12.5 cm2 area is placed on a rock with representative algae density which has been drawn from the designated locale at the transect line. The sampler should observe the algae density in a roughly 1 meter by 1 meter area centered on the sampling point and select a representative rock therein. The area within the template is then scraped into a container and filtered on site (0.70 um Glass Fiber Filters (GF/F)). At the laboratory, the filter will be extracted and the resulting extract measured for Chla. The template can be made, for example, from a cut-off piece of PVC pipe (Schedule 40 - 1 1/2” nominal I.D.), which results in an internal area of approximately 12.5 cm2. Internal diameter of template should be checked and be within 3.93 to 4.05 cm (+/- 4% area error).
2.1.2 Sampling Equipment Waders or hip boots
2
It should be noted that the recreationally-based impairment threshold identified in Suplee et al. (2009) is based
on the quantification of stream bottom algae using the same sample collection methods (template, hoop) presented in this SOP.
Sample Collection and Laboratory Analysis of Chlorophyll-a Standard Operation Procedure
12/21/11 Final 6
50 cm3 centrifuge tube
Knife for scraping rock
Tooth brush for brushing rock
Tap water in squirt bottle
Shallow plastic pan to hold rock
Hand pump vacuum with tubing
Nalgene filtering unit
GF/F filters (0.70 um)
Tweezers or forceps
Cooler with ice or dry ice (preferred)
Aluminum foil
Large and medium Ziploc bags
Sharpie
2.1.3 Sample Collection A representative rock is placed in the shallow pan and the template placed over the upper (light-facing) surface of the rock. All of the growing material within the template is scraped/scrubbed and placed in the pan. In certain cases the volume of algal material on the rock surface is small, therefore it is better to scrub the rock surface with a toothbrush and then rinse the rock surface and the toothbrush into the pan with a small volume of tap water (Note: Previous versions of this SOP listed de-ionized water. DO NOT USE de-ionized water as it may burst cells due to osmotic pressure differences.) In some cases, the rocks are very small (smaller than template diameter, but still too large for core sampling). In this case, instead of using 1 representative rock, place several small representative rocks inside the template diameter, and follow the process as described in the above paragraphs, scrubbing the light-facing surfaces as best possible. Field filtration (MUST BE PERFORMED IN THE FIELD): The rinse water/algae material that has been rinsed into the pan is field filtered on to a GF/F filter using a hand pump, and the filter placed in the centrifuge tube. Refer to Section 2.4.3 for proper use of the Nalgene filtering unit. Minimize rinse water use to assure that all water will move through the GF/F filter. Circumstances where rocks have very low, or high, levels of attached algae:
Very Low Levels: In some instances levels of attached algae or so low that scrapings from a single template will result in very little material on the GF/F filter. Little or no color will be observed on the filter after filtration. To better assure that the sample is sufficient to achieve detectable levels, up to 3 templates from the same rock (or from other representative rocks in the observation locale) can be collected and all the scraped material is then captured on the same GF/F filter. Record the number of templates aggregated on the single GF/F filter on the Aquatic Plant Tracking Form (Appendix B).
High Levels: If benthic algae density from a single template is so high that the GF/F filter clogs prior to all water passing through3, the remaining algal material/water in the upper half of the
3
This can also occur due to unusually high levels of fine sediment deposited on the rocks, intermixed with the
algae.
Sample Collection and Laboratory Analysis of Chlorophyll-a Standard Operation Procedure
12/21/11 Final 7
Nalgene unit may be returned to the clean pan. Make sure the pan is clean and will therefore only contain material scraped from the single template sample in question. Then, load a 2nd GF/F filter on the Nalgene unit and filter the remaining water/algae material. Both filters are placed in the centrifuge tube together. Record the number of GF/F filters associated with the single template on the Aquatic Plant Tracking Form (Appendix B).
2.1.4 Sample Handling & Labeling Place the GF/F filter(s) into an appropriate container (50 cm3 centrifuge tube). Sampling location is identified on an external label with the following information:
a) Sample Type b) Activity ID c) Collection Date d) Waterbody Name e) Collector’s Name
Fill out the outside label, place it on the centrifuge tube or container, and cover the label completely with a strip of clear tape. Wrap the tube with aluminum foil to exclude light, write the Activity ID on the lid with a SHARPIE. Place the centrifuge tube or container into a Ziplock plastic bag. Immediately store the sample on dry ice (preferred), or ice, and away from light. Samples should be sent to the laboratory as soon as possible for Chla analysis. Record the transect number (A-K), collection position (Right, Left, Center), and the collection technique (C = Core, H = Hoop, T = Template) on the SVF/COC. If the corresponding surface area is different than the one indicated in this SOP, you must record it on the SVF/COC.
2.2 HOOP METHOD
The hoop method is designed for transects dominated by the presence of filamentous algae, regardless of stream substrate.
2.2.1 Method Summary The hoop collection method is a sample from a representative area where filamentous algae dominates the sampling locale, regardless of stream substrate. Upon collection, filamentous algae is physically separated from macrophytes (retain both portions if Ash Free Dry Weight is being analyzed). The filamentous algae sample is submitted to the laboratory for extraction and analysis of Chla. The macrophytes portion may be analyzed for ash free dry weight to determine macrophyte biomass. The hoop can be made by wrapping a stiff wire around the bottom of a 5 gallon bucket. Check area by measuring hoop diameter and calculating for area of a circle (A=3.14*(D/2)2), adjust as necessary to arrive at an area of 710 cm2. The diameter of the hoop is approximately 30 cm. Sampling Equipment:
Waders or hip boots
Large freezer storage bags
Aluminum Foil
Cooler with ice or dry ice (preferred)
Metal hoop (30 cm diameter, 710 cm2 area)
Sample Collection and Laboratory Analysis of Chlorophyll-a Standard Operation Procedure
12/21/11 Final 8
Scissors
Tooth brush
Knife for scraping rocks
Sharpie
2.2.2 Sample Collection Find designated location in the transect line. Within the 1.0 m2 sampling locale, locate a representative area to place the hoop. If a small number of macrophytes (< 5% by area) are present, they can be separated from the filamentous algae sample at the time of collection. If >5% macrophytes are present, collect the entire sample and perform the filamentous algae separation on the bank using a pan or bucket placed on a stable surface. Place the hoop over the representative area. All the algal material within the hoop is collected (i.e. filamentous and non-filamentous). Scissors or a knife may be used to detach the filamentous algae from their substrate. Filaments originating inside the hoop that are streaming beyond it in the downstream direction are to be cut off along the lower edge of the hoop, and only the parts within the hoop are retained. Similarly, filaments originating upstream of the hoop which are streaming down into the hoop (and sometimes beyond it) are to be cut along the edge(s) of the hoop, retaining only the filament parts that originally fell within the hoop. Algae attached to rocks within the hoop are scraped into the Ziplock bag. Minimize the amount of water submitted by decantation (do not decant floating algae); gently squeezing the water out of filaments works well.
2.2.3 Sample Handling & Labeling Place all filamentous algae collected at the site into a large Ziploc freezer bag. Sampling location is identified on an external label with the following information:
a) Sample Type b) Activity ID c) Collection Date d) Waterbody Name e) Collector’s Name
Fill out the outside label, place it on Ziploc bag, and cover the label completely with a strip of clear tape. Wrap the bag with aluminum foil leaving no space for light to enter. Place this wrapped bag into another large Ziploc bag and hand write the Activity ID on the outer bag with a SHARPIE. Immediately store the sample on dry ice (preferred), or ice, and away from light. Send samples to the laboratory as soon as possible for Chla analysis. Record the transect letter (A-K), collection position (Right, Left, Center), and the collection technique (C = Core, H = Hoop, T = Template) on the SVF/COC. If the corresponding surface area is different than the one indicated in this SOP, you must record it on the SVF/COC.
2.3 CORE METHOD
Method for transects dominated by silt-clay substrate without heavy filamentous growth. These substrate types are often dominated by varying thicknesses of microalgal mats, which can have Chla levels comparable to those measured in templates and hoops.
Sample Collection and Laboratory Analysis of Chlorophyll-a Standard Operation Procedure
12/21/11 Final 9
2.3.1 Method Summary The core collection method is a sample from a representative area where a silt-clay substrate dominates the sampling point on the transect, and luxuriant plant growth is not present. A core sample is taken from the substrate. The top 1cm of the core is sliced off the plug and placed in a centrifuge tube. The sample is sent to the laboratory for extraction & analysis.
2.3.2 Sampling Equipment Waders or hip boots
Cut-off 60 ml syringes (5.6cm2)
50 cm3 centrifuge tubes
Aluminum foil
Small Ziploc bags
Knife
Sharpie
2.3.3 Sample Collection A 5.6 cm2 core sample is collected using a cut-off 60 cc syringe in a representative portion of the designated transect site location. (Figure 2-1)
Figure 2-1 Illustration of Core Sample Collection Process. Each core sample is taken by driving the 60 cc syringe into the substrate to a depth of 5-10 cm. The syringe plunger may have to be drawn up as the body of the syringe is pushed into the substrate, as the plunger may have too much friction within the barrel to rise up on its own. The plug may be comprised of loose sediment that will fall out of the syringe. To minimize loss of a loose plug, the sampler can place his/her fingers over the end of the syringe as it is pulled out of the hole and up through the water column. In deeper water, a broom handle can be duck-taped to the syringe to extend your reach. Immediately invert the syringe containing the plug to prevent the plug from sliding out of the barrel. Extrude the core so the upper 1 cm of the core remains in the syringe (Figure 2-2). Slice off and discard the lower portion. Place the 1 cm portion in a 60 ml centrifuge tube.
Sample Collection and Laboratory Analysis of Chlorophyll-a Standard Operation Procedure
12/21/11 Final 10
Figure 2-2 Extruding a Core Sample. Important: Only the upper 1 cm of each core sample is placed in a centrifuge tube. Assure that all the material adhering to the rubber surface of the plunger-end is carefully collected, as most of the chlorophyll is located there.
2.3.4 Sample Handling & Labeling Sampling location is identified on an external label with the following information:
a) Sample Type b) Activity ID c) Collection Date d) Waterbody Name e) Collector’s Name
Fill out the outside label, place it on the centrifuge tube, and cover the label completely with a strip of clear tape. Wrap it with aluminum foil to exclude light, write the Activity ID on the lid with a SHARPIE. Place the centrifuge tube or container into a self-sealing plastic bag. Immediately store the sample on dry ice (preferred), or ice, and away from light. Samples should be sent to the laboratory as soon as possible for Chla analysis. Record the transect letter (A-K), collection position (Right, Left, Center), and the collection technique (C = Core, H = Hoop, T = Template) on the SVF/COC. If the corresponding surface area is different than the one indicated in this SOP, you must record it on the SVF/COC.
2.4 PHYTOPLANKTON METHOD (CHLA IN WATER)
The phytoplankton method is the sampling method for determining Chla in the water column. It is used for transects dominated by pools with green color (light green to dark green), and lakes/reservoirs.
2.4.1 Method Summary This method uses a filtration apparatus to collect a sample. Since Chla breaks down readily in sunlight, the use of a dark Nalgene bottle is required to minimize the exposure of the sample to sunlight4. The filter apparatus should be set up prior to sample collection to minimize time between sampling and filtration. The volume of water filtered must be recorded! 4
Sampling in lakes and large rivers often involves collecting various water samples at depth, which are then placed
together in a single carboy. In such cases, assure that the carboy (which is usually made of plastic) is kept covered with a canvas tarp, or similar cover, to exclude light throughout the sampling process.
Sample Collection and Laboratory Analysis of Chlorophyll-a Standard Operation Procedure
12/21/11 Final 11
2.4.2 Sampling Equipment Snap-shut petri dish or 50 cm3 centrifuge tube
1 - hand pump vacuum with tubing
Nalgene filtering unit
GF/F filters (0.70 um)
Tweezers or forceps
Graduated cylinder (100-250 ml)
Tap water in squeeze bottle
1 L (Dark) Nalgene Bottle
Sharpie
2.4.3 Sample Collection Filter apparatus setup Using clean forceps, place a glass fiber filter (GF/F nominal pore size 0.7 um) on the filter holder. Use a small amount of tap water from a wash bottle to settle the filter. Rinse the sides of the filter funnel and filter with a small volume of tap water. Sample collection and processing Rinse a 1L dark Nalgene bottle 3 times with stream or lake water before collecting the sample. Grab a water sample from an undisturbed location using the 1L Nalgene bottle. Cap the bottle and invert the bottle 3 times to mix thoroughly. Rinse a 100-250 ml graduated cylinder three times with tap water. Measure 20 ml or more of sample water in the graduated cylinder and pour into the filter funnel, place the cap loosely on the filter funnel. Draw the sample through the filter using the vacuum hand pump. Note: To avoid rupture of fragile algal cells, do not exceed 9.0 inches Hg on the vacuum gauge. Keep track of the volume of sample water filtered! The volume of sample filtered may vary from 5 ml to 1000 ml or more. When filtration slows and the filter has developed a distinct green (or green-brown) color, sufficient sample has been filtered. Do not allow the filter to clog. If a filter completely clogs while water remains in the upper half of the apparatus, discard the filter and start again, using less water volume. (Note that this differs from the allowable approach for benthic algae templates presented in Section 2.1.3.) After filtration is complete, unplug the hand pump, remove the filter funnel from the filter holder, and remove the filter with clean forceps. Avoid touching the colored portion of the filter. Fold the filter in half, with the colored side folded on itself. Place the folded filter paper inside the petri dish and snap it shut (or place the folded filter inside centrifuge tube).
2.4.4 Sample Handling & Labeling Sampling location is identified on an external label with the following information:
a) Sample Type b) Activity ID c) Collection Date d) Waterbody Name e) Collector’s Name
Sample Collection and Laboratory Analysis of Chlorophyll-a Standard Operation Procedure
12/21/11 Final 12
Fill out the outside label, place it on the petri dish/centrifuge tube, and cover the label completely with a strip of clear tape. Wrap it with aluminum foil to exclude light, write the Activity ID on the foil with a SHARPIE. Place the petri dish/tube into a self-sealing plastic bag. Immediately store the sample on dry ice. Always use dry ice for phytoplankton samples unless no other option is available; in such circumstances, regular ice may be used. Samples should be sent to the laboratory as soon as possible for Chla analysis. Store the sample away from light.
3.0 RECORDING THE CHLA SAMPLING EVENT
The Chla sampling event must be recorded including information on the location, collection methods used, and the area/volume collected. DEQ uses a SVF/COC to record this information in the field for later entry into the MT-eWQX database for submission into EPA’s STORET database.
3.1 GEO LOCATION
As described in Section 1.2.4 of this SOP, the F transect is used to geo-reference the sample site. Other locations may be recorded to document the extent of the sampling frame, however, these must be clearly distinguished so that the F middle transect is easily recognized. Regardless of how many locations are recorded, in the database only the F middle transect will be used to geo-locate the site.
3.2 RECORDING THE SAMPLING EVENT - DEQ SITE VISIT FORM/CHAIN-OF-CUSTODY (SVF/COC)
DEQ established a site visit form for recording monitoring sampling event metadata. This form was designed to geo-locate a sampling event to the single, downstream site in multi-parameter sampling events. Therefore, when using the DEQ site visit form, it is imperative that the geo-location of the F transect for a Chla sampling event is distinguished from the latitude and longitude of the other measurements.
3.2.1 Filling Out the Form Indicate a Chla sample was taken by checking the “Chlorophyll a” box on the SVF/COC. Note the Sample ID on the form. Indicate the sample collection procedure and location used at each transect on the Site Visit Form using the following abbreviations. The first letter represents the sample type and the second letter represents the location on the transect. First letter (Technique/Type)
Template = T
Hoop = H
Core = C Second letter (Position)
Right = R
Left = L
Center = C
Sample Collection and Laboratory Analysis of Chlorophyll-a Standard Operation Procedure
12/21/11 Final 13
For example: Transect: A_C-R_, B_H-C__, C_C-L__, D_T-R__, Etc… Record the geo-location of the F transect under Site Visit Comments. Record the mean wetted width from the F site (Section 1.2.5 Sampling Frame) under Site Visit Comments. Include each sample on a separate line and include the area or volume collected so the laboratory may complete the calculations to area or volume. Phytoplankton samples must include documentation of volume filtered. The laboratory must not accept samples until the field crew provides these documents.
3.2.2 Compositing If compositing is desired, THIS FACT MUST BE NOTED ON THE SVF/COC by checking the box “Composite at Lab”. Because Chla readily breaks down in sunlight, samples must be composited in subdued light at the laboratory prior to processing. Samples collected by different techniques CANNOT be composited. However, method-specific composites may be made (i.e. Core Composite, Hoop Composite, and/or Template composite). The sampler is responsible for providing the area, type (core, hoop, template), and the number of each type of each individual sample collected and recording this on the SVF/COC. The laboratory is responsible for multiplying the number of composites by the area of each sample for determining the denominator of the final result.
3.2.3 Ash-Free Dry Weight In addition to Chla, DEQ recommends that ash-free dry weight (AFDW) be determined for all benthic algae samples (Suplee and Sada de Suplee, 2011). AFDW collected from natural stream-sediment surfaces is a useful measurement for estimating algal biomass. It is useful in that it provides an additional means of assessing accumulated algal biomass independent of Chla. Chla levels tend to be highest during peak growth, and then decline later as the Chla molecules degrade as the algae senesce (Stevenson, et al., 1996). AFDW is to be determined using Standard Methods 10300 C (APHA, 1998). AFDW can be determined from the same sample in a subsequent analysis that follows the Chla analysis. AFDW can be determined from individual replicates, or as a weighted average. AFDW results from core samples should not be included in determining a site’s average AFDW. This is because the method measures organic material from the entire core sample, not just the surface where the algae are growing, and will therefore over-report AFDW.
4.0 SAMPLE EXTRACTION
Sample extraction and spectrophotometric determination are to be performed in an analytical laboratory by a qualified laboratory technician or chemist. Sample extraction and determinative techniques described herein are modified from the procedure described in EPA 446.0 (Arar E.,1997). These modifications are:
Use of the monochromatic equation for phaeopigment-corrected Chla with the extraction solvent ethanol (Suplee, et al., 2006), and
Option for using high-performance liquid chromatography (HPLC).
Sample Collection and Laboratory Analysis of Chlorophyll-a Standard Operation Procedure
12/21/11 Final 14
The solvent purity and grade used for extraction can greatly influence the outcome of the analysis. Therefore, this procedure limits extraction solvent options to those listed in Table 5-1. If HPLC will be used, strict adherence to solvents and instrument conditions described in Standard Methods 10200H (5) must be maintained. Caution: ALL CHLOROPHYLL WORK MUST BE PERFORMED IN SUBDUED LIGHT. If processing must be delayed, hold solid and filter samples at -20oC and protect them from exposure to light. Solid and filter samples taken from water having a pH 7 or higher may be placed in airtight plastic freezer bags and stored frozen for 3 weeks. Samples from acidic water must be processed promptly to prevent Chla degradation. The four different sampling techniques result in different types of media which are submitted to the laboratory, and extractions to accommodate each media follow.
4.1 HOOP SAMPLES
This extraction must be performed in subdued light to minimize the degradation of Chla pigment. A hoop sample consists of all filamentous algae collected in a 710 cm2 area. Samples are shipped to the laboratory in a Ziploc bag covered with aluminum foil, and with a second (outer) ziploc bag protecting the aluminum foil. Upon arrival at the laboratory, samples may be analyzed immediately or frozen until ready for analysis. Frozen samples must be thawed in subdued light at room temperature.
4.1.1 Sample Extraction If frozen, remove sample from freezer and allow it to thaw in subdued light at room
temperature.
Remove any excess water by straining or decanting. Excessive water interferes with the spectrophotometric measurement.
Add enough solvent to the (inner) Ziplock bag to cover the sample. Record volume added. A minimum of 13 ml of solvent is needed for analysis. Additional solvent may be added, however the more dilute the sample becomes, the lower the instrument reading will be relative to the calibration range of the spectrophotometer - don’t dilute into a non-detect at extraction.
Samples may require grinding to break cell walls to release chlorophylls.
Identify the sample with a label.
Keep in the dark overnight.
The next day, proceed with spectrophotometric analysis (Section 5).
4.2 CORE SAMPLES
This extraction must be performed in subdued light to minimize the degradation of Chla pigment. A core sample is the upper 1 cm of a 5.6 cm2 sample of stream sediment. The sample will be returned from the field in a 50 cm3 centrifuge tube wrapped in aluminum foil. This foil wrapped tube should be in a protective (outer) Ziploc bag. Sample should arrive frozen and remain frozen until ready for extraction.
4.2.1 Sample Extraction When ready to extract, remove sample from freezer and allow it to thaw.
Sample Collection and Laboratory Analysis of Chlorophyll-a Standard Operation Procedure
12/21/11 Final 15
Add enough solvent to the centrifuge tube to cover the sample. Record volume added. A minimum of 13 ml of solvent is needed for analysis. Additional solvent may be added, however the more /solvent added, the greater the dilution of pigments – don’t dilute into a non-detect.
Core samples can be very thick and compact. It may be necessary to mix the solvent and sample using a mechanical shaker.
Keep in the dark overnight.
The next day, proceed with spectrophotometric analysis (Section 5).
4.3 TEMPLATE SAMPLES
Template samples must arrive at the laboratory as a frozen filter sample. This extraction must be performed in subdued light to minimize the degradation of Chla pigment. Template samples are scrapings and rinsate from the rock, within the template area. The water and scrapings are then filtered. The filter is submitted to a laboratory who extracts the Chla from the filter and analyzes the extract. Field crews normally have filtration equipment available and return samples on filters in centrifuge tubes. Regardless, the template area must be included on the SVF/COC prior to proceeding with the analysis because results are reported as mass/area. Filtered samples should be returned to the laboratory frozen and remain frozen until analysis.
4.3.1 Sample Extraction (note: first 3 bullets will normally have been done in field)
Assemble filtration apparatus and quantitatively transfer and filter entire sample through a 47 mm glass fiber filter with a nominal pore size of 0.7 um. (Whatman GF/F filters).
Volume filtered is irrelevant because results will be related to template area.
Place filter into a labeled centrifuge tube.
Add a minimum of 13 ml. of solvent to centrifuge tube and keep in the dark overnight. Do not add more than 20 ml of solvent unless multiple filters were required for the sample. Make sure the entire filter is covered by solvent. Record volume of solvent added.
Keep sample in the dark overnight.
The next day, proceed with spectrophotometric analysis (Section 5).
4.4 PHYTOPLANKTON SAMPLES
This extraction must be performed in subdued light to minimize the degradation of Chla pigment. Phytoplankton samples should arrive frozen at the laboratory as a filter in an aluminum-foil wrapped petri dish or similarly covered 50 cm3 centrifuge tube.
4.4.1 Filter Extraction When ready to extract, remove sample from freezer and allow it to thaw.
Add enough solvent to the centrifuge tube (or sample beaker if sample was in a petri dish) to cover the sample. Record volume added. A minimum of 13 ml of solvent is needed for analysis. Additional solvent may be added, however the more solvent added, the greater the dilution of pigments – don’t dilute into a non-detect.
It may be necessary to mix the solvent and sample using a mechanical shaker.
Keep in the dark overnight.
Sample Collection and Laboratory Analysis of Chlorophyll-a Standard Operation Procedure
12/21/11 Final 16
The next day, proceed with spectrophotometric analysis (Section 5)
5.0 SPECTROPHOTOMETRIC DETERMINATION OF CHLA
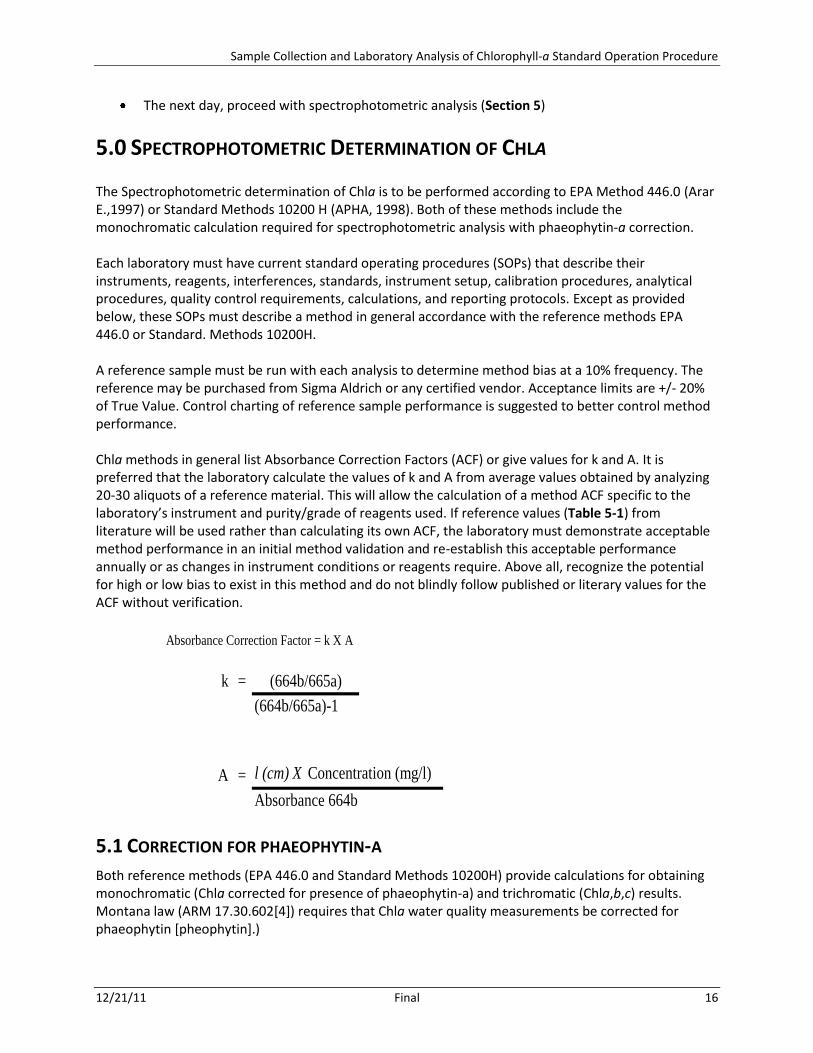
The Spectrophotometric determination of Chla is to be performed according to EPA Method 446.0 (Arar E.,1997) or Standard Methods 10200 H (APHA, 1998). Both of these methods include the monochromatic calculation required for spectrophotometric analysis with phaeophytin-a correction. Each laboratory must have current standard operating procedures (SOPs) that describe their instruments, reagents, interferences, standards, instrument setup, calibration procedures, analytical procedures, quality control requirements, calculations, and reporting protocols. Except as provided below, these SOPs must describe a method in general accordance with the reference methods EPA 446.0 or Standard. Methods 10200H. A reference sample must be run with each analysis to determine method bias at a 10% frequency. The reference may be purchased from Sigma Aldrich or any certified vendor. Acceptance limits are +/- 20% of True Value. Control charting of reference sample performance is suggested to better control method performance. Chla methods in general list Absorbance Correction Factors (ACF) or give values for k and A. It is preferred that the laboratory calculate the values of k and A from average values obtained by analyzing 20-30 aliquots of a reference material. This will allow the calculation of a method ACF specific to the laboratory’s instrument and purity/grade of reagents used. If reference values (Table 5-1) from literature will be used rather than calculating its own ACF, the laboratory must demonstrate acceptable method performance in an initial method validation and re-establish this acceptable performance annually or as changes in instrument conditions or reagents require. Above all, recognize the potential for high or low bias to exist in this method and do not blindly follow published or literary values for the ACF without verification.
Absorbance Correction Factor = k X A
k = (664b/665a)
(664b/665a)-1
A = l (cm) X Concentration (mg/l)
Absorbance 664b
5.1 CORRECTION FOR PHAEOPHYTIN-A
Both reference methods (EPA 446.0 and Standard Methods 10200H) provide calculations for obtaining monochromatic (Chla corrected for presence of phaeophytin-a) and trichromatic (Chla,b,c) results. Montana law (ARM 17.30.602[4]) requires that Chla water quality measurements be corrected for phaeophytin [pheophytin].)
Sample Collection and Laboratory Analysis of Chlorophyll-a Standard Operation Procedure
12/21/11 Final 17
Refer to Standard Methods 10200H(2) (APHA, 1998) or EPA Method 446.0 (Arar E.,1997), for instrument requirements, sample analysis requirements (calibrations, reagents, wavelengths, and calculations). The calculations presented in the reference methods are for a phytoplankton (water) sample and can be applied directly for those samples. Chla mg/m3 = [(Absorbance Correction)((664b-750b)-(665a-750a))*V1/(V2*L)] Where: V1 = Volume of extract (L) V2 = Volume of sample (m3) a = after acidification b = before acidification L = Light path or width of cuvette, cm The calculation for periphyton replaces area for volume. Chla mg/m2 = [(Absorbance Correction)((664b-750b)-(665a-750a))*V1/(A1*L)] Where: V1 = Volume of extract (L) A1 = Sample collection area (m2) a = after acidification b = before acidification L = Light path or width of cuvette, cm The allowed solvents in its purity form are listed in Table 5-1.
1. APHA, 1998 2. Values listed by Sartory (Sartory D.P. and Grobbelaar J.U.,1984) 3. Calculated from values listed by Sartory (Sartory D.P. and Grobbelaar J.U.,1984) 4. Significant figure error. Error carried forward.
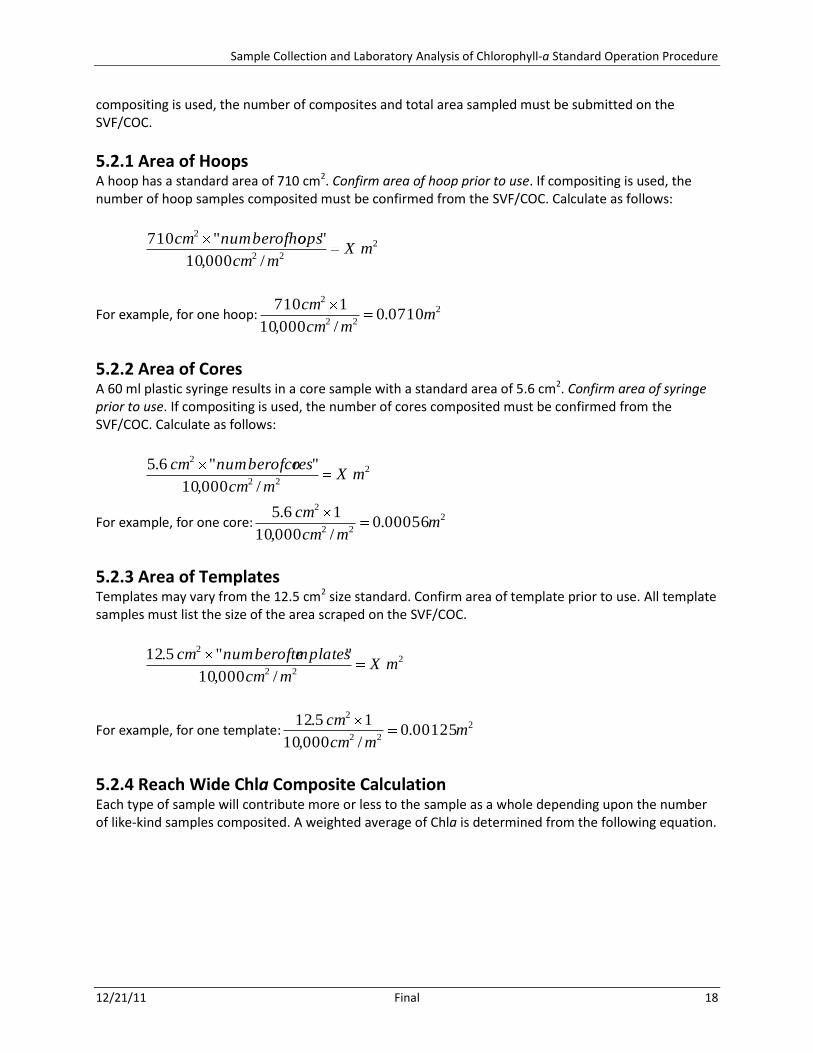
5.2 CALCULATION TO AREA
In order to determine the density of periphyton algae by measuring Chla, results obtained from the instrument (in mg) must be related to the area sampled rather than a volume of water. The area obtained from the three collection techniques varies. If the area information is not readily available on the SVF/COC, the laboratory must not begin the extraction and analysis until it is provided. Also, if
Table 5-1. Approved Solvents and Absorbance Correction Factors.
Sample Collection and Laboratory Analysis of Chlorophyll-a Standard Operation Procedure
12/21/11 Final 18
compositing is used, the number of composites and total area sampled must be submitted on the SVF/COC.
5.2.1 Area of Hoops A hoop has a standard area of 710 cm2. Confirm area of hoop prior to use. If compositing is used, the number of hoop samples composited must be confirmed from the SVF/COC. Calculate as follows:
2
22
2
/000,10
""710mX
mcm
opsnumberofhocm
For example, for one hoop: 2
22
2
0710.0/000,10
1710m
mcm
cm
5.2.2 Area of Cores A 60 ml plastic syringe results in a core sample with a standard area of 5.6 cm2. Confirm area of syringe prior to use. If compositing is used, the number of cores composited must be confirmed from the SVF/COC. Calculate as follows:
2
22
2
/000,10
""6.5mX
mcm
resnumberofcocm
For example, for one core: 2
22
2
00056.0/000,10
16.5m
mcm
cm
5.2.3 Area of Templates Templates may vary from the 12.5 cm2 size standard. Confirm area of template prior to use. All template samples must list the size of the area scraped on the SVF/COC.
2
22
2
/000,10
""5.12mX
mcm
mplatesnumberoftecm
For example, for one template: 2
22
2
00125.0/000,10
15.12m
mcm
cm
5.2.4 Reach Wide Chla Composite Calculation Each type of sample will contribute more or less to the sample as a whole depending upon the number of like-kind samples composited. A weighted average of Chla is determined from the following equation.
Sample Collection and Laboratory Analysis of Chlorophyll-a Standard Operation Procedure
12/21/11 Final 19
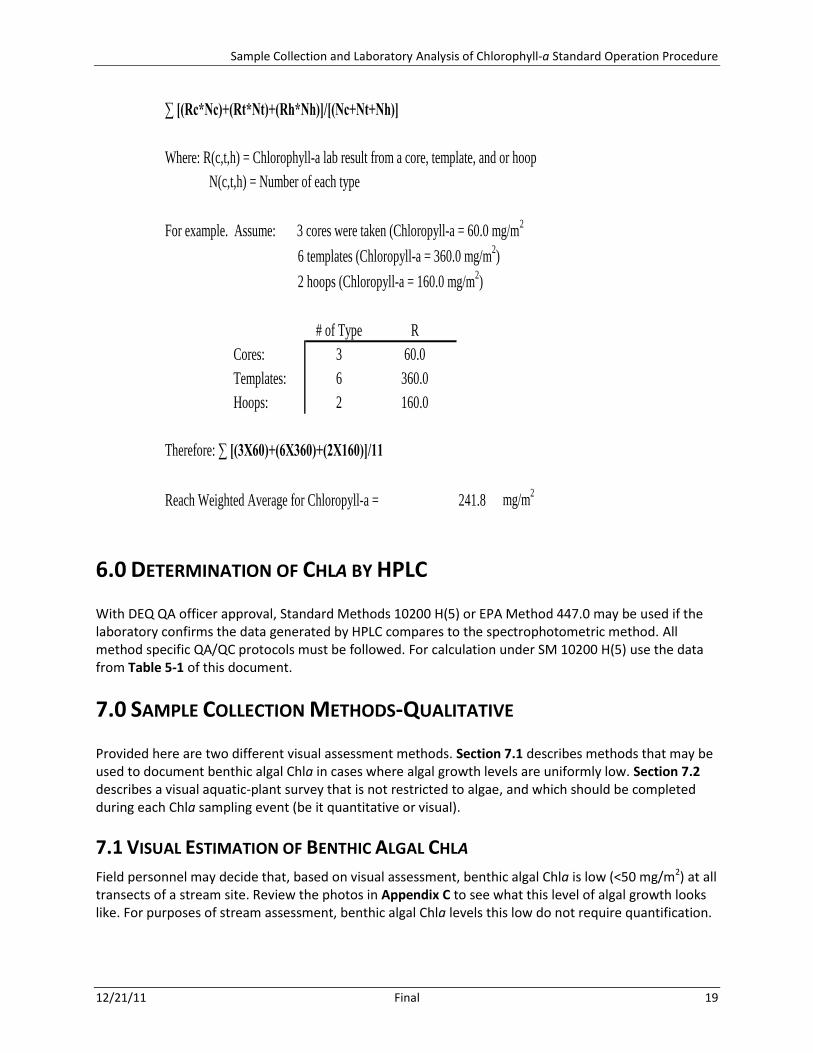
∑ [(Rc*Nc)+(Rt*Nt)+(Rh*Nh)]/[(Nc+Nt+Nh)]
Where: R(c,t,h) = Chlorophyll-a lab result from a core, template, and or hoop
N(c,t,h) = Number of each type
For example. Assume: 3 cores were taken (Chloropyll-a = 60.0 mg/m2
6 templates (Chloropyll-a = 360.0 mg/m2)
2 hoops (Chloropyll-a = 160.0 mg/m2)
# of Type R
Cores: 3 60.0
Templates: 6 360.0
Hoops: 2 160.0
Therefore: ∑ [(3X60)+(6X360)+(2X160)]/11
Reach Weighted Average for Chloropyll-a = 241.8 mg/m2
6.0 DETERMINATION OF CHLA BY HPLC
With DEQ QA officer approval, Standard Methods 10200 H(5) or EPA Method 447.0 may be used if the laboratory confirms the data generated by HPLC compares to the spectrophotometric method. All method specific QA/QC protocols must be followed. For calculation under SM 10200 H(5) use the data from Table 5-1 of this document.
7.0 SAMPLE COLLECTION METHODS-QUALITATIVE
Provided here are two different visual assessment methods. Section 7.1 describes methods that may be used to document benthic algal Chla in cases where algal growth levels are uniformly low. Section 7.2 describes a visual aquatic-plant survey that is not restricted to algae, and which should be completed during each Chla sampling event (be it quantitative or visual).
7.1 VISUAL ESTIMATION OF BENTHIC ALGAL CHLA
Field personnel may decide that, based on visual assessment, benthic algal Chla is low (<50 mg/m2) at all transects of a stream site. Review the photos in Appendix C to see what this level of algal growth looks like. For purposes of stream assessment, benthic algal Chla levels this low do not require quantification.
Sample Collection and Laboratory Analysis of Chlorophyll-a Standard Operation Procedure
12/21/11 Final 20
For each stream site, EITHER quantitative samples are collected at all 11 transects (per methods in Sections 1.0 through 6.0), OR photos are taken to document that Chla is <50mg/m2 at all 11 transects. A mixture of photos (i.e., no sample taken) and quantitative Chla samples from a site is not permitted. If you are not confident that algae levels at all transects are equal to or lower than the photos in Appendix C, then proceed with quantitative Chla sampling. If all transects appear to be <50mg/m2, take at least one digital photo per transect (AK). Each photo should represent a close-up aerial view of the channel substrate at the transect. Use a polarized lens to reduce glare from the sun and water’s surface to enhance photo quality. Record the photo number and a brief description of each photo on the Photograph Locations and Description Form. If conditions do not allow for substrate photos through the water column and the bottom is rocky, some representative rock samples should be taken to the bank and photographed for each transect. A polarized filter should be used.
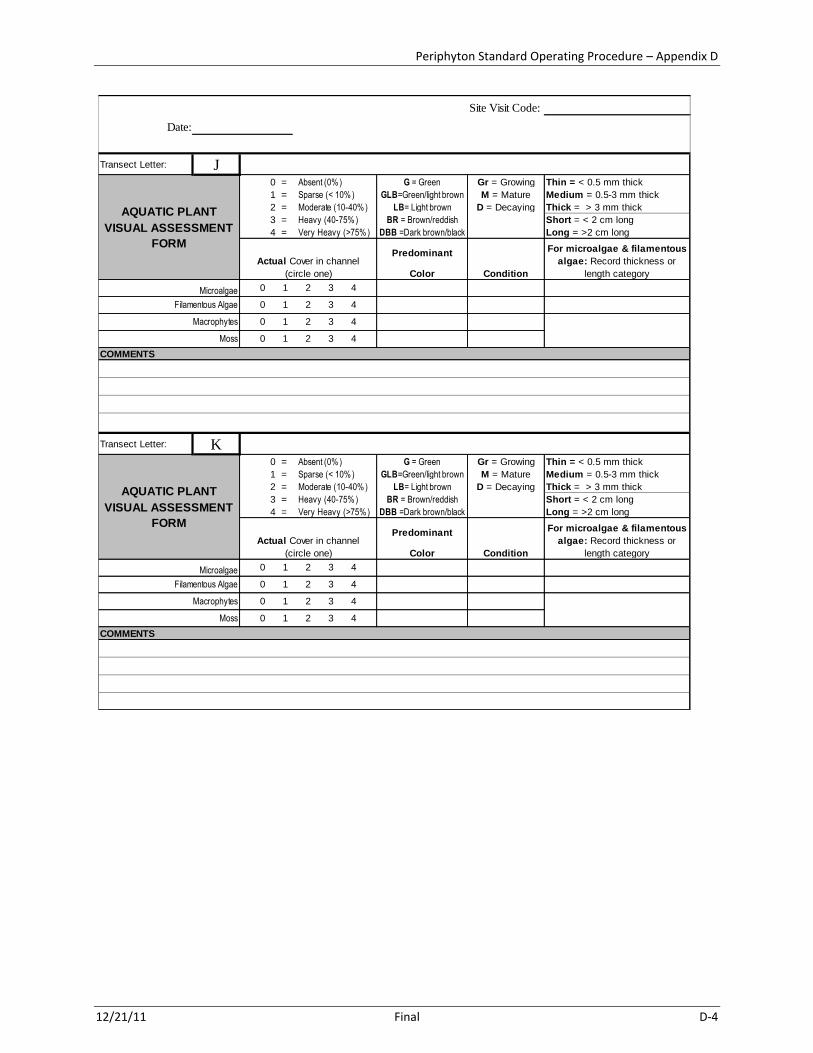
7.2 AQUATIC PLANT VISUAL ASSESSMENT FORM
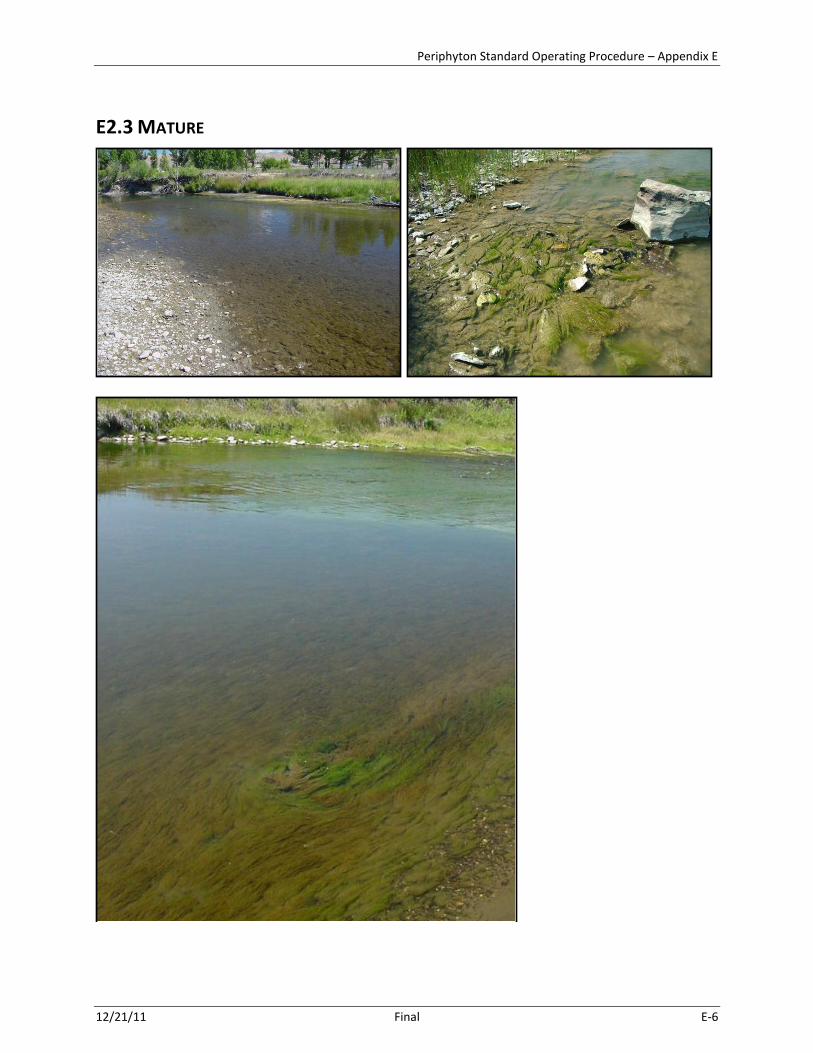
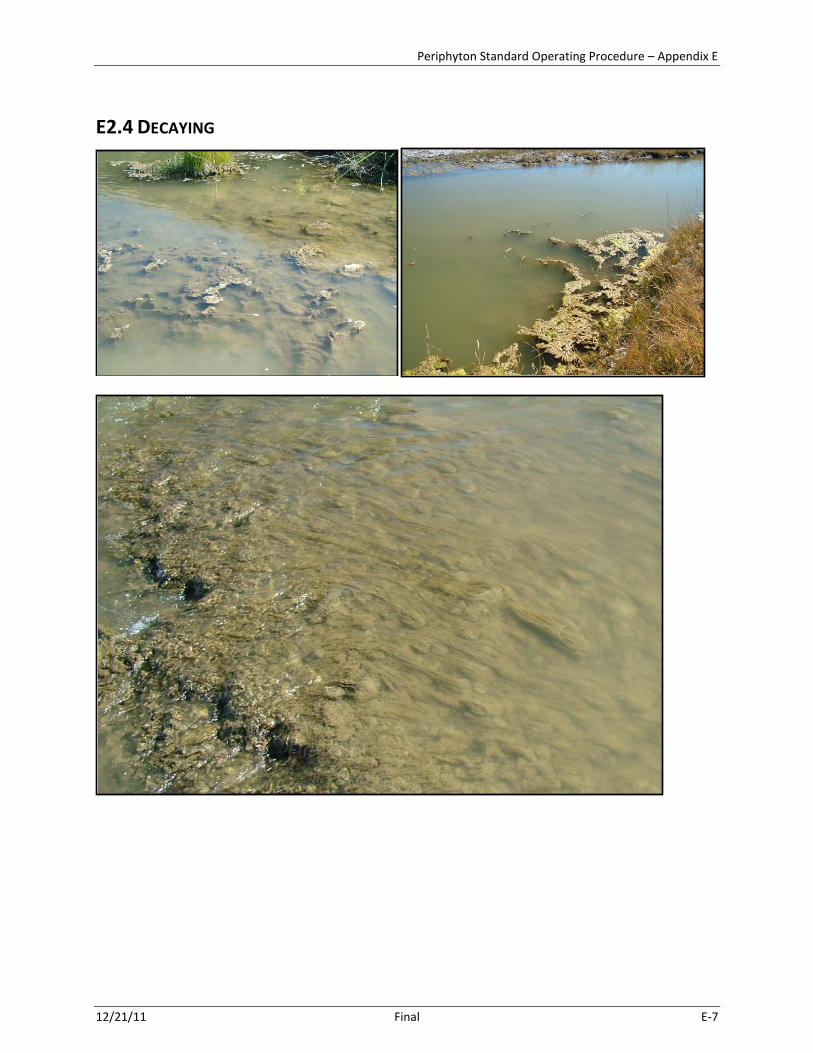
The general composition, amount, color, and condition of aquatic plants are visually assessed in the field using the Aquatic Plant Visual Assessment Form (Appendix D). This information helps describe the health and productivity of the aquatic ecosystem, records nuisance aquatic plant problems, documents changes in the plant community over time, and can be used to help corroborate quantitative Chla results. The Aquatic Plant Visual Assessment Form should be filled out while collecting quantitative measurements of stream bottom Chla. It may also be used when collecting samples for periphyton standing crop, composition, and community structure per the periphyton SOP, WQPBWQM-010. If the stream you are assessing does not entail laying out a longitudinal reach, use only the “F” labeled form in Appendix D. For this latter scenario, use one “F” site form per stream site. At each transect (A, B, etc.), the assessor will evaluate the entire wetted stream bottom as it appears 5 m above and 5 m below the transect line (i.e., an evaluation zone comprising 10 linear m of stream bottom, with 5 m of stream bottom downstream of the transect line and 5 m upstream). Actual Cover in Channel: First part of the form. Refers to the aerial coverage of the stream bottom by the plant type in question, within the evaluation zone. Circle the percent coverage category that most closely fits what you see. Predominant Color: The colors of aquatic plants are clues to their identity, state of growth, and health of the aquatic ecosystem. Record the predominant color of the plants or algae from the pick list, using the letter codes. Be sure to lift up your sunglasses to record accurate color categories. See Appendix E (Section E1.0) for photo examples. Note: Color reference is to the actual colors observed, not the types of algae the assessor may identify. Condition: Aquatic plants go through seasonal cycles of growth, maturity, and decay. The condition of a plant or algae will indicate the approximate stage of this seasonal cycle. It can also help explain cases where, for example, Ash Free Dry Weight (AFDW) to chlorophyll a (Chla) ratios are found to be unusually high. Growing plants and algae show new growth and bright colors. Mature plants and algae are larger but have more subdued colors because of age, epiphytes, and sediment deposits. Decaying plant and
Sample Collection and Laboratory Analysis of Chlorophyll-a Standard Operation Procedure
12/21/11 Final 21
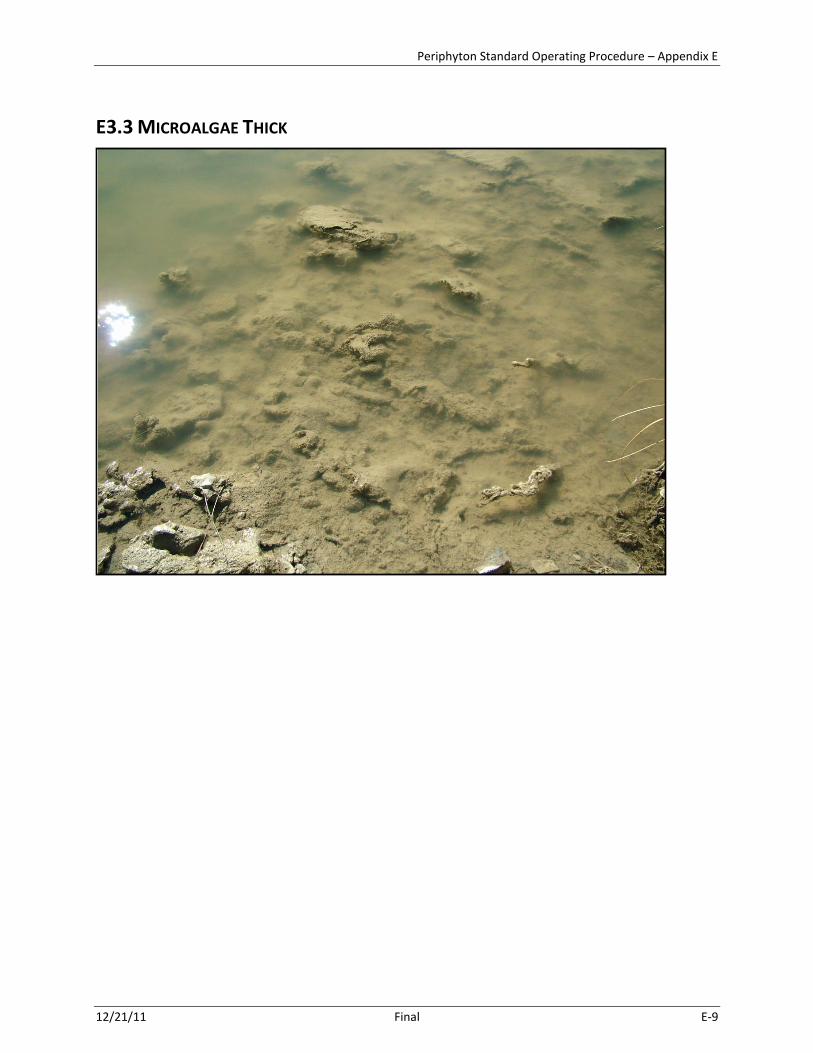
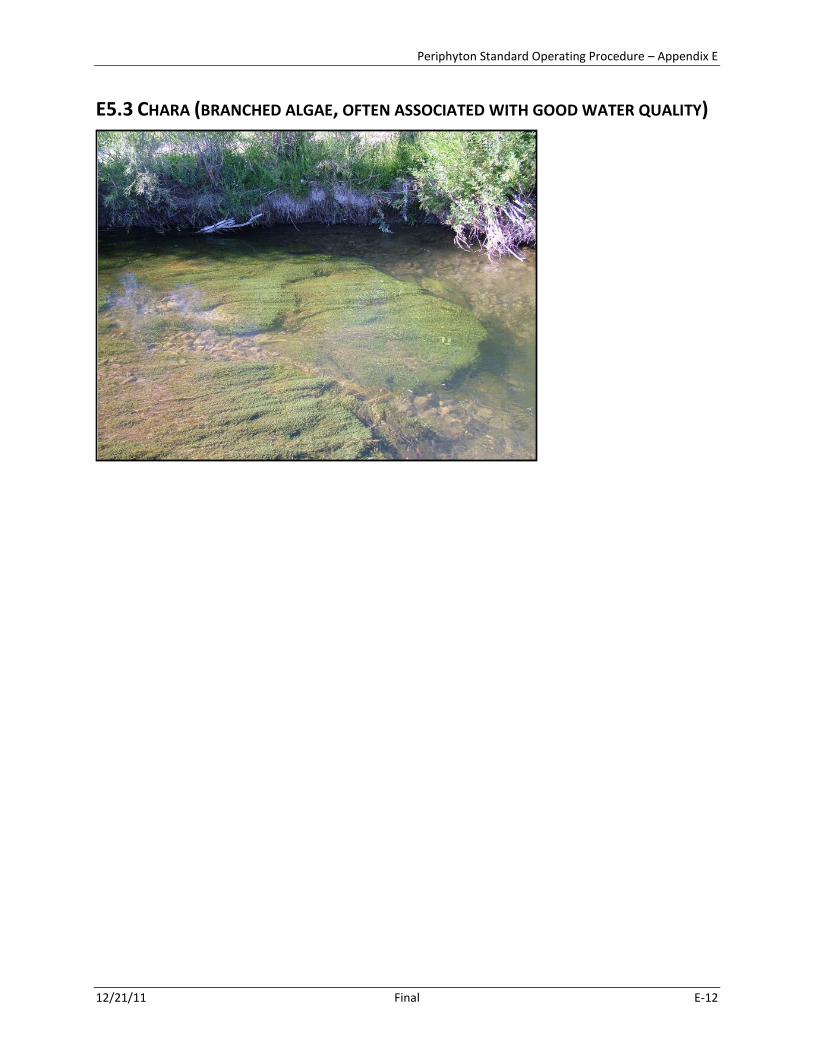
algae display a loss of both pigmentation and physical integrity. Record conditions as Growing, Mature, or Decaying on the form using the letter codes. See Appendix E (Section E2.0) for photo examples. Thickness Category for Microalgae: Non-filamentous microalgae can be present on stones and fine sediment surfaces and can develop a fairly wide array of Chla levels depending upon the mat thickness. The categories (Thin, Medium, Thick) will help corroborate Chla and AFDW measurements collected and also show the progression of algal growth at a site. Use a mm-scale ruler to measure the mat thickness. See Appendix E (Section E3.0) for photo examples. Length Category for Filamentous Algae: Increasing length of filamentous algae has been associated with recreation impacts (Biggs, 2000; Suplee, et al., 2009). Highly enriched waters tend to grow long filaments, 1-2 meters or more in length at times. Record filamentous algae filament lengths as Short or Long on the form. When filaments are >2 cm in length, record their approximate lengths in the comments section. Appendix E (Section E4.0) has photo examples. Finally, Section 5.0 of Appendix E shows a few photos of other aquatic plants found in Montana streams, but is by no means complete. It is recommended that a good aquatic plant identification guide (e.g., (DiTomaso and Healy, 2003) be taken to the field and consulted when filling out the form.
8.0 REPORTING RESULTS
Results of Chla analyses must be reported in conformance with MT-eWQX specific format. Data providers are required to populate the data in a MT-eWQX EDD. Detailed guidance for populating the MT-eWQX EDD can be found in the MT-eWQX Guidance Manual located on the Web at http://deq.mt.gov/wqinfo/datamgmt/MTEWQX.mcpx.
9.0 REFERENCES
APHA. 1998. Standard Methods for the Examination of Water and Wastewater, 20th ed., American Public Health Association.
Arar E. 1997. EPA Method 446.0 - In Vitro Determination of Chlorophylls a, B, C1 + C2 and Pheopigments in Marine And Freshwater Algae by Visible Spectrophotometry, Revision 1.2. Washington, D.C.: U.S. Environmental Protection Agency.
Biggs, B. J. F. 2000. New Zealand Periphyton Guideline: Detecting, Monitoring and Managing Enrichment of Streams. Christchurch, New Zealand: NIWA.
Cattaneo, A. and Y. Prairie. 1995. Temporal Variability in the Chemical Characteristics Along the Rivi`Ere De L'Achigan: How Many Samples Are Necessary to Describe Stream Chemistry? Canadian Journal of Fish and Aquatic Sciences. 52: 828-835.
DiTomaso, Joseph and Evelyn Healy. 2003. Aquatic and Riparian Weeds of the West, Publication No. 3421 ed., Oakland, CA: University of California Agriculture and Natural Resources.
Sample Collection and Laboratory Analysis of Chlorophyll-a Standard Operation Procedure
12/21/11 Final 22
Flynn, Kyle and Michael Suplee. 2010. Defining Large Rivers in Montana Using a Wadeablity Index: Montana Department of Environmental Quality, Water Quality Planning Bureau.
-----. 2011. Using a Computer Water Quality Model to Derive Numeric Nutrient Criteria: Lower Yellowstone River: Final Draft. Helena, MT: Montana Department of Environmental Quality. Report WQPBDMSTECH-22.
Lazorchak, James M., Donald J. Klemm, and David V. Peck. 1998. Environmental Monitoring and Assessment Program – Surface Waters: Field Operations and Methods For Measuring the Ecological Condition Of Wadeable Streams. Washington D.C.: U.S. Environmental Protection Agency. EPA/620/R-94/004F.
Leopold, L. B, M. G. Wolman, and J. P. Miller. 1964. Fluvial Processes in Geomorphology, St. Louis, MO: Freeman Press.
Manly, B. F. J. 2001. Randomization, Bootstrap and Monte Carlo Methods in Biology, 2nd ed., Boca Raton, FL: Chapman & Hall.
Ott, R. Lyman. 1993. An Introduction to Statistical Methods and Data Analysis - Fourth Edition, Belmont, CA: Duxbury Press.
Sartory D.P. and Grobbelaar J.U. 1984. Extraction of Chlorophyll a From Freshwater Phytoplankton for Spectrophotometric Analysis. The Hague: Dr. W. Junk Publishers. Hydrobiologica 114.
Simonson, T. D., J. Lyons, and P. D. Kanehl. 1994. Quantifying Fish Habitat in Streams: Transect Spacing, Sample Size, and a Proposed Framework. North American Journal of Fisheries Management. 14: 606-615.
Stevenson, R. Jan, M. L. Bothwell, and R. L. Lowe. 1996. Algal Ecology, Freshwater Benthic Ecosystems: Academic Press.
Suplee, M. and R. Sada de Suplee. 2011. Assessment Methodology for Determining Wadeable Stream Impairment Due to Excess Nitrogen and Phosphorus Levels. Helena, MT: Montana Department of Environmental Quality Water Quality Planning Bureau. Report WQPMASTR-01.
Suplee, M., V. Watson, A. Varghese, and J. CLeland. 2008. Scientific and Technical Basis of the Numeric Nutrient Criteria for Montana's Wadeable Streams and Rivers. Helena, MT: MT DEQ Water Quality Planning Bureau.
Suplee, Michael W., Vicki Watson, and et al. 2006. An Experiment to Determine the Efficiency of Measuring Chlorophyll a in Stream Sediment Samples Using Spectrophotometric Methods. Montana Department of Environmental Quality.
Sample Collection and Laboratory Analysis of Chlorophyll-a Standard Operation Procedure
12/21/11 Final 23
Suplee, Michael W., Vicki Watson, Mark E. Teply, and Heather McKee. 2009. How Green Is Too Green? Public Opinion of What Constitutes Undesirable Algae Levels in Streams. Journal of the American Water Resources Association. 45(1): 123-140.
Thornton, K. W., R. H. Kennedy, A. D. Magoun, and G. E. Saul. 1982. Reservoir Water Quality Sampling Design. Water Resources Bulletin. 18: 471-480.
Sample Collection and Laboratory Analysis of Chlorophyll-a Standard Operation Procedure
12/21/11 Final 24
Sample Collection and Laboratory Analysis of Chlorophyll-a Standard Operation Procedure – Appendix A
12/21/11 Final A-1
APPENDIX A – STATISTICAL CONFIDENCE IN DEQ’S BENTHIC ALGAE CHLA
SAMPLING
Definitions: Sample Frame: Within an assessment reach, a “site”, which is a short longitudinal stretch of
stream, or a perpendicular transect of a stream/river. For wadeable streams, a site’s longitudinal length is defined as 40 times the average wetted width at its midpoint, or 150 m minimum5. Sites can have multiple sampling events (i.e., across-time sampling).
Population: The algae growing on or across the surface of the stream bottom within the defined
longitudinal area of the site, or across the perpendicular transect. Sampling Unit: An individual benthic algae sample collected via the template, core, or hoop
method, which is subsequently measured for chlorophyll a (Chla) and/or ash free dry weight. Suplee et al. (Suplee, et al., 2009) demonstrate that average benthic algae levels up to about 150 mg Chla/m2 are considered acceptable by the Montana public majority, whereas average levels of 200 mg Chla/m2 or more are very undesirable. This algae level threshold is an important component in the assessment of beneficial use attainment, particularly for the western and mountainous regions of the state. As such, it is important to understand the variability and confidence levels associated with DEQ’s Standard Operating Procedure (SOP) for sampling benthic algae. This section describes the datasets used, methods, and confidence intervals estimated for DEQ’s algal sampling protocols. The purpose of the analysis outlined here was to answer the following question: 1. What is the accuracy and confidence in the average Chla value determined for a sampling event? (The above question is posed given that DEQ’s Chla SOP calls for the collection of 11 replicates from a site.)
A.1. DATASETS, AVERAGES, COEFFICIENTS OF VARIATION
All available datasets were collated for the purpose of understanding variability and confidence in DEQ benthic algal sampling methods (Table A-1). Data from the Stream Reference Project (STREFPRO) were restricted to sites in western Montana ecoregions, or transitional ecoregions, and did not include algae collected from eastern Montana prairie streams. This is because prairie streams are substantially different ecologically (e.g., they grow considerably more algae naturally, often have fine sediment bottoms, and are commonly intermittent), and can be better assessed for nutrient impairment by examining other factors like dissolved oxygen. The other datasets were from streams or rivers that
5
40 times the mean wetted width (150 m minimum) was derived from USEPA’s method to asses wadeable streams
(Lazorchak, et al., 1998). Similarly, the USGS NAWQA program uses 20X the wetted width, and Simonson et al. (1994) specify 30-35 times the wetted width. These stream lengths have been shown to be sufficiently long to encapsulate key stream characteristics (e.g. depth, substrate type, cover, shading, bank height, etc.) which strongly influence algae and aquatic plant growth. Simonson et al. (1994) find that the aforementioned stream variables could be estimated within ± 5% of the true mean 81-89% of the time using 11 transects spaced along a reach that is 30-35 times the mean wetted width. This longitudinal length was also found to encompass at least three riffle-pool sequences (Leopold, et al., 1964).
Sample Collection and Laboratory Analysis of Chlorophyll-a Standard Operation Procedure – Appendix A
12/21/11 Final A-2
typically have gravel/cobble substrates and good flow. The University of Montana’s Clark Fork River dataset and the PP&L FERC 401 certification dataset were helpful in that many sampling events straddled or exceeded the nuisance threshold value of 150 mg Chla/m2 identified in Suplee et al. (Suplee, et al., 2009). The term sampling event is used here to describe the sampling of algae (n = 10 or 11 replicates) on a given day, as opposed to site, since a site may have been sampled repeatedly over time (e.g., monthly during the summer) and we wanted to include these temporal sampling events. Conditions for a sampling event to be used in the analysis were (a) the total number of replicates collected and analyzed for the sampling event was 10 or 11, and (b) the average benthic Chla calculated from a sampling event’s replicates was >19 mg Chla/m2. These conditions were established so that the amount of effort expended for any given sampling event was uniform (i.e., replicate n was nearly identical), and so that replicates whose result were non-detects (ND) would not be a substantial part of the dataset. (Sampling events with average algae >19 mg Chla/m2 usually had none, or at most 1or 2 replicates, as NDs, whereas sampling events whose average algae was <19 mg Chla/m2 often had several or more NDs.) Also, 19 mg Chla/m2 is the average algal density we have so far determined for western MT reference streams (see: http://deq.mt.gov/wqinfo/nutrientworkgroup/agendasMinutes/2009/july09/NWG_july16-09.pdf), and since we are most interested in variability of algal growth closer to the nuisance threshold, 19 mg Chla /m2 seemed liked a natural low-end cutoff. Table A-1. List of Datasets Available for Use in this Analysis.
Dataset Source No. Sampling
Events in Dataset Number of Sampling
Events Used Notes
Stream Reference Project (STREFPRO; 2004-2008)
DEQ 72 21 Since these were reference sites, many Chla means <19 mg/m
2
Outstanding Fisheries Project (2006-2007)
DEQ 65 32
Monitoring – Reassessment (2006) DEQ 15 0
Data not used. All sampling event averages <19 mg Chla/m
2, or n <<10.
Tabacco & Flint Watershed TMDLs (2007)
DEQ 19 14
Yellowstone River QUAL2K Model (2007) DEQ 10 0
Data not used. Sampling event averages <19 mg Chla/m
2, or <<10
Upper Gallatin R. TMDL (2005-2008) DEQ ? 0
Data not used. 11 transect replicates were composited (no replicates)
328 105 Only used sampling events for which n=10 or 11
The average, standard deviation (s), and coefficient of variation (CV; [s/average]∙100) was calculated from the replicate Chla measurements for each sampling event. The CV is very useful as it allows comparison of any given sampling event’s standard deviation to all other sampling event’s standard
Sample Collection and Laboratory Analysis of Chlorophyll-a Standard Operation Procedure – Appendix A
12/21/11 Final A-3
deviations, regardless of whether the sampling event’s average algae level was low or high (or in between). After screening the sampling events with the two conditions above (sample size, mean algae >19 mg Chla/m2), a total of 218 individual sampling events were collated. These 218 sampling events, each comprising 10 or 11 replicate Chla samples each, represent more than 2,200 individual measurements of stream bottom Chla. Template, hoop, and core samples are all represented. They also represent a wide array of stream types and conditions such as rivers with varying amounts of eutrophication (Clark Fork, Madison, and Missouri rivers), low and mid Strahler-order streams with little or no human impacts (STREFPRO), mid-order streams with various degrees of human impacts (TMDL datasets), etc. A correlation was run between the sampling events’ average benthic algal Chla values and their associated CVs (Fig. A-1)(Cattaneo and Prairie, 1995). This was carried out to ascertain if there was any clear relationship between the two (e.g., lower algae levels are closely associated with higher replicate CVs, or visa-versa), which could influence subsequent analyses. No clear pattern was noted; the correlation coefficient (r2) between the two variables was very low, only 0.07. Low average Chla values were associated with about eight unusually high CVs (Figure A-1, outside of gray box), but the vast majority of low-Chla averages had CVs typical of the entire range. A histogram of CVs for the complete dataset was generated (Figure A-2). Figure A-2 shows a clearly defined central tendency for the replicates’ CVs (average = 69%). Thus, across all datasets, a typical Chla sampling event comprised of 10 or 11 replicates typically had a replicate CV of 69%. There were significant differences in CV patterns between the five different datasets (Analysis of Variance; p < 0.05). But each dataset contributed information to the whole that could not be ascertained individually. For example, the Clark Fork River dataset had a lower mean CV than did the other datasets, but provided much information on replicate variability for Chla samples bracketing the nuisance threshold (150 mg Chla/m2). The central tendency of the CVs provides a mechanism to estimate an overall confidence and interval width for the SOP algae sampling method (more on this, Section A.2 below). Consideration must first, however, be given to the fact that the datasets’ individual CV patterns differ. Among the 5 datasets, the most variable dataset was the Outstanding Fisheries Project (average replicate CV = 88%), the least variable dataset was the Clark Fork River (CV = 58%), and the dataset falling exactly midway was the Tobacco & Flint TMDL dataset (average replicate CV = 73%). The latter is a DEQ dataset collected following this SOP’s methods. Since the central tendency of all datasets is a CV of 69%, and since a DEQ dataset with a mean CV of 73% falls exactly midway among the datasets, 73% is a good estimate of the typical replicate variability one would encounter in a typical DEQ benthic Chla sampling event. This CV value was used to estimate the overall confidence level associated with the method.
Sample Collection and Laboratory Analysis of Chlorophyll-a Standard Operation Procedure – Appendix A
12/21/11 Final A-4
Figure A-1. Scatterplot between mean benthic Chla and Corresponding CVs. Gray outlined box show that the vast majority of CVs, over a large Chla range, range from about 25 to 120. Regression correlation (R2=0.07) shows that there is no relationship between the two variables.
0
25
50
75
100
125
150
175
200
225
250
275
300
0 50 100 150 200 250 300 350 400 450 500 550 600
Ass
oci
ate
d C
V (
%)
Mean Benthic Chl a(mg/m2)
Correlation Coefficient
y = -0.1071x + 79.05
r2 = 0.07
Sample Collection and Laboratory Analysis of Chlorophyll-a Standard Operation Procedure – Appendix A
12/21/11 Final A-5
Figure A-2. Histogram of CVs for the 218 benthic Chla sampling events.
A.2. ESTIMATION OF THE CONFIDENCE LEVEL AND INTERVAL WIDTH FOR
DEQ’S BENTHIC ALGAE SAMPLING PROTOCOL
The next objective was to estimate the interval width (i.e., the range across which the true population average for a sampling event is likely to fall) and the confidence in that interval. The goal is to be able to make a statement like “with the sampling protocol used, I am usually within ± X of the true benthic algae average Y% of the time”. Two statistical equations (Ott, 1993) and a third statistical approach (bootstrapping; Manly, 2001) were used together to develop these estimates. The two equations used are:
n = t2s2 (1) d2
Where n is the number of sample replicates collected, t is the two-tailed critical value of the Student’s t distribution, s is the standard deviation of a sampling event’s replicates, and d is the pre-selected half width of the desired interval width of the sample mean.
x ± Z Sx (2)
300240180140120100806040200
60
50
40
30
20
10
0
CVs
Fre
qu
en
cy
Mean 68.68
StDev 37.17
N 218
Histogram of CVsNormal
Sample Collection and Laboratory Analysis of Chlorophyll-a Standard Operation Procedure – Appendix A
12/21/11 Final A-6
Where x is the sampling event average Chla, Z is the Z-table value having a tail area of to its right, and Sx is equal to the standard deviation of the sampling event divided by the square root of n (n =11). The bootstrapping approach will be discussed momentarily. Equation 1 is solved iteratively (Thornton, et al., 1982), and is commonly used to determine an appropriate sample size for future sampling events, given the variability of a test sample’s replicates and the desired interval width. In our case, sample size is about 11, since that is the SOP for Chla. The standard deviation, s, needs to be determined for a given sampling event, and d needs to be determined based on what degree of precision around the true average is wanted. Again, our objective was to determine the confidence and accuracy with which our current protocol estimates an average benthic algae level. The most reasonable standard deviation (s) to use in equation 1, therefore, is the one associated with the central tendency for all types of streams sampled via these methods (Figure A-2). Per our rationale in Section A.1, a CV of 73% was used to back-calculate s. This is easily done, as s = [CV∙ average]/100. (For example, an 11-replicate sampling event with an average algae density of 114 mg Chla/m2 will have, at a CV of 73%, an s of 83.) The desired interval width also needed to be determined; we believed a precision of ± 20-30% of the mean was reasonable. This is because, at a threshold of 150 mg Chla/m2 (nuisance threshold), the upper confidence bound for the measured average should fall short of the unacceptable (i.e., 200 mg Chla/m2) algae level, given a reasonable level of confidence. Equation 1 was solved iteratively (Thornton et al., 1982) with a fixed n = 11, varying confidence levels from the Student’s t distribution, and varying values of d between 20 and 30% of the average. We found that, with a typical replicate CV of 73%, we are 80% confident that the average benthic Chla measured during a sampling event will be within ± 30% of the true population average. Stated differently: for a typical benthic Chla sampling event that has followed the SOP, DEQ is confident that 80% of the time the measured Chla average will be within ± 30% of the true population average. It should be noted that if the replicates from a sampling event produce a much lower CV, then greater confidence in the interval width is possible (e.g., 90 or 95% confidence), the interval width can be narrowed, or both. Conversely, sampling events with much higher CVs will estimate the mean Chla with less confidence, or with a wider interval width, or both. The confidence limits estimated in the above paragraph are, therefore, for typical Chla sampling events. Bootstrapping was used to cross-check these results. Bootstrapping is a method that, in the absence of any other knowledge about a population, considers the distribution of values found in a random sample of size n from a population to be the best guide to the distribution in the population itself (Manly, 2001). To carry out the bootstrap, test datasets comprised of 11 replicates which produced a particular average algae level (e.g., 150 mg Chla/m2) were created, each test dataset having a replicate CV of 73%. For any given algae level (say, 150 mg Chla/m2), the bootstrap program sampled (with replacement) the original 11 replicates, and then generated an average for the re-sampled observations. This was repeated 200 times, i.e., creating 200 generated datasets and 200 corresponding averages. A confidence interval and upper and lower bound for the generated average Chla levels were then calculated. In all cases the results of the bootstrap closely matched the output from equation 2, for both the confidence level and the interval width.
Sample Collection and Laboratory Analysis of Chlorophyll-a Standard Operation Procedure – Appendix A
12/21/11 Final A-7
Finally, we examined the consistency of averages calculated from field duplication efforts. These involved the collection of 11 replicates along a site, labeled “Duplicate 1”, followed immediately by the collection of another 11 replicates, labeled “Duplicate 2”. The Duplicate 2 samples were collected either 1 m up- or downstream of the Duplicate 1 collection points, or were collected via one of the site’s alternative longitudinal sampling patterns (see Section 1.2.5 and Figure 1-0, this SOP). There is no way to know which (if either) of the two duplicate values is the “true” Chla average, therefore the average of all the replicates (n=22) at a site was assumed to be the true site average. The % difference between the collective average and each duplicate’s average was then evaluated (i.e., did duplicate 1 and duplicate 2 each fall within 30% of the all-replicates average). Results are shown in Table A-2. Table A-2. Field Duplicated Sampling Events for Benthic Algal Chla. Values are the average benthic Chla calculated seperately for two sampling events (N = 11 reps each), carried out at the same stream site, same day.
Site
Benthic Algal Chla (mg/m
2)
CVs (%) Duplicates' average Chla within
expected range*? 1
st
Duplicate 2
nd
Duplicate 1
st
Duplicate 2
nd
Duplicate
Rock Creek (Y02ROCKC01) 21 21 126 149 Yes
Beaver Creek (M09BEVRC05) 51 67 99 61 Yes
Little Thompson River (C13LTTPR40) 32 23 106 104 Yes
Swamp Creek (C13SWPCR20) 12 11 62 61 Yes
E. Gallatin River (site EG10)
136 130 n/a n/a Yes
E. Gallatin River (site EG13)
54 161 n/a n/a No
Armells Creek (M31ARMLC07) 58 65 70 89 Yes
Middle Fork Judith River (M22JUDSF01)
31 36 80 96 Yes
Moose Creek (M03MOOSEC04) 26 27 112 132 Yes
Eagle Creek (M10EAGLC01) 79 96 83 79 Yes
Box Elder Creek (Y26BOXEC08) 22 31 74 78 Yes
*Compared to ± 30% of the whole dataset average, i.e., all replicates collected for the 1st duplicate and the 2nd duplicate. Note: In some sites the templates, hoops or cores were composited and so a CV could not be calculated. Shown as n/a in the 'CVs (%)' columns.
Overall, the duplicates’ averages all fell within ± 30% of the corresponding overall average, with one exception. Nine of eleven successful duplications is 91% success; this is in fact superior to the calculated statistical confidence level (80%) of the method. These data therefore show that actual field duplication will produce results equal to or better than our statistically determined expectations derived from replicate variability.
Sample Collection and Laboratory Analysis of Chlorophyll-a Standard Operation Procedure – Appendix A
12/21/11 Final A-8
Sample Collection and Laboratory Analysis of Chlorophyll-a Standard Operation Procedure – Appendix B
12/21/11 Final B-1
APPENDIX B – AQUATIC PLANT TRACKING FORM
Sample Collection and Laboratory Analysis of Chlorophyll-a Standard Operation Procedure – Appendix B
12/21/11 Final B-1
Periphyton Standard Operating Procedure – Appendix C
12/21/11 Final C-1
APPENDIX C – EXAMPLE PHOTOS DEPICTING BENTHIC ALGAE LEVELS OF 50
MG CHLA/M2 OR LESS.
Periphyton Standard Operating Procedure – Appendix C
12/21/11 Final C-2
Periphyton Standard Operating Procedure – Appendix D
12/21/11 Final D-1
APPENDIX D – AQUATIC PLANT VISUAL ASSESSMENT FORM
Waterbody: Site Visit Code:
Date: Reach: EMAP Layout
Visit No.:
Transect Letter: A0 = Absent (0% ) G = Green Gr = Growing Thin = < 0.5 mm thick
1 = Sparse (< 10% ) GLB=Green/light brown M = Mature Medium = 0.5-3 mm thick
2 = Moderate (10-40% ) LB= Light brown D = Decaying Thick = > 3 mm thick
3 = Heavy (40-75% ) BR = Brown/reddish Short = < 2 cm long
4 = Very Heavy (>75% ) DBB =Dark brown/black Long = >2 cm long
Predominant
Color Condition
Transect Letter: B0 = Absent (0% ) G = Green Gr = Growing Thin = < 0.5 mm thick
1 = Sparse (< 10% ) GLB=Green/light brown M = Mature Medium = 0.5-3 mm thick
2 = Moderate (10-40% ) LB= Light brown D = Decaying Thick = > 3 mm thick
3 = Heavy (40-75% ) BR = Brown/reddish Short = < 2 cm long
4 = Very Heavy (>75% ) DBB =Dark brown/black Long = >2 cm long
Predominant
Color Condition
Transect Letter: C0 = Absent (0% ) G = Green Gr = Growing Thin = < 0.5 mm thick
1 = Sparse (< 10% ) GLB=Green/light brown M = Mature Medium = 0.5-3 mm thick
2 = Moderate (10-40% ) LB= Light brown D = Decaying Thick = > 3 mm thick
3 = Heavy (40-75% ) BR = Brown/reddish Short = < 2 cm long
4 = Very Heavy (>75% ) DBB =Dark brown/black Long = >2 cm long
Predominant
Color Condition
For microalgae & filamentous
algae: Record thickness or
length category
Microalgae 0 1 2 3 4
Filamentous Algae 0 1 2 3 4
Macrophytes 0 1 2 3 4
Moss 0 1 2 3 4
AQUATIC PLANT
VISUAL ASSESSMENT
FORM
Actual Cover in channel
(circle one)
COMMENTS
AQUATIC PLANT
VISUAL ASSESSMENT
FORM
Actual Cover in channel
(circle one)
For microalgae & filamentous
algae: Record thickness or
length category
Moss 0 1 2 3 4
Microalgae 0 1 2 3 4
Filamentous Algae 0 1 2 3 4
Macrophytes 0 1 2 3 4
AQUATIC PLANT
VISUAL ASSESSMENT
FORM
Actual Cover in channel
(circle one)
For microalgae & filamentous
algae: Record thickness or
length category
COMMENTS
Moss 0 1 2 3 4
Microalgae 0 1 2 3 4
Filamentous Algae 0 1 2 3 4
Macrophytes 0 1 2 3 4
COMMENTS
Periphyton Standard Operating Procedure – Appendix D
12/21/11 Final D-2
Site Visit Code:
Date:
Transect Letter: D0 = Absent (0% ) G = Green Gr = Growing Thin = < 0.5 mm thick
1 = Sparse (< 10% ) GLB=Green/light brown M = Mature Medium = 0.5-3 mm thick
2 = Moderate (10-40% ) LB= Light brown D = Decaying Thick = > 3 mm thick
3 = Heavy (40-75% ) BR = Brown/reddish Short = < 2 cm long
4 = Very Heavy (>75% ) DBB =Dark brown/black Long = >2 cm long
Predominant
Color Condition
Transect Letter: E0 = Absent (0% ) G = Green Gr = Growing Thin = < 0.5 mm thick
1 = Sparse (< 10% ) GLB=Green/light brown M = Mature Medium = 0.5-3 mm thick
2 = Moderate (10-40% ) LB= Light brown D = Decaying Thick = > 3 mm thick
3 = Heavy (40-75% ) BR = Brown/reddish Short = < 2 cm long
4 = Very Heavy (>75% ) DBB =Dark brown/black Long = >2 cm long
Predominant
Color Condition
Transect Letter: F0 = Absent (0% ) G = Green Gr = Growing Thin = < 0.5 mm thick
1 = Sparse (< 10% ) GLB=Green/light brown M = Mature Medium = 0.5-3 mm thick
2 = Moderate (10-40% ) LB= Light brown D = Decaying Thick = > 3 mm thick
3 = Heavy (40-75% ) BR = Brown/reddish Short = < 2 cm long
4 = Very Heavy (>75% ) DBB =Dark brown/black Long = >2 cm long
Predominant
Color Condition
AQUATIC PLANT
VISUAL ASSESSMENT
FORM
Actual Cover in channel
(circle one)
For microalgae & filamentous
algae: Record thickness or
length category
Moss 0 1 2 3 4
Microalgae 0 1 2 3 4
Filamentous Algae 0 1 2 3 4
Macrophytes 0 1 2 3 4
AQUATIC PLANT
VISUAL ASSESSMENT
FORM
Actual Cover in channel
(circle one)
For microalgae & filamentous
algae: Record thickness or
length category
COMMENTS
Moss 0 1 2 3 4
Microalgae 0 1 2 3 4
Filamentous Algae 0 1 2 3 4
Macrophytes 0 1 2 3 4
AQUATIC PLANT
VISUAL ASSESSMENT
FORM
Actual Cover in channel
(circle one)
For microalgae & filamentous
algae: Record thickness or
length category
COMMENTS
Moss 0 1 2 3 4
Microalgae 0 1 2 3 4
Filamentous Algae 0 1 2 3 4
Macrophytes 0 1 2 3 4
COMMENTS
Periphyton Standard Operating Procedure – Appendix D
12/21/11 Final D-3
Site Visit Code:
Date:
Transect Letter: G0 = Absent (0% ) G = Green Gr = Growing Thin = < 0.5 mm thick
1 = Sparse (< 10% ) GLB=Green/light brown M = Mature Medium = 0.5-3 mm thick
2 = Moderate (10-40% ) LB= Light brown D = Decaying Thick = > 3 mm thick
3 = Heavy (40-75% ) BR = Brown/reddish Short = < 2 cm long
4 = Very Heavy (>75% ) DBB =Dark brown/black Long = >2 cm long
Predominant
Color Condition
Transect Letter: H0 = Absent (0% ) G = Green Gr = Growing Thin = < 0.5 mm thick
1 = Sparse (< 10% ) GLB=Green/light brown M = Mature Medium = 0.5-3 mm thick
2 = Moderate (10-40% ) LB= Light brown D = Decaying Thick = > 3 mm thick
3 = Heavy (40-75% ) BR = Brown/reddish Short = < 2 cm long
4 = Very Heavy (>75% ) DBB =Dark brown/black Long = >2 cm long
Predominant
Color Condition
Transect Letter: I0 = Absent (0% ) G = Green Gr = Growing Thin = < 0.5 mm thick
1 = Sparse (< 10% ) GLB=Green/light brown M = Mature Medium = 0.5-3 mm thick
2 = Moderate (10-40% ) LB= Light brown D = Decaying Thick = > 3 mm thick
3 = Heavy (40-75% ) BR = Brown/reddish Short = < 2 cm long
4 = Very Heavy (>75% ) DBB =Dark brown/black Long = >2 cm long
Predominant
Color Condition
AQUATIC PLANT
VISUAL ASSESSMENT
FORM
Actual Cover in channel
(circle one)
For microalgae & filamentous
algae: Record thickness or
length category
Moss 0 1 2 3 4
Microalgae 0 1 2 3 4
Filamentous Algae 0 1 2 3 4
Macrophytes 0 1 2 3 4
AQUATIC PLANT
VISUAL ASSESSMENT
FORM
Actual Cover in channel
(circle one)
For microalgae & filamentous
algae: Record thickness or
length category
COMMENTS
Moss 0 1 2 3 4
Microalgae 0 1 2 3 4
Filamentous Algae 0 1 2 3 4
Macrophytes 0 1 2 3 4
AQUATIC PLANT
VISUAL ASSESSMENT
FORM
Actual Cover in channel
(circle one)
For microalgae & filamentous
algae: Record thickness or
length category
COMMENTS
Moss 0 1 2 3 4
Microalgae 0 1 2 3 4
Filamentous Algae 0 1 2 3 4
Macrophytes 0 1 2 3 4
COMMENTS
Periphyton Standard Operating Procedure – Appendix D
12/21/11 Final D-4
Site Visit Code:
Date:
Transect Letter: J0 = Absent (0% ) G = Green Gr = Growing Thin = < 0.5 mm thick
1 = Sparse (< 10% ) GLB=Green/light brown M = Mature Medium = 0.5-3 mm thick
2 = Moderate (10-40% ) LB= Light brown D = Decaying Thick = > 3 mm thick
3 = Heavy (40-75% ) BR = Brown/reddish Short = < 2 cm long
4 = Very Heavy (>75% ) DBB =Dark brown/black Long = >2 cm long
Predominant
Color Condition
Transect Letter: K0 = Absent (0% ) G = Green Gr = Growing Thin = < 0.5 mm thick
1 = Sparse (< 10% ) GLB=Green/light brown M = Mature Medium = 0.5-3 mm thick
2 = Moderate (10-40% ) LB= Light brown D = Decaying Thick = > 3 mm thick
3 = Heavy (40-75% ) BR = Brown/reddish Short = < 2 cm long
4 = Very Heavy (>75% ) DBB =Dark brown/black Long = >2 cm long
Predominant
Color Condition
AQUATIC PLANT
VISUAL ASSESSMENT
FORM
Actual Cover in channel
(circle one)
For microalgae & filamentous
algae: Record thickness or
length category
Moss 0 1 2 3 4
Microalgae 0 1 2 3 4
Filamentous Algae 0 1 2 3 4
Macrophytes 0 1 2 3 4
AQUATIC PLANT
VISUAL ASSESSMENT
FORM
Actual Cover in channel
(circle one)
For microalgae & filamentous
algae: Record thickness or
length category
COMMENTS
Microalgae 0 1 2 3 4
Filamentous Algae 0 1 2 3 4
Macrophytes 0 1 2 3 4
COMMENTS
Moss 0 1 2 3 4
Periphyton Standard Operating Procedure – Appendix E
12/21/11 Final E-1
APPENDIX E – EXAMPLE ALGAE PHOTOS DEPICTING DIFFERENT COLOR AND
GROWTH CONDITIONS, PER CATEGORIES IN THE AQUATIC PLANT VISUAL
ASSESSMENT FORM
E1.0 PREDOMINANT COLOR
E1.1 GREEN
Periphyton Standard Operating Procedure – Appendix E
12/21/11 Final E-2
E1.2 GREEN/LIGHT BROWN
Periphyton Standard Operating Procedure – Appendix E
12/21/11 Final E-3
E1.3 LIGHT BROWN
Periphyton Standard Operating Procedure – Appendix E
12/21/11 Final E-4
E1.4. BROWN/REDDISH
E1.5 DARK BROWN/BLACK - NO EXAMPLE AVAILABLE
Periphyton Standard Operating Procedure – Appendix E
12/21/11 Final E-5
E2.0 CONDITION
E2.1 GROWING (FILAMENTOUS ALGAE)
E2.2 GROWING (DIATOMS. NOTE THE GOLDEN BROWN COLOR ON ROCKS)
Periphyton Standard Operating Procedure – Appendix E
12/21/11 Final E-6
E2.3 MATURE
Periphyton Standard Operating Procedure – Appendix E
12/21/11 Final E-7
E2.4 DECAYING
Periphyton Standard Operating Procedure – Appendix E
12/21/11 Final E-8
E3.0 THICKNESS CATEGORY FOR MICROALGAE
E3.1 MICROALGAE THIN (NOTE THICKNESS ON ROCKS THAT DON’T HAVE
FILAMENTS)
E3.2 MICROALGAE MEDIUM
Periphyton Standard Operating Procedure – Appendix E
12/21/11 Final E-9
E3.3 MICROALGAE THICK
Periphyton Standard Operating Procedure – Appendix E
12/21/11 Final E-10
E4.0 LENGTH CATEGORY FOR FILAMENTOUS ALGAE
E4.1 SHORT
E4.2 LONG
Periphyton Standard Operating Procedure – Appendix E
12/21/11 Final E-11
E5.0 A FEW EXAMPLES OF OTHER AQUATIC PLANTS IN STREAMS
E5.1 MACROPHYTES
E5.2 MOSS
Periphyton Standard Operating Procedure – Appendix E
12/21/11 Final E-12
E5.3 CHARA (BRANCHED ALGAE, OFTEN ASSOCIATED WITH GOOD WATER QUALITY)