10
Portfolio Review Abbot Household 6718 Windy Way Lane Raleigh, NC 27601 Prepared By: Rick Davis, CFP June 30, 2013 SAMPLE

Portfolio ReviewAbbot Household
6718 Windy Way LaneRaleigh, NC 27601
Prepared By: Rick Davis, CFP
June 30, 2013
SAMPLE
Market Commentary
Abbot HouseholdCombined Brokerage
Period Ending: 6/30/2013Portfolio Inception Date: 2/28/2007
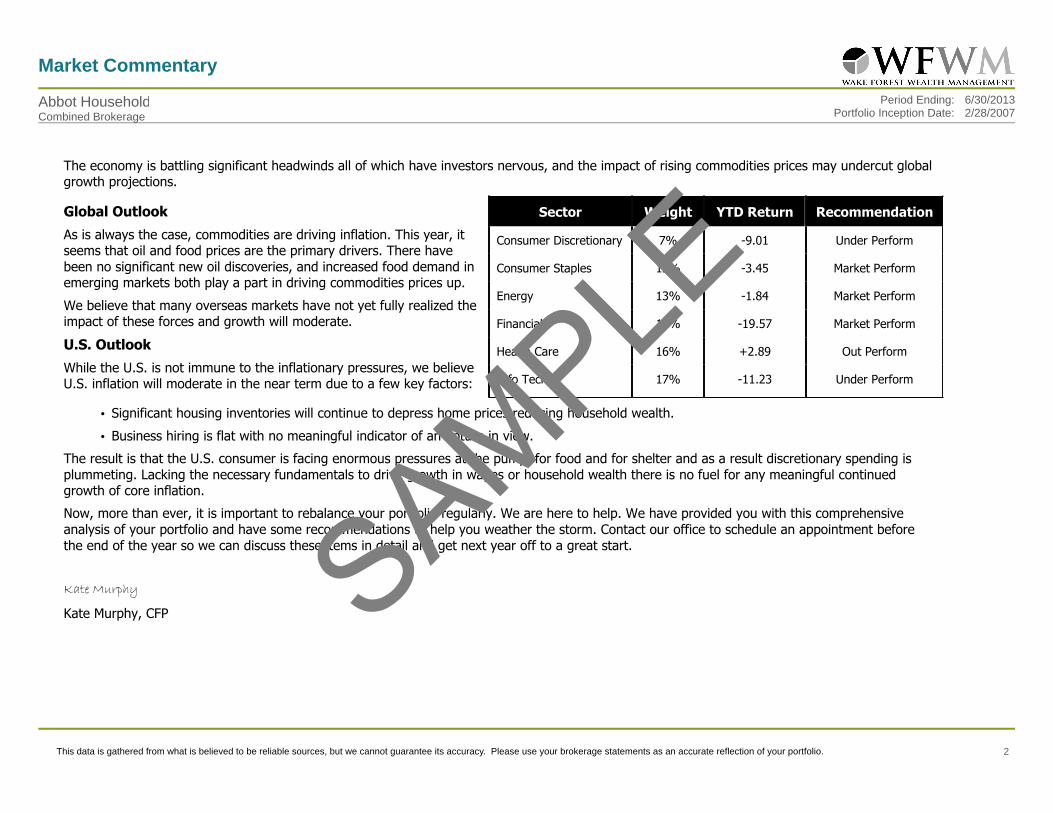
The economy is battling significant headwinds all of which have investors nervous, and the impact of rising commodities prices may undercut global growth projections.
Sector Weight YTD Return RecommendationGlobal Outlook
As is always the case, commodities are driving inflation. This year, it seems that oil and food prices are the primary drivers. There have been no significant new oil discoveries, and increased food demand in emerging markets both play a part in driving commodities prices up.
We believe that many overseas markets have not yet fully realized the impact of these forces and growth will moderate.
U.S. Outlook
While the U.S. is not immune to the inflationary pressures, we believe U.S. inflation will moderate in the near term due to a few key factors:
Consumer Discretionary 7% -9.01 Under Perform
Consumer Staples 12% -3.45 Market Perform
Energy 13% -1.84 Market Perform
Financial 15% -19.57 Market Perform
Health Care 16% +2.89 Out Perform
Info Tech 17% -11.23 Under Perform
�
�
Significant housing inventories will continue to depress home prices reducing household wealth.
Business hiring is flat with no meaningful indicator of an upturn in view.
The result is that the U.S. consumer is facing enormous pressures at the pump, for food and for shelter and as a result discretionary spending is plummeting. Lacking the necessary fundamentals to drive growth in wages or household wealth there is no fuel for any meaningful continued growth of core inflation.
Now, more than ever, it is important to rebalance your portfolio regularly. We are here to help. We have provided you with this comprehensive analysis of your portfolio and have some recommendations to help you weather the storm. Contact our office to schedule an appointment before the end of the year so we can discuss these items in detail and get next year off to a great start.
Kate Murphy
Kate Murphy, CFP
This data is gathered from what is believed to be reliable sources, but we cannot guarantee its accuracy. Please use your brokerage statements as an accurate reflection of your portfolio. 2
SAMPLE
Portfolio Overview
Abbot HouseholdCombined Brokerage
Period Ending: 6/30/2013Portfolio Inception Date: 2/28/2007
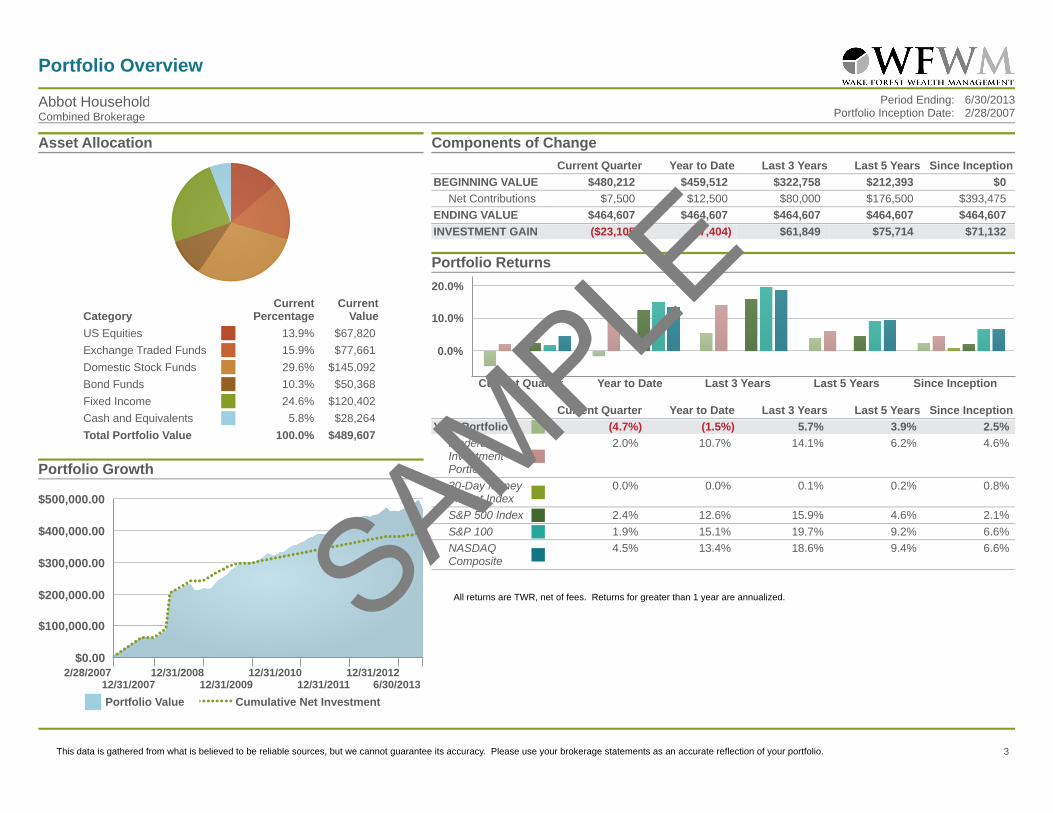
Asset Allocation
CategoryCurrent
PercentageCurrent
Value
US Equities 13.9% $67,820
Exchange Traded Funds 15.9% $77,661
Domestic Stock Funds 29.6% $145,092
Bond Funds 10.3% $50,368
Fixed Income 24.6% $120,402
Cash and Equivalents 5.8% $28,264
Total Portfolio Value 100.0% $489,607
Portfolio Growth
Portfolio Value Cumulative Net Investment
$0.00
$100,000.00
$200,000.00
$300,000.00
$400,000.00
$500,000.00
2/28/200712/31/2007
12/31/200812/31/2009
12/31/201012/31/2011
12/31/20126/30/2013
Components of Change
BEGINNING VALUE
Net Contributions
ENDING VALUE
INVESTMENT GAIN
Current Quarter
$480,212
$7,500
$464,607
($23,105)
Year to Date
$459,512
$12,500
$464,607
($7,404)
Last 3 Years
$322,758
$80,000
$464,607
$61,849
Last 5 Years
$212,393
$176,500
$464,607
$75,714
Since Inception
$0
$393,475
$464,607
$71,132
Portfolio Returns
Current Quarter Year to Date Last 3 Years Last 5 Years Since Inception
0.0%
10.0%
20.0%
Current Quarter Year to Date Last 3 Years Last 5 Years Since Inception
Your Portfolio (4.7%) (1.5%) 5.7% 3.9% 2.5%
Moderate Investment Portfolio
2.0% 10.7% 14.1% 6.2% 4.6%
30-Day Money Market Index
0.0% 0.0% 0.1% 0.2% 0.8%
S&P 500 Index 2.4% 12.6% 15.9% 4.6% 2.1%
S&P 100 1.9% 15.1% 19.7% 9.2% 6.6%
NASDAQ Composite
4.5% 13.4% 18.6% 9.4% 6.6%
All returns are TWR, net of fees. Returns for greater than 1 year are annualized.
This data is gathered from what is believed to be reliable sources, but we cannot guarantee its accuracy. Please use your brokerage statements as an accurate reflection of your portfolio. 3
SAMPLE

Account Performance Summary
Abbot HouseholdCombined Brokerage
Period Ending: 6/30/2013Portfolio Inception Date: 2/28/2007
Account Description Account Key Account Type Inception Date Current Value
Current Quarter Year to Date Last 3 Years Last 5 Years
Since Inception
Time-Weighted Rate of Return
Abbot, Joel ****5030 Brokerage 2/28/2007 370,189.07 1.8% 6.6% 10.7% 5.0% 2.5%
Abbot, Maggie ****4008 IRA 3/31/2008 94,418.04 (23.7%) (24.0%) (7.2%) (2.9%) (1.7%)
Abbot Household 2/28/2007 464,607.11 (4.7%) (1.5%) 5.7% 3.9% 2.5%
Moderate Investment Portfolio 2.0% 10.7% 14.1% 6.2% 4.6%
30-Day Money Market Index 0.0% 0.0% 0.1% 0.2% 0.8%
S&P 500 Index 2.4% 12.6% 15.9% 4.6% 2.1%
S&P 100 1.9% 15.1% 19.7% 9.2% 6.6%
NASDAQ Composite 4.5% 13.4% 18.6% 9.4% 6.6%
All returns are TWR, net of fees. Returns for greater than 1 year are annualized.
This data is gathered from what is believed to be reliable sources, but we cannot guarantee its accuracy. Please use your brokerage statements as an accurate reflection of your portfolio. 4
SAMPLE

Asset Class Performance Summary
Abbot HouseholdCombined Brokerage
Period Ending: 6/30/2013Portfolio Inception Date: 2/28/2007
Asset Class Description Inception Date Current ValueCurrent Quarter Year to Date Last 3 Years Last 5 Years
Since Inception
US Equities 4/14/2007 67,820 2.05% 7.27% 27.72% 17.52% 11.54%
Exchange Traded Funds 3/14/2007 77,661 5.84% 14.21% 7.06% 2.59% 1.11%
Domestic Stock Funds 2/28/2007 145,092 3.45% 12.16% 12.51% 4.66% 1.49%
Bond Funds 3/31/2007 50,368 (4.10%) (2.76%) 2.18% 1.56% 0.38%
Fixed Income 3/31/2008 120,402 (4.51%) (4.76%) 1.52% 3.65% 4.87%
Cash and Equivalents 2/28/2007 28,264 0.00% 0.00% 0.00% 0.00% 0.00%
Total Portfolio (Prior to Fees) 2/28/2007 464,607 (4.71%) (1.47%) 6.14% 4.39% 3.10%
Total Portfolio (Net of Fees) 2/28/2007 464,607 (4.71%) (1.47%) 5.66% 3.88% 2.48%
Moderate Investment Portfolio 2.04% 10.69% 14.10% 6.19% 4.59%
30-Day Money Market Index 0.01% 0.02% 0.07% 0.16% 0.85%
S&P 500 Index 2.36% 12.63% 15.94% 4.65% 2.12%
S&P 100 1.88% 15.08% 19.69% 9.21% 6.64%
NASDAQ Composite 4.52% 13.43% 18.64% 9.39% 6.61%
Your TWR returns are gross of fees unless otherwise stated. Returns for more than a year have been annualized.
This data is gathered from what is believed to be reliable sources, but we cannot guarantee its accuracy. Please use your brokerage statements as an accurate reflection of your portfolio. 5
SAMPLE

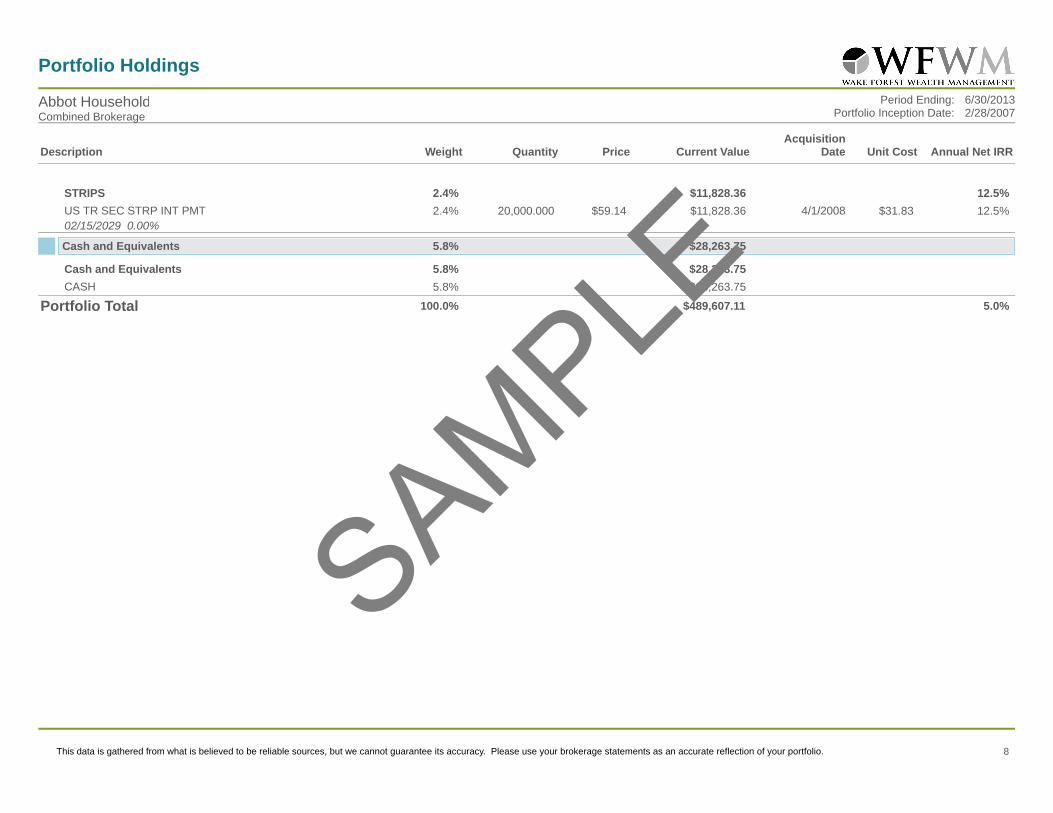
Portfolio Holdings
Abbot HouseholdCombined Brokerage
Period Ending: 6/30/2013Portfolio Inception Date: 2/28/2007
Description Weight Quantity Price Current ValueAcquisition
Date Unit Cost Annual Net IRR
US Equities 13.9% $67,820.37 16.4%
Technology 4.9% $23,935.83 20.2%
APPLE INC 2.4% $11,895.90 29.4%30.000 $396.53 7/1/2009 $175.07
International Business Machines 2.5% $12,039.93 14.7%63.000 $191.11 7/15/2008 $113.79
Services 6.1% $30,106.44 22.7%
Walt Disney Company 3.0% $14,777.10 19.6%234.000 $63.15 3/14/2008 $25.55
Starbucks Corp 3.1% $15,329.34 25.4%234.000 $65.51 1/15/2008 $18.88
Conglomarates 2.8% $13,778.10
3M Co. 2.8% $13,778.10126.000 $109.35 9/25/2012 $92.83
Exchange Traded Funds 15.9% $77,660.79 4.0%
Healthcare & Pharmacutical 4.3% $20,935.53 22.3%
SPDR S&P Pharmaceuticals ETF 4.3% $20,935.53 22.3%297.000 $70.49 8/1/2009 $36.96
Industry: Technology Funds 7.8% $37,991.45 7.1%
iShares Dow Jones US Regional Banks Index Fund 4.0% $19,633.46 6.3%671.000 $29.26 8/15/2007 $23.85
PowerShares Dynamic Financial Sector 3.7% $18,357.99 7.9%749.000 $24.51 3/15/2007 $18.23
Bear Market 3.8% $18,733.81 (14.7%)
ProShares Short QQQ ProShares 3.8% $18,733.81 (14.7%)817.000 $22.93 7/1/2007 $35.85
Domestic Stock Funds 29.6% $145,092.08 4.4%
Growth - Large 7.4% $36,203.51 4.6%
Growth Fund Of Amer Cl A 7.4% $36,203.51 4.1%941.329 $38.46 3/1/2007 $34.23
Growth - Small 22.2% $108,888.57 4.3%
Berwyn Income Fund 7.3% $35,807.33 2.5%2,611.767 $13.71 9/1/2007 $12.98
Dfa US Small Cap Value 7.4% $36,120.50 3.8%1,172.363 $30.81 5/1/2007 $28.00
Hartford Capital Appreciation 7.5% $36,960.74728.865 $50.71 9/25/2012 $47.25
Continued on Next Page
This data is gathered from what is believed to be reliable sources, but we cannot guarantee its accuracy. Please use your brokerage statements as an accurate reflection of your portfolio. 6
SAMPLE

Portfolio Holdings
Abbot HouseholdCombined Brokerage
Period Ending: 6/30/2013Portfolio Inception Date: 2/28/2007
Description Weight Quantity Price Current ValueAcquisition
Date Unit Cost Annual Net IRR
Bond Funds 10.3% $50,367.70 1.5%
Fixed Income - Diversified 2.5% $12,138.69 2.7%
Permanent Portfolio 2.5% $12,138.69 5.3%270.169 $44.93 1/1/2008 $38.10
Fixed Income - High Yield 7.8% $38,229.01 0.5%
American Aadvantage High Yield 2.6% $12,754.15 (0.6%)1,410.857 $9.04 4/1/2008 $8.94
Buffalo High Yield Fund 2.7% $13,118.17 2.0%1,127.960 $11.63 8/1/2008 $10.74
Putnam High Yield Trust 2.5% $12,356.691,574.100 $7.85 9/25/2012 $8.01
Fixed Income 24.6% $120,402.42 4.8%
Corporate Bonds 11.8% $57,803.81 5.1%
BERKSHIRE HATHAWAY FIN 2.1% $10,118.17 1.7%10,000.000 $101.18 4/1/2008 $93.74
10/15/2013 4.625%Accrued Income $97.30
GE CAPITAL INTERNOTES 5.1% $25,000.00 2.1%25,000.000 $100.00 4/1/2008 $90.09
06/15/2013 4.15%
HANCOCK JOHN LIFE INS 4.6% $22,588.34 8.9%20,000.000 $112.94 3/1/2009 $98.01
11/15/2027 6.00%
Government Agency Bonds 2.7% $13,079.55 3.0%
FEDERAL NATL MTG ASSN 2.7% $12,999.73 3.0%10,000.000 $130.00 4/1/2008 $112.28
05/15/2029 6.25%Accrued Income $79.82
Treasury Notes 7.7% $37,690.70 3.1%
US TR BD STRIP PRN PMT 1.9% $9,344.66 11.3%10,000.000 $93.45 4/1/2008 $53.33
05/15/2018 0.00%
UNITED STATES TR BD 2.9% $13,913.28 0.8%10,000.000 $139.13 4/1/2008 $134.41
11/15/2018 9.00%Accrued Income $114.95
UNITED STATES TR BD 2.9% $13,984.38 1.3%10,000.000 $139.84 4/1/2008 $133.56
02/15/2019 8.875%Accrued Income $333.43
Continued on Next Page
This data is gathered from what is believed to be reliable sources, but we cannot guarantee its accuracy. Please use your brokerage statements as an accurate reflection of your portfolio. 7
SAMPLE
Portfolio Holdings
Abbot HouseholdCombined Brokerage
Period Ending: 6/30/2013Portfolio Inception Date: 2/28/2007
Description Weight Quantity Price Current ValueAcquisition
Date Unit Cost Annual Net IRR
STRIPS 2.4% $11,828.36 12.5%
US TR SEC STRP INT PMT 2.4% $11,828.36 12.5%20,000.000 $59.14 4/1/2008 $31.83
02/15/2029 0.00%
Cash and Equivalents 5.8% $28,263.75
Cash and Equivalents 5.8% $28,263.75
CASH 5.8% $28,263.75
Portfolio Total 100.0% $489,607.11 5.0%
This data is gathered from what is believed to be reliable sources, but we cannot guarantee its accuracy. Please use your brokerage statements as an accurate reflection of your portfolio. 8
SAMPLE
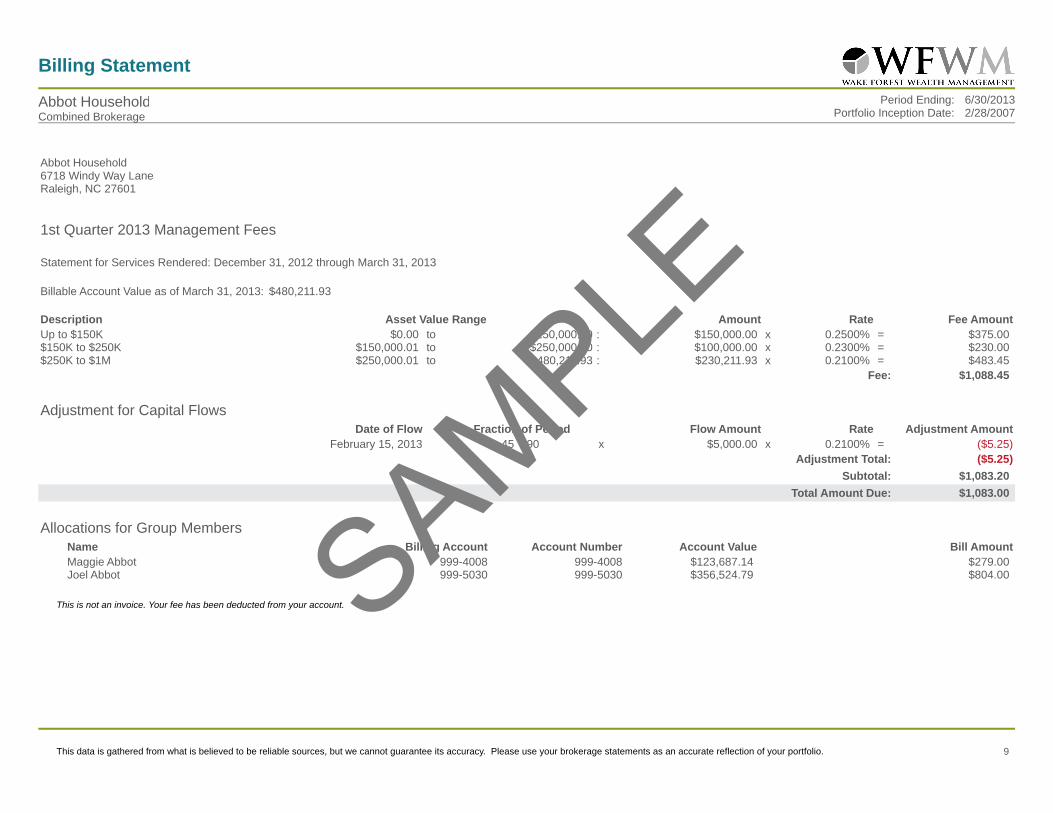
Billing Statement
Abbot HouseholdCombined Brokerage
Period Ending: 6/30/2013Portfolio Inception Date: 2/28/2007
Abbot Household6718 Windy Way LaneRaleigh, NC 27601
1st Quarter 2013 Management Fees
Statement for Services Rendered: December 31, 2012 through March 31, 2013
Billable Account Value as of March 31, 2013: $480,211.93
Description Asset Value Range Amount Rate Fee Amount
Up to $150K $0.00 to $150,000.00 : $150,000.00 x 0.2500% = $375.00$150K to $250K $150,000.01 to $250,000.00 : $100,000.00 x 0.2300% = $230.00$250K to $1M $250,000.01 to $480,211.93 : $230,211.93 x 0.2100% = $483.45
Fee: $1,088.45
Adjustment for Capital FlowsDate of Flow Fraction of Period Flow Amount Rate Adjustment Amount
February 15, 2013 45 / 90 x $5,000.00 x 0.2100% = ($5.25)
Adjustment Total: ($5.25)
Subtotal: $1,083.20
Total Amount Due: $1,083.00
Allocations for Group MembersName Billing Account Account Number Account Value Bill Amount
Maggie Abbot 999-4008 999-4008 $123,687.14 $279.00Joel Abbot 999-5030 999-5030 $356,524.79 $804.00
This is not an invoice. Your fee has been deducted from your account.
This data is gathered from what is believed to be reliable sources, but we cannot guarantee its accuracy. Please use your brokerage statements as an accurate reflection of your portfolio. 9
SAMPLE
Disclaimers
Abbot HouseholdCombined Brokerage
Period Ending: 6/30/2013Portfolio Inception Date: 2/28/2007
Market TermsAccrued InterestInterest that has accumulated since the last pay date, but has not yet been paid. Computed using the interest rate of the security.
Beginning/Ending ValueThe total value of all investments in your portfolio at the beginning or ending of the period or on a specific date. This value includes the market value of securities, cash and money funds, and accrued interest on bonds.
Capital FlowsDeposits and withdrawals of cash and securities. Capital flows include receipts and transfers of securities as well as cash deposits and withdrawals.
Cost BasisOriginal price of an asset, used in determining capital gains. Cost Basis is usually the purchase price including all fees.
ExpenseFee charged against a portfolio, reducing portfolio value. Includes Management Fees charged by the advisor.
Time Weighted Return (TWR)Provides a measure of the growth of a portfolio in terms that remove the effect of the timing and size of capital flows.
This data is gathered from what is believed to be reliable sources, but we cannot guarantee its accuracy. Please use your brokerage statements as an accurate reflection of your portfolio. 10
SAMPLE


