46
SAMPLE REPORT: JAPAN April 2018 – (The data in the sample report may not be the latest data available in the service). COUNTRY ENERGY REPORT- SAMPLE Report Sample
SAMPLE REPORT: JAPAN April 2018 – (The data in the sample report may not be the latest data
available in the service).
COUNTRY ENERGY REPORT-SAMPLE
Report
Sample
World Energy Research
Energy Report Sample— Japan Energy Report April 2018 — Copyright © Enerdata — All rights reserved 1
*Reproduction in whole or in part prohibited without written permission.
Table of contents
Table of contents ______________________________ 1
List of graphs & tables __________________________ 2
Overview ____________________________________ 4
Institutions and energy policy ____________________ 6
Energy companies ____________________________ 13
Energy supply ________________________________ 17
Energy prices ________________________________ 22
Energy consumption __________________________ 24
Issues and prospects __________________________ 30
Graphs & data files ___________________________ 36
Abbreviations ________________________________ 40
Glossary ____________________________________ 42
→
Report
Sample
World Energy Research
2 Energy Report Sample—Japan Energy Report April 2018 — Copyright © Enerdata — All rights reserved
*Reproduction in whole or in part prohibited without written permission.
List of graphs & tables
List of graphs
Graph 1: CO2-energy emissions (MtCO2) ----------------------------------------------------------------------------------------------------- 11
Graph 2: Installed electric capacity by source (2017, %) --------------------------------------------------------------------------------- 18
Graph 3: Gross power production by source (TWh) --------------------------------------------------------------------------------------- 19
Graph 4: Power generation by source (2017, %) ------------------------------------------------------------------------------------------- 19
Graph 5: Map of natural gas infrastructure -------------------------------------------------------------------------------------------------- 21
Graph 6: Gasoline & diesel prices (US$/l) ---------------------------------------------------------------------------------------------------- 22
Graph 7: Electricity prices for industry and households (US$c/kWh)------------------------------------------------------------------ 23
Graph 8: Gas prices for industry and households (US$c/kWh GCV) ------------------------------------------------------------------- 23
Graph 9: Consumption trends by energy source (Mtoe) --------------------------------------------------------------------------------- 24
Graph 10: Total consumption market share by energy (2017, %) ---------------------------------------------------------------------- 25
Graph 11: Final consumption market share by sector (2017, %) ----------------------------------------------------------------------- 25
Graph 12: Oil consumption (Mt) --------------------------------------------------------------------------------------------------------------- 26
Graph 13: Oil consumption breakdown by sector (2017, %) ---------------------------------------------------------------------------- 26
Graph 14: Electricity consumption (TWh) ---------------------------------------------------------------------------------------------------- 27
Graph 15: Electricity consumption breakdown by sector (2017, %) ------------------------------------------------------------------- 27
Graph 16: Natural gas consumption (bcm) -------------------------------------------------------------------------------------------------- 28
Graph 17: Gas consumption breakdown by sector (2017, %) --------------------------------------------------------------------------- 28
Graph 18: Coal and lignite consumption (Mt) ----------------------------------------------------------------------------------------------- 29
Graph 19: Coal and lignite consumption breakdown by sector (2017, %) ------------------------------------------------------------ 29
List of tables
Table 1: Economic indicators
• Population, GDP growth
• Imports & exports
• Inflation rate, exchange rate
• Energy security and efficiency indicators
• CO2 emissions
→
Report
Sample
World Energy Research
Energy Report Sample— Japan Energy Report April 2018 — Copyright © Enerdata — All rights reserved 3
*Reproduction in whole or in part prohibited without written permission.
Table 2: Supply indicators
• Oil & Gas proven reserves
• Electric & refining capacity detailed by source
• Production by energy source
• Power production by source
• External trade by energy source
Table 3: Demand indicators
• Consumption / inhabitant and consumption trends
• Total consumption by energy source
• Final consumption by energy source and by sector
• Electricity consumption by sector
Table 4: Energy Balance
• Total energy balance
• Detailed energy balance by energy source
Table 5: Power Infrastructures
• Main power plant projects by energy, technology, status and operator
Table 6: Gas infrastructures and contracts
• Main gas plant projects
• Main LNG contracts
Report
Sample
World Energy Research
4 Energy Report Sample—Japan Energy Report April 2018 — Copyright © Enerdata — All rights reserved
*Reproduction in whole or in part prohibited without written permission.
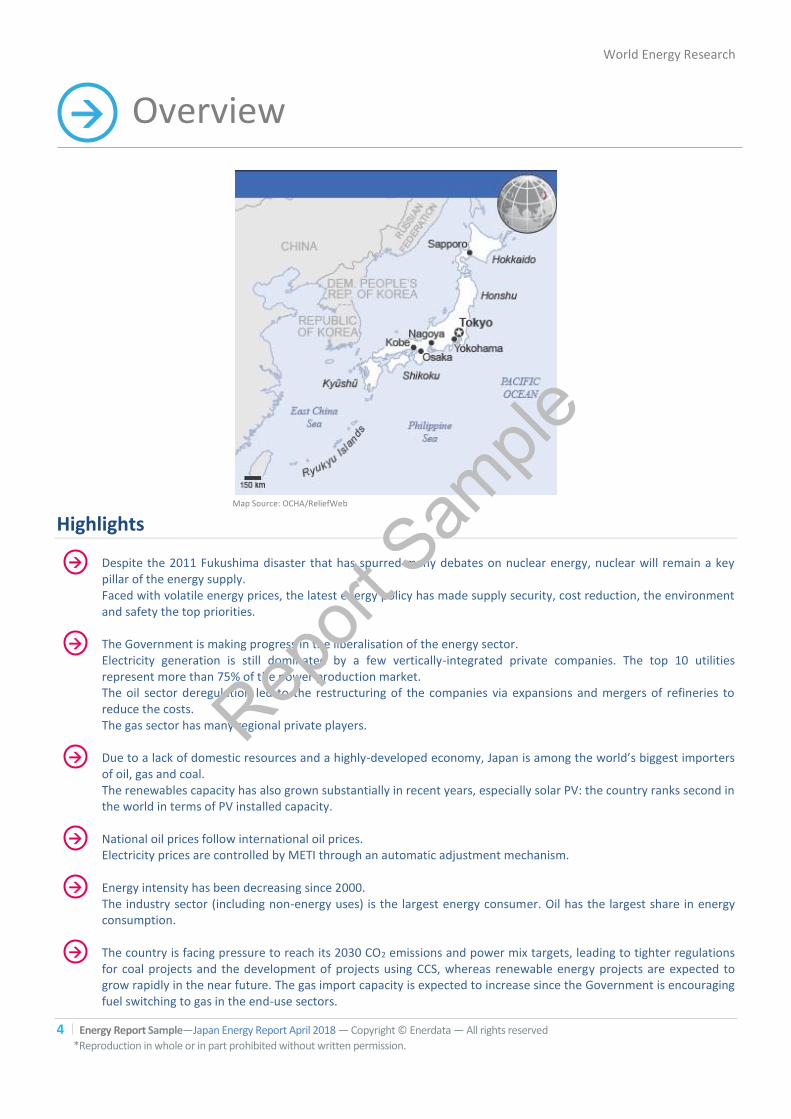
Overview
Map Source: OCHA/ReliefWeb
Highlights
Despite the 2011 Fukushima disaster that has spurred many debates on nuclear energy, nuclear will remain a key pillar of the energy supply. Faced with volatile energy prices, the latest energy policy has made supply security, cost reduction, the environment and safety the top priorities. The Government is making progress in the liberalisation of the energy sector. Electricity generation is still dominated by a few vertically-integrated private companies. The top 10 utilities represent more than 75% of the power production market. The oil sector deregulation led to the restructuring of the companies via expansions and mergers of refineries to reduce the costs. The gas sector has many regional private players. Due to a lack of domestic resources and a highly-developed economy, Japan is among the world’s biggest importers of oil, gas and coal. The renewables capacity has also grown substantially in recent years, especially solar PV: the country ranks second in the world in terms of PV installed capacity. National oil prices follow international oil prices. Electricity prices are controlled by METI through an automatic adjustment mechanism. Energy intensity has been decreasing since 2000. The industry sector (including non-energy uses) is the largest energy consumer. Oil has the largest share in energy consumption. The country is facing pressure to reach its 2030 CO2 emissions and power mix targets, leading to tighter regulations for coal projects and the development of projects using CCS, whereas renewable energy projects are expected to grow rapidly in the near future. The gas import capacity is expected to increase since the Government is encouraging fuel switching to gas in the end-use sectors.
→
→
→
→
→
→
→
Report
Sample
World Energy Research
Energy Report Sample— Japan Energy Report April 2018 — Copyright © Enerdata — All rights reserved 5
*Reproduction in whole or in part prohibited without written permission.
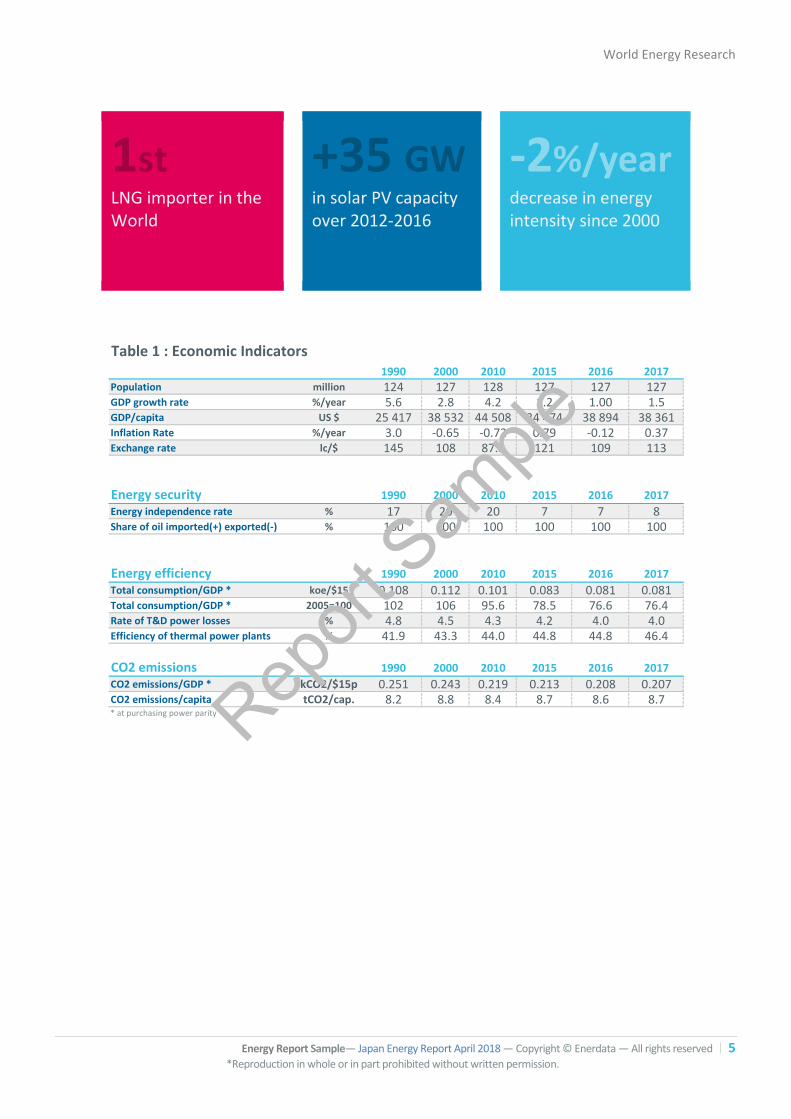
1st LNG importer in the World
+35 GW in solar PV capacity over 2012-2016
-2%/year decrease in energy intensity since 2000
Table 1 : Economic Indicators1990 2000 2010 2015 2016 2017
Population million 124 127 128 127 127 127GDP growth rate %/year 5.6 2.8 4.2 1.2 1.00 1.5GDP/capita US $ 25 417 38 532 44 508 34 474 38 894 38 361Inflation Rate %/year 3.0 -0.65 -0.72 0.79 -0.12 0.37Exchange rate lc/$ 145 108 87.8 121 109 113
Energy security 1990 2000 2010 2015 2016 2017
Energy independence rate % 17 20 20 7 7 8Share of oil imported(+) exported(-) % 100 100 100 100 100 100
Energy efficiency 1990 2000 2010 2015 2016 2017
Total consumption/GDP * koe/$15 0.108 0.112 0.101 0.083 0.081 0.081Total consumption/GDP * 2005=100 102 106 95.6 78.5 76.6 76.4Rate of T&D power losses % 4.8 4.5 4.3 4.2 4.0 4.0Efficiency of thermal power plants % 41.9 43.3 44.0 44.8 44.8 46.4
CO2 emissions 1990 2000 2010 2015 2016 2017
CO2 emissions/GDP * kCO2/$15p 0.251 0.243 0.219 0.213 0.208 0.207CO2 emissions/capita tCO2/cap. 8.2 8.8 8.4 8.7 8.6 8.7* at purchasing power parity Rep
ort Sam
ple
World Energy Research
Energy Report Sample— Japan Energy Report April 2018 — Copyright © Enerdata — All rights reserved 6
*Reproduction in whole or in part prohibited without written permission.
The residential electricity sector has been
open to competition since April 2016
Institutions and energy policy
Despite the 2011 Fukushima disaster that has spurred many debates on nuclear energy, nuclear will remain a key pillar of the energy supply.
Faced with volatile energy prices, the latest energy policy has made supply security, cost reduction, the environment and safety the top priorities.
The METI, Ministry of Economy, Trade and Industry, is in charge of the
energy sector through ANRE, Agency for Natural Resources and Energy.
ANRE has three departments: the Energy Conservation and Renewable
Energy Department, the Natural Resources and Fuel Department, and the
Electricity and Gas Industry Department.
EGC, Electricity and Gas Market Surveillance Commission, has been
implemented in 2015 to strengthen the monitoring of both markets.
The Strategic Energy Plan of Japan (2014) stipulates the main goals of the
country’s energy policy, based on the Basic Act on Energy Policy. It
designates nuclear power as an important long-term electricity source,
overturning the nuclear phase-out envisaged after the 2011 Fukushima
accident. The country will also seek to boost renewables. As of April 2018,
METI’s expert committee is finalising its long-term energy plan (to 2050)
proposal, which designates renewable energy sources and nuclear power
as major energy sources in the future, with an emphasis on advancing the
development of energy storage and hydrogen. The committee
recommended phasing-out and replacing inefficient coal-fired power
plants with gas power plants. METI aims to finalise the long-term energy
plan by summer 2018.
Electricity
ESCJ, Electric Power System Council of Japan, regulates the electricity
sector.
Under the Policy on the Electricity System Reform, the deregulation of the
retail market was launched in April 2016 and the residential sector was
open to competition. The unbundling of the power transmission and
→
Report
Sample
World Energy Research
Energy Report Sample— Japan Energy Report April 2018 — Copyright © Enerdata — All rights reserved 7
*Reproduction in whole or in part prohibited without written permission.
Nuclear target: 20-22% of power mix in 2030
distribution activities is planned for April 2020. This market opening
reform ends the monopoly of the ten regional electricity companies and
aims to boost competition and lower prices, which are among the highest
in the world. Utilities have long been opposed to such a move, but the
Fukushima accident has weakened their lobbying power.
An Organization for Cross-regional Coordination of Transmission
Operators (OCCTO) was set up in 2015 to aggregate and evaluate the
electricity supply plans from various companies, to oversee the cross-
regional operation of supply/demand and the network, and to draw up
the rules of the network code and power bidding.
Since the full opening of the retail residential electricity market, the
number of electricity retailers has ballooned from the 10 vertically
integrated utilities to about 400 companies. Non-power utility retailers are
expected to account for more than 10% of Japan’s electricity consumption
soon. However, former regional monopolies still generate most of the
power, while new retail companies must purchase power from higher-cost
plants such as gas-fired power plants. In December 2016, the METI
announced that it plans to implement a baseload power market to
improve competition by ensuring equal access to cheap power supplies
for new retail companies. This new scheme is planned to start during the
fiscal year 2019-2020.
The Japan Electric Power Exchange (JPEX) was set up in 2003. Following a
request from METI, Japan’s nine major utilities have pledged to allocate at
least 10% of their sales for competitive bidding during the fiscal year
starting 1 April 2018. This volume (which was previously locked up in
bilateral agreements) will boost JPEX’s trading volume to exceed a 15%
share in Japan’s total domestic power demand during the same period.
Nuclear
The Energy White Paper (Annual Report on Energy), which was approved
by the Cabinet in 2014, calls for a nuclear revival. In 2015, the Government
released plans to achieve a 20-22% share of nuclear in the power mix by
2030. The government is expected to maintain this target nuclear share in
the next long-term energy plan, which it is finalising, as nuclear is
considered a major energy source for Japan’s future.
Following the Fukushima nuclear accident, a new nuclear regulatory
agency, the Nuclear Regulation Authority (NRA), was created in 2012. It
issued new nuclear safety rules that took effect in 2013. Since then, only 6
reactors have cleared NRA inspections and resumed operations, namely
Sendai-1 and 2, Ohi-3 (Kyushu Electric), Takahama-3 and 4, Genkai-3
Report
Sample
8 Energy Report Sample— Japan Energy Report April 2018 — Copyright © Enerdata — All rights reserved *Reproduction in whole or in part prohibited without written permission.
The 4th Strategic Energy Plan
introduced full competition in the gas retail business in 2017
Energy efficiency target: 30% of energy savings by 2030
compared to 2006
(Kansai Electric). Shikoku Electric’s Ikata-3 also cleared inspection but was
ordered by the Hiroshima High Court to shut down until September 2018.
In addition, Kansai Electric’s Ohi-4 reactor and Kyushu Electric’s Genkai-4
reactor are scheduled for restart in May 2018.
In 2013, Japan created an authority dedicated to the dismantling of four
Fukushima nuclear units. The International Research Institute for Nuclear
Decommissioning (IRID) will be in charge of conceiving new technologies
and processes to clean up the nuclear site, including withdrawing spent
fuel.
Oil
Due to the lack of domestic resources, the energy policy incentivises
companies to pursue overseas exploration projects in order to secure the
supply.
Gas
The opening of the gas market took place in several phases: first for
customers consuming more than 217 mcm/year in 1994 and, after several
revisions, the threshold was lowered to 0.1 mcm/year in 2007. In 1999 the
law also introduced third party access to the gas transmission networks.
The government has implemented the full liberalisation of Japan’s gas
retail market since April 2017. Gas transmission and distribution networks
operated by the three largest gas suppliers, namely Tokyo Gas, Osaka Gas
and Toho Gas, will be transferred to companies that will become legally
separated in 2022, in order to open access to new entrants.
In 2014, Japan launched its LNG Futures market on the Japan OTC
Exchange (JOE) to bring more transparency to the spot deals and to lower
the price of LNG.
Energy efficiency
The Energy Efficiency Policy is governed by the Energy Conservation Law
(Rational Use of Energy Act, 1979), which was last amended in 2013. In
March 2018, the government approved a partial revision to the Rational
Use of Energy Act to establish a new evaluation system for inter-business
collaborations in energy conservation and to revise the energy
conservation classification of consignors in the goods transportation
sector. In 2006, the New National Energy Strategy, including the Energy
Report
Sample
World Energy Research
Energy Report Sample— Japan Energy Report April 2018 — Copyright © Enerdata — All rights reserved 9
*Reproduction in whole or in part prohibited without written permission.
Renewable energy target: 10% of the primary energy
consumption by 2020
Conservation Frontrunner Plan, set the target to improve energy efficiency
by at least 30% by 2030 compared to 2006.
Energy efficiency standards, known as the “top-runner programme”, have
existed since 1998. They currently concern about 32 products and types of
equipment, including household and commercial electrical appliances,
lamps, road vehicles, heating and cooking appliances and industrial
electric equipment (e.g. motors, transformers), with up to 3 updates for
some of them. For passenger cars, the 2015 target represented an
increase of about 24% in average fuel efficiency compared to 2004 levels.
The vehicle efficiency targets are generally set at 5-year intervals, with the
government targeting an average passenger car fleet fuel economy of
20.3 km/l by 2020, a 24% increase from 2009 levels and a 19.6% increase
from the 2015 actual results.
In industry, and in the commercial sector since 2008, large companies are
obliged to name an “energy manager” who is responsible for the
implementation of an energy plan and who has to report statistics to the
METI.
In 2015, the METI announced plans to invest US$779m to finance the
implementation of energy efficiency devices, such as LED lamps or high-
efficiency boilers by SMEs and industries. In 2016, the government
introduced new energy efficiency benchmarks and standards for existing
and new thermal power plants, and revised the calculation method for
energy efficiency evaluation to promote the effective utilization of waste
heat.
Renewables
Under the Strategic Energy Plan of Japan, the country intends to supply
10% of its primary energy from renewables by 2020. In the government’s
proposed long-term energy plan, renewables are recognized as a major
energy source for Japan’s future. METI is expected to maintain the current
generation mix target share for renewables at 22-24% (including
hydropower) by 2030.
Feed-in tariffs (FITs) were introduced for solar PV (for surplus electricity
production only) in 2009. In 2011, FITs were extended to other
renewables. Since 2012, the new scheme applies to all generated
electricity. The scheme will be reviewed at least every three years and is
scheduled for a major review in 2020.
In 2015, the Government started to review the FiTs with the aim of
lowering them and to tackle grid instability (large share of solar) and the
Report
Sample
10 Energy Report Sample— Japan Energy Report April 2018 — Copyright © Enerdata — All rights reserved *Reproduction in whole or in part prohibited without written permission.
improper use of guaranteed FiTs by some business owners (e.g. delaying
solar projects to take advantage of falling panel costs).
In 2012-2013, FiTs were among the highest in the world (twice the level of
Germany and over three times that of China for solar). The FiTs for non
residential solar PV systems >10 kW have been reduced several times
since 2013 to reflect declining costs and increasing utilization rates of solar
facilities. The latest reduction will apply to facilities certified in and after
April 2018, with the FiT dropping from Yen 21/kWh (US$19c/kWh) to Yen
18/kWh (US$16c/kWh). Current tariffs are, therefore, almost half the
initial levels set in July 2012 (Yen 40/kWh or US$36c/kWh). Since April
2017, non-residential PV projects > 2 MW are no longer eligible to FITs.
To boost offshore wind development, the METI introduced a specific FIT
for offshore wind in 2014. The FiT for offshore wind and small-scale wind
will remain at Yen 36/kWh (US$32c/kWh) and Yen 55/kWh (US$50c/kWh),
respectively, until FY 2019, while the FiT for large-scale (>20 kW) onshore
wind will decrease from Yen 21/kWh (US$19c/kWh) in FY 2017 to Yen
19/kWh (US$17c/kWh) in FY 2019. The FiT for repowering wind projects
will decreased from Yen 18/kWh (US$16c/kWh) in FY 2017 to Yen 16/kWh
(US$14c/kWh).
FITs for geothermal facilities are set for 15 years at US$28.2c/kWh
(>15 MW) and at US$43.4c/kWh (<15 MW). FITs for small and medium
hydropower are set at US$35c/kWh <200 kW), US$30c/kWh (between
200 kW and 1 MW) and US$25c/kWh (>1 MW), respectively, for 20 years
(from April 2015).
For biomass projects above 2 MW, the Yen 24/kWh (US$22c/kWh) tariff
will progressively fall to Yen 21/kWh (US$19c/kWh) from 1 September
2017 to FY 2019, while smaller installations will benefit from a tariff of Yen
24/kWh (US$22c/kWh).
In May 2016, the government revised the Act on Special Measures for
Renewable Energy, which includes changes in FiTs to promote a larger mix
of renewables, as the existing FiTs favoured solar PV. Since April 2017, FiTs
for large scale PV projects (non-residential >2 MW) have been shifted to a
tendering program initiated by METI. Under this “reverse auction system”,
companies will submit bids and compete to supply a fixed amount of
power to the utilities at the best possible costs. The bids will be accepted
from the lowest bid upwards until the capacity available at the auction is
completely allocated. Meanwhile, other renewables energies, i.e.
geothermal, hydro, and biomass, will benefit from a slightly more
favorable tariff framework.
Feed-in tariffs
Report
Sample
World Energy Research
Energy Report Sample— Japan Energy Report April 2018 — Copyright © Enerdata — All rights reserved 11
*Reproduction in whole or in part prohibited without written permission.
GHG reduction target: 26% below 2013
levels by 2030
CO2
Japan met its Kyoto commitment to reduce its GHG emissions by 6% by
2008-2012 compared to the 1990 level. In 2017, Japan’s CO2 emissions
were 8% above the 1990 level (lower nuclear generation).
In its First NDC, Japan aims to reduce GHG emissions to 1.04 GtCO2eq by
fiscal year (FY) 2030, 26% below FY 2013 levels. In November 2016, the
country ratified the Paris Agreement on climate change.
Since the shutdown of most of the nuclear reactors after Fukushima and
the increase in thermal generation, Japan decided to scale back its 25%
reduction target for 2020 to 3.8% (compared to 2005 levels); this
translates into a 3% increase compared to the 1990 level. The long-term
goal, announced in 2008, is to reduce greenhouse gas emissions by 80%
by 2050 compared to 1990.
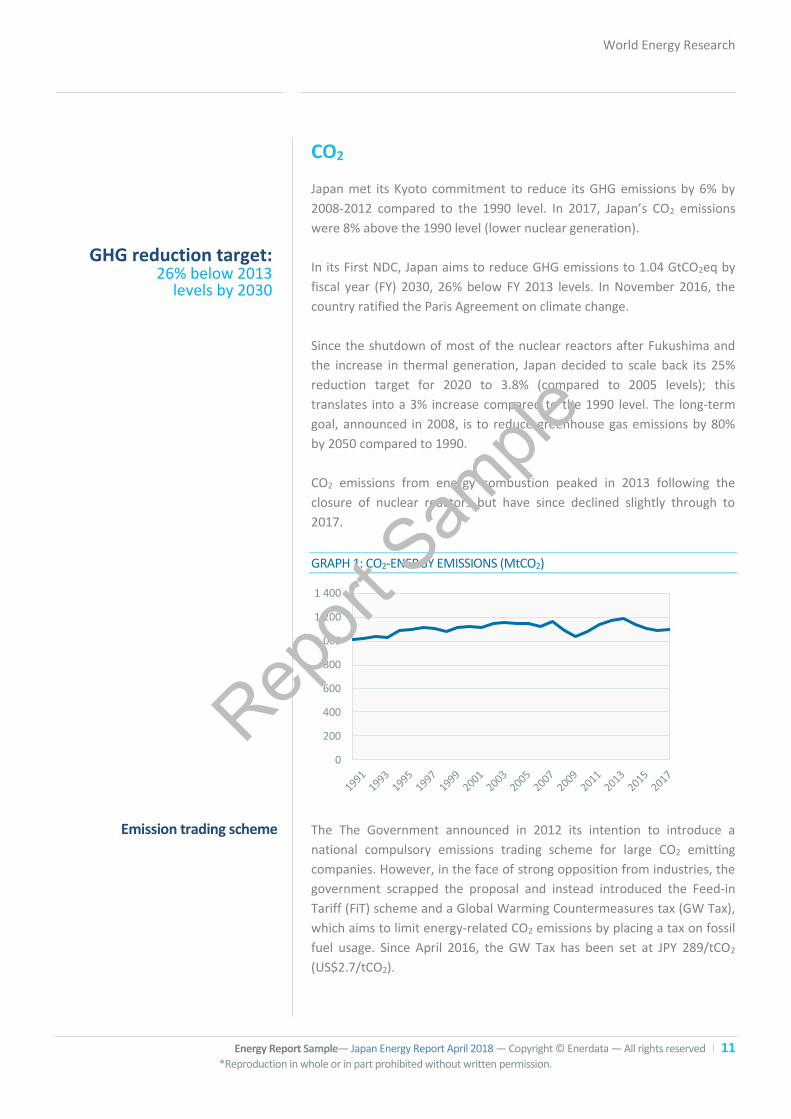
CO2 emissions from energy combustion peaked in 2013 following the
closure of nuclear reactors but have since declined slightly through to
2017.
GRAPH 1: CO2-ENERGY EMISSIONS (MtCO2)
0
200
400
600
800
1 000
1 200
1 400
The The Government announced in 2012 its intention to introduce a
national compulsory emissions trading scheme for large CO2 emitting
companies. However, in the face of strong opposition from industries, the
government scrapped the proposal and instead introduced the Feed-in
Tariff (FiT) scheme and a Global Warming Countermeasures tax (GW Tax),
which aims to limit energy-related CO2 emissions by placing a tax on fossil
fuel usage. Since April 2016, the GW Tax has been set at JPY 289/tCO2
(US$2.7/tCO2).
Emission trading scheme
Report
Sample

12 Energy Report Sample— Japan Energy Report April 2018 — Copyright © Enerdata — All rights reserved *Reproduction in whole or in part prohibited without written permission.
In 2010, the Tokyo Metropolitan Government launched a mandatory cap
and trade scheme to reduce its GHG emissions by 25% by 2020 and 30%
by 2030 (compared with 2000). At the end of the first compliance period
(FY2010-2014), a 25% emission reduction was achieved; the second
compliance period started in 2015 and should last until 2019, with a
reduction target of 15-17% from base-year emissions. Japan’s fiscal year
(FY) runs between 1 April and 31 March.
Report
Sample
World Energy Research
Energy Report Sample— Japan Energy Report April 2018 — Copyright © Enerdata — All rights reserved 13
*Reproduction in whole or in part prohibited without written permission.
JERA Integration of Tepco and
Chubu fossil fuel generation forms largest generator
Energy companies
The Government is making progress in the liberalisation of the energy sector.
Electricity generation is still dominated by a few vertically-integrated private companies. The top 10 utilities represent more than 75% of the power production market.
The oil sector deregulation led to the restructuring of the companies via expansions and mergers of refineries to reduce the costs.
The gas sector has many regional private players.
Electricity
The electricity sector is dominated by 10 regional, private companies (the
“Ten EPCOS”), vertically integrated and grouped together in the
Federation of Electric Power Companies (FEPC), and by J-Power (also
called EPDC), which until 2004 was a public company. The EPCOs’
monopoly in their region ended in April 2016 with the liberalization of the
retail electricity market: almost 400 companies are now registered to sell
electricity. The Ten EPCOS account for more than ¾ of the electricity
produced in Japan with the three largest - TEPCO, Kansai and Chubu -
representing about 60% of the installed capacity and sales of the Ten
EPCOS.
In October 2017, Tokyo Electric Power Company Holdings (Tepco) and
Chubu Electric Power Co received approval from the Japan Fair Trade
Commission (JTFC) to integrate their fossil fuel power plants under their
JERA Co joint venture. The biggest and third-biggest of Japan's power
utilities will combine their businesses in April-September 2019 to form a
company aggregating 68 GW of generation capacity.
TEPCO (Tokyo EPCO) currently has a capacity of over 67 GW (13 GW of
nuclear, 31 GW of LNG/LPG, 3.2 GW of coal, 11 GW of oil and 10 GW of
hydro, end of FY 2016). Prior to the Fukushima accident in 2011, its
nuclear capacity was 17.3 GW. The 6 Fukushima Daichi nuclear reactors
have now been permanently closed. TEPCO power generation has
→
Report
Sample
14 Energy Report Sample— Japan Energy Report April 2018 — Copyright © Enerdata — All rights reserved *Reproduction in whole or in part prohibited without written permission.
decreased significantly, from 264 TWh in 2010 to 200 TWh in FY2016, and
its sales dropped to 242 TWh from 317 TWh in 2010 (FY2016: fiscal years
ending in March 2017). Following TEPCO’s nationalisation in 2012, the
Nuclear Damage Liability Facilitation Fund is now the company’s main
shareholder with a 54.69% stake. In December 2016, the government
announced that TEPCO could remain nationalized longer than initially
planned, but that the government would progressively reduce its
involvement in the management through the Nuclear Damage Liability
Facilitation Fund. The METI is also considering an alternative solution to
split TEPCO into "business operations" (power generation and retail sales)
and "Fukushima operations" (decommissioning operations and
compensation payment), with the latter entity remaining under public
control.
Kansai EPCO has a capacity of 36.6 GW and sales of 121.5 TWh (FY 2016).
Kansai has 11 nuclear reactors (9 GW). The company restarted operations
at Units 3 and 4 of the Takahama nuclear facility in June 2017 and the
Ohi-3 reactor in April 2018 (Ohi-4 is scheduled for May 2018).
Chubu EPCO has a capacity of 33 GW and sales of 122 TWh (FY2015).
The other companies are, in order of importance: Kyushu (29 GW, 79 TWh
of sales), Tohoku (19 GW, 74 TWh of sales), Chugoku (12 GW, 57 TWh of
sales), Hokuriku (8 GW, 28 TWh of sales), Hokkaido (8 GW, 27 TWh of
sales), Shikoku (6.3 GW, 30 TWh of sales), and Okinawa (2.1 GW, 7.8 TWh
of sales) (FY2016).
J-Power has a capacity of 17.8 GW (including affiliated companies), made
up of 8.8 GW thermal, 8.6 GW hydro, and 0.4 GW of wind (April 2017).
Total Sales in FY 2016 were 62.2 TWh. It was privatised in 2004 through
the sale by the State of 83% of its capital.
Japan Nuclear Fuel Ltd (JNFL) is a private venture led by the nation's ten
electric utilities to develop a "closed" nuclear fuel cycle. About 1/3 of the
capital will be contributed by TEPCO.
Nuclear Fuel Industries Ltd. has been Japan’s sole producer of nuclear fuel
since 1972. In 2009, Westinghouse Electric acquired a 52% stake in the
company from Furukawa Electric Co and Sumitomo Electric Industries,
which now hold the remaining 48% (24% each
Report
Sample
World Energy Research
Energy Report Sample— Japan Energy Report April 2018 — Copyright © Enerdata — All rights reserved 15
*Reproduction in whole or in part prohibited without written permission.
JOGMEC was created in 2004 to help oil and gas companies to expand
overseas, mainly in E&P activities
Oil
Around thirty Japanese companies produce oil abroad and import it into
Japan. JOGMEC, Japan Oil, Gas and Metals National Corporation, supports
the oil and gas companies in conducting oil and gas exploration and
development efforts overseas and offshore Japan. JOGMEC provided
financial assistance to more than 50 companies for exploration activities.
In November 2016, the parliament adopted a bill allowing JOGMEC to
invest in foreign oil and gas companies. So far, the company was restricted
to supporting acquisitions of foreign natural resource assets by Japanese
companies. This should help Japan compete for global energy assets and
improve its energy supply. JOGMEC manages the national level petroleum
stockpiling.
To reduce costs, refineries are moving towards mergers and acquisitions.
JX Nippon Oil & Energy, Japan’s largest oil group with refineries with a
total capacity of 1.1 mb/d as of December 2016, integrated its business
with TonenGeneral on 1 April 2017 to form JXTG Nippon Oil & Energy.
The new company holds nearly 2 mb/d of refining capacity, controls half
of the Japanese gasoline market, and operates more than 14 000 retail
gasoline outlets in the country.
Until then, Tonen/General was one of the other large refiners (3 refineries
with a total capacity of 0.5 mb/d).
In 2015 Idemitsu Kosan and Showa Shell Sekiyu announced their merger
(acquisition by Idemitsu Kosan of 33.24% stake in Showa Shell Sekiyu, 6
refineries) to form the second largest oil refining company (0.8 mb/d),
controlling around 28% of the refining market. The integration of their key
businesses will be completed in spring 2018.
The remaining large refiner is Cosmo Oil (3 refineries with a total capacity
of 0.5 mb/d).
Gas
Three companies account for more than 80% of the gas supply: Tokyo Gas
(15.7 bcm of sales volume in FY 2016), Osaka Gas (8.7 bcm) and Toho Gas
(3.9 bcm). There are around 200 gas companies, 85% of which are private;
they are grouped together in the Japan Gas Association (JGA).
Inpex was set up to develop gas projects, in particular LNG imports to
Japan (about ¼ of total LNG imports). Initially, Inpex was public through
the 54% stake owned by JNOC, but the company was privatised in 2004.
Upstream
Downstream
Report
Sample
16 Energy Report Sample— Japan Energy Report April 2018 — Copyright © Enerdata — All rights reserved *Reproduction in whole or in part prohibited without written permission.
Inpex holds shares in the LNG plant of Bontang and holds a 65% operating
interest in the Masela Abadi LNG project in Indonesia.
JERA, the joint venture of TEPCO and Chubu Electric, signed a Sales and
Purchase Agreement (SPA) in May 2016 with EDF Trading for the sale of
1.5 Mt of LNG over a 2.5-year period starting in June 2018.
Tokyo Gas and Kansai Electric signed a strategic cooperation agreement in
April 2016 to jointly source LNG on global markets. The two companies
will cooperate on LNG imports, especially from the Pluto LNG project in
Australia, as both have 15-year LNG import deals with that project
(1.5 Mt/year for Tokyo Gas and 1.75 Mt/year for Kansai Electric), as well
as from the Cove Point LNG project (20-year supply agreement for
1.4 Mt/year for Tokyo Gas and 0.8 Mt/year for Kansai Electric).
In April 2017, Tokyo Gas also partnered with Kyushu Electric to jointly
purchase LNG to reduce costs and enhance supply stability. The alliance
allows Kyushu Electric to offload its LNG contracted volumes following the
successful restart of its Sendai nuclear reactors and pending restart of its
Genkai nuclear reactors. The alliance also enables Tokyo Gas to defend
some of its market share from JERA.
Report
Sample
World Energy Research
Energy Report Sample— Japan Energy Report April 2018 — Copyright © Enerdata — All rights reserved 17
*Reproduction in whole or in part prohibited without written permission.
Since 2013 4 nuclear units have
restarted and continued operating as of end-2017
Energy supply
Due to a lack of domestic resources and a highly-developed economy, Japan is among the world’s biggest importers of oil, gas and coal.
The renewables capacity has also grown substantially in recent years, especially solar PV: the country ranks second in the world in terms of PV installed capacity.
Resources
Japan has limited resources (around 6.2 Mt of oil and 29.3 bcm of gas in
2016) and fossil fuel production is very low compared to the demand.
ANRE estimates that the economically exploitable potential of renewable
energies amounts to 38-64 Mtoe/year (including 10-21 Mtoe of solar and
7-10 Mtoe of waste); the technical potential is estimated at
127 Mtoe/year.
Electricity
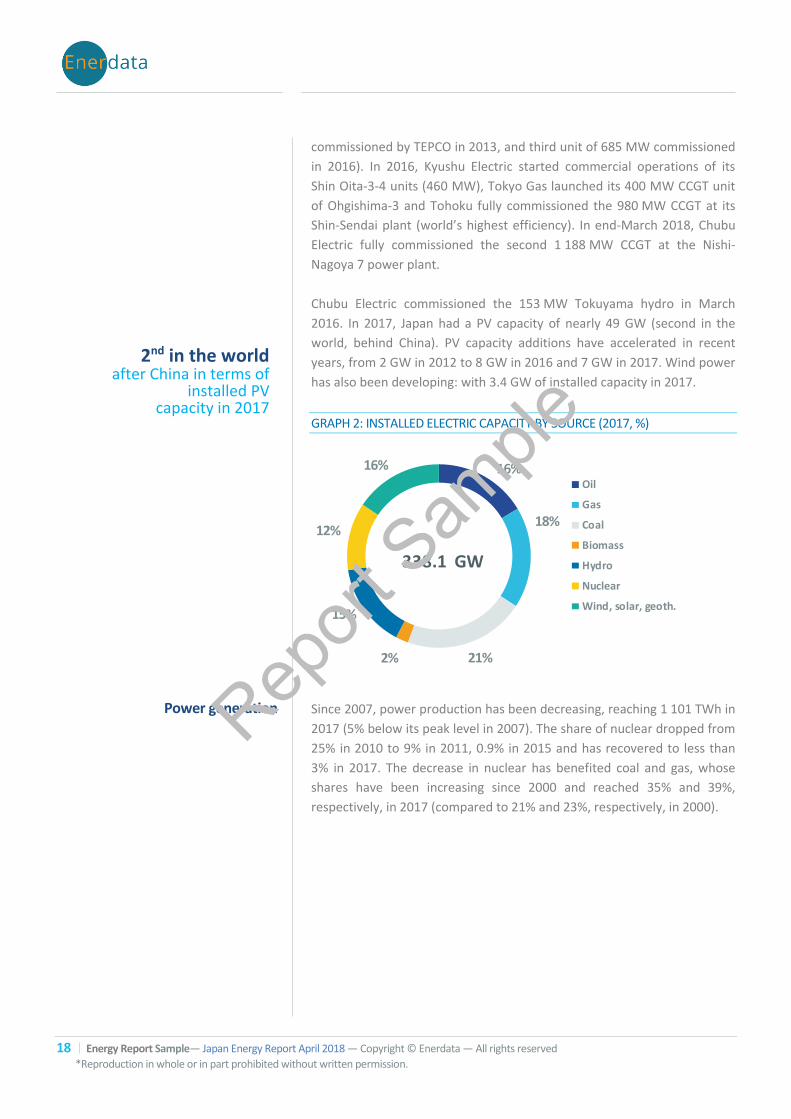
The installed electricity capacity is 338 GW, including 40.3 GW of nuclear
energy and 50.2 GW of hydroelectricity. Thermal power plants account for
57% of the total capacity (end of 2017).
Following the Fukushima accident, all undamaged nuclear reactors were
placed offline for safety controls. Before the accident, there were
54 reactors spread over 17 plants. As of April 2018, 6 of the 42 operable
reactors have been restarted: the 890 MW units Sendai-1 and Sendai -2 by
Kyushu Electric in 2015, the 830 MW units Takahama-3 and Takahama-4
by Kansai Electric in 2017, and the 1 180 MW unit Ohi-3 by Kansai Electric
and the 1 180 MW unit Genkai-3 by Kyushu Electric in April 2018. The NRA
approved a lifetime extension for Takahama -1 and 2 in June 2016. This
approval will enable the reactors to operate until 2034 and 2035. It is the
first time that Japan has allowed a nuclear plant to operate beyond
40 years.
More than 7 GW of gas power capacity have been added to the network
since 2011, including four 576 MW units at the Joetsu CCGT LNG-fired
power station in the Niigata Prefecture (commissioned in 2012-2014 by
Chubu Electric), two new CCGT units in Kawasaki (the first unit of 500 MW
→
Installed capacity
Report
Sample
18 Energy Report Sample— Japan Energy Report April 2018 — Copyright © Enerdata — All rights reserved *Reproduction in whole or in part prohibited without written permission.
2nd in the world after China in terms of
installed PV capacity in 2017
commissioned by TEPCO in 2013, and third unit of 685 MW commissioned
in 2016). In 2016, Kyushu Electric started commercial operations of its
Shin Oita-3-4 units (460 MW), Tokyo Gas launched its 400 MW CCGT unit
of Ohgishima-3 and Tohoku fully commissioned the 980 MW CCGT at its
Shin-Sendai plant (world’s highest efficiency). In end-March 2018, Chubu
Electric fully commissioned the second 1 188 MW CCGT at the Nishi-
Nagoya 7 power plant.
Chubu Electric commissioned the 153 MW Tokuyama hydro in March
2016. In 2017, Japan had a PV capacity of nearly 49 GW (second in the
world, behind China). PV capacity additions have accelerated in recent
years, from 2 GW in 2012 to 8 GW in 2016 and 7 GW in 2017. Wind power
has also been developing: with 3.4 GW of installed capacity in 2017.
GRAPH 2: INSTALLED ELECTRIC CAPACITY BY SOURCE (2017, %)
16%
18%
21%2%
15%
12%
16%Oil
Gas
Coal
Biomass
Hydro
Nuclear
Wind, solar, geoth.
338.1 GW
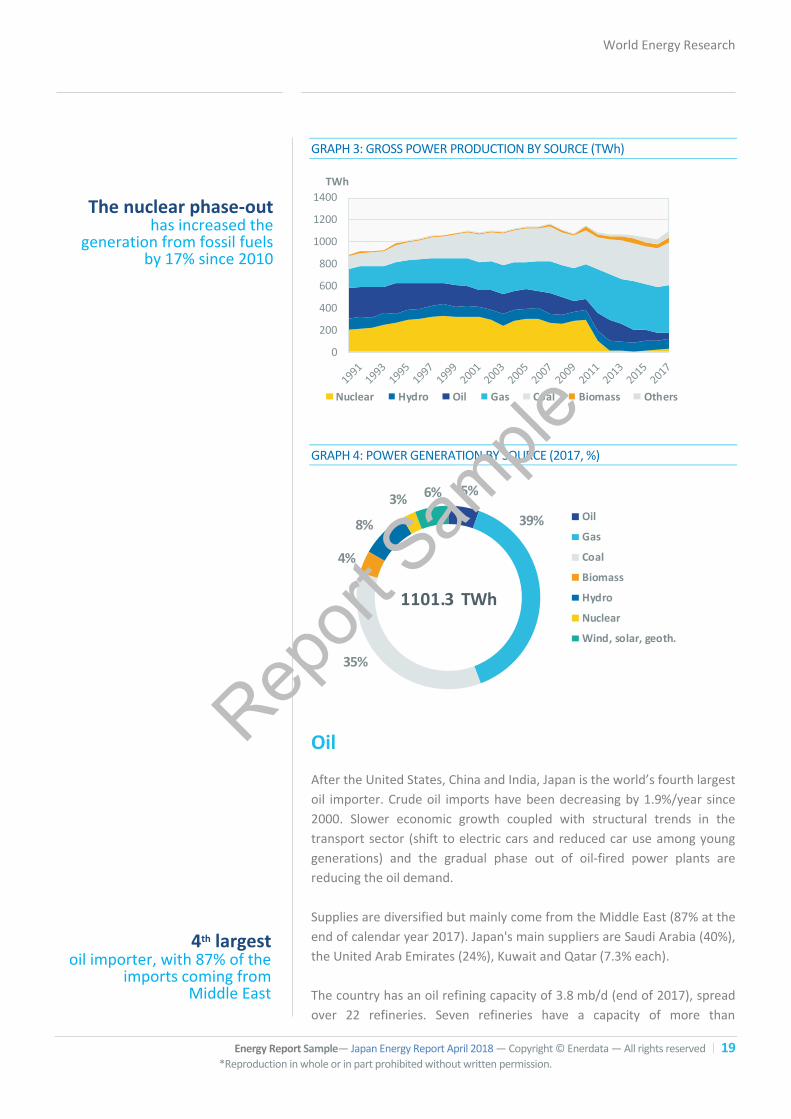
Since 2007, power production has been decreasing, reaching 1 101 TWh in
2017 (5% below its peak level in 2007). The share of nuclear dropped from
25% in 2010 to 9% in 2011, 0.9% in 2015 and has recovered to less than
3% in 2017. The decrease in nuclear has benefited coal and gas, whose
shares have been increasing since 2000 and reached 35% and 39%,
respectively, in 2017 (compared to 21% and 23%, respectively, in 2000).
Power generation Rep
ort Sam
ple
World Energy Research
Energy Report Sample— Japan Energy Report April 2018 — Copyright © Enerdata — All rights reserved 19
*Reproduction in whole or in part prohibited without written permission.
The nuclear phase-out has increased the
generation from fossil fuels by 17% since 2010
4th largest oil importer, with 87% of the
imports coming from Middle East
GRAPH 3: GROSS POWER PRODUCTION BY SOURCE (TWh)
0
200
400
600
800
1000
1200
1400
Nuclear Hydro Oil Gas Coal Biomass Others
TWh
GRAPH 4: POWER GENERATION BY SOURCE (2017, %)
5%
39%
35%
4%
8%
3% 6%
Oil
Gas
Coal
Biomass
Hydro
Nuclear
Wind, solar, geoth.
1101.3 TWh
Oil
After the United States, China and India, Japan is the world’s fourth largest
oil importer. Crude oil imports have been decreasing by 1.9%/year since
2000. Slower economic growth coupled with structural trends in the
transport sector (shift to electric cars and reduced car use among young
generations) and the gradual phase out of oil-fired power plants are
reducing the oil demand.
Supplies are diversified but mainly come from the Middle East (87% at the
end of calendar year 2017). Japan's main suppliers are Saudi Arabia (40%),
the United Arab Emirates (24%), Kuwait and Qatar (7.3% each).
The country has an oil refining capacity of 3.8 mb/d (end of 2017), spread
over 22 refineries. Seven refineries have a capacity of more than
Report
Sample
20 Energy Report Sample— Japan Energy Report April 2018 — Copyright © Enerdata — All rights reserved *Reproduction in whole or in part prohibited without written permission.
Largest LNG importer: a total of 117 bcm of LNG
was imported in 2017
200 000 bbl/d, representing nearly half of the country’s capacity. In 2014,
JX Nippon Oil & Energy closed its Muroran Refinery (180 000 bbl/d) to
transform it into a petrochemical plant and Idemitsu Kosan closed its
Tokuyama refinery (120 000 bbl/d).
Gas
Japan is the world’s largest LNG importer. Imports increased rapidly
between 2010 and 2014 in order to compensate the drop in nuclear
production and supply gas power plants. However, imports have since
declined by 5% to 117 bcm in 2017. LNG imports represent more than one
third of the world’s total LNG trade.
The main LNG suppliers are Australia, Malaysia and Qatar (28%, 19% and
13%, respectively, in 2016). In 2016, significant imports also came from
Indonesia (9% - initially Japan's main supplier, but its market share is down
from 33% in 2000), Russia (8%) and the United Arab Emirates (6%).
Japan has secured a multitude of long-term LNG contracts, including
55 bcm/year from Australia, 24 bcm/year from Malaysia, 14 bcm/year
from Qatar, around 21 bcm/year from the US, 10 bcm/year from Russia
and 6 bcm/year from the United Arab Emirates. The total contracted
volume reached 160 bcm/year in 2017.
Japan has 40 operating LNG regasification terminals. The main recently
commissioned terminals are Hachinoe LNG (1 Mt/year) in 2015, Hitachi
LNG (1.7 Mt/year) in 2016 and Soma LNG (1 Mt/year) in March 2018.
Report
Sample
World Energy Research
Energy Report Sample— Japan Energy Report April 2018 — Copyright © Enerdata — All rights reserved 21
*Reproduction in whole or in part prohibited without written permission.
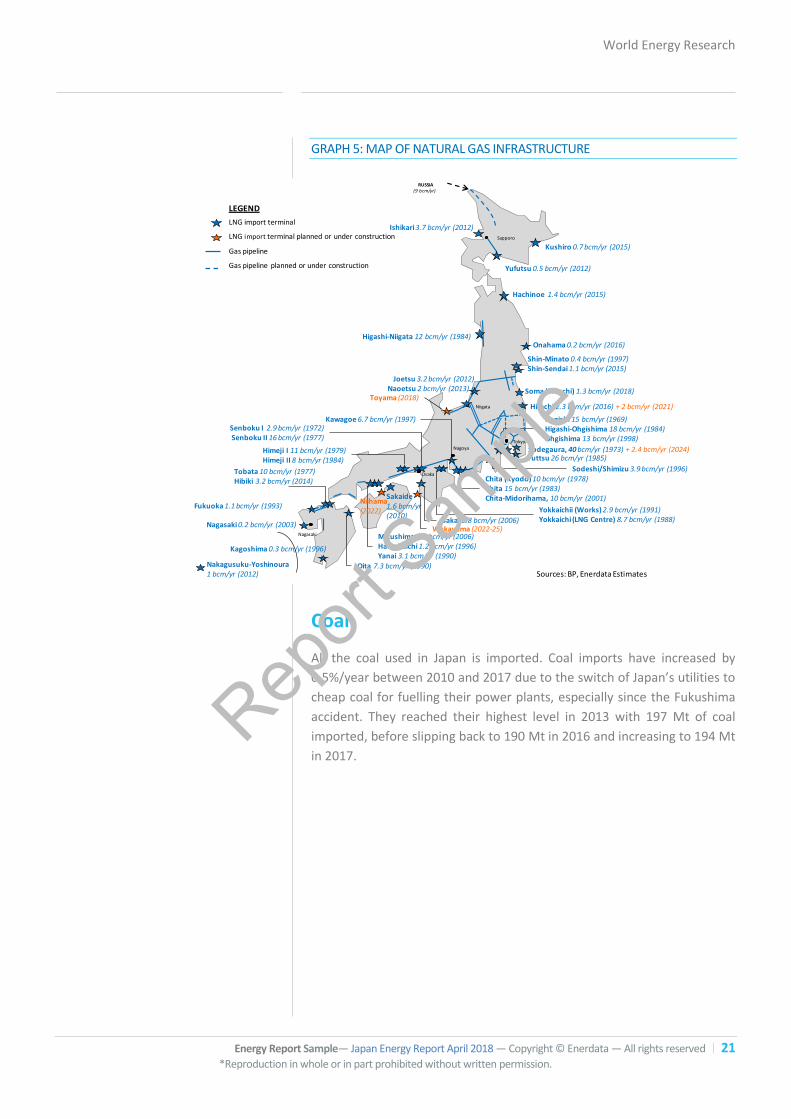
GRAPH 5: MAP OF NATURAL GAS INFRASTRUCTURE
Japan Gas Map
Tokyo
Nagoya
Nagasaki
Sapporo
Shin-Minato 0.4 bcm/yr (1997) Shin-Sendai 1.1 bcm/yr (2015)
Negishi 15 bcm/yr (1969)Higashi-Ohgishima 18 bcm/yr (1984)Ohgishima 13 bcm/yr (1998)
Sodegaura, 40bcm/yr (1973) + 2.4 bcm/yr (2024)
Sodeshi/Shimizu 3.9 bcm/yr (1996)
Chita (Kyodo) 10 bcm/yr (1978)Chita 15 bcm/yr (1983) Chita-Midorihama, 10 bcm/yr (2001)
Mizushima 5.8 bcm/yr (2006)Hatsukaichi 1.2 bcm/yr (1996)Yanai 3.1 bcm/yr (1990)
Kawagoe 6.7 bcm/yr (1997)
Yokkaichii (Works) 2.9 bcm/yr (1991)Yokkaichi (LNG Centre) 8.7 bcm/yr (1988)
Fukuoka 1.1 bcm/yr (1993)
Oita 7.3 bcm/yr (1990)
Higashi-Niigata 12 bcm/yr (1984)
Sakai 8.8 bcm/yr (2006)
RUSSIA(9 bcm/yr)
Sources: BP, Enerdata Estimates
Joetsu 3.2 bcm/yr (2012)Naoetsu 2 bcm/yr (2013) r
Wakayama (2022-25)
Sakaide1.6 bcm/yr(2010)
Hachinoe 1.4 bcm/yr (2015)
Ishikari 3.7 bcm/yr (2012)
Kagoshima 0.3 bcm/yr (1996)
Kushiro 0.7 bcm/yr (2015)
Yufutsu 0.5 bcm/yr (2012)
Futtsu 26 bcm/yr (1985)
Hitachi 2.3 bcm/yr (2016) + 2 bcm/yr (2021)Toyama (2018)
Nagasaki 0.2 bcm/yr (2003)
Soma (Shinchi) 1.3 bcm/yr (2018)
Himeji I 11 bcm/yr (1979)Himeji II 8 bcm/yr (1984)
Senboku I 2.9 bcm/yr (1972)Senboku II 16 bcm/yr (1977)
Tobata 10 bcm/yr (1977)Hibiki 3.2 bcm/yr (2014)
LNG import terminal
LNG import terminal planned or under construction
Gas pipeline
Gas pipeline planned or under construction
LEGEND
Niigata
Osaka
Onahama 0.2 bcm/yr (2016)
Nakagusuku-Yoshinoura1 bcm/yr (2012)
Niihama(2022)
Coal
All the coal used in Japan is imported. Coal imports have increased by
0.5%/year between 2010 and 2017 due to the switch of Japan’s utilities to
cheap coal for fuelling their power plants, especially since the Fukushima
accident. They reached their highest level in 2013 with 197 Mt of coal
imported, before slipping back to 190 Mt in 2016 and increasing to 194 Mt
in 2017.
Report
Sample
World Energy Research
Energy Report Sample— Japan Energy Report April 2018 — Copyright © Enerdata — All rights reserved 22
*Reproduction in whole or in part prohibited without written permission.
Energy prices
National oil prices follow international oil prices.
Electricity prices are controlled by METI through an automatic adjustment mechanism.
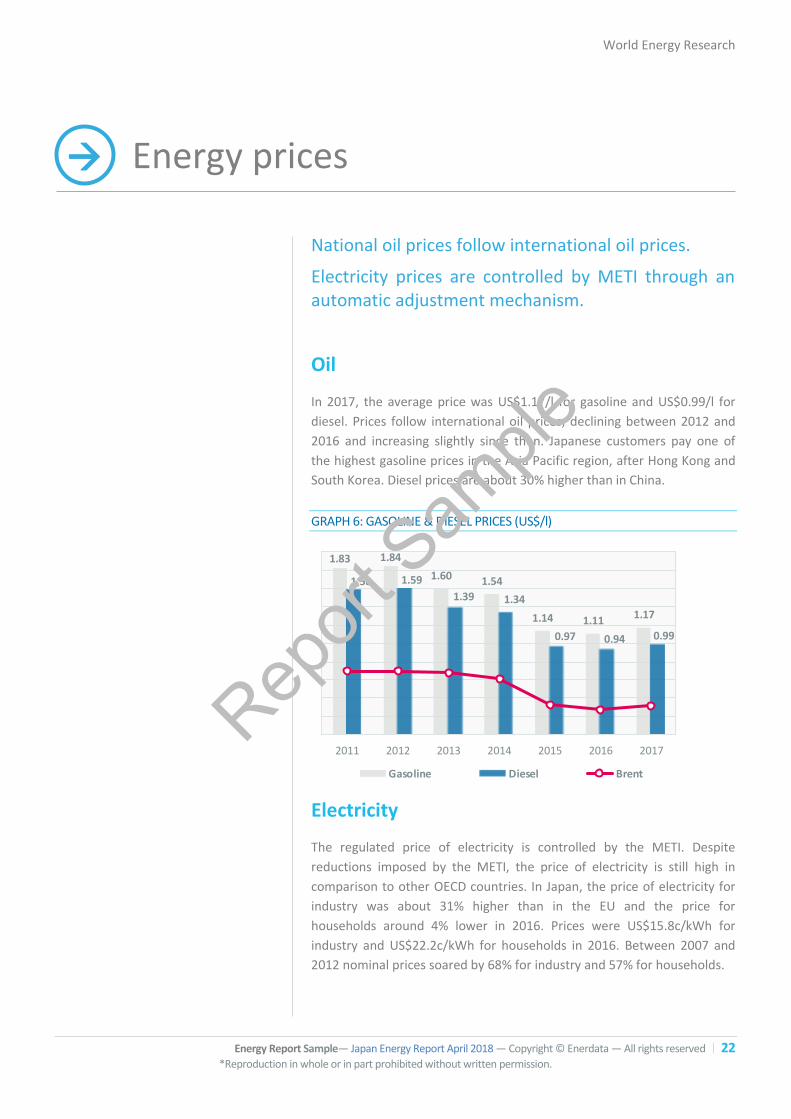
Oil
In 2017, the average price was US$1.17/l for gasoline and US$0.99/l for
diesel. Prices follow international oil prices, declining between 2012 and
2016 and increasing slightly since then. Japanese customers pay one of
the highest gasoline prices in the Asia Pacific region, after Hong Kong and
South Korea. Diesel prices are about 30% higher than in China.
GRAPH 6: GASOLINE & DIESEL PRICES (US$/l)
1.83 1.84
1.60 1.54
1.14 1.111.17
1.58 1.59
1.39 1.34
0.97 0.94 0.99
2011 2012 2013 2014 2015 2016 2017
Gasoline Diesel Brent
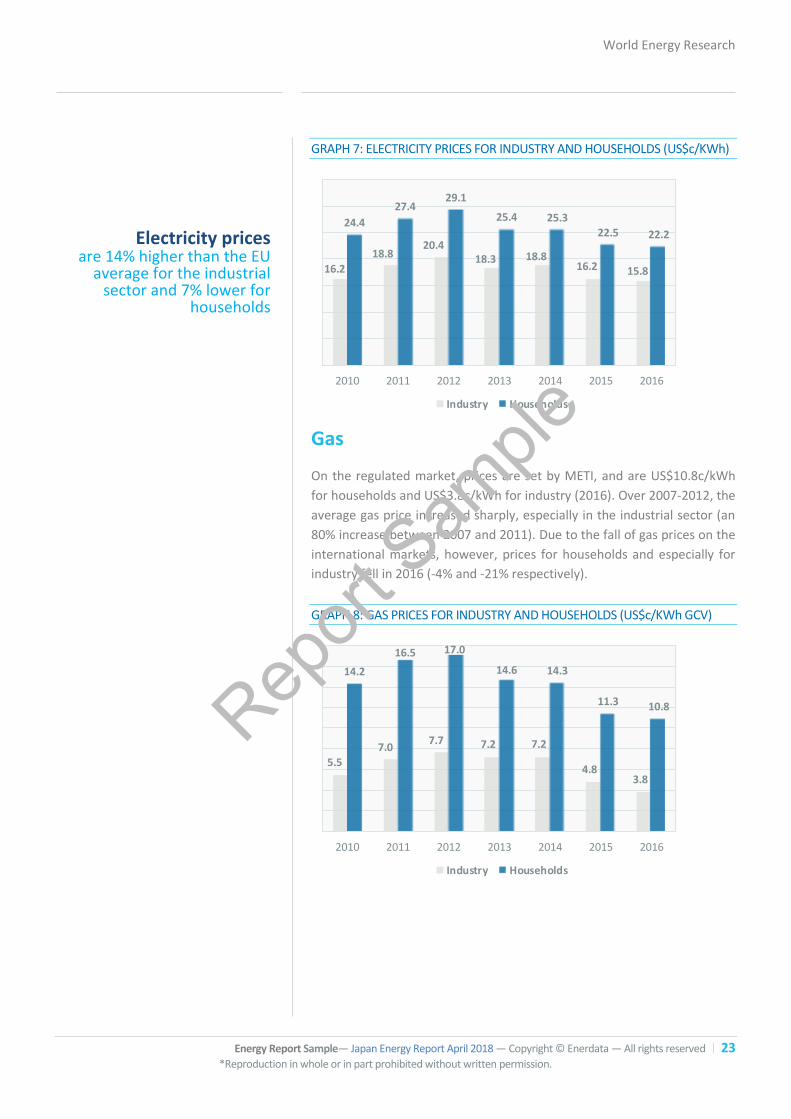
Electricity
The regulated price of electricity is controlled by the METI. Despite
reductions imposed by the METI, the price of electricity is still high in
comparison to other OECD countries. In Japan, the price of electricity for
industry was about 31% higher than in the EU and the price for
households around 4% lower in 2016. Prices were US$15.8c/kWh for
industry and US$22.2c/kWh for households in 2016. Between 2007 and
2012 nominal prices soared by 68% for industry and 57% for households.
→
Report
Sample
World Energy Research
Energy Report Sample— Japan Energy Report April 2018 — Copyright © Enerdata — All rights reserved 23
*Reproduction in whole or in part prohibited without written permission.
Electricity prices are 14% higher than the EU
average for the industrial sector and 7% lower for
households
GRAPH 7: ELECTRICITY PRICES FOR INDUSTRY AND HOUSEHOLDS (US$c/KWh)
16.2
18.820.4
18.3 18.816.2 15.8
24.4
27.429.1
25.4 25.322.5 22.2
2010 2011 2012 2013 2014 2015 2016
Industry Households
Gas
On the regulated market, prices are set by METI, and are US$10.8c/kWh
for households and US$3.8c/kWh for industry (2016). Over 2007-2012, the
average gas price increased sharply, especially in the industrial sector (an
80% increase between 2007 and 2011). Due to the fall of gas prices on the
international markets, however, prices for households and especially for
industry fell in 2016 (-4% and -21% respectively).
GRAPH 8: GAS PRICES FOR INDUSTRY AND HOUSEHOLDS (US$c/KWh GCV)
5.5
7.07.7 7.2 7.2
4.83.8
14.2
16.5 17.0
14.6 14.3
11.3 10.8
2010 2011 2012 2013 2014 2015 2016
Industry Households
Report
Sample
World Energy Research
Energy Report Sample— Japan Energy Report April 2018 — Copyright © Enerdata — All rights reserved 24
*Reproduction in whole or in part prohibited without written permission.
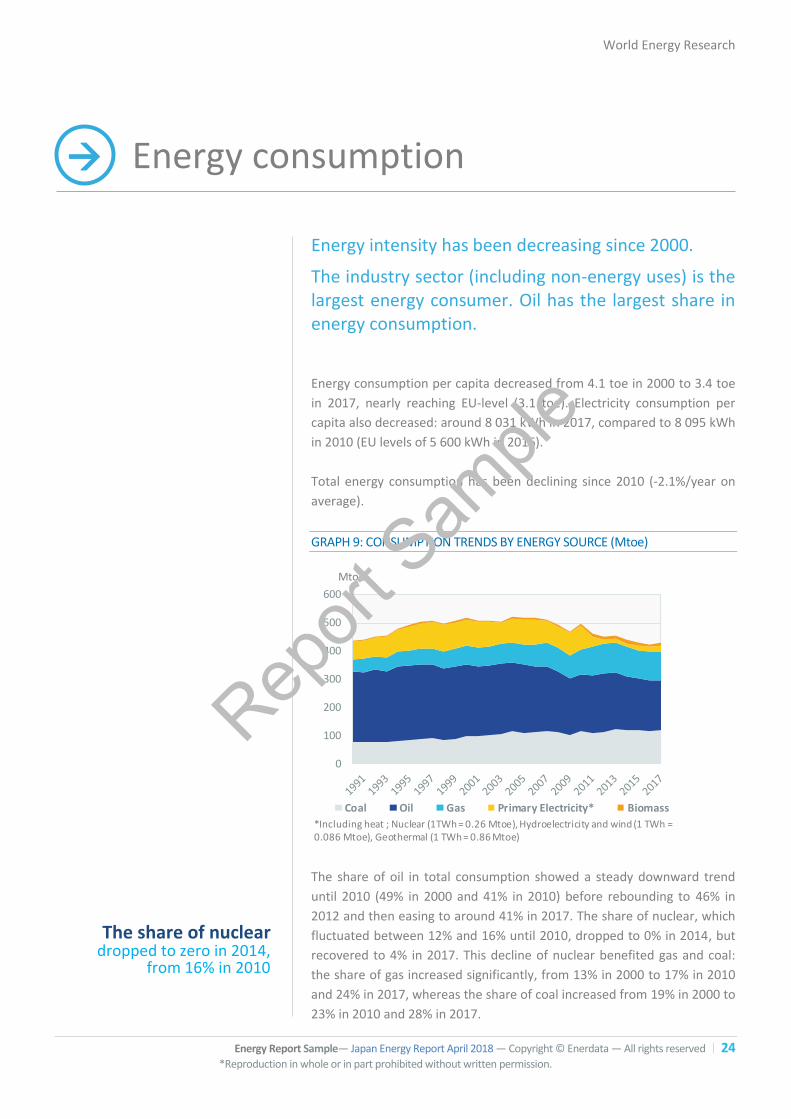
The share of nuclear dropped to zero in 2014,
from 16% in 2010
Energy consumption
Energy intensity has been decreasing since 2000.
The industry sector (including non-energy uses) is the largest energy consumer. Oil has the largest share in energy consumption.
Energy consumption per capita decreased from 4.1 toe in 2000 to 3.4 toe
in 2017, nearly reaching EU-level (3.1 toe). Electricity consumption per
capita also decreased: around 8 031 kWh in 2017, compared to 8 095 kWh
in 2010 (EU levels of 5 600 kWh in 2016).
Total energy consumption has been declining since 2010 (-2.1%/year on
average).
GRAPH 9: CONSUMPTION TRENDS BY ENERGY SOURCE (Mtoe)
0
100
200
300
400
500
600
Coal Oil Gas Primary Electricity* Biomass
*Including heat ; Nuclear (1TWh = 0.26 Mtoe), Hydroelectricity and wind (1 TWh = 0.086 Mtoe), Geothermal (1 TWh = 0.86 Mtoe)
Mtoe
The share of oil in total consumption showed a steady downward trend
until 2010 (49% in 2000 and 41% in 2010) before rebounding to 46% in
2012 and then easing to around 41% in 2017. The share of nuclear, which
fluctuated between 12% and 16% until 2010, dropped to 0% in 2014, but
recovered to 4% in 2017. This decline of nuclear benefited gas and coal:
the share of gas increased significantly, from 13% in 2000 to 17% in 2010
and 24% in 2017, whereas the share of coal increased from 19% in 2000 to
23% in 2010 and 28% in 2017.
→
Report
Sample
World Energy Research
Energy Report Sample— Japan Energy Report April 2018 — Copyright © Enerdata — All rights reserved 25
*Reproduction in whole or in part prohibited without written permission.
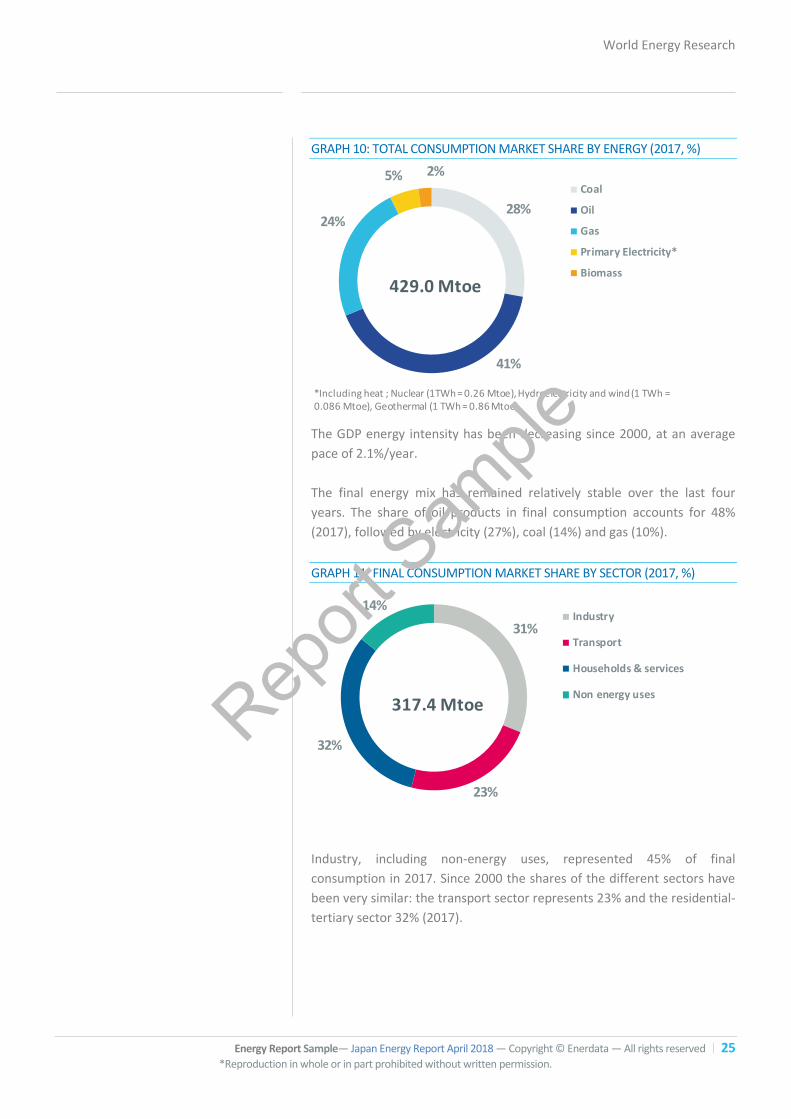
GRAPH 10: TOTAL CONSUMPTION MARKET SHARE BY ENERGY (2017, %)
28%
41%
24%
5% 2%Coal
Oil
Gas
Primary Electricity*
Biomass
*Including heat ; Nuclear (1TWh = 0.26 Mtoe), Hydroelectricity and wind (1 TWh = 0.086 Mtoe), Geothermal (1 TWh = 0.86 Mtoe)
429.0 Mtoe
The GDP energy intensity has been decreasing since 2000, at an average
pace of 2.1%/year.
The final energy mix has remained relatively stable over the last four
years. The share of oil products in final consumption accounts for 48%
(2017), followed by electricity (27%), coal (14%) and gas (10%).
GRAPH 11: FINAL CONSUMPTION MARKET SHARE BY SECTOR (2017, %)
31%
23%
32%
14%Industry
Transport
Households & services
Non energy uses317.4 Mtoe
Industry, including non-energy uses, represented 45% of final
consumption in 2017. Since 2000 the shares of the different sectors have
been very similar: the transport sector represents 23% and the residential-
tertiary sector 32% (2017).
Report
Sample
26 Energy Report Sample— Japan Energy Report April 2018 — Copyright © Enerdata — All rights reserved *Reproduction in whole or in part prohibited without written permission.
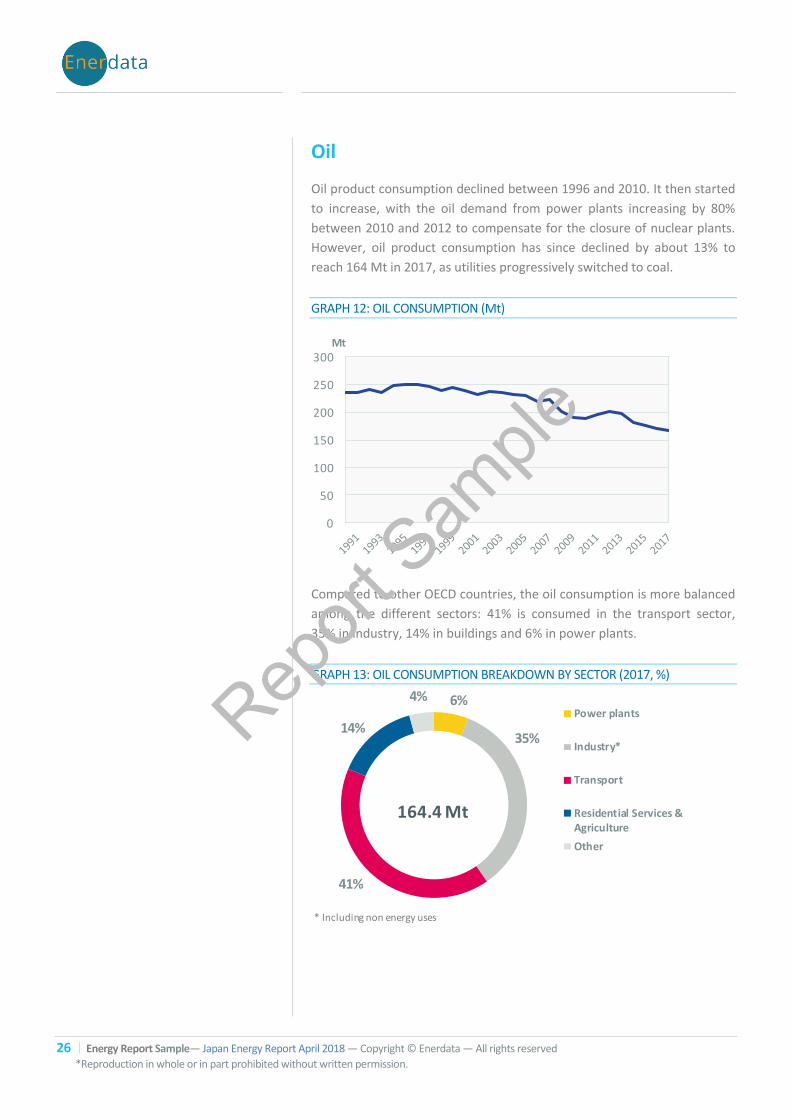
Oil
Oil product consumption declined between 1996 and 2010. It then started
to increase, with the oil demand from power plants increasing by 80%
between 2010 and 2012 to compensate for the closure of nuclear plants.
However, oil product consumption has since declined by about 13% to
reach 164 Mt in 2017, as utilities progressively switched to coal.
GRAPH 12: OIL CONSUMPTION (Mt)
0
50
100
150
200
250
300Mt
Compared to other OECD countries, the oil consumption is more balanced
among the different sectors: 41% is consumed in the transport sector,
35% in industry, 14% in buildings and 6% in power plants.
GRAPH 13: OIL CONSUMPTION BREAKDOWN BY SECTOR (2017, %) 6%
35%
41%
14%
4%Power plants
Industry*
Transport
Residential Services &Agriculture
Other
164.4 Mt
* Including non energy uses
Report
Sample
World Energy Research
Energy Report Sample— Japan Energy Report April 2018 — Copyright © Enerdata — All rights reserved 27
*Reproduction in whole or in part prohibited without written permission.
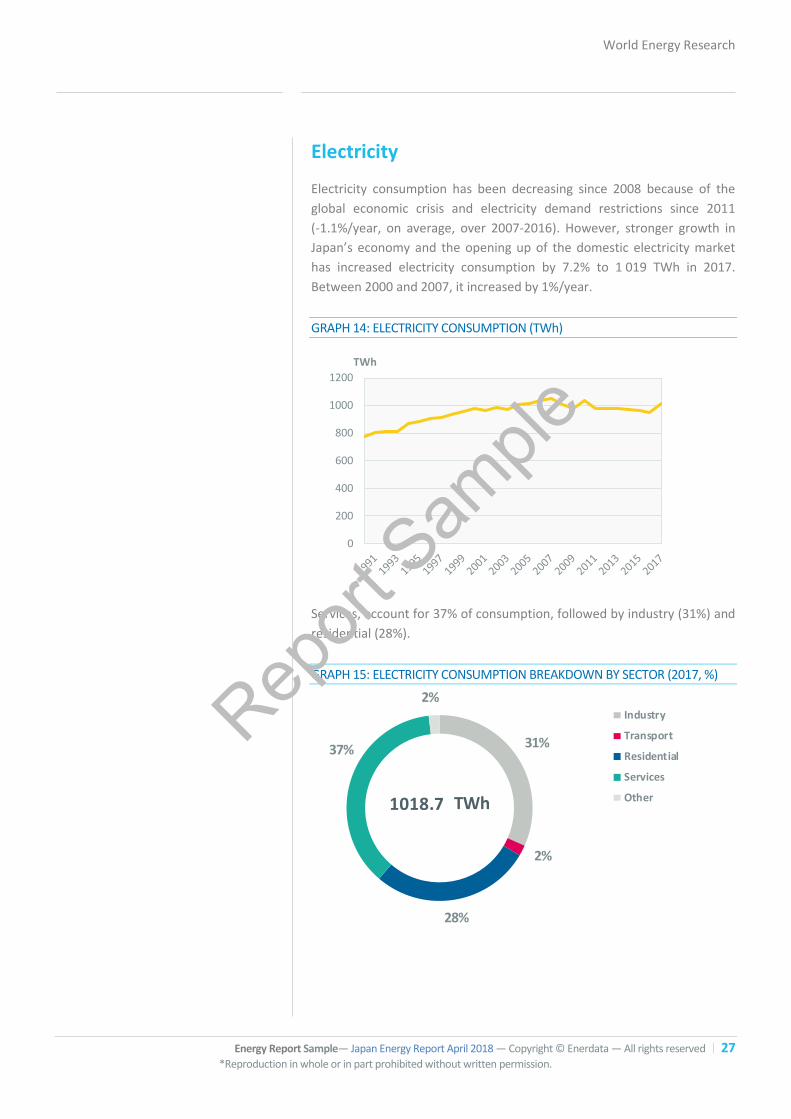
Electricity
Electricity consumption has been decreasing since 2008 because of the
global economic crisis and electricity demand restrictions since 2011
(-1.1%/year, on average, over 2007-2016). However, stronger growth in
Japan’s economy and the opening up of the domestic electricity market
has increased electricity consumption by 7.2% to 1 019 TWh in 2017.
Between 2000 and 2007, it increased by 1%/year.
GRAPH 14: ELECTRICITY CONSUMPTION (TWh)
0
200
400
600
800
1000
1200
TWh
Services, account for 37% of consumption, followed by industry (31%) and
residential (28%).
GRAPH 15: ELECTRICITY CONSUMPTION BREAKDOWN BY SECTOR (2017, %)
31%
2%
28%
37%
2%Industry
Transport
Residential
Services
Other1018.7 TWh
Report
Sample
28 Energy Report Sample— Japan Energy Report April 2018 — Copyright © Enerdata — All rights reserved *Reproduction in whole or in part prohibited without written permission.
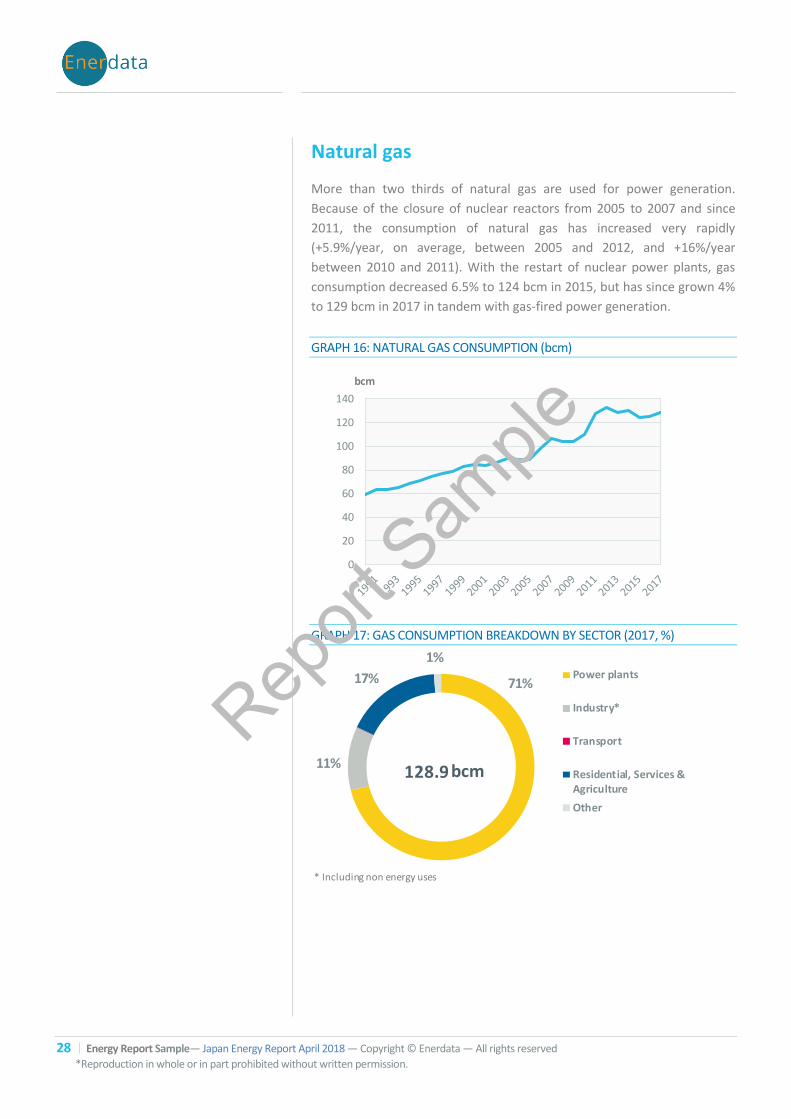
Natural gas
More than two thirds of natural gas are used for power generation.
Because of the closure of nuclear reactors from 2005 to 2007 and since
2011, the consumption of natural gas has increased very rapidly
(+5.9%/year, on average, between 2005 and 2012, and +16%/year
between 2010 and 2011). With the restart of nuclear power plants, gas
consumption decreased 6.5% to 124 bcm in 2015, but has since grown 4%
to 129 bcm in 2017 in tandem with gas-fired power generation.
GRAPH 16: NATURAL GAS CONSUMPTION (bcm)
0
20
40
60
80
100
120
140
bcm
GRAPH 17: GAS CONSUMPTION BREAKDOWN BY SECTOR (2017, %)
71%
11%
17%
1%Power plants
Industry*
Transport
Residential, Services &Agriculture
Other
128.9 bcm
* Including non energy uses
Report
Sample
World Energy Research
Energy Report Sample— Japan Energy Report April 2018 — Copyright © Enerdata — All rights reserved 29
*Reproduction in whole or in part prohibited without written permission.
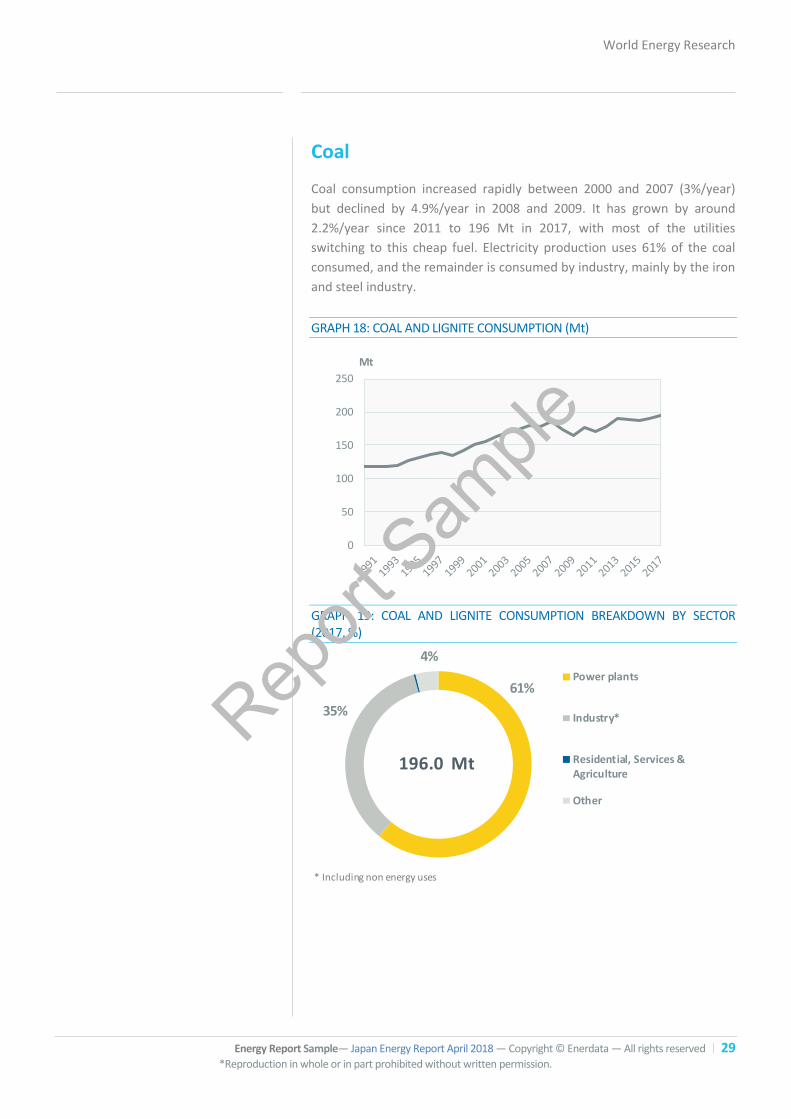
Coal
Coal consumption increased rapidly between 2000 and 2007 (3%/year)
but declined by 4.9%/year in 2008 and 2009. It has grown by around
2.2%/year since 2011 to 196 Mt in 2017, with most of the utilities
switching to this cheap fuel. Electricity production uses 61% of the coal
consumed, and the remainder is consumed by industry, mainly by the iron
and steel industry.
GRAPH 18: COAL AND LIGNITE CONSUMPTION (Mt)
0
50
100
150
200
250
Mt
GRAPH 19: COAL AND LIGNITE CONSUMPTION BREAKDOWN BY SECTOR (2017, %)
61%
35%
4%
Power plants
Industry*
Residential, Services &Agriculture
Other
196.0 Mt
* Including non energy uses
Report
Sample
World Energy Research
Energy Report Sample— Japan Energy Report April 2018 — Copyright © Enerdata — All rights reserved 30
*Reproduction in whole or in part prohibited without written permission.
Issues and prospects
The country is facing pressure to reach its 2030 CO2 emissions and power mix targets, leading to tighter regulations for coal projects and the development of projects using CCS, whereas renewable energy projects are expected to grow rapidly in the near future.
The gas import capacity is expected to increase since the Government is encouraging fuel switching to gas in the end-use sectors.
Using its Global Energy Forecasting Model POLES, Enerdata foresees the
share of oil to account for 38% of the primary energy consumption by
2040, while the share of natural gas would be around 14% and the share
of coal around 10%. The remainder (37%) would be covered by nuclear,
renewables and biomass. METI is finalising the draft of its long-term
energy plan, which will prioritize nuclear and renewables as major energy
sources in Japan’s energy sector future.
Electricity
A Japanese consultative committee has backed governmental plans to
reach a 20-22% share of nuclear power in the power mix by 2030.
Renewable generation would account for 22% to 24% of the power mix
while coal would cover 26% of power generation. Gas is expected to
supply 27% by 2030. The target was formally approved by the Ministry of
Trade in 2015. It would be revised every three years and energy mix
targets could be changed if necessary. The energy mix targets are not
expected to differ greatly in METI’s long-term energy plan proposal.
Enerdata expects thermal generation to account for 61% of the power mix
by 2040, while renewables would grow to 20% (solar and wind). The
remainder would come from nuclear and hydro generation.
JERA announced in September 2016 that it would refurbish and operate
5.6 GW of thermal capacity by 2023. These capacities include "state-of-
the-art high-efficiency" projects: the Goi (3x780 MW) LNG-fired power
→
Report
Sample
World Energy Research
Energy Report Sample— Japan Energy Report April 2018 — Copyright © Enerdata — All rights reserved 31
*Reproduction in whole or in part prohibited without written permission.
plant, the new Anegasaki (3x650 MW) LNG fired power plant and the
Yokosuka (2x650 MW) coal-fired power plant.
Since the Fukushima disaster in March 2011, only 6 of the 42 operable
reactors in Japan have cleared new regulatory safety standards
regulations and restarted operations. In December 2017, two units at
TEPCO’s Kashiwazaki-Kariwa passed safety inspections, but TEPCO has
struggled to obtain approval from the local government to resume
operations. High safety-related costs and rising opposition to restarting
existing nuclear plants have affected nuclear projects announced before
2011 and new nuclear commissionings remain hypothetical.
Two projects are currently under construction. Construction work has
resumed at Chugoku Electric’s Shimane 3 (1 325 MW), but the start year is
still unclear. Commissioning of J-Power’s Ohma (1 325 MW) has now been
shifted to 2024. Seven nuclear reactors are planned on 4 sites: Tsuruga
3&4 by Japco (2 x 1 500 MW), Kaminoseki 1&2 by Chugoku Electric
(2x1 320 MW), Higashi-Dori 1&2 by TEPCO (2x1 320 MW) and Hamaoka 6
by Chubu (1 380 MW).
Several power utilities have decided to decommission their nuclear
reactors, due to high investments required to upgrade them to the new
safety standards: Kansai Electric (Ohi-1 and 2), Japan Atomic Power
(Tsuruga-1), Kyushu Electric (Genkai-1), Chugoku Electric (Shimane-1),
Kansai Electric (Mihama-1 and Mihama-2), Shikoku Electric (Ikata-2).
In December 2016, the METI again revised its costs projections related to
Fukushima to Yen 21 500bn (US$188bn), which is two times higher than
the initial projections: decommissioning costs have soared from Yen
2 000bn to Yen 8 000bn (US$70bn), compensation payments to Yen
7 900bn (US$69bn) and the treatment and storage of contaminated soil to
Yen 5 600bn (US$49bn).
Meanwhile, three licence extensions enabling operations beyond 40 years
under revised regulation were granted by the NRA in 2016 to Takahama-1
and 2, and to the Mihama-3 nuclear power unit (780 MW). All units are
operated by Kansai Electric.
Due to fierce criticism from environmental groups, the Japanese
Government is considering tightening regulations on the approval of coal-
fired power projects, so that only the most efficient technologies
(including ultra-supercritical plants) would be approved. Japan plans to
adopt advanced technologies such as integrated gasification combined
cycle (IGCC) and to have them operational by 2020.
Nuclear projects
Coal power projects
Report
Sample
32 Energy Report Sample— Japan Energy Report April 2018 — Copyright © Enerdata — All rights reserved *Reproduction in whole or in part prohibited without written permission.
Possible tightening of coal power plant
approvals due to pressure from
environmental groups
In 2013, in accordance with its “Comprehensive Special Business Plan”,
TEPCO invited bids for new power generation. The company is planning to
purchase a total of 2 600 MW of thermal power from other operators.
Power delivery should start between June 2019 and June 2021. In April
2016, TEPCO mothballed 12 gas and oil-fired power plants, totalling
4 061 MW, as part of its strategy to improve fuel efficiency in power
generation.
TEPCO is building two 540 MW coal-based IGCC power plants in
partnership with Joban Joint Power and Mitsubishi through the two joint-
ventures Nakoso IGCC Power GK and Hirono IGCC Power GK. The first
power plant is being built in the Hirono area by 2021, the second one is
being built within the premises of the Nakoso power plant by 2020.
J-POWER is constructing the 600 MW Takehara New 1 Ultra-supercritical
plant which is expected to start in 2020, and which will burn up to 10% of
wood.
Kyushu Electric is building the 1 000 MW Matsuura 2 Ultra-supercritical
plant, which is expected to be commissioned in 2019.
Chugoku Electric aims to build a 1 000 MW USC power plant, Misumi 2,
which is expected to be commissioned in 2022.
Chubu Electric is constructing the 650 MW Hitachinaka Kyodo power
plant, expected to be commissioned in 2020-2021.
Tohoku has started the construction of a new 950 MW gas-fired unit at its
Shin-Sendai plant. The company aims to start operating at half of the
capacity in mid-2016 and raise the output to full capacity in 2017.
Tokyo Gas is constructing the 400 MW Ohgishima 3 power plant which will
be commissioned in 2015.
TEPCO is constructing the 420 MW Kashima Group 7-3 which is expected
to start in 2015. TEPCO has received the finalised "Environmental impact
assessment results" for its Kawasaki II expansion project, involving the
construction of two 500 MW gas-fired CCGT units at the Kawasaki power
plant. The group plans to commission the units, currently under
construction, in July 2016 and July 2017, respectively.
Chubu Electric aims to build the 2 300 MW Nishi-Nagoya-7-1 & 7-2 CCGT
plant which is expected to be commissioned in 2017-2018. In 2013 Kyushu
Electric started building its 480 MW Shin Oita 3-4 CCGT power plant,
which is expected to start in 2016.
Gas power plants Rep
ort Sam
ple
World Energy Research
Energy Report Sample— Japan Energy Report April 2018 — Copyright © Enerdata — All rights reserved 33
*Reproduction in whole or in part prohibited without written permission.
Hokkaido Electric is planning the 1 600 MW Ishikariwan Shinko 1-2-3 CCGT
to be commissioned in stages over 2019-2029. Kobe Steel is planning the 1
200 MW Kobe Steel CCGT which is expected to start in 2019. Hokuriku
Electric-operated 400 MW Toyama Shinko CCGT is in the planning stage
and will be commissioned by 2018-2019.
Hokuriku Electric’s 400 MW Toyama Shinko CCGT is being built and
scheduled to start operations in November 2018.
Several CCGT are under construction, planned or in bid process:
Ishikariwan Shinko 1-2-3 (1 707 MW) by Hokkaido Electric (commissioning
in stages over 2019-2028); a 1 200 MW CCGT by Kobe Steel (expected to
start in 2019); a 1180 MW CCGT in the port of Soma is being planned by
Fukushima Gas Power (50.7% Japex, 49.3% Mitsui) (2x590 MW units, with
first unit to be commissioned in January 2020 and the second one in April
2020).
According to the METI, Japan has approved 87.4 GW worth of renewable
power projects since the introduction of feed-in tariffs in 2012.
Three pumped-storage projects are in the pipeline: the 1 880 MW
Kannagawa project being constructed by TEPCO and expected in 2019, the
200 MW Kyogoku-3 project by Hokkaido Electric (planned for 2023), And
the 400 MW Kazunogawa-3 project by TEPCO (planned for 2024.
According to a study by the Ministry of Environment in 2015, solar power
generation could increase to 78-128 TWh by 2030, out of a total
renewable power generation of 241-257 TWh, depending on energy
policies.
The main projects under construction are: the 231 MW Setouchi Solar
project developed by TOYO group that should be commissioned in 2019
and the 257.7 MW Sakuto project managed by Pacifico Energy planned for
2019.
According to the Japan Wind Power Association (JWPA), Japan has good
wind power potential, with average wind speeds of 6.5 m/s (onshore) and
7 m/s (up to 30 km offshore and less than 200m sea depth). In its wind
power roadmap to 2050, JWPA projects onshore and offshore wind power
capacities to reach 10 GW and 1 GW, respectively, by 2020, 27 GW
(onshore) and 9 GW (offshore) by 2030, and 38 GW (onshore) and 27 GW
(offshore) by 2050.
The New Energy and Industrial Technology Development Organisation
(NEDO) approved financial support through subsidies to two offshore wind
Hydropower projects
Gas power plants
Renewables
Solar power projects
Wind power projects
Report
Sample
34 Energy Report Sample— Japan Energy Report April 2018 — Copyright © Enerdata — All rights reserved *Reproduction in whole or in part prohibited without written permission.
projects in January 2016: a 170 MW offshore wind park, developed by
Marubeni and Obayashi in the port of Noshiro by 2020, and a 104 MW
offshore wind park developed by Green Power Investment within the
Ishikari Bay by 2020.
Several wind plants are under consideration: Softbank is moving ahead
with plans for 150 MW Ibaraki offshore; Murakami City is bidding for
220 MW Iwafune (initially expected to start in 2025); and the 700 MW
Hibikinada offshore is being planned.
The city of Kitakyushu (Kyushu Island, Japan) has selected the Hibiki
consortium led by Kyuden Mirai (fully-owned renewable subsidiary of
Kyushu Electric), and including J-Power, Saibu Gas and engineering firm
Kyudenko to develop a Yen 175bn (US$1.5bn) offshore wind project near
the port of Kitakyushu.
Gas
To increase the LNG supply, several LNG regasification terminals are under
development, adding more than 4 bcm/year.
Tokyo Gas plans to add two LNG vaporisers in Hitachi by December 2018,
and the company announced that it plans to build a second LNG storage
tank by 2021, for a total capacity of 2 bcm/year.
In addition, the company plans to install two new vaporisers and a new
LNG storage tank at the Sodegaura LNG terminal by 2024 (2.4 bcm/year).
Japan and Russia have signed an MoU to promote Japanese firms'
participation in a project to build a terminal in Vladivostok (Russian far
east) for LNG for export to Japan. In 2014, the company decided to
reconsider the project feasibility and, while it has not advanced, the
possibility remains for an export terminal up to 10 Mt/year at some point
in the future.
Tokyo Gas, Japex and Nippon Steel & Sumikin Engineering completed a
preliminary feasibility study for a 1 500 km gas pipeline project, which
would import natural gas from Russia’s Sakhalin Island to Hokkaido and
then on to the Tokyo metropolitan area. The pipeline, which would be
50 cm to 76 cm in diameter, would be brought onshore near Kashima Port
in Ibaraki Prefecture and connected to Tokyo Gas’s pipeline network. It
would cost up to around US$6.5bn and could transport 25 bcm/year.
Gas pipelines
LNG projects
LNG projects
Report
Sample
World Energy Research
Energy Report Sample— Japan Energy Report April 2018 — Copyright © Enerdata — All rights reserved 35
*Reproduction in whole or in part prohibited without written permission.
Oil
The 4th Strategic Energy Plan recognises oil as an important energy
resource for the transportation, civilian and power sectors. According to
the Energy Committee of the Japanese government, oil demand is
expected to fall by 1.6%/year over FY2015-FY2020.
The unconventional oil revolution in the U.S. has prompted the Japanese
Government to promote policies that will increase the competitiveness of
the Japanese petrochemical industry. The energy efficiency and
production flexibility of the Japanese refineries need to be improved to
enable competition with the new refineries in Asia.
CO2 capture and storage
JGC Corporation has also received a contract from Japan CCS to construct
the core facilities at a CO2 capture and storage (CCS) technology
demonstration project. The site for the demonstration project is located
adjacent to an oil refinery in Tomakomai, Hokkaido, owned by Idemitsu
Kosan. The lump-sum turnkey contract calls for the engineering,
procurement, construction and commissioning work associated with
carbon dioxide capture facilities with a yearly capacity of 200 000 t/year of
CO2, as well as compression, transportation and injection facilities. The
value of the contract was not disclosed. Capture started with the pilot
project in March 2016 and is planned to operate for three years.
Toshiba Energy Systems and Solutions has started construction on Japan’s
first large-scale carbon capture project at its 50 MW Mikawa biomass
power plant. The project is scheduled for commercial operations in 2020
and aims to capture more than 500 tCO2/d.
Uranium
Japan Oil, Oil, Gas and Metals National Corp. (JOGMEC) and Navoi Mining
and Metallurgical Combinat (Uzbekistan) will conduct joint exploration for
uranium in Uzbekistan, with the aim of supplying Japan with nuclear fuel
in the case of the restart of nuclear plants. They will conduct joint
exploration for around 5 years and verify the amount and quality of
Uzbekistan’s uranium deposits. JOGMEC continues to undertake
exploration in the Navoi region. In May 2017, the company published a bid
for uranium exploration activities, including drilling works and analysis in
Uzbekistan. If Japan sees potential in mining high-quality uranium, it will
try to secure concession rights to both import it and export it to other
countries.
Report
Sample
Energy Statistics
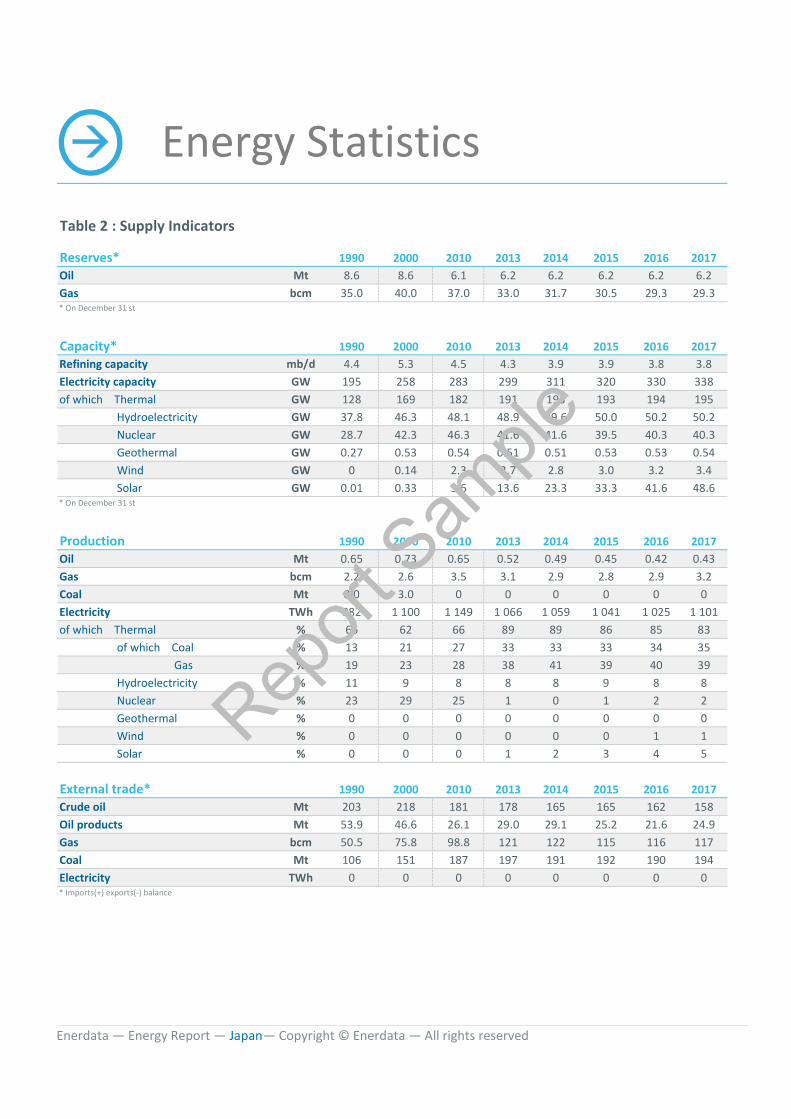
Table 2 : Supply Indicators
Reserves* 1990 2000 2010 2013 2014 2015 2016 2017Oil Mt 8.6 8.6 6.1 6.2 6.2 6.2 6.2 6.2Gas bcm 35.0 40.0 37.0 33.0 31.7 30.5 29.3 29.3* On December 31 st
Capacity* 1990 2000 2010 2013 2014 2015 2016 2017Refining capacity mb/d 4.4 5.3 4.5 4.3 3.9 3.9 3.8 3.8Electricity capacity GW 195 258 283 299 311 320 330 338of which Thermal GW 128 169 182 191 193 193 194 195 Hydroelectricity GW 37.8 46.3 48.1 48.9 49.6 50.0 50.2 50.2 Nuclear GW 28.7 42.3 46.3 41.6 41.6 39.5 40.3 40.3 Geothermal GW 0.27 0.53 0.54 0.51 0.51 0.53 0.53 0.54 Wind GW 0 0.14 2.3 2.7 2.8 3.0 3.2 3.4 Solar GW 0.01 0.33 3.6 13.6 23.3 33.3 41.6 48.6* On December 31 st
Production 1990 2000 2010 2013 2014 2015 2016 2017Oil Mt 0.65 0.73 0.65 0.52 0.49 0.45 0.42 0.43Gas bcm 2.2 2.6 3.5 3.1 2.9 2.8 2.9 3.2Coal Mt 8.0 3.0 0 0 0 0 0 0Electricity TWh 882 1 100 1 149 1 066 1 059 1 041 1 025 1 101of which Thermal % 66 62 66 89 89 86 85 83 of which Coal % 13 21 27 33 33 33 34 35 Gas % 19 23 28 38 41 39 40 39 Hydroelectricity % 11 9 8 8 8 9 8 8 Nuclear % 23 29 25 1 0 1 2 2 Geothermal % 0 0 0 0 0 0 0 0 Wind % 0 0 0 0 0 0 1 1 Solar % 0 0 0 1 2 3 4 5
External trade* 1990 2000 2010 2013 2014 2015 2016 2017Crude oil Mt 203 218 181 178 165 165 162 158Oil products Mt 53.9 46.6 26.1 29.0 29.1 25.2 21.6 24.9Gas bcm 50.5 75.8 98.8 121 122 115 116 117Coal Mt 106 151 187 197 191 192 190 194Electricity TWh 0 0 0 0 0 0 0 0* Imports(+) exports(-) balance
Enerdata — Energy Report — Japan— Copyright © Enerdata — All rights reserved
Report
Sample
Energy Statistics
Table 3 : Demand Indicators
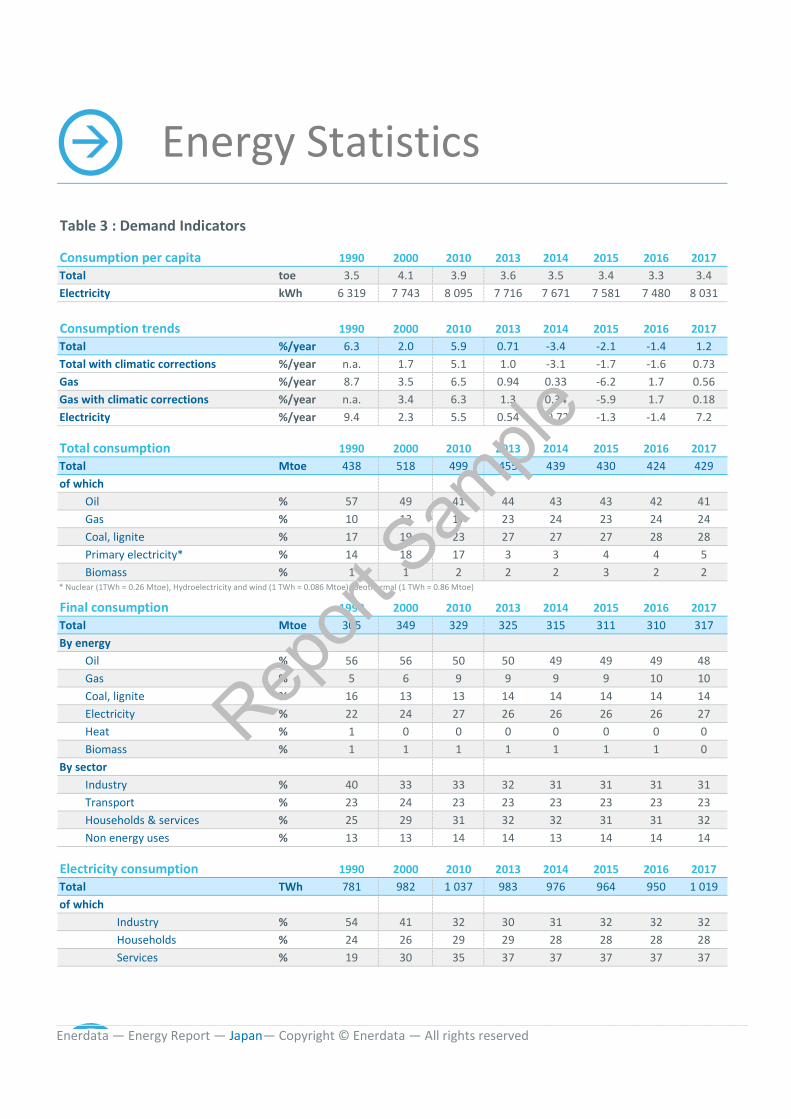
Consumption per capita 1990 2000 2010 2013 2014 2015 2016 2017Total toe 3.5 4.1 3.9 3.6 3.5 3.4 3.3 3.4Electricity kWh 6 319 7 743 8 095 7 716 7 671 7 581 7 480 8 031
Consumption trends 1990 2000 2010 2013 2014 2015 2016 2017Total %/year 6.3 2.0 5.9 0.71 -3.4 -2.1 -1.4 1.2Total with climatic corrections %/year n.a. 1.7 5.1 1.0 -3.1 -1.7 -1.6 0.73Gas %/year 8.7 3.5 6.5 0.94 0.33 -6.2 1.7 0.56Gas with climatic corrections %/year n.a. 3.4 6.3 1.3 0.34 -5.9 1.7 0.18Electricity %/year 9.4 2.3 5.5 0.54 -0.72 -1.3 -1.4 7.2
Total consumption 1990 2000 2010 2013 2014 2015 2016 2017Total Mtoe 438 518 499 455 439 430 424 429of which Oil % 57 49 41 44 43 43 42 41 Gas % 10 13 17 23 24 23 24 24 Coal, lignite % 17 19 23 27 27 27 28 28 Primary electricity* % 14 18 17 3 3 4 4 5 Biomass % 1 1 2 2 2 3 2 2* Nuclear (1TWh = 0.26 Mtoe), Hydroelectricity and wind (1 TWh = 0.086 Mtoe), Geothermal (1 TWh = 0.86 Mtoe)
Final consumption 1990 2000 2010 2013 2014 2015 2016 2017Total Mtoe 305 349 329 325 315 311 310 317By energy Oil % 56 56 50 50 49 49 49 48 Gas % 5 6 9 9 9 9 10 10 Coal, lignite % 16 13 13 14 14 14 14 14 Electricity % 22 24 27 26 26 26 26 27 Heat % 1 0 0 0 0 0 0 0 Biomass % 1 1 1 1 1 1 1 0By sector Industry % 40 33 33 32 31 31 31 31 Transport % 23 24 23 23 23 23 23 23 Households & services % 25 29 31 32 32 31 31 32 Non energy uses % 13 13 14 14 13 14 14 14
Electricity consumption 1990 2000 2010 2013 2014 2015 2016 2017Total TWh 781 982 1 037 983 976 964 950 1 019of which Industry % 54 41 32 30 31 32 32 32 Households % 24 26 29 29 28 28 28 28 Services % 19 30 35 37 37 37 37 37
Enerdata — Energy Report — Japan— Copyright © Enerdata — All rights reserved
Report
Sample
Energy Statistics
Table 4 : Energy Balances
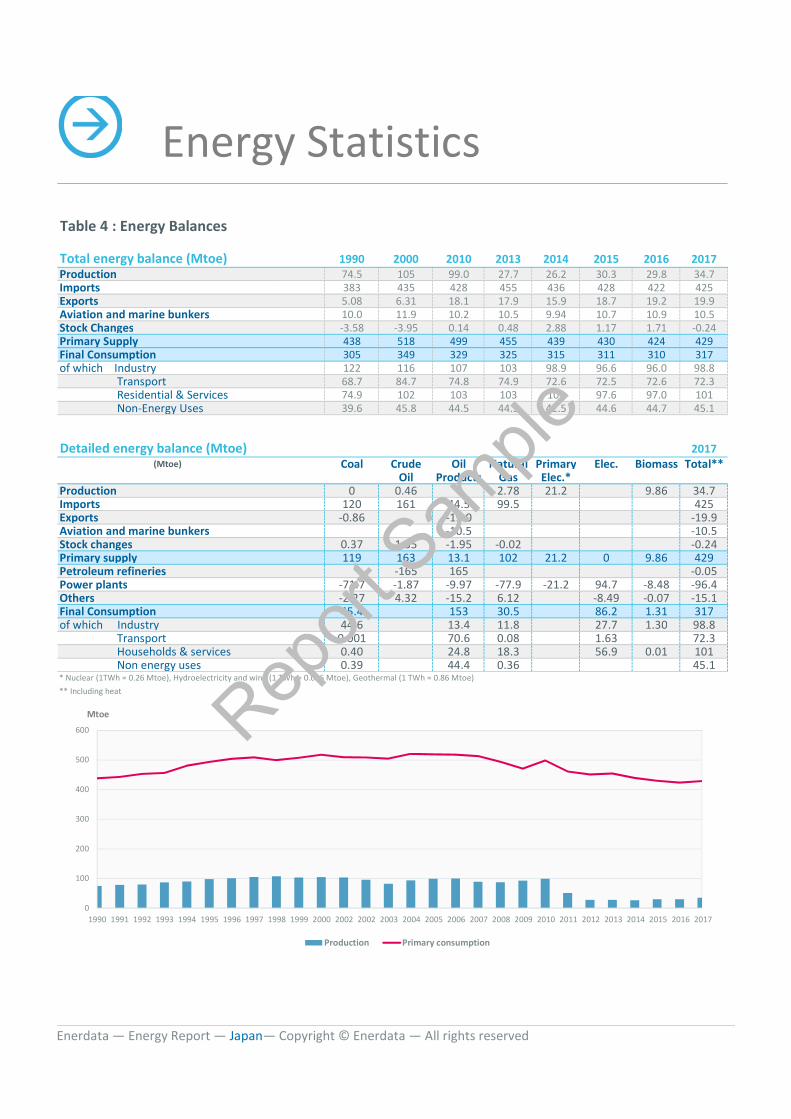
Total energy balance (Mtoe) 1990 2000 2010 2013 2014 2015 2016 2017Production 74.5 105 99.0 27.7 26.2 30.3 29.8 34.7Imports 383 435 428 455 436 428 422 425Exports 5.08 6.31 18.1 17.9 15.9 18.7 19.2 19.9Aviation and marine bunkers 10.0 11.9 10.2 10.5 9.94 10.7 10.9 10.5Stock Changes -3.58 -3.95 0.14 0.48 2.88 1.17 1.71 -0.24Primary Supply 438 518 499 455 439 430 424 429Final Consumption 305 349 329 325 315 311 310 317of which Industry 122 116 107 103 98.9 96.6 96.0 98.8 Transport 68.7 84.7 74.8 74.9 72.6 72.5 72.6 72.3 Residential & Services 74.9 102 103 103 102 97.6 97.0 101 Non-Energy Uses 39.6 45.8 44.5 44.3 42.5 44.6 44.7 45.1
Detailed energy balance (Mtoe) 2017(Mtoe) Coal Crude Oil Natural Primary Elec. Biomass Total**
Oil Products Gas Elec.*Production 0 0.46 2.78 21.2 9.86 34.7Imports 120 161 44.5 99.5 425Exports -0.86 -19.0 -19.9Aviation and marine bunkers -10.5 -10.5Stock changes 0.37 1.35 -1.95 -0.02 -0.24Primary supply 119 163 13.1 102 21.2 0 9.86 429Petroleum refineries -165 165 -0.05Power plants -71.7 -1.87 -9.97 -77.9 -21.2 94.7 -8.48 -96.4Others -2.27 4.32 -15.2 6.12 -8.49 -0.07 -15.1Final Consumption 45.4 153 30.5 86.2 1.31 317of which Industry 44.6 13.4 11.8 27.7 1.30 98.8 Transport 0.001 70.6 0.08 1.63 72.3 Households & services 0.40 24.8 18.3 56.9 0.01 101 Non energy uses 0.39 44.4 0.36 45.1* Nuclear (1TWh = 0.26 Mtoe), Hydroelectricity and wind (1 TWh = 0.086 Mtoe), Geothermal (1 TWh = 0.86 Mtoe)** Including heat
0
100
200
300
400
500
600
1990 1991 1992 1993 1994 1995 1996 1997 1998 1999 2000 2002 2002 2003 2004 2005 2006 2007 2008 2009 2010 2011 2012 2013 2014 2015 2016 2017
Production Primary consumption
Mtoe
Enerdata — Energy Report — Japan— Copyright © Enerdata — All rights reserved
Report
Sample
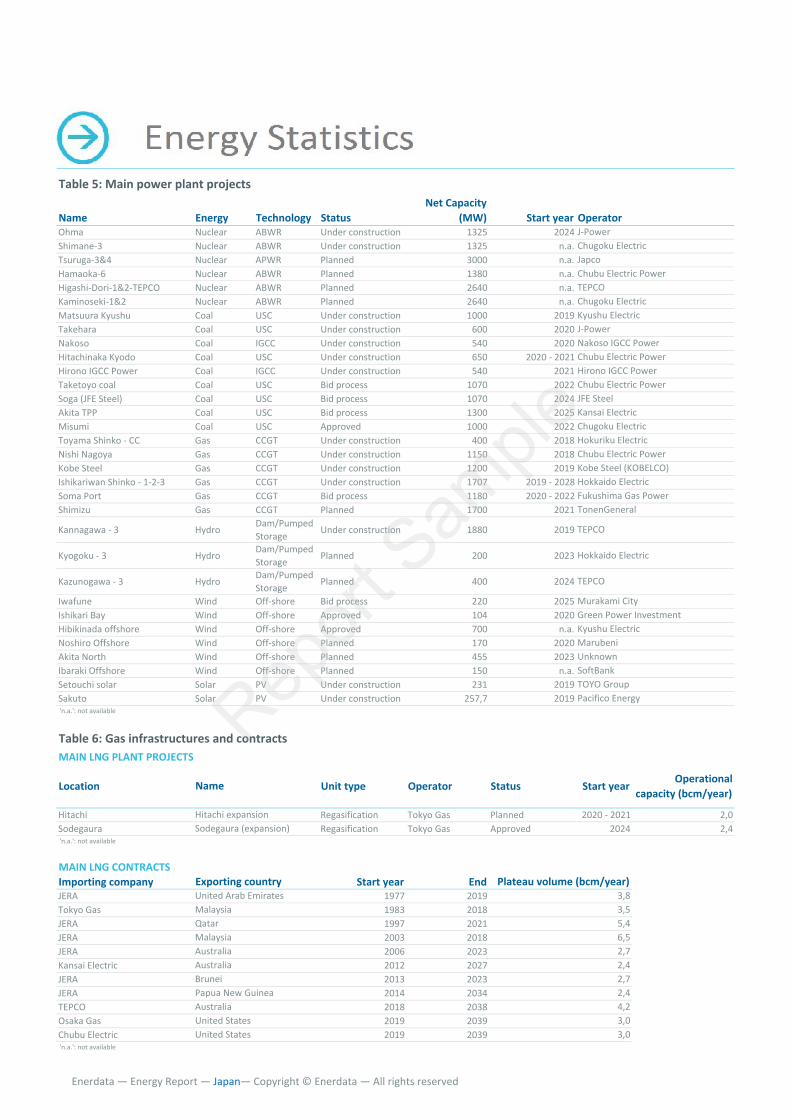
Name Energy Technology StatusNet Capacity
(MW) Start yearOhma Nuclear ABWR Under construction 1325 2024Shimane-3 Nuclear ABWR Under construction 1325 n.a.Tsuruga-3&4 Nuclear APWR Planned 3000 n.a.Hamaoka-6 Nuclear ABWR Planned 1380 n.a.Higashi-Dori-1&2-TEPCO Nuclear ABWR Planned 2640 n.a.Kaminoseki-1&2 Nuclear ABWR Planned 2640 n.a.Matsuura Kyushu Coal USC Under construction 1000 2019Takehara Coal USC Under construction 600 2020Nakoso Coal IGCC Under construction 540 2020Hitachinaka Kyodo Coal USC Under construction 650 2020 - 2021Hirono IGCC Power Coal IGCC Under construction 540 2021Taketoyo coal Coal USC Bid process 1070 2022Soga (JFE Steel) Coal USC Bid process 1070 2024Akita TPP Coal USC Bid process 1300 2025Misumi Coal USC Approved 1000 2022Toyama Shinko - CC Gas CCGT Under construction 400 2018Nishi Nagoya Gas CCGT Under construction 1150 2018Kobe Steel Gas CCGT Under construction 1200 2019Ishikariwan Shinko - 1-2-3 Gas CCGT Under construction 1707 2019 - 2028Soma Port Gas CCGT Bid process 1180 2020 - 2022Shimizu Gas CCGT Planned 1700 2021
Kannagawa - 3 Hydro Dam/PumpedStorage Under construction 1880 2019
Kyogoku - 3 Hydro Dam/PumpedStorage Planned 200 2023
Kazunogawa - 3 Hydro Dam/PumpedStorage Planned 400 2024
Iwafune Wind Off-shore Bid process 220 2025Ishikari Bay Wind Off-shore Approved 104 2020Hibikinada offshore Wind Off-shore Approved 700 n.a.Noshiro Offshore Wind Off-shore Planned 170 2020Akita North Wind Off-shore Planned 455 2023Ibaraki Offshore Wind Off-shore Planned 150 n.a.Setouchi solar Solar PV Under construction 231 2019Sakuto Solar PV Under construction 257,7 2019 'n.a.': not available
Location Unit type Operator Status Start year Operationalcapacity (bcm/year)
Hitachi Regasification Tokyo Gas Planned 2020 - 2021 2,0Sodegaura Regasification Tokyo Gas Approved 2024 2,4 'n.a.': not available
Importing company Start year EndJERA 1977 2019Tokyo Gas 1983 2018JERA 1997 2021JERA 2003 2018JERA 2006 2023Kansai Electric 2012 2027JERA 2013 2023JERA 2014 2034TEPCO 2018 2038Osaka Gas 2019 2039Chubu Electric 2019 2039 'n.a.': not available
Table 5: Main power plant projects
OperatorJ-PowerChugoku ElectricJapcoChubu Electric PowerTEPCOChugoku ElectricKyushu ElectricJ-PowerNakoso IGCC PowerChubu Electric PowerHirono IGCC PowerChubu Electric PowerJFE SteelKansai ElectricChugoku ElectricHokuriku ElectricChubu Electric PowerKobe Steel (KOBELCO)Hokkaido ElectricFukushima Gas PowerTonenGeneral
TEPCO
Hokkaido Electric
TEPCO
Murakami CityGreen Power InvestmentKyushu ElectricMarubeniUnknownSoftBankTOYO GroupPacifico Energy
Table 6: Gas infrastructures and contractsMAIN LNG PLANT PROJECTS
Name
Hitachi expansionSodegaura (expansion)
MAIN LNG CONTRACTSExporting country Plateau volume (bcm/year)United Arab Emirates 3,8Malaysia 3,5Qatar 5,4Malaysia 6,5Australia 2,7Australia 2,4Brunei 2,7Papua New Guinea 2,4Australia 4,2United States 3,0United States 3,0
Enerdata — Energy Report — Japan— Copyright © Enerdata — All rights reserved
Report
Sample
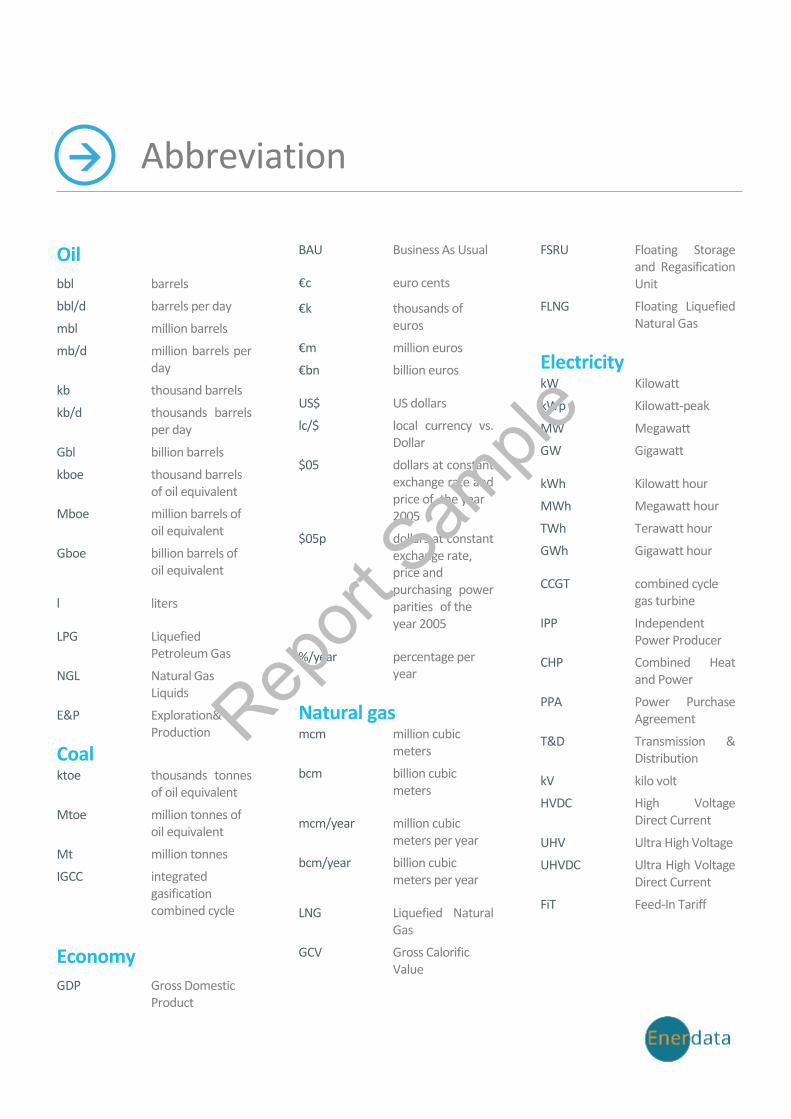
Abbreviation
Oil
bbl barrels
bbl/d barrels per day
mbl million barrels
mb/d million barrels per day
kb thousand barrels
kb/d thousands barrels per day
Gbl billion barrels
kboe thousand barrels of oil equivalent
Mboe million barrels of oil equivalent
Gboe billion barrels of oil equivalent
l liters
LPG Liquefied Petroleum Gas
NGL Natural Gas Liquids
E&P Exploration& Production
Coal ktoe thousands tonnes
of oil equivalent
Mtoe million tonnes of oil equivalent
Mt million tonnes
IGCC integrated gasification combined cycle
Economy
GDP Gross Domestic Product
BAU Business As Usual
€c euro cents
€k thousands of euros
€m million euros
€bn billion euros
US$ US dollars
lc/$ local currency vs. Dollar
$05 dollars at constant exchange rate and price of the year 2005
$05p dollars at constant exchange rate, price and purchasing power parities of the year 2005
%/year percentage per year
Natural gas mcm million cubic
meters
bcm billion cubic meters
mcm/year million cubic meters per year
bcm/year billion cubic meters per year
LNG Liquefied Natural Gas
GCV Gross Calorific Value
FSRU Floating Storage and Regasification Unit
FLNG Floating Liquefied Natural Gas
Electricity kW Kilowatt
kWp Kilowatt-peak
MW Megawatt
GW Gigawatt
kWh Kilowatt hour
MWh Megawatt hour
TWh Terawatt hour
GWh Gigawatt hour
CCGT combined cycle gas turbine
IPP Independent Power Producer
CHP Combined Heat and Power
PPA Power Purchase Agreement
T&D Transmission & Distribution
kV kilo volt
HVDC High Voltage Direct Current
UHV Ultra High Voltage
UHVDC Ultra High Voltage Direct Current
FiT Feed-In Tariff
Report
Sample
CO2
MtCO2 million tonnes of carbon dioxide
gCO2 grammes of carbon dioxide
tCO2/cap tonnes of carbon dioxide per capita
CO2eq CO2 equivalent
kg kilogrammes
CCS carbon capture and storage
ETS Emission Trading Scheme
GHG Greenhouse Gases
INDC Intended Nationally Determined Contribution
EUA European Union emission Allowances
Energy Efficiency
NEEAP National Energy Efficiency Action Plan
EPBD Energy Performance of Buildings Directive
EED Energy Efficiency Directive
Uranium
$/lb dollar per pound
Mlb million pounds
Infrastructures
km kilometers
HOA Head of Agreements
MoU Memorandum of Understanding
LOI Letter of Intent
FEED Front-End Engineering Design
FID Final Investment Decision
EPC Engineering, Procurement, Construction
EPCC Engineering, Procurement, Construction and Commissioning
BOO Build-Own-Operate
BOOT Build-Own-Operate-Transfer
BOT Build-Own-Transfer
O&M Operation and Maintenance
TSO Transmission System Operator
TYNDP Ten-Year Network Development Plan
Report
Sample
Glossary
Production
Production
Energy production always corresponds to gross domestic production. It consists of primary and secondary gross production, except for natural gas for which production corresponds to marketed production.
Gross power generation
Gross production of electricity includes the public production (production of private and public electricity utilities) and the autoproducers, by any type of power plants (including cogeneration).
Trade
Balance of trade
The trade balance is the difference between exports and imports. The balance of a net exporter appears as a negative value (-).
Imports
Imports are the quantities of energy products imported from abroad into the national territory, deductions being made for quantities simply in transit destined for other countries and those quantities which are processed within the national boundaries on behalf of another country.
Exports
Exports are the quantities of energy product exported from the national territory to foreign countries, deductions being made for products simply in transit and quantities
processed on behalf of other countries. For reasons of accounting conformity, exports appear with a negative sign (-) in the energy balance.
Consumption
Total energy consumption
Total energy consumption, for each energy product, is the sum of total production, balance of trade, aviation and marine bunkers, and stock variations.
Final consumption
Final consumption is the difference between total consumption and the consumption of the energy sector for its own uses or as inputs in transformations (e.g. power generation, refining, oil, coal, gas extraction, LNG plants...), in transport and distribution (T&D losses,.), as well as statistical discrepancies. Final consumption measures the needs of the final consumers of the country. They are broken down into several sectors: industry, transport, residential, tertiary, agriculture and non-energy uses.
Final consumption of industry
Final consumption of industry includes the final consumption of the mining sector, manufacturing sector, and construction and water distribution and processing. It excludes the fuel used as input for autoproduction and includes the autoproduced electricity. It excludes the fuel consumption of all modes of transport used by industry, and also
excludes energy products employed for non energy uses (e.g. raw materials in petrochemicals, lubricants).
Final consumption of transport
Final consumption of transport is the total consumption of all modes of transportation regardless of to whom they belong, and to what purpose the transport serves. Aviation and marine bunkers (international aviation and sea transport) are excluded.
Final consumption of residential, tertiary and agriculture
This consumption is broken down into three sub-sectors: residential, tertiary, agriculture (including fishing activities).It is often defined as the total final energy consumption energy uses, excluding industry and transport sectors.
Final consumption for non energy uses
This covers products used in the petrochemical industry (e.g. naphta), for the production of ammonia (natural gas), for electrodes (carbon), and all other products used for their physical-chemical properties (bitumen, paraffin, motor oils, etc....).It is divided into chemical and others.
CO2
CO2 emissions cover the emissions from fossil fuels combustion (coal, oil and gas). They are calculated according to the UNFCCC methodology. Here the sectoral approach is presented, ie the sum of CO2 emissions of each sector.
Report
Sample
Prices
Gasoline and diesel prices
Price all taxes in Dollar or Euro. For gasoline corresponds to the premium gasoline unleaded 95; for the former years series retropolated from the variation of premium gasoline 98 and / or normal unleaded gasoline and / or premium leaded gasoline. For diesel, corresponds to price including all taxes of the motor fuel for the motorists.
Households and Industry prices (Gas and Electricity)
Price all taxes in Dollar or Euro. They used to be calculated as the average revenues per kWh of electricity received by all (or main) public or private utilities of the sector. They can also refer to the price applied to a particular class of consumer; in particular for European countries for prices after 2007 (Eurostat data).
Economy
GDP
GDP measures the economic activity of a country. To allow comparison between countries and avoid the impact of inflation it provided in constant price at purchasing power parities (converted on the basis of the exchange rate of 2005 and the rate of purchasing power parity of World Bank).
Report
Sample
Instant delivery of energy data and reports Get an annual online subscription with
access to a selection of reports or data
sets, and benefit from continuous
updates.
• Energy Market Reports
• LNG Dataset
• Refineries Datasets
• Energy Prices
• Key Energy News
Click here to request a free trial of our energy services
Contact us https://www.enerdata.net/research/ [email protected]
EMEA 23 Austin Friars London EC2N 2QP United Kingdom
Tel: +44 207 183 4475 Fax: +44 207 183 8445 email us
SINGAPORE
401 North Bridge Road.
Singapore 188726 Tel: +65 6407 7648
email us
Enerdata Research
Enerdata is a global energy intelligence company. Since 30 years, we provide to our international client base a comprehensive set of information services to better understand and tackle energy related issues.
Annual subscriptions
Get an annual online subscription with access to a selection of reports or data
sets, and benefit from continuous updates.
Global Energy Research
Market intelligence reports for more than 100 countries. Reports provide a synthetic analysis of the oil, gas, coal and power markets, and include updated market data. Grasp the essentials on the market structure, organisation,actors, projects and perspectives of the global energy industry.
Global Energy & CO2 database
Historical data for more than 186 countries covering supply demand, prices, balances and indicators for oil, gas, power, coal and renewable energy by sector. CO2, N2O, CH4 emissions data included.
EnerFuture: Energy forecasts
Forecasts up to 2040 for demand, prices, CO2 emissions & power generation. Oil, gas, power, coal, renewable projections by sector for 60 countries and worldwide.
Power Plant Tracker
Market research service from Enerdata to screen, monitor and analyse the development of power generation assets. Power Plant Tracker is offering an interactive database and a powerful search engine covering power plants in the World - both installed and projects..
More energy services on our web page.
Report
Sample
Contact us
Enquiries, comments and suggestions are welcome and should be addressed to:
www.enerdata.net [email protected]
Copyright notices
All information or data provided by Enerdata, in any form, is the property of Enerdata and is protected in each country by national laws governing intellectual property. All information or data provided by Enerdata is copyright protected, inclusive of material appearing in a hard copy format or electronically.
Enerdata shall not be liable for damages of any nature, direct or indirect, arising from the use of data and information contained in this document, including any operational, financial or commercial losses.
COUNTRY ENERGY REPORT
Report
Sample


