266

R e p o r t
Sampling, Analysis, and Field Procedures Manual,
PG&E Topock Program
PG&E Topock Compressor Station
Needles, California
Prepared for
Pacific Gas and Electric Company
Revision 1 March 31, 2005
Prepared by
155 Grand, Suite 1000 Oakland, CA 94604-2681

SFO\FIELDPROCEDURES_REVISION1.DOC iii
Contents
Acronyms and Abbreviations .................................................................................................. vi
1.0 Introduction.................................................................................................................. 1-1
2.0 Site Background........................................................................................................... 2-1
3.0 Summary of Data Collection Projects...................................................................... 3-1 3.1 Groundwater and Surface Water Monitoring Program............................. 3-1 3.2 Background Metals Groundwater Investigation ........................................ 3-1 3.3 Interim Measures Hydrogeologic and Groundwater Investigations....... 3-2 3.4 Interim Measures Groundwater Pumping and Hydraulic
Containment..................................................................................................... 3-2 3.5 Compliance Monitoring for Expanded Interim Measures
Groundwater Remediation ............................................................................ 3-3
4.0 Water Quality Sampling, Analysis, and Monitoring Procedures ...................... 4-1 4.1 Pre-sampling Activities .................................................................................. 4-1
4.1.1 Field Event Planning.......................................................................... 4-1 4.1.2 Field Supplies...................................................................................... 4-3
4.2 Analytical Parameters and Methods for Water Quality Sampling .......... 4-4 4.3 Sampling Methods and Procedures for Groundwater Wells.................... 4-6
4.3.1 Well Purging and Field Parameters................................................. 4-6 4.4 Sampling Methods and Procedures for Surface Water.............................. 4-7 4.5 Groundwater Sampling from Boreholes During Drilling ......................... 4-8 4.6 Field Filtration of Groundwater Samples .................................................... 4-8 4.7 Water Level Measurements, Wells and Surface Water .............................. 4-8 4.8 Water Quality Field Measurements and Calibration ................................. 4-9 4.9 Water Sample Handling, Documentation, and Shipment....................... 4-10 4.10 Well Inspection and Maintenance............................................................... 4-12 4.11 Water Quality Sampling Equipment Decontamination........................... 4-12 4.12 Water Quality Sampling Investigation-derived Waste............................ 4-13 4.13 Quality Control Procedures ......................................................................... 4-13
4.13.1 Field Quality Control Samples ....................................................... 4-14 4.13.2 Data Validation................................................................................. 4-14
4.14 Field Variances............................................................................................... 4-14
5.0 Hydrogeologic Investigation Methods and Procedures....................................... 5-1 5.1 Drilling and Well Installation ........................................................................ 5-1
5.1.1 Preparation Activities ........................................................................ 5-1 5.1.2 Field Activities .................................................................................... 5-1
5.2 Soil and Core Description and Logging ....................................................... 5-2 5.3 Core and Subsurface Soil Sampling.............................................................. 5-2 5.4 Geotechnical Data Collection......................................................................... 5-3 5.5 Wireline Geophysical Logging ...................................................................... 5-3

TOPOCK FIELD PROCEDURES MANUAL REVISION 01 3/31/2005 CONTENTS
SFO\FIELDPROCEDURES_REVISION1.DOC iv
5.6 Well Development........................................................................................... 5-4 5.7 Well Surveying ................................................................................................ 5-4 5.8 Decontamination of Drilling Equipment ..................................................... 5-4 5.9 Investigation-derived Waste.......................................................................... 5-5
6.0 Hydraulic Data Collection and Aquifer Testing ................................................... 6-1 6.1 Transducer Maintenance ....................................................................................... 6-1
6.1.1 Routine Inspections and Maintenance ............................................ 6-1 6.1.2 Periodic Inspections and Maintenance............................................ 6-1
6.2 Spinner Logging .............................................................................................. 6-2 6.2.1 Procedure............................................................................................. 6-2
6.3 Step-drawdown and Constant-rate Testing ................................................ 6-3 6.3.1 Step-drawdown Test.......................................................................... 6-3 6.3.2 Constant-rate Test .............................................................................. 6-4 6.3.3 Data Analysis and Reporting............................................................ 6-5
7.0 References .........................................................................................................................1
Figures
2-1 Site Map............................................................................................................................. 2-2
Tables
4-1 Employee Signoff Form .................................................................................................. 4-2 4-2 Sample Containers, Preservation, and Holding Times .............................................. 4-4
Appendices
A Standard Operating Procedures for Water Quality Investigation and Monitoring Activities
SOP-A1 Purging and Sampling of Groundwater Monitoring Wells SOP-A2 Purging and Sampling of 1-inch-diameter Monitoring Wells SOP-A3 Purging and Sampling of Active and Inactive Water Supply Wells SOP-A4 Surface Water Sampling SOP-A5 Groundwater Sampling from Sonic Drilling Boreholes SOP-A6 Sample Field Filtration and Preservation for Metals Analyses SOP-A7 Water Level Measurements SOP-A8 Field Water Quality Measurements Using a Flow-through Cell SOP-A9 Calibration of Field Instruments SOP-A10 Decontamination of Water Sampling Equipment SOP-A11 Total Depth Measurement
B Standard Operating Procedures for Drilling, Logging, and Well Installation
SOP-B1 General Guidance for Monitoring Well Installation and Development
TOPOCK FIELD PROCEDURES MANUAL REVISION 01 3/31/2005 CONTENTS
SFO\FIELDPROCEDURES_REVISION1.DOC v
SOP-B2 Soil Classification and Logging Procedures SOP-B3 Borehole Sampling and Logging of Soil Borings SOP-B4 Boring Abandonment SOP-B5 Decontamination of Personnel and Equipment, Well Drilling, and Subsurface Sampling and Investigations SOP-B6 Disposal of Waste Fluids and Solids (IDW) SOP-B7 Homogenization of Soil and Sediment Samples SOP-B8 General Guidance for Well Surveying SOP-B9 Drilling – Sonic Method SOP-B10 Drilling – Mud Rotary Method SOP-B11 Site Clearance and Permitting SOP-B12 General Guidance for Wireline Geophysical Logging SOP-B13 Extraction Well Installation and Development
C Standard Operating Procedures for Hydraulic Data Collection and Testing
SOP-C1 Temporary Removal and Replacement of Pressure Transducers SOP-C2 Transducer Programming SOP-C3 Pressure Transducer Installation, Download, and Maintenance SOP-C4 Pressure Transducer Upload to Topock DB SOP-C5 Spinner logging SOP-C6 Aquifer and Step Testing
D QAPP for Water Quality Sampling and Analysis
SFO\FIELDPROCEDURES_REVISION1.DOC vi
Acronyms and Abbreviations
CACA Corrective Action Consent Agreement
Cr(T) total chromium
Cr(VI) hexavalent chromium
DTSC Department of Toxic Substances Control
FTM Field Team Manager
GMP Groundwater and Surface Water Monitoring Program
HSP Health and Safety Plan
IDW investigation-derived waste
IM Interim Measure
ORP oxidation-reduction potential
PG&E Pacific Gas and Electric Company
PPE personal protective equipment
PSI pounds per square inch
PVC polyvinyl chloride
QAPP Quality Assurance Project Plan
RCRA Resource Conservation and Recovery Act
RFI RCRA Facility Investigation
SAP Sampling and Analysis Plan
SOP standard operating procedure
USEPA United States Environmental Protection Agency
SFO\FIELDPROCEDURES_REVISION1.DOC 1-1
1.0 Introduction
This sampling, analysis, and field procedures manual documents procedures for sample collection, laboratory analysis, and other field investigation and data collection activities at the Pacific Gas and Electric Company (PG&E) Topock Compressor Station. PG&E is implementing a Resource Conservation and Recovery Act (RCRA) facility investigation (RFI) and corrective measures at the Topock Compressor Station pursuant to a RCRA Corrective Action Consent Agreement (CACA) with the California Environmental Protection Agency Department of Toxic Substances Control (DTSC) (DTSC 1996). Currently, there are a number of investigations and data collection efforts proceeding in parallel at the Topock site in support of the RCRA corrective action process. This document has been prepared in response to DTSC’s January 25, 2005 letter requesting publication of a sampling and analysis field procedures manual to be applicable to the entire Topock program (DTSC 2005a).
This manual was originally submitted to DTSC on February 11, 2005, as Revision 0. This Revision 1 incorporates comments in DTSC letters dated March 4, 2005 and March 16, 2005 (DTSC 2005b-c). Revision 1 includes field investigation and data collection activities not included in Revision 0.
This manual identifies the various data collection projects being implemented at the PG&E Topock Compressor Station site (Topock site) and summarizes the data collection activities associated with each project. Detail on the locations, frequency, and rationale for field investigation and other data collection activities specific to the individual projects are not provided in this document but are included in the respective monitoring plans and work plans developed for the individual projects.
The purpose of this manual is to document the specific procedures to be used while performing groundwater and surface water sampling and other field data collection activities at the Topock site. The focus of this document is field data collection activities currently being implemented at the site and anticipated future field data collection activities. This manual does not attempt to compile and document procedures used in the past during data collection and investigation activities beginning in the 1980s at the Topock site.
The remainder of this manual is organized as follows:
• Section 2.0 provides background information about the Topock site.
• Section 3.0 identifies the various data collection projects currently being conducted or planned at the Topock site and a brief summary of each project.
• Section 4.0 summarizes the water quality sampling, analysis, and monitoring procedures that apply to groundwater and surface water monitoring and investigations.
• Section 5.0 summarizes the well drilling, installation, data collection, and field methods and procedures associated with groundwater and hydrogeologic investigations.

TOPOCK FIELD PROCEDURES MANUAL REVISION 01, 3/31/2005 1.0 INTRODUCTION
SFO\FIELDPROCEDURES_REVISION1.DOC 1-2
• Section 6.0 summarizes the methods and procedures for hydraulic data collection and aquifer testing.
• References are included in Section 7.0.
Standard operating procedures (SOPs) applicable to each of the various projects are provided in the following appendices to this manual:
• Appendix A: SOPs for Water Quality Sampling and Analysis
• Appendix B: SOPs for Hydrogeologic Investigations
• Appendix C: SOPs for Hydraulic Data Collection and Aquifer Testing
Two companion documents, a Quality Assurance Project Plan (QAPP) and a Health and Safety Plan (HSP), have previously been prepared to support the laboratory analyses and field sampling activities, respectively. The QAPP was submitted to DTSC as Appendix B of the July 2004 Sampling and Analysis Plan (SAP) (CH2M HILL 2004a), and the HSP was submitted as a stand-alone document in June 2004 (CH2M HILL 2004b). A revised QAPP is provided as Appendix D of this document.

SFO\FIELDPROCEDURES_REVISION1.DOC 2-1
2.0 Site Background
The PG&E Topock Compressor Station is used to compress natural gas so that it can be transported through pipelines to PG&E's customers in northern and central California. The Station is located in eastern San Bernardino County about 15 miles southeast of the City of Needles, California, and sits just south of Interstate 40, one-half mile west of the Colorado River (Figure 2-1). The station is surrounded by federal land, including the United States Fish and Wildlife Service's Havasu National Wildlife Refuge and lands managed by the United States Bureau of Land Management.
RCRA corrective action activities at the Topock site began in 1996 upon execution of the CACA. Five phases of the RFI fieldwork have been completed to date, including the installation of over 50 groundwater monitoring wells (including approximately 15 sets of vertical cluster wells) to investigate the horizontal and vertical extent of constituents of potential concern in groundwater. A groundwater and surface water monitoring program has been implemented at the Topock site since 1997. Data from years of environmental investigations and groundwater monitoring indicate that the affected groundwater extends northeast from the Topock Station under adjacent federal lands.
In addition to RFI activities, DTSC is directing PG&E in taking actions, called Interim Measures (IM), pursuant to Section IV.A of the CACA. IM activities were initiated in March 2004 and include groundwater extraction and management. The objective of the IM is hydraulic control to maintain a net landward groundwater gradient. Long-term cleanup options for the site are also being evaluated and will be summarized in a Corrective Measures Study, which will be evaluated by stakeholder agencies and the public before a final cleanup plan is implemented.
The DTSC is the lead agency responsible for oversight of RCRA corrective action activities being conducted at the Topock Compressor Station. DTSC and PG&E are working in a collaborative process with interested agencies through the Topock Consultative Work Group, constituted under California’s site designation process.
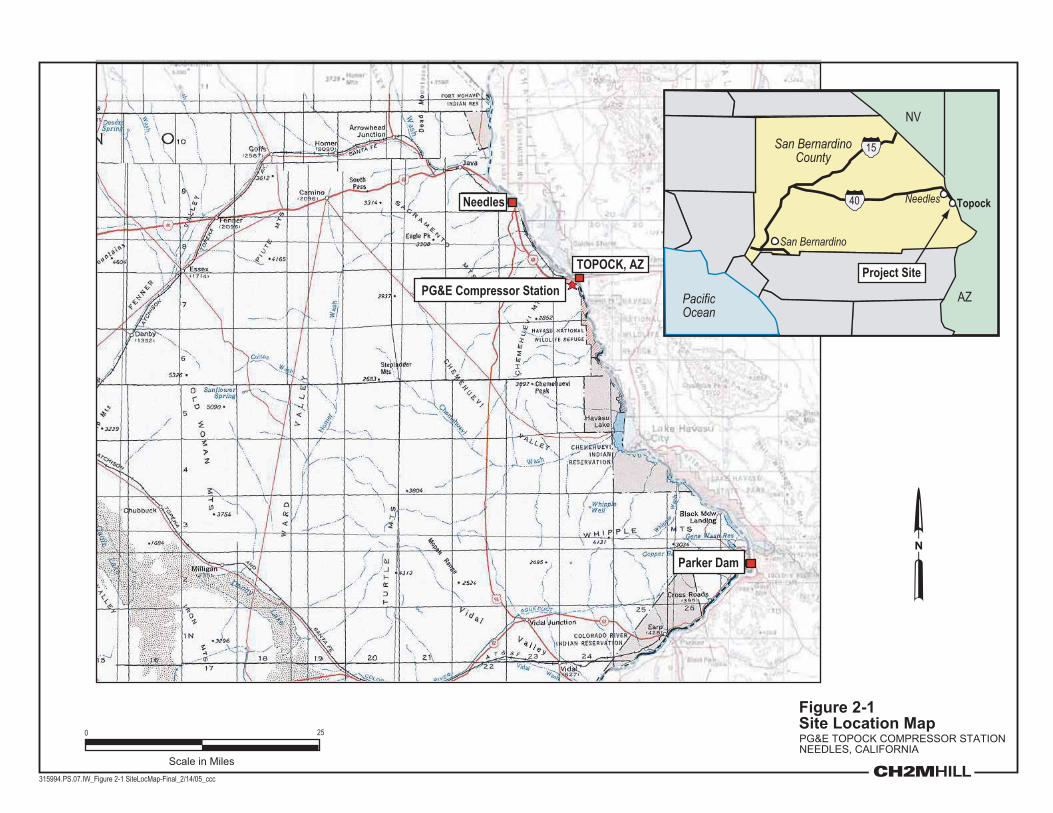
Figure 2-1Site Location Map
315994.PS.07.IW_Figure 2-1 SiteLocMap-Final_2/14/05_ccc
PG&E Compressor Station
TOPOCK, AZ
Needles
Parker Dam
San Bernardino
Needles Topock
San BernardinoCounty
40
15
NV
AZPacificOcean
Project Site
0 25
Scale in Miles
PG&E TOPOCK COMPRESSOR STATIONNEEDLES, CALIFORNIA

SFO\FIELDPROCEDURES_REVISION1.DOC 3-1
3.0 Summary of Data Collection Projects
This section identifies the various data collection projects currently being conducted or planned at the Topock site and summarizes the data collection activities associated with each project. Detail on the locations, frequency, and rationale for field investigation and other data collection activities specific to the individual projects are not provided in this document but are included in the monitoring plans and work plans for the individual projects.
3.1 Groundwater and Surface Water Monitoring Program Routine groundwater and surface water monitoring activities were initiated at the Topock site in 1998 and continue today. The program initially consisted of quarterly sampling of the groundwater monitoring wells and surface water stations developed during the RFI and periodic sampling of inactive supply wells. In late 2003 and early 2004, the sampling frequencies were increased in selected monitoring wells in the Colorado River floodplain.
The current groundwater and surface water monitoring program (GMP) sampling and water quality monitoring activities are performed in accordance with the Sampling and Analysis Plan, Groundwater and Surface Water Monitoring dated July 14, 2004 (CH2M HILL 2004a). This document outlines the locations, frequencies, and analytical methods for sampling and analysis under the routine groundwater and surface water monitoring program. This document is currently being revised to incorporate modifications requested by DTSC in its January 25, 2005 letter.
As proposed, the groundwater monitoring program consists of: (1) biweekly sampling of four selected floodplain wells; (2) monthly monitoring of 24 selected wells near the Colorado River and nine surface water locations; (3) quarterly monitoring of 54 wells, one off-site supply well, and nine surface water locations; (4) annual monitoring of two wells located upgradient of Bat Cave Wash and one test well; and (5) biannual monitoring of two water supply wells.
During January and February 2005, new groundwater monitoring wells were installed in the floodplain area of the site under the IM program. In late February 2005, biweekly sampling of selected floodplain monitoring wells and river sampling locations was changed to weekly sampling at the request of DTSC (DTSC 2005d).
3.2 Background Metals Groundwater Investigation PG&E is currently implementing a study of background metals concentrations in groundwater in the vicinity of the Topock site. The Draft Work Plan for Assessing Background Metals Concentrations in Groundwater dated June 30, 2004 (CH2M HILL 2004c) identifies the process for selecting and evaluating potential background wells in the vicinity of the Topock site, describes the sampling frequency and analytical methods for the background study, and discusses methods to be used to calculate and evaluate background concentrations of
TOPOCK FIELD PROCEDURES MANUAL REVISION 01, 3/31/2005 3.0 SUMMARY OF DATA COLLECTION PROJECTS
SFO\FIELDPROCEDURES_REVISION1.DOC 3-2
metals in groundwater. Groundwater samples are proposed to be collected during six bimonthly sampling events from pre-selected wells in the area that exhibit similar groundwater geochemistry to that at the Topock site. Wells to be sampled as part of the background study will include on-site monitoring wells and off-site supply wells located in both California and Arizona.
3.3 Interim Measures Hydrogeologic and Groundwater Investigations
As part of the IM currently being implanted at the Topock site, PG&E is conducting additional hydrogeologic investigations for further plume delineation and to support remediation activities. Monitoring wells or well locations were installed at eight locations between March and May 2004 as part of the IM program (sometimes referred to as IM Phase 1 drilling), and these wells have subsequently been incorporated into the routine groundwater monitoring program for the site. Based on information collected from these Phase 1 wells, additional data gaps have been identified, and additional well installation is proposed (IM Phase 2 drilling).
The Phase 2 drilling program was initiated on January 26, 2005 and is being conducted in accordance with the Phase 2 Monitoring Well Installation Work Plan dated January 31, 2005 (CH2M HILL 2005a). The Phase 2 drilling program involves the installation of monitoring wells or monitoring well clusters at five locations on the western floodplain of the Colorado River, between January and February 2005. Field activities include drilling and core logging, groundwater sampling, monitoring well construction, well development, and geophysical logging. Additional step-out or contingency wells may be installed, depending on the results of the Phase 2 field activities. If construction of contingency wells is deemed necessary, then the specifications and associated monitoring protocols will be addressed in a subsequent work plan. The monitoring wells installed during the Phase 2 drilling program will eventually be incorporated into the routine groundwater monitoring program for the site.
3.4 Interim Measures Groundwater Pumping and Hydraulic Containment
The IM currently being implemented at the Topock site involves groundwater extraction, groundwater treatment, and management of treated groundwater. These activities commenced in March 2004 and continue to date. The IM activities are being conducted as described in the Draft Interim Measures Work Plan, dated February 2004 (CH2M HILL 2004d); the Interim Measures Work Plan Number 2 (CH2M HILL 2004e) and its addenda (CH2M HILL 2004f), both dated March 2004; and the Batch Treatment Work Plan dated April 2004 (CH2M HILL 2004dg. Performance of the IM is being evaluated based on the criteria outlined in DTSC’s letter Criteria for Evaluating Interim Measures Performance Requirements to Hydraulically Contain Chromium Plume in the Floodplain Area, Pacific Gas and Electric Company, Topock Compressor Station (DTSC 2005e). Ongoing field data collection activities associated with the IM performance monitoring include collection of water level information, using pressure transducers in monitoring wells and river monitoring stations, and sampling of

TOPOCK FIELD PROCEDURES MANUAL REVISION 01, 3/31/2005 3.0 SUMMARY OF DATA COLLECTION PROJECTS
SFO\FIELDPROCEDURES_REVISION1.DOC 3-3
effluent from the treatment system. Performance monitoring activities will be addressed in the forthcoming Interim Measure Floodplain Monitoring Plan and Interim Measure Extraction System Operation and Maintenance Plan.
3.5 Compliance Monitoring for Expanded Interim Measures Groundwater Remediation
Planned IM activities at the Topock site include the installation and operation of a subsurface injection system as a proposed water management option for treated groundwater. Waste Discharge Requirements Order No. R7-2004-0103 adopted by the California Regional Water Quality Control Board Colorado River Basin Region regulates the injection system design and implementation.
The proposed injection system includes a network of injection wells, observation wells, and compliance wells that will be used to monitor changes in water levels and water quality in the immediate vicinity of the injection wells. The injection wells and observation wells were installed between November 2004 and December 2004, in accordance with the Final Work Plan for Injection Well Installation on Parcel Number 650-151-06, Interim Measures No. 3, dated November 15, 2004 (CH2M HILL 2004h). The compliance wells were installed between January 2005 and February 2005 in accordance with the Final Design Plan for Groundwater Compliance Monitoring, Interim Measures No. 3, Pacific Gas and Electric Company, Topock Project, dated January 5, 2005 (CH2M HILL 2005b). Field activities involved with installation of the injection wells, observation wells, and compliance wells included drilling and installation, well development, geophysical and spinner logging, hydraulic testing, and groundwater sampling. Pursuant to Waste Discharge Requirements Order No. R7-2004-0103, the forthcoming Compliance Monitoring Plan will be prepared prior to the startup of the injection system and will describe the data collection associated with monitoring compliance of the injection system.
SFO\FIELDPROCEDURES_REVISION1.DOC 4-1
4.0 Water Quality Sampling, Analysis, and Monitoring Procedures
This section provides a list of necessary pre-sampling activities including field equipment and calibration requirements. It also provides details of water-quality field activities, including monitoring well purging and sampling, surface water sampling, equipment decontamination procedures, and investigation-derived waste management. To supplement this section, detailed SOPs for major field tasks are included in Appendix A.
4.1 Pre-sampling Activities Pre-sampling activities consist of coordination with the analytical laboratory, a review of previous sampling data, and a kick-off meeting to discuss the specific scope of work to be accomplished during each sampling event. It also includes the acquisition of all required field supplies and the inspection and calibration of field instruments.
4.1.1 Field Event Planning Prior to each field sampling event, the Field Team Manager (FTM) will coordinate the organization of the field team and preparations for field activities. The FTM or Chemist will contact the analytical laboratory to notify the laboratory of the pending sampling, arrange for the delivery of the appropriate type and number sample containers, and coordinate courier service for the pickup and delivery of the collected samples. The FTM will also prepare, in spreadsheet format, a detailed event-specific sampling and analysis plan that documents the locations to be sampled, required analyses, and other pertinent sampling information. The FTM will distribute the event-specific sampling and analysis plan and copies of previous sampling logs to each field team member. All necessary parties (e.g., PG&E station personnel, the Park Moabi Ranger, and other private well owners) will be contacted prior to sampling.
The FTM will also facilitate a pre-field planning meeting prior to each sampling event. The purpose of the planning meeting will be to ensure that field team members understand the specific scope of work to be accomplished during the field effort. Specific roles and responsibilities for each field team member will also be addressed during this meeting. The FTM will ensure that all field team members have read this Procedures Manual and have signed the Employee Signoff Form acknowledging that they have read the manual (Table 4-1).

TOPOCK FIELD PROCEDURES MANUAL REVISION 01, 3/31/2005 4.0 WATER QUALITY SAMPLING, ANALYSIS, AND MONITORING PROCEDURES
SFO\FIELDPROCEDURES_REVISION1.DOC 4-2
TABLE 4-1 Employee Signoff Form Draft Report Sampling, Analysis, and Field Procedures Manual, PG&E Topock Program
EMPLOYEE SIGNOFF FORM Procedures Manual
The CH2M HILL project employees and subcontractors listed below have been provided with a copy of this manual, have read and understood it, and agree to abide by its provisions.
Project Name: Project Number:
EMPLOYEE NAME
(Please print) EMPLOYEE SIGNATURE COMPANY DATE
TOPOCK FIELD PROCEDURES MANUAL REVISION 01, 3/31/2005 4.0 WATER QUALITY SAMPLING, ANALYSIS, AND MONITORING PROCEDURES
SFO\FIELDPROCEDURES_REVISION1.DOC 4-3
4.1.2 Field Supplies The following is a list of the primary field supplies that are required for sampling activities. Additional field supplies may be required depending on the exact scope, nature, and duration of the sampling event. It is the responsibility of the FTM or designee to ensure that the field team is equipped with all appropriate supplies.
4.1.2.1 Documents • SAP/Work plan, QAPP, and HSP
• This Procedures Manual
• Sampling logs from previous event(s) and well construction logs from the location if sampled before, or from nearby locations if not sampled before
• Blank sampling log forms
• Sample labels
• Chain-of-Custody forms
• Field logbook
4.1.2.2 Supplies • Sample containers
• Coolers and ice
• Container for purge water
• Decontamination equipment (e.g., deionized water, buckets, spray bottles, brushes, Alconox, etc.)
• Personal protective equipment (PPE), HSP equipment (refer to HSP for specific requirements), and first-aid kit
• Tool kit
• Miscellaneous field supplies (e.g., waterproof pens, paper towels, plastic bags, etc.)
4.1.2.3 Instruments Field instruments required for sampling activities consist of:
• Water level indicator (Heron or equivalent)
• Flow-through water quality meter (Horiba U-22 or equivalent)
• Turbidity meter (Hach 2100-P or equivalent)
• Sampling device (bailer, portable pump, and power supply if needed)
If possible, dedicated field instruments should be employed for monitoring activities. Prior to use, field instruments must be inspected and calibrated.
TOPOCK FIELD PROCEDURES MANUAL REVISION 01, 3/31/2005 4.0 WATER QUALITY SAMPLING, ANALYSIS, AND MONITORING PROCEDURES
SFO\FIELDPROCEDURES_REVISION1.DOC 4-4
4.2 Analytical Parameters and Methods for Water Quality Sampling
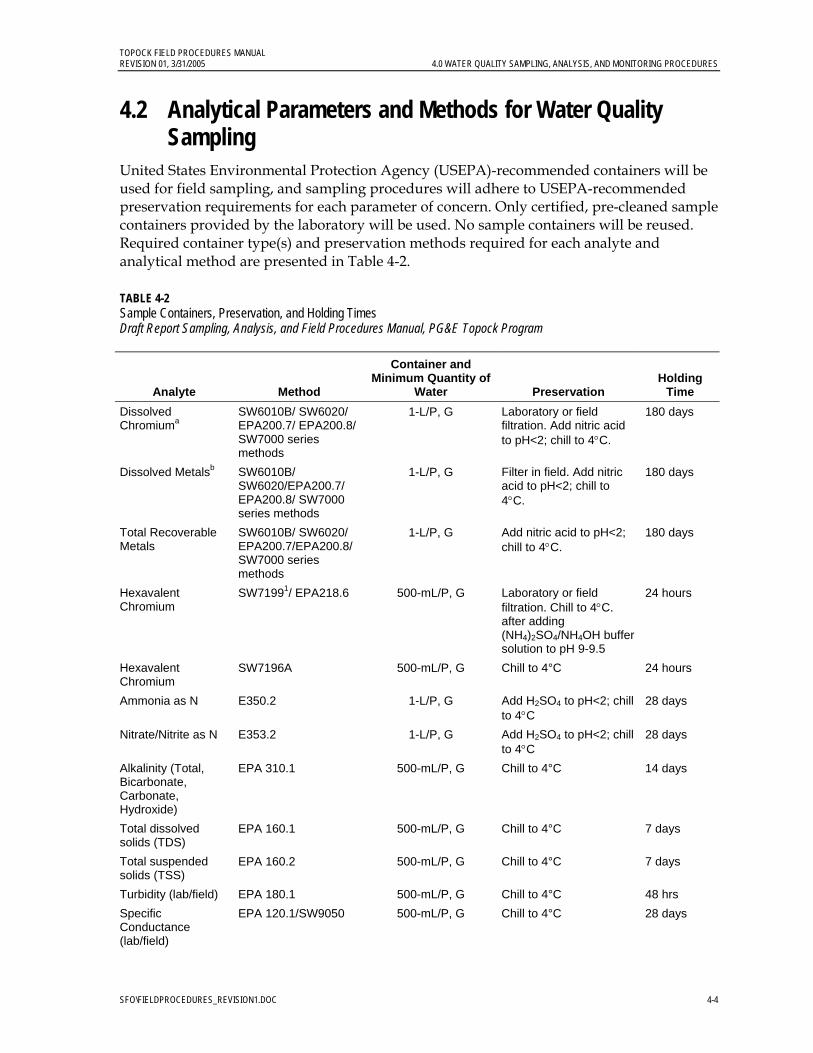
United States Environmental Protection Agency (USEPA)-recommended containers will be used for field sampling, and sampling procedures will adhere to USEPA-recommended preservation requirements for each parameter of concern. Only certified, pre-cleaned sample containers provided by the laboratory will be used. No sample containers will be reused. Required container type(s) and preservation methods required for each analyte and analytical method are presented in Table 4-2.
TABLE 4-2 Sample Containers, Preservation, and Holding Times Draft Report Sampling, Analysis, and Field Procedures Manual, PG&E Topock Program
Analyte Method
Container and Minimum Quantity of
Water Preservation Holding
Time Dissolved Chromiuma
SW6010B/ SW6020/ EPA200.7/ EPA200.8/ SW7000 series methods
1-L/P, G Laboratory or field filtration. Add nitric acid to pH<2; chill to 4°C.
180 days
Dissolved Metalsb SW6010B/ SW6020/EPA200.7/ EPA200.8/ SW7000 series methods
1-L/P, G Filter in field. Add nitric acid to pH<2; chill to 4°C.
180 days
Total Recoverable Metals
SW6010B/ SW6020/ EPA200.7/EPA200.8/ SW7000 series methods
1-L/P, G Add nitric acid to pH<2; chill to 4°C.
180 days
Hexavalent Chromium
SW71991/ EPA218.6 500-mL/P, G Laboratory or field filtration. Chill to 4°C. after adding (NH4)2SO4/NH4OH buffer solution to pH 9-9.5
24 hours
Hexavalent Chromium
SW7196A 500-mL/P, G Chill to 4°C 24 hours
Ammonia as N E350.2 1-L/P, G Add H2SO4 to pH<2; chill to 4°C
28 days
Nitrate/Nitrite as N E353.2 1-L/P, G Add H2SO4 to pH<2; chill to 4°C
28 days
Alkalinity (Total, Bicarbonate, Carbonate, Hydroxide)
EPA 310.1 500-mL/P, G Chill to 4°C 14 days
Total dissolved solids (TDS)
EPA 160.1 500-mL/P, G Chill to 4°C 7 days
Total suspended solids (TSS)
EPA 160.2 500-mL/P, G Chill to 4°C 7 days
Turbidity (lab/field) EPA 180.1 500-mL/P, G Chill to 4°C 48 hrs Specific Conductance (lab/field)
EPA 120.1/SW9050 500-mL/P, G Chill to 4°C 28 days
TOPOCK FIELD PROCEDURES MANUAL REVISION 01, 3/31/2005 4.0 WATER QUALITY SAMPLING, ANALYSIS, AND MONITORING PROCEDURES
SFO\FIELDPROCEDURES_REVISION1.DOC 4-5
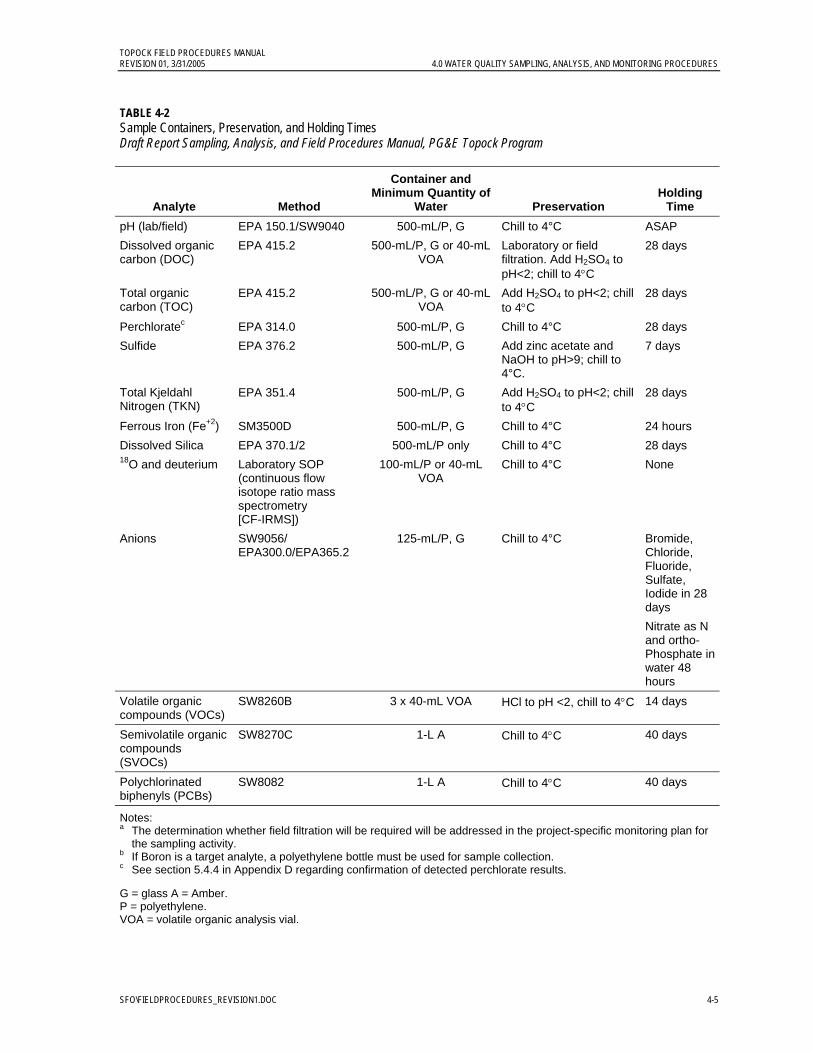
TABLE 4-2 Sample Containers, Preservation, and Holding Times Draft Report Sampling, Analysis, and Field Procedures Manual, PG&E Topock Program
Analyte Method
Container and Minimum Quantity of
Water Preservation Holding
Time pH (lab/field) EPA 150.1/SW9040 500-mL/P, G Chill to 4°C ASAP Dissolved organic carbon (DOC)
EPA 415.2 500-mL/P, G or 40-mL VOA
Laboratory or field filtration. Add H2SO4 to pH<2; chill to 4°C
28 days
Total organic carbon (TOC)
EPA 415.2 500-mL/P, G or 40-mL VOA
Add H2SO4 to pH<2; chill to 4°C
28 days
Perchloratec EPA 314.0 500-mL/P, G Chill to 4°C 28 days Sulfide EPA 376.2 500-mL/P, G Add zinc acetate and
NaOH to pH>9; chill to 4°C.
7 days
Total Kjeldahl Nitrogen (TKN)
EPA 351.4 500-mL/P, G Add H2SO4 to pH<2; chill to 4°C
28 days
Ferrous Iron (Fe+2) SM3500D 500-mL/P, G Chill to 4°C 24 hours Dissolved Silica EPA 370.1/2 500-mL/P only Chill to 4°C 28 days 18O and deuterium Laboratory SOP
(continuous flow isotope ratio mass spectrometry [CF-IRMS])
100-mL/P or 40-mL VOA
Chill to 4°C None
Anions SW9056/ EPA300.0/EPA365.2
125-mL/P, G Chill to 4°C Bromide, Chloride, Fluoride, Sulfate, Iodide in 28 days Nitrate as N and ortho-Phosphate in water 48 hours
Volatile organic compounds (VOCs)
SW8260B 3 x 40-mL VOA HCl to pH <2, chill to 4°C 14 days
Semivolatile organic compounds (SVOCs)
SW8270C 1-L A Chill to 4°C 40 days
Polychlorinated biphenyls (PCBs)
SW8082 1-L A Chill to 4°C 40 days
Notes: a The determination whether field filtration will be required will be addressed in the project-specific monitoring plan for
the sampling activity. b If Boron is a target analyte, a polyethylene bottle must be used for sample collection. c See section 5.4.4 in Appendix D regarding confirmation of detected perchlorate results.
G = glass A = Amber. P = polyethylene. VOA = volatile organic analysis vial.
TOPOCK FIELD PROCEDURES MANUAL REVISION 01, 3/31/2005 4.0 WATER QUALITY SAMPLING, ANALYSIS, AND MONITORING PROCEDURES
SFO\FIELDPROCEDURES_REVISION1.DOC 4-6
4.3 Sampling Methods and Procedures for Groundwater Wells At the Topock site, groundwater samples are collected from monitoring and extraction wells installed as part of the site investigation and remediation program and from existing active and inactive water supply wells in the area. The majority of the wells are conventional monitoring wells constructed of 2-inch and 4-inch-diameter polyvinyl chloride (PVC) casing. However, several new well clusters constructed with 1-inch-diameter casing were installed at the Topock site in 2004.
Due to construction and configuration differences, the sampling of each type of well requires different sampling procedures. This section describes the general sampling procedures that are applicable to all groundwater wells. Specific SOPs for each type of groundwater well are provided in Appendix A:
• SOP-A1, Purging and Sampling of Groundwater Monitoring Wells • SOP-A2, Purging and Sampling of 1-inch-diameter Monitoring Wells • SOP-A3, Purging and Sampling of Active and Inactive Water Supply Wells
Many of the monitoring and extraction wells at the site are equipped with pressure transducers for the continuous recording of water levels within the well. On occasion, to facilitate manual water level measurements, purging, and sampling, the transducer must be temporarily removed from the well. Following completion of sampling activities, the transducer must be placed back into the well in the exact same position and depth from which it was removed. Detailed procedures for transducer handling are provided in SOP-C1, Temporary Removal and Replacement of Pressure Transducers (Appendix C).
4.3.1 Well Purging and Field Parameters All on-site monitoring wells and inactive water supply wells will be purged prior to sampling to ensure that stagnant water present in the well and well screen interval is removed and that collected samples are representative of aquifer conditions. Water quality parameters will be recorded during purging as described in Section 4.8.
Where portable sampling equipment is used, wells will be sampled in order of least to most impacted. Based on the most recent chromium concentration data, wells that were non-detect will be sampled first, followed by wells with trace detections. Wells with the highest detections of chromium will be sampled last.
Flow rate is a function of pump capability and drawdown characteristics of the well. When a well is sampled for the first time, drawdown effects of pumping between 1 and 3 gallons per minute will be evaluated. A maximum purge rate between 1 and 3 gallons per minute will be assigned for the well, based on water remaining above the top of screen and less than 5 percent of the water column height drawdown. Therefore, previous sampling logs and/or historic data tables should be consulted for purge rate when available.
In high-yield wells (wells that exhibit 80-percent recovery in less than 2 hours), purging will be conducted at a flow rate sufficient to remove water from the entire screened interval of the well. However, the purge rate should be low enough so that substantial drawdown in the well does not occur during purging. Substantial drawdown is defined as 5 percent of the
TOPOCK FIELD PROCEDURES MANUAL REVISION 01, 3/31/2005 4.0 WATER QUALITY SAMPLING, ANALYSIS, AND MONITORING PROCEDURES
SFO\FIELDPROCEDURES_REVISION1.DOC 4-7
water column or the top of the screened interval. Purging will consist of the removal of a minimum of three casing volumes of water.
For low-yield wells (those that exhibit less than 80-percent recovery in less than 2 hours), one casing volume of water shall be removed. If pump capability allows, the well will be purged at a rate of less than 1 gallon per minute. The well will then be allowed to recover to 80 percent and sampled within 24 hours of purging.
Purging of the inactive supply wells will be accomplished using the dedicated pumps installed in these wells, or if dedicated equipment is not present or nonfunctional a portable pump may be used for purging and sampling. SOP-A3, Purging and Sampling of Active and Inactive Water Supply Wells (Appendix A), describes the procedures for all three sampling scenarios. Because active water supply wells are being pumped on an almost continuous basis, purging of these wells is not necessary.
Sample acquisition shall occur immediately following purging. Decrease the discharge rate to reduce water turbulence at the pump discharge point. A flow rate of 75 milliliters per minute is recommended for sampling of volatile compounds. Details regarding field filtration of metals samples are provided in Section 4.6. Samples shall be collected by transferring water directly from the sampling port/pump outlet to the appropriate sample container(s). If a duplicate sample is to be collected at a location, all bottles designated for a particular analysis for both duplicates will be filled sequentially before bottles for another analysis are filled. For example, duplicate samples will be taken sequentially for metals, followed by duplicate samples taken sequentially for semivolatiles.
Samples will be collected and containerized according to the volatility of the target analytes. Vials for volatile components will be filled first to minimize aeration of water in the well. All vials for volatile components should have already been provided with a preservative in them by the subcontractor laboratory. The vials will be filled directly from the tap. Each vial will be inverted and checked for air bubbles to ensure zero headspace. If a pea-size or larger air bubble appears, the vial contents will be emptied into the container used to measure purge volumes, the vial discarded, and a new sample will be collected. As appropriate, the preferred collection order will be volatile organic compounds, semivolatile organic compound, metals (including hexavalent chromium [Cr(VI)] and total chromium [Cr(T)]), then general chemistry (cations, anions, stable isotopes). Samples from water supply wells for metals analyses will be filtered in the field for the background study but will not be filtered in the laboratory or field for the GMP.
4.4 Sampling Methods and Procedures for Surface Water There are currently nine surface water sampling locations under the PG&E Topock program. The goal of surface water grab sampling is to collect a flowing, representative surface water sample. At locations RRB and I-3 samples are collected using a disposable bailer and directly filling the sample bottles. At all other locations, samples are collected using a surface water sampling pole, which is extended as far as possible in a safe manner, approximately 4 feet from the shoreline and the sample collected approximately 6 inches below the surface. Sampling containers are filled from the sampling bottle attached to the sampling pole. Detailed protocols for surface water sampling are provided in SOP-A4,
TOPOCK FIELD PROCEDURES MANUAL REVISION 01, 3/31/2005 4.0 WATER QUALITY SAMPLING, ANALYSIS, AND MONITORING PROCEDURES
SFO\FIELDPROCEDURES_REVISION1.DOC 4-8
Surface Water Sampling (Appendix A). The procedures for surface water sampling may be modified in the future based on data quality objectives determined in the Monitoring Plan for Groundwater and Surface Water (to be completed in April 2005) and subsequent DTSC comments.
Currently, all surface water locations are located using a site map and samples are collected from the most direct (north or east, respectively) position from the access route to the shoreline. During the Spring/Summer of 2005 the use of resource grade GPS units will be phased into the surface water sampling program. Initially, all locations will be defined with coordinates; thereafter locations will be located using defined GPS coordinates.
4.5 Groundwater Sampling from Boreholes During Drilling During drilling operations, groundwater samples are often collected from open boreholes using a pump sampling system (i.e., Isoflow), where available, or a bailer. Unlike completed wells, a mandated purge volume and parameter stabilization are not appropriate for an open borehole. Purging is complete when all drilling fluids have been removed from the borehole. Detailed protocols for collecting groundwater samples from a borehole are provided in SOP-A5, Groundwater Sampling from Sonic Drilling Boreholes.
4.6 Field Filtration of Groundwater Samples Currently, for on-site characterization activities (i.e. GMP), samples for Cr(VI) and Cr(T) are sent to the laboratory unpreserved and unfiltered. Filtration followed by preservation is performed in the laboratory within 12 hours of sample collection, prior to analysis. However, to evaluate whether field filtration may be preferable to laboratory filtration for quality assurance, a test plan to compare field versus laboratory filtration was submitted to DTSC February 7, 2005 (CH2M HILL 2005c). Because the groundwater matrix is highly variable over the site area, and Cr(VI) concentrations vary spatially and temporally, a carefully planned and implemented comparative test is necessary to ensure the integrity of long-term data and the achievement of data quality objectives. The proposed field filtering and sample preservation procedures for use in the comparative test are presented as SOP-A6, Sample Field Filtration and Preservation for Metals Analyses (Appendix A).
On-site sampling activities for the purpose of defining the site conceptual model, specifically samples collected for all metals except Cr(VI) and Cr(T) (pending comparative filtration test results evaluation), will be field filtered and preserved as needed. Samples collected for the background study will be field filtered. Overall, the determination to field filter and preserve samples for Cr(VI) and Cr(T) will be made on a project-by-project basis.
4.7 Water Level Measurements, Wells and Surface Water Groundwater level measurements will be taken prior to purging using an electronic water level indicator (Heron or equivalent) in monitoring wells, extraction wells, and inactive supply wells. However, due to their construction and near constant operation, groundwater levels measurements will not be obtained from active supply wells. Depth to water will be measured from the marking on the well casing or, if no marking exists, from the north side

TOPOCK FIELD PROCEDURES MANUAL REVISION 01, 3/31/2005 4.0 WATER QUALITY SAMPLING, ANALYSIS, AND MONITORING PROCEDURES
SFO\FIELDPROCEDURES_REVISION1.DOC 4-9
of the well casing. Water level elevations will be recorded in the field sampling logs at the time of the measurement. Detailed protocols for the collection of water level measurements are provided in SOP-A7, Water Level Measurements (Appendix A).
After use, water level meters will be decontaminated in accordance with SOP-A10, Decontamination of Water Sampling Equipment. Following final decontamination at the end of a sampling event, the water level meter will be labeled to reflect such. During equipment inspection for an event, if the water level meter is not tagged/labeled as decontaminated, the team member will proceed with decontamination prior to use. During a sampling event, all decontamination procedures will be documented in the field book. If the field book does not reflect decontamination prior to use, the field team member will proceed with decontamination prior to use.
There are three Colorado River sampling locations where water level elevation measurements will be recorded: RRB, A-Dock, and I-3. Water level measurements will be recorded using an electronic water level indicator (Heron or equivalent). At RRB, water level measurement will be taken at the surveyed point identified with an “X” on the bridge. Water level elevation is recorded from the 4-foot water level mark on the water level elevation pole at A-Dock. At I-3, there is a bolt and washer in the metal bridge; water level is recorded from the base of the washer as seen in SOP-A4 Surface Water Sampling (Appendix A). Water level elevations will be recorded in the field sampling logs at the time of the measurement.
4.8 Water Quality Field Measurements and Calibration Purge water samples will be evaluated in the field using the Horiba U-22 flow-through water quality meter for temperature, specific conductivity, oxidation reduction potential (ORP), pH, and dissolved oxygen as described in SOP-A8, Field Water Quality Measurements Using a Flow-through Cell. In addition, the following SOPs in Appendix A provide sampling-specific information:
• SOP-A1, Purging and Sampling of Groundwater Monitoring Wells • SOP-A2, Purging and Sampling of 1-inch-diameter Monitoring Wells • SOP-A3, Purging and Sampling of Active and Inactive Water Supply Wells • SOP-A4, Surface Water Sampling • SOP-A5, Groundwater Sampling from Boreholes During Drilling
The Hach turbidity meter will be used to monitor turbidity. The Orion ORP meter will be used to evaluate ORP and pH as a backup instrument should there be calibration issues with the Horiba. At least four to six readings will be recorded every 3 minutes during the purging process. Purging will be considered complete when three casing volumes of water have been removed from the well, and three consecutive field parameter measurements stabilize within prescribed limits. However, in some instances field parameters may not stabilize within prescribed ranges, and the FTM may sample based on an evaluation of historical field data from the location in question.
Because active water supply wells are being pumped almost continuously, purging of these wells is not necessary. Field parameters will be measured by filling a clean bucket from the

TOPOCK FIELD PROCEDURES MANUAL REVISION 01, 3/31/2005 4.0 WATER QUALITY SAMPLING, ANALYSIS, AND MONITORING PROCEDURES
SFO\FIELDPROCEDURES_REVISION1.DOC 4-10
sampling port and placing the Horiba and Orion meter probes into the bucket. The Hach turbidity meter sampling vial is filled directly from the sampling port.
Surface water field parameters are collected at each sample location by placing all necessary probes in a bucket. The bucket is filled with Colorado River water collected 6 to 12 inches below surface using a bailer or by directly filling the bucket. Where possible (all locations except RRB), flowing water is sampled and collected for field parameters.
Prior to sampling, all field instruments must be inspected and calibrated. Each instrument will be inspected to ensure that it is working properly. Any damage that affects the proper operation or safe use of the instrument will be logged in the field notebook, and the instrument will be tagged so that it is not inadvertently used and removed from the equipment inventory until it has been properly repaired. Each field instrument will also be calibrated prior to use. Calibration will be in accordance with procedures and schedules by the manufacturer. Calibration results logged in the field book and/or the calibration log for that specific instrument. Any instrument “drift” from prior calibration should also be recorded in the field notebook or log. Additional details regarding procedures for instrument calibration are presented in SOP-A9, Calibration of Field Instruments (Appendix A).
Calibrated equipment will be uniquely identified by using either the manufacturer’s serial number or other means. The results of calibrations and records of repairs will be recorded in a logbook or on the calibration form.
Scheduled periodic calibration of testing equipment does not relieve field personnel of the responsibility of employing properly functioning equipment. If an individual suspects an equipment malfunction, the device shall be removed from service, tagged so that it is not inadvertently used, and the appropriate personnel notified so that a re-calibration can be performed or a substitute piece of equipment can be obtained. Results of activities performed using equipment that has failed re-calibration will be evaluated. If the activity results are adversely affected, the results of the evaluation will be documented and the FTM will be notified.
4.9 Water Sample Handling, Documentation, and Shipment The following section describes field activities and sample documentation procedures applicable to groundwater and surface water sampling under the Topock program. Appropriate chain-of-custody procedures to be followed through collection, transfer, analysis, and disposal to ensure the integrity of the samples is maintained, are described in Section 4.2 of the QAPP (Appendix D). Likewise, sample packaging and transportation is described in Section 4.3 of the QAPP.
Field notes for sampling activities may consist of logbooks, chain of custody forms, pre-printed sampling forms and photographs. All sampling activities will be recorded in a bound field notebook. Entries must be dated, legible, written in permanent ink, and contain accurate and inclusive documentation of project activities. Language should be objective and factual. Entries must include (if applicable):
TOPOCK FIELD PROCEDURES MANUAL REVISION 01, 3/31/2005 4.0 WATER QUALITY SAMPLING, ANALYSIS, AND MONITORING PROCEDURES
SFO\FIELDPROCEDURES_REVISION1.DOC 4-11
• Names of all personnel.
• Names of all site visitors/observers.
• General description of weather conditions.
• Location of each sampling point.
• Date and time of sample collection.
• Legible corrections, which will be single lines through the error, signed and dated by the person making the correction.
• Observations of sampling procedure.
• Reference to any photographs taken.
• Field observations and descriptions of problems encountered or changes made to the original plan.
• Field instruments calibration information.
During the collection of each sample, a field logbook or sampling form will record:
• Sample location and description (sketch and measured distances from reference points will be recorded if there is no established identification for the sample location).
• Sample identification.
• Sampler’s name.
• Date and time of sampling.
• Sample designation as composite or grab.
• Sample matrix.
• Type and identification of sampling equipment used.
• Field measurement data (pH, temperature, conductivity, etc.).
• Field observations that may be relevant to the analysis or sample integrity (odor, color, weather conditions, etc.).
• Associated quality control samples.
• Preservative used.
• Field instrument serial number(s).
To prevent sample misidentification, a label will be permanently affixed to each sample container. Sample labels should be sufficiently durable to remain legible even when wet and should be filled in using waterproof ink. Sample labels should contain, at a minimum:
• Sample identification number. • Name or initials of collector.
TOPOCK FIELD PROCEDURES MANUAL REVISION 01, 3/31/2005 4.0 WATER QUALITY SAMPLING, ANALYSIS, AND MONITORING PROCEDURES
SFO\FIELDPROCEDURES_REVISION1.DOC 4-12
• Date and time of collection. • Location of collection. • Parameters requested (if space permits).
Sampling nomenclature is as follows:
• Regular samples are named by their Location ID followed by the sampling event number for each sampling program (i.e., -026 for the 26th sampling event conducted by CH2M HILL).
• Field duplicates are identified with MW-90, MW-91, etc. followed by the sampling event number, as locations designated with 90-series numbers do not exist at this site.
• Equipment blanks are identified by the well number sampled prior to decontamination and equipment blank sampling, followed by -EB, followed by the sampling event number.
4.10 Well Inspection and Maintenance Monitoring wells will be inspected (condition of well casing, well lock, markings, standing water at surface, etc.) each time the wells are sampled. Information will be recorded on Page 3 of the field sampling form (SOP-A1, Purging and Sampling of Groundwater Monitoring Wells, Appendix A). If possible, the field crew will implement corrective action prior to demobilizing from the site for the sampling event (i.e., replace lock, remark well identification, etc.). Documentation will be reviewed following the field sampling event, and necessary corrective action will be implemented in a timely fashion, based on the severity of the field well conditions.
Every 2 years, at a minimum, the total depth of monitoring wells will be measured. Total well depth will be measured to the nearest 0.1 foot from the marking on the casing, or if no marking exists, from the north side. If more than 10 percent of the screened interval is blocked by sediment, the well will be redeveloped. Likewise, if the performance of a well changes, the reason for the change will be evaluated and appropriate action will be taken. Appropriate corrective actions will be implemented based on the severity of the field well conditions. Total depth measurements will be made in accordance with SOP-A11, Total Depth Measurements.
4.11 Water Quality Sampling Equipment Decontamination All field equipment used during sampling that is not dedicated to one well or sampling location will be decontaminated to prevent cross-contamination following SOP-A10, Decontamination of Water Sampling Equipment. All field and sampling equipment that may contact samples must be decontaminated after each use.
The minimum decontamination procedure for sampling equipment will consist of:
• Wash the equipment with non-phosphate detergent. • Rinse the equipment with deionized or distilled water.
TOPOCK FIELD PROCEDURES MANUAL REVISION 01, 3/31/2005 4.0 WATER QUALITY SAMPLING, ANALYSIS, AND MONITORING PROCEDURES
SFO\FIELDPROCEDURES_REVISION1.DOC 4-13
Equipment will be protected from dust and allowed to air-dry. Decontaminated equipment will not be allowed to touch contaminated surfaces. The equipment will be labeled as decontaminated with the decontamination date included on the label. All decontamination waste media must be collected, stored, and transported in approved containers.
4.12 Water Quality Sampling Investigation-derived Waste Different types of potentially-contaminated investigation-derived waste (IDW) will be generated during groundwater and surface water sampling efforts. These may include:
• Used PPE. • Disposable sampling equipment. • Decontamination fluids. • Purged groundwater and excess groundwater collected for sample container filling.
Used PPE and disposable equipment will be double-bagged and placed in a municipal refuse dumpster at the compressor station. These wastes are not considered hazardous and can be sent to a municipal landfill. Any PPE and disposable equipment that is to be disposed of that could still be reused will be rendered inoperable before disposal in the refuse dumpster.
Decontamination fluids that will be generated in the sampling event will consist of purge water and decontamination water (deionized water, residual contaminants, and water with non-phosphate detergent). For the GMP, fluids will be contained on the sampling vehicle until the end of the day when the water shall be transferred to an on-site wastewater storage tank. The wastewater is then managed and disposed of by PG&E following the compressor station’s waste management and off-site disposal procedures. For the background study, purge water is not expected to be contaminated and therefore will not require disposal as waste. For active and inactive water supply wells, well owner holding tanks will be filled with purge water where possible. If this is not possible, arrangements will be made with the well owner for discharge of the water to the ground at the property. IDW management for other Topock projects is detailed in the project-specific work plan or SAP.
4.13 Quality Control Procedures Quality control procedures will be implemented for both field activities and laboratory work. Detailed descriptions of quality control procedures are also provided in the QAPP (Appendix D).
Audits of field activities will be performed during various sampling events to evaluate the execution of field tasks, including the instrument calibrations, collection of field data, field documentation, and chain-of-custody procedures. The audit will be performed to evaluate the extent of adherence to this SAP, SOPs, and the QAPP. The results of the audit will be used to identify any deficiencies in the sampling program and develop corrective actions (if necessary).
Field documents pertaining to sample identification and control will be reviewed for completeness and accuracy. Field notebooks and logs will be reviewed to verify that the
TOPOCK FIELD PROCEDURES MANUAL REVISION 01, 3/31/2005 4.0 WATER QUALITY SAMPLING, ANALYSIS, AND MONITORING PROCEDURES
SFO\FIELDPROCEDURES_REVISION1.DOC 4-14
contents are legible, contain accurate and complete documentation of sampling activities, and that all entries are dated and signed. Sampling and chain-of-custody procedures will be checked to ensure that established sampling protocols are being followed, the appropriate samples are being collected, the proper containers and preservatives are being used, proper sampling packaging and shipment protocols are being followed, and proper chain-of-custody procedures are being maintained.
Field measurements will be evaluated by checking the field instruments for proper calibration and frequency of calibration. Procedures for obtaining measurements will also be reviewed to ensure that established protocols or SOPs are being followed.
The field audit will be performed by the Project Chemist, the Project Manager, or designee. At a minimum, field audits will be performed twice per year. The results of the field audits will be summarized and appropriate corrective action implemented within 4 weeks of the audit.
4.13.1 Field Quality Control Samples Field quality control samples will be collected to monitor accuracy, precision, and the presence of field contamination in the laboratory. Field quality control sample types and corresponding frequency of collection are described in Section 3.2 of the QAPP (Appendix D).
4.13.2 Data Validation The analytical results of groundwater and surface water samples will be evaluated to verify whether the data are sufficiently accurate, precise, and representative of site conditions for decision-making purposes in support of ongoing site investigation and remediation activities. Details regarding data validation for the Topock GMP are provided in the QAPP (Appendix D).
4.14 Field Variances As conditions in the field may vary, it may become necessary to implement minor modifications to the sampling procedures as presented in this SAP. Prior to varying from established procedures, the field team lead or FTM will notify the Project Manager and/or Project Chemist of the proposed modification and reason for the modification. Implementation of any modifications will not be made until at least verbal approval has been obtained. Any variances or modifications to procedures in the approved SAP will be documented in the field notes, sampling logs, and in the sampling project report.
SFO\FIELDPROCEDURES_REVISION1.DOC 5-1
5.0 Hydrogeologic Investigation Methods and Procedures
This section provides a list of activity and equipment procedures for drilling, soil sampling, and the installation of monitoring wells, extraction wells and injection wells. These procedures are described in detail in Appendix B. Other procedures that also apply to tasks described in this section are cited for reference from Appendix A and Appendix C.
5.1 Drilling and Well Installation Drilling and well installation will be conducted in accordance with approved work plans, and will meet two primary objectives:
• Collect geologic data from the borehole to meet work plan requirements. • Install and develop wells that meet design specifications.
Drilling, monitoring well installation, and development procedures are described in detail in SOP B-1,General Guidance for Monitoring Well Installation and Development in Appendix B.
5.1.1 Preparation Activities The minimum preparations to be completed before beginning a drilling and well installation task will consist of:
• Agency-approved work plan in place.
• Site utility clearance performed by Underground Service Alert and also by private locator where appropriate.
• Permits in place: San Bernardino County well permits, necessary encroachment permits, and biological and cultural resources agencies’ approval for site access.
• Field sampling plan or SAP and/or field instructions prepared and reviewed with field staff and project manager.
• HSP prepared and orientation provided for CH2M HILL and subcontractor staff.
5.1.2 Field Activities Monitoring wells are installed using truck-mounted or all-terrain drilling rigs, depending on access to the drilling site and the need to minimize land impacts. Sonic drilling methods were employed for 2004 to 2005 drilling operations to collect continuous core. Other drilling methods may be employed for future drilling efforts if these methods are appropriate to the work plan objectives. Typically, the deep borehole at a new monitoring well location is used for soil or groundwater sampling and logging and provides geologic data for screen selection at that location. Sections 5.2 and 5.3 discuss these requirements further. During the 2004 to 2005 drilling programs, the regulatory agencies (DTSC, Regional Water Quality

TOPOCK FIELD PROCEDURES MANUAL REVISION 01, 3/31/2005 5.0 HYDROGEOLOGIC INVESTIGATION METHODS AND PROCEDURES
SFO\FIELDPROCEDURES_REVISION1.DOC 5-2
Control Board, Arizona Department of Environmental Quality) were consulted by phone to review field data for concurrence on monitoring well screen selection.
Monitoring wells are typically installed with 20-foot screens and are constructed of 2-inch Schedule 40 PVC. Well construction is recorded on a CH2M HILL well completion form. Well construction details are recorded in the field note book and include:
• Depth below ground surface to bottom of well, top and bottom of screen, top and bottom of filter pack, top of transition sand, top of annular space seal, and centralizer locations.
• Materials used for well construction (screen and casing, filter sand, transition sand, bentonite chips or pellets, grout, and surface completion).
• Dimensions of the completed well including total depth measured from top of PVC casing.
Monitoring wells are developed by surging, bailing and pumping. Groundwater quality indicator parameters are measured during development using a flow-through cell and recorded on a development log.
5.2 Soil and Core Description and Logging The logging and description of soil cuttings, soil samples and core samples is done in accordance with SOP B-2, Soil Classification and Logging Procedures. Logging is performed to meet the requirements of the:
• HSP, • work plan, and • task SAP or field instructions.
Logging also follows the references listed in SOP B-2, including ASTM D 2488, CH2M HILL soil boring log forms, Munsell soil color chart.
Logging of soil samples follows ASTM D2488 with additional geologic description. The rounding and lithology of clasts is logged to distinguish alluvial and fluvial sediments. More rounded clasts with diverse provenance indicate fluvial deposition associated with the Colorado River. Subrounded to subangular clasts limited in provenance to the meta-igneous rocks of the Chemehuevi Mountains indicate alluvial fan deposits. The percent sand, gravel, and fines are estimated and recorded at a minimum 5-foot interval and more frequently at changes in soil properties.
5.3 Core and Subsurface Soil Sampling Core sampling and soil sampling from boreholes are performed according to SOP B-3, Borehole Sampling and Logging of Soil Borings in Appendix B. Other SOPs cited there will also apply. The preparation for subsurface soil sampling includes the:
• Work plan, SAP, field instructions, and appropriate SOPs. • Materials for sample preservation, shipment, and archiving.

TOPOCK FIELD PROCEDURES MANUAL REVISION 01, 3/31/2005 5.0 HYDROGEOLOGIC INVESTIGATION METHODS AND PROCEDURES
SFO\FIELDPROCEDURES_REVISION1.DOC 5-3
• Field log book, chain of custody forms, and sample log.
The management of core samples required for special analyses is critical. Core for anaerobic preservation will be handled to minimize exposure to the atmosphere. A nitrogen preservation system may be used to purge ambient air from anaerobic core samples during collection and sealing in Protectacore sleeves. Core for archiving that will be sealed in Protectacore oxygen barrier sleeves will be handled in a manner that minimizes disaggregation and headspace.
5.4 Geotechnical Data Collection Geotechnical sampling may be conducted in addition to the physical grain size sampling and core preservation. Since geotechnical sampling will be event-specific, it is critical to follow the task-specific work plan for the design task that requires geotechnical sampling. Field preparation will include review of sampling plan or field instructions with the geotechnical engineer for the task.
5.5 Wireline Geophysical Logging Geophysical logs may be run in the deep borehole or well at new drilling locations. Geophysical logs are run as ‘cased-hole logs’ in completed PVC monitoring wells, or as ‘open-hole logs’ in mud rotary open boreholes. Detailed procedures for geophysical logs are presented in SOP B-12, Wireline Geophysical Logging in Appendix B.
Cased-hole logs are typically run the deep well at a monitoring well cluster and include induction and natural gamma-ray logs. The geophysical logger should be provided the following information before running logs:
• Well ID and total depth. • Location of centralizers if present. • Static water level.
Open-hole logs are run in open boreholes drilled by mud-rotary methods. The logs may be run in pilot boreholes of smaller diameter than the reamed bore that is used for well installation or in the reamed bore prior to well installation. Coordination of geophysical logging in a reamed borehole is critical to minimize drilling standby and the resulting changes in mud properties or mud penetration into the aquifer formation. In addition to borehole depth and water level, the geophysical logger needs to be informed of mud properties before logging open boreholes. The suite of logs that can be run in an open borehole is not constrained by the presence of a well casing. Typical open borehole logs could include any of the following, based on data collection objectives:
• Long and short resistivity. • Natural gamma-ray. • Lateral-log or other focused induction logs. • Caliper, with borehole drift if four-arm caliper is used. • Sonic.
Video logs may be run for inspection of completed extraction or injection wells.
TOPOCK FIELD PROCEDURES MANUAL REVISION 01, 3/31/2005 5.0 HYDROGEOLOGIC INVESTIGATION METHODS AND PROCEDURES
SFO\FIELDPROCEDURES_REVISION1.DOC 5-4
5.6 Well Development The objective of well development is to remove fines and establish a hydraulic connection with the formation. A secondary goal of well development is to gather specific capacity data for newly-completed wells. Well development procedures are outlined in SOP B-1, General Guidance for Monitoring Well Installation and Development and SOP B-13, Extraction Well Installation and Development in Appendix B. Well development requires coordination with the driller and with laboratories if groundwater samples are collected. Extraction or injection well development may have a level of effort similar to well installation, and it is critical that the project hydrogeologist is consulted for review of field instructions before beginning work.
Well development activities will typically follow this sequence:
• Measure static water level and well total depth.
• Surge the well with bailer (monitoring well) or surge block (large-diameter well).
• Bail the well to remove fines.
• Pumping development (monitoring wells, with water quality parameters measured and recorded).
• Add dispersant and follow with airlift development (large-diameter wells).
• Pumping development of larger wells with water quality parameters measured and recorded.
• Aquifer testing or water quality sampling to follow development (step tests, spinner tests, constant rate pumping tests).
Well development at new locations may include groundwater quality sampling. Well development may be completed with a short duration constant rate or step discharge aquifer test using procedures adapted from Section 6.0 and Appendix C.
5.7 Well Surveying Well locations and elevations will be surveyed after completion to provide precise map coordinates and water level measuring point elevations. SOP B-8, Well Surveying in Appendix B provides detailed procedures.
5.8 Decontamination of Drilling Equipment Drilling and sampling equipment will be decontaminated following the procedures in SOP B-5, Decontamination of Personnel and Equipment, Well Drilling and Subsurface Sampling and Investigations in Appendix B. The project HSP will direct the personnel PPE and decontamination requirements.
TOPOCK FIELD PROCEDURES MANUAL REVISION 01, 3/31/2005 5.0 HYDROGEOLOGIC INVESTIGATION METHODS AND PROCEDURES
SFO\FIELDPROCEDURES_REVISION1.DOC 5-5
5.9 Investigation-derived Waste IDW will be managed following SOP B-6, Disposal of Waste Fluids and Solids in Appendix B. IDW will be stored in approved staging areas. Soil cuttings will be stored in lined containers, and IDW water will be stored in phase-separator bins or frac tanks. IDW will be sampled to characterize and profile representative waste streams for manifesting and disposal. Denbeste Transportation, Inc., under their disposal contract with PG&E, supported IDW manifesting and disposal for 2004 site investigations.
SFO\FIELDPROCEDURES_REVISION1.DOC 6-1
6.0 Hydraulic Data Collection and Aquifer Testing
6.1 Transducer Maintenance Transducer maintenance consists of routine and periodic inspection and maintenance. Routine inspection and maintenance should be conducted during all routine visits to a well by a member of the transducer team (typically biweekly). Periodic inspection and maintenance should be conducted at specified intervals.
6.1.1 Routine Inspections and Maintenance Following are general procedures for performing routine transducer inspections and maintenance.
1. After accessing a well, ensure the hanger and transducer are hanging freely (e.g., not caught up, obstructed or otherwise prevented from hanging in the lower-most position on the hanger bracket). Also ensure the hanger bracket is seated flush on the PVC well casing.
2. Before and/or after connecting to the transducer, ensure the cable cap is securely fastened to prevent moisture from entering the vented cable.
3. After connecting to the transducer, observe and take note of the memory and battery capacity remaining. Any values less than 25 percent should be immediately reported and discussed with the FTM. MiniTroll and Troll 9000 batteries can be replaced in the field (detailed in transducer manuals), but the transducer must be removed and the test must be stopped to remove the batteries. Discuss the condition of the transducer with the FTM before undertaking the battery replacement.
4. While still connected to the transducer, ensure the current test is running and that no error codes are noted on the screen (e.g., ABEND for abnormal end of test).
5. If the transducer has been recently moved, a forced reading of the parameter PRESSURE should yield a value between 0 and the pressure range of the transducer. Transducer pressure ranges are typically 15 or 30 pounds per square inch (psi) and are noted on the main screen. An exception is the multi-parameter Troll 9000, which has a 100 psi range. The conversion from psi to feet of fresh water is 2.309 psi per foot of water.
6.1.2 Periodic Inspections and Maintenance Following are general procedures for performing routine transducer inspections and maintenance:
TOPOCK FIELD PROCEDURES MANUAL REVISION 01, 3/31/2005 6.0 HYDRAULIC DATA COLLECTION AND AQUIFER TESTING
SFO\FIELDPROCEDURES_REVISION1.DOC 6-2
1. Desiccant cartridges are located in the cable connector of each transducer. The capsules should be inspected quarterly to ensure the desiccant has not been exhausted. If the desiccant is exhausted, replace with a new cartridge.
2. Annually, each transducer should be removed from the well and a pressure reading taken with the transducer open to the atmosphere. Transducers should read 0 psi plus or minus the accuracy of the transducer. Deviations from the specifications should be reported to the FTM and will likely result in removal of the transducer for factory inspection and calibration. For example:
• 15 psi transducer should read 0 +/- 0.0075 psi. • 30 psi transducer should read 0 +/- 0.015 psi.
3. Biannually, transducers should be removed and returned to the factory for inspection and re-calibration. A replacement transducer will be required while the transducer is at the factory.
6.2 Spinner Logging Well installation and maintenance at the Topock site may require periodic spinner logging to assess production rates from various zones in the wells, provide injection and production profiles and vertical distribution of water quality in the well. Spinner logging, also commonly referred to as flowmeter logging, is performed under dynamic pumping conditions. When used in conjunction with depth-specific sampling, spinner logging may be performed to evaluate changes in water quality flowing into the well at various production intervals.
Spinner logging is conducted by a qualified geophysical logging specialist contracted by CH2M HILL. The logging specialist is required to provide all the temporary and permanent materials, equipment, and labor to perform the spinner survey. The following is a brief summary of how the work is executed. A more detailed description is presented in SOP C-5, Spinner Logging in Appendix C.
6.2.1 Procedure Following are general procedures for performing spinner logging on production and injection wells at the Topock site.
1. Spinner logging shall be conducted while the well is pumping at its typical discharge rate. The logs shall be provided at two vertical scales: 50 feet to 1 inch and 20 feet to 1 inch. The horizontal scale shall be approved by the CH2M HILL field representative. All data shall be recorded digitally.
2. The spinner logs shall be run in the presence of a CH2M HILL representative and results, including three field copies of each log, provided to the CH2M HILL representative immediately after completion. In addition to the field copies, the logging specialist shall provide CH2M HILL with:
• Five final copies of each geophysical log. • Digital ASCII files of all geophysical data on a compact disc. • Digital PDF files of all geophysical data on compact disc.

TOPOCK FIELD PROCEDURES MANUAL REVISION 01, 3/31/2005 6.0 HYDRAULIC DATA COLLECTION AND AQUIFER TESTING
SFO\FIELDPROCEDURES_REVISION1.DOC 6-3
3. The spinner logs may be obtained during dynamic pumping conditions. The surveys should take place to the total depth of the well. Both continuous traverse and stationary flowmeter logs should be obtained. Three downward continuous traverse logs should be made at different line speeds. The line speeds will be selected by a CH2M HILL representative but will most likely be 30 feet per minute, 60 feet per minute, and 90 feet per minute. Stop counts may be requested by the CH2M HILL FTM.
4. The spinner tool will use a magnetorestrictive counter or other nonmechanical device to sense rotation. The tool shall be capable of sensing flow rates between 0.25 feet per second to 10 feet per second in an 18-inch straight pipe. Time-drive recording shall be provided for stationary mode operations. To the degree practicable, the flowmeter too shall be centralized in the casing and well screen during all operations.
5. Dynamic spinner logging s best performed while the well is pumping at its typical discharge rate and frequency. Water levels in nearby wells should be monitored during the spinner-flowmeter logging to determine if water levels near the pumping well change due to this testing and to gain additional aquifer property data. However, this test assumes that the well pumps continuously for a period of time sufficient for collection of all the data. If the current well pumps in frequent on/off cycles, it may be necessary to bypass the existing distribution system and discharge the well water to another location in order to pump the well continuously for the required amount of time.
6. The spinner logging equipment shall be equipped with a line speed indicator capable of indicating variations in line speed of 10 percent. Variations in speed beyond 10 percent will invalidate the test.
6.3 Step-drawdown and Constant-rate Testing Following construction of new production and/or injection wells at the Topock site, it is necessary to perform step-drawdown and constant-rate testing to evaluate well performance and aquifer properties. Following is a summary of these testing procedures. A more detailed description is presented in SOP C-6, Aquifer and Step Testing in Appendix C.
6.3.1 Step-drawdown Test A step-drawdown test is conducted on newly installed production wells to assess their efficiency. Tests are typically conducted in advance of a constant rate aquifer test. The test also allows for a “shakedown” period before starting the final constant rate test. During this period, adjustments are made to the pump, discharge pipes, flow meters, and pressure transducers to ensure accurate data is recorded during the constant-rate test. The results of a step-drawdown test will show:
• Overall well performance.
• The optimum pumping rate and pump-setting depth.
• The maximum anticipated drawdown.
• The volume of water produced at specific engine (pump) speeds and drawdown.

TOPOCK FIELD PROCEDURES MANUAL REVISION 01, 3/31/2005 6.0 HYDRAULIC DATA COLLECTION AND AQUIFER TESTING
SFO\FIELDPROCEDURES_REVISION1.DOC 6-4
• Whether observation wells are located so that they exhibit sufficient drawdown prior to produce usable data.
During step-drawdown testing, the well is pumped at several successively higher pumping rates over an 8-hour period. Up to four pumping steps lasting up to 2 hours may be used. Final step rates and lengths are determined by the lead hydrogeologist on-site during test operation.
Discharge rates will be carefully monitored using a flow meter on the discharge line and recorded at regular intervals. Drawdown is recorded in the production well at intervals recommended by the lead hydrogeologist. Water levels are recorded every 15 minutes in monitoring wells located in the vicinity of the production well. Regularly-spaced measurements are recorded using pressure transducers and confirmed with periodic manual tape readings.
After step-drawdown testing, the water level in the aquifer is allowed to return to static (pre-test) conditions before starting the constant-rate test.
6.3.2 Constant-rate Test After it has been determined that water levels have recovered to static conditions from any previous pumping or injection activities, a constant-rate drawdown test may be performed on a production/injection well. Results from the test will yield information that can be used to assess:
• Aquifer properties such as transmissivity, hydraulic conductivity, and storativity. • Zone of effective hydraulic capture. • Spacing and withdrawal rates of extraction wells.
A constant-rate test consists of pumping a production or injections well at a constant rate for a period of time (typically 8 to 48 hours) and monitoring water levels in the pumping well and surrounding monitoring wells. Discharge rates are carefully monitored using the flow meter on the discharge line and recorded at regular intervals. Water levels are recorded at logarithmic intervals in the production well and regularly-spaced intervals in surrounding monitoring wells using down-hole pressure transducers. These readings are verified by periodic manual tape readings.
6.3.2.1 Recovery Test Once the test pump in the production well is shut off following the constant rate test, water levels in the monitoring wells and test well will start to recover to pre-test conditions. The rise in water level is termed residual drawdown. Measurement of residual drawdown during the recovery period allows the transmissivity of the aquifer to be calculated, providing an independent check on results of the constant rate test.
Residual drawdown will be measured logarithmic time intervals in the same fashion as described above for measuring water level response during constant-rate testing. Water levels are monitored until they have recovered to pre-constant-rate test conditions.
TOPOCK FIELD PROCEDURES MANUAL REVISION 01, 3/31/2005 6.0 HYDRAULIC DATA COLLECTION AND AQUIFER TESTING
SFO\FIELDPROCEDURES_REVISION1.DOC 6-5
6.3.3 Data Analysis and Reporting Measurements collected during aquifer testing field activities are used to assess aquifer properties such as transmissivity, hydraulic conductivity, and storativity. Hydraulic boundaries such as barriers to flow and interference pumping may also be evaluated from the data. Analysis consists of performing standard analytical methods to assess the aquifer properties. After an approximation of aquifer properties has been made, analytical and numerical modeling may be used to further refine estimates of aquifer properties.
SFO\FIELDPROCEDURES_REVISION1.DOC
7.0 References
California Department of Toxic Substances Control (DTSC). 1996. Corrective Action Consent Agreement: Pacific Gas and Electric Company's Topock Compressor Station, Needles, California. EPA ID No. CAT080011729. February 26.
__________. 2005a. Letter re: Sampling and Analysis Plan, Groundwater and Surface Water Monitoring, dated July 14, 2004, Pacific Gas and Electric Company, Topock Compressor Station, Needles California (EPA ID No. CAT080011729). January 25.
__________. 2005b. Letter re: Conditional Approval of Sampling, Analysis, and Field Procedures Manual, dated February 11, 2005, Pacific Gas and Electric Company, Topock Compressor Station, Needles California (EPA ID No. CAT080011729). March 4.
__________. 2005c. Letter re: Observations of Groundwater and Surface Water Sampling Activities, Pacific Gas and Electric Company, Topock Compressor Station, Needles California (EPA ID No. CAT080011729). March 16.
__________. 2005d. Letter re: Response to Elevated Levels of Hexavalent and Total Chromium Concentrations Reported in Newly Installed Monitoring Well MW-34-100 at Pacific Gas and Electric Company, Topock Compressor Station, Needles, Calidfornia (EPA ID No. CAT080011729). February 16.
__________. 2005e. Letter re: Criteria for Evaluating Interim Measures Performance Requirements to Hydraulically Contain Chromium Plume in the Floodplain Area, Pacific Gas and Electric Company, Topock Compressor Station Needles California (EPA ID No. CAT080011729). February 14.
CH2M HILL. 2004a. Sampling and Analysis Plan, Groundwater and Surface Water Monitoring. July 14.
__________. 2004b. Health and Safety Plan, PG&E Topock Project. Revision 4. June.
__________. 2004c. Draft Work Plan for Assessing Background Metals Concentrations in Groundwater, PG&E Topock Compressor Station and Vicinity, Needles California. June 30.
__________. 2004d. Draft Interim Measures Work Plan, Topock Compressor Station. February.
__________. 2004e. Interim Measures Workplan Number 2, Topock Compressor Station, Needles, California. March 2.
__________. 2004f. Addenda to Interim Measures Workplan No. 2, Topock Compressor Station, Needles, California. March 1.
__________. 2004g. Batch Treatment Work Plan, Topock Compressor Station, Needles, California. April 30.
SFO\FIELDPROCEDURES_REVISION1.DOC
__________. 2004h. Final Work Plan for Injection Well Installation on Parcel Number 650-151-06, Interim Measures No. 3, Pacific Gas and Electric Company, Topock Project. November 15.
__________. 2005a. Phase 2 Monitoring Well Installation Work Plan, PG&E Topock Compressor Station, Needles, California. January 31.
__________. 2005b. Final Design Plan for Groundwater Compliance Monitoring, Interim Measures No. 3, Pacific Gas and Electric Company, Topock Project. January 5.
__________. 2005c. Work Plan for Chromium Sample Filtration Comparison Test, Pacific Gas and Electric Company, Topock Project. February 7.

SFO\FIELDPROCEDURES_REVISION1.DOC
Appendix A Standard Operating Procedures for Water
Quality Investigation and Monitoring Activities
TOPOCK FIELD PROCEDURES MANUAL SOP-A1, REVISION 03, 3/31/2005
SOP-A1 GW_MW_PANDS_REV3.DOC 1 OF 4
SOP-A1
Purging and Sampling of Groundwater Monitoring Wells Well-Volume Method
Standard Operating Procedures for PG&E Topock Program
This standard operating procedure (SOP) addresses the procedures and equipment to be used for purging and sampling all groundwater monitoring wells at the Topock site with casing diameters in excess of 1-inch. This SOP should be used for sampling groundwater monitoring wells using an electric submersible pump with a single discharge rate dedicated pump, a dedicated electric pump with a controllable discharge rate, and a portable electric pump with a controllable discharge rate. A well-volume based purging and sampling method will be used for these wells.
REQUIRED DOCUMENTS
1) Event-specific sampling and analysis plan (SAP).
2) Applicable project work plan or monitoring plan. Refer to Topock Program Sampling, Analysis, and Field Procedures Manual and QAPP (Procedures Manual), as required.
3) Topock Program Health and Safety Plan (HSP)
4) Well construction logs/specifications
5) Previous sampling logs or tabular historic field data
6) Blank sampling logs and field notebook
PREPARATION & SETUP
1) Review event-specific SAP or event-specific field instructions, previous sampling logs, Procedures Manual, and HSP.
2) Initiate field logbook for sampling activity.
3) Inspect all equipment and verify that the field water quality (WQ) meters have been calibrated prior to use according to SOP-A9, Calibration of Field Instruments.
4) Inventory sample bottles, required analyses, and confirm the lab courier schedule.
5) Field-check and setup sampling equipment: water level (WL) meter, WQ meters, flow-through cell, pump control and power supply, pump discharge/sampling tubing, etc.
6) Open well protection lid and measure initial static WL according to SOP-A7, Water level Measurements. Record WL value on sampling log.
7) If well is equipped with a transducer, remove transducer from the well according to SOP-C1, Temporary Removal and Replacement of Transducers.
8) If well is not equipped with a dedicated sampling system, install a decontaminated pump at the same intake/sampling depth used in prior events and record intake depth.
TOPOCK FIELD PROCEDURES MANUAL SOP-A1, REVISION 03, 3/31/2005
SOP-A1 GW_MW_PANDS_REV3.DOC 2 OF 4
If the well has not been previously sampled, install the pump with the intake 15 feet below the static water column, or at the depth prescribed by the PM or FTM.
PURGING AND SAMPLING PROCEDURES
9) Prepare groundwater sampling log (use attached form dated February 2005).
10) Use the water level determined in Step 6 above and the total depth provided in the field sampling plan to evaluate the column of standing water in the well, as described on the Topock Groundwater Sampling Log sheet.
11) Calculate 3-casing volumes.
12) Evaluate previous purge rates, amount of drawdown, and purge volume prior to sample collection from previous sampling records and historical data tables (see July 2004 SAP Table 3-2, or Appendix B of Monitoring Plan for Groundwater and Surface Water Monitoring Program [currently in preparation]). If the well has not been previously sampled, estimate the expected purge parameters using previous sampling information from nearby wells. Start purging, measure WL, and calculate purge rate.
13) Continue purging and measuring WL, and field indicator parameters every 3 minutes at minimum. Decrease the purge rate and measure/record new purge rate if significant drawdown is observed. Significant drawdown is considered to be 5 percent of the total height of the water column or to the top of screen. Record time for all measurements collected. Note and provide qualifying remarks if parameter readings are anomalous or unstable due to instrument problem.
14) Observations on sample appearance and clarity during purging and at sampling are required. For standardization, use a glass jar or clear plastic bottle to collect and record observations of discharge water appearance during purging. Also note characteristics of any odors associated with discharge.
15) Continue purging until 3-casing volumes have been purged and field parameters stabilize. Field parameters should be measured at intervals no less than 3 minutes apart or no less than the time frame for a complete exchange of water in the flow-through cell. Indicator parameters are considered stabilized when 3 consecutive readings made several minutes apart fall within the following EPA stabilization criteria:
• pH +/- 0.1 pH units • Specific conductance +/- 3% • ORP +/- 10 millivolts • Turbidity +/- 10% NTU units (when turbidity is >10 NTUs) • Dissolved oxygen +/- 0.3 mg/L
• Temperature +/- 2º Celsius
16) Collect samples for analyses according to event-specific SAP. For all samples, decrease the discharge rate to reduce water turbulence at the pump discharge point. Prepare sample containers and collect gas-sensitive analytes first. The preferred collection order will be volatile organic compounds (VOCs), semi-volatile organic compound (SVOCs), metals (including hexavalent chromium [Cr(VI)] and total chromium [Cr(T)]; see SOP-A6), then general chemistry (cations, anions, stable isotopes). Sample containers are to be

TOPOCK FIELD PROCEDURES MANUAL SOP-A1, REVISION 03, 3/31/2005
SOP-A1 GW_MW_PANDS_REV3.DOC 3 OF 4
filled by transferring water directly from the pump discharge to the appropriate sample container.
17) Record sample information, final WL, and purge volume data on field log.
18) If well was equipped with a transducer, replace transducer according to SOP-C1, Temporary Removal and Replacement of Transducers.
19) Close and secure well protection lid.
20) Follow Procedures Manual for sample handing and management, equipment decontamination, and investigation-derived waste (IDW) management.
LOW VOLUME AND POOR RECOVERY WELLS
Some groundwater monitoring wells under the GMP may exhibit slow or poor recovery upon purging. These groundwater monitoring wells may not recover sufficiently during purging and run completely dry without an opportunity to collect the required series of groundwater stabilization parameters, or run dry prior to sampling. The following procedures should be followed for collection representative groundwater samples from wells that go dry during purging activities in preparation for groundwater sampling.
PREPARATION & SETUP
Follow steps 1 through 8 as above and evaluate the volume of water to be discharged prior to the groundwater monitoring well going dry, if known.
PURGING AND SAMPLING PROCEDURES FOR LOW RECOVERY WELLS
9) Prepare groundwater sampling log (use attached form dated February 2005).
10) Use the water level determined in Step 6 above and the total depth measurement from the field sampling table to evaluate the column of standing water in the well as described on the Topock Groundwater Sampling Log sheet.
11) Calculate 3-casing volumes.
12) Evaluate previous purge rates, amount of drawdown, and purge volume prior to sample collection from previous sampling records and historical data tables (see July 2004 SAP Table 3-2, or Appendix B of Monitoring Plan for Groundwater and Surface Water Monitoring Program [currently in preparation]). If the well has not been previously sampled, estimate the expected purge parameters using previous sampling information from nearby wells. Start purging at a rate of less than one gallon per minute if the pump capacity allows. Measure WL, and calculate purge rate.
13) Continue purging and measuring WL, and field indicator parameters every 3 minutes at minimum. Record time for all measurements collected. Note and provide qualifying remarks if parameter readings are anomalous or unstable due to instrument problem.
14) Observations on sample appearance and clarity during purging and at sampling are required. For standardization, use a glass jar or clear plastic bottle to collect and record
TOPOCK FIELD PROCEDURES MANUAL SOP-A1, REVISION 03, 3/31/2005
SOP-A1 GW_MW_PANDS_REV3.DOC 4 OF 4
observations of discharge water appearance during purging. Also note characteristics of any odors associated with discharge.
15) Continue purging until 3-casing volumes have been purged and field parameters stabilize, or until the well is purged dry. Field parameters should be measured at intervals no less than 3 minutes apart or no less than the time frame for a complete exchange of water in the flow-through cell. If the well purges dry during the observation period, immediately shut off the pump and collect a final set of water quality parameters (ph, specific conductance, ORP, turbidity, dissolved oxygen, and temperature).
16) Record the final water level, note the time, the volume of water discharged and the elapsed time for the complete discharge of the well.
17) Allow the well to recharge to 80 percent of the original height of the water column. Ideally, this should be the following day within 24 hours of the groundwater monitoring well being purged dry. The recovery period to achieve 80 percent of the height of the water column could take longer than 24 hours in some instances. Calculate the volume of water in the well and volume of water needed to fill all of the sample containers. Initiate procedures for the well sampling. Begin to slowly purge the well and collect at least one set of water quality parameters prior to filling the sample containers. Collect samples for analyses according to event-specific SAP. Prepare sample containers and collect gas-sensitive analytes first. The preferred collection order will be volatile organic compounds (VOCs), semi-volatile organic compound (SVOCs), metals (including hexavalent chromium [Cr(VI)] and total chromium [Cr(T)]), then general chemistry (cations, anions, stable isotopes). If an insufficient volume of water will be generated to fill all of the sample containers, prioritize the sample collection to obtain the critical analytes for the main COCs first, then continue collecting samples until the groundwater supply is exhausted. Verify the critical analyte list with the PM or the FTM. Sample containers are to be filled by transferring water directly from the pump discharge to the appropriate sample container.
18) Record sample information, final WL, and purge volume data on field log.
19) If well was equipped with a transducer, replace transducer according to SOP-C1, Temporary Removal and Replacement of Transducers.
20) Close and secure well protection lid.
21) Follow Procedures Manual for sample handing and management, equipment decontamination, and IDW management.

Topock Groundwater Sampling Log Updated: February 2005
Project Name PG&E Topock PROJECT Sampling EventJob Number Date
Field Team Field Conditions Page of
Well/Sample Number QC Sample ID QC Sample Time _________________Purge Start Time Purge Method: Ded. Pump MAKE/MODEL
Flow Cell: Y / N Instrument Serial Number: Min. Purge Volume (gal)/(L) Purge Rate (gpm)/(mLpm)
TDS Eh / ORP Commentsg/L mv (See descriptors below)
Parameter Stabilization Criteria:NA
+/- 10 mV
Did Parameters Stabilize prior to sampling? NA
Are measurements consistent with previous?
Sample Time Sample Location: pump tubing ______well port _____ spigot ______ bailer ________ other ____________________________________________________
Comments: _______________________________________________________________________________________________________________________________________________________________
Initial Depth to Water (ft BTOC): ____________________________________ Measure Point: Well TOC Steel Casing WATER LEVEL METER SERIAL NUMBER:___________________________
WD (Well Depth - from table) ft btoc: ________________________________SWH (Standing Water Height) = WD-Initial Depth ____________________ Time of Removal__________________________D (Volume as per diameter) 2" = 0.17, 4"= 0.66, 1" = 0.041 _____________ Time of Reinstallation______________________
One Casing Volume = D*SWH ___________________________________
Three Casing Volumes = _______________________________________
Color: clear, grey, yellow, brown, black, cloudy, green Odor: none, sulphur, organic, other Solids: Trace, Small Qu, Med Qu, Large Qu, Particulate, Silt, Sand
Comments:
Final DTWTime Initial DTWTime
+/- 0.1 pH units +/- 3%
+/- 10% NTU units
when >10 NTUs
+/- 0.3 mg/L NA NA
TRANSDUCER
Approx. 5 min After ReinstallationBefore Removal
NA
NA
NA
Water Time Vol. Purgedgallons / litersLevel
pH Conductivity TurbidityNTUUNITS
Diss. Oxygen Temp.mg/L
Salinity%oC
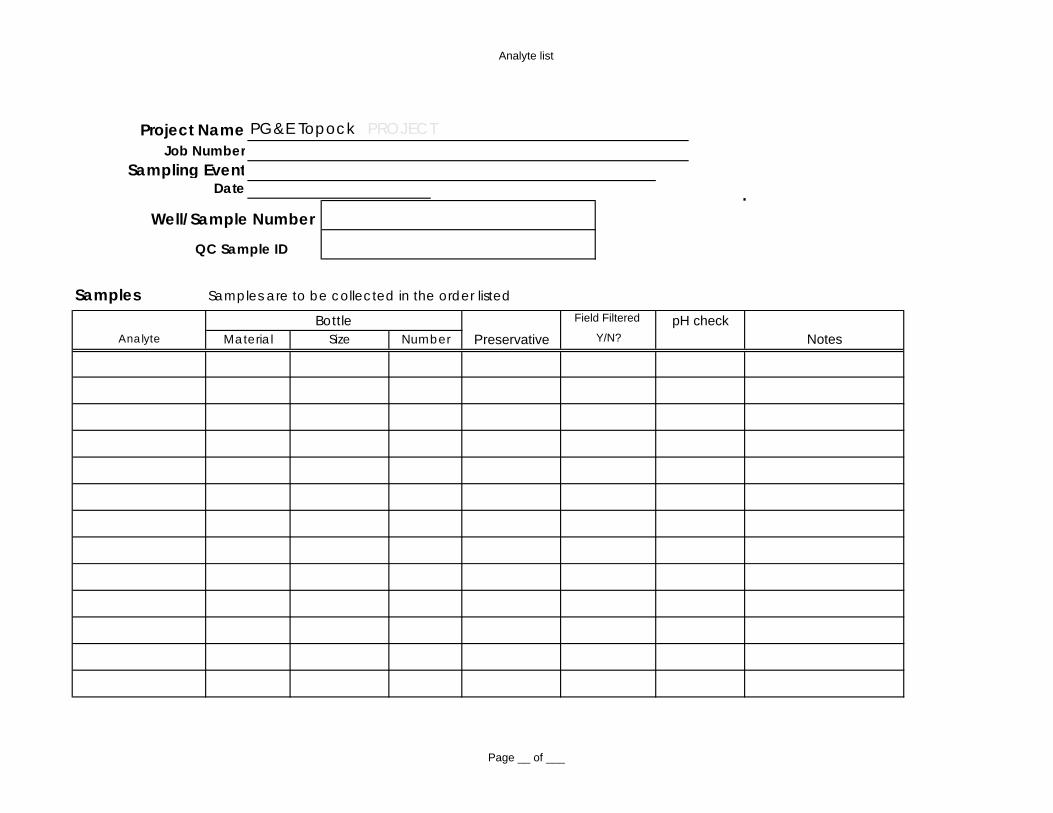
Analyte list
Project Name PG&E Topock PROJECTJob Number
Sampling EventDate
Well/Sample Number
QC Sample ID
Samples Samples are to be collected in the order listed
NotesPreservative Y/N?
Field Filtered pH checkBottleMaterialAnalyte Size Number
Page __ of ___

Page ____ of ____
Project Name: PG&E Topock
Staff:
Well/Piezometer Date Survey Mark Present?
Standing or Ponded Water? Lock in Place?
Evidence of Well
Subsidence?
Well Labeled on Casing or Pad?
Traffic Poles Intact?
Concrete Pad Intact?
Erosion Around Wellhead?
Steel Casing Intact?
PVC Cap Present?
Standing Water in Annulus?
Well Casing Intact? NOTES
Y N Y N Y N Y N Y N Y N Y N Y N Y N Y N Y N Y N
Y N Y N Y N Y N Y N Y N Y N Y N Y N Y N Y N Y N
Y N Y N Y N Y N Y N Y N Y N Y N Y N Y N Y N Y N
Y N Y N Y N Y N Y N Y N Y N Y N Y N Y N Y N Y N
Y N Y N Y N Y N Y N Y N Y N Y N Y N Y N Y N Y N
Y N Y N Y N Y N Y N Y N Y N Y N Y N Y N Y N Y N
Y N Y N Y N Y N Y N Y N Y N Y N Y N Y N Y N Y N
Y N Y N Y N Y N Y N Y N Y N Y N Y N Y N Y N Y N
Y N Y N Y N Y N Y N Y N Y N Y N Y N Y N Y N Y N
Y N Y N Y N Y N Y N Y N Y N Y N Y N Y N Y N Y N
Equipment Model/Type
Water Level Meter
Horiba
Hach
WELL INSPECTION LOG
Serial Number Last Calibration Date
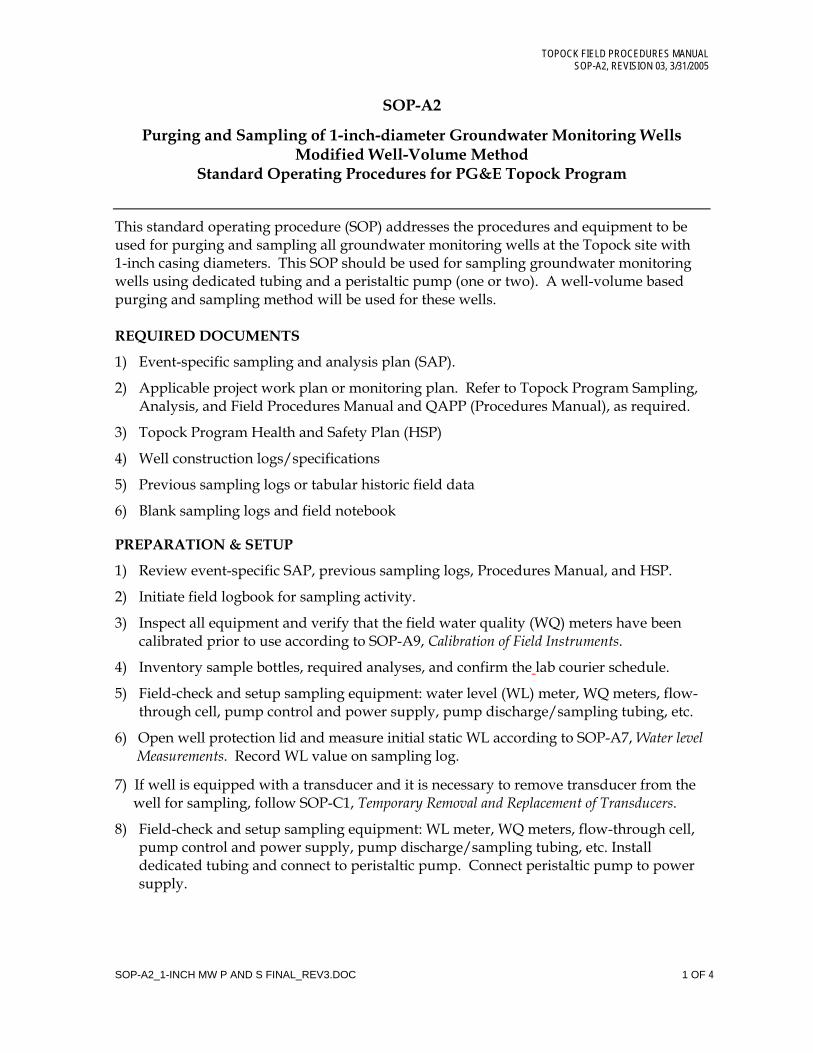
TOPOCK FIELD PROCEDURES MANUAL SOP-A2, REVISION 03, 3/31/2005
SOP-A2_1-INCH MW P AND S FINAL_REV3.DOC 1 OF 4
SOP-A2
Purging and Sampling of 1-inch-diameter Groundwater Monitoring Wells Modified Well-Volume Method
Standard Operating Procedures for PG&E Topock Program
This standard operating procedure (SOP) addresses the procedures and equipment to be used for purging and sampling all groundwater monitoring wells at the Topock site with 1-inch casing diameters. This SOP should be used for sampling groundwater monitoring wells using dedicated tubing and a peristaltic pump (one or two). A well-volume based purging and sampling method will be used for these wells.
REQUIRED DOCUMENTS
1) Event-specific sampling and analysis plan (SAP).
2) Applicable project work plan or monitoring plan. Refer to Topock Program Sampling, Analysis, and Field Procedures Manual and QAPP (Procedures Manual), as required.
3) Topock Program Health and Safety Plan (HSP)
4) Well construction logs/specifications
5) Previous sampling logs or tabular historic field data
6) Blank sampling logs and field notebook
PREPARATION & SETUP
1) Review event-specific SAP, previous sampling logs, Procedures Manual, and HSP.
2) Initiate field logbook for sampling activity.
3) Inspect all equipment and verify that the field water quality (WQ) meters have been calibrated prior to use according to SOP-A9, Calibration of Field Instruments.
4) Inventory sample bottles, required analyses, and confirm the lab courier schedule.
5) Field-check and setup sampling equipment: water level (WL) meter, WQ meters, flow-through cell, pump control and power supply, pump discharge/sampling tubing, etc.
6) Open well protection lid and measure initial static WL according to SOP-A7, Water level Measurements. Record WL value on sampling log.
7) If well is equipped with a transducer and it is necessary to remove transducer from the well for sampling, follow SOP-C1, Temporary Removal and Replacement of Transducers.
8) Field-check and setup sampling equipment: WL meter, WQ meters, flow-through cell, pump control and power supply, pump discharge/sampling tubing, etc. Install dedicated tubing and connect to peristaltic pump. Connect peristaltic pump to power supply.
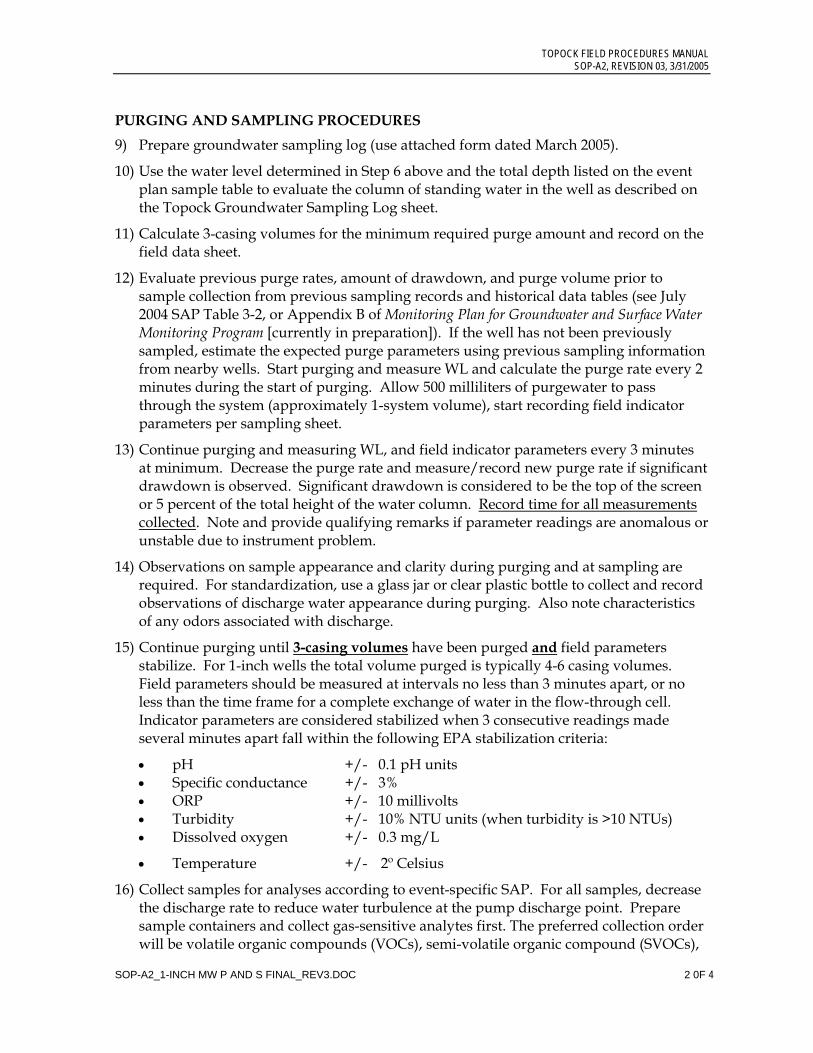
TOPOCK FIELD PROCEDURES MANUAL SOP-A2, REVISION 03, 3/31/2005
SOP-A2_1-INCH MW P AND S FINAL_REV3.DOC 2 0F 4
PURGING AND SAMPLING PROCEDURES
9) Prepare groundwater sampling log (use attached form dated March 2005).
10) Use the water level determined in Step 6 above and the total depth listed on the event plan sample table to evaluate the column of standing water in the well as described on the Topock Groundwater Sampling Log sheet.
11) Calculate 3-casing volumes for the minimum required purge amount and record on the field data sheet.
12) Evaluate previous purge rates, amount of drawdown, and purge volume prior to sample collection from previous sampling records and historical data tables (see July 2004 SAP Table 3-2, or Appendix B of Monitoring Plan for Groundwater and Surface Water Monitoring Program [currently in preparation]). If the well has not been previously sampled, estimate the expected purge parameters using previous sampling information from nearby wells. Start purging and measure WL and calculate the purge rate every 2 minutes during the start of purging. Allow 500 milliliters of purgewater to pass through the system (approximately 1-system volume), start recording field indicator parameters per sampling sheet.
13) Continue purging and measuring WL, and field indicator parameters every 3 minutes at minimum. Decrease the purge rate and measure/record new purge rate if significant drawdown is observed. Significant drawdown is considered to be the top of the screen or 5 percent of the total height of the water column. Record time for all measurements collected. Note and provide qualifying remarks if parameter readings are anomalous or unstable due to instrument problem.
14) Observations on sample appearance and clarity during purging and at sampling are required. For standardization, use a glass jar or clear plastic bottle to collect and record observations of discharge water appearance during purging. Also note characteristics of any odors associated with discharge.
15) Continue purging until 3-casing volumes have been purged and field parameters stabilize. For 1-inch wells the total volume purged is typically 4-6 casing volumes. Field parameters should be measured at intervals no less than 3 minutes apart, or no less than the time frame for a complete exchange of water in the flow-through cell. Indicator parameters are considered stabilized when 3 consecutive readings made several minutes apart fall within the following EPA stabilization criteria:
• pH +/- 0.1 pH units • Specific conductance +/- 3% • ORP +/- 10 millivolts • Turbidity +/- 10% NTU units (when turbidity is >10 NTUs) • Dissolved oxygen +/- 0.3 mg/L
• Temperature +/- 2º Celsius
16) Collect samples for analyses according to event-specific SAP. For all samples, decrease the discharge rate to reduce water turbulence at the pump discharge point. Prepare sample containers and collect gas-sensitive analytes first. The preferred collection order will be volatile organic compounds (VOCs), semi-volatile organic compound (SVOCs),

TOPOCK FIELD PROCEDURES MANUAL SOP-A2, REVISION 03, 3/31/2005
SOP-A2_1-INCH MW P AND S FINAL_REV3.DOC 3 0F 4
metals (including hexavalent chromium [Cr(VI)] and total chromium [Cr(T)]; see SOP-A6), then general chemistry (cations, anions, stable isotopes). Sample containers are to be filled by transferring water directly from the pump discharge to the appropriate sample container.
17) Record sample information, final WL, and purge volume data on field log.
18) If well was equipped with a transducer, replace transducer according to SOP-C1, Temporary Removal and Replacement of Transducers.
19) Close and secure well protection lid.
20) Follow Procedures Manual for sample handing and management, equipment decontamination, and investigation-derived waste (IDW) management.
LOW VOLUME AND POOR RECOVERY WELLS
Some groundwater monitoring wells under the GMP may exhibit slow or poor recovery upon purging. These groundwater monitoring wells may not recover sufficiently during purging and run completely dry without an opportunity to collect the required series of groundwater stabilization parameters, or run dry prior to sampling. The following procedures should be followed for collection representative groundwater samples from wells that go dry during purging activities in preparation for groundwater sampling.
PREPARATION & SETUP
Follow steps 1 through 8 as above and evaluate the volume of water to be discharged prior to the groundwater monitoring well going dry, if known.
PURGING AND SAMPLING PROCEDURES FOR LOW RECOVERY WELLS
9) Prepare groundwater sampling log (use attached form dated March 2005).
10) Measure the depth to water and the total depth provided in the plan sample table to evaluate the column of standing water in the well as described on the Topock Groundwater Sampling Log sheet.
11) Calculate 3-casing volumes.
12) Evaluate previous purge rates, amount of drawdown, and purge volume prior to sample collection from previous sampling records and historical data tables (see July 2004 SAP Table 3-2, or Appendix B of Monitoring Plan for Groundwater and Surface Water Monitoring Program [currently in preparation]). If the well has not been previously sampled, estimate the expected purge parameters using previous sampling information from nearby wells. Start purging at a rate of less than one gallon per minute. Measure WL, and calculate purge rate.
13) Continue purging and measuring WL. Begin recording field indicator parameters after 500 milliliters of water has been purged, and every 3 minutes at minimum thereafter. Record time for all measurements collected. Note and provide qualifying remarks if parameter readings are anomalous or unstable due to instrument problem.
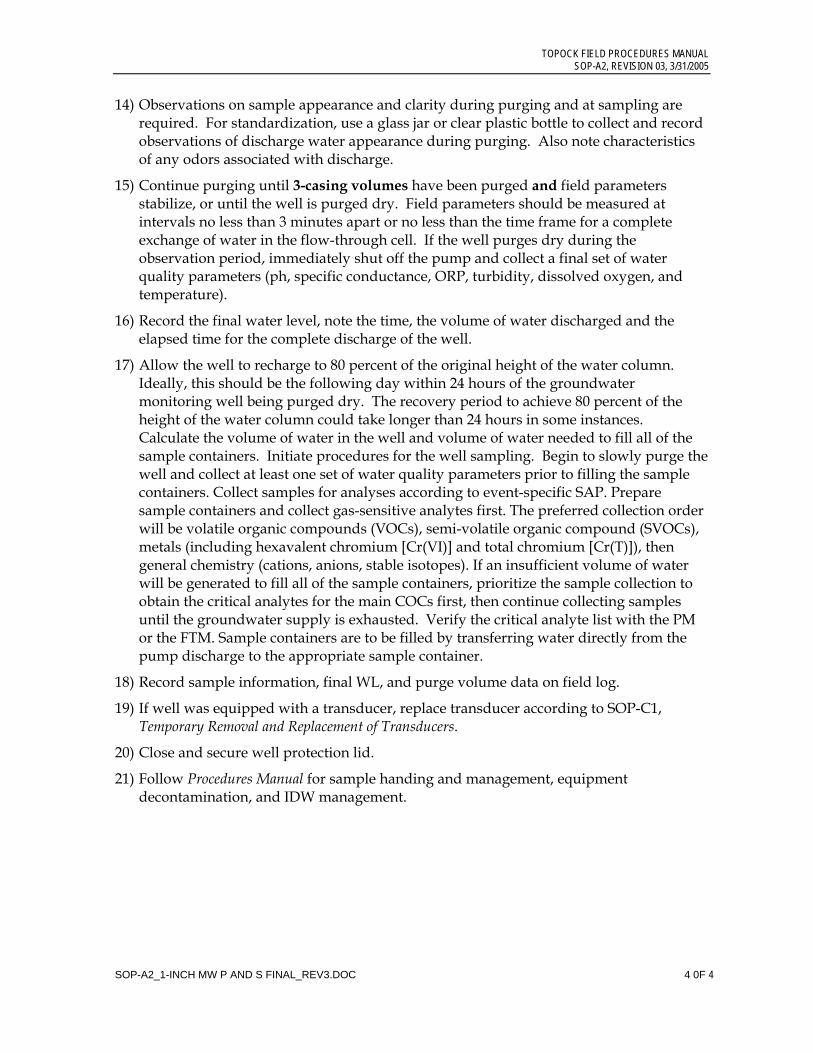
TOPOCK FIELD PROCEDURES MANUAL SOP-A2, REVISION 03, 3/31/2005
SOP-A2_1-INCH MW P AND S FINAL_REV3.DOC 4 0F 4
14) Observations on sample appearance and clarity during purging and at sampling are required. For standardization, use a glass jar or clear plastic bottle to collect and record observations of discharge water appearance during purging. Also note characteristics of any odors associated with discharge.
15) Continue purging until 3-casing volumes have been purged and field parameters stabilize, or until the well is purged dry. Field parameters should be measured at intervals no less than 3 minutes apart or no less than the time frame for a complete exchange of water in the flow-through cell. If the well purges dry during the observation period, immediately shut off the pump and collect a final set of water quality parameters (ph, specific conductance, ORP, turbidity, dissolved oxygen, and temperature).
16) Record the final water level, note the time, the volume of water discharged and the elapsed time for the complete discharge of the well.
17) Allow the well to recharge to 80 percent of the original height of the water column. Ideally, this should be the following day within 24 hours of the groundwater monitoring well being purged dry. The recovery period to achieve 80 percent of the height of the water column could take longer than 24 hours in some instances. Calculate the volume of water in the well and volume of water needed to fill all of the sample containers. Initiate procedures for the well sampling. Begin to slowly purge the well and collect at least one set of water quality parameters prior to filling the sample containers. Collect samples for analyses according to event-specific SAP. Prepare sample containers and collect gas-sensitive analytes first. The preferred collection order will be volatile organic compounds (VOCs), semi-volatile organic compound (SVOCs), metals (including hexavalent chromium [Cr(VI)] and total chromium [Cr(T)]), then general chemistry (cations, anions, stable isotopes). If an insufficient volume of water will be generated to fill all of the sample containers, prioritize the sample collection to obtain the critical analytes for the main COCs first, then continue collecting samples until the groundwater supply is exhausted. Verify the critical analyte list with the PM or the FTM. Sample containers are to be filled by transferring water directly from the pump discharge to the appropriate sample container.
18) Record sample information, final WL, and purge volume data on field log.
19) If well was equipped with a transducer, replace transducer according to SOP-C1, Temporary Removal and Replacement of Transducers.
20) Close and secure well protection lid.
21) Follow Procedures Manual for sample handing and management, equipment decontamination, and IDW management.

Topock Groundwater Sampling Log Updated: February 2005
Project Name PG&E Topock PROJECT Sampling EventJob Number Date
Field Team Field Conditions Page of
Well/Sample Number QC Sample ID QC Sample Time _________________Purge Start Time Purge Method: Ded. Pump MAKE/MODEL
Flow Cell: Y / N Instrument Serial Number: Min. Purge Volume (gal)/(L) Purge Rate (gpm)/(mLpm)
TDS Eh / ORP Commentsg/L mv (See descriptors below)
Parameter Stabilization Criteria:NA
+/- 10 mV
Did Parameters Stabilize prior to sampling? NA
Are measurements consistent with previous?
Sample Time Sample Location: pump tubing ______well port _____ spigot ______ bailer ________ other ____________________________________________________
Comments: _______________________________________________________________________________________________________________________________________________________________
Initial Depth to Water (ft BTOC): ____________________________________ Measure Point: Well TOC Steel Casing WATER LEVEL METER SERIAL NUMBER:___________________________
WD (Well Depth - from table) ft btoc: ________________________________SWH (Standing Water Height) = WD-Initial Depth ____________________ Time of Removal__________________________D (Volume as per diameter) 2" = 0.17, 4"= 0.66, 1" = 0.041 _____________ Time of Reinstallation______________________
One Casing Volume = D*SWH ___________________________________
Three Casing Volumes = _______________________________________
Color: clear, grey, yellow, brown, black, cloudy, green Odor: none, sulphur, organic, other Solids: Trace, Small Qu, Med Qu, Large Qu, Particulate, Silt, Sand
Comments:
Final DTWTime Initial DTWTime
+/- 0.1 pH units +/- 3%
+/- 10% NTU units
when >10 NTUs
+/- 0.3 mg/L NA NA
TRANSDUCER
Approx. 5 min After ReinstallationBefore Removal
NA
NA
NA
Water Time Vol. Purgedgallons / litersLevel
pH Conductivity TurbidityNTUUNITS
Diss. Oxygen Temp.mg/L
Salinity%oC

Analyte list
Project Name PG&E Topock PROJECTJob Number
Sampling EventDate
Well/Sample Number
QC Sample ID
Samples Samples are to be collected in the order listed
NotesPreservative Y/N?
Field Filtered pH checkBottleMaterialAnalyte Size Number
Page __ of ___

Page ____ of ____
Project Name: PG&E Topock
Staff:
Well/Piezometer Date Survey Mark Present?
Standing or Ponded Water? Lock in Place?
Evidence of Well
Subsidence?
Well Labeled on Casing or Pad?
Traffic Poles Intact?
Concrete Pad Intact?
Erosion Around Wellhead?
Steel Casing Intact?
PVC Cap Present?
Standing Water in Annulus?
Well Casing Intact? NOTES
Y N Y N Y N Y N Y N Y N Y N Y N Y N Y N Y N Y N
Y N Y N Y N Y N Y N Y N Y N Y N Y N Y N Y N Y N
Y N Y N Y N Y N Y N Y N Y N Y N Y N Y N Y N Y N
Y N Y N Y N Y N Y N Y N Y N Y N Y N Y N Y N Y N
Y N Y N Y N Y N Y N Y N Y N Y N Y N Y N Y N Y N
Y N Y N Y N Y N Y N Y N Y N Y N Y N Y N Y N Y N
Y N Y N Y N Y N Y N Y N Y N Y N Y N Y N Y N Y N
Y N Y N Y N Y N Y N Y N Y N Y N Y N Y N Y N Y N
Y N Y N Y N Y N Y N Y N Y N Y N Y N Y N Y N Y N
Y N Y N Y N Y N Y N Y N Y N Y N Y N Y N Y N Y N
Equipment Model/Type
Water Level Meter
Horiba
Hach
WELL INSPECTION LOG
Serial Number Last Calibration Date
TOPOCK FIELD PROCEDURESMANUAL SOP-A3,REVISION 00, 2/11/2005
SOP-A3_SUPPLYWELLSAMPLING.DOC 1 OF 4
SOP-A3
Purging and Sampling of Active and Inactive Water Supply Wells Standard Operating Procedures for PG&E Topock Program
This standard operating procedure (SOP) addresses the procedures and equipment to be used for purging and sampling active and inactive water supply wells in the vicinity of the Topock site. This procedures also applies to the collection of water quality samples from long-screen extraction, injection, and test wells. Active and inactive water supply wells with functional dedicated pumps and a sampling port will be sampled directly from the sampling port. Inactive supply wells without functional pumps will be sampled using a temporary submersible pump following the well-volume sampling procedure.
REQUIRED DOCUMENTS
1) Event-specific sampling and analysis plan (SAP).
2) Applicable project work plan or monitoring plan. Refer to Topock Program Sampling, Analysis, and Field Procedures Manual and QAPP (Procedures Manual), as required.
3) Topock Program Health and Safety Plan (HSP)
4) Well construction logs/specifications, if available
5) Previous sampling logs or tabular historic field data, if available
6) Blank sampling logs and field notebook
PREPARATION AND SETUP
1) Review event-specific SAP or event-specific field instructions, previous sampling logs, Procedures Manual, and HSP.
2) Initiate field logbook for sampling activity.
3) Inspect all required field equipment and calibrate field water quality (WQ) meters according to SOP-A9, Calibration of Field Instruments.
4) Inventory sample bottles, review required analyses, and confirm the lab courier schedule.
5) Field-check and setup sampling equipment: water level (WL) meter, WQ meters, flow-through cell, pump control and power supply, pump discharge/sampling tubing, health and safety equipment, etc.
6) If well is equipped with a transducer and transducer removal is required for sampling, follow SOP-C1, Temporary Removal and Replacement of Transducers.
7) If well is not equipped with a functioning dedicated pump, install temporary sampling pump at the same intake/sampling depth used in prior events and record intake depth. If the well has not been previously sampled, install the pump with the intake in the middle of the screened interval or at the depth prescribed by the Project Manager or Field Team Manager.
TOPOCK FIELD PROCEDURESMANUAL SOP-A3,REVISION 00, 2/11/2005
SOP-A3_SUPPLYWELLSAMPLING.DOC 2 0F 4
PURGING AND SAMPLING PROCEDURES FOR ACTIVE WATER SUPPLY WELLS
8) Prepare groundwater sampling log (use attached form dated February 2005).
9) If the well has been inactive for more than 24 hours, a water level measurement can be taken. Measure initial static WL according to SOP-A7, Water level Measurements. Record WL value on sampling log.
10) Measure one set of water quality parameters using a flow-through cell connected directly to the sampling port. If it is not possible to connect the flow-through cell, a clean 5-gallon bucket may be used by filling the bucket with purge water and inserting the instrument probes directly into the bucket. If the bucket is used, turbulence in the bucket should be minimized to the extent possible. Record time for all measurements collected. Note and provide qualifying remarks if parameter readings are anomalous or unstable due to instrument problems. Purge water should be contained in a portable water storage tank. If approved by well owner and the governing regulatory agencies, water may be discharged directly to the ground, as directed by the Field Team Manager.
11) Observations on sample appearance and clarity during purging and at sampling are required. For standardization, use a clear glass jar to collect and record observations of discharge water appearance during purging. Also note characteristics such as any odors associated with the discharge water.
12) Collect samples for analyses according to the SAP and/or event-specific field instructions. Sample containers are to be filled by transferring water directly from the pump discharge or sampling spigot to the appropriate sample container. If the SAP calls for filtered and/or preserved samples, refer to SOP A6 Sample Field Filtration and Preservation for Metals.
13) Record sample information, final WL, and purge volume data on field log. If the pump is equipped with a flow meter, record the flow rate as well.
14) If well was equipped with a transducer, replace transducer according to SOP-C1, Temporary Removal and Replacement of Transducers.
15) Close and secure well including access gates or fences.
16) Follow SOPs in Program Procedures Manual for sample handing and management, equipment decontamination, and investigation-derived waste (IDW) management.
PURGING AND SAMPLING PROCEDURES FOR INACTIVE WATER SUPPLY WELLS
Inactive water wells may include: (1) wells with functioning dedicated pumps, (2) wells without dedicated pumps, and (3) wells with non-functioning dedicated pumps. A well-pump subcontractor will be required to install temporary pump for purging wells without pumps and non-functioning dedicated pumps.
8) Prepare groundwater sampling log (use attached form dated February 2005).
TOPOCK FIELD PROCEDURESMANUAL SOP-A3,REVISION 00, 2/11/2005
SOP-A3_SUPPLYWELLSAMPLING.DOC 3 0F 4
9) If the well has a water level meter port or the lid can be removed, water level measurements should be taken before purging. Measure initial static WL according to SOP-A7, Water level Measurements. Record WL value on sampling log.
10) Calculate 3-casing volumes using measured WL depth, casing diameter, and total well depth information. If it is not possible to measure the depth to water or total depth of the well, use well records or prior knowledge to calculate 3-casing volumes.
11) If it can be assumed that 3-casing volumes have been purged from the well in the last 24-hour period, purging will not be necessary prior to sampling. Measure water quality parameters using a flow-through cell connected directly to the sampling port. If it is not possible to connect the flow-through cell, a clean 5-gallon bucket may be used by filling the bucket with purge water and inserting the instrument probes directly into the bucket. If the bucket is used, turbulence in the bucket should be minimized to the extent possible. Record time for all measurements collected. Note and provide qualifying remarks if parameter readings are anomalous or unstable due to instrument problems.
12) If determined that 3-casing volumes have not been purged in the last 24-hours, start purging using the functional dedicated equipment, if available.
13) If dedicated equipment is not present or nonfunctional, a portable pump installed by subcontractor may be used for purging and sampling. Install a decontaminated pump at the same intake/sampling depth used in prior events and record intake depth. If the well has not been previously sampled, install the pump with the intake in the middle of the screened interval ,or the midpoint of the saturated interval if the water level is lower than the top of the screen, or at the depth proscribed by the Project Manager or Field Team Manager. Purge water should be contained in an on-site water storage tank or portable water storage tank if an on-site water storage tank is not available. If approved by well owner and the governing regulatory agencies, water may be discharged directly to the ground, as directed by the Field Team Manager.
14) During purging, measure water quality parameters and WL every 3 minutes at minimum using a flow-through cell. If it is not possible to connect the flow-through cell directly to the well pump discharge hose, a clean 5-gallon bucket may be used by filling the bucket with purge water and inserting the instrument probes directly into the bucket. If the bucket is used, turbulence in the bucket should be minimized to the extent possible. Record time for all measurements collected. Note and provide qualifying remarks if parameter readings are anomalous or unstable due to instrument problems.
15) Observations on sample appearance and clarity during purging and at sampling are required. For standardization, use a clear glass jar to collect and record observations of discharge water appearance during purging. Also note characteristics such as any odors associated with the discharge water.
16) If water quality parameters are collected using a flow-through cell, the parameters should stabilize prior to sampling. Indicator parameters are considered stabilized when 3 consecutive readings made several minutes apart fall within the following EPA-recommended stabilization criteria:
• pH +/- 0.1 pH units • Specific conductance +/- 3%
TOPOCK FIELD PROCEDURESMANUAL SOP-A3,REVISION 00, 2/11/2005
SOP-A3_SUPPLYWELLSAMPLING.DOC 4 0F 4
• ORP +/- 10 millivolts • Turbidity +/- 10% NTU units (when turbidity is >10 NTUs) • Dissolved oxygen +/- 0.3 mg/L
17) Collect samples for analyses according to the SAP and/or event-specific field instructions. If possible, decrease the discharge rate to reduce water turbulence at the pump discharge point. Prepare sample containers and collect gas-sensitive analytes first. The preferred collection order will be volatile organic compounds (VOCs), semi-volatile organic compound (SVOCs), metals (including hexavalent chromium [Cr(VI)] and total chromium [Cr(T)]), then general chemistry (cations, anions, stable isotopes). Sample containers are to be filled by transferring water directly from the pump discharge to the appropriate sample container. See SOP-A6 Sample Field Filtration and Preservation for Metals Analyses if collecting samples for metals samples that require field filtration.
18) Record sample information, final WL, and purge volume data on field log.
19) Close and secure well including access gates or fences.
20) Follow SOPs in Program Procedures Manual for sample handing and management, equipment decontamination, and IDW management.

Topock Groundwater Sampling Log Updated: February 2005
Project Name PG&E Topock PROJECT Sampling EventJob Number Date
Field Team Field Conditions Page of
Well/Sample Number QC Sample ID QC Sample Time _________________Purge Start Time Purge Method: Ded. Pump MAKE/MODEL
Flow Cell: Y / N Instrument Serial Number: Min. Purge Volume (gal)/(L) Purge Rate (gpm)/(mLpm)
TDS Eh / ORP Commentsg/L mv (See descriptors below)
Parameter Stabilization Criteria:NA
+/- 10 mV
Did Parameters Stabilize prior to sampling? NA
Are measurements consistent with previous?
Sample Time Sample Location: pump tubing ______well port _____ spigot ______ bailer ________ other ____________________________________________________
Comments: _______________________________________________________________________________________________________________________________________________________________
Initial Depth to Water (ft BTOC): ____________________________________ Measure Point: Well TOC Steel Casing WATER LEVEL METER SERIAL NUMBER:___________________________
WD (Well Depth - from table) ft btoc: ________________________________SWH (Standing Water Height) = WD-Initial Depth ____________________ Time of Removal__________________________D (Volume as per diameter) 2" = 0.17, 4"= 0.66, 1" = 0.041 _____________ Time of Reinstallation______________________
One Casing Volume = D*SWH ___________________________________
Three Casing Volumes = _______________________________________
Color: clear, grey, yellow, brown, black, cloudy, green Odor: none, sulphur, organic, other Solids: Trace, Small Qu, Med Qu, Large Qu, Particulate, Silt, Sand
Comments:
Final DTWTime Initial DTWTime
+/- 0.1 pH units +/- 3%
+/- 10% NTU units
when >10 NTUs
+/- 0.3 mg/L NA NA
TRANSDUCER
Approx. 5 min After ReinstallationBefore Removal
NA
NA
NA
Water Time Vol. Purgedgallons / litersLevel
pH Conductivity TurbidityNTUUNITS
Diss. Oxygen Temp.mg/L
Salinity%oC

Analyte list
Project Name PG&E Topock PROJECTJob Number
Sampling EventDate
Well/Sample Number
QC Sample ID
Samples Samples are to be collected in the order listed
NotesPreservative Y/N?
Field Filtered pH checkBottleMaterialAnalyte Size Number
Page __ of ___

Page ____ of ____
Project Name: PG&E Topock
Staff:
Well/Piezometer Date Survey Mark Present?
Standing or Ponded Water? Lock in Place?
Evidence of Well
Subsidence?
Well Labeled on Casing or Pad?
Traffic Poles Intact?
Concrete Pad Intact?
Erosion Around Wellhead?
Steel Casing Intact?
PVC Cap Present?
Standing Water in Annulus?
Well Casing Intact? NOTES
Y N Y N Y N Y N Y N Y N Y N Y N Y N Y N Y N Y N
Y N Y N Y N Y N Y N Y N Y N Y N Y N Y N Y N Y N
Y N Y N Y N Y N Y N Y N Y N Y N Y N Y N Y N Y N
Y N Y N Y N Y N Y N Y N Y N Y N Y N Y N Y N Y N
Y N Y N Y N Y N Y N Y N Y N Y N Y N Y N Y N Y N
Y N Y N Y N Y N Y N Y N Y N Y N Y N Y N Y N Y N
Y N Y N Y N Y N Y N Y N Y N Y N Y N Y N Y N Y N
Y N Y N Y N Y N Y N Y N Y N Y N Y N Y N Y N Y N
Y N Y N Y N Y N Y N Y N Y N Y N Y N Y N Y N Y N
Y N Y N Y N Y N Y N Y N Y N Y N Y N Y N Y N Y N
Equipment Model/Type
Water Level Meter
Horiba
Hach
WELL INSPECTION LOG
Serial Number Last Calibration Date
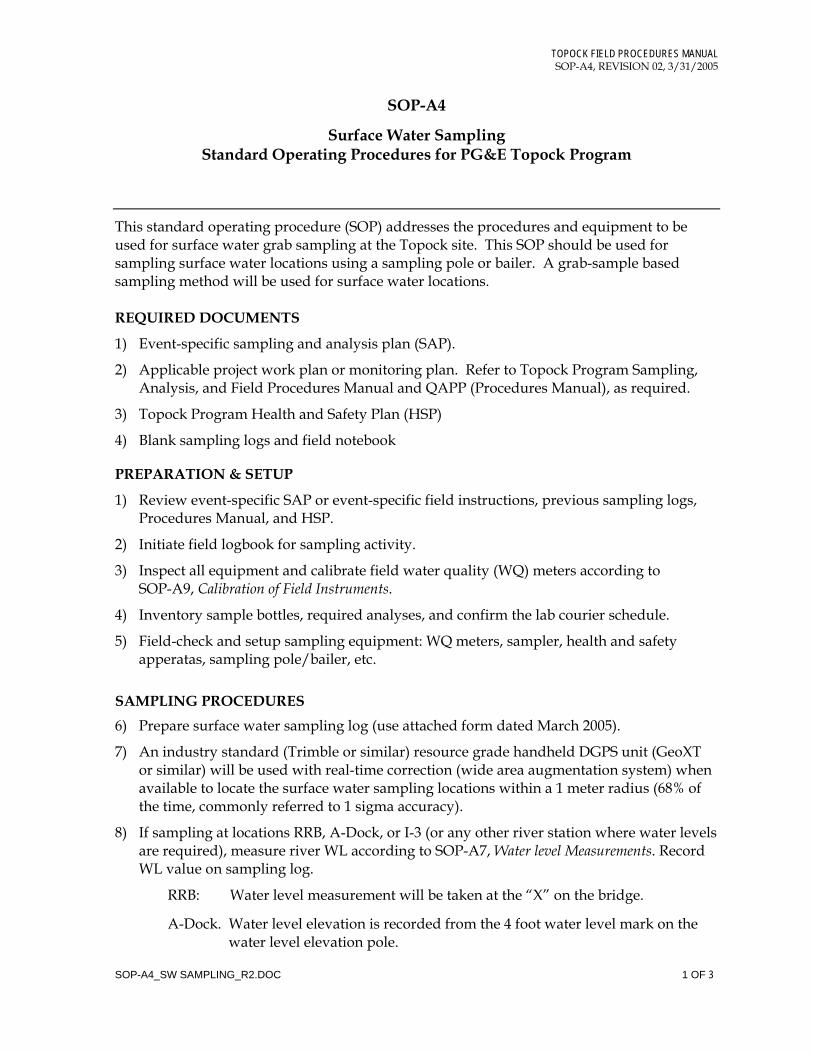
TOPOCK FIELD PROCEDURES MANUAL SOP-A4, REVISION 02, 3/31/2005
SOP-A4_SW SAMPLING_R2.DOC 1 OF 3
SOP-A4
Surface Water Sampling Standard Operating Procedures for PG&E Topock Program
This standard operating procedure (SOP) addresses the procedures and equipment to be used for surface water grab sampling at the Topock site. This SOP should be used for sampling surface water locations using a sampling pole or bailer. A grab-sample based sampling method will be used for surface water locations.
REQUIRED DOCUMENTS
1) Event-specific sampling and analysis plan (SAP).
2) Applicable project work plan or monitoring plan. Refer to Topock Program Sampling, Analysis, and Field Procedures Manual and QAPP (Procedures Manual), as required.
3) Topock Program Health and Safety Plan (HSP)
4) Blank sampling logs and field notebook
PREPARATION & SETUP
1) Review event-specific SAP or event-specific field instructions, previous sampling logs, Procedures Manual, and HSP.
2) Initiate field logbook for sampling activity.
3) Inspect all equipment and calibrate field water quality (WQ) meters according to SOP-A9, Calibration of Field Instruments.
4) Inventory sample bottles, required analyses, and confirm the lab courier schedule.
5) Field-check and setup sampling equipment: WQ meters, sampler, health and safety apperatas, sampling pole/bailer, etc.
SAMPLING PROCEDURES
6) Prepare surface water sampling log (use attached form dated March 2005).
7) An industry standard (Trimble or similar) resource grade handheld DGPS unit (GeoXT or similar) will be used with real-time correction (wide area augmentation system) when available to locate the surface water sampling locations within a 1 meter radius (68% of the time, commonly referred to 1 sigma accuracy).
8) If sampling at locations RRB, A-Dock, or I-3 (or any other river station where water levels are required), measure river WL according to SOP-A7, Water level Measurements. Record WL value on sampling log.
RRB: Water level measurement will be taken at the “X” on the bridge.
A-Dock. Water level elevation is recorded from the 4 foot water level mark on the water level elevation pole.
TOPOCK FIELD PROCEDURES MANUAL SOP-A4, REVISION 02, 3/31/2005
SOP-A4_SW SAMPLING_R2.DOC 2 0F 3
I-3: There is a bolt and nut in the metal bridge, water level is recorded to the base of the nut (see photo)
9) Where possible, place water quality meter probes in the Colorado River in a secure place near-shore for approximately 3, until the temperature reading stabilizes prior to reading field parameters from sample. Proceed with sampling activities while the temperature of the probes is equilibriating.
10) Collect samples for analyses according to event-specific SAP. RRB: Samples are collected using a disposable bailer and directly filling the sample bottles. An attempt will be made to ensure the water is collected from several inches beneath the surface of the water. If the water is too shallow to use a bailer, than the surface water sampling pole can be used. A notation will be made on the sample log that the sample was a skim sample and not from the recommended depth.
I-3: Samples are collected using a disposable bailer and directly filling the sample bottles. An attempt will be made to ensure the water is collected from several inches beneath the surface of the water.
All other locations: Samples are collected using a surface water sampling pole that is extended as far as possible in a safe manner (ideally 4 feet from the shoreline) and the sample collected approximately 6 inches below the surface, or by wading out and dipping the sampling bottle approximately 6 inches beneath the surface. Sampling containers are connected to the sampling pole and filled directly from the river. If it is not possible to connect the sampling bottle directly to the sampling pole, a portable sampling bottle will be used. The portable sampling bottle will be decontaminated between locations in accordance with SOP-A10 and protected from ambient conditions as prescribed therein. Prior to filling the portable sampling bottle it will be rinsed with surface water at the sampling location.
Samples that are to be filtered as part of the analytical suite will be field filtered at the support vehicle using a portable peristaltic pump to transfer water from the collection vessel through a 0.45 micron filter in accordance with SOP-A6 and discharged into the laboratory supplied sample container. At minimum, the required sample volume and an additional 500 milliliters will be collected to ensure there is sufficient volume for filtration.
TOPOCK FIELD PROCEDURES MANUAL SOP-A4, REVISION 02, 3/31/2005
SOP-A4_SW SAMPLING_R2.DOC 3 0F 3
11) Record sample information on field log.
12) Fill a clean bucket with Colorado River water collected approximately 6 inches below surface using a bailer or by directly filling the bucket (invert until desired depth) for measurement of water quality field parameters. Where possible (all locations except RRB), flowing water is collected for a one-time temperature stable reading of the following field parameters:
• pH • Specific conductance • ORP • Turbidity • Dissolved oxygen • Temperature
13) Measure field parameters by removing the water quality probes from the river and
inserting the Horiba probes directly into the bucket. The Hach vial shall be filled from the bucket. Record all parameters on the field sheet. Record time for all measurements collected. Note and provide qualifying remarks if parameter readings are anomalous or unstable due to instrument problem.
13) Follow the Field Procedures Manual for sample handing and management, equipment decontamination, and investigation-derived waste (IDW) management.
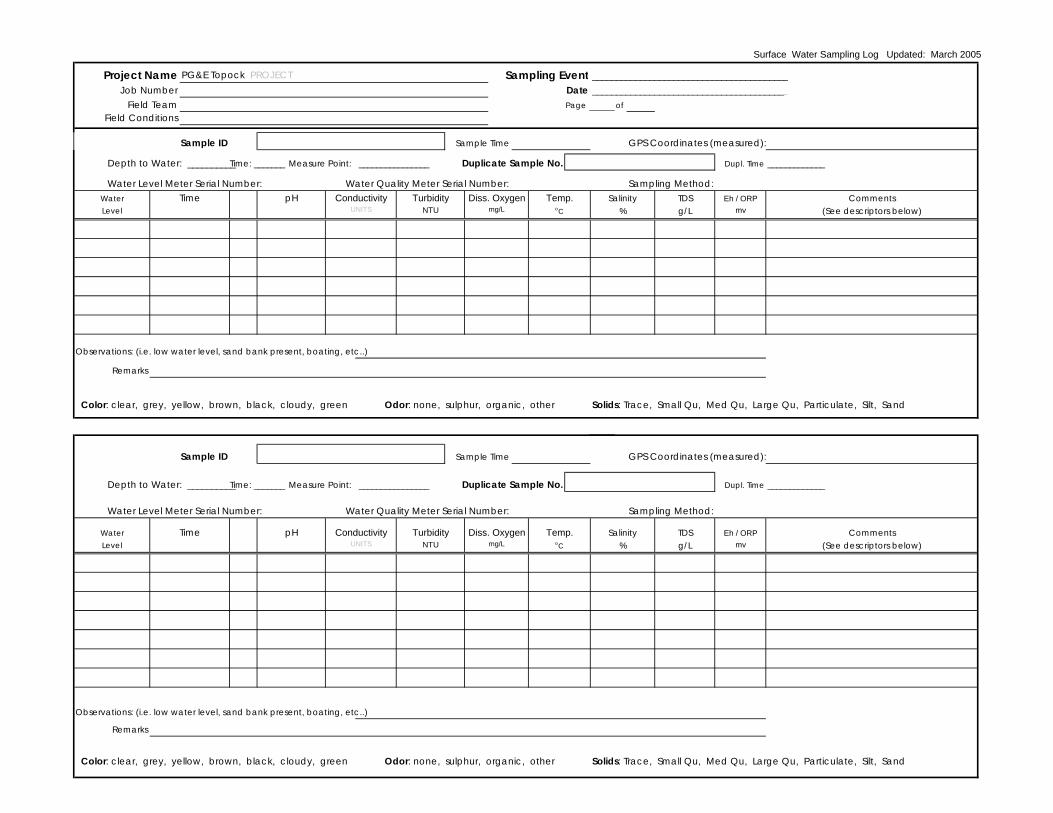
Surface Water Sampling Log Updated: March 2005
Project Name PG&E Topock PROJECT Sampling Event _________________________________________Job Number Date _________________________________________
Field Team Page ofField Conditions
Sample ID Sample Time GPS Coordinates (measured):
Depth to Water: __________ Time: _______ Measure Point: ________________ Duplicate Sample No. Dupl. Time _____________
Water Level Meter Serial Number: Water Quality Meter Serial Number: Sampling Method:TDS Eh / ORP Commentsg/L mv (See descriptors below)
Observations: (i.e. low water level, sand bank present, boating, etc..)
Remarks
Color: clear, grey, yellow, brown, black, cloudy, green Odor: none, sulphur, organic, other Solids: Trace, Small Qu, Med Qu, Large Qu, Particulate, Silt, Sand
Sample ID Sample Time GPS Coordinates (measured):
Depth to Water: __________ Time: _______ Measure Point: ________________ Duplicate Sample No. Dupl. Time _____________
Water Level Meter Serial Number: Water Quality Meter Serial Number: Sampling Method:
TDS Eh / ORP Commentsg/L mv (See descriptors below)
Observations: (i.e. low water level, sand bank present, boating, etc..)
Remarks
Color: clear, grey, yellow, brown, black, cloudy, green Odor: none, sulphur, organic, other Solids: Trace, Small Qu, Med Qu, Large Qu, Particulate, Silt, Sand
SalinityLevel UNITS NTU mg/L oC %
Conductivity Turbidity Diss. Oxygen Temp.Water Time pH
Water TimeLevel
pH Conductivity TurbidityNTUUNITS
Diss. Oxygen Temp.mg/L
Salinity%oC
TOPOCK FIELD PROCEDURESMANUAL SOP-A5 REVISION 01 3/31/2005
SOP-A5_ GW_SAMPLING_BOREHOLE_R1.DOC 1 OF 4
SOP-A5
Groundwater Sampling from Sonic Drilling Boreholes Standard Operating Procedures for PG&E Topock Program
This standard operating procedure (SOP) addresses the procedures and equipment to be used for purging and collection of grab groundwater samples from boreholes during sonic drilling. When a pump sampling system (Prosonic “Isoflow”) is available and feasible, Isoflow sampling is the preferred method. When Isoflow sampling is not available or not feasible then a bailer method will be used for grab groundwater sampling while drilling.
REQUIRED DOCUMENTS
1) Event-specific sampling and analysis plan (SAP), Work Plan or event-specific field instructions. Planned borehole depth, proposed well construction/specifications, and field sampling summary table, if available.
2) Applicable project work plan or monitoring plan. Refer to Topock Program Sampling, Analysis, and Field Procedures Manual and QAPP (Procedures Manual), as required.
3) Topock Program Health and Safety Plan (HSP)
4) Previous sampling, drilling, or well construction logs from other boreholes or wells in the vicinity, if available
5) Blank sampling log and field notebook
PREPARATION & SETUP
1) Review event-specific Work Plan or event-specific field instructions, previous sampling logs, Procedures Manual, and HSP.
2) Initiate field logbook for sampling activity.
3) Review sampling procedures and equipment, and planned sample depths with drilling contractor and field crew.
4) Inspect all required field equipment and calibrate field water quality (WQ) meters according to SOP-A9, Calibration of Field Instruments.
5) Inventory sample bottles, review required analyses, and understand lab courier schedule.
6) Field-check and setup sampling equipment: Decontaminated Isoflow pump or stainless steel bailer, rig hoist, generator, containers for purge water management, water level (WL) meter, WQ meters, flow-through cell, pump control and power supply, pump discharge/sampling tubing, health and safety equipment, etc.

TOPOCK FIELD PROCEDURESMANUAL SOP-A5 REVISION 01 3/31/2005
SOP-A5_ GW_SAMPLING_BOREHOLE_R1.DOC 2 0F 4
PURGING AND SAMPLING PROCEDURES FOR ISOFLOW SAMPLING FROM BOREHOLE
7) Prepare groundwater sampling log (use field notebook and summarize relevant information on sampling form).
8) Insert the Isoflow into the sonic casing. After the Isoflow is set, retract the sonic casing approximately 10 feet. Record the top and bottom of this open borehole interval and identify the grab groundwater sample as the mid-point of this interval. If possible, a water level measurement can be taken before Isoflow pumping begins. Measure initial static WL according to SOP-A7, Water level Measurements. Record WL value on sampling log. Monitor and record Isoflow pumping rate and WL measurements made while pumping. The length of the open borehole interval will be a field decision based on the frequency of Isoflow sampling and the formation conditions. Shorter open borehole intervals (as short as 5 feet) are appropriate for Isoflow sampling frequency of every 20 feet of drilled depth, or in heterogeneous conditions where it is desired to sample from a specific conductive zone. Longer open borehole intervals of up to 20 feet are appropriate if the Isoflow sampling frequency is every 50 to 60 feet of drill depth.
9) Measure water quality parameters using a flow-through cell connected directly to the sampling port. If it is not possible to connect the flow-through cell, a clean 5-gallon bucket may be used by filling the bucket with purge water and inserting the instrument probes directly into the bucket. If the bucket is used, turbulence in the bucket should be minimized to the extent possible. Record time for all measurements collected. Note and provide qualifying remarks if parameter readings are anomalous or unstable due to instrument problems. Record the purge rate. Purge water should be contained in a portable water storage tank, as directed by the Field Team Manager.
10) Observations on sample appearance and clarity during purging and at sampling are required. For standardization, use a clear glass jar to collect and record observations of discharge water appearance during purging. Also note characteristics such as any odors associated with the discharge water. Record the following water quality data on the field data sheet: pH, specific conductance, ORP, turbidity, TDS, and dissolved oxygen, and temperature. Indicator parameters are considered stabilized, and thus sampling may commence, when 3 consecutive readings made several minutes apart fall within the following EPA-recommended stabilization criteria:
• pH +/- 0.1 pH units • Specific conductance +/- 3% • ORP +/- 10 millivolts • Turbidity +/- 10% NTU units (when turbidity is >10 NTUs) • Dissolved oxygen +/- 0.3 mg/L
However, parameter stabilization is not a requirement for sampling from open boreholes. Typically, TDS is used as a reliable indicator for borehole sampling at the site, given the known increasing concentration with depth across the site.
11) Collect samples for analyses according to event-specific SAP. For all samples, decrease the discharge rate to reduce water turbulence at the pump discharge point. Prepare sample containers and collect gas-sensitive analytes first. The preferred collection order
TOPOCK FIELD PROCEDURESMANUAL SOP-A5 REVISION 01 3/31/2005
SOP-A5_ GW_SAMPLING_BOREHOLE_R1.DOC 3 0F 4
will be volatile organic compounds (VOCs), semi-volatile organic compound (SVOCs), metals (including hexavalent chromium [Cr(VI)] and total chromium [Cr(T)]), then general chemistry (cations, anions, stable isotopes). Sample containers are to be filled by transferring water directly from the pump discharge to the appropriate sample container.
12) Record sample information, final WL, and purge volume data on field log.
13) Oversee the driller’s removal and decontamination of the Isoflow sampling pump.
14) Oversee the driller in resuming drilling and soil sampling.
15) Follow SOPs in Program Procedures Manual for sample handing and management, equipment decontamination, and investigation-derived waste (IDW) management.
PURGING AND SAMPLING PROCEDURES FOR BAILER SAMPLING FROM BOREHOLE
7) Prepare groundwater sampling log (use field notebook and summarize relevant information on sampling form).
8) Collect the grab groundwater sample by bailing the open hole interval below the sonic casing after removing a 10 to 20-foot sonic core run.
9) Sound the bottom of the borehole after removing the core barrel. Measure initial static WL according to SOP-A7, Water level Measurements. Record WL value on sampling log.
10) Calculate 1-casing volume using measured WL depth, casing diameter, and total well depth information. Insert the decontaminated stainless steel bailer into the borehole and begin bailing a minimum of one casing volume. Purge water should be contained in a portable water storage tank, as directed by the Field Team Manager.
11) Measure water quality parameters using a clean 5-gallon bucket and inserting the instrument probes directly into the bucket. If the bucket is used, turbulence in the bucket should be minimized to the extent possible. Record time for all measurements collected. Record the following water quality data on the field data sheet: pH, specific conductance, ORP, turbidity, TDS, dissolved oxygen, sample appearance, and odor. Parameter stabilization is not a requirement for sampling from open boreholes. Typically, TDS is used as a reliable indicator for borehole sampling at the site, given the known increasing concentration with depth across the site.
12) Collect samples for analyses according to event-specific SAP. Prepare sample containers and collect gas-sensitive analytes first. The preferred collection order will be volatile organic compounds (VOCs), semi-volatile organic compound (SVOCs), metals (including hexavalent chromium [Cr(VI)] and total chromium [Cr(T)]), then general chemistry (cations, anions, stable isotopes). Sample containers are to be filled by transferring water directly from the bailer to the appropriate sample container. For all samples, handle the bailer with care and decant from the bailer slowly to minimize the potential for aeration and turbulence as containers are filled.
13) Record sample information, final WL, and purge volume data on field log.
TOPOCK FIELD PROCEDURESMANUAL SOP-A5 REVISION 01 3/31/2005
SOP-A5_ GW_SAMPLING_BOREHOLE_R1.DOC 4 0F 4
14) Follow SOPs in Program Procedures Manual for sample handing and management, equipment decontamination, and IDW management.

TOPOCK FIELD PROCEDURES MANUAL SOP-A6, REVISION 02, 3/31/2005
SOP-A6 FIELD FILTRATION FINAL.DOC 1 OF 3
SOP-A6
Sample Field Filtration and Preservation for Metals Analyses Standard Operating Procedures for PG&E Topock Program
This standard operating procedure (SOP) addresses the procedures and equipment to be used for collecting groundwater / surface water samples for field filtered metals analyses at the Topock site. Refer to SOP- A1, A2, A3, or A4 for specific groundwater and surface water sampling methods.
REQUIRED DOCUMENTS
1) Event-specific sampling and analysis plan (SAP).
2) Applicable project work plan or monitoring plan. Refer to Topock Program Sampling, Analysis, and Field Procedures Manual and QAPP (Procedures Manual), as required.
3) Topock Program Health and Safety Plan (HSP)
4) Previous sampling logs
5) Blank sampling logs and field notebook
PREPARATION & SETUP
1) Review event-specific SAP or event-specific field instructions, previous sampling logs, Procedures Manual, and HSP.
2) Initiate field logbook for sampling activity.
3) Inventory sample bottles, required analyses, and lab courier schedule.
4) Field-check and setup sampling equipment: field filters, buffering solution, acid, and sample bottles.
FIELD-FILTRATION AND SAMPLE COLLECTION PROCEDURES FOR GROUNDWATER FROM MONITORING AND EXTRACTION WELLS
1) Follow SOPs A1 and A2.
Sample Collection
1) Once parameters are stabilized and a minimum 3-casing volumes have been removed from the well, disconnect the tubing from the flow-through cell and connect the inline 0.45 micron filter.
2) Allow 500 milliliters to flow through the inline filter. Fill the sample container by transferring water directly from the filter discharge to the appropriate sample container.
TOPOCK FIELD PROCEDURES MANUAL SOP-A6, REVISION 02, 3/31/2005
SOP-A6 FIELD FILTRATION FINAL.DOC 2 0F 3
Total Chromium and Metals Method SW 6010B
(i) Fill a laboratory provided pre-preserved sample bottle (250 ml poly containing HNO3) or unpreserved sample bottle (250 mL poly) with the sample to the top of the bottle neck. CARE MUST BE TAKEN NOT TO OVERFILL THE BOTTLE.
(ii) Test the pH of the sample with laboratory provided pH paper.
(iii) If the pH of the sample is greater than 2, add 5 drops of HNO3. Close the bottle, shake, test pH. Continue adding HNO3 in 5-drop increments until the pH is less than 2.
(iv) Record the total amount of HNO3 added to the sample and the pH on the chain of custody and field form. Seal, label, and place the sample on ice.
Hexavalent Chromium Method SW 7196A
(i) Fill a laboratory provided sample bottle (250 mL poly) to the top of the bottle neck.
(ii) Seal, label, and place the sample on ice.
Hexavalent Chromium Method SW 7199
(i) Fill a laboratory provided sample bottle (250 mL poly) to approximately 235 mL, leaving headspace for the addition of buffer solution.
(ii) Add 3 mL of laboratory provided buffer solution using a pipette. Place the lid on the sample bottle and shake gently. Test the pH using laboratory provided pH strips.
(iii) If the pH is less than 9, add ten drops (0.5 mL) of buffer solution, close bottle and shake gently. Test pH using laboratory provided pH strips. If the pH is less than 9, continue adding the buffer solution in 10-drop increments until the pH is between 9 and 9.5 or until 12.5 mL of buffer solution is added.
(iv) If the pH is less than 9 and 12.5 mL of buffer solution has been added, add one drop of 20% NH4OH, close bottle, gently shake, test pH. Continue until the pH is between 9 and 9.5.
(v) When the pH of the sample is between 9 and 9.5, record the total amount of pH buffer and 20% NH4OH added to the sample and the pH of the sample on the chain of custody and field form. Seal, label, and place the sample on ice.
3) Discard used pH paper(s) and filter in IDW bin.
4) Record sample information, final WL, and purge volume data on field log.
FILTRATION AND SAMPLE COLLECTION PROCEDURES FOR SURFACE WATER AND GROUNDWATER FROM PRODUCTION WELLS
5) Follow SOP-A4 for surface water and SOP-A3 for production well sampling.
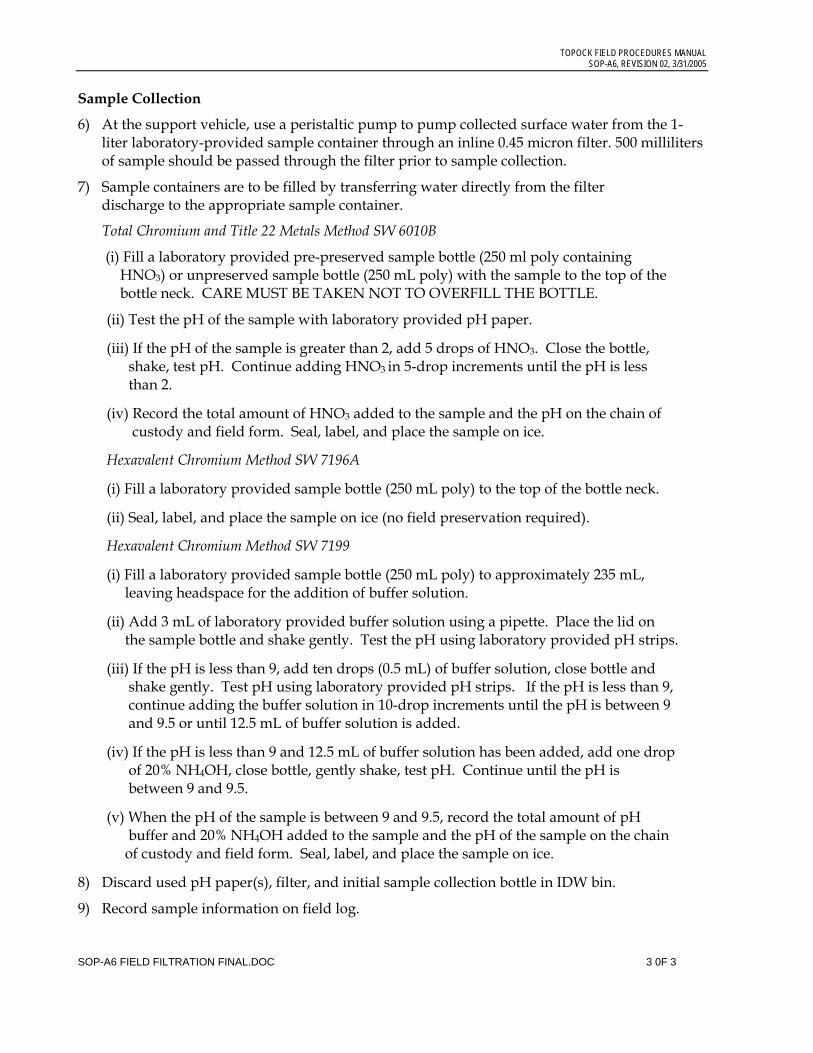
TOPOCK FIELD PROCEDURES MANUAL SOP-A6, REVISION 02, 3/31/2005
SOP-A6 FIELD FILTRATION FINAL.DOC 3 0F 3
Sample Collection
6) At the support vehicle, use a peristaltic pump to pump collected surface water from the 1-liter laboratory-provided sample container through an inline 0.45 micron filter. 500 milliliters of sample should be passed through the filter prior to sample collection.
7) Sample containers are to be filled by transferring water directly from the filter discharge to the appropriate sample container.
Total Chromium and Title 22 Metals Method SW 6010B
(i) Fill a laboratory provided pre-preserved sample bottle (250 ml poly containing HNO3) or unpreserved sample bottle (250 mL poly) with the sample to the top of the bottle neck. CARE MUST BE TAKEN NOT TO OVERFILL THE BOTTLE.
(ii) Test the pH of the sample with laboratory provided pH paper.
(iii) If the pH of the sample is greater than 2, add 5 drops of HNO3. Close the bottle, shake, test pH. Continue adding HNO3 in 5-drop increments until the pH is less than 2.
(iv) Record the total amount of HNO3 added to the sample and the pH on the chain of custody and field form. Seal, label, and place the sample on ice.
Hexavalent Chromium Method SW 7196A
(i) Fill a laboratory provided sample bottle (250 mL poly) to the top of the bottle neck.
(ii) Seal, label, and place the sample on ice (no field preservation required).
Hexavalent Chromium Method SW 7199
(i) Fill a laboratory provided sample bottle (250 mL poly) to approximately 235 mL, leaving headspace for the addition of buffer solution.
(ii) Add 3 mL of laboratory provided buffer solution using a pipette. Place the lid on the sample bottle and shake gently. Test the pH using laboratory provided pH strips.
(iii) If the pH is less than 9, add ten drops (0.5 mL) of buffer solution, close bottle and shake gently. Test pH using laboratory provided pH strips. If the pH is less than 9, continue adding the buffer solution in 10-drop increments until the pH is between 9 and 9.5 or until 12.5 mL of buffer solution is added.
(iv) If the pH is less than 9 and 12.5 mL of buffer solution has been added, add one drop of 20% NH4OH, close bottle, gently shake, test pH. Continue until the pH is between 9 and 9.5.
(v) When the pH of the sample is between 9 and 9.5, record the total amount of pH buffer and 20% NH4OH added to the sample and the pH of the sample on the chain of custody and field form. Seal, label, and place the sample on ice.
8) Discard used pH paper(s), filter, and initial sample collection bottle in IDW bin.
9) Record sample information on field log.
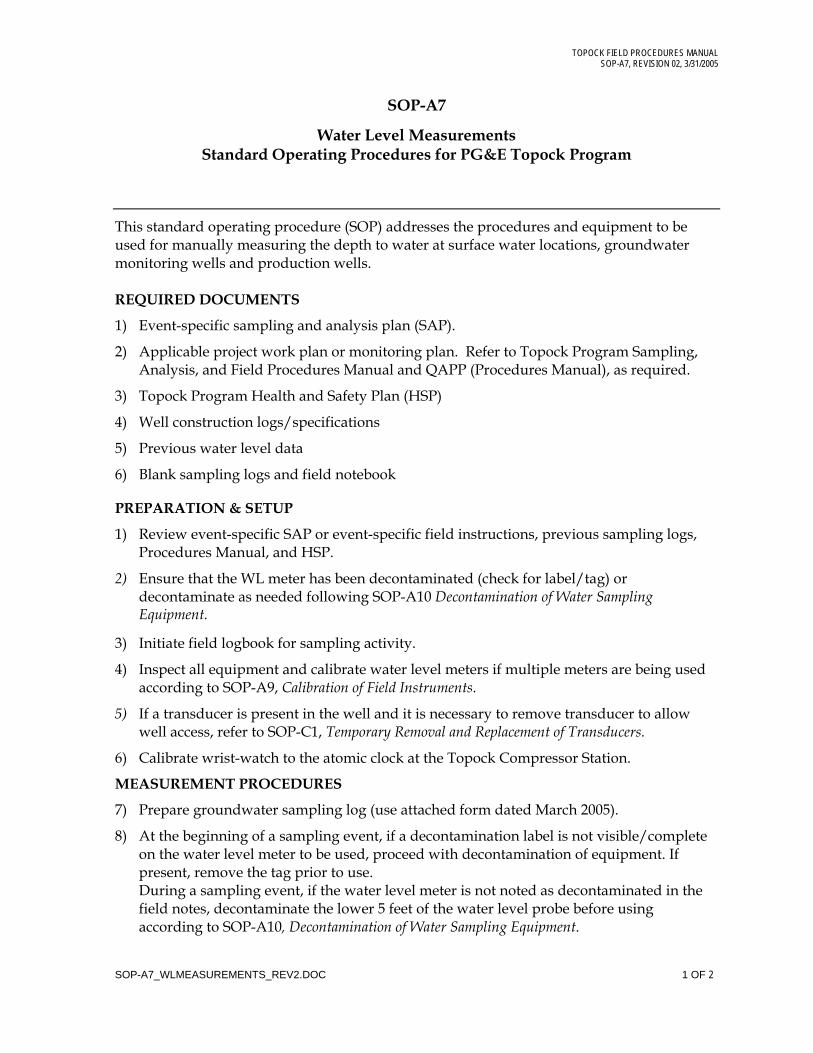
TOPOCK FIELD PROCEDURES MANUAL SOP-A7, REVISION 02, 3/31/2005
SOP-A7_WLMEASUREMENTS_REV2.DOC 1 OF 2
SOP-A7
Water Level Measurements Standard Operating Procedures for PG&E Topock Program
This standard operating procedure (SOP) addresses the procedures and equipment to be used for manually measuring the depth to water at surface water locations, groundwater monitoring wells and production wells.
REQUIRED DOCUMENTS
1) Event-specific sampling and analysis plan (SAP).
2) Applicable project work plan or monitoring plan. Refer to Topock Program Sampling, Analysis, and Field Procedures Manual and QAPP (Procedures Manual), as required.
3) Topock Program Health and Safety Plan (HSP)
4) Well construction logs/specifications
5) Previous water level data
6) Blank sampling logs and field notebook
PREPARATION & SETUP
1) Review event-specific SAP or event-specific field instructions, previous sampling logs, Procedures Manual, and HSP.
2) Ensure that the WL meter has been decontaminated (check for label/tag) or decontaminate as needed following SOP-A10 Decontamination of Water Sampling Equipment.
3) Initiate field logbook for sampling activity.
4) Inspect all equipment and calibrate water level meters if multiple meters are being used according to SOP-A9, Calibration of Field Instruments.
5) If a transducer is present in the well and it is necessary to remove transducer to allow well access, refer to SOP-C1, Temporary Removal and Replacement of Transducers.
6) Calibrate wrist-watch to the atomic clock at the Topock Compressor Station.
MEASUREMENT PROCEDURES
7) Prepare groundwater sampling log (use attached form dated March 2005).
8) At the beginning of a sampling event, if a decontamination label is not visible/complete on the water level meter to be used, proceed with decontamination of equipment. If present, remove the tag prior to use. During a sampling event, if the water level meter is not noted as decontaminated in the field notes, decontaminate the lower 5 feet of the water level probe before using according to SOP-A10, Decontamination of Water Sampling Equipment.
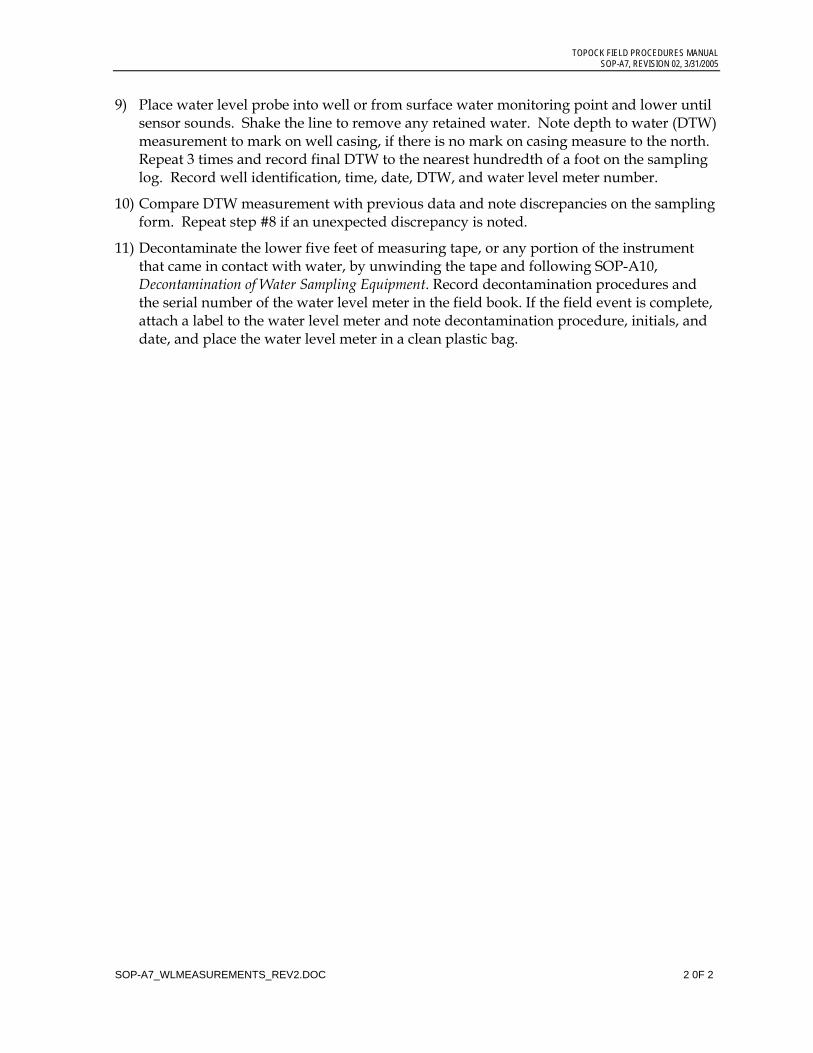
TOPOCK FIELD PROCEDURES MANUAL SOP-A7, REVISION 02, 3/31/2005
SOP-A7_WLMEASUREMENTS_REV2.DOC 2 0F 2
9) Place water level probe into well or from surface water monitoring point and lower until sensor sounds. Shake the line to remove any retained water. Note depth to water (DTW) measurement to mark on well casing, if there is no mark on casing measure to the north. Repeat 3 times and record final DTW to the nearest hundredth of a foot on the sampling log. Record well identification, time, date, DTW, and water level meter number.
10) Compare DTW measurement with previous data and note discrepancies on the sampling form. Repeat step #8 if an unexpected discrepancy is noted.
11) Decontaminate the lower five feet of measuring tape, or any portion of the instrument that came in contact with water, by unwinding the tape and following SOP-A10, Decontamination of Water Sampling Equipment. Record decontamination procedures and the serial number of the water level meter in the field book. If the field event is complete, attach a label to the water level meter and note decontamination procedure, initials, and date, and place the water level meter in a clean plastic bag.
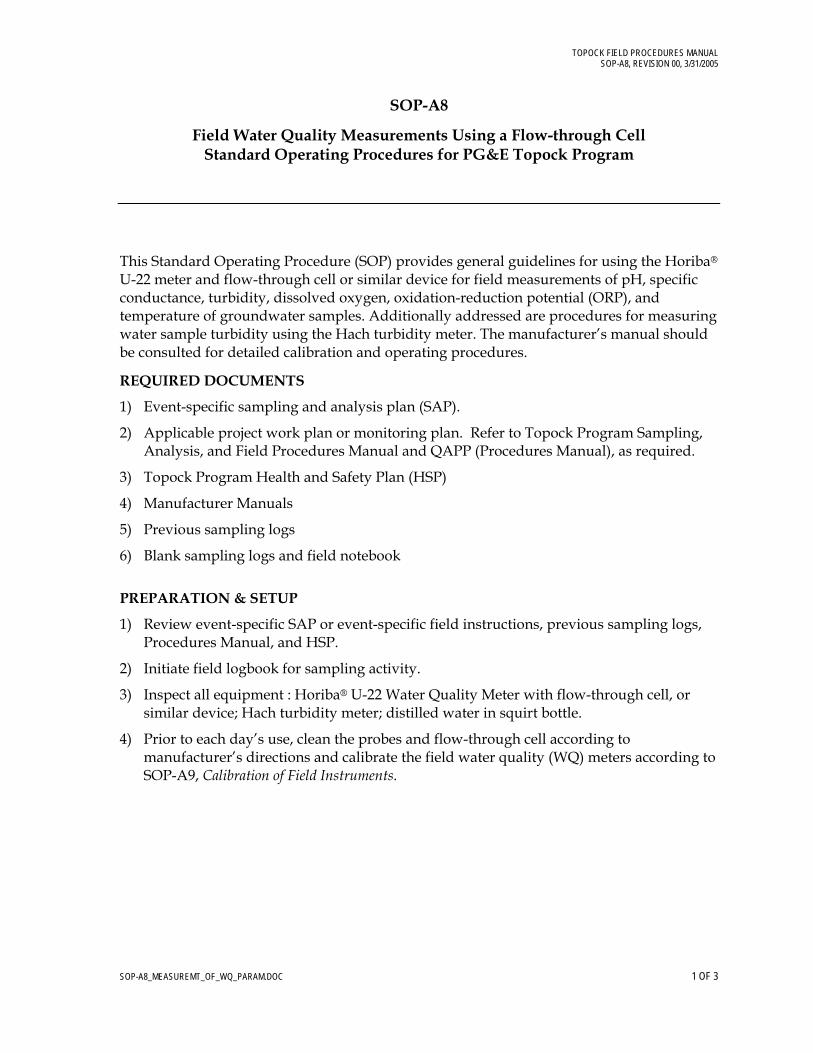
TOPOCK FIELD PROCEDURES MANUAL SOP-A8, REVISION 00, 3/31/2005
SOP-A8_MEASUREMT_OF_WQ_PARAM.DOC 1 OF 3
SOP-A8
Field Water Quality Measurements Using a Flow-through Cell Standard Operating Procedures for PG&E Topock Program
This Standard Operating Procedure (SOP) provides general guidelines for using the Horiba® U-22 meter and flow-through cell or similar device for field measurements of pH, specific conductance, turbidity, dissolved oxygen, oxidation-reduction potential (ORP), and temperature of groundwater samples. Additionally addressed are procedures for measuring water sample turbidity using the Hach turbidity meter. The manufacturer’s manual should be consulted for detailed calibration and operating procedures.
REQUIRED DOCUMENTS
1) Event-specific sampling and analysis plan (SAP).
2) Applicable project work plan or monitoring plan. Refer to Topock Program Sampling, Analysis, and Field Procedures Manual and QAPP (Procedures Manual), as required.
3) Topock Program Health and Safety Plan (HSP)
4) Manufacturer Manuals
5) Previous sampling logs
6) Blank sampling logs and field notebook
PREPARATION & SETUP
1) Review event-specific SAP or event-specific field instructions, previous sampling logs, Procedures Manual, and HSP.
2) Initiate field logbook for sampling activity.
3) Inspect all equipment : Horiba® U-22 Water Quality Meter with flow-through cell, or similar device; Hach turbidity meter; distilled water in squirt bottle.
4) Prior to each day’s use, clean the probes and flow-through cell according to manufacturer’s directions and calibrate the field water quality (WQ) meters according to SOP-A9, Calibration of Field Instruments.
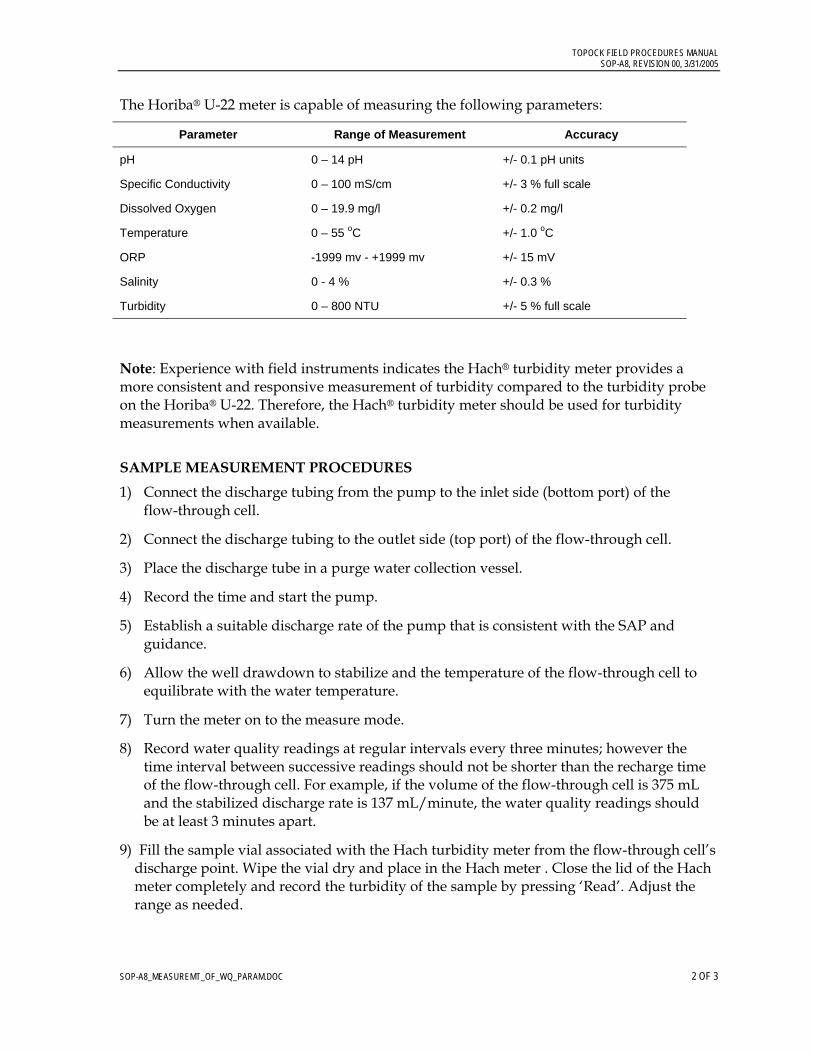
TOPOCK FIELD PROCEDURES MANUAL SOP-A8, REVISION 00, 3/31/2005
SOP-A8_MEASUREMT_OF_WQ_PARAM.DOC 2 OF 3
The Horiba® U-22 meter is capable of measuring the following parameters:
Parameter Range of Measurement Accuracy
pH 0 – 14 pH +/- 0.1 pH units
Specific Conductivity 0 – 100 mS/cm +/- 3 % full scale
Dissolved Oxygen 0 – 19.9 mg/l +/- 0.2 mg/l
Temperature 0 – 55 oC +/- 1.0 oC
ORP -1999 mv - +1999 mv +/- 15 mV
Salinity 0 - 4 % +/- 0.3 %
Turbidity 0 – 800 NTU +/- 5 % full scale
Note: Experience with field instruments indicates the Hach® turbidity meter provides a more consistent and responsive measurement of turbidity compared to the turbidity probe on the Horiba® U-22. Therefore, the Hach® turbidity meter should be used for turbidity measurements when available.
SAMPLE MEASUREMENT PROCEDURES
1) Connect the discharge tubing from the pump to the inlet side (bottom port) of the flow-through cell.
2) Connect the discharge tubing to the outlet side (top port) of the flow-through cell.
3) Place the discharge tube in a purge water collection vessel.
4) Record the time and start the pump.
5) Establish a suitable discharge rate of the pump that is consistent with the SAP and guidance.
6) Allow the well drawdown to stabilize and the temperature of the flow-through cell to equilibrate with the water temperature.
7) Turn the meter on to the measure mode.
8) Record water quality readings at regular intervals every three minutes; however the time interval between successive readings should not be shorter than the recharge time of the flow-through cell. For example, if the volume of the flow-through cell is 375 mL and the stabilized discharge rate is 137 mL/minute, the water quality readings should be at least 3 minutes apart.
9) Fill the sample vial associated with the Hach turbidity meter from the flow-through cell’s discharge point. Wipe the vial dry and place in the Hach meter . Close the lid of the Hach meter completely and record the turbidity of the sample by pressing ‘Read’. Adjust the range as needed.
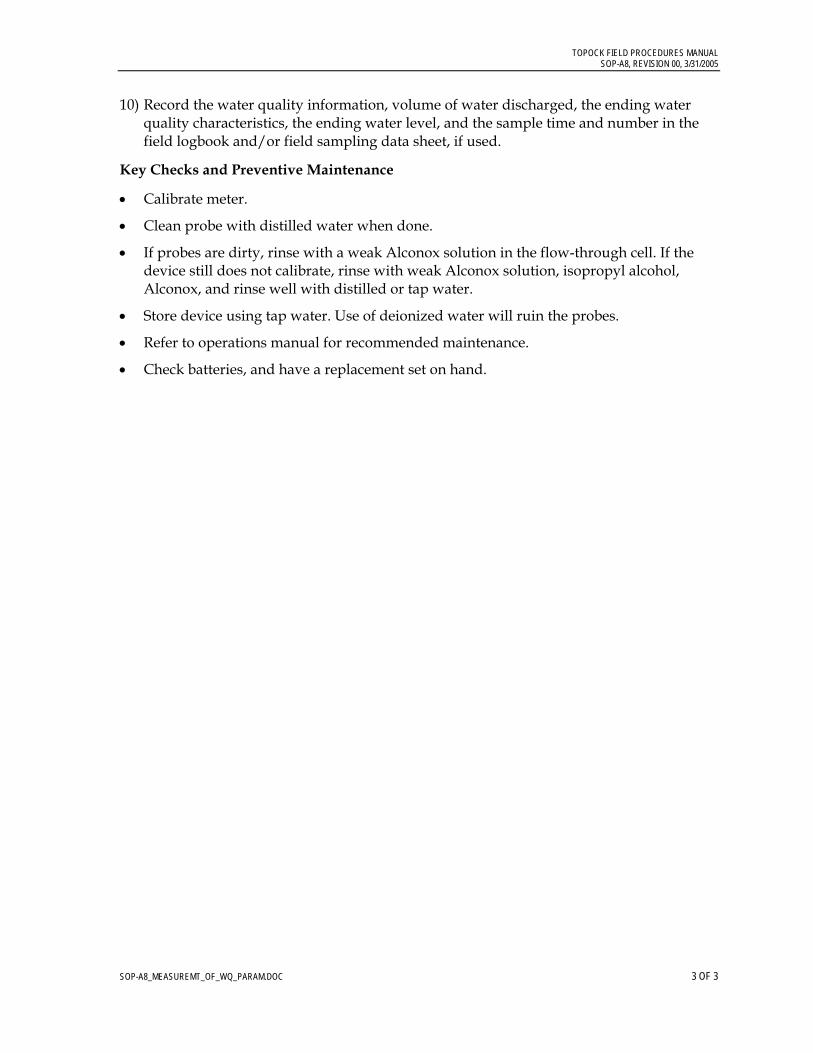
TOPOCK FIELD PROCEDURES MANUAL SOP-A8, REVISION 00, 3/31/2005
SOP-A8_MEASUREMT_OF_WQ_PARAM.DOC 3 OF 3
10) Record the water quality information, volume of water discharged, the ending water quality characteristics, the ending water level, and the sample time and number in the field logbook and/or field sampling data sheet, if used.
Key Checks and Preventive Maintenance
• Calibrate meter.
• Clean probe with distilled water when done.
• If probes are dirty, rinse with a weak Alconox solution in the flow-through cell. If the device still does not calibrate, rinse with weak Alconox solution, isopropyl alcohol, Alconox, and rinse well with distilled or tap water.
• Store device using tap water. Use of deionized water will ruin the probes.
• Refer to operations manual for recommended maintenance.
• Check batteries, and have a replacement set on hand.

TOPOCK FIELD PROCEDURES MANUAL SOP-A9, REVISION 01, 3/31/2005
SOP-A9_EQUIPMNT_CALIBRATION.DOC 1 OF 4
SOP-A9
Calibration of Field Instruments Standard Operating Procedures for PG&E Topock Program
This standard operating procedure (SOP) addresses the procedures and equipment to be used for calibration of field instruments at the Topock site. This SOP should be used for calibration of water level meters, Horiba-U22, Orion meter, and a Hach turbidity meter.
Required Documents
1) Event-specific sampling and analysis plan (SAP).
2) Applicable project work plan or monitoring plan. Refer to Topock Program Sampling, Analysis, and Field Procedures Manual and QAPP (Procedures Manual), as required.
3) Equipment Manufacturers’ Manual
4) Previous Calibration Records
5) Field Equipment Binder (documents equipment servicing, calibration, etc..)
6) Blank Calibration Sheets (see attached)
Preparation and Setup
1) Initiate field log sampling book for activity.
2) Inspect all equipment necessary to carry out activities detailed in event-specific SAP.
3) Always use fresh solutions for calibration.
4) Calibration should be performed prior to initiating sampling each day.
5) Review Field Equipment Binder equipment servicing records to anticipate next service.
6) All equipment and solutions are stored in an air-conditioned office onsite to maintain the integrity. Due to extreme temperature at the site, all calibrations are performed within this office.
7) The Horiba U-22 or Horiba U-23 and Hach turbidity meter shall be used as the principal field instruments for measuring water quality parameters during groundwater and surface water sampling. Use of the Orion pH/ORP meter should be restricted to field laboratory due to the less robust mechanics of the Orion and the specific design of the Horiba as a field instrument. If a Horiba instrument initial calibration fails and cannot be properly calibrated after repeated attempts and a replacement Horiba instrument is not available at the time, the Orion can be used as a field instrument on a temporary basis until a replacement Horiba is obtained.
Horiba U-22 – Equipment List:
-Autocal solution -Level II solution -Zobell’s ORP check solution
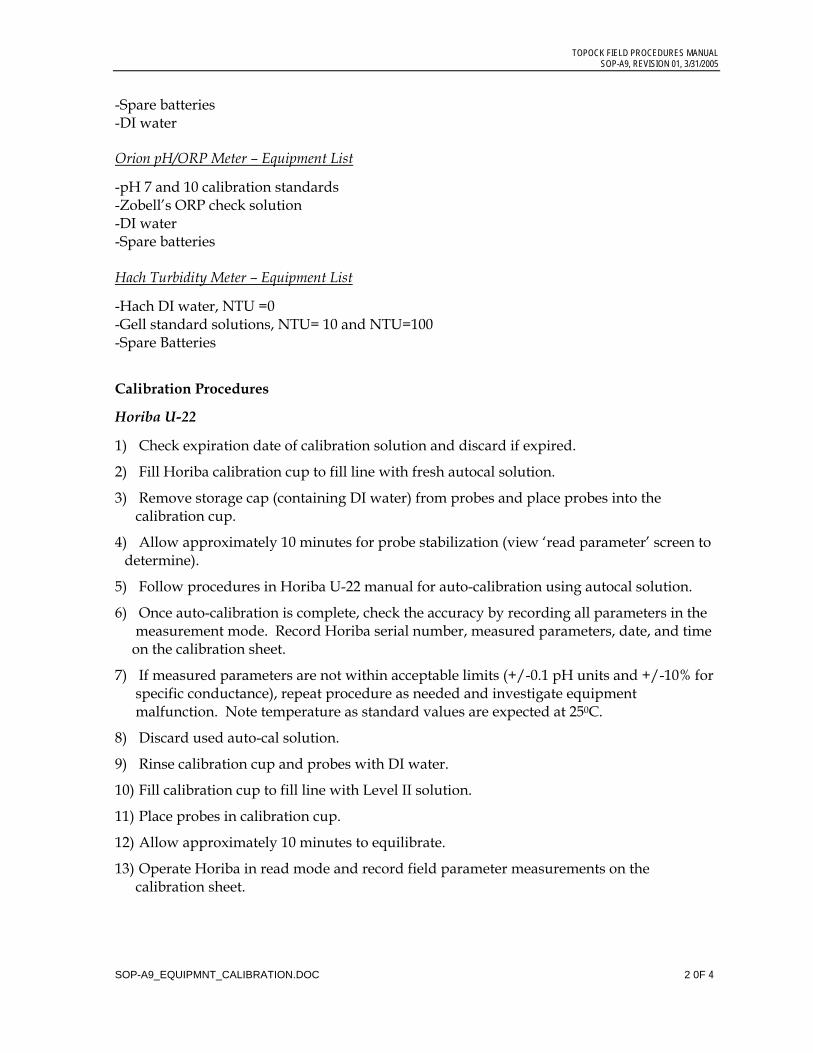
TOPOCK FIELD PROCEDURES MANUAL SOP-A9, REVISION 01, 3/31/2005
SOP-A9_EQUIPMNT_CALIBRATION.DOC 2 0F 4
-Spare batteries -DI water Orion pH/ORP Meter – Equipment List
-pH 7 and 10 calibration standards -Zobell’s ORP check solution -DI water -Spare batteries Hach Turbidity Meter – Equipment List
-Hach DI water, NTU =0 -Gell standard solutions, NTU= 10 and NTU=100 -Spare Batteries
Calibration Procedures
Horiba U-22
1) Check expiration date of calibration solution and discard if expired.
2) Fill Horiba calibration cup to fill line with fresh autocal solution.
3) Remove storage cap (containing DI water) from probes and place probes into the calibration cup.
4) Allow approximately 10 minutes for probe stabilization (view ‘read parameter’ screen to determine).
5) Follow procedures in Horiba U-22 manual for auto-calibration using autocal solution.
6) Once auto-calibration is complete, check the accuracy by recording all parameters in the measurement mode. Record Horiba serial number, measured parameters, date, and time on the calibration sheet.
7) If measured parameters are not within acceptable limits (+/-0.1 pH units and +/-10% for specific conductance), repeat procedure as needed and investigate equipment malfunction. Note temperature as standard values are expected at 250C.
8) Discard used auto-cal solution.
9) Rinse calibration cup and probes with DI water.
10) Fill calibration cup to fill line with Level II solution.
11) Place probes in calibration cup.
12) Allow approximately 10 minutes to equilibrate.
13) Operate Horiba in read mode and record field parameter measurements on the calibration sheet.

TOPOCK FIELD PROCEDURES MANUAL SOP-A9, REVISION 01, 3/31/2005
SOP-A9_EQUIPMNT_CALIBRATION.DOC 3 0F 4
14) If measured parameters are not within acceptable limits (+/-0.1 pH units and +/-10% for specific conductance), perform manual calibration of each parameter standard to match Level II solution. Note temperature as standard values are expected at 250C.
15) Operate Horiba in read mode and record field parameter measurements on the calibration sheet.
16) Discard used Level II solution.
17) Rinse probes with DI water.
18) Mix a fresh bottle of Zobell’s solution using DI water as per manufacturer’s instructions.
19) Fill calibration cup with the Zobells’s solution
20) Place probes into calibration cup.
21) Allow 10 minutes to equilibrate (view ‘read parameter’ screen to determine).
22) Operate Horiba in read mode and record field parameter measurements, temperature, time, and date on field calibration sheet.
23) If ORP exceeds +/- 25mV troubleshoot and repeat calibration. If the discrepancy persists, mark meter as “Not in Service” and use a different Horiba if available. Otherwise, use the Orion ORP meter.
24) Cap probes with transfer cup containing DI water.
25) Proceed with field measurements as needed while noting:
-probes must be rinsed thoroughly with DI water after each well. -probes must always be submersed in liquid (DI water when not in use). –absolutely no air bubbles nor leaks should be present in the flow-through cell, repair and/or replace as needed. –ensure all readings have stabilized prior to recording a measurement. –all field parameters must be compared with previous data and documented on the field data sheet.
Orion pH/ORP Meter
1) Inspect electrode for scratches, cracks, salt crystal build-up, or membrane/junction deposits.
2) Rinse off any salt build-up with DI water. Follow manufacturer cleaning procedures if needed.
3) Check expiration date of calibration solution and discard if expired.
pH probe
1) Attach the pH probe to the Orion meter.
2) Rinse electrode with DI water.
3) Place electrode into fresh container of pH 7 and wait until reading stabilizes.
4) Record reading, time, and date on field calibration sheet.
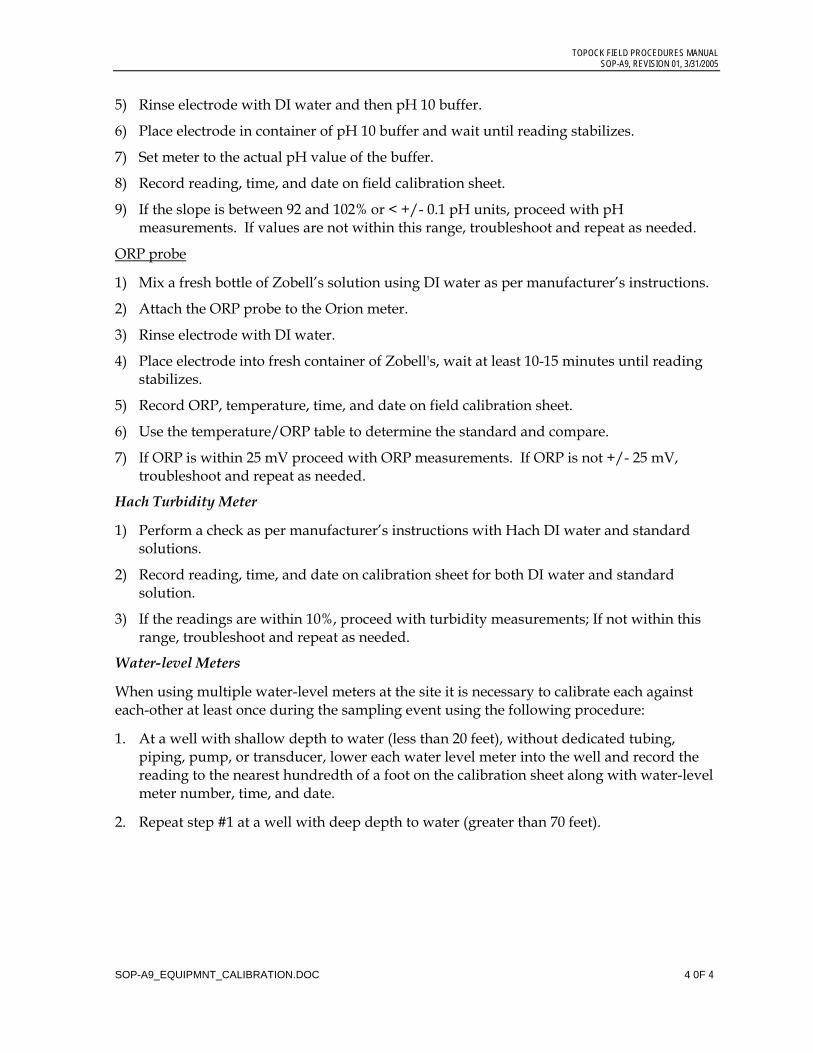
TOPOCK FIELD PROCEDURES MANUAL SOP-A9, REVISION 01, 3/31/2005
SOP-A9_EQUIPMNT_CALIBRATION.DOC 4 0F 4
5) Rinse electrode with DI water and then pH 10 buffer.
6) Place electrode in container of pH 10 buffer and wait until reading stabilizes.
7) Set meter to the actual pH value of the buffer.
8) Record reading, time, and date on field calibration sheet.
9) If the slope is between 92 and 102% or < +/- 0.1 pH units, proceed with pH measurements. If values are not within this range, troubleshoot and repeat as needed.
ORP probe
1) Mix a fresh bottle of Zobell’s solution using DI water as per manufacturer’s instructions.
2) Attach the ORP probe to the Orion meter.
3) Rinse electrode with DI water.
4) Place electrode into fresh container of Zobell's, wait at least 10-15 minutes until reading stabilizes.
5) Record ORP, temperature, time, and date on field calibration sheet.
6) Use the temperature/ORP table to determine the standard and compare.
7) If ORP is within 25 mV proceed with ORP measurements. If ORP is not +/- 25 mV, troubleshoot and repeat as needed.
Hach Turbidity Meter
1) Perform a check as per manufacturer’s instructions with Hach DI water and standard solutions.
2) Record reading, time, and date on calibration sheet for both DI water and standard solution.
3) If the readings are within 10%, proceed with turbidity measurements; If not within this range, troubleshoot and repeat as needed.
Water-level Meters
When using multiple water-level meters at the site it is necessary to calibrate each against each-other at least once during the sampling event using the following procedure:
1. At a well with shallow depth to water (less than 20 feet), without dedicated tubing, piping, pump, or transducer, lower each water level meter into the well and record the reading to the nearest hundredth of a foot on the calibration sheet along with water-level meter number, time, and date.
2. Repeat step #1 at a well with deep depth to water (greater than 70 feet).

Updated: February 2005
Calibrate each day prior to inititating sampling following SOP-A9.
U-22 instrument serial #Auto Calibration Performed: Y / N Units Date/Time Standard Measured Standard Measured Standard MeasuredAuto Calibration solution reading:
pH pH 4.00 4.00 4.00
Conductivity mS/cm 4.49 4.49 4.49
Turbidity ntu
DO mg/L
Temperature celsius 25.00 25.00 25.00
Salinity %
TDS g/L
ORP mV (Ag/AgCl)
Manufacturer, expiration date, lot number of auto calibration solution
Manual Calibration Performed: Y / NReadings (Auto Calibration solution)
pH pH
Conductivity mS/cm
Turbidity ntu
DO mg/L
Temperature celsius
Salinity %
TDS g/L
ORP mV (Ag/AgCl)
Manufacturer, expiration date, lot number of auto calibration solutionLevel II Solution Readings
pH pH 6.68 6.68 6.68
Conductivity mS/cm 53.00 53.00 53.00
Turbidity ntu 10 or 100 10 or 100 10 or 100
DO mg/L
Temperature celsius
Salinity %
TDS g/L
ORP mV (Ag/AgCl)
Manufacturer, expiration date, lot number of solution
Manual Calibration Performed: Y / NReadings (Level II solution)
pH pH
Conductivity mS/cm
Turbidity ntu
DO mg/L
Temperature celsius
Salinity %
TDS g/L
ORP mV (Ag/AgCl)
Horiba U-22/U-23, ORION, and Hach Turbidity Meter Calibration SheetProject Site: PG&E Topock
SOP-A9_CalibrationFieldForm.xls 1 of 3
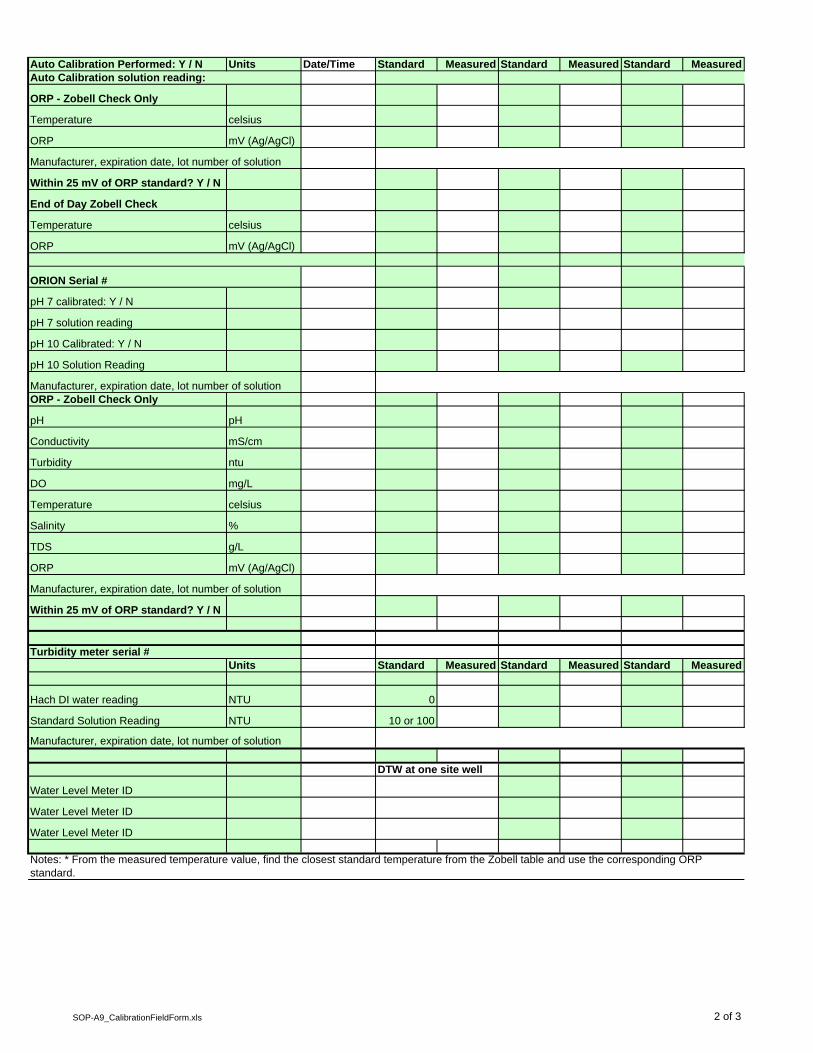
Updated: February 2005Auto Calibration Performed: Y / N Units Date/Time Standard Measured Standard Measured Standard MeasuredAuto Calibration solution reading:
ORP - Zobell Check Only
Temperature celsius
ORP mV (Ag/AgCl)
Manufacturer, expiration date, lot number of solution
Within 25 mV of ORP standard? Y / N
End of Day Zobell Check
Temperature celsius
ORP mV (Ag/AgCl)
ORION Serial #
pH 7 calibrated: Y / N
pH 7 solution reading
pH 10 Calibrated: Y / N
pH 10 Solution Reading
Manufacturer, expiration date, lot number of solutionORP - Zobell Check Only
pH pH
Conductivity mS/cm
Turbidity ntu
DO mg/L
Temperature celsius
Salinity %
TDS g/L
ORP mV (Ag/AgCl)
Manufacturer, expiration date, lot number of solution
Within 25 mV of ORP standard? Y / N
Turbidity meter serial #Units Standard Measured Standard Measured Standard Measured
Hach DI water reading NTU 0
Standard Solution Reading NTU 10 or 100
Manufacturer, expiration date, lot number of solution
DTW at one site well
Water Level Meter ID
Water Level Meter ID
Water Level Meter ID
Notes: * From the measured temperature value, find the closest standard temperature from the Zobell table and use the corresponding ORP standard.
SOP-A9_CalibrationFieldForm.xls 2 of 3

Updated: February 2005
Temp in ORP Temp in ORPdeg C (Ag/AgCl) deg C (Ag/AgCl)
(4M KCl) (4M KCl)mV mV
-5 270.0 23 233.6-4 268.7 24 232.3-3 267.4 25 231.0-2 266.1 26 229.7-1 264.8 27 228.40 263.5 28 227.11 262.2 29 225.82 260.9 30 224.53 259.6 31 223.24 258.3 32 221.95 257.0 33 220.66 255.7 34 219.37 254.4 35 218.08 253.1 36 216.79 251.8 37 215.4
10 250.5 38 214.111 249.2 39 212.812 247.9 40 211.513 246.6 41 210.214 245.3 42 208.915 244.0 43 207.616 242.7 44 206.317 241.4 45 205.018 240.1 46 203.719 238.8 47 202.420 237.5 48 201.121 236.2 49 199.822 234.9 50 198.5
Zobell solution-Temp/ORP Table
SOP-A9_CalibrationFieldForm.xls 3 of 3
TOPOCK FIELD PROCEDURES MANUAL SOP-A10, REVISION 02, 3/31/2005
SOP-A10_DECON_WQEQUIPMNT_REV2.DOC 1 OF 3
SOP-A10
Decontamination of Water Sampling Equipment Standard Operating Procedures for PG&E Topock Program
This standard operating procedure (SOP) addresses the procedures and equipment to be used for decontamination of sampling equipment at the Topock site.
Required Documents
1) Event-specific sampling and analysis plan (SAP).
2) Applicable project work plan or monitoring plan. Refer to Topock Program Sampling, Analysis, and Field Procedures Manual and QAPP (Procedures Manual), as required.
Preparation and Setup
1) Initiate field log sampling book for activity.
2) Inspect all equipment necessary to carry out activities detailed in event-specific SAP.
3) Review decontamination guidelines for equipment necessary to carry out activities.
Equipment List:
-Distilled water -2.5 percent (W/W) Alconox and distilled water solution -Large plastic pails or tubs for Alconox and distilled water, scrub brushes, squirt bottles for Alconox solution, distilled water, and clean plastic bags. -Trash pump to transfer used decontamination water from tubs to holding tank for disposal of waste. -Phthalate-free gloves Guidelines
Field Equipment
Water-level Indicators
Any portion of a water-level indicator (e.g. probe and/or cable) that contacts the groundwater must be decontaminated by washing with Alconox or Liquinox solution and rinse with distilled water after use. Probes/Cables Probes (e.g., pH or specific ion electrodes, geophysical probes, etc..) and/or cables that come into contact with groundwater will be decontaminated using the procedures specified below unless manufacturer's instructions indicate otherwise. For probes that make no direct contact (e.g.,OVM equipment), the probe will be wiped with paper towels.
TOPOCK FIELD PROCEDURES MANUAL SOP-A10, REVISION 02, 3/31/2005
SOP-A10_DECON_WQEQUIPMNT_REV2.DOC 2 0F 3
Other Sampling Equipment Other sampling equipment such as surface water sampling containers, spatulas, spoons, or bowls should be decontaminated and cleaned in the manner prescribed in this SOP. Procedures Sampling Equipment Decontamination—Groundwater Sampling Pumps Sampling pumps are decontaminated after each use as follows:
1. Don phthalate-free gloves.
2. Turn off pump after sampling. Remove pump from well and place pump in decontamination tub, making sure that tubing does not touch the ground.
3. Turn pump back on and pump 1 gallon of Alconox solution through the sampling pump.
4. Rinse with a minimum of 1 gallon of distilled water.
5. Keep decontaminated pump in decontamination tub or remove and wrap in clean plastic sheeting or clean plastic garbage bag.
6. Collect all rinsate and dispose of in a DOT-approved 55-gallon drum or holding tank.
7. Decontamination materials (e.g., plastic sheeting, tubing, etc.) that have come in contact with used decontamination fluids or sampling equipment will be disposed of in DOT-approved 55-gallon drums.
Sampling Equipment Decontamination—Other Equipment
Reusable sampling equipment is decontaminated after each use as follows.
1. Don phthalate-free gloves.
2. Wash all equipment surfaces that contacted the potentially contaminated soil/water with Alconox solution.
3. Rinse with distilled water or triple rinse with potable water.
4. Air dry and wrap exposed areas with plastic sheeting or a clean plastic garbage bag for transport and handling if equipment will not be used immediately.
5. Collect all rinsate and dispose of in a DOT-approved 55-gallon drum or holding tank.
6. Decontamination materials (e.g., plastic sheeting, tubing, etc.) that have come in contact with used decontamination fluids or sampling equipment will be disposed of in DOT-approved 55-gallon drums.
Key Checks and Items
• Clean with solutions of Alconox and distilled water.
• If necessary, decontaminate the outside of filled sample bottles before relinquishing them to anyone.
TOPOCK FIELD PROCEDURES MANUAL SOP-A10, REVISION 02, 3/31/2005
SOP-A10_DECON_WQEQUIPMNT_REV2.DOC 3 0F 3
• All materials generated during sampling (debris, PPE, decontamination liquids, etc.) will be placed in 55-gallon drums or rolloff bins for storage pending analysis and disposal off site.
• Document all decontamination procedures in the field log book. Prior to use of equipment during a sampling event, check log book to see that equipment was decontaminated, if not proceed with decontamination procedures prior to use. At the end of an event, tag equipment as decontaminated with initials and date. Remove the tag prior to use at the beginning of the next event. If at the beginning of a sampling event this tag is not visible/complete, proceed with decontamination of equipment.
• The effectiveness of field cleaning procedures will be monitored by rinsing decontaminated equipment (i.e. portable pump) with organic-free water and submitting the rinse water in standard sample containers for analysis. The minimum number of equipment blank samples will be at least one per team (per event), per piece of equipment decontaminated, during large-scale field sampling efforts.
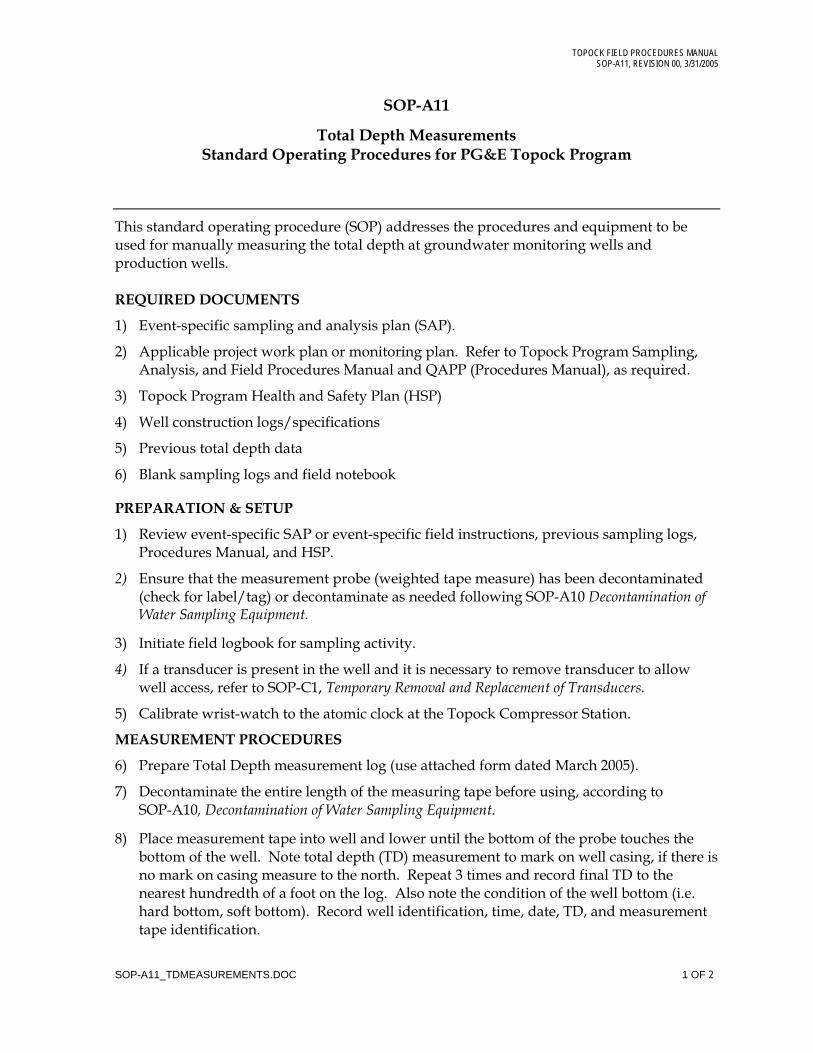
TOPOCK FIELD PROCEDURES MANUAL SOP-A11, REVISION 00, 3/31/2005
SOP-A11_TDMEASUREMENTS.DOC 1 OF 2
SOP-A11
Total Depth Measurements Standard Operating Procedures for PG&E Topock Program
This standard operating procedure (SOP) addresses the procedures and equipment to be used for manually measuring the total depth at groundwater monitoring wells and production wells.
REQUIRED DOCUMENTS
1) Event-specific sampling and analysis plan (SAP).
2) Applicable project work plan or monitoring plan. Refer to Topock Program Sampling, Analysis, and Field Procedures Manual and QAPP (Procedures Manual), as required.
3) Topock Program Health and Safety Plan (HSP)
4) Well construction logs/specifications
5) Previous total depth data
6) Blank sampling logs and field notebook
PREPARATION & SETUP
1) Review event-specific SAP or event-specific field instructions, previous sampling logs, Procedures Manual, and HSP.
2) Ensure that the measurement probe (weighted tape measure) has been decontaminated (check for label/tag) or decontaminate as needed following SOP-A10 Decontamination of Water Sampling Equipment.
3) Initiate field logbook for sampling activity.
4) If a transducer is present in the well and it is necessary to remove transducer to allow well access, refer to SOP-C1, Temporary Removal and Replacement of Transducers.
5) Calibrate wrist-watch to the atomic clock at the Topock Compressor Station.
MEASUREMENT PROCEDURES
6) Prepare Total Depth measurement log (use attached form dated March 2005).
7) Decontaminate the entire length of the measuring tape before using, according to SOP-A10, Decontamination of Water Sampling Equipment.
8) Place measurement tape into well and lower until the bottom of the probe touches the bottom of the well. Note total depth (TD) measurement to mark on well casing, if there is no mark on casing measure to the north. Repeat 3 times and record final TD to the nearest hundredth of a foot on the log. Also note the condition of the well bottom (i.e. hard bottom, soft bottom). Record well identification, time, date, TD, and measurement tape identification.
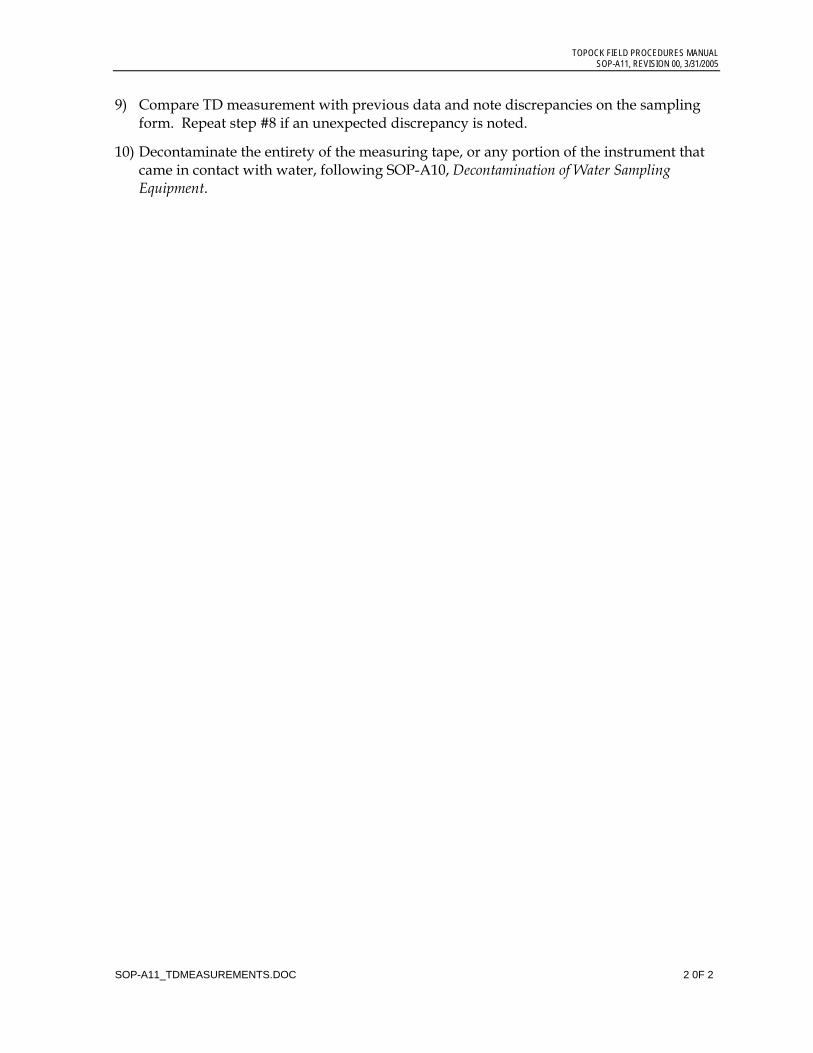
TOPOCK FIELD PROCEDURES MANUAL SOP-A11, REVISION 00, 3/31/2005
SOP-A11_TDMEASUREMENTS.DOC 2 0F 2
9) Compare TD measurement with previous data and note discrepancies on the sampling form. Repeat step #8 if an unexpected discrepancy is noted.
10) Decontaminate the entirety of the measuring tape, or any portion of the instrument that came in contact with water, following SOP-A10, Decontamination of Water Sampling Equipment.
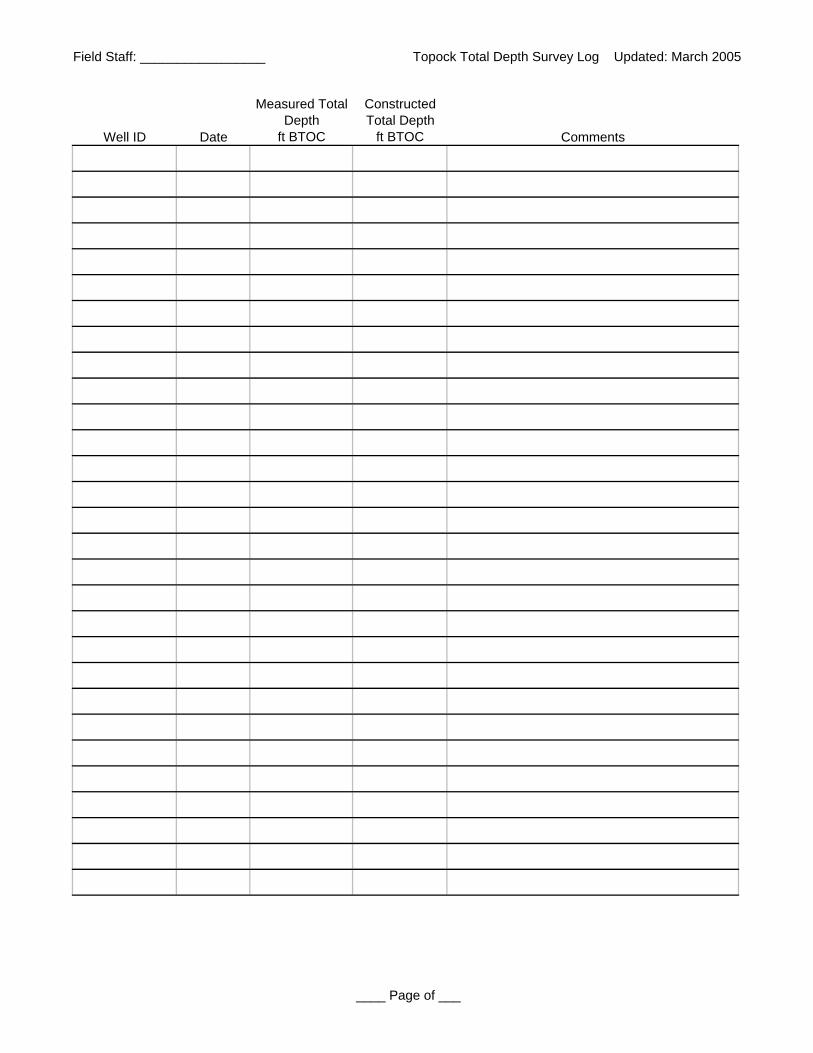
Field Staff: _________________ Topock Total Depth Survey Log Updated: March 2005
Well ID Date
Measured Total Depth
ft BTOC
Constructed Total Depth
ft BTOC Comments
____ Page of ___

SFO\FIELDPROCEDURES_REVISION1.DOC
Appendix B Standard Operating Procedures for Drilling,
Logging, and Well Installation
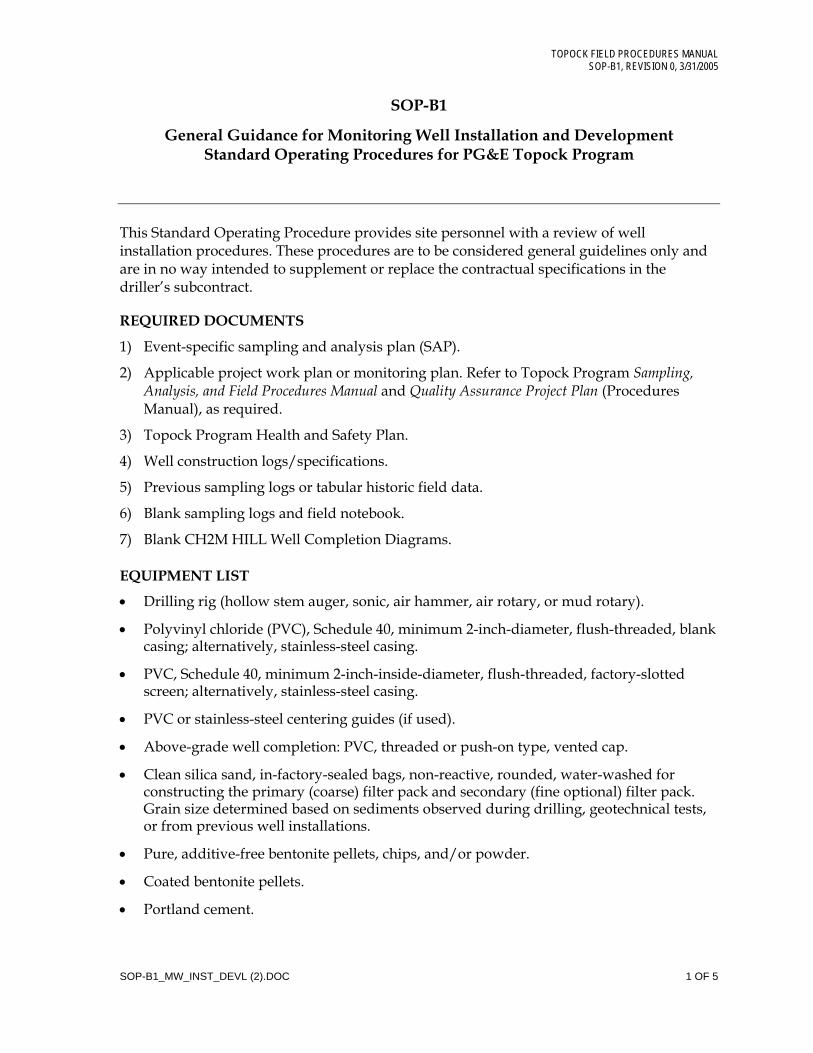
TOPOCK FIELD PROCEDURES MANUAL SOP-B1, REVISION 0, 3/31/2005
SOP-B1_MW_INST_DEVL (2).DOC 1 OF 5
SOP-B1
General Guidance for Monitoring Well Installation and Development Standard Operating Procedures for PG&E Topock Program
This Standard Operating Procedure provides site personnel with a review of well installation procedures. These procedures are to be considered general guidelines only and are in no way intended to supplement or replace the contractual specifications in the driller’s subcontract.
REQUIRED DOCUMENTS
1) Event-specific sampling and analysis plan (SAP).
2) Applicable project work plan or monitoring plan. Refer to Topock Program Sampling, Analysis, and Field Procedures Manual and Quality Assurance Project Plan (Procedures Manual), as required.
3) Topock Program Health and Safety Plan.
4) Well construction logs/specifications.
5) Previous sampling logs or tabular historic field data.
6) Blank sampling logs and field notebook.
7) Blank CH2M HILL Well Completion Diagrams.
EQUIPMENT LIST
• Drilling rig (hollow stem auger, sonic, air hammer, air rotary, or mud rotary).
• Polyvinyl chloride (PVC), Schedule 40, minimum 2-inch-diameter, flush-threaded, blank casing; alternatively, stainless-steel casing.
• PVC, Schedule 40, minimum 2-inch-inside-diameter, flush-threaded, factory-slotted screen; alternatively, stainless-steel casing.
• PVC or stainless-steel centering guides (if used).
• Above-grade well completion: PVC, threaded or push-on type, vented cap.
• Clean silica sand, in-factory-sealed bags, non-reactive, rounded, water-washed for constructing the primary (coarse) filter pack and secondary (fine optional) filter pack. Grain size determined based on sediments observed during drilling, geotechnical tests, or from previous well installations.
• Pure, additive-free bentonite pellets, chips, and/or powder.
• Coated bentonite pellets.
• Portland cement.
TOPOCK FIELD PROCEDURES MANUAL SOP-B1, REVISION 0, 3/31/2005
SOP-B1_MW_INST_DEVL (2).DOC 2 OF 5
• Above-grade well completion: minimum 6-inch-inside-diameter steel pipe with locking cover, diameter at least 2 inches greater than the well casing, painted for rust protection; heavy duty lock; protective posts if appropriate.
• Flush-mount well completion: Morrison 9-inch or 12-inch 519 manhole cover or equivalent; rubber seal to prevent leakage; locking cover inside of traffic-rated box.
• Single- or double-surge block with solid bottom, open top, separated by 2 feet of slotted pipe (double surge block only).
• Well-development pump, pump controller, and steam cleaner.
• Calibrated meter(s) to measure pH, temperature, specific conductance, turbidity, dissolved oxygen, and total dissolved solids (TDS) of purged water during well development.
• Containers (Department of Transportation [DOT]-approved 5-gallon drums or trailer-mounted water tank) for water produced from well.
GUIDELINES
1) Wells will be installed in accordance with standard United States Environmental Protection Agency (USEPA) procedures.
2) The threaded connections will be water-tight.
3) Well screens generally will be constructed of 10-slot or 20-slot Schedule 40 PVC and will be 10 to 20 feet long, depending on the requirements of the well. The exact slot size and length will be determined by the field team supervisor. Stainless steel may be required under certain contaminant conditions.
4) Wells will be surrounded by four concrete-filled, 3-inch-diameter guard posts.
5) A record of the finished well construction will be compiled.
6) All soils and liquids generated during well installations will be placed in lined, roll-off containers pending proper disposal.
WELL TYPES
There are several basic types of monitoring wells: single-cased, double-cased, clustered, nested, and multiple-port wells. The first three are recommended for general use in most hydrogeologic investigations.
Single-cased Wells. A single-cased well consists of a section of slotted well screen connected to a riser pipe that extends to above or just below the ground surface. An artificial filter pack is placed in the annulus between the screen and the borehole to 2 to 3 feet above the top of the well screen. A transitional seal fills the annular space directly above the filter pack, followed by bentonite-cement or sand-cement grout to the ground surface.
Double-cased Wells. Double- or multiple-cased wells are often installed when the aquifer zone to be sampled must be isolated from overlying aquifer zones to prevent cross contamination between aquifer zones. Typically, a large-diameter boring (14 to 16 inches or more in diameter) is drilled into a low-permeability material (clay) immediately below the
TOPOCK FIELD PROCEDURES MANUAL SOP-B1, REVISION 0, 3/31/2005
SOP-B1_MW_INST_DEVL (2).DOC 3 OF 5
zone to be sealed off. Steel conductor casing with welded joints and an outside diameter that is at least 4 inches smaller than the hole diameter is lowered into the borehole, centered, and pushed into the clay up to 10 feet. A bentonite-cement or sand-cement grout is then pumped through a tremie pipe into the annular space, between the conductor casing and the formation from the bottom up to the ground surface.
Clustered Wells. Well clusters consist of two or more wells installed in proximity to one another but screened at different intervals in different boreholes. Single- and double-cased wells may both be included in the well cluster. Well cluster systems allow sampling of groundwater from different aquifers or from different zones within the same aquifer with essentially no risk of cross contamination between the aquifers. Installation procedures for each well in a well cluster are the same as for single- or double-cased wells.
Nested Wells. Nested wells consist of more than one well casing installed in a single borehole. Nested wells allow groundwater sampling and measurement of water levels from two or more different zones or aquifers using one borehole. Each well is screened at a different depth, and seals are placed above and below each well screen.
Multiple-port Wells. Multiple-port wells have multiple screens on the same casing string with sampling ports at different depths separated by inflatable or mechanical packers. This arrangement allows for discrete sampling at different depths across a large vertical extent in one thick aquifer or in several thinner ones.
PROCEDURES
Monitoring Well Installation
This section presents procedures for the installation of the monitoring wells, including discussion of borehole completion; installation of the casing and screen, artificial filter pack, and borehole seals; and surface completion.
1) Monitoring wells in unconsolidated materials will be installed in at least 6-inch-diameter boreholes to accommodate well completion materials in designated locations.
2) Monitoring wells in unconsolidated materials will be constructed of 2-inch-diameter, factory manufactured, flush-jointed, Schedule 40 PVC screen with threaded bottom plug and riser.
3) Screens will be filter packed with a properly-sized, properly-graded, thoroughly-washed, sound, durable, well-rounded basalt or siliceous sand. When using sonic drill casing, the filter pack will be installed by slowly pouring the sand into the annular space while raising the casing in 1 to 3 foot intervals and using a weighted tape to sound for the sand surface.
4) Following each lift of the drill casing, the well casing height will be checked for settling or to see if the casing was pulled up.
5) The primary filter sand pack (typically Monterey #3 or equivalent) will extend from 1 to 2 feet below the base to 2 feet above the top of the screen; for non-sonic drilling methods the filter pack will be allowed to settle and hydrate before final measurement is taken. Alternately, a surge block can be used to agitate the sand and facilitate settling. For sonic drilling, the vibration induced during casing removal serves to properly settle the sand.

TOPOCK FIELD PROCEDURES MANUAL SOP-B1, REVISION 0, 3/31/2005
SOP-B1_MW_INST_DEVL (2).DOC 4 OF 5
For wells that are installed with approved screen lengths longer than 20 feet, the filter pack will be proportionally extended above the top of the screen to allow for settling of the longer pack.
6) A secondary filter sand pack (typically Monterey #30 or equivalent) 1 foot thick will be placed above the primary sand pack.
7) Annular well seals will consist of 2 to 5 feet of pelletized or granular bentonite clay placed above the filter pack. If necessary, the pellets will be hydrated using potable water. For wells drilled using sonic, the bentonite will be poured into the annular space while raising the drill casing in 1- to 3-foot increments and sounding for the top of the bentonite with a weighted tape. The height of the well seal also will be sounded with a weighted tape.
8) The top of the annular seal will be measured after the pellets have been allowed to hydrate and before the grout is applied. The pellets will be allowed to hydrate for at least 30 minutes before work in the well continues.
9) The annular space above the bentonite seal will be filled to grade with a bentonite-cement slurry grout mixture.
10) The grout mixture consists of 94 pounds of cement (1 bag) per 6 gallons of water and 2 to 3 pounds of powdered bentonite per bag of cement to reduce shrinkage.
11) The grout mix will be carefully applied to avoid disturbing the bentonite seal; the method of grout placement must force grout from the bottom of the space to be grouted to the surface.
12) After allowing the grout to settle and set up overnight, additional grout will be added to maintain grade.
13) A protective steel casing equipped with keyed-alike locking caps will be grouted in place for each new well; the casing will extend at least 2 feet above grade and 3 feet below grade and will be painted a bright color.
Well Development
1) New monitoring wells will be developed after the well has been completely installed and the grout has hardened (a minimum of 24 hours following grouting).
2) The well will be developed by bailing, surging, and pumping.
3) Equipment placed in the well will be decontaminated before use.
4) If information is available, the least-contaminated well will be developed first.
5) Initial development will be with a bailer (i.e., stainless-steel, 10-foot-long bailer) to facilitate removal of coarse-grained sediment.
6) The well will subsequently be surged using a surge block across the screened interval. Additional bailing will be performed if significant coarse sediment is still present.
TOPOCK FIELD PROCEDURES MANUAL SOP-B1, REVISION 0, 3/31/2005
SOP-B1_MW_INST_DEVL (2).DOC 5 OF 5
7) Following bailing and surging, a submersible pump will be lowered into the well. Development may include surging the well by abruptly stopping flow and allowing water in the well column to fall back into the well.
8) Pumping will continue until the water produced is free of turbidity (less than 10 NTU) and water quality parameters (i.e., pH, temperature, conductivity, TDS, and dissolved oxygen) have stabilized.
9) Development water will be considered hazardous and placed in sealed 55-gallon DOT-approved steel drums or other approved containers (i.e., lined roll-off bins).
KEY CHECK AND ITEMS
• Ensure that all equipment is properly decontaminated as needed.
• Only new, sealed materials (e.g., screens, risers, and sand) will be used in constructing the well.
• Care will be taken when making downhole measurements to ensure that proper heights of sand, seal, and grout are achieved.
• Fill out CH2M HILL Well Completion Diagram (see Attachment A).
• All materials generated during sampling (debris, PPE, decontamination liquids, etc.) will be placed in approved investigation-derived waste storage containers (i.e., drums or roll-offs) for storage pending analysis and disposal off site.
TOPOCK FIELD PROCEDURE MANUAL SOP-B2, REVISION 0, 3/31/05
SOP-B2_SOILCLASSIFICATIONANDLOGGINGPROCEDURES_BM.DOC 1 OF 21
SOP-B2
Soil Classification and Logging Procedures Standard Operating Procedures for PG&E Topock Program
This standard operating procedure (SOP) provides guidance to obtain accurate and consistent descriptions of soil characteristics during soil-sampling operations. The characterization is based on visual examination and manual tests not on laboratory determinations.
REQUIRED DOCUMENTS
1) Event-specific sampling and analysis plan, work plan or event-specific field instructions. Planned borehole depth, proposed well construction/specifications, and field sampling summary table, if available.
2) Applicable project work plan or monitoring plan. Refer to Topock Program Sampling, Analysis, and Field Procedures Manual and Quality Assurance Project Plan (Procedures Manual), as required.
3) Topock Program Health and Safety Plan (HSP).
4) Previous sampling, drilling, or well construction logs from other boreholes or wells in the vicinity, if available.
5) Blank field notebook.
6) Blank CH2M HILL soil boring log Form D1586.
PREPARATION AND SETUP
1) Review event-specific work plan or event-specific field instructions, previous sampling logs, Procedures Manual, and HSP.
2) Initiate field logbook for sampling activity.
3) Review sampling procedures and equipment, and planned sample depths with drilling contractor and field crew.
EQUIPMENT LIST
• Indelible pens
• Tape measure or ruler
• Field logbook
• Spatula
• HCl, 10-percent solution
• Squirt bottle/Spray bottle with water

TOPOCK FIELD PROCEDURE MANUAL SOP-B2, REVISION 0, 3/31/05
SOP-B2_SOILCLASSIFICATIONANDLOGGINGPROCEDURES_BM.DOC 2 OF 21
• Rock- or soil-color chart (e.g., Munsell)
• Grain-size chart
• Hand lens
• Unified Soil Classification System index charts and tables to help with soil classification
PROCEDURES
This section covers several aspects of the soil characterization: instructions for completing the CH2M HILL soil boring log Form D1586 (attached) and field classification of soil.
Instructions for Completing Soil Boring Logs
• Soil boring logs will be completed on field boring log forms. Information collected will be consistent with that required for Form D1586 (attached), a standard CH2M HILL form, or an equivalent form that supplies the same information.
• The information collected in the field to perform the soil characterization is described below.
• Field personnel should review completed logs for accuracy, clarity, and thoroughness of detail. Samples also should be checked to see that information is correctly recorded on both jar lids and labels and on the log sheets.
Heading Information
1) Boring/Well Number. Enter the boring/well number. A numbering system should be chosen that does not conflict with information recorded for previous exploratory work done at the site. Number the sheets consecutively for each boring.
2) Location. If stationing, coordinates, mileposts, or similar project layout information is available, indicate the position of the boring to that system using modifiers such as “approximate” or “estimated,” as appropriate.
3) Elevation. Elevation will be determined at the conclusion of field activities.
4) Drilling Contractor. Enter the name of the drilling company and the city and state where the company is based.
5) Drilling Method and Equipment. Identify the bit size and type, drilling fluid (if used), and method of drilling (e.g., rotary, hollow-stem auger, sonic). Information on the drilling equipment (e.g., CME 55, Mobile B61) should be noted.
6) Water Level and Date. Enter the depth below ground surface to the apparent water level in the borehole. The information should be recorded as a comment. If free water is not encountered during drilling or cannot be detected because of the drilling method, this information should be noted. Record date and time of day (for tides, river stage) of each water level measurement.
7) Date of Start and Finish. Enter the dates the boring was started and completed. Time of day should be added if several borings are performed on the same day.
TOPOCK FIELD PROCEDURE MANUAL SOP-B2, REVISION 0, 3/31/05
SOP-B2_SOILCLASSIFICATIONANDLOGGINGPROCEDURES_BM.DOC 3 OF 21
8) Logger. Enter the first initial and full last name of the logger.
Technical Data
1) Depth Below Surface. Use a depth scale that is appropriate for the sample spacing and for the complexity of subsurface conditions.
2) Sample Interval. Note the depth at the top and bottom of the sample interval.
3) Sample Type and Number. Enter the sample type and number. SS-1 = split spoon, first sample. Number samples consecutively regardless of type. Enter a sample number even if no material was recovered in the sampler.
4) Sample Recovery. Enter the length to the nearest 0.1 foot of soil sample recovered from the sampler. Often, there will be some wash or caved material above the sample; do not include the wash material in the measurement. Record recovery in feet.
5) Soil Description. The soil classification should follow the format described in the “Field Classification of Soil” subsection below. `
6) Comments. Include all pertinent observations (changes in drilling fluid color, rod drops, drilling chatter, rod bounce as in driving on a cobble, damaged Shelby tubes, and equipment malfunctions). In addition, note if casing was used, the sizes and depths installed, and if drilling fluid was added or changed. You should instruct the driller to alert you to any significant changes in drilling (changes in material, occurrence of boulders, and loss of drilling fluid). Such information should be attributed to the driller and recorded in this column. Specific information might include:
• The date and the time drilling began and ended each day.
• The depth and size of casing and the method of installation.
• The date, time, and depth of water level measurements.
• Depth of rod chatter.
• Depth and percentage of drilling fluid loss.
• Depth of hole caving or heaving.
• Depth of change in material.
• Health and safety monitoring data.
• Drilling interval through a boulder.
Field Classification of Soil
This section presents the format for the field classification of soil. In general, the approach and format for classifying soils should conform to ASTM D 2488, “Visual-Manual Procedure for Description and Identification of Soils” (see Attachment B).

TOPOCK FIELD PROCEDURE MANUAL SOP-B2, REVISION 0, 3/31/05
SOP-B2_SOILCLASSIFICATIONANDLOGGINGPROCEDURES_BM.DOC 4 OF 21
• The Unified Soil Classification System is based on numerical values of certain soil properties that are measured by laboratory tests (ASTM D 2487). It is possible, however, to estimate these values in the field with reasonable accuracy using visual-manual procedures (ASTM D 2488). In addition, some elements of a complete soil description, such as the presence of cobbles or boulders, changes in strata, and the relative proportions of soil types in a bedded deposit can be obtained only in the field.
• Soil descriptions should be precise and comprehensive without being verbose. The correct overall impression of the soil should not be distorted by excessive emphasis on insignificant details. In general, similarities rather than differences between consecutive samples should be stressed.
Soil Descriptions
Soil descriptions must be recorded for every soil sample collected. The format and order for soil descriptions should be:
1) Soil name (synonymous with ASTM D 2488 Group Name) with appropriate modifiers. Soil name should be in all capitals in the log, for example “POORLY-GRADED SAND.”
2) Group symbol, in parentheses, for example, “(SP).”
3) Color, using Munsell color designation.
4) Particle size distribution (i.e., sand, silt, clay).
5) Moisture content.
6) Relative density or consistency.
7) Soil structure, mineralogy, or other descriptors.
This order follows, in general, the format described in ASTM D 2488.
(1) Soil Name
The basic name of a soil should be the ASTM D 2488 Group Name on the basis of visual estimates of gradation and plasticity. The soil name should be capitalized.
Examples of acceptable soil names are illustrated by the following descriptions:
• A soil sample is visually estimated to contain 15-percent gravel, 55-percent sand, and 30-percent fines (passing No. 200 sieve). The fines are estimated as either low- or highly-plastic silt. This visual classification is SILTY SAND WITH GRAVEL with a Group Symbol of (SM).
• Another soil sample has the following visual estimate: 10-percent gravel, 30-percent sand, and 60-percent fines (passing the No. 200 sieve). The fines are estimated as low-plastic silt. This visual classification is SANDY SILT. The gravel portion is not included in the soil name because the gravel portion was estimated as less than 15 percent. The Group Symbol is (ML).
The gradation of coarse-grained soil (more than 50 percent retained on No. 200 sieve) is included in the specific soil name in accordance with ASTM D 2488.
TOPOCK FIELD PROCEDURE MANUAL SOP-B2, REVISION 0, 3/31/05
SOP-B2_SOILCLASSIFICATIONANDLOGGINGPROCEDURES_BM.DOC 5 OF 21
• There is no need to further document the gradation.
• However, the maximum size and angularity or roundness of gravel and sand-sized particles should be recorded.
• For fine-grained soil (50 percent or more passing the No. 200 sieve), the name is modified by the appropriate plasticity/elasticity term in accordance with ASTM D 2488.
Interlayered soil should each be described starting with the predominant type.
• An introductory name, such as “Interlayered Sand and Silt,” should be used.
• In addition, the relative proportion of each soil type should be indicated (see Table 1 for example).
Where helpful, the evaluation of plasticity/elasticity can be justified by describing results from any of the visual-manual procedures for identifying fine-grained soils, such as reaction to shaking, toughness of a soil thread, or dry strength as described in ASTM D 2488.
(2) Group Symbol
The appropriate group symbol from ASTM D 2488 must be given after each soil name.
1) The group symbol should be placed in parentheses to indicate that the classification has been estimated.
2) In accordance with ASTM D 2488, dual symbols (e.g., GP-GM or SW-SC) can be used to indicate that a soil is estimated to have about 10-percent fines.
3) Borderline symbols (e.g., GM/SM or SW/SP) can be used to indicate that a soil sample has been identified as having properties that do not distinctly place the soil into a specific group. Generally, the group name assigned to a soil with a borderline symbol should be the group name for the first symbol. The use of a borderline symbol should not be used indiscriminately. Every effort should be made to first place the soil into a single group.
(3) Color
Soil color is described by comparing the sample with the Munsell Soil Color Charts. The Munsell colors should be used unless directed otherwise by project sampling plans. Instructions for their proper use are in the color charts. The color name shall precede the Munsell color notation (e.g., “yellowish brown, 10 YR 5/4”), with color hue and chroma number parenthetically entered in the borelog description. If no color chip is available, the color should be simply described as primary color (i.e., green, brown, gray, yellow, tan, etc.).
(4) Particle Size Distribution
Within the gravel sizes and the sand sizes, there are further divisions based on particle sizes. Gravel is divided into fine and coarse gravel. Fine-gravel particles (pebbles) are those that would pass through 3/4-inch opening but not a 1/4-inch opening. The fine gravel ranges from pea- to marble-sized. Coarse-gravel particles are those that would pass through a 3-inch opening but not a 3/4-in opening. Common objects of this size are grapes and tennis balls. Cobbles range from 3 inches to 12 inches in size; boulders are larger than 12 inches.
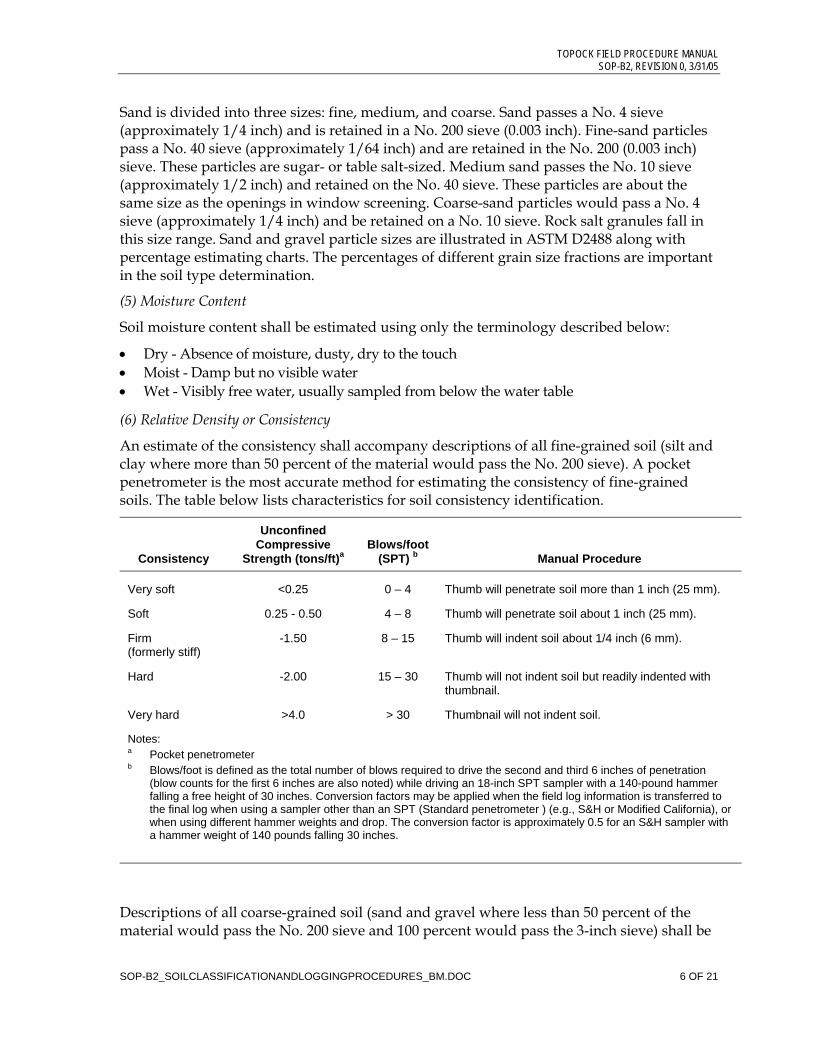
TOPOCK FIELD PROCEDURE MANUAL SOP-B2, REVISION 0, 3/31/05
SOP-B2_SOILCLASSIFICATIONANDLOGGINGPROCEDURES_BM.DOC 6 OF 21
Sand is divided into three sizes: fine, medium, and coarse. Sand passes a No. 4 sieve (approximately 1/4 inch) and is retained in a No. 200 sieve (0.003 inch). Fine-sand particles pass a No. 40 sieve (approximately 1/64 inch) and are retained in the No. 200 (0.003 inch) sieve. These particles are sugar- or table salt-sized. Medium sand passes the No. 10 sieve (approximately 1/2 inch) and retained on the No. 40 sieve. These particles are about the same size as the openings in window screening. Coarse-sand particles would pass a No. 4 sieve (approximately 1/4 inch) and be retained on a No. 10 sieve. Rock salt granules fall in this size range. Sand and gravel particle sizes are illustrated in ASTM D2488 along with percentage estimating charts. The percentages of different grain size fractions are important in the soil type determination.
(5) Moisture Content
Soil moisture content shall be estimated using only the terminology described below:
• Dry - Absence of moisture, dusty, dry to the touch • Moist - Damp but no visible water • Wet - Visibly free water, usually sampled from below the water table
(6) Relative Density or Consistency
An estimate of the consistency shall accompany descriptions of all fine-grained soil (silt and clay where more than 50 percent of the material would pass the No. 200 sieve). A pocket penetrometer is the most accurate method for estimating the consistency of fine-grained soils. The table below lists characteristics for soil consistency identification.
Consistency
Unconfined Compressive
Strength (tons/ft)a Blows/foot
(SPT) b Manual Procedure
Very soft <0.25 0 – 4 Thumb will penetrate soil more than 1 inch (25 mm).
Soft 0.25 - 0.50 4 – 8 Thumb will penetrate soil about 1 inch (25 mm).
Firm (formerly stiff)
-1.50 8 – 15 Thumb will indent soil about 1/4 inch (6 mm).
Hard -2.00 15 – 30 Thumb will not indent soil but readily indented with thumbnail.
Very hard >4.0 > 30 Thumbnail will not indent soil.
Notes: a Pocket penetrometer b Blows/foot is defined as the total number of blows required to drive the second and third 6 inches of penetration
(blow counts for the first 6 inches are also noted) while driving an 18-inch SPT sampler with a 140-pound hammer falling a free height of 30 inches. Conversion factors may be applied when the field log information is transferred to the final log when using a sampler other than an SPT (Standard penetrometer ) (e.g., S&H or Modified California), or when using different hammer weights and drop. The conversion factor is approximately 0.5 for an S&H sampler with a hammer weight of 140 pounds falling 30 inches.
Descriptions of all coarse-grained soil (sand and gravel where less than 50 percent of the material would pass the No. 200 sieve and 100 percent would pass the 3-inch sieve) shall be

TOPOCK FIELD PROCEDURE MANUAL SOP-B2, REVISION 0, 3/31/05
SOP-B2_SOILCLASSIFICATIONANDLOGGINGPROCEDURES_BM.DOC 7 OF 21
accompanied by an estimate of the density based upon standard penetrometer (SPT) blow counts. The following terminology should be used:
Density Blows/foot (SPT)
Very loose < 4
Loose 4-10
Medium dense 10-30
Dense 30-50
Very dense > 50
(7) Soil Structure, Mineralogy, and Other Descriptors
Discontinuities and inclusions are important and should be described. Such features include joints or fissures, slickensides, bedding or laminations, veins, root holes, and wood debris.
Significant mineralogical information such as cementation, abundant mica, or unusual mineralogy should be described.
Other descriptors may include particle angularity or shape, maximum particle size, hardness of large particles, plasticity of fines, dry strength, dilatancy, toughness, reaction to HCl, and staining, as well as other information such as organic debris, odor, or presence of free product. Criteria for the use of these other descriptions include:
• Structure:
− Stratified - Alternating layers of varying material or color with layers at least 1/4-inch thick; note thickness.
− Laminated - Alternating layers of varying material or color with the layers less than 1/4-inch thick; note thickness.
− Fissured - Breaks along definite planes of fracture with little resistance.
− Slickensides - Fracture planes appear polished or glossy, often striated.
− Blocky - Cohesive soil that can be broken down into small angular lumps that resist further breakdown.
− Lensed - Inclusion of small pockets of different soils, such as lenses of sand within clay; note thickness.
− Homogeneous - Same color and appearance throughout.
− Grading - Whether the particles increase or decrease in size toward the top of logged interval.
• Particle Shape:
− Flat - Particles with width/thickness ratio > 3. − Elongated - Particles with length/width ratio > 3.
TOPOCK FIELD PROCEDURE MANUAL SOP-B2, REVISION 0, 3/31/05
SOP-B2_SOILCLASSIFICATIONANDLOGGINGPROCEDURES_BM.DOC 8 OF 21
− Elongated and flat - Particles meet criteria for both flat and elongated.
• Particle Angularity:
− Angular - Particles have sharp edges and relatively planar sides with unpolished surfaces.
− Subangular - Particles are similar to angular description but have rounded edges.
− Subrounded - Particles have nearly planar sides but have well-rounded corners and edges.
− Rounded - Particles have smoothly-curved sides and no edges.
• Cementation:
− Weak - rumbles or breaks with handling or little finger pressure. − Moderate - Crumbles or breaks with considerable finger pressure. − Strong - Will not crumble or break with finger pressure.
• Reaction with HCl:
− None - No visible reaction. − Weak - Some reaction, bubbles forming slowly. − Strong - Vigorous reaction, bubbles forming immediately.
Comments
This section should be reserved for information not pertaining to lithologic description. Sample information including sample identifier, analysis, matrix, and depth interval should be included in the boring log comments. Information related to drilling, such as drilling rate, chatter, and equipment malfunctions should also be well documented in the comments section of the boring log. Additionally interpretations of the lithologic data may also be presented in the comments section. Examples of this include “transition between Older Alluvium and Fanglomerate,” “paleosol horizon B,” or “conductive zone.”
Recovery
Recovery data are entered along the left side of the boring log. Enter the length of retrieved core to the nearest 0.1 foot of sample recovered and record the value in feet. Do not count slough or caved material as part of the total recovered length of core. Record total length and percent of sample recovered. If using a 5-foot sample barrel, multiply the total length by 2 and 100 to get a percentage number. Similarly, if using a 2.5-foot sampler, multiply by 4 and 100 to get the percent recovery.
Backfilling
When a boring is completed and the water level measured, the boring shall be backfilled to ground surface according to applicable regulations. The destruction of the hole shall be noted on the log. Borehole destruction should follow SOP 28 Soil Boring Abandonment
Attachments
TOPOCK FIELD PROCEDURE MANUAL SOP-B2, REVISION 0, 3/31/05
SOP-B2_SOILCLASSIFICATIONANDLOGGINGPROCEDURES_BM.DOC 9 OF 21
• Soil Boring Log, CH2M HILL Form D1586, and a completed example
• ASTM D 2488: Standard Practice for Description and Identification of Soils (Visual-Manual Procedures)
Key Checks and Preventive Maintenance
Check entries to the soil boring log and field logbook in the field; because the samples will be disposed of, confirmation and corrections cannot be made later. Check that sample numbers and intervals are properly specified. Check that drilling and sampling equipment is decontaminated using the procedures defined in SOP Decontamination of Drilling Rigs and Equipment.

ATTACHMENT A
Examples of Soil Bore Logs


ATTACHMENT B
ASTM D-2488
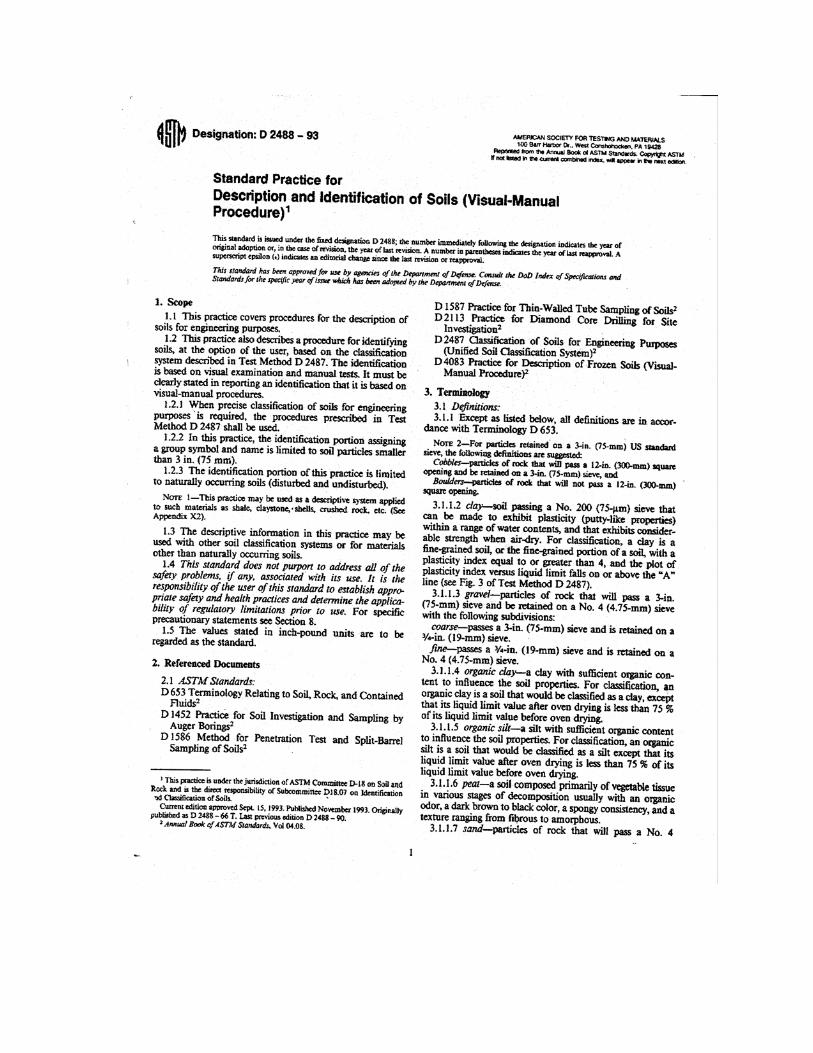
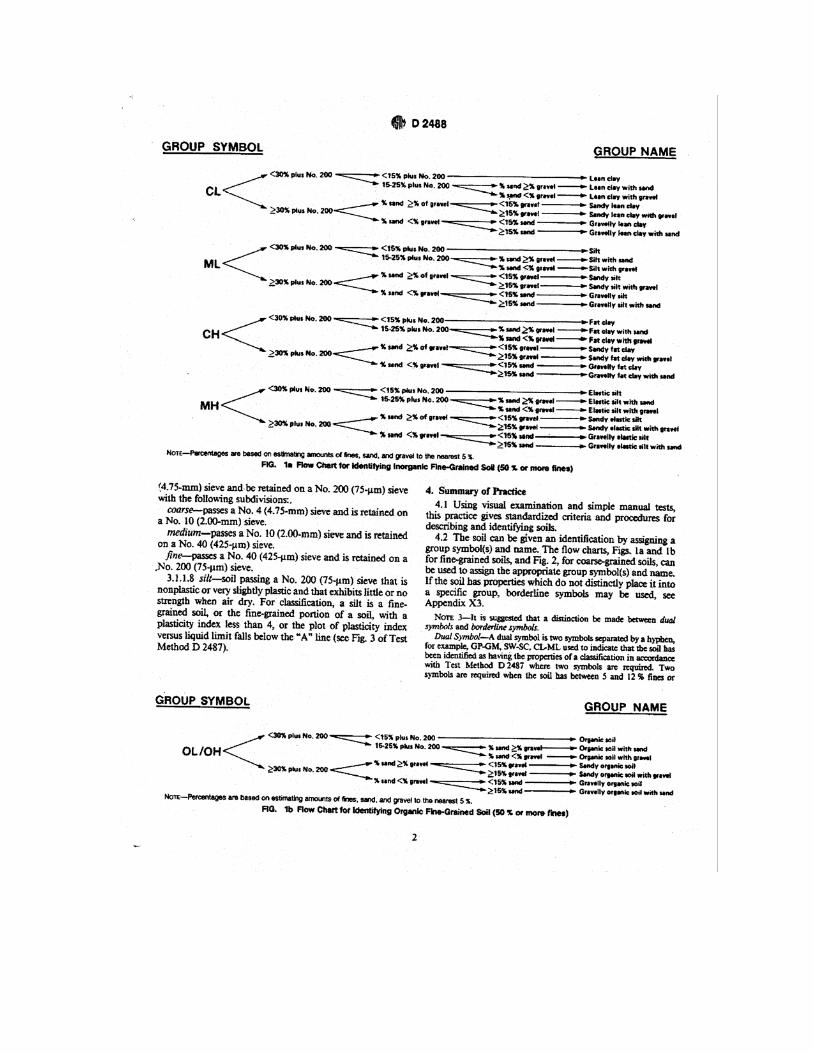


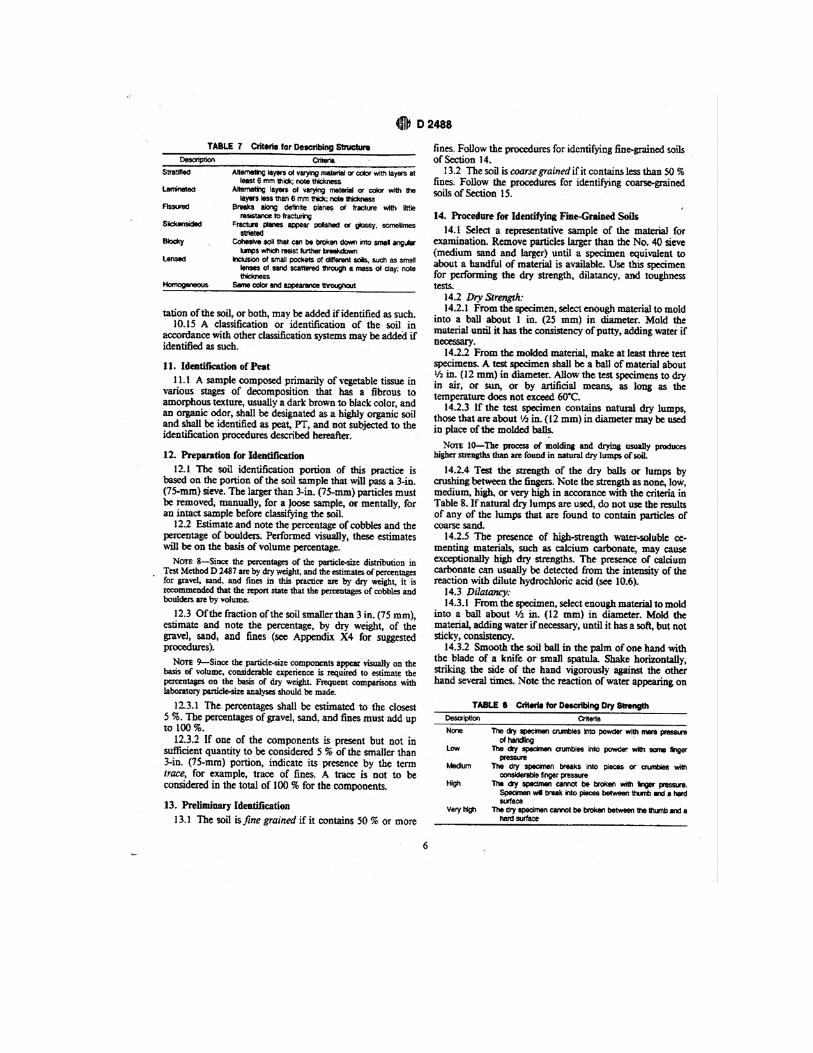


TOPOCK FIELD PROCEDURE MANUAL SOP-B3, REVISION 0, 3/31/05
SOP-B3_BOREHOLESAMPANDLOGBORINGS_BM.DOC 1 OF 18
SOP-B3
Borehole Sampling and Logging of Soil Borings Standard Operating Procedures for PG&E Topock Program
This standard operating procedure (SOP) provides guidance for sample collection from soil borings during the drilling process, and proper documentation necessary. Detailed guidance for sample collection, preservation and handling is provided in Section 4.0 of the site Quality Assurance Project Plan (QAPP) and in the Topock Program Sampling, Analysis, and Field Procedures Manual (Procedures Manual). SOP-B2 provides detailed guidance for soil characterization and logging.
REQUIRED DOCUMENTS
1) Event-specific sampling and analysis plan (SAP), work plan or event-specific field instructions. Planned borehole depth, proposed well construction/specifications, and field sampling summary table, if available.
2) Applicable project work plan or monitoring plan. Refer to the Procedures Manual and QAPP, as required.
3) Topock Program Health and Safety Plan (HSP).
4) Previous sampling, drilling, or well construction logs from other boreholes or wells in the vicinity, if available.
5) Blank sampling log and field notebook.
PREPARATION AND SETUP
1) Review event-specific work plan or event-specific field instructions, previous sampling logs, Procedures Manual, and HSP.
2) Initiate field logbook for sampling activity.
3) Review sampling procedures and equipment, and planned sample depths with drilling contractor and field crew.
Equipment List
• Field logbook
• Borehole log
• Blue or black waterproof or permanent ink pens
• Trash bags
• Plastic sandwich bags
• Paper towels
TOPOCK FIELD PROCEDURE MANUAL SOP-B3, REVISION 0, 3/31/05
SOP-B3_BOREHOLESAMPANDLOGBORINGS_BM.DOC 2 OF 18
• Stainless steel sampling equipment (provided by driller)
• Decontamination equipment (Alconox® solution in spray bottle, brushes, buckets, rinse water spray bottle)
• Soil sample containers appropriate for sample analysis and preservation as called for in SAP and QAPP (glass jars, brass sleeves, Encore® containers, sandwich bags, etc.)
• Soil sampling equipment not provided by driller (spatula or putty knife, stainless steel compositing bowl, hand auger, etc.)
• Groundwater sample containers appropriate for sample analysis and preservation as called for in SAP and QAPP (glass jars, VOA vials, plastic jars, etc.)
• Groundwater sample equipment not provided by driller (pump, filters, tubing, power supply, etc.)
• Water quality meters
• Water level indicator
• Distilled water
• Coolers with ice
• Protective waterproof gloves (nitrile or latex)
GUIDELINES
Soil Boring Logs Documentation
Soil boring logs will be completed on the soil boring log forms during the drilling activities at the time of the logging and soil descriptions. Information collected will be consistent with the standard CH2M HILL form (See SOP-B2 attachment A). Sample data may also be documented in the comments section of the boring log (Form D1586).
Items documented on the borehole log include:
1) Sample Interval: The top and bottom depth of each sample run should be recorded on the borelog. Sampling includes samples collected for analysis as well as core retrieved for logging purposes.
2) Sample Type and Number: Enter the sample type and number consistent with the sampling and analysis plan at the correct depth intervals. An “x” should be placed across the vertical interval where the environmental soil, grab groundwater, or geotechnical sample was collected.
3) Sample Recovery: Enter the length of retrieved core to the nearest 0.1 foot of sample recovered, and record the value in feet. Do not count slough or caved material as part of the total recovered length of core. Record total length and percent of sample recovered. If using a 5-foot sample barrel, multiply the total length by 2 and 100 to get a percentage number. Similarly, if using a 2.5-foot sampler, multiply by 4 and 100 to get the percent recovery.
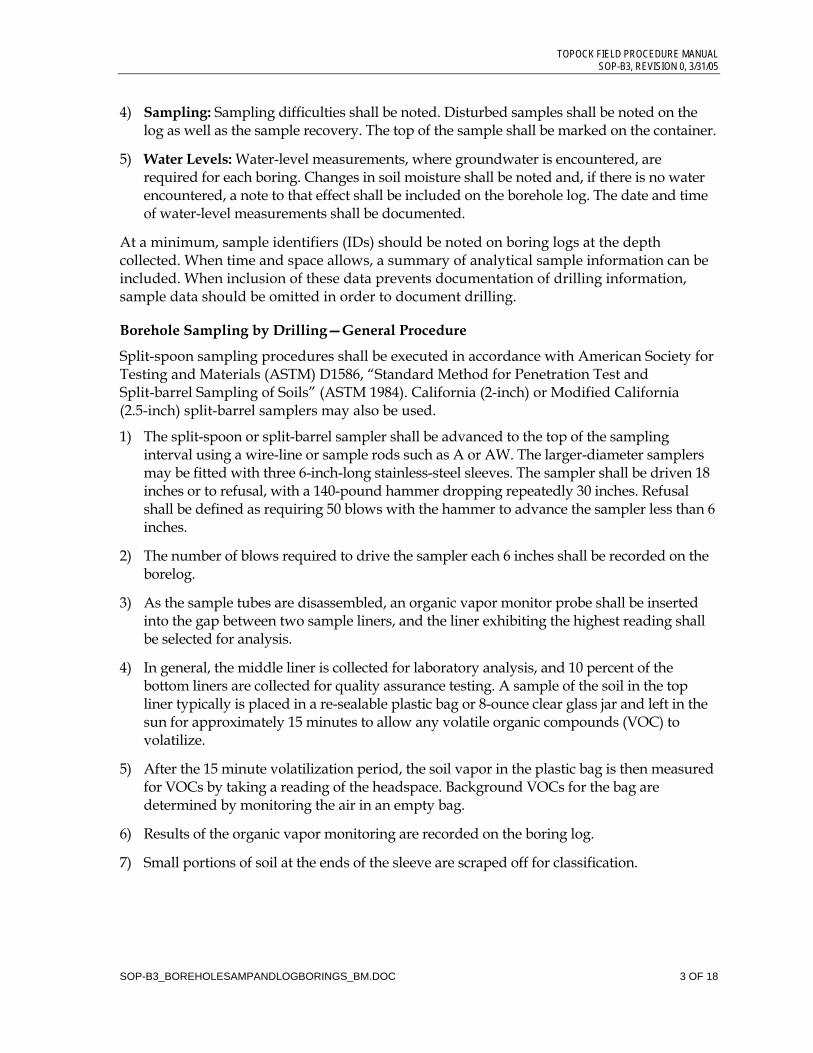
TOPOCK FIELD PROCEDURE MANUAL SOP-B3, REVISION 0, 3/31/05
SOP-B3_BOREHOLESAMPANDLOGBORINGS_BM.DOC 3 OF 18
4) Sampling: Sampling difficulties shall be noted. Disturbed samples shall be noted on the log as well as the sample recovery. The top of the sample shall be marked on the container.
5) Water Levels: Water-level measurements, where groundwater is encountered, are required for each boring. Changes in soil moisture shall be noted and, if there is no water encountered, a note to that effect shall be included on the borehole log. The date and time of water-level measurements shall be documented.
At a minimum, sample identifiers (IDs) should be noted on boring logs at the depth collected. When time and space allows, a summary of analytical sample information can be included. When inclusion of these data prevents documentation of drilling information, sample data should be omitted in order to document drilling.
Borehole Sampling by Drilling—General Procedure
Split-spoon sampling procedures shall be executed in accordance with American Society for Testing and Materials (ASTM) D1586, “Standard Method for Penetration Test and Split-barrel Sampling of Soils” (ASTM 1984). California (2-inch) or Modified California (2.5-inch) split-barrel samplers may also be used.
1) The split-spoon or split-barrel sampler shall be advanced to the top of the sampling interval using a wire-line or sample rods such as A or AW. The larger-diameter samplers may be fitted with three 6-inch-long stainless-steel sleeves. The sampler shall be driven 18 inches or to refusal, with a 140-pound hammer dropping repeatedly 30 inches. Refusal shall be defined as requiring 50 blows with the hammer to advance the sampler less than 6 inches.
2) The number of blows required to drive the sampler each 6 inches shall be recorded on the borelog.
3) As the sample tubes are disassembled, an organic vapor monitor probe shall be inserted into the gap between two sample liners, and the liner exhibiting the highest reading shall be selected for analysis.
4) In general, the middle liner is collected for laboratory analysis, and 10 percent of the bottom liners are collected for quality assurance testing. A sample of the soil in the top liner typically is placed in a re-sealable plastic bag or 8-ounce clear glass jar and left in the sun for approximately 15 minutes to allow any volatile organic compounds (VOC) to volatilize.
5) After the 15 minute volatilization period, the soil vapor in the plastic bag is then measured for VOCs by taking a reading of the headspace. Background VOCs for the bag are determined by monitoring the air in an empty bag.
6) Results of the organic vapor monitoring are recorded on the boring log.
7) Small portions of soil at the ends of the sleeve are scraped off for classification.
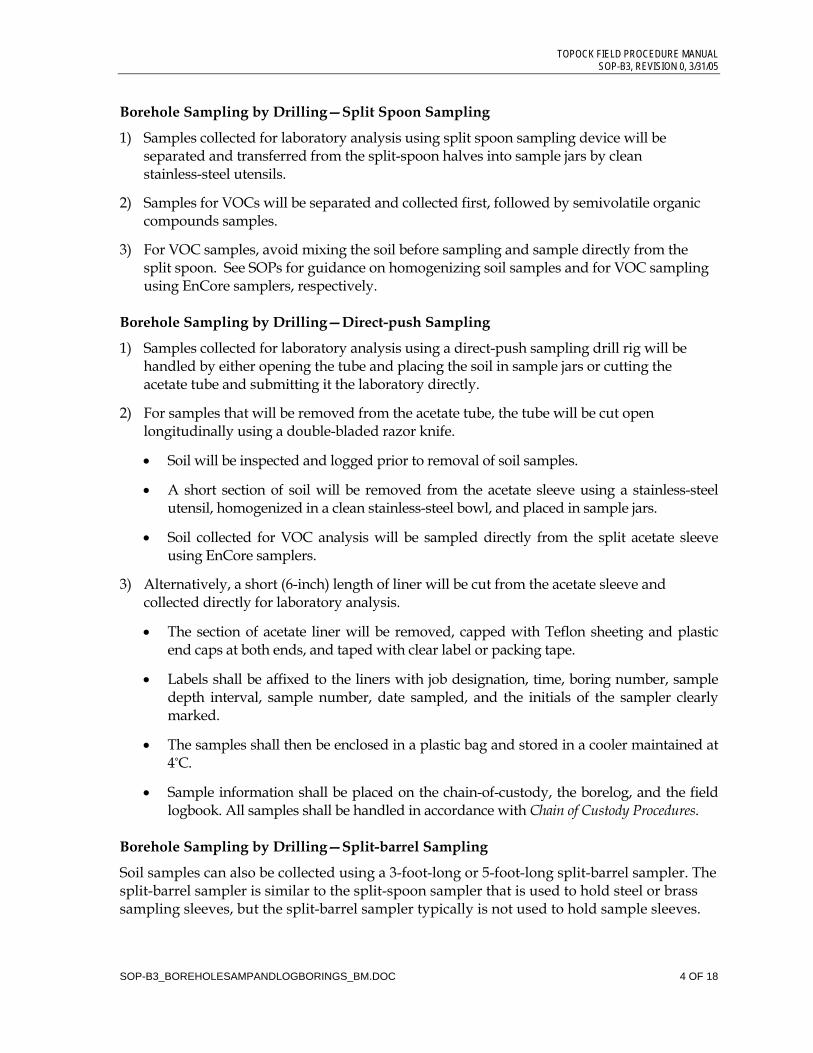
TOPOCK FIELD PROCEDURE MANUAL SOP-B3, REVISION 0, 3/31/05
SOP-B3_BOREHOLESAMPANDLOGBORINGS_BM.DOC 4 OF 18
Borehole Sampling by Drilling—Split Spoon Sampling
1) Samples collected for laboratory analysis using split spoon sampling device will be separated and transferred from the split-spoon halves into sample jars by clean stainless-steel utensils.
2) Samples for VOCs will be separated and collected first, followed by semivolatile organic compounds samples.
3) For VOC samples, avoid mixing the soil before sampling and sample directly from the split spoon. See SOPs for guidance on homogenizing soil samples and for VOC sampling using EnCore samplers, respectively.
Borehole Sampling by Drilling—Direct-push Sampling
1) Samples collected for laboratory analysis using a direct-push sampling drill rig will be handled by either opening the tube and placing the soil in sample jars or cutting the acetate tube and submitting it the laboratory directly.
2) For samples that will be removed from the acetate tube, the tube will be cut open longitudinally using a double-bladed razor knife.
• Soil will be inspected and logged prior to removal of soil samples.
• A short section of soil will be removed from the acetate sleeve using a stainless-steel utensil, homogenized in a clean stainless-steel bowl, and placed in sample jars.
• Soil collected for VOC analysis will be sampled directly from the split acetate sleeve using EnCore samplers.
3) Alternatively, a short (6-inch) length of liner will be cut from the acetate sleeve and collected directly for laboratory analysis.
• The section of acetate liner will be removed, capped with Teflon sheeting and plastic end caps at both ends, and taped with clear label or packing tape.
• Labels shall be affixed to the liners with job designation, time, boring number, sample depth interval, sample number, date sampled, and the initials of the sampler clearly marked.
• The samples shall then be enclosed in a plastic bag and stored in a cooler maintained at 4°C.
• Sample information shall be placed on the chain-of-custody, the borelog, and the field logbook. All samples shall be handled in accordance with Chain of Custody Procedures.
Borehole Sampling by Drilling—Split-barrel Sampling
Soil samples can also be collected using a 3-foot-long or 5-foot-long split-barrel sampler. The split-barrel sampler is similar to the split-spoon sampler that is used to hold steel or brass sampling sleeves, but the split-barrel sampler typically is not used to hold sample sleeves.

TOPOCK FIELD PROCEDURE MANUAL SOP-B3, REVISION 0, 3/31/05
SOP-B3_BOREHOLESAMPANDLOGBORINGS_BM.DOC 5 OF 18
1) The sampler is lowered to the base of the drill bit and is advanced slightly ahead of the drill bit and augers (or conductor casing). The weight of the drill string and sample barrel along with the drilling and cutting action of the drill bit advances the face of the split-barrel sampler into the formation.
2) Once the desired depth interval is reached, the split-barrel sampler is retrieved using a cable or tool steel sections.
3) The retrieved sampler is unscrewed, and one or both halves are laid on the sample table. The soil typically will form a continuous column of soil in one of the split-barrel halves.
4) The soil column is split longitudinally for soil descriptions using a putty knife or spatula.
5) Samples for VOC analysis are collected immediately directly from the soil column.
6) Other soil samples are collected after the core section has been described and logged. The soil is described following the procedures in the following sections.
Groundwater Sampling
1) Groundwater samples can be collected by hydropunch by bailer or by pumping from an isolated zone. Collection of groundwater by bailing is not an accurate method of collection depth discrete groundwater samples, as the zone sampled is poorly isolated.
2) Hydropunch samples are collected below the bit of the drill stem, in relatively undisturbed soil zone. This method of sample collection may be difficult in fine-textured soils and in very rocky soils. To collect these samples, a point is driven below the depth of the drill bit, then a screen zone is opened within this point and water allowed to flow in. The hydropunch tool must be decontaminated between samples.
Groundwater can also be collected from the open or cased borehole with a bailer. A disposable or decontaminated stainless-steel bailer is lowered into the boring, and water is collected. This method is preferable for collection of groundwater from the water table. Attempts can be made to collect discrete groundwater samples beneath the water table; however, the boring must be cased with watertight, stainless-steel pipe, and the boring must be evacuated prior to collection of samples.
Alternatively, discrete groundwater samples can be collected by isolating a zone with casing and packers. To collect these samples, the borehole is first advanced to the depth at which a sample is required. Then casing is advanced to within 20 feet of the sample zone. Next, a pump and packers are lowered into the hole. The zone from which samples are to be collected is isolated with a packer, and water is pumped directly from the target zone.
Sample Handling
Sample preservation and sampling procedures are detailed in Section 4.0 of the QAPP. Additional information is provided in the Procedures Manual and in the appropriate SAP.
KEY CHECKS AND ITEMS • Check entries to the soil boring log and field logbook in the field during sampling activities
because the samples will be disposed at the end of the fieldwork, confirmation and corrections cannot be made later.
TOPOCK FIELD PROCEDURE MANUAL SOP-B3, REVISION 0, 3/31/05
SOP-B3_BOREHOLESAMPANDLOGBORINGS_BM.DOC 6 OF 18
• Check that the sample numbers and intervals are properly specified.
• Ensure that drilling equipment is decontaminated prior to the beginning of work and between each borehole.
• All materials generated during sampling (debris, PPE, decontamination liquids, etc.) will be placed in 55-gallon drums or roll-off bins for storage pending analysis and disposal off site, as outlined in SOP 39, Standard of Practice H-83, and Appendix D of the project Soil and Groundwater Management Plan.

ATTACHMENT A
Examples of Soil Bore Logs
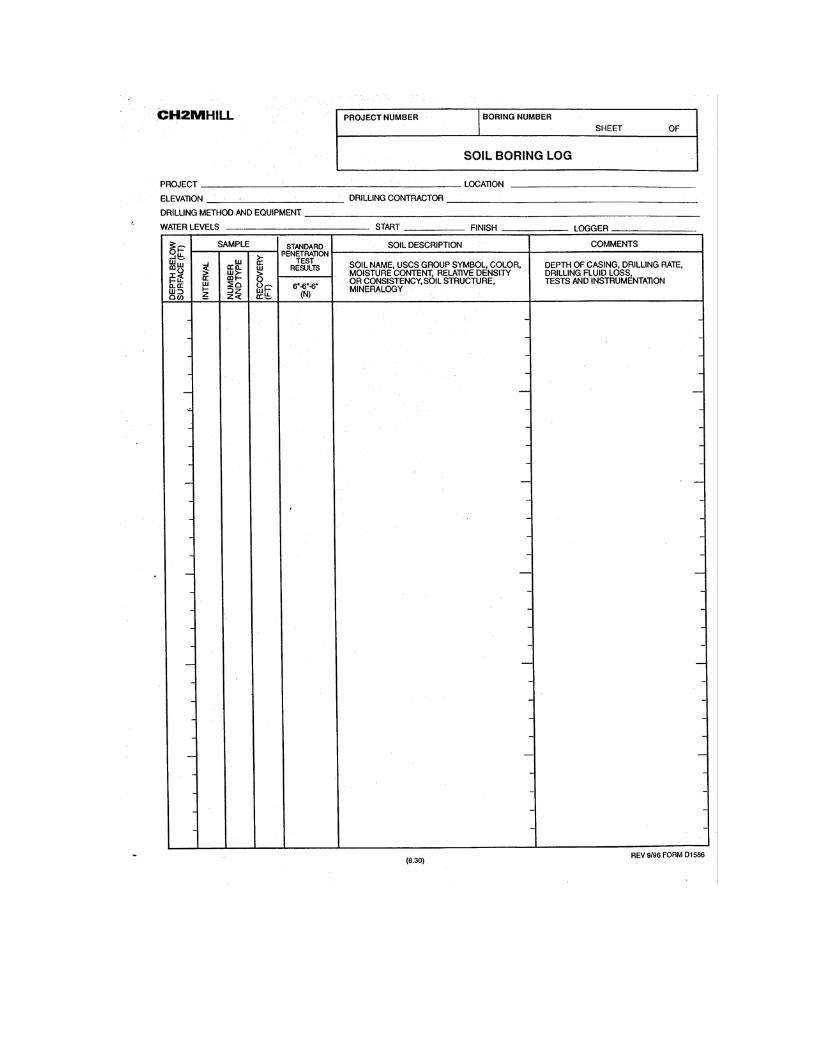
ATTACHMENT B
ASTM D-2488


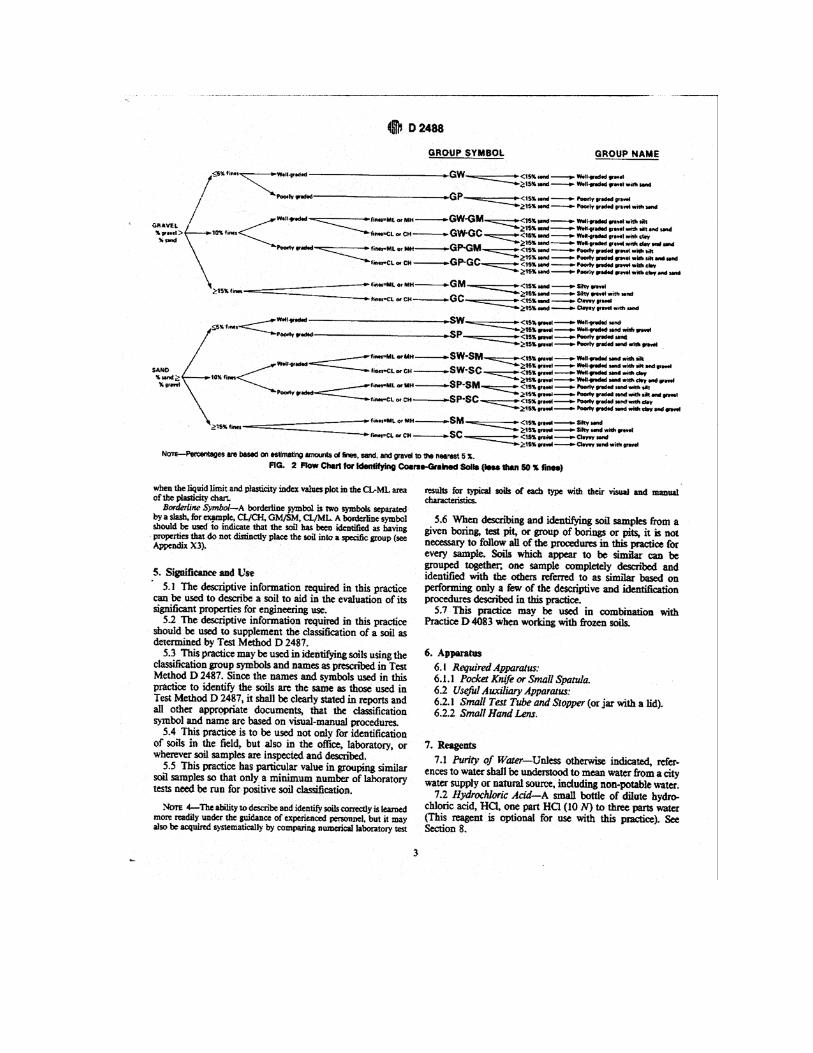
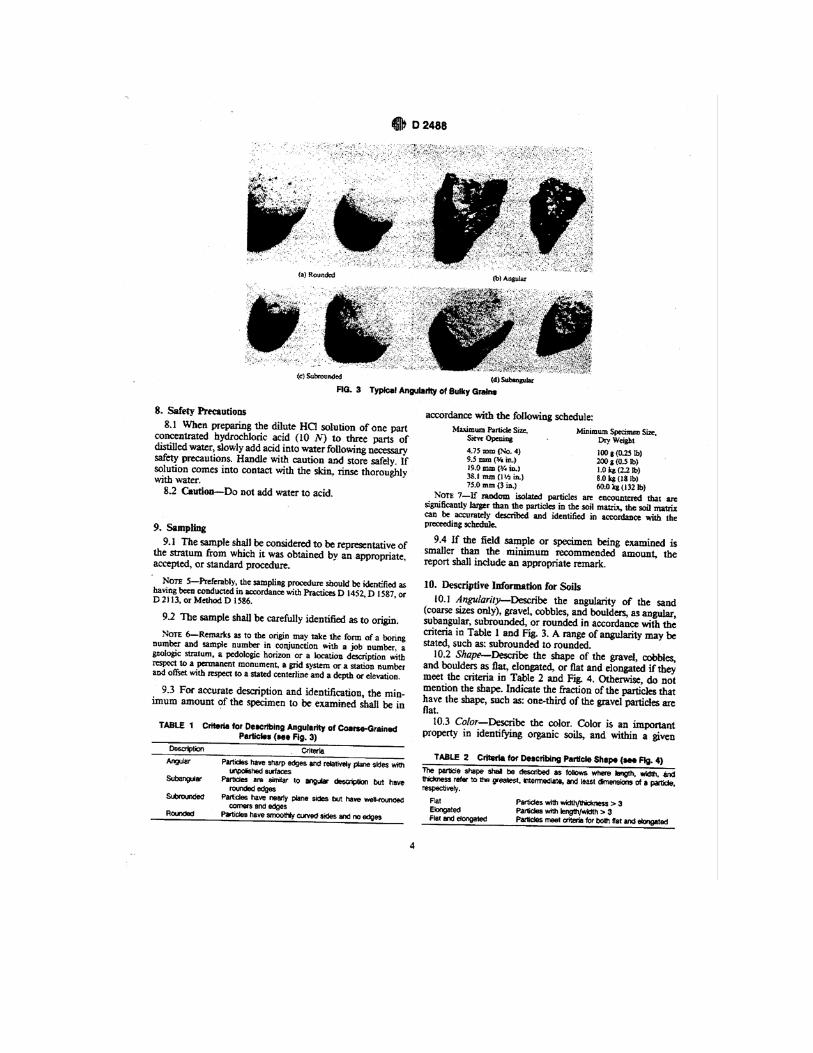

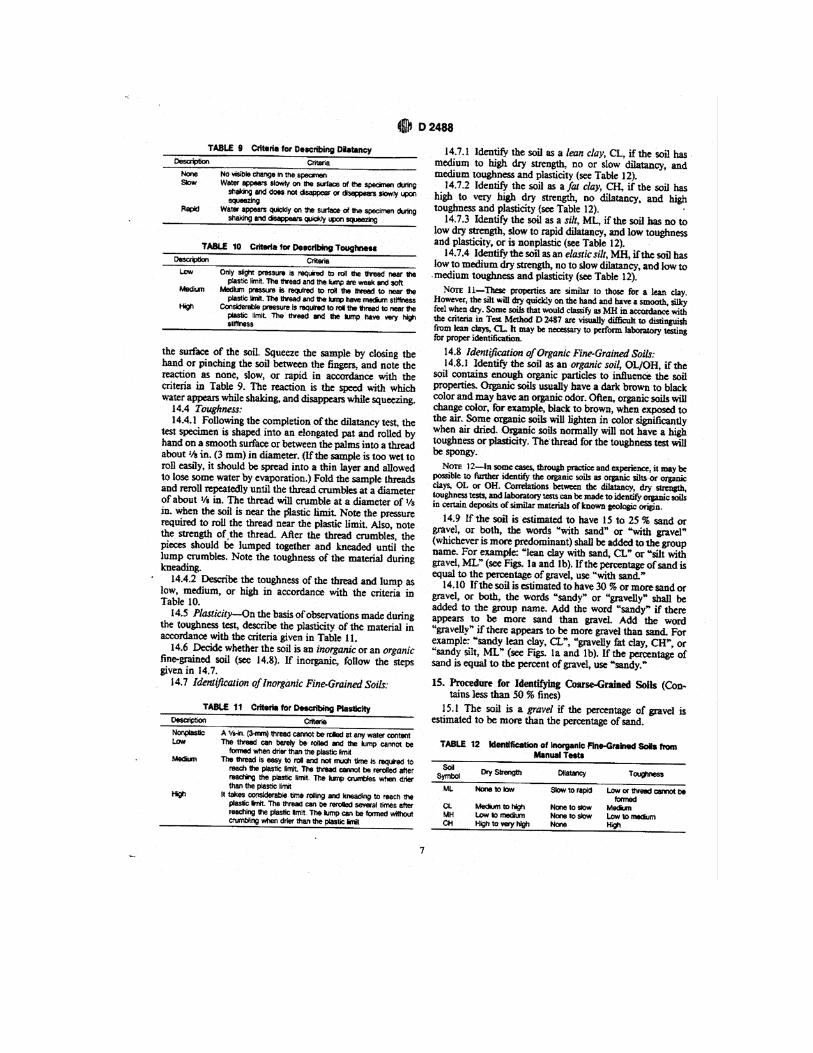
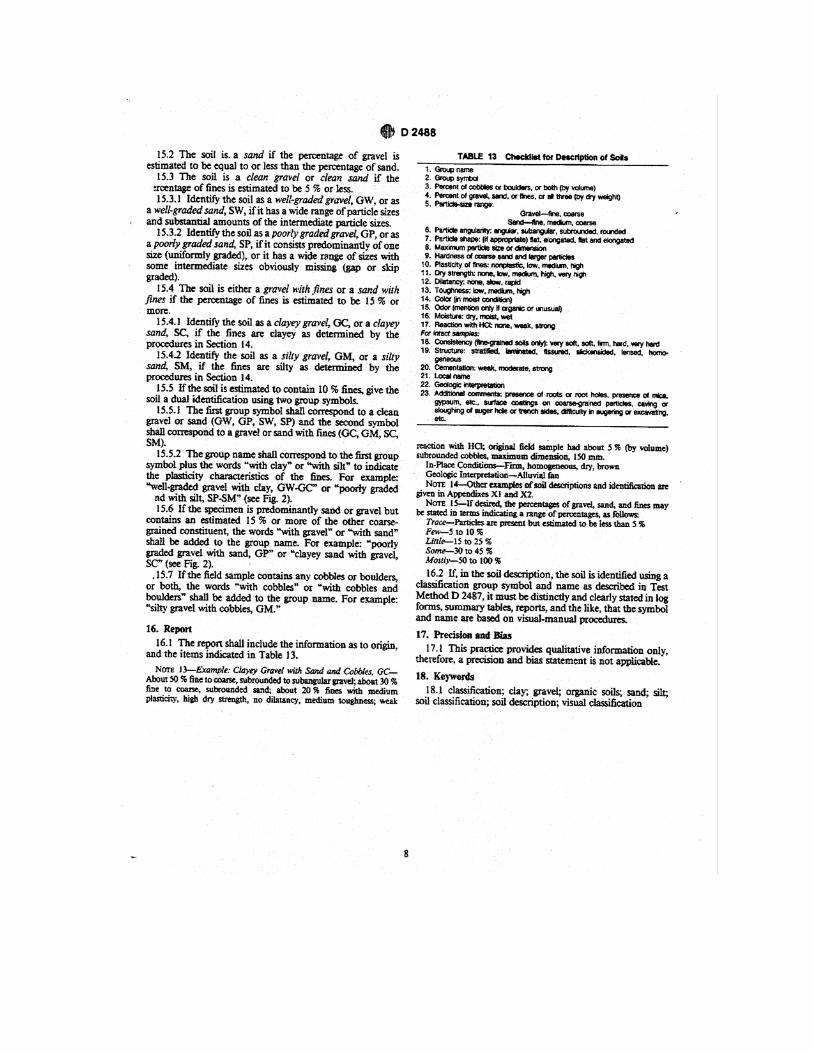

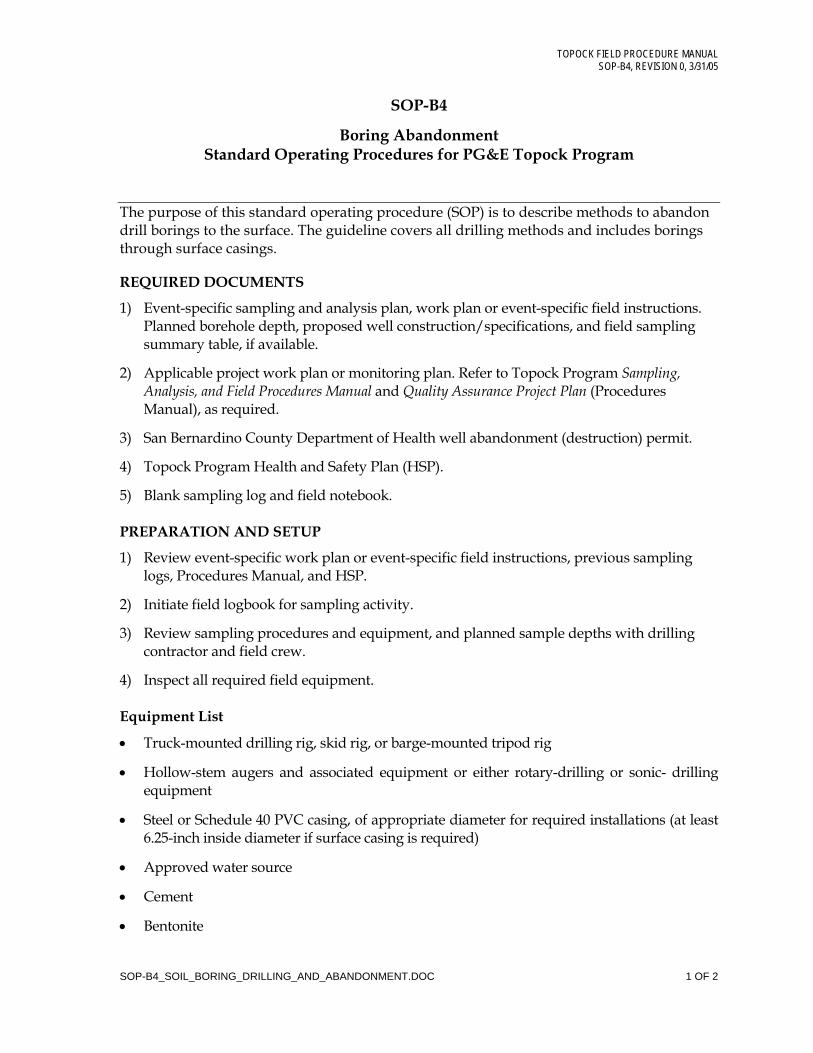
TOPOCK FIELD PROCEDURE MANUAL SOP-B4, REVISION 0, 3/31/05
SOP-B4_SOIL_BORING_DRILLING_AND_ABANDONMENT.DOC 1 OF 2
SOP-B4
Boring Abandonment Standard Operating Procedures for PG&E Topock Program
The purpose of this standard operating procedure (SOP) is to describe methods to abandon drill borings to the surface. The guideline covers all drilling methods and includes borings through surface casings.
REQUIRED DOCUMENTS
1) Event-specific sampling and analysis plan, work plan or event-specific field instructions. Planned borehole depth, proposed well construction/specifications, and field sampling summary table, if available.
2) Applicable project work plan or monitoring plan. Refer to Topock Program Sampling, Analysis, and Field Procedures Manual and Quality Assurance Project Plan (Procedures Manual), as required.
3) San Bernardino County Department of Health well abandonment (destruction) permit.
4) Topock Program Health and Safety Plan (HSP).
5) Blank sampling log and field notebook.
PREPARATION AND SETUP
1) Review event-specific work plan or event-specific field instructions, previous sampling logs, Procedures Manual, and HSP.
2) Initiate field logbook for sampling activity.
3) Review sampling procedures and equipment, and planned sample depths with drilling contractor and field crew.
4) Inspect all required field equipment.
Equipment List
• Truck-mounted drilling rig, skid rig, or barge-mounted tripod rig
• Hollow-stem augers and associated equipment or either rotary-drilling or sonic- drilling equipment
• Steel or Schedule 40 PVC casing, of appropriate diameter for required installations (at least 6.25-inch inside diameter if surface casing is required)
• Approved water source
• Cement
• Bentonite
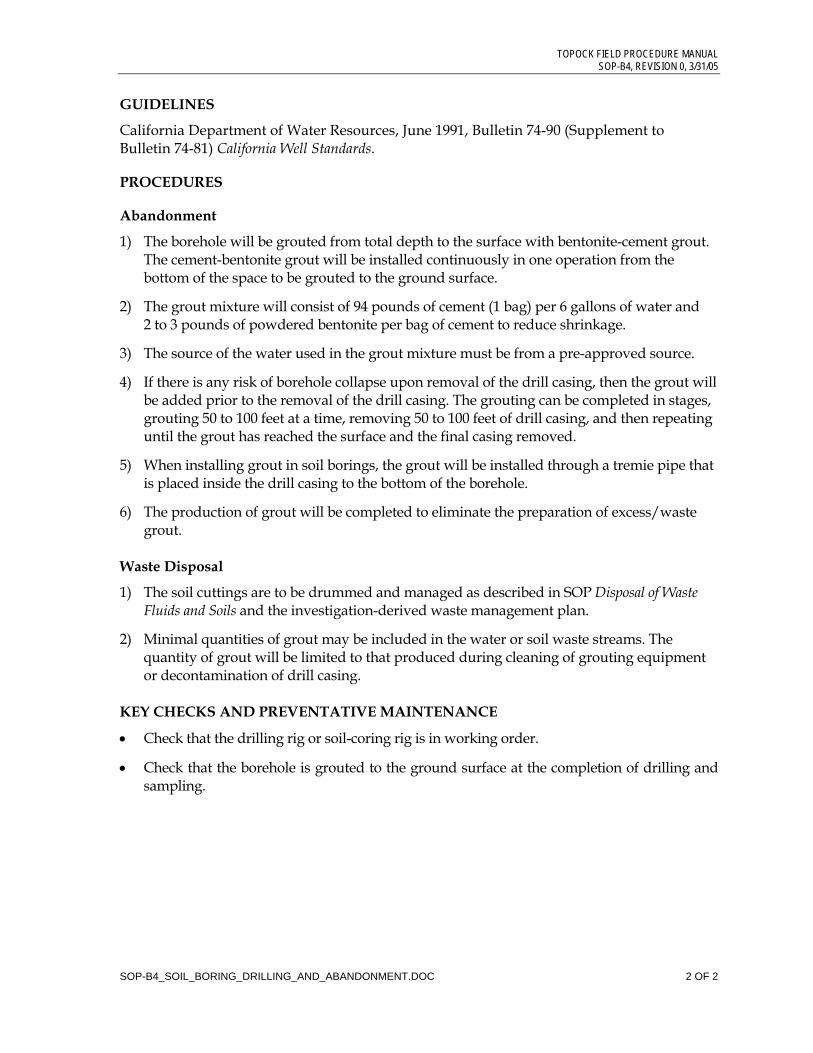
TOPOCK FIELD PROCEDURE MANUAL SOP-B4, REVISION 0, 3/31/05
SOP-B4_SOIL_BORING_DRILLING_AND_ABANDONMENT.DOC 2 OF 2
GUIDELINES
California Department of Water Resources, June 1991, Bulletin 74-90 (Supplement to Bulletin 74-81) California Well Standards.
PROCEDURES
Abandonment
1) The borehole will be grouted from total depth to the surface with bentonite-cement grout. The cement-bentonite grout will be installed continuously in one operation from the bottom of the space to be grouted to the ground surface.
2) The grout mixture will consist of 94 pounds of cement (1 bag) per 6 gallons of water and 2 to 3 pounds of powdered bentonite per bag of cement to reduce shrinkage.
3) The source of the water used in the grout mixture must be from a pre-approved source.
4) If there is any risk of borehole collapse upon removal of the drill casing, then the grout will be added prior to the removal of the drill casing. The grouting can be completed in stages, grouting 50 to 100 feet at a time, removing 50 to 100 feet of drill casing, and then repeating until the grout has reached the surface and the final casing removed.
5) When installing grout in soil borings, the grout will be installed through a tremie pipe that is placed inside the drill casing to the bottom of the borehole.
6) The production of grout will be completed to eliminate the preparation of excess/waste grout.
Waste Disposal
1) The soil cuttings are to be drummed and managed as described in SOP Disposal of Waste Fluids and Soils and the investigation-derived waste management plan.
2) Minimal quantities of grout may be included in the water or soil waste streams. The quantity of grout will be limited to that produced during cleaning of grouting equipment or decontamination of drill casing.
KEY CHECKS AND PREVENTATIVE MAINTENANCE
• Check that the drilling rig or soil-coring rig is in working order.
• Check that the borehole is grouted to the ground surface at the completion of drilling and sampling.
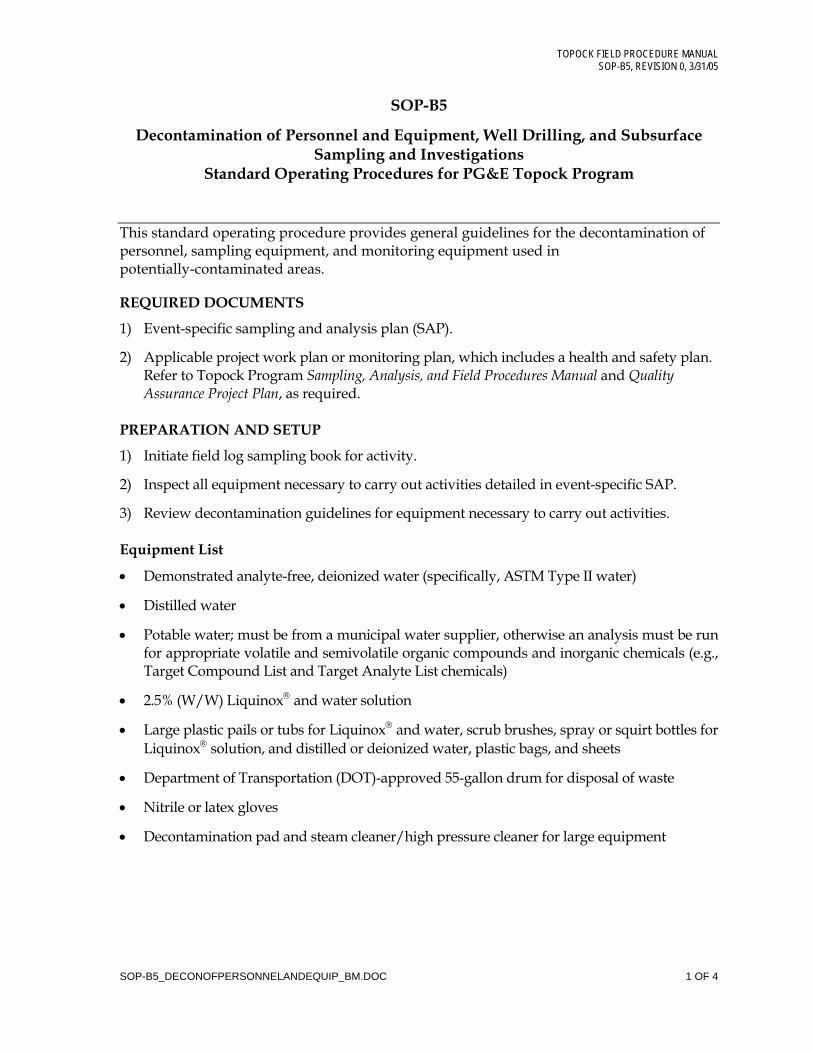
TOPOCK FIELD PROCEDURE MANUAL SOP-B5, REVISION 0, 3/31/05
SOP-B5_DECONOFPERSONNELANDEQUIP_BM.DOC 1 OF 4
SOP-B5
Decontamination of Personnel and Equipment, Well Drilling, and Subsurface Sampling and Investigations
Standard Operating Procedures for PG&E Topock Program
This standard operating procedure provides general guidelines for the decontamination of personnel, sampling equipment, and monitoring equipment used in potentially-contaminated areas.
REQUIRED DOCUMENTS
1) Event-specific sampling and analysis plan (SAP).
2) Applicable project work plan or monitoring plan, which includes a health and safety plan. Refer to Topock Program Sampling, Analysis, and Field Procedures Manual and Quality Assurance Project Plan, as required.
PREPARATION AND SETUP
1) Initiate field log sampling book for activity.
2) Inspect all equipment necessary to carry out activities detailed in event-specific SAP.
3) Review decontamination guidelines for equipment necessary to carry out activities.
Equipment List
• Demonstrated analyte-free, deionized water (specifically, ASTM Type II water)
• Distilled water
• Potable water; must be from a municipal water supplier, otherwise an analysis must be run for appropriate volatile and semivolatile organic compounds and inorganic chemicals (e.g., Target Compound List and Target Analyte List chemicals)
• 2.5% (W/W) Liquinox® and water solution
• Large plastic pails or tubs for Liquinox® and water, scrub brushes, spray or squirt bottles for Liquinox® solution, and distilled or deionized water, plastic bags, and sheets
• Department of Transportation (DOT)-approved 55-gallon drum for disposal of waste
• Nitrile or latex gloves
• Decontamination pad and steam cleaner/high pressure cleaner for large equipment

TOPOCK FIELD PROCEDURE MANUAL SOP-B5, REVISION 0, 3/31/05
SOP-B5_DECONOFPERSONNELANDEQUIP_BM.DOC 2 OF 4
GUIDELINES
Personnel Decontamination
Decontamination should be performed after completion of tasks whenever personnel come in contact with contaminated (or potentially-contaminated) soils or fluids. Full or emergency decontamination should be performed when contaminant concentrations are not known and when potentially-contaminated fluids come into contact with skin beneath clothing, eyes, nose, or ears.
Procedures for full/emergency decontamination are to:
1) Remove contaminated clothing.
2) Step into containment area (decontamination pad or large pail).
3) Rinse away fluids and soil.
4) Wash skin with Liquinox® solution in such a way as to not abrade skin. (Liquinox® solution should be made with potable water and sufficient detergent to create foamy suds.) Eyes and mucus membranes in contact with contaminants must be washed with eye wash or drinking water continuously for at least 15 minutes.
5) Rinse with potable water.
6) If no other clothes are available, wash affected clothes in Liquinox® solution prior to donning. If other clothes are available, contaminated clothes may be isolated for later wash or disposed of along with personal protective equipment (PPE).
7) Any PPE worn (including disposable latex booties, gloves, and disposable coveralls) should be discarded into DOT-approved 55-gallon drum located at the MW-20 bench.
8) Dispose of wash and rinseate water in an appropriate container with other chromium contaminated fluids. These fluids may be taken to the MW-20 bench for treatment or to a Baker® tank within the PG&E facility for containerization.
9) Replace all appropriate clothing and PPE before resuming work or departing site.
Moist soil or water containing known concentrations of hexavalent chromium less than 50 parts per billion that comes into contact with hands need not require full decontamination. Dry soil containing chromium that comes into contact with clothing can also be decontaminated in an abbreviated manner.
Daily decontamination and minor exposure contact decontamination procedures are to:
1) Wash hands and skin that comes in contact with soils or water that may contain small concentrations of chromium as soon as possible after contact. Wash with Liquinox® solution and rinse with potable water.
2) If contaminated soil or water contacts hands through hole or over lip of gloves, remove gloves and wash hands thoroughly before donning new gloves.
3) Discard gloves into DOT-approved 55-gallon drum located on the MW-20 bench at the end of the day or event.
TOPOCK FIELD PROCEDURE MANUAL SOP-B5, REVISION 0, 3/31/05
SOP-B5_DECONOFPERSONNELANDEQUIP_BM.DOC 3 OF 4
4) Remove coveralls or dry soils from clothing before leaving site. Clothing contaminated by moist soil or water containing hexavalent chromium should be removed and promptly washed.
5) At the end of the work day, shower entire body, including hair, either at the work site or at hotel.
Sampling Equipment Decontamination—Groundwater Sampling Pumps
Sampling pumps are decontaminated after each use as follows:
1) Don waterproof (nitrile or latex) gloves.
2) Run pump and reusable tubing through with Liquinox® solution (made with potable water) so that the pump and all portions or the tubing have been flushed with the solution for at least 30 to 60 seconds. More time is required if water is present in the tubing. If unsure, run for 2.5 minutes. Outside of the tubing should also be submerged and washed in the solution.
3) Run pump and reusable tubing through first rinse (with potable or distilled water) so that the pump and all portions or the tubing have been flushed with the solution for at least 60 seconds. More time is required if any suds are present in the pump or tubing.
4) Run pump and reusable tubing through second rinse (with distilled water) so that the pump and all portions or the tubing have been flushed with the solution for at least 30 seconds. More time is required if water from first rinse is present in tubing.
5) Equipment blank samples may be taken at this point using ASTM Type II water or distilled water as required by laboratory.
Sampling Equipment Decontamination—Other Equipment
Reusable sampling equipment is decontaminated after each use as follows:
1) Don nitrile or latex gloves.
2) Wash all equipment surfaces that contacted the potentially contaminated soil/water with Liquinox® solution (made from potable water). Water quality meters that are not placed within wells should not be washed with detergent, as this will degrade sensors; these meters should be double-rinsed. Any portion of equipment that is placed inside wells (including cables and pipe) and that comes in contact with moisture should be washed with detergent.
3) Rinse equipment and supplies with potable water, if the equipment is not used to collect groundwater or soil samples. Equipment used to collect samples or take water quality parameters should be rinsed with distilled water.
4) Air dry or towel dry with paper towels.
5) Collect all rinseate and dispose of in Baker® tank within the PG&E facility or Denbeste® tank at the MW-20 bench.
TOPOCK FIELD PROCEDURE MANUAL SOP-B5, REVISION 0, 3/31/05
SOP-B5_DECONOFPERSONNELANDEQUIP_BM.DOC 4 OF 4
6) Decontamination materials (e.g., plastic sheeting, tubing, etc.) that have come in contact with used decontamination fluids or sampling equipment will be disposed of in DOT-approved 55-gallon drums if highly contaminated. If not contaminated, equipment can be washed and disposed of in trash.
7) Preserved bottles may need to be washed before being packed or handed without gloves. The outsides of filled bottles should be rinsed and toweled dry to prevent contact with strong acids or based.
Heavy Equipment and Tools
Heavy equipment such as drilling rigs, drilling rods/tools, and the backhoe will be decontaminated upon arrival at the site and between locations as follows:
1) Set up a decontamination pad in designated area.
2) Steam clean heavy equipment until no visible signs of dirt are observed. This may require wire or stiff brushes to dislodge dirt from some areas.
KEY CHECKS AND ITEMS
• Clean with solutions of Liquinox® and potable water. Rinse with distilled or deionized water if equipment is used to collect samples or water readings; otherwise, rinse with potable water.
• Equipment placed within wells should be thoroughly decontaminated and before being placed in a well. All potions of this equipment that come into contact with moisture should be decontaminated.
• Decontaminate filled sample bottles before relinquishing them to anyone.

TOPOCK FIELD PROCEDURE MANUAL SOP-B6, REVISION 0, 3/31/05
SOP-B6_DISPOSALOFWASTEFLUIDSANDSOLIDS_BM.DOC 1 OF 3
SOP-B6
Disposal of Waste Fluids and Solids (IDW) Standard Operating Procedures for PG&E Topock Program
This standard operation procedure (SOP) describes the procedures used to dispose of hazardous fluid and solid materials generated as a result of the site operations. This SOP does not provide guidance on the details of Department of Transportation (DOT) regulations pertaining to the transport of hazardous wastes; the appropriate Code of Federal Regulations (49 CFR 171 through 177) should be referenced. Also, the site investigation-derived waste management plan should be consulted for additional information and should take precedence over this SOP.
REQUIRED DOCUMENTS
1) Event-specific sampling and analysis plan.
2) Applicable project work plan or monitoring plan. Refer to Topock Program Sampling, Analysis, and Field Procedures Manual and Quality Assurance Project Plan, as required.
3) Topock Program Health and Safety Plan.
PREPARATION AND SETUP
1) For soil and groundwater collection and storage, a subcontractor (either Denbeste Transportation, Inc. or a drilling or sampling contractor) will bring clean, empty drums, roll-off bins, Denbeste® tanks, or Baker® Tanks to the site.
2) Locate the empty drums at the field staging area and move drums to drilling locations as required.
EQUIPMENT LIST
• DOT-approved 55-gallon steel drums, Denbeste® Tanks, Baker® Tanks or roll-off bins • Portable polytanks for transferring water from well samples locations to tanks or bins • Tools for securing drum lids • Funnel for transferring liquid into drum • Water pump to transfer liquids • Labels • Marking pen for appropriate labels • Seals for 55-gallon steel drums • Plastic sheets and buckets to catch leaks and drips
PROCEDURES
General Methodology
1) Prior to filling soil bins, determine if plastic sheeting is required for soil disposal bins. Line bins with plastic sheeting as required by disposal contractor and facility. Seal bins and
TOPOCK FIELD PROCEDURE MANUAL SOP-B6, REVISION 0, 3/31/05
SOP-B6_DISPOSALOFWASTEFLUIDSANDSOLIDS_BM.DOC 2 OF 3
check for water tightness on soil bins and water tanks. Inventory all bins and tanks by unique identifier.
2) Fill soil bins with drilling and well installation wastes. When three-fourths full, cap or close, and update inventory. The drilling, sampling, or waste disposal subcontractor will move the drums to the on-site drum storage area. Fill tanks with clear water. Muddy water should be allowed to settle out in soil bins or separator tanks prior to transfer to Denbeste® or Baker® Tanks.
3) Separate full drums by waste and media types.
4) As the drums are filled in the field, affix labels indicating that the contents are potentially hazardous. Update bin log with type of waste and locations from which soil is obtained.
5) Drums may be used for temporary storage of soil or water. The drums should be closed and sealed at the end of each work day or when full. Drums used for soil should not be used for clear water storage without decontamination. Drums should be labeled if the contents are not transferred to a tank or bin by the end of the day.
6) Portable polytanks are used to transfer water from wells being sampled or developed to Denbeste® or Baker® tanks. These tanks should be emptied at the end of each day or when full. Sediment that accumulates that the bottom of these tanks should be removed and disposed of with contaminated soil on a regular basis.
7) Soils and groundwater from the site have been characterized for waste disposal. Wastes, which have not been included in the characterization, should be labeled sampled and separated from other wastes.
8) Typically Denbeste Transportation, Inc. should be contacted for disposal of wastes and movement of soil bins and large water tanks. Other contractors may also be involved in waste disposal.
Labeling
1) Label drums and other containers used for storing wastes from drilling, development, and sampling operations when accumulation in the container begins. Labels will include the following minimum information:
• Container number • Container contents • Origin (source area including individuals wells, piezometers, and soil borings) • Date that accumulation began • Date that accumulation ended
2) When laboratory results are received, complete or revise drum labels to indicate the hazardous waste constituents in compliance with 40 CFR, Part 262, Subpart C.
Groundwater and Drilling Fluids
1) Collect water and drilling fluids generated during well sampling and development and during soil boring in polytank or hopper (water-tight bin used to transport cuttings with forklift).
TOPOCK FIELD PROCEDURE MANUAL SOP-B6, REVISION 0, 3/31/05
SOP-B6_DISPOSALOFWASTEFLUIDSANDSOLIDS_BM.DOC 3 OF 3
2) When a polytank is full, or hopper is half full, secure the tank or hopper and transfer fluid to appropriate separator tank or to Denbeste® or Baker® tanks.
3) When fluids are being transferred from polytanks or drums to larger tanks, use an appropriate pump (often referred to as trash pump) used for contaminated fluids. Subcontractors should decontaminate trash pumps before they are brought to the site. When transferring liquids, materials to contain spills and drips should be at hand, and appropriate PPE should be worn. Nitrile or latex gloves should be worn at a minimum. If water is being transferred by bucket, plastic sheeting should be used to contain drips.
4) Water that is allowed to settle in soil bins or separator tanks should be removed prior to movement of bin. Water stored in a soil bin, should not be stored longer than one week after filling to minimized dripping and leaking. Water may be transferred using a vacuum truck or pump and tank.
5) A separate tank will be needed for waste that cannot be treated by on-site water treatment. This waste will be characterized and disposed of off site.
6) Any tanks containing waste fluids for more than one day shall be labeled.
Solids
The soil cuttings from well and boring drilling will constitute a large portion of the solids to be disposed of. The solid waste stream also include plastic sheeting used for decontamination pads, Tyveks, disposable sampling materials, and any other disposable material used during the field operations that appears to be contaminated.
1) Place these materials in the designated bins and indicate what materials, other than soil, are present in logbook.
2) Contact Denbeste Transportation, Inc. or drilling company for removal and disposal of bins.
3) Dispose waste solid materials that contain hazardous constituents at an off-site location in a manner consistent with applicable solid waste, hazardous waste, and water quality regulations.
KEY CHECKS AND ITEMS
• When fluids are being transferred from polytanks or drums to larger tanks, use an appropriately designated pump.
• If wastes are stored in drum, tank, or bin for longer than 1 day, this container should be labeled.
• Waste characterization profiles should be checked prior to waste accumulation to determine if samples should be collected for further characterization and if wastes need to be segregated from others on site.
TOPOCK FIELD PROCEDURE MANUAL SOP-B6, REVISION 0, 3/31/05
SOP-B7_HOMOGENIZATION_OF_SOIL_AND_SEDIMENT_SAMPLES.DOC 1 OF 2
SOP-B7
Homogenization of Soil and Sediment Samples Standard Operating Procedures for PG&E Topock Program
The homogenization of soil and sediment samples is performed to minimize any bias of sample representativeness introduced by the natural stratification of constituents within the sample. Standard techniques for soil and sediment homogenization and equipment are provided in this SOP. These procedures do not apply to aliquots collected for volatile organic compounds (VOCs) or field gas chromography screening; samples for these analyses should NOT be homogenized.
REQUIRED DOCUMENTS
1) Event-specific sampling and analysis plan (SAP).
2) Applicable project work plan or monitoring plan. Refer to Topock Program Sampling, Analysis, and Field Procedures Manual and Quality Assurance Project Plan, as required.
3) Topock Program Health and Safety Plan (HSP).
4) Previous sampling logs.
5) Blank sampling logs and field notebook.
PREPARATION AND SETUP
1) Review event-specific SAP or event-specific field instructions, previous sampling logs, Procedures Manual, and HSP.
2) Initiate field logbook for sampling activity.
EQUIPMENT LIST
• Sample containers • Stainless-steel spoons or spatulas • Stainless-steel pans • Phthalate-free gloves
PROCEDURES
Sample Homogenization
1) Soil and sediment samples to be analyzed for semivolatiles, pesticides, polychlorinated biphenyls, metals, cyanide, or field x-ray fluorescence screening should be homogenized in the field.
2) After a sample is taken, a stainless-steel spatula should be used to remove the sample from the split spoon or other sampling device. The sampler should not use fingers to do this, as gloves may introduce organic interferences into the sample.

TOPOCK FIELD PROCEDURE MANUAL SOP-B6, REVISION 0, 3/31/05
SOP-B7_HOMOGENIZATION_OF_SOIL_AND_SEDIMENT_SAMPLES.DOC 2 OF 2
3) Samples for VOCs should be taken immediately upon opening the spoon and should not be homogenized.
4) Prior to homogenizing the soil or sediment sample, any rocks, twigs, leaves, or other debris should be removed from the sample.
5) The sample should be placed in a decontaminated stainless-steel pan and thoroughly mixed using a stainless-steel spoon. The soil or sediment material in the pan should be scraped from the sides, corners, and bottom, rolled into the middle of the pan, and initially mixed.
6) The sample should then be quartered and moved to the four corners of the pan. Each quarter of the sample should be mixed individually, then rolled to the center of the pan and mixed with the entire sample again.
Equipment Decontamination
1) All stainless-steel spoons, spatulas, and pans must be decontaminated following procedures specified in SOP Decontamination of Personnel and Equipment prior to homogenizing the sample.
2) A composite equipment rinse blank of homogenization equipment should be taken each day it is used.

TOPOCK FIELD PROCEDURE MANUAL SOP-B8, REVISION 0, 3/31/05
SOP-B8_WELLSURVEYINGL.DOC 1 OF 5
SOP-B8
General Guidance for Well Surveying Standard Operating Procedures for PG&E Topock Program
To provide site personnel with a review of the procedures necessary to perform a proper survey of monitoring wells and other site features at the Topock site. These procedures are to be considered general guidelines only and are in no way intended to supplement or replace the PG&E guidelines.
REQUIRED DOCUMENTS
1) Topock Program Health and Safety Plan (HSP) 2) Topographic map(s) of the Topock station and surrounding sites. 3) Maps that show features to be surveyed and reference landmarks. 4) Soil Boring Log and or other lithologic descriptions of the local area 5) Well construction logs/specifications for wells to be surveyed. 6) Blank survey logs and field notebook
EQUIPMENT LISTS
The equipment needed for surveying are simply the survey or global positioning equipment, and the vehicle and keys needed to access each site.
DEFINITIONS
The following terms are defined to clarify discussion in this SOP:
• North American Datum (NAD) -The standard geodetic datum on the North American continent.
• North American Vertical Datum (NAVD) 1983 - The vertical-control datum used by the National Geodetic Survey for all new vertical control.
• Horizontal Control - Horizontal location of an object from surveyed corners or other features on permanent land monuments in the immediate site area. Will be based on North American Datum (NAD) 1983 and state plane grid systems (California State Plane Coordinate System, Zone 5).
• Vertical Control - Vertical location of an object compared to the adjacent ground surface.
• Bench Mark - Precisely determined elevation above or below sea level. May also have horizontal control (northing, easting) determined for location.
PROCEEDURES
Record Keeping
All field notes should be kept in bound books. Each book should have an index. Each page of field notes should be numbered and dated and should show the initials of all crew

TOPOCK FIELD PROCEDURE MANUAL SOP-B8, REVISION 0, 3/31/05
SOP-B8_WELLSURVEYINGL.DOC 2 OF 5
members. The person taking field notes will be identified in the log. Information on weather (wind speed/wind direction, cloud cover, etc.) and on other site conditions should also be entered in the notes. Notes should also include instrument field identification number and environmental settings. Graphite pencils should be used. Erasing is not acceptable; use a single-strike-through and initial it. The note keeping format should conform to the Handbook of Survey Note keeping by William Pafford. A survey work drawing with grid lines and at the scale of the topographic map should be prepared for all survey field work in AutoCAD or Microstation (depending on client specifications).
Horizontal Survey
Horizontal angular measurements shall be made with a 5-second or better total station. All angles shall be doubled (once each direct and inverted), with the mean of the second angle within 5 seconds of the first angle. The minimum length of any traverse courses shall be 300 feet.
Distance measurements shall be made with a total station. When using a total station the parts per million (PPM), curvature and refraction corrections shall be made. Vertical angle measurements used for distance slope corrections shall be recorded to the nearest 5 seconds of arc deviation from the horizontal plane. Horizontal locations will be surveyed to within 0.05-foot of the true location.
Horizontal traverse stations shall be established and referenced for future use. All stations shall be described in the field notes with sufficient detail to facilitate their recovery at a later date. The station shall consist of a permanent mark scribed on facilities such as sidewalks, curbs, concrete slabs, or iron rod and cap.
The horizontal location will be referenced to NAD83 and California Zone 5 in the state plane grid system.
Some horizontal coordinates will be measured using Geographic Positioning System (GPS) equipment. This approach will be used in particular for determining the coordinates of surface-water and sediment sampling locations, and may be used also for determining the locations of piezometers and monitoring wells. The GPS survey will be performed by staff trained in the use of the equipment and will conform to guidance provided by the manufacturer.
Vertical Survey
When practical, vertical control will be referenced to the North American Vertical Datum (NAVD) of 1988, obtained from a permanent benchmark. If practical, level circuits should close on a known benchmark other than the starting benchmark. The following criteria shall be met in conducting the survey:
Using a Conventional Level
• Instruments shall be pegged weekly or after any time it is dropped or severely jolted.
• Foresight and backsight distances shall be reasonably balanced and shall not be greater than 250 feet in length.
• No side shot shall be used as a beginning or ending point in another level loop.

TOPOCK FIELD PROCEDURE MANUAL SOP-B8, REVISION 0, 3/31/05
SOP-B8_WELLSURVEYINGL.DOC 3 OF 5
• Rod readings shall be made to 0.01-foot and estimated to 0.005-foot.
• Elevations shall be adjusted and recorded to 0.01-foot.
Using an electronic Digital Level
• Use the electronic level per the instructions for the specific instrument.
• Balance forsight and backsight distances per instrument specifications.
• Elevations shall be adjusted and recorded to 0.01-foot.
Using a Total Station (Trig levels)
• From each instrument station readings will be taken both with a direct scope and an inverted scope.
• Direct and inverted measurements will be meaned and than meaned again with the adjacent stations.
• The level loop will be closed to another known monument or back on the beginning monument.
• Elevations shall be adjusted and recorded to 0.01-foot.
Using Global Positioning Systems (GPS)
• The GPS survey will be performed staff trained in the use of the equipment.
• All monuments to be used for Vertical Control will be tied from two existing vertical control monuments.
• Geoid03 model will be used.
• Elevations shall be adjusted and recorded to 0.01-foot.
Temporary benchmarks (TBM's) shall be established and referenced for future use. All TBM’s shall be described in the field notes with sufficient detail to facilitate their recovery at a later date. The TBM’s shall consist of a permanent mark scribed on facilities such as sidewalks, curbs, concrete slabs, etc. or spikes set in the base of trees (not power poles), or tops of anchor bolts for transmission line towers, etc. (If suitable Horizontal traverse stations can be used as a TBM’s .)
Traverse Computations and Adjustments
Traverses will be closed and adjusted in the following manner:
1) Coordinate closures will be computed using unadjusted bearings and unadjusted field distances.
2) Coordinate positions will be adjusted (if the traverse closes within the specified limits) using the compass rule or a Least Square Adjustment Program.
3) Final adjusted coordinates will be labeled as "adjusted coordinates." Field coordinates should be specifically identified as such.

TOPOCK FIELD PROCEDURE MANUAL SOP-B8, REVISION 0, 3/31/05
SOP-B8_WELLSURVEYINGL.DOC 4 OF 5
4) The direction and length of the unadjusted error of closure, the ratio of error, and the method of adjustment shall be printed with the final adjusted coordinates.
5) The adjustment shall meet 3rd order specifications.
Level Circuit Computations and Adjustments
Level circuits will be closed and adjusted in the following manner:
• For a single circuit, elevations will be adjusted proportionally, provided the raw closure is within the prescribed limits for the circuit.
• In a level net where the elevation of a point is established by more than one circuit, the method of adjustment should consider the length of each circuit, the closure of each circuit, and the combined effect of all the separate circuit closures on the total net adjustments.
Piezometer and Monitoring-Well Surveys
Piezometer and monitoring-well locations will be surveyed only after the installation of the protective casing, which is set in concrete. The horizontal plane survey accuracy is +0.05-foot and is measured to any point on the protective-casing cover. The vertical plane survey must be accurate to +0.01-foot. The following two elevations will be measured at piezometers and monitoring wells:
• Top of the piezometer or well riser (not on the protective casing), preferably on the north side
• Ground surface, preferably on the north side of the well
If no notch or mark exists, the point at which the elevation was measured on the inner casing shall be described and marked so that water-level measurements may be taken from the same location.
Grid Surveys
Selected soil boring locations may be located by the survey crew after the soil borings are complete. The selected borings will be staked in the field by the field team leader. The stake will be marked with the boring number for reference. The horizontal plane survey accuracy is + 1 foot and is measured to any point on the ground surface immediately adjacent to the stake.
KEY CHECK
STANDARDS FOR MODIFIED THIRD-ORDER PLANE SURVEYS
Traverse
Max Number of bearing courses between azimuth checks 30 Astronomical bearings standard error of results: 6" Azimuth closure at azimuth checkpoint not to exceed 20" N Standard error of the mean for length measurements 1 in 50,000 Position closure per loop in feet before azimuth adjustment 1:10,000
TOPOCK FIELD PROCEDURE MANUAL SOP-B8, REVISION 0, 3/31/05
SOP-B8_WELLSURVEYINGL.DOC 5 OF 5
Leveling
Levels error of closure per loop in feet 0.05 M
N = the number of stations for carrying bearing M = the distance in miles
TOPOCK FIELD PROCEDURE MANUAL SOP-B9, REVISION 0, 3/31/05
SOP-B9_SONIC_DRILLING.DOC 1 OF 3
SOP-B9
Drilling--Sonic Method Standard Operating Procedures for PG&E Topock Program
REQUIRED DOCUMENTS
1) Event-specific sampling and analysis plan (SAP), Work Plan or event-specific field instructions. Planned borehole depth, proposed well construction/specifications, and field sampling summary table, if available.
2) Applicable project work plan or monitoring plan. Refer to Topock Program Sampling, Analysis, and Field Procedures Manual and QAPP (Procedures Manual), as required.
3) Topock Program Health and Safety Plan (HSP)
4) Previous sampling, drilling, or well construction logs from other boreholes or wells in the vicinity, if available
5) Blank sampling log and field notebook
Equipment List:
• Drilling rig (Sonic) • Drill rods and core barrel
GUIDELINES
PRIOR TO INTRUSIVE ACTIVITIES AT ANY DRILLING LOCATION THE AREA WILL HAVE BEEN CLEARED OF ALL UTILITIES AND THE CLEARANCE RECORDED IN THE FIELD LOGBOOK. It is also the field team leader’s responsibility to confirm that all required access permits are in place.
Prior to the start of drilling, the area of site activity will be identified and delineated using stakes and/or flagging. The extent of impact will be mineralized at all times and the delineated area of activity decreased when possible. All sensitive vegetation or habitats will be delineated with stakes and/or flagging and no impact will occur in these areas.
Sampling depths and total depths of holes shall be determined by temporary marking of drill equipment, by reference to standard equipment dimensions (for example, 5-foot hollow-stem auger flights), or by measurement using a fiberglass tape. Final total depth measurements will be confirmed using a weighted fiberglass tape. Observations by the field geologist or engineer shall be recorded directly in the borehole log.
The field borehole log is the standard form used to document subsurface geologic conditions. The borehole log is divided into two areas. One portion contains spaces for noting information on the drilling and sampling methods. The second portion contains space for noting lithologic descriptions. All sheets shall be filled out completely, legibly, and in ink. The borehole log will be filled out in the field at the time of the drilling and sampling. The original logs shall be permanent records, and information on the logs may not be
TOPOCK FIELD PROCEDURE MANUAL SOP-B9, REVISION 0, 3/31/05
SOP-B9_SONIC_DRILLING.DOC 2 OF 3
erased. If corrections are needed, information shall be crossed out with a single line and the correction shall be initialed and dated.
The use of water and drilling fluid to assist in sonic drilling for monitoring well installation will be avoided, unless required for such conditions as running sands or drilling bedrock formations.
Temporary outer casing, drill rods, core barrels, and other downhole drilling tools will be properly decontaminated prior to the initiation of drilling activities and between each borehole location. Core barrels and other downhole soil sampling equipment will also be properly decontaminated before and after each use.
Sonic inner casing (sample tube) will have an inside diameter of at least 3.25 inches. Samples may be collected for chemical analysis. For sonic drilling, these samples are collected in a metal trough. A continuous core is collected and the sample interval is selected from the length of core run.
Surface casing may be installed where soil borings will penetrate a confining layer or when there is risk of eroding soil during the drilling process if water is used.
PROCEDURES
Instructions for Completing Soil Boring Logs
Soil boring logs will be completed in the field log books. Information collected will be consistent with that required for Form D1586 (attached), a standard CH2M HILL form or an equivalent form that supplies the same information. Procedures will follow the SOP “Soil
Non-Core Collection Drilling
At locations or depths from which core collection is not required, drilling may proceed without the recovery of soil cores. The drilling will include advancing the larger outer casing and the use of water to facilitate cuttings removal from the boring. The inner casing drill rods may or may not be used, depending on the cuttings recovery when drilling with the larger outer casing.
Continuous Core Drilling
At locations or depths when core collection is required, drilling will proceed using an outer casing and an inner core sample tube. The inner core sampling tube will be advanced first without the use of water. Before removal of the sampling tube, the outer casing will be advanced, using water only as needed for cuttings removal, to the same total depth as the inner casing. The outer casing will stabilize the boring when the sampling tube is removed. The process is repeated in 10 to 20 foot intervals, as the lithology of the boring permits.
The length of each drilling interval should be adjusted depending on the lithology and the quality and recovery percentage of the sample cores retrieved. At locations with very hard drilling (i.e. with large cobbles or hard materials) or when percent recovery decreases, the drilling interval should be decreased until such time that the conditions change.
After retrieval of the inner sampling core tube, the minimally disturbed sample cores will be collected into plastic liner sleeves in intervals of 2 to 3 feet. The plastic sleeves will be
TOPOCK FIELD PROCEDURE MANUAL SOP-B9, REVISION 0, 3/31/05
SOP-B9_SONIC_DRILLING.DOC 3 OF 3
immediately sealed on both ends. The cores will be used for visual descriptions and may be used for analysis for geochemical and geotechnical parameters.
KEY CHECKS AND ITEMS
• Check entries to the soil boring log and field logbook in the field during sampling activities because the cores will be disposed at the end of the fieldwork, confirmation and corrections cannot be made later.
• Check that the sample numbers and intervals are properly specified.
• Ensure that drilling equipment is decontaminated prior to the beginning of work and between each borehole.
• All materials generated during sampling (debris, PPE, decontamination liquids, etc.) will be placed in approved IDW storage containers pending analysis and disposal off site as outlined in SOP-B6, Disposal of Waste Fluids and Solids (IDW).
TOPOCK FIELD PROCEDURE MANUAL SOP-B10, REVISION 0, 3/31/05
SOP-B10_MUD_ROTARY.DOC 1 OF 4
SOP-B10
Drilling--Mud Rotary Method Standard Operating Procedures for PG&E Topock Program
OBJECTIVE
To provide site personnel with a review of the mud-rotary drilling method and procedures that will be performed while providing drilling oversight. These procedures are to be considered general guidelines only and are in no way intended to supplement the contractual specifications in the driller's subcontract.
REQUIRED DOCUMENTS
• Event-specific sampling and analysis plan, work plan, or field instructions that include details such as planned borehole depth, proposed well construction specifications, and field sampling summary tables, if available.
• Applicable project work plan. Refer to Topock Program Sampling, Analysis, and Field Procedures Manual and Quality Assurance Project Plan, as required.
• Topock Program Health and Safety Plan.
• Previous sampling, drilling, or well construction logs from other boreholes or wells in the vicinity, if available.
• Blank sampling log and field notebook.
EQUIPMENT LIST
• Mud rotary drilling rig; applicable mud compounds and circulation equipment; drill bits, sub, rod, stabilizer(s), and collar(s); surface and conductor casing (if required); split-spoon or thin-walled tube samplers; downhole compacting tool (e.g., a pipe with a flat plate attached to the bottom); and impermeable flexible barriers for spill containment (Visqueen or similar product).
• Mud sampling kit that includes: Marsh funnel viscometer; mud balance; 1-L measuring cup; sand content kit; pH strips; low pressure filter press with 10-ml graduated cylinder; extra CO2 cartridges and filters; clean water; and a 1-gal plastic pitcher.
GUIDELINES
Mud rotary or other rotary drilling techniques can be used to install surface casing, conductor casing, and well casing. Surface casing will be installed to direct the upward flow of mud into the tray surrounding the drill rod. Surface casing will be sealed in place using medium bentonite chips (or similar product).
Drilling equipment will be decontaminated before drilling in accordance with the procedures detailed in SOP-B5, Decontamination of Personnel and Equipment.
TOPOCK FIELD PROCEDURE MANUAL SOP-B10, REVISION 0, 3/31/05
SOP-B10_MUD_ROTARY.DOC 2 OF 4
To drill, the tri-cone bit is placed on the ground at the location to be drilled and then turned with the drilling or soil-coring rig. To collect split spoon samples, the drill bit is advanced to the depth to be sampled, the bit is removed from the borehole and the split-spoon is advanced to collect soil from the desired depth.
Drill cuttings and fluids generated during rotary drilling activities will be contained until completion of activities at the drilling location. Such material will be disposed of according to SOP-B6, Disposal of Waste Fluids and Solids.
PROCEDURES
Instructions for Completing Soil Boring Logs
Soil boring logs will be completed in the field log books in accordance with SOPs -B2 and -B3. Field personnel should review completed logs for accuracy, clarity, and thoroughness of detail.
Instructions for Completing Field Logs
Begin each entry with an accurate time of day, then include the following (if applicable):
1) Boring/Well Number. Enter the boring/well number. A numbering system should be chosen that does not conflict with information recorded for previous exploratory work done at the site. Number the sheets consecutively for each boring.
2) Location. If stationing, coordinates, mileposts, or similar project layout information is available, indicate the position of the boring to that system using modifiers such as “approximate” or “estimated” as appropriate.
3) Boring depth. Enter the current depth of boring below ground surface.
4) Elevation. Elevation will be determined at the conclusion of field activities in accordance with SOP B8, General Guidance for Well Surveying.
5) Drilling Contractor. Enter the name of the drilling company and the city and state where the company is based.
6) Drilling Method and Equipment. Identify the bit size and type, drilling fluid (if used), and method of drilling (mud rotary). Information on the drilling equipment (e.g., CME 55, Mobile B61) should also be noted.
7) Water Level and Date. Enter the depth below ground surface to the apparent water level in the borehole. The information should be recorded as a comment. If free water is not encountered during drilling or cannot be detected because of the drilling method, this information should be noted. Record date and time of day (for tides, river stage) of each water-level measurement.
8) Date of Start and Finish. Enter the dates the boring was started and completed. Time of day should be added if several borings are performed on the same day.
9) Logger. Enter the first initial and full last name of the logger.
TOPOCK FIELD PROCEDURE MANUAL SOP-B10, REVISION 0, 3/31/05
SOP-B10_MUD_ROTARY.DOC 3 OF 4
Instructions for Using Mud Test Kit
1) Collect a mud sample using 1-gal plastic pitcher. Mud samples should be obtained upstream of the borehole from the mud shaker/mixing unit. Use mud from these samples for each of the specific tests included in the mud test kit.
2) Using the Marsh funnel viscometer, plug the small hole at the bottom with a finger and fill the funnel with mud, making sure all mud passes through the mesh screen as it is filling the funnel. Once the funnel is filled to the impressioned line, position the funnel over the 1-L measuring cup, remove the finger plugging the bottom of the funnel, and record the time it takes for the mud exiting the funnel to fill the measuring cup to one liter.
3) Using the mud balance, rinse off all parts of the beam, cup, and lid. Then overfill the cup so that firmly securing the lid over the full cup causes mud to pass through the small hole in the center of the lid. With a finger placed over the hole in the center of the lid and the lid held firmly in place, wipe excess mud and water off of the cup, beam, and lid. Place beam on the included stand and position the counterbalance (sliding weight) such that the beam is level. The mud weight to be recorded is indicated by the position of the counterbalance along the beam.
4) Using the sand content kit, rinse off all parts of the screen, funnels, and glass vial, and then fill the glass vial with mud to the white line. Pour the mud in the vial through the screen; the screen should be fit above the funnel. Once the mud has passed through the screen, separate the screen from funnel and attach the funnel upside down to the top of the screen. Be careful not to lose any material that has settled on the screen. Rinse the glass vial and place the open end upside down over the small end of the funnel. Invert the entire assembly - screen, funnel, and vial - and pour clean water through the screen to release all settled material. Pour only enough water to fill the vial to the white line. Measure the amount of sand using the gradations on the side of the vial and record the value.
5) Using the pH paper included in the kit, place a strip of pH paper into a small sample of mud for the duration specified on the pH paper container. Record the pH that corresponds to the color of the paper after the specified time has elapsed.
6) Using the low-pressure filter press, ensure that the regulator has been bled of compressed air and is closed before disconnecting any parts. Once the regulator is free of compressed air, disconnect the filter plate from the regulator and rinse both parts before placing a new filter disc on the filter plate. Reattach the filter plate to the base of the regulator making sure the rubber O-ring is clean and intact. Provided there is sufficient pressure remaining in the CO2 cartridge attached to the side of the regulator, place the 10-ml graduated cylinder beneath the outlet in the center of the filter plate and open the regulator until the pressure gage is reading 100 psi. Maintain this pressure for 7.5 minutes. Once 7.5 minutes has elapsed from the time the regulator valve was opened, close the regulator valve, bleed the remaining compressed air, and disconnect the filter plate from the regulator. Remove the filter disc making sure not to disturb the mud cake that has formed on its surface. Let sit until damp and measure the thickness of the mud cake. Record this thickness in millimeters in the field log book.
Instructions for Collecting Borehole Soil Samples
TOPOCK FIELD PROCEDURE MANUAL SOP-B10, REVISION 0, 3/31/05
SOP-B10_MUD_ROTARY.DOC 4 OF 4
1) Borehole sample collection using a split spoon sampling device should be conducted in accordance with SOP-B3, Borehole Sampling and Logging of Soil Borings.
KEY CHECKS AND ITEMS
• Routinely confirm that entries to the soil boring log and field log book are accurate and complete. In many cases confirmation and corrections cannot be made later.
• Note all progress made as well as events that may have impeded drilling progress in the field log book.
• Conduct daily visual inspections of the drill rig and equipment to ensure proper working order and that the area is clean and clear of debris.
• Ensure that drilling equipment is decontaminated prior to the beginning of work at each new borehole location.
• Waste materials generated during drilling (soil cuttings, decontamination liquids and debris, personal protective equipment, etc.) will be placed in roll-off bins designated for each type of waste, and subsequently disposed of off site pending analysis.
TOPOCK FIELD PROCEDURE MANUAL SOP-B11, REVISION 0, 3/31/05
SOP-B11_SITECLEARANCEPERMITTING2.DOC 1 OF 3
SOP-B11
Site Clearance and Permitting Standard Operating Procedures for PG&E Topock Program
This standard operating procedure (SOP) addresses the procedures for site clearance and permitting at the Topock site. This SOP should be used to obtain proper site clearance and permits before any work is performed at a site.
REQUIRED DOCUMENTS
1) Applicable project work plan, event-specific sampling and analysis plan (SAP), and/or Procedures Manual, if applicable.
2) Topock Program Health and Safety Plan (HSP).
3) Site map with work locations identified.
PREPARATION AND SETUP
1) Review applicable project work plan, event-specific SAP, Procedures Manual, and HSP.
2) Identify locations where work will be performed, determine if any subsurface work will be needed.
3) Before the start of any work obtain approval by the appropriate land agencies (such as BLM, USFWS, or the County of San Bernardino). Activities located on PG&E property fall under the jurisdiction of the County; however, approval may also be required from BLM and/or USFWS for activities such as access, waste management, etc.
4) Before the start of any work obtain appropriate approval by the regulatory agencies. These include at a minimum the DTSC. Other regulatory approvals that may be required include, but are not limited to CDFG, USFWS, USACE and RWQCB.
If subsurface work will be involved, follow the following steps:
1) Follow the guidelines of the Southern California Underground Service Alert (USA) agency to mark the edges of the work location as outlined on their web page (http://www.digalert.org). Make sure to:
• Identify delineated areas with white markings with the requesters company name or logo within the pre-marked zones
• Delineate the exact area of excavation with white paint through the use of dots or dashes, or a continuous solid line. Limit the size of each dash to approximately 6" in length and 1" width with interval spacing not less that approximately 4 feet. Dots of approximately 1" diameter are typically used to define arcs or radii and may be placed at closer intervals in lieu of dashes. Limit width of lines to 1".

TOPOCK FIELD PROCEDURE MANUAL SOP-B11, REVISION 0, 3/31/05
SOP-B11_SITECLEARANCEPERMITTING2.DOC 2 OF 3
• For point locations (such as a soil boring or well) mark the exact location in the USA box with a stake. Make sure the delineated area around the stake is of adequate radius (50 to 100 feet is appropriate for drilling).
2) Call USA at 1-800-227-2600 at least three working days before the start of work at the identified location and provide them with the information requested on the location request form, shown in Attachment 1. Be ready to give the location in terms of feet relative to I-40 and to Park Moabi Road when calling. You will be assigned a Dig Alert Number, file this number until work at the delineated area is complete. (The number does expire after two weeks and a new number may need to be obtained if work has been delayed.)
3) Mark the Dig Alert Number in the delineated area using white paint as soon as possible after calling USA.
4) If the location is in a developed area, contact a private utility locator and have them perform a sweep of the delineated work area. Util-Locate at (866) 421-5325 is typically used for this service.
5) In some cases the utility companies may need to be contacted directly by CH2M HILL. If the following companies do not respond to the USA ticket or if we are working in their easements, use the following contact information and procedures:
Southwest Gas: Main contact is Jim Default/702-365-2097 (The required minimum clearance distance from gas pipelines is 18-inches. Potholing may need to be performed in advance of design completion Southwest Gas should be called prior to construction activities). If Southwest Gas does not come to the site after the USA call, contact them at their Bullhead City office at (928) 763-7766
Southern California Gas Co.: Main contact is Frank Castro/818-701-4566; secondary contact is Martin Woodsworth/818-701-4543. If we need to work in their easement, we must provide a letter from BLM giving us permission to be on the property. Southern California Gas Co. also requires advance notification of construction activities. They may also require a copy of the design drawing, potholing activities, and the issuance of a "Non-Interference" letter, if applicable, before work can proceed. One of their representatives may need to be in the field when digging is occurring near their pipeline.
TransWestern Pipeline Co.: Main contacts are Ron Westbrook (ROW Department)/713-345-3067 and Mike Baxter (Operations)/928-757-3620. They may require potholing if proposed construction activities are near their pipelines. Crossing pipeline requires filling out a simple form.
Burlington Northern Santa Fe Railroad: Main contact is Greg Rousseau (BNSF)/909-386-4079. Prior to work in their easements submit the proper application with the $250 fee to the Staubach Company.
City of Needles Utility Dept: Main contact is Ron Myers/760-326-5700 (ext. 7 for the utilities department). Work activities may need to be a minimum of 10 to 15 feet from their utility poles.

TOPOCK FIELD PROCEDURE MANUAL SOP-B11, REVISION 0, 3/31/05
SOP-B11_SITECLEARANCEPERMITTING2.DOC 3 OF 3
6) Do not start subsurface work at the site until the delineated area has been marked or cleared by the appropriate utility agencies.
If the work includes a performing a well installation or abandonment, or drilling a boring:
1) Apply for a San Bernardino County well permit two to three weeks before the start of drilling (one permit per well; cost is /$212.00 per well). Obtain a permit application by calling the Environmental Health Services Department at 1-909-387-4666 (open Monday through Friday, 8:00 a.m. to 5:00 p.m). An example well permit form is shown in Attachment2. The fee schedule for permits is located at http://www.sbcounty.gov/ dehs/FEESCHEDULE/feeschedule.htm#wateranchor. Fill out the appropriate permit form and provide it to the California-licensed driller contracted to perform the well installation. The driller is expected to review and file the permit with the San Bernardino County Department of Environmental Health Services (Steve Sesler), address below.
Environmental Health Services 385 N. Arrowhead, 2nd Floor San Bernardino, CA 92415-0160
2) A well permit needs to be obtained from San Bernardino County for well abandonment by the same procedure described in #11. Check the 'destruction' box on the same permit form used for well installation.
3) A permit also needs to be obtained from San Bernardino County for any boring that reaches to or below the water table, even if a well is not actually installed. The permit process is the same as described in #11.
TOPOCK FIELD PROCEDURE MANUAL SOP-B12, REVISION 0, 3/31/05
SOP-B12_WIRELINEGEOPHYSICALLOGGINGL (LT).DOC 1 OF 7
SOP-B12
General Guidance for Wireline Geophysical Logging Standard Operating Procedures for PG&E Topock Program
This standard operating procedure (SOP) addresses the procedures and equipment to be used for oversight of down-hole geophysical surveys performed during drilling and well inspection operations at the Topock site. These procedures are to be considered general guidelines only and are in no way intended to supplement or replace the contractual specifications in the subcontractor’s agreements.
REQUIRED DOCUMENTS
1) Applicable project work plan or monitoring plan. Refer to Topock Program Sampling, Analysis, and Field Procedures Manual and QAPP (Procedures Manual), as required.
2) Topock Program Health and Safety Plan (HSP)
3) Soil Boring Log and or other lithologic descriptions of the local area
4) Well construction logs/specifications (if performed in cased borehole)
5) Available soil and groundwater sample results or field parameter measurements
6) Blank geophysical survey logs and field notebook
EQUIPMENT LISTS
Equipment may vary considerably depending on the scope of work and site conditions. The following pieces of equipment are common, however, the logging contractor typically brings only what is necessary to complete their scope of work.
• Contractor rig or winch system (equipment with proper mast arm and stabilization equipment necessary to lower and raise geophysical equipment within borehole or well)
• Caliper logging tool ( for caliper logging)
• Temperature logging tool (for temperature logging)
• Electric logging tools (for spontaneous potential and resistivity logging)
• Brine injection apparatus (for brine tracer test)
• Fluid conductivity logging tool (for brine tracer test)
• Gamma ray logging tool (for gamma ray logging)
• Acoustic spectrum tool (for acoustic imaging)
• Electromagnetic borehole flowmeter (for flow characterization)
• Video-camera logging tool (for video imaging)

TOPOCK FIELD PROCEDURE MANUAL SOP-B12, REVISION 0, 3/31/05
SOP-B12_WIRELINEGEOPHYSICALLOGGINGL (LT).DOC 2 OF 7
• Decontamination materials
• Electrical power supply
• Appropriate data logging, data analysis and computer equipment
GUIDELINES
Various down-hole geophysical methods are available for subsurface investigation. Some common methods are listed in this section. They can be used to: (i) characterize subsurface lithology, aquifers, or groundwater, (ii) characterize the borehole or well, and (iii) assist in design of wells. This section provides summary information on method applicability and basic guidelines.
Caliper Logging
The caliper log is a record of the average diameter of the borehole. Caliper logs primarily are run to determine annular volumes prior to well construction, locate fractures or other openings might intersect the borehole and assess whether or not squeezing or other effects may have reduced the diameter of the borehole. Caliper logs may be either three-arm or four-arm (X-Y) types. Four-arm caliper logging tools are capable of measuring borehole deviation and direction.
Guidelines:
1) A caliper log must be performed in uncased boreholes.
2) A caliper log featuring arm-type devices is preferable to one featuring bow springs because of greater sensitivity of the arms.
3) Logs should have at least 1 inch of chart width per inch of hole diameter to provide adequate sensitivity of recording.
4) Several feet of casing should be logged so that the accuracy of the tool can be checked.
Electric Logs (E-Logs)
The most common suite of e-logs run in boreholes during well drilling and/or exploration operations include spontaneous potential, sing point resistivity, 16-inch normal, 64-inch normal and guard resistivity. They are all based on the same principals of electrical conductivity, but can be used to extract different sorts of subsurface information. Resistance is measured between two electrodes. When electrodes are closely spaced and boreholes are large, the resistance is affected primarily by borehole fluids. When electrodes are spaced farther apart, the resistance is largely affected by lithology and stratigraphy. The logging records are taken continuously in units of ohm-meters.
Single-point resistance logs record the electrical resistance from points within the borehole to an electrical ground at land surface. In general, resistance increases with increasing grain size and decreases with increasing borehole diameter, fracture density, and dissolved-solids concentration of the water. Single-point resistance logs are useful in the determination of lithology, water quality, and location of fracture zones.
TOPOCK FIELD PROCEDURE MANUAL SOP-B12, REVISION 0, 3/31/05
SOP-B12_WIRELINEGEOPHYSICALLOGGINGL (LT).DOC 3 OF 7
Normal resistance logs record the electrical resistivity of the borehole environment and surrounding rocks and water as measured by variably spaced potential electrodes on the logging probe. Typical spacing for potential electrodes is 16 inches for short-normal resistivity and 64 inches for long-normal resistivity. Normal-resistivity logs are affected by bed thickness, borehole diameter, and borehole fluid and can only be collected in water- or mud-filled open holes
Fluid-resistivity logging provides a measurement of the resistivity of the borehole fluid between closely spaced electrodes in the probe. Abrupt and significant changes in fluid resistivity in the borehole may indicate the entry of groundwater of differing resistivity into the borehole via fractures and other openings in the geologic materials surrounding the borehole.
The fluid-resistivity log should be one of the first logs run because other logging methods will disturb the water in the borehole.
Temperature Logging
The temperature log measures the temperature and temperature gradient of the fluid in the boreholes. It can provide information on the source and movement of groundwater into and out of the borehole. Generally the temperature of the groundwater in the borehole will increase with depth. Deviations from this general trend may indicate where groundwater is flowing up, down, into, or out of the borehole. The presence of water producing zones in the borehole can be inferred from the temperature log data and correlated with other borehole flow data to determine the best well construction parameters for monitoring wells and potential extraction wells.
The temperature log may be made using the same tool as the fluid-resistivity log.
Guidelines:
1) A temperature log can be performed in uncased boreholes or wells.
2) Drilling, pumping and disruption to the fluid column will disturb the temperature gradient. For best results, the borehole needs to stabilize for at least 5 days before temperature logging.
3) The temperature log should be one of the first logs run because other logging methods will disturb the water in the borehole.
4) All temperature sensors have an inherent response lag, or time constant, so that the logging speed must be constant and slow enough that the temperatures are accurately reflected at the true depths on the log.
Flow Logging
Borehole flow logging is performed using an electromagnetic borehole flowmeter. Flow logging can identify the zones with the highest flow rate. These data are correlated with other flow data and fracture data using Geostatistics and used to evaluate the most permeable portions of the rock formation.
TOPOCK FIELD PROCEDURE MANUAL SOP-B12, REVISION 0, 3/31/05
SOP-B12_WIRELINEGEOPHYSICALLOGGINGL (LT).DOC 4 OF 7
Guidelines:
1) Flow logging can be performed in uncased borings or wells.
2) This method may not be accurate in a boring drilled using the mud rotary method since drilling fluids may disrupt the natural flow patterns, and inhibit flow from permeable zones.
3) Results of flow logging may be biased by differing gradients at various zones. To determine the response of various zones to specific aquifer units, flow logging can be performed in an observation borehole or well during a pump test. To determine hydraulic properties, flow logging should be performed in boreholes where horizontal gradients are relatively equivalent with depth.
Brine Tracing
Brine tracing is used to measure natural or artificially induced flow within a borehole. Data on borehole flow is related to well construction, vertical differences in hydraulic head within the open or screened interval in the well, and the relative magnitude or permeability of the water-bearing units open to the well.
Guidelines:
1) Brine tracing can be performed in uncased borings or though the screened zones of cased borings or wells.
2) The fluid conductivity of the borehole should be profiled previous to the injection of brine. Low conductivity fluids, with a flat conductivity profile are ideal.
3) Lithologic stratigraphy data should be detailed enough to determine if conductivity anomalies are caused by stratigraphic changes.
4) The conductivity difference between the brine and borehole fluids needs to be large enough to easily distinguish between dilution caused by brine moving downwards though the borehole, and dilution caused by fluid movement from the aquifer.
5) The brine should be more dense than the borehole fluid, in order to move downward through the borehole from the injection point near the surface of the borehole fluid.
6) The dilution and movement are monitored by moving the detector slowly up and down through the tracer. Care is required so that the movement of the detector does not cause excessive spreading of the tracer; this effect can be minimized by using the smallest-diameter probe available.
Gamma Ray Log
The gamma ray log is used to measure the naturally occurring gamma emissions in counts per second (cps) from the formation surrounding the boreholes, due to potassium and elements of the uranium and thorium series present in the rocks. The log is a single trace of measured average radiation versus depth. Changes in the amount of gamma emissions result in significant changes in the single trace which will display measured average radiation versus depth. The presence of lithological changes in the borehole can be inferred
TOPOCK FIELD PROCEDURE MANUAL SOP-B12, REVISION 0, 3/31/05
SOP-B12_WIRELINEGEOPHYSICALLOGGINGL (LT).DOC 5 OF 7
from the gamma ray log data and correlated with other lithological data derived from formation samples.
Guidelines:
1) Gamma ray logs can be performed in cased and uncased borings or wells.
2) The logging tool will need to be moved at a constant rate in order for counts to be weighed accurately to various depths.
3) For a given site, the rate of movement may have to be adjusted to the geologic materials present in the borehole walls. In general, the smaller the gamma counts, the slower the tool should be moved.
4) These logs may be biased by water with radiological contaminants
5) Gamma ray logging equipment does not contain radiological emission sources, as does some radiological methods (neutron probe). Therefore this equipment does not have to be treated as a hazard.
Video Logging
Video logging provides a real-time and recorded image of the actual conditions in the borehole. The video log typically is used to identify the depths of fractures and other openings in the borehole. Well videos can also be performed in order to assess damage and structure of wells. It is important to ensure the video log tool has side-scan capabilities.
Guidelines:
1) The log should be run at a sufficiently slow speed that features can be accurately recorded.
2) The field geologist (or technician), if possible, should observe the logging image so that the operator can be directed to stop or reduce logging speed at any critical locations, such as intervals where flow may be occurring as indicated by the movement of particles in the borehole.
3) If a non-aqueous phase liquid (NAPL), particularly one that floats on the surface, is present in the borehole, the image may be so adversely affected that the NAPL may have to be removed from the borehole before logging can be completed.
4) The field geologist (or technician) should obtain a copy of the video in VHS format while the operator is still in the field.\
5) A video log report containing photos of key features and their depths should be generated and provided to the CH2M HILL representative on site immediately following the logging.
Acoustic Televiewer/Spectrum System
The acoustic logs are used to measure the amplitude and pulse travel time of transmitted acoustic pulses returning from the borehole wall. The generated log is a pseudo log in waveform graphics. The pseudo log consists of an image oriented to the magnetic north as a two dimensional presentation of direction and depth. From left to right, the quadrants

TOPOCK FIELD PROCEDURE MANUAL SOP-B12, REVISION 0, 3/31/05
SOP-B12_WIRELINEGEOPHYSICALLOGGINGL (LT).DOC 6 OF 7
run north, east, south, west, and back again to north (360 degrees). The final image is a continuous picture of the borehole, with depths to the far right and the image, laid flat, to the left. From these pseudo logs, the depth, orientation, and dip of bedding intersecting the borehole can be determined. These data are correlated with other data using geostatistical analysis to determine the best location to monitor for groundwater contamination.
Guidelines:
1) This visualization method should be performed in an open borehole, with no opaque fluids.
2) The log should be run at a sufficiently slow speed that features can be accurately recorded.
EXECUTION/PROCEEDURES
Specific procedures vary according to the geophysical method used, and the specific equipment and software used. The general procedures are as follows:
1) Prior to commencement of down-hole measurements, the site should be evaluated to determine if the site conditions are safe and appropriate for the specific work to be performed.
2) Determine the proper order or combination of geophysical logs/tests that will provide the best data, and minimal interference.
3) Calibrate all down-hole instruments and check that all equipment is working in proper order. Calibration should be properly documented.
4) Collect preliminary measurements pertinent to all geophysical logs/tests.
5) Set up equipment, making sure that all electrical equipment is properly grounded, and all mechanical equipment is properly supported. Cables should not be positioned such that they may be entangled or cause tripping hazards.
6) The logging equipment should be adequately decontaminated before the first use on the site and between boreholes.
7) Perform down-hole geophysics with oversight of appropriately trained and experienced scientist or engineer, with appropriate documentation of field techniques.
8) Review each log, test or visualization prior to removal of instruments from boring to determine if, and where new data needs to be collected.
9) Allow borehole fluids to equilibrate as is necessary and practicable between logging runs.
10) Secure each boring or well prior to proceeding to another location. No instruments, cables or fluids should be suspended within unattended borehole.
11) Collect all available electronic and hardcopy data from subcontractor prior to departure.
TOPOCK FIELD PROCEDURE MANUAL SOP-B12, REVISION 0, 3/31/05
SOP-B12_WIRELINEGEOPHYSICALLOGGINGL (LT).DOC 7 OF 7
KEY CHECK AND ITEMS
• Ensure that subcontractor follows their procedures, particularly those for calibration of the instruments and the rate of logging.
• Obtain copies of logs at the site.
• Temperature and fluid-resistivity logs should be run first so that the disturbance caused by the other logging methods does not disrupt the results of these two methods.
• Decontaminate as necessary.
DELIVERABLES
Geophysical logs should be run in the presence of a CH2M HILL representative and the results, including three field copies of each log, provided to a CH2M HILL representative immediately after completion. The logs become the property of CH2M HILL at the time the logging is completed. In addition to the three field copies, the logging specialist shall submit the following:
1) Five final copies of each geophysical log.
2) Digital ASCII files of all geophysical data on a compact disk.
3) Digital PDF files of all geophysical data on compact disk.
Upon receiving copies of the geophysical logs, the CH2M HILL representative in the field should distribute copies of the logs to the appropriate senior level staff in the office and field. Geophysical logs should also be reviewed by the driller (in the case of drilling operations) and in the presence of the logging specialist contracted to perform the wireline logging.
REFERENCES
The following are useful technical references:
Driscoll, F.G. 1995. Groundwater and Wells. Second Edition. St. Paul, MN: Johnson Screens.
Keyes, Scott W. 1989. Borehole Geophysics Applied to Groundwater Investigations. National Water Well Association.
Welenco Inc. 1996. Water and Environmental Geophysical Well Logs. Welenco, Inc., 8th Edition
TOPOCK FIELD PROCEDURE MANUAL SOP-B13, REVISION 0, 3/31/05
SOP-B13_EXTRACT_INSTALL_DEVEL.DOC 1 OF 3
SOP-B13
Extraction Well Installation and Development Standard Operating Procedures for PG&E Topock Program
Development of extraction wells at Topock will consist of surge block and air-lift followed by pumping development. Prior to any development activities, the well will be cleaned of all heavy muds and sediment settled at the bottom of the well using an air-lift pipe from the drilling rig.
EQUIPMENT LIST
• Air-lift pipe • Surge block/air-lift development tool • Dispersant • Access Tube • Flow Meter • Rossum Sand Tester • Drilling rig (hollow stem auger, sonic, air hammer, air rotary, or mud rotary)
SURGE BLOCK AND AIR-LIFT
Guidelines
Air-lift pipe.
Most air-lift tools consist of a discharge, or eductor, pipe and a smaller concentric air-injection pipe (air line), both partially submerged in the well. The air line is set inside the eductor pipe at a slightly shallower depth. Compressed air is introduced through a discharge point in the air line that allows air to be discharged into the well with resulting discharge of water through the pipe and out of the well. This is used to air-lift accumulated sediments from the bottom of the well.
Surge block/air-lift development tool.
This tool consists of two rubber discs (swabs) whose outside diameter is not more than 1 inch smaller than the inside diameter of the screen section, separated by a 10- to 20-foot section of perforated drill pipe. The drill pipe should have sufficient perforations between surge blocks for passage of at least 200 gpm.
Dispersant.
A non-phosphate based clay dispersant such as Baroid’s Aqua-Clear PFD, Johnson’s NuWell 220, or equivalent.
Procedure
All development activities should commence within 24 hours of placing the annular seal. If surge and air lift development is not commenced within 24 hours of placing the annular

TOPOCK FIELD PROCEDURE MANUAL SOP-B13, REVISION 0, 3/31/05
SOP-B13_EXTRACT_INSTALL_DEVEL.DOC 2 OF 3
seal, additional development above and beyond what is considered “typical”, may be required. Development will consist of the following steps in order of their operation:
1) Initial development by surge block and air-lift pumping. Surge block development of the well should begin by gently surging and simultaneously air lifting in the unperforated casing immediately above the uppermost section of well screen. During this time, the surge block is raised and lowered several times every 15 minutes. Periodically, the driller measures and bails from the well all sand, silt, and clay that has accumulated at the bottom. Surging in the unperforated casing section continues until no additional appreciable quantity of sand, silt, or clay is brought into the well. At this time, the surge block is lowered into the screened section and surge development continued gently from the top of the screened interval downward. The pumping rate shall be between 50 to 150 gpm. It is expected that this stage of surging and air-lift continue for approximately 16 hours.
2) Application of dispersant - Add a non-phosphate based dispersant into the well using the surge block tool. The amount of dispersant required and instructions for mixing vary depending on the product. The manufacturer should be consulted prior to application for instructions on how to most effectively apply the dispersant. For best results, the well should be pre-treated with no more than 500 ppm of chlorine. After the proper volumes have been calculated, the dispersant is swabbed into 20-foot sections of well screen and agitated using the surge block tool for a half-hour prior to moving on to the next 20-foot screen section. The dispersant should be allowed to sit in the well for at least two hours prior to any additional surge block and air-lift development.
3) Final development by surge block and air-lift pumping. After applying the dispersant, development by surge block and air-lift in the screen section should continue. Similar to before, the surge block is lowered into the screened section and surge development continued gently from the top of the screened interval downward. The pumping rate shall be between 50 to 150 gpm. It is expected that additional surging and bailing continue for approximately 16 hours or until sand, silt, and clay have been washed through the screen to the satisfaction of the CH2M HILL representative on site. Upon completion of this procedure, the well should again be bailed clean of all accumulated sediment to its full depth using the air-lift tool.
DEVELOPMENT BY PUMPING
Guidelines
Access tube
A 2-inch diameter sounding tube adequate for insertion of water level sensing devices should be installed in the well before the test pumping. The access pipe must allow free passage of pressure transducers that are 1 inch in diameter and approximately 8 inches long. The sounding tube shall be securely fastened to the pump column assembly, terminate approximately 5 feet above the pump, and be perforated along the bottom 10 feet.
Flow meter
The Contractor shall provide instantaneous and totalizing flow meters, or other approved devices, that will measure the flow rate to an accuracy of 5 percent or better. To guarantee
TOPOCK FIELD PROCEDURE MANUAL SOP-B13, REVISION 0, 3/31/05
SOP-B13_EXTRACT_INSTALL_DEVEL.DOC 3 OF 3
accurate measurements, the discharge pipe must be level for a distance of ten-pipe diameters upstream of the flow meter and five pipe diameters downstream of the flow meter.
Rossum Sand Tester
A Rossum Sand Tester should be coupled to a small-diameter pipe tapped horizontally in the well discharge pipe close to the pump head.
Record Keeping
The Contractor shall monitor and document the specific capacity (pumping rate and drawdown) of the well as it is developed with the pump. The monitoring frequency and instrumentation shall be approved by the Engineer. The on-site CH2M HILL representative keeps records of the following: 1) pumping rate, 2) water level, 3) drawdown, 4) specific capacity, 5) sand content, and other pertinent information regarding well development at regular time intervals.
Procedure
1) The initial pumping rate during development is restricted (fairly low rate) and, as the water clears, is gradually increased until the maximum allowable rate is reached. The step increase discharge schedule and maximum pumping rate is determined by the on-site CH2M HILL representative prior to the initiation of pumping. At regular intervals, the pump shall be stopped and the water in the pump column allowed to surge back through the pump intake.
2) The well is considered thoroughly developed when measured specific capacity at the maximum discharge rate is similar to previous wells drilled nearby, and does not produce fine sands in excess of the sand production. Sand production should be limited to less than 5 parts per million sand after 15 minutes of surging and pumping at the design capacity of the well. During the development pumping, the rate of sand production is measured using the Rossum Sand Tester. For analysis, measurements are made during steady state pumping after a surge. It is estimated that the development by pumping continue for approximately 16 hours.

SFO\FIELDPROCEDURES_REVISION1.DOC
Appendix C Hydraulic Data Collection and Testing
TOPOCK FIELD PROCEDURES MANUAL SOP-C1, REVISION 0, 3/14/2005
SOP-C1_TEMP_RMVL_REPL_PRES_TRDS.DOC 1 OF 2
SOP-C1
Temporary Removal and Replacement of Pressure Transducers Standard Operating Procedures, PG&E Topock Project
This standard operating procedure (SOP) addresses the procedures and equipment to be used for the temporary removal and reinstallation of pressure transducers during the sampling of groundwater monitoring wells at the Topock site. Pressure transducers should only be removed if it is necessary to make additional room for the temporary placement of sampling equipment.
Transducers measure the pressure head, or the height of water above a pressure sensor, which is converted to a groundwater elevation. Groundwater elevations often vary only by a tenth of a foot or less between wells and it is therefore important to maintain the correct transducer installation setup and to avoid unnecessary movement of the transducers. If it is necessary to remove the transducers for groundwater sampling, the following procedures should be followed.
REQUIRED DOCUMENTS
1) Event-specific sampling and analysis plan
2) SAP/QAPP
3) HSP
4) Well construction logs/specifications
5) Previous sampling logs and water level data
6) Blank sampling logs and field notebook
7) Pressure transducer installation log
PREPARATION AND SETUP
1) Review event-specific sampling and analysis plan, previous field data, SAP, QAPP, and HSP.
2) Initiate field logbook for sampling activity.
3) Inspect all equipment and calibrate water level meters (if multiple meters are being used) according to SOP-1, Calibration of Field Instruments.
4) Calibrate wrist-watch to satellite time using atomic clock time at Topock Compressor Station.
MEASUREMENT PROCEDURES
1) Open well protection lid and inspect transducer installation hardware. The transducer mounting bracket should be perfectly flush against the well casing. The nuts holding
TOPOCK FIELD PROCEDURES MANUAL SOP-C1, REVISION 0, 3/14/2005
SOP-C1_TEMP_RMVL_REPL_PRES_TRDS.DOC 2 0F 2
the mounting bracket together should be inside the well casing for the 2” and 4” wells. The 1” wells will have the nuts resting directly on top of the well casing. Describe the transducer setup and condition in the transducer comments section of the sampling field data sheet. Mark the position of the mounting bracket using a permanent marker against the top of the well casing to verify the correct reinstallation of the pressure transducer. If the transducer is incorrectly installed, inform the field team manager.
2) Before removing the transducer, measure the depth to water below top of casing (DTW BTOC) according to SOP-3, Water Level Measurements. Record the exact time to the nearest minute and the DTW BTOC in the transducer section of the sampling form (use attached form dated June 2004). Mark the location of the kelly grip attachment on the pressure transducer communication cable housing. Use a permanent marker to draw lines across the pressure transducer communication cable housing bracketing upper and lower points at the kelly grip. This will facilitate reinstallation of the pressure transducer to the exact depth.
3) Remove the transducer, coil the cable, and store in a manner to prevent contamination of the cable and probe. A clean, large heavy-gauge plastic garbage bag or leaf bag or a large sheet of visqueen (large enough to fold over the coiled pressure transducer and communication cable) should be made available as the pressure transducer and communication cable is removed from the well. Record the time of removal on the sampling field data sheet.
4) When groundwater sampling is completed, reinstall the transducer and maintain the correct setup of the transducer mounting hardware as described in Steps 1 and 2. Inspect the kelly grip to ensure it is in the same location as when the pressure transducer was removed from the well. Inspect the mounting bracket to ensure it is installed in the same position as originally installed. Record the time of reinstallation on the sampling field data sheet. If the installation setup of the transducer has changed, notify the field team manager.
5) Measure the depth to water below top of casing at least five minutes after reinstalling the transducer according to SOP-3, Water Level Measurements. Record the time and DTW BTOC on the sampling form.
The above procedures are for removal and replacement of transducers during groundwater sampling. For transducer downloading and maintenance procedures contact the field manager and refer to Pressure Transducer Download and Maintenance SOP, PG&E Topock.
TOPOCK FIELD PROCEDURES MANUAL SOP-C2, REVISION 0, 3/20/2005
SOP-C2_TRANSDUCER_PROG.DOC 1 OF 5
SOP-C2
Transducer Programming Standard Operating Procedures for PG&E Topock Program
This standard operating procedure (SOP) details field instructions for transducer programming at the PG&E Topock site.
PROCEDURE
1. Before starting any transducer programming, please ensure that laptops, PDAs, rugged readers, and watches are exactly synchronized with PG&E atomic clock. Always double-check this - one of the worst things that can happen is to have transducers unsynched.
2. At the well, perform a visual inspection of the transducer cable and hanger. Ensure that the transducer is hanging freely in the well and not obstructed or hung up on any other equipment in the well. Ensure that the cable is properly capped and pins are not damaged.
3. Connect to the transducer with the rugged reader, PDA or laptop using one of the data cables (gray cables are for the older Troll 4000s; yellow, black or white cables are for the newer miniTrolls or Troll 9000s). Note that the rugged reader will not work with the older Troll 4000s.
4. Start the software on the PDA or laptop as follows:
Transducer PDA Laptop Troll 4000 Pocket-Situ 1.1 Win-Situ Legacy or 2000 miniTroll Pocket-Situ 4.4 Win-Situ 4
5. Establish connection with transducer:
⇒ Select COM 1-19200 and press FIND (this will search for a connected transducer)
6. If a test is currently running, download/extract the currently running test before doing any changes to the transducer programming. Most transducer programming features (Date/Time, Name, Test features, etc.) cannot be changed while a test is running. To do programming, stop the test. Note that stopping the test does not mean the test has to be deleted to program a new test. The exception is RRB, which can only have one test in memory at a time.

TOPOCK FIELD PROCEDURES MANUAL SOP-C2, REVISION 0, 3/20/2005
SOP-C2_TRANSDUCER_PROG.DOC 2 OF 5
7. Change the NAME of the transducer if the transducer is being installed for the first time or moved from another well. The transducer name should be the well name (e.g., MW-34-55).
⇒ Select the transducer (click on the serial number; one level beneath COM1-19200)
⇒ Press EDIT
⇒ Chose NAME
⇒ Type in Well I.D. (use the exact name with hyphens and all)
⇒ Press FINISH
8. Set the DATE/TIME for the transducer. If using a laptop, maximize the Win-Situ window. The computer time should be visible in the bottom right-hand corner of the screen in the task bar, and the transducer time should be visible in the bottom right-hand corner of the Win-Situ screen. Compare the laptop time with the transducer time. If error is greater than 15 seconds, make note of the time error in the field bock, make note that the time is being synchronized, and then:
⇒ Press EDIT (same as with NAME) ⇒ Choose CLOCK ⇒ Note that all transducers are on Pacific Standard Time (PST) year-round.
DO NOT enter Daylight Savings Time (or Pacific Daylight Time – PDT) into the transducer. Transducers will always be one hour behind when Daylight Savings is observed in the summer months (April through October).
⇒ Synchronize with computer clock (ensure that the computer clock is on PST and not PDT synchcronized with satellite time – double-check this as computer times are unreliable!!). If you cannot synchronize with laptop, enter time manually with no more than 5 seconds error.
⇒ Press FINISH
9. Note battery capacity at the bottom of main screen. A battery capacity of 100 percent equates to a few months to a couple years of operation depending on data collection frequency. If this is a new installation, battery capacity should be 100 percent.
10. Check installation depth:
⇒ Select PARAMETERS ⇒ Choose PRESSURE ⇒ Press READ

TOPOCK FIELD PROCEDURES MANUAL SOP-C2, REVISION 0, 3/20/2005
SOP-C2_TRANSDUCER_PROG.DOC 3 OF 5
Note submergence depth. Submergence depth should be between 0 and the pressure rating of the transducer. Do a reality check with the depth to water and the length of cable (e.g., if water is 45 feet BTOC and transducer is hung on 75 foot cable, pressure reading or submergence depth should be ~30 feet or 13 psi).
⇒ Lower or raise transducer if it is deeper than its rating or if it is too shallow to measure fluctuating water levels. Click UPDATE between each adjustment for new submergence. Record final submergence setting.
11. Configure Pressure Sensor:
⇒ Select PARAMETERS ⇒ Select PRESSURE ⇒ Select EDIT ⇒ Select PRESSURE HEAD ⇒ Note that selecting PRESSURE HEAD disables all the offsets, densities, or
latitude corrections. All these corrections will be applied in the office as “post-processing”.
12. Configure Temperature Sensor:
⇒ Select PARAMETERS ⇒ Select TEMPERATURE ⇒ Select EDIT ⇒ Select FARENHEIT
13. Record time-synchronized manual water level and transducer pressure head:
⇒ Measure depth to water below measuring point (nearly always top of PVC casing)
⇒ Force the transducer to read pressure head ⇒ Select PARAMETERS ⇒ Select PRESSURE ⇒ Select READ ⇒ Record Date, Time, Manual Depth to Water, and the Pressure Head
An extra step here is to precisely mark 1-foot increments on the transducer cable with a permanent marker. Temporarily raise the transducer in exactly 1 foot increments and record pressure readings (or forced scans) at every increment. The transducer should be recording exactly 1-foot changes (or 0.43 psi) in pressure as the transducer is raised or lowered each increment. This is an
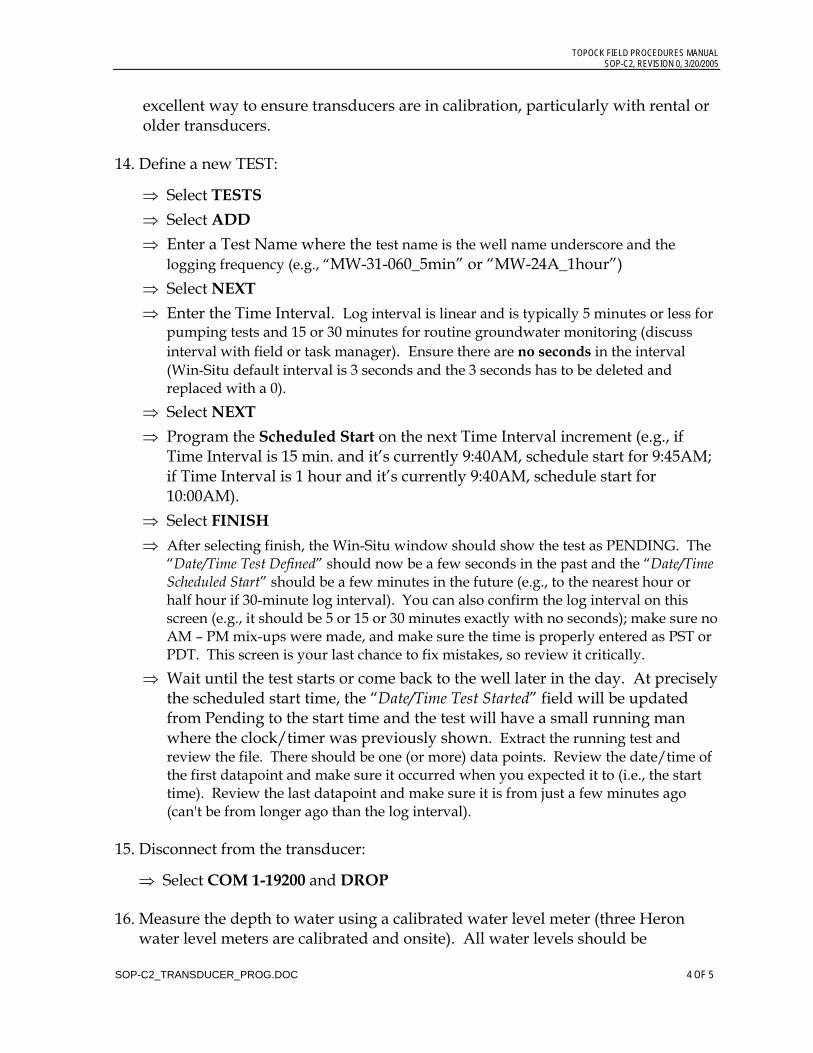
TOPOCK FIELD PROCEDURES MANUAL SOP-C2, REVISION 0, 3/20/2005
SOP-C2_TRANSDUCER_PROG.DOC 4 OF 5
excellent way to ensure transducers are in calibration, particularly with rental or older transducers.
14. Define a new TEST:
⇒ Select TESTS ⇒ Select ADD ⇒ Enter a Test Name where the test name is the well name underscore and the
logging frequency (e.g., “MW-31-060_5min” or “MW-24A_1hour”) ⇒ Select NEXT ⇒ Enter the Time Interval. Log interval is linear and is typically 5 minutes or less for
pumping tests and 15 or 30 minutes for routine groundwater monitoring (discuss interval with field or task manager). Ensure there are no seconds in the interval (Win-Situ default interval is 3 seconds and the 3 seconds has to be deleted and replaced with a 0).
⇒ Select NEXT ⇒ Program the Scheduled Start on the next Time Interval increment (e.g., if
Time Interval is 15 min. and it’s currently 9:40AM, schedule start for 9:45AM; if Time Interval is 1 hour and it’s currently 9:40AM, schedule start for 10:00AM).
⇒ Select FINISH ⇒ After selecting finish, the Win-Situ window should show the test as PENDING. The
“Date/Time Test Defined” should now be a few seconds in the past and the “Date/Time Scheduled Start” should be a few minutes in the future (e.g., to the nearest hour or half hour if 30-minute log interval). You can also confirm the log interval on this screen (e.g., it should be 5 or 15 or 30 minutes exactly with no seconds); make sure no AM – PM mix-ups were made, and make sure the time is properly entered as PST or PDT. This screen is your last chance to fix mistakes, so review it critically.
⇒ Wait until the test starts or come back to the well later in the day. At precisely the scheduled start time, the “Date/Time Test Started” field will be updated from Pending to the start time and the test will have a small running man where the clock/timer was previously shown. Extract the running test and review the file. There should be one (or more) data points. Review the date/time of the first datapoint and make sure it occurred when you expected it to (i.e., the start time). Review the last datapoint and make sure it is from just a few minutes ago (can't be from longer ago than the log interval).
15. Disconnect from the transducer:
⇒ Select COM 1-19200 and DROP
16. Measure the depth to water using a calibrated water level meter (three Heron water level meters are calibrated and onsite). All water levels should be
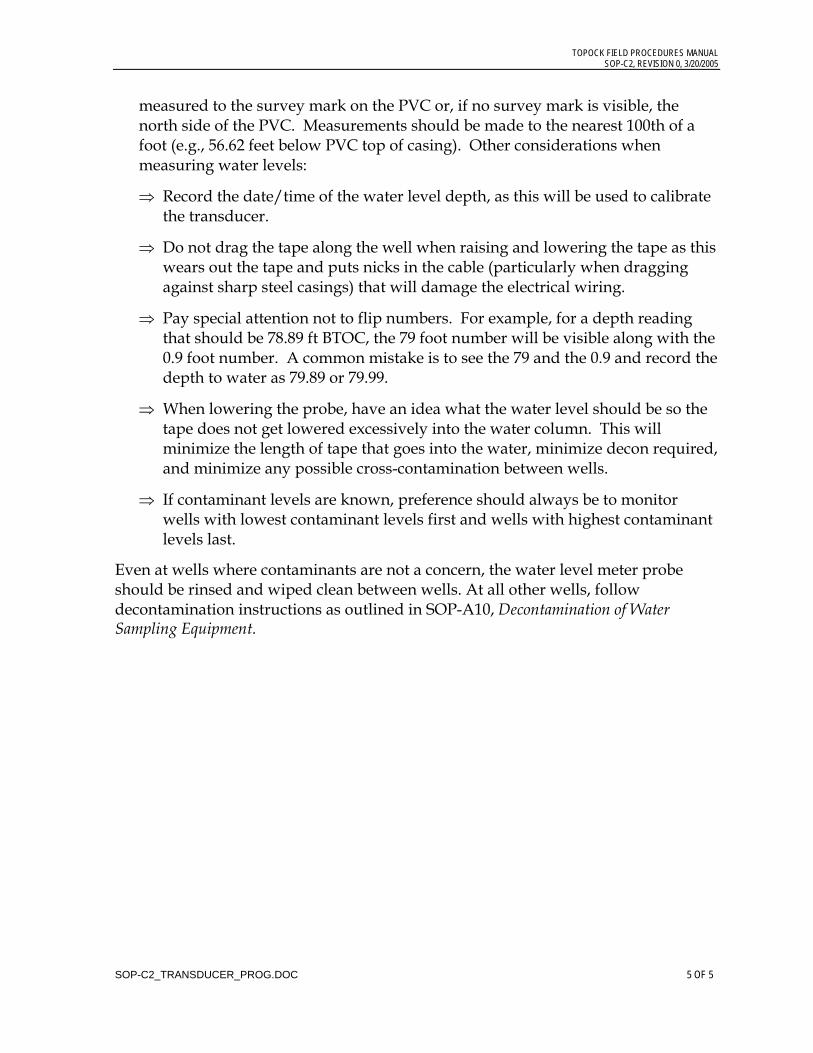
TOPOCK FIELD PROCEDURES MANUAL SOP-C2, REVISION 0, 3/20/2005
SOP-C2_TRANSDUCER_PROG.DOC 5 OF 5
measured to the survey mark on the PVC or, if no survey mark is visible, the north side of the PVC. Measurements should be made to the nearest 100th of a foot (e.g., 56.62 feet below PVC top of casing). Other considerations when measuring water levels:
⇒ Record the date/time of the water level depth, as this will be used to calibrate the transducer.
⇒ Do not drag the tape along the well when raising and lowering the tape as this wears out the tape and puts nicks in the cable (particularly when dragging against sharp steel casings) that will damage the electrical wiring.
⇒ Pay special attention not to flip numbers. For example, for a depth reading that should be 78.89 ft BTOC, the 79 foot number will be visible along with the 0.9 foot number. A common mistake is to see the 79 and the 0.9 and record the depth to water as 79.89 or 79.99.
⇒ When lowering the probe, have an idea what the water level should be so the tape does not get lowered excessively into the water column. This will minimize the length of tape that goes into the water, minimize decon required, and minimize any possible cross-contamination between wells.
⇒ If contaminant levels are known, preference should always be to monitor wells with lowest contaminant levels first and wells with highest contaminant levels last.
Even at wells where contaminants are not a concern, the water level meter probe should be rinsed and wiped clean between wells. At all other wells, follow decontamination instructions as outlined in SOP-A10, Decontamination of Water Sampling Equipment.

TOPOCK FIELD PROCEDURES MANUAL SOP-C3, REVISION 00, 3/14/2005
SOP-C3_PRESSURE_TRANSDUCER_INSTALL_DWNLD_MAINT.DOC 1 OF 8
SOP-C3
Pressure Transducer Installation, Download, and Maintenance Standard Operating Procedures for PG&E Topock Program
This document details procedures for pressure transducer installation, downloads, and maintenance at the PG&E Topock site.
Additional information on installations, downloads, and data transfers are available as attachments to this document and in the In-Situ miniTroll and Win-Situ manuals.
REQUIRED DOCUMENTS
1) Event-specific sampling and analysis plan
2) SAP/QAPP
3) HSP
4) Well construction logs/specifications
5) Previous sampling logs and water level data
6) Blank sampling logs and field notebook
7) Pressure transducer installation log
PREPARATION AND SETUP
1) Review event-specific sampling and analysis plan, previous field data, SAP, QAPP, and HSP.
2) Initiate field logbook for sampling activity.
3) Inspect all equipment and calibrate water level meters (if multiple meters are being used) according to SOP-1, Calibration of Field Instruments.
4) Calibrate wrist-watch to satellite time using atomic clock time at Topock Compressor Station.
GUIDELINES
Installations
Proper installation of transducer is very important. The transducers measure the height of water above the sensor or pressure head. Following calibration, the height of water (pressure head) is converted into a groundwater elevation (or hydraulic head, which is pressure head plus the elevation). Groundwater elevations often vary only by a tenth of a foot or less between wells. Improper installations can result in errors in transducer readings by a tenth of a foot or more completely invalidating data. Some goals for transducer installation are:

TOPOCK FIELD PROCEDURES MANUAL SOP-C3, REVISION 00, 3/14/2005
SOP-C3_PRESSURE_TRANSDUCER_INSTALL_DWNLD_MAINT.DOC 2 0F 8
⇒ Install the transducer securely in a manner so that it does not have to be removed, raised or changed in any way during sampling, well access, water level measurements, etc.
⇒ Install the transducer so that it is possible, if necessary, to remove and replace the transducer while maintaining calibration
⇒ Minimize restriction of well access (i.e., maintain access for water levels meter and sampling equipment)
Always obtain as many manual water level measurements as possible after installation. If there is ever any question that the transducer has been moved, collect another manual water level measurement. The manual water level measurements are used to calibrate the transducer (convert the pressure head into hydraulic head or groundwater elevation).
Data Downloads
Data downloads should be conducted regularly to provide data for analysis & evaluation and to ensure the transducer is working properly. Data should be screened in the field to ensure data extends to the download date (i.e., is still recording) and that the data make sense (i.e., the sensor hasn’t “maxed out” its pressure ranged and data are garbled, which can happen when a transducer fails). Battery life and storage capacity should be checked to ensure the transducer will continue to operate well into the future.
Communication and Data Transfer
Before stopping any test or removing transducers, please communicate with office staff. Frequency of data downloads is variable, but at the current time should be at least bi-weekly. Please document any discrepancies with respect to installation, programming, errors in the field log book. Data transfers to office staff should include the downloaded bin files, a photocopy of the field log book, and if possible, manual water levels entered into a spreadsheet.
Key Contacts
Key contacts are:
Contact Office Cell Email
Jay Piper (702) 369-6904 x1202 (702) 525-1137 [email protected]
David Thomas (510) 587-7529 (510) 220-4449 [email protected]
John Piersol (510) 587-7619 (510) 517-5950 [email protected]
Martin Barackman (530) 229-3401 (530) 945-8371 [email protected]
Procedures
Transducer Installation Procedures
1. Physical installation of a transducer is as follows:
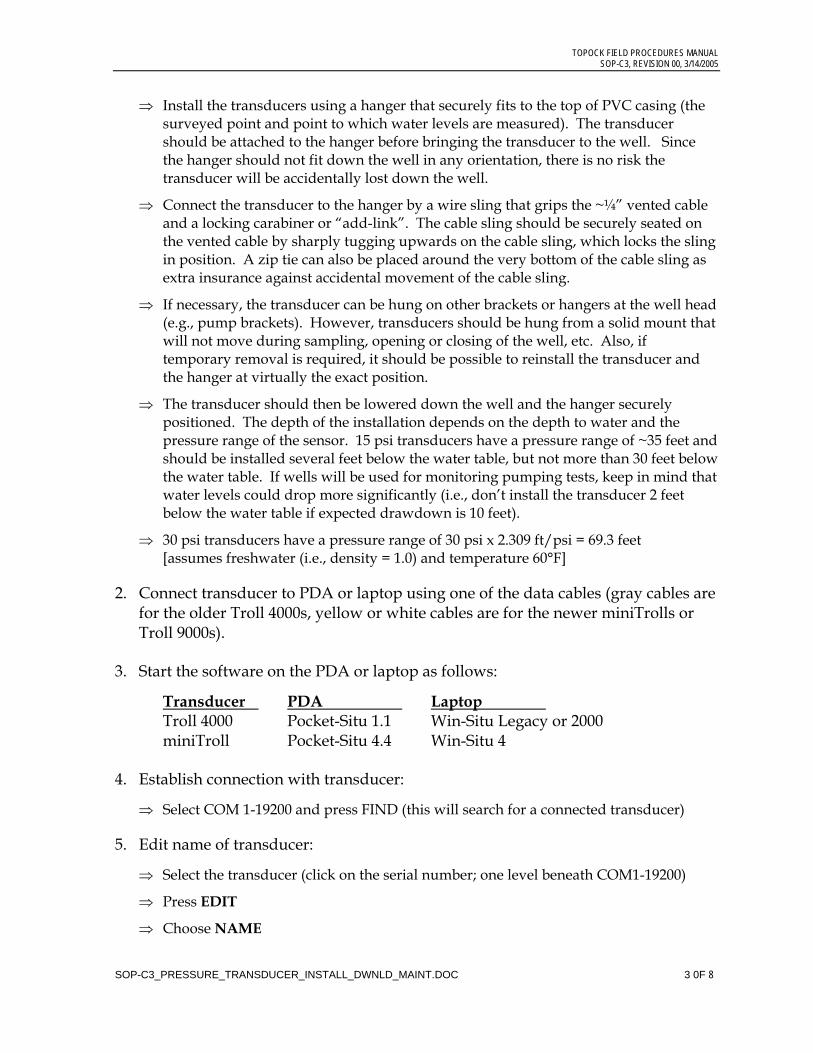
TOPOCK FIELD PROCEDURES MANUAL SOP-C3, REVISION 00, 3/14/2005
SOP-C3_PRESSURE_TRANSDUCER_INSTALL_DWNLD_MAINT.DOC 3 0F 8
⇒ Install the transducers using a hanger that securely fits to the top of PVC casing (the surveyed point and point to which water levels are measured). The transducer should be attached to the hanger before bringing the transducer to the well. Since the hanger should not fit down the well in any orientation, there is no risk the transducer will be accidentally lost down the well.
⇒ Connect the transducer to the hanger by a wire sling that grips the ~¼” vented cable and a locking carabiner or “add-link”. The cable sling should be securely seated on the vented cable by sharply tugging upwards on the cable sling, which locks the sling in position. A zip tie can also be placed around the very bottom of the cable sling as extra insurance against accidental movement of the cable sling.
⇒ If necessary, the transducer can be hung on other brackets or hangers at the well head (e.g., pump brackets). However, transducers should be hung from a solid mount that will not move during sampling, opening or closing of the well, etc. Also, if temporary removal is required, it should be possible to reinstall the transducer and the hanger at virtually the exact position.
⇒ The transducer should then be lowered down the well and the hanger securely positioned. The depth of the installation depends on the depth to water and the pressure range of the sensor. 15 psi transducers have a pressure range of ~35 feet and should be installed several feet below the water table, but not more than 30 feet below the water table. If wells will be used for monitoring pumping tests, keep in mind that water levels could drop more significantly (i.e., don’t install the transducer 2 feet below the water table if expected drawdown is 10 feet).
⇒ 30 psi transducers have a pressure range of 30 psi x 2.309 ft/psi = 69.3 feet [assumes freshwater (i.e., density = 1.0) and temperature 60°F]
2. Connect transducer to PDA or laptop using one of the data cables (gray cables are for the older Troll 4000s, yellow or white cables are for the newer miniTrolls or Troll 9000s).
3. Start the software on the PDA or laptop as follows:
Transducer PDA Laptop Troll 4000 Pocket-Situ 1.1 Win-Situ Legacy or 2000 miniTroll Pocket-Situ 4.4 Win-Situ 4
4. Establish connection with transducer:
⇒ Select COM 1-19200 and press FIND (this will search for a connected transducer)
5. Edit name of transducer:
⇒ Select the transducer (click on the serial number; one level beneath COM1-19200)
⇒ Press EDIT
⇒ Choose NAME
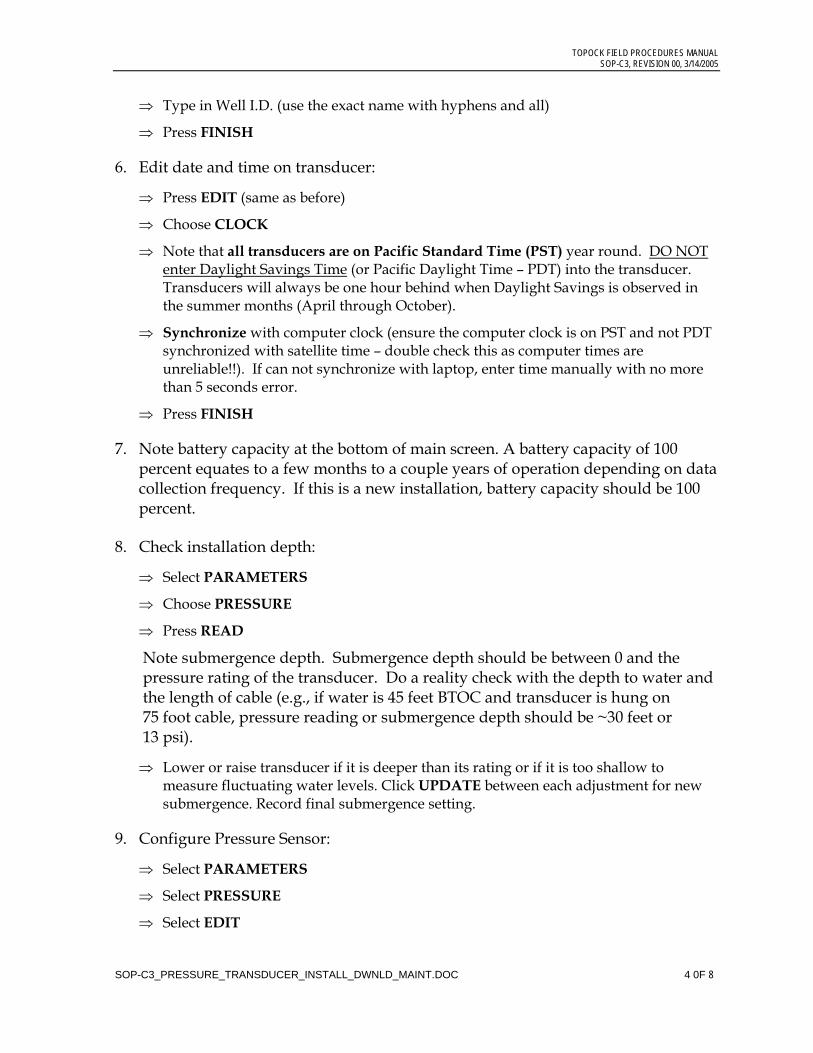
TOPOCK FIELD PROCEDURES MANUAL SOP-C3, REVISION 00, 3/14/2005
SOP-C3_PRESSURE_TRANSDUCER_INSTALL_DWNLD_MAINT.DOC 4 0F 8
⇒ Type in Well I.D. (use the exact name with hyphens and all)
⇒ Press FINISH
6. Edit date and time on transducer:
⇒ Press EDIT (same as before)
⇒ Choose CLOCK
⇒ Note that all transducers are on Pacific Standard Time (PST) year round. DO NOT enter Daylight Savings Time (or Pacific Daylight Time – PDT) into the transducer. Transducers will always be one hour behind when Daylight Savings is observed in the summer months (April through October).
⇒ Synchronize with computer clock (ensure the computer clock is on PST and not PDT synchronized with satellite time – double check this as computer times are unreliable!!). If can not synchronize with laptop, enter time manually with no more than 5 seconds error.
⇒ Press FINISH
7. Note battery capacity at the bottom of main screen. A battery capacity of 100 percent equates to a few months to a couple years of operation depending on data collection frequency. If this is a new installation, battery capacity should be 100 percent.
8. Check installation depth:
⇒ Select PARAMETERS
⇒ Choose PRESSURE
⇒ Press READ
Note submergence depth. Submergence depth should be between 0 and the pressure rating of the transducer. Do a reality check with the depth to water and the length of cable (e.g., if water is 45 feet BTOC and transducer is hung on 75 foot cable, pressure reading or submergence depth should be ~30 feet or 13 psi).
⇒ Lower or raise transducer if it is deeper than its rating or if it is too shallow to measure fluctuating water levels. Click UPDATE between each adjustment for new submergence. Record final submergence setting.
9. Configure Pressure Sensor:
⇒ Select PARAMETERS
⇒ Select PRESSURE
⇒ Select EDIT
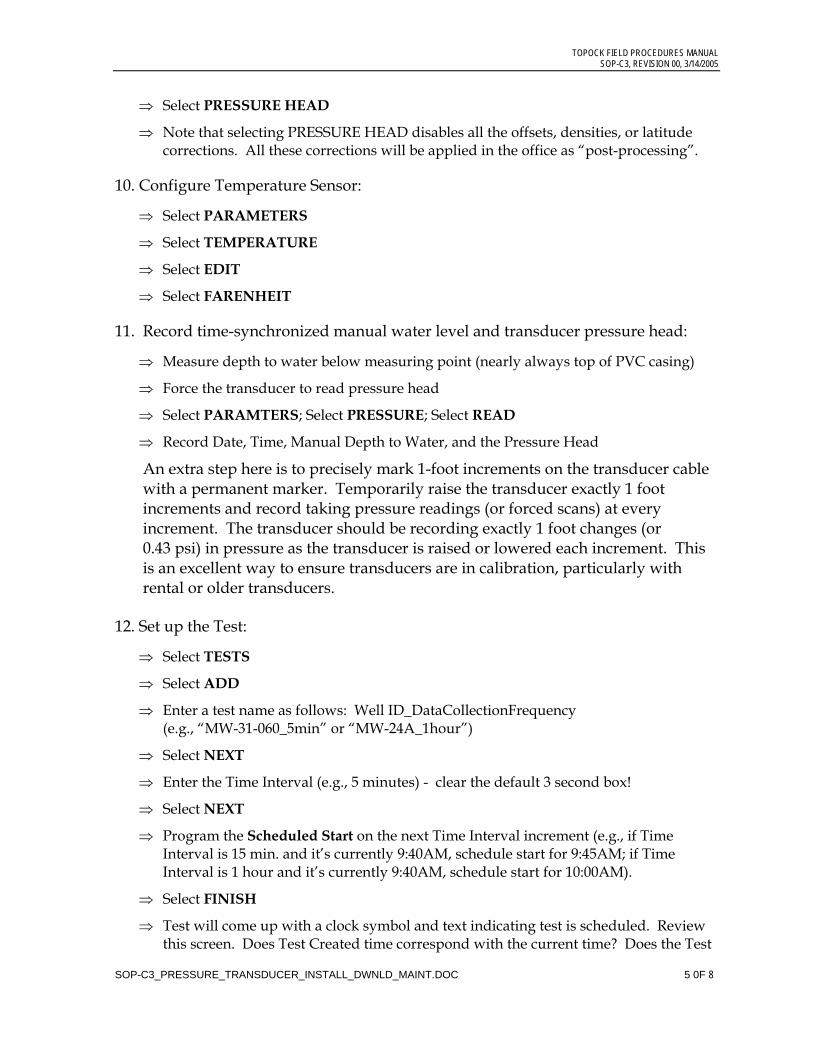
TOPOCK FIELD PROCEDURES MANUAL SOP-C3, REVISION 00, 3/14/2005
SOP-C3_PRESSURE_TRANSDUCER_INSTALL_DWNLD_MAINT.DOC 5 0F 8
⇒ Select PRESSURE HEAD
⇒ Note that selecting PRESSURE HEAD disables all the offsets, densities, or latitude corrections. All these corrections will be applied in the office as “post-processing”.
10. Configure Temperature Sensor:
⇒ Select PARAMETERS
⇒ Select TEMPERATURE
⇒ Select EDIT
⇒ Select FARENHEIT
11. Record time-synchronized manual water level and transducer pressure head:
⇒ Measure depth to water below measuring point (nearly always top of PVC casing)
⇒ Force the transducer to read pressure head
⇒ Select PARAMTERS; Select PRESSURE; Select READ
⇒ Record Date, Time, Manual Depth to Water, and the Pressure Head
An extra step here is to precisely mark 1-foot increments on the transducer cable with a permanent marker. Temporarily raise the transducer exactly 1 foot increments and record taking pressure readings (or forced scans) at every increment. The transducer should be recording exactly 1 foot changes (or 0.43 psi) in pressure as the transducer is raised or lowered each increment. This is an excellent way to ensure transducers are in calibration, particularly with rental or older transducers.
12. Set up the Test:
⇒ Select TESTS
⇒ Select ADD
⇒ Enter a test name as follows: Well ID_DataCollectionFrequency (e.g., “MW-31-060_5min” or “MW-24A_1hour”)
⇒ Select NEXT
⇒ Enter the Time Interval (e.g., 5 minutes) - clear the default 3 second box!
⇒ Select NEXT
⇒ Program the Scheduled Start on the next Time Interval increment (e.g., if Time Interval is 15 min. and it’s currently 9:40AM, schedule start for 9:45AM; if Time Interval is 1 hour and it’s currently 9:40AM, schedule start for 10:00AM).
⇒ Select FINISH
⇒ Test will come up with a clock symbol and text indicating test is scheduled. Review this screen. Does Test Created time correspond with the current time? Does the Test
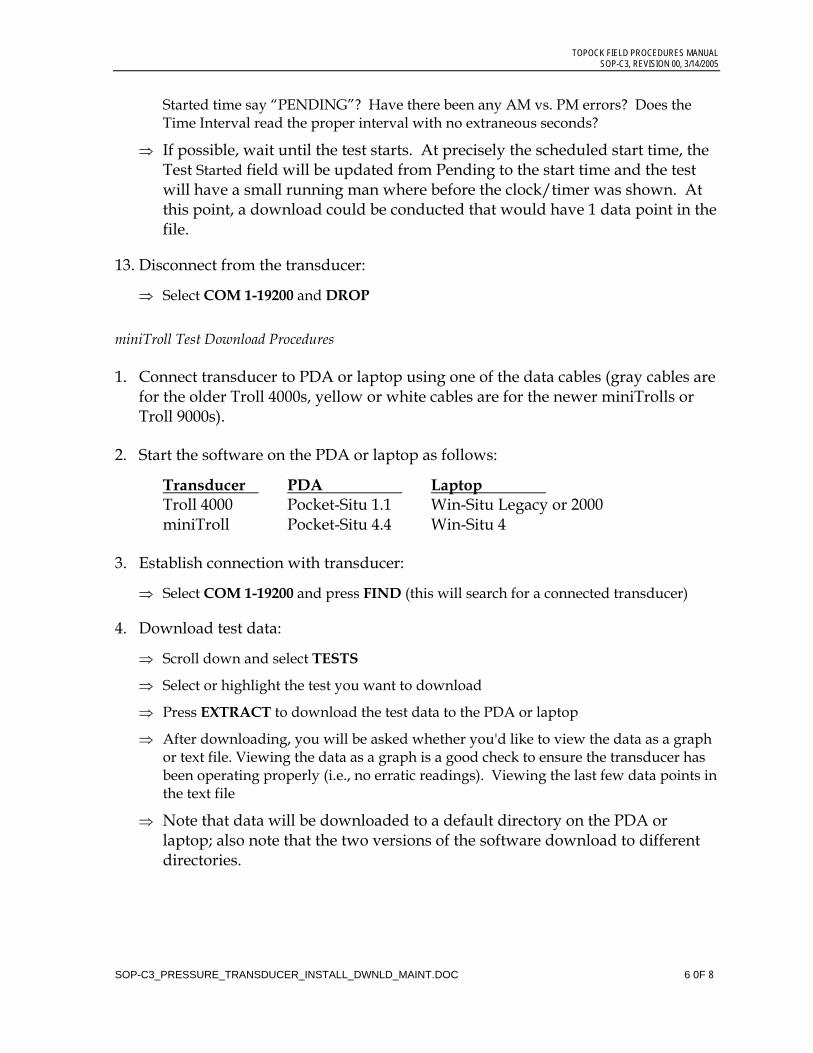
TOPOCK FIELD PROCEDURES MANUAL SOP-C3, REVISION 00, 3/14/2005
SOP-C3_PRESSURE_TRANSDUCER_INSTALL_DWNLD_MAINT.DOC 6 0F 8
Started time say “PENDING”? Have there been any AM vs. PM errors? Does the Time Interval read the proper interval with no extraneous seconds?
⇒ If possible, wait until the test starts. At precisely the scheduled start time, the Test Started field will be updated from Pending to the start time and the test will have a small running man where before the clock/timer was shown. At this point, a download could be conducted that would have 1 data point in the file.
13. Disconnect from the transducer:
⇒ Select COM 1-19200 and DROP
miniTroll Test Download Procedures
1. Connect transducer to PDA or laptop using one of the data cables (gray cables are for the older Troll 4000s, yellow or white cables are for the newer miniTrolls or Troll 9000s).
2. Start the software on the PDA or laptop as follows:
Transducer PDA Laptop Troll 4000 Pocket-Situ 1.1 Win-Situ Legacy or 2000 miniTroll Pocket-Situ 4.4 Win-Situ 4
3. Establish connection with transducer:
⇒ Select COM 1-19200 and press FIND (this will search for a connected transducer)
4. Download test data:
⇒ Scroll down and select TESTS
⇒ Select or highlight the test you want to download
⇒ Press EXTRACT to download the test data to the PDA or laptop
⇒ After downloading, you will be asked whether you'd like to view the data as a graph or text file. Viewing the data as a graph is a good check to ensure the transducer has been operating properly (i.e., no erratic readings). Viewing the last few data points in the text file
⇒ Note that data will be downloaded to a default directory on the PDA or laptop; also note that the two versions of the software download to different directories.
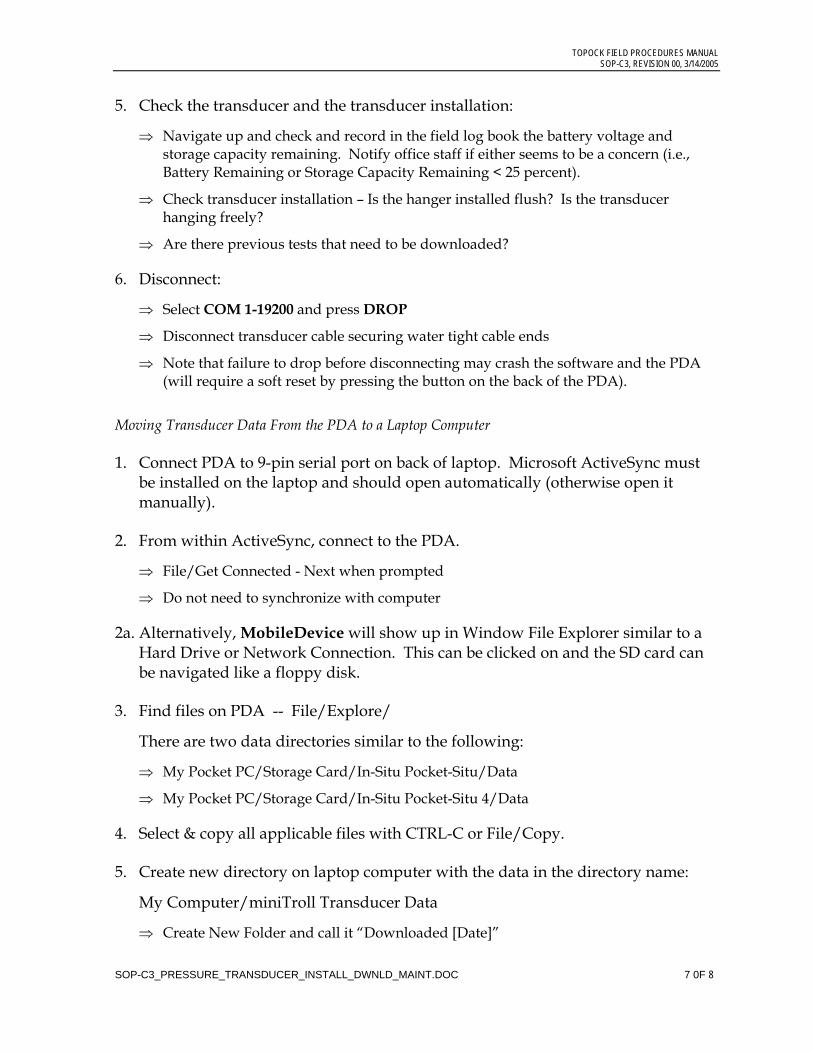
TOPOCK FIELD PROCEDURES MANUAL SOP-C3, REVISION 00, 3/14/2005
SOP-C3_PRESSURE_TRANSDUCER_INSTALL_DWNLD_MAINT.DOC 7 0F 8
5. Check the transducer and the transducer installation:
⇒ Navigate up and check and record in the field log book the battery voltage and storage capacity remaining. Notify office staff if either seems to be a concern (i.e., Battery Remaining or Storage Capacity Remaining < 25 percent).
⇒ Check transducer installation – Is the hanger installed flush? Is the transducer hanging freely?
⇒ Are there previous tests that need to be downloaded?
6. Disconnect:
⇒ Select COM 1-19200 and press DROP
⇒ Disconnect transducer cable securing water tight cable ends
⇒ Note that failure to drop before disconnecting may crash the software and the PDA (will require a soft reset by pressing the button on the back of the PDA).
Moving Transducer Data From the PDA to a Laptop Computer
1. Connect PDA to 9-pin serial port on back of laptop. Microsoft ActiveSync must be installed on the laptop and should open automatically (otherwise open it manually).
2. From within ActiveSync, connect to the PDA.
⇒ File/Get Connected - Next when prompted
⇒ Do not need to synchronize with computer
2a. Alternatively, MobileDevice will show up in Window File Explorer similar to a Hard Drive or Network Connection. This can be clicked on and the SD card can be navigated like a floppy disk.
3. Find files on PDA -- File/Explore/
There are two data directories similar to the following:
⇒ My Pocket PC/Storage Card/In-Situ Pocket-Situ/Data
⇒ My Pocket PC/Storage Card/In-Situ Pocket-Situ 4/Data
4. Select & copy all applicable files with CTRL-C or File/Copy.
5. Create new directory on laptop computer with the data in the directory name:
My Computer/miniTroll Transducer Data
⇒ Create New Folder and call it “Downloaded [Date]”
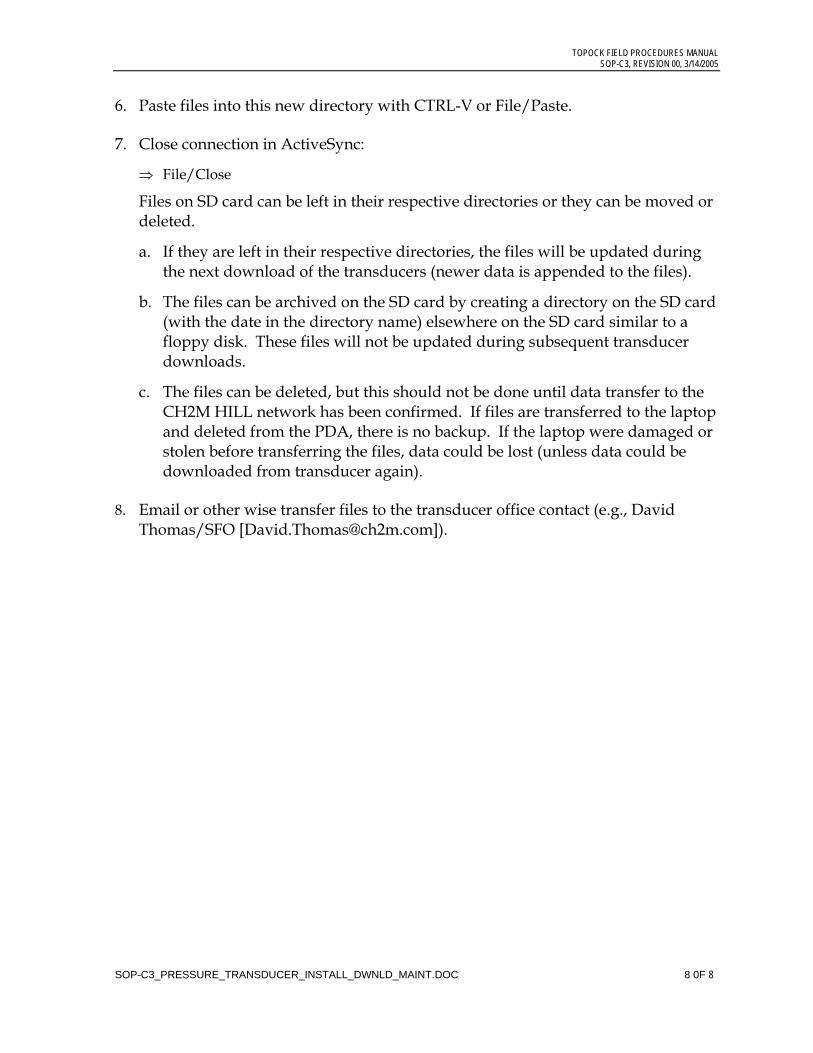
TOPOCK FIELD PROCEDURES MANUAL SOP-C3, REVISION 00, 3/14/2005
SOP-C3_PRESSURE_TRANSDUCER_INSTALL_DWNLD_MAINT.DOC 8 0F 8
6. Paste files into this new directory with CTRL-V or File/Paste.
7. Close connection in ActiveSync:
⇒ File/Close
Files on SD card can be left in their respective directories or they can be moved or deleted.
a. If they are left in their respective directories, the files will be updated during the next download of the transducers (newer data is appended to the files).
b. The files can be archived on the SD card by creating a directory on the SD card (with the date in the directory name) elsewhere on the SD card similar to a floppy disk. These files will not be updated during subsequent transducer downloads.
c. The files can be deleted, but this should not be done until data transfer to the CH2M HILL network has been confirmed. If files are transferred to the laptop and deleted from the PDA, there is no backup. If the laptop were damaged or stolen before transferring the files, data could be lost (unless data could be downloaded from transducer again).
8. Email or other wise transfer files to the transducer office contact (e.g., David Thomas/SFO [[email protected]]).
TOPOCK FIELD PROCEDURES MANUAL SOP-C4, REVISION 0, 3/20/2005
SOP-C4_TRANSDUCER_UPLOAD.DOC 1 OF 2
SOP-C4
Pressure Transducer Upload to Topock DB Standard Operating Procedures for PG&E Topock Program
This standard operating procedure (SOP) details field instructions for uploading pressure transducer data to the PG&E Topock site database.
PROCEDURE
Data Transfer and Upload Data files are transferred from the field as binary (bin) files that are in an In-Situ proprietary format. The files must be opened using the In-Situ software. The recommended software is Data Manager 2000, which is included in Win-Situ 2000 or Legacy installation. Win-Situ 4 is the most recent software and may also be used. Different versions of the Win-Situ software may cause problems as different versions will format the Date and Time in columns 1 and 2 (default for uploads is separate columns).
1. Open each bin file in Data Manager. The bin files are named as follows: e.g., SN065420 20040205 141118 MW-15_1_min.bin - where the transducer serial number is 065420 - the test was started on 2004-02-05 at 14:11:18 - the test name is MW-15_1_min - Note that the bin file name should contain the well name, and within the header section of the bin file, the transducer s should be named and the test name will be repeated)
2. Export each bin file as a text file with the well name as the file name; save the files in the same directory as the bin files. e.g., SN065420 20040205 141118 MW-15_1_min.bin --> MW-15.txt
3. Once all bin files have been converted to txt files, the files, when viewed from a text editor or File Explorer, will sort in alpha-numeric order. The files should then be imported into the database in this order to ensure all files are imported and to assist in making sure there are no duplicates, misnaming, missed files, etc.
4. Open the first file in a text editor. The first dozen or so lines are header lines that should be noted. The header lines identify the transducer name (should be the well or LocID), the test name (which should also include the LocID), the test description including the interval and measurement method (i.e., Pressure Head, Depth, or Reference Elevation). Make sure of the following:
• the same LocID should exist in the Filename, Transducer Name, Test Name

TOPOCK FIELD PROCEDURES MANUAL SOP-C4, REVISION 0, 3/20/2005
SOP-C4_TRANSDUCER_UPLOAD.DOC 2 OF 2
• the test should be set up as a Pressure Head or Depth with no elevation, salinity, or latitude offsets/adjustments
• if possible, check that the download time is consistent with the last data point downloaded (note that this often does not get recorded correctly in the file if the PDA was used for the download)
5. Select all the numeric data (excluding header lines) and copy to the clipboard (CTRL-C).
6. OPEN the Topock Transducer frontend database, OPEN table tblPT_Temp (should be empty), SELECT the entire row, PASTE (CTRL-V) the data.
7. OPEN the Transducer Control Form (frmTransducerCalibrationSummary); in the Data Upload section and do the following:
• ENTER the LocID for the transducer
• SELECT PST (Pacific Standard Time) or PDT (Pacific Daylight Time) - transducer data should always be PST unless there was a programming error
• SELECT PSI or FEET (note that this is shown in the header lines of the txt file)
• enter a comment that should, as a minimum, include the date of the bin file download, the LocID, and the test frequency. Whether the upload is PST/PDT and PSI/FEET can also be included in the comment. e.g., - bin:04/05/04_MW-15_1min; uploaded as PST/FEET (if problems arrise following upload, it is the unique comment field that can be used to purge bad data or apply corrections if, for example, the data is inadvertently uploaded as PSI or as the wrong LocID)
8. With the data in tblPT_Temp and the fields filled out in the Data Upload section, PRESS the Upload Temp Transducer Data. This will transfer the data from the temporary table to the table tblPT while appending LocID, Comments, and making unit conversions and time shifts to PDT or PST as necessary.
9. As the upload process continues, you will be prompted to confirm the appending of records to tblPT – SELECT “Yes” unless you have made a mistake (this may be your only chance to stop the upload). If some of the records already exist in tblPT (i.e., were uploaded during a previous upload session), a 2nd prompt box will come up telling you some records won’t be uploaded due to primary key violations (the database will not let records with duplicate LocID, Date & Time be uploaded to tblPT). If it makes sense that records are duplicates, proceed with the upload. This can not be undone without writing queries, etc.
10. Delete all records from the tblPT_temp. Close the text file. Repeat process for next well.
TOPOCK FIELD PROCEDURE MANUAL SOP C5, REVISION 0, 3/31/05
SOP-C5_SPINNER LOGGING (LT).DOC 1 OF 3
SOP-C5
Spinner Logging Standard Operating Procedures, PG&E Topock Project
This standard operating procedure (SOP) details field instructions for performing dynamic spinner (or flowmeter) logging on extraction and injection wells located on the East Mesa at the PG&E Topock site. Spinner logging is one of a family of geophysical logs which measure the flow of fluids in a borehole. The family consists primarily of: the tracer survey, the thermal flowmeter, the heat pulse flowmeter, and the impeller flowmeter (the spinner logging tool). This SOP concentrates on logging using the impeller flowmeter.
REQUIRED DOCUMENTS
• Event-specific sampling and analysis plan (SAP), work plan, or field instructions.
• Applicable project work plan. Refer to Topock Program Sampling, Analysis, and Field Procedures Manual and QAPP (Procedures Manual), as required.
• Topock Program Health and Safety Plan (HSP).
• Detailed well construction diagram including a list of all down-hole components (such as access tubes and pumps) and their depths.
• Previous sampling, drilling, and well construction logs, and aquifer testing results from other boreholes or wells in the vicinity, if available.
• Field data sheets set up to record static water level, time, elapsed time, instantaneous pumping rate, and totalizer readings. Depending on access, water level data may also be collected.
• Field notebook.
EQUIPMENT LIST
• Pressure transducers with on-board dataloggers (mini-Troll).
• Aboveground or submersible pump controller, with all required pipe, hose, fittings, and filters (if necessary).
• Water-level meter.
• Adequate and appropriate storage containers for discharged groundwater.
• Laptop or field computer with datalogger software.
• Calculator and stopwatch.
GENERAL GUIDELINES
TOPOCK FIELD PROCEDURE MANUAL SOP-C5, REVISION 0, 3/31/05
SOP-C5_SPINNER LOGGING (LT).DOC 2 OF 3
The purpose of dynamic spinner logging is to characterize the hydraulic contribution to overall discharge from the well in discrete zones. Following are some basic guidelines to successfully performing dynamic spinner logging.
• The spinner flowmeter logs is always conducted by a geophysical logging specialist.
• Flowmeter equipment will be Atlas, Halliburton, Schlumberger, Welenco, or equal subject to approval by CH2M HILL.
• Logs should be provided on 2 vertical scales: 50-feet to 1-inch and 20-feet to 1-inch. The horizontal scale shall be approved by the CH2M HILL representative. All data should be recorded digitally.
• Spinner logging operations are conducted while the well is pumping at its typical discharge rate.
PROCEDURE
1) The well(s) should be modified (as necessary) to accommodate installation of a spinner-flowmeter logging access tube. Work associated with this may be as minimal as moving the pump to one side of the well casing and installing an access tube along-side, or could include removal of the permanent pump and installation of a temporary test pump and access tubing. If a temporary test pump is required, this pump could be plumbed into the existing distribution system in order to minimize service interruptions.
2) The spinner flowmeter logs may be obtained during the final phase of a constant-rate test or separately under design pumping conditions. The surveys should take place to the total depth of the well. Both continuous traverse and stationary flowmeter logs should be obtained. Three downward continuous traverse logs should be made at different line speeds. The line speeds will be selected by a CH2M HILL representative but will most likely be 30 feet per minute, 60 feet per minute, and 90 feet per minute. Stop counts may be requested by the CH2M HILL Field Manager.
3) The spinner tool will be of the type utilizing a magnetorestrictive counter or other nonmechanical device to sense rotation. The tool shall be capable of sensing flow rates between 0.25 feet per second to 10 feet per second in an 18-inch straight pipe. Time-drive recording shall be provided for stationary mode operations. To the degree practicable, the flowmeter too shall be centralized in the casing and well screen during all operations.
4) Dynamic spinner logging s best performed while the well is pumping at its typical discharge rate and frequency. Water levels in nearby wells should be monitored during the spinner-flowmeter logging to determine if water levels near the pumping well change due to this testing and to gain additional aquifer property data. However, this test assumes that the well pumps continuously for a period of time sufficient for collection of all the data. If the current well pumps in frequent on/off cycles, it may be necessary to bypass the existing distribution system, and discharge the well water to another location in order to pump the well continuously for the required amount of time.
5) The spinner logging equipment shall be equipped with a line speed indicator capable of indicating variations in line speed of 10 percent. Variations in speed beyond 10 percent will invalidate the test.
TOPOCK FIELD PROCEDURE MANUAL SOP-C5, REVISION 0, 3/31/05
SOP-C5_SPINNER LOGGING (LT).DOC 3 OF 3
DELIVERABLES
Spinner logs should be run in the presence of a CH2M HILL representative and the results, including three field copies of each log, provided to a CH2M HILL representative immediately after completion. The logs become the property of CH2M HILL at the time the logging is completed. In addition to the three field copies, the logging specialist shall submit the following:
1) Five final copies of each geophysical log. 2) Digital ASCII files of all geophysical data on a compact disk. 3) Digital PDF files of all geophysical data on compact disk.
Upon receiving copies of the geophysical logs, the CH2M HILL representative in the field should distribute copies of the logs to the appropriate senior level staff in the office and field. They should also be reviewed by the driller (in the case of drilling operations) and in the presence of the logging specialist contracted to perform the logging.
REFERENCES
The following are useful technical references:
Driscoll, F.G. 1995. Groundwater and Wells. Second Edition. St. Paul, MN: Johnson Screens.
Keyes, Scott W. 1989. Borehole Geophysics Applied to Groundwater Investigations. National Water Well Association.
Welenco Inc. 1996. Water and Environmental Geophysical Well Logs. Welenco, Inc., 8th Edition

TOPOCK FIELD PROCEDURE MANUAL SOP C6, REVISION 0, 3/31/05
SOP-C6_AQUIFER_STEP_TEST (LT).DOC 1 OF 4
SOP-C6
Aquifer and Step Testing Standard Operating Procedures for PG&E Topock Program
This standard operating procedure (SOP) details field instructions for conducting constant rate aquifer tests, variable rate or step tests, and constant rate injection tests in the East Mesa injection wells at the PG&E Topock site.
REQUIRED DOCUMENTS
• Event-specific sampling and analysis plan (SAP), work plan, or field instructions.
• Applicable project work plan. Refer to Topock Program Sampling, Analysis, and Field Procedures Manual and QAPP (Procedures Manual), as required.
• Topock Program Health and Safety Plan (HSP).
• Detailed well construction diagram including a list of all down-hole components (such as access tubes and pumps) and their depths.
• Previous sampling, drilling, and well construction logs, and aquifer testing results from other boreholes or wells in the vicinity, if available.
• Field data sheets set up to record static water level, time, elapsed time, instantaneous pumping rate, totalizer readings, pumping water level, sand content, and specific capacity.
• Blank sampling log and field notebook.
EQUIPMENT LIST
• Above-ground or submersible pump and controller, with all required pipe, hose, fittings, and filters (if necessary).
• Pressure transducers with on-board dataloggers (mini-Troll).
• Water-level meter.
• Adequate and appropriate storage containers for discharged groundwater.
• Lap-top or field computer with datalogger software.
• Calculator and stopwatch.
GENERAL GUIDELINES
Background Water Level Measurements
Prior to conducting aquifer and/or step testing activities, it is necessary to understand hydrologic influences in the area that may affect results. Collection of background water level data from nearby monitoring wells will record any external influences that may affect
TOPOCK FIELD PROCEDURE MANUAL SOP-C6, REVISION 0, 3/31/05
SOP-C6_AQUIFER_STEP_TEST (LT).DOC 2 OF 4
test results, namely interference effects of nearby wells and atmospheric pressure changes. At a minimum, 24 hours of background water level data should be collected prior to initiating the aquifer or step rate tests. Background water level data should be reviewed before testing and all pertinent information related to water level fluctuations should be noted.
Sand
A Rossum sand tester should be used to monitor sand production while pumping from the injection wells. Sand production should be noted and recorded frequently and, in particular, following increases in pumping rate.
Pump Discharge Measurements
Variations in pump speed are a major cause of erratic drawdown data. During aquifer and step test operations the discharge rate shall be maintained within 2 percent of the desired rate. Regular monitoring to ensure pumping rate consistency should be conducted using a flow meter installed on the discharge pipe. The flow meter must be capable of providing instantaneous and cumulative flow measurements. To guarantee accurate measurements, the discharge pipe must be level for a distance of ten-pipe diameters upstream of the flow meter and five pipe diameters downstream of the flow meter. Any adjustments to the pumping rate should be made through a gate valve installed on the discharge piping. The gate valve should be installed downstream of the flow meter and be maintained from one-half to three-fourths open while pumping at the desired rate. Flow rates as well as pump performance may vary as tanks fill up or become empty. These changes in flow rates should either be noted in the field log book or valves adjusted to keep flow rates constant (refer to event specific field instructions or work plan).
Water Levels
During testing, water levels will be measured in the injection and nearby observation wells at regular frequencies with water level indicators. All measurements will be taken to top of casing (TOC). Submersible pressure transducers with on-board dataloggers will be installed in all nearby observation wells and programmed to record at a maximum of 15-minute intervals during testing. Transducers will also be installed in the injection wells and programmed to record at a maximum of 2-minute intervals during testing.
PROCEDURE
Variable Rate or Step Testing
1) The purpose of the step test is to evaluate overall well performance, optimum pumping rate and pump-setting depth, the maximum anticipated drawdown, the volume of water produced at specific engine speeds and drawdown, and determine a suitable pumping rate for constant rate testing. Typical step tests consist of pumping the well at up to four successively higher pumping steps lasting up to two hours each. Restrictions on where water may be discharged at the Topock site require shorter (about 30-minute) steps. Actual pumping rates will be established after evaluating yield and drawdown data obtained during development. The following step test is recommended:
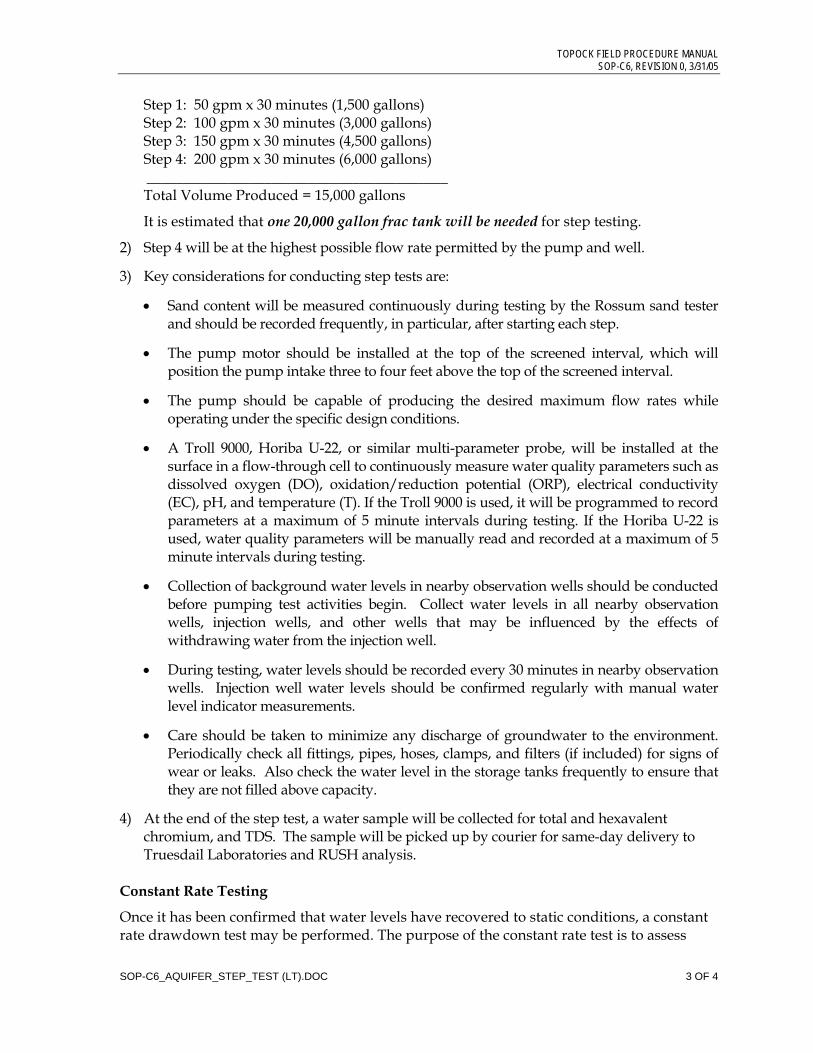
TOPOCK FIELD PROCEDURE MANUAL SOP-C6, REVISION 0, 3/31/05
SOP-C6_AQUIFER_STEP_TEST (LT).DOC 3 OF 4
Step 1: 50 gpm x 30 minutes (1,500 gallons) Step 2: 100 gpm x 30 minutes (3,000 gallons) Step 3: 150 gpm x 30 minutes (4,500 gallons) Step 4: 200 gpm x 30 minutes (6,000 gallons) _________________________________________ Total Volume Produced = 15,000 gallons
It is estimated that one 20,000 gallon frac tank will be needed for step testing.
2) Step 4 will be at the highest possible flow rate permitted by the pump and well.
3) Key considerations for conducting step tests are:
• Sand content will be measured continuously during testing by the Rossum sand tester and should be recorded frequently, in particular, after starting each step.
• The pump motor should be installed at the top of the screened interval, which will position the pump intake three to four feet above the top of the screened interval.
• The pump should be capable of producing the desired maximum flow rates while operating under the specific design conditions.
• A Troll 9000, Horiba U-22, or similar multi-parameter probe, will be installed at the surface in a flow-through cell to continuously measure water quality parameters such as dissolved oxygen (DO), oxidation/reduction potential (ORP), electrical conductivity (EC), pH, and temperature (T). If the Troll 9000 is used, it will be programmed to record parameters at a maximum of 5 minute intervals during testing. If the Horiba U-22 is used, water quality parameters will be manually read and recorded at a maximum of 5 minute intervals during testing.
• Collection of background water levels in nearby observation wells should be conducted before pumping test activities begin. Collect water levels in all nearby observation wells, injection wells, and other wells that may be influenced by the effects of withdrawing water from the injection well.
• During testing, water levels should be recorded every 30 minutes in nearby observation wells. Injection well water levels should be confirmed regularly with manual water level indicator measurements.
• Care should be taken to minimize any discharge of groundwater to the environment. Periodically check all fittings, pipes, hoses, clamps, and filters (if included) for signs of wear or leaks. Also check the water level in the storage tanks frequently to ensure that they are not filled above capacity.
4) At the end of the step test, a water sample will be collected for total and hexavalent chromium, and TDS. The sample will be picked up by courier for same-day delivery to Truesdail Laboratories and RUSH analysis.
Constant Rate Testing
Once it has been confirmed that water levels have recovered to static conditions, a constant rate drawdown test may be performed. The purpose of the constant rate test is to assess

TOPOCK FIELD PROCEDURE MANUAL SOP-C6, REVISION 0, 3/31/05
SOP-C6_AQUIFER_STEP_TEST (LT).DOC 4 OF 4
aquifer properties such as transmissivity, hydraulic conductivity, and storativity. Constant-rate tests are conducted by pumping the well at a single rate for an extended period of time (usually 24 hours). Restrictions on groundwater discharge and space for storage tanks at the Topock field site will be the limiting factor in determining the test length. The pumping rate during testing will be determined based on results of step testing. The same guidelines and key considerations for the step test apply for the constant rate test.
REFERENCES
The following are useful technical references:
Driscoll, F.G. 1995. Groundwater and Wells. Second Edition. St. Paul, MN: Johnson Screens.
Lohman S.W. 1972. Ground-Water Hydraulics. U.S. Geological Survey Professional Paper 708
Kruseman, G.P. and N.A. de Ridder. 1994. Analysis and Evaluation of Pumping Test Data. ILRI Publication 47, Second Edition
Roscoe Moss Company. 1990. Handbook of Groundwater Development. John Wiley & Sons

SFO\FIELDPROCEDURES_REVISION1.DOC
Appendix D Quality Assurance Project Plan
A p p e n d i x D
Quality Assurance Project Plan for
Water Quality Sampling and Analysis
PG&E Topock Program Procedures Manual PG&E Topock Compressor Station
Needles, California
Prepared for
Pacific Gas and Electric Company
Revision 02 March 31, 2005
Prepared by
155 Grand, Suite 1000 Oakland, CA 94604-2681
SFO\PGE_TOPOCK_QAPP_REV02_MAR-31-05.DOC iii
Contents
Page
Acronyms and Abbreviations .........................................................................................................vi
1.0 Introduction.........................................................................................................................1-1 1.1 QAPP Objectives.....................................................................................................1-1
2.0 Project Organization and Responsibility ......................................................................2-1 2.1 Project/Task Organization....................................................................................2-1 2.2 Certification Requirements ...................................................................................2-1
3.0 Sampling Design and Quality Control ..........................................................................3-1 3.1 Sampling Design.....................................................................................................3-1 3.2 Field Quality Control Samples .............................................................................3-1
3.2.1 Field Duplicate Samples ...........................................................................3-1 3.2.2 Equipment Blanks .....................................................................................3-2 3.2.3 Trip Blanks .................................................................................................3-2 3.2.4 Matrix Spike/Matrix Spike Duplicate ....................................................3-2 3.2.5 Split Samples..............................................................................................3-2
4.0 Sample Handling and Custody........................................................................................4-1 4.1 Containers and Preservatives ...............................................................................4-1
4.1.1 Filtration and Preservation of Samples for Metals Analysis ...............4-3 4.2 Chain of Custody....................................................................................................4-3
4.2.1 Laboratory Responsibilities .....................................................................4-4 4.3 Sample Packaging and Transport ........................................................................4-5
4.3.1 Sample Container Preparation ................................................................4-5 4.3.2 Shipping Cooler Preparation ...................................................................4-5 4.3.3 Placing Samples in the Cooler .................................................................4-6 4.3.4 Closing the Cooler.....................................................................................4-6 4.3.5 Transport ....................................................................................................4-6
5.0 Data Quality Objectives and Quality Assurance Program.........................................5-1 5.1 Precision, Accuracy, Representativeness, Completeness, and
Comparability .........................................................................................................5-1 5.1.1 Precision......................................................................................................5-1 5.1.2 Accuracy .....................................................................................................5-1 5.1.3 Representativeness....................................................................................5-1 5.1.4 Completeness .............................................................................................5-2 5.1.5 Comparability ............................................................................................5-2
5.2 Method Detection Limits, Reporting Limits, and Instrument Calibration Requirements ..........................................................................................................5-2 5.2.1 Method Detection Limits..........................................................................5-2 5.2.2 Reporting Limits........................................................................................5-3 5.2.3 Instrument Calibration .............................................................................5-3

TOPOCK FIELD PROCEDURES MANUAL APPENDIX D: QAPP, REVISION 02, 3/31/2005 CONTENTS
SFO\PGE_TOPOCK_QAPP_REV02_MAR-31-05.DOC) iv
5.3 Elements of Quality Control .................................................................................5-8 5.3.1 Method Blank.............................................................................................5-8 5.3.2 Laboratory Control Sample......................................................................5-8 5.3.3 Matrix Spike/Matrix Spike Duplicate ....................................................5-9 5.3.4 Laboratory Sample Duplicate..................................................................5-9 5.3.5 Interference Check Samples.....................................................................5-9 5.3.6 Retention Time Windows.......................................................................5-10 5.3.7 Equipment Blank.....................................................................................5-10 5.3.8 Field Duplicates .......................................................................................5-10
5.4 Additional Quality Control Requirements .......................................................5-10 5.4.1 Holding Time...........................................................................................5-10 5.4.2 Standard Materials and Other Supplies and Consumables ..............5-11 5.4.3 Manual Integration..................................................................................5-11 5.4.4 Confirmation of Perchlorate Results.....................................................5-11 5.4.5 Laboratory Quality Assurance Program..............................................5-11
5.5 Reporting Limits and Analytical Requirements ..............................................5-12
6.0 Calibration Procedures and Frequency ..........................................................................6-1 6.1 Field Calibration Procedures ................................................................................6-1 6.2 Laboratory Calibration Procedures .....................................................................6-1
7.0 Analytical Procedures........................................................................................................7-1
8.0 Data Reduction, Validation, and Reporting..................................................................8-1 8.1 Laboratory Data Management..............................................................................8-1 8.2 Data Validation.......................................................................................................8-8
9.0 Performance Evaluations ..................................................................................................9-1 9.1 Technical Systems Audits .....................................................................................9-1
9.1.1 Laboratory Audits .....................................................................................9-1 9.1.2 Field Audits................................................................................................9-2
9.2 Performance Audits ...............................................................................................9-2 9.2.1 Performance Evaluations .........................................................................9-2 9.2.2 External Audits ..........................................................................................9-2 9.2.3 Internal Audits...........................................................................................9-3
10.0 Preventive Maintenance..................................................................................................10-1 10.1 Maintenance Responsibilities .............................................................................10-1 10.2 Maintenance Schedules .......................................................................................10-2 10.3 Spare Parts.............................................................................................................10-2
11.0 Corrective Action..............................................................................................................11-1
12.0 Quality Assurance Reports .............................................................................................12-1
13.0 References ..........................................................................................................................13-1
TOPOCK FIELD PROCEDURES MANUAL APPENDIX D: QAPP, REVISION 02, 3/31/2005 CONTENTS
SFO\PGE_TOPOCK_QAPP_REV02_MAR-31-05.DOC) v
Tables 2-1 Project Staff...........................................................................................................................2-1
4-1 Sample Containers, Preservation, and Holding Times ..................................................4-1
5-1 Reporting Limit Objectives for Metals .............................................................................5-4 5-2 Reporting Limit Objectives for General Chemistry and Other Parameters ................5-5 5-3 Reporting Limit Objectives for PCBs by SW8082 ...........................................................5-6 5-4 Reporting Limit Objectives for Volatile Organic Compounds by SW8260B...............5-6 5-5 Reporting Limit Objectives for Semi-volatile Organic Compounds by SW8270C.....5-7 5-6 Accuracy and Precision Limits for ICP/ICP-MS Metals .............................................5-13 5-7 Accuracy and Precision Limits for General Chemistry and Other Analyses............5-14 5-8 Accuracy and Precision Limits for SW7000 Series........................................................5-15 5-9 Accuracy and Precision Limits for PCBs by SW8082 ...................................................5-15 5-10 Accuracy and Precision Limits for Volatile Organic Compounds by SW8260B ......5-16 5-11 Accuracy and Precision Limits for Semi-volatile Organic Compounds by
SW8270C.............................................................................................................................5-18 5-12 Calibration and QC Requirements for SW6020/EPA200.8 .........................................5-20 5-13 Calibration and QC Requirements for SW7000 Series/EPA 245.1.............................5-21 5-14 Calibration and QC Requirements for General Chemistry and Other Parameters .5-22 5-15 Calibration and QC Requirements for SW7199/EPA218.6 .........................................5-23 5-16 Calibration and QC Requirements for Stable Isotopes (18O and Deuterium) ...........5-24 5-17 Calibration and QC Requirements for SW8081A and SW8082...................................5-25 5-18 Calibration and QC Requirements for SW8260B ..........................................................5-26 5-19 Calibration and QC Requirements for SW8270C..........................................................5-27
7-1 Extraction and Digestion Methods ...................................................................................7-1
8-1 Data Guidelines for Electronic Deliverables....................................................................8-4 8-2 Flagging Conventions–Minimum Data Evaluation Criteria for Inorganic Methods.8-9 8-3 Flagging Conventions for Organic Methods .................................................................8-12 8-4 Qualifier Flag Definitions.................................................................................................8-15
SFO\PGE_TOPOCK_QAPP_REV02_MAR-31-05.DOC vi
Acronyms and Abbreviations
ASTM American Society for Testing and Materials
BFB bromofluorobenzene
CAS Chemical Abstracts Service CCB continuing calibration blank CCC calibration check compound CERCLA Comprehensive Environmental Response, Compensation, and Liability Act CF-IRMS continuous flow isotope ratio mass spectrometry COC chain of custody
DQO data quality objective DTSC Department of Toxic Substances Control
EDD electronic data deliverable EICP extracted ion current profile ELAP DTSC’s Environmental Laboratory Accreditation Program EPA U.S. Environmental Protection Agency ERPIMS the U.S. Air Force system for validation and management of data from
environmental projects at all Air Force bases
FSP Field Sampling Plan
GFAA graphite furnace atomic absorption HPLC high pressure liquid chromatography
IA Investigation Area IC ion chromatography ICB initial calibration blank ICP inductively coupled plasma ICP-MS inductively coupled plasma mass spectrometry ICS interference check standard IPC instrument performance check
LCS laboratory control sample LRB laboratory reagent blank LT lower tolerance
MB method blank MCT matrix conductivity threshold MDL method detection limit mL milliliter MS/MSD matrix spike / matrix spike duplicate MSA method of standard addition
NIST National Institute of Standards and Technology
TOPOCK FIELD PROCEDURES MANUAL APPENDIX D: QAPP, REVISION 02, 3/31/2005 ACRONYMS AND ABBREVIATIONS
SFO\PGE_TOPOCK_QAPP_REV02_MAR-31-05.DOC) vii
PCB polychlorinated biphenyl PCL practical quantitation limit PE performance evaluation PPE personal protective equipment
QA quality assurance QAM Quality Assurance Manual QAO Quality Assurance Officer QAPP Quality Assurance Project Plan QC quality control
%R percent recovery RF response factor RL reporting limit RPD relative percent difference RRF relative response factor RSD relative standard deviation
SAP Sampling and Analysis Plan SOP standard operating procedure SPCC system performance check compound SPLP synthetic precipitation leaching procedure STLC soluble threshold limit concentration
TCLP toxicity characteristic leaching procedure
UT upper tolerance
VOA volatile organic analysis
SFO\PGE_TOPOCK_QAPP_REV02_MAR-31-05.DOC 1-1
1.0 Introduction
This Quality Assurance Project Plan (QAPP) was prepared to present the quality assurance and quality control (QA/QC) requirements for water quality sampling and analysis activities at the Pacific Gas and Electric Company (PG&E) Topock Compressor Station located near Needles, California. The QAPP is an integral part of the project-specific work plan and/or sampling and analysis plan (SAP) that govern water quality sampling and analysis activities for the Topock Program. These plans ensure that data of appropriate quality are collected and meet the project-specific requirements. The QAPP is intended for use by CH2M HILL and its subcontractors who provide services associated with the environmental data collection effort.
1.1 QAPP Objectives The QAPP presents the QA/QC requirements designed to ensure that environmental data collected for the Topock Program are of the appropriate quality to achieve the project objectives defined in project-specific plans. The main body of this Field Procedures Manual describes the background of the site and summarizes data collection projects. Specific protocols for sampling, equipment decontamination, handling of investigation-derived wastes, and field quality control are discussed in Section 4 of this Field Procedures Manual and corresponding Standard Operating Procedures (SOPs) provided in Appendix A. Requirements for laboratory analyses, data handling, and data evaluation and assessment performance evaluations, and corrective actions are specified in the QAPP.
The elements included in this QAPP are consistent with those specified in the U.S. Environmental Protection Agency (EPA) Requirements for Quality Assurance Project Plans, EPA QA/R-5, March 2001. The objectives of the QAPP are as follows:
• Ensure that data collection and measurement procedures are standardized among all participants.
• Monitor the performance of the various measurement systems being used in the program to maintain statistical control and provide rapid feedback, so that corrective measures, if needed, can be taken before data quality is compromised.
• Periodically assess the performance of these measurement systems and their components.
• Verify that reported data are sufficiently complete, comparable, representative, unbiased, and precise, so that they are suitable for their intended use.

SFO\PGE_TOPOCK_QAPP_REV02_MAR-31-05.DOC 2-1
2.0 Project Organization and Responsibility
2.1 Project/Task Organization Project Responsibilities for each of the primary project contacts for water quality monitoring and investigations at the Topock site are listed below in Table 2-1.
TABLE 2-1 Project Staff
Title Name/Address Phone Fax Email
Groundwater Monitoring Program Project Manager (PM)
Paul Bertucci 155 Grand Ave, Suite 1000 Oakland, CA 94612
(510) 587-7629 (510) 622-9629 [email protected]
Interim Measures (IM) #1 PM
Jay Piper 2285 Corporate Circle Henderson, NV 89074
(702) 953-1202 (702) 36-1107 [email protected]
IM #2 PM Matt Johns 9191 S. Jamaica St. Engelwood, CO 80112
(303) 771-0952 (720) 286-9893 [email protected]
Background Study PM
Julie Eakins 155 Grand Ave, Suite 1000 Oakland, CA 94612
(510) 587-7647 (510) 622-9647 [email protected]
Project Chemist Dan Moore 6001 Indian School Rd N.E. Suite 350 Albuquerque, NM 87110
(505) 855-5235
(505) 816-0580 [email protected]
Data Manager Tuesdai Powers 155 Grand Ave, Suite 1000 Oakland, CA 94612
(510) 587-7595 (510) 622-9595 [email protected]
Health and Safety Manager
Rick Cavil 1737 North First Street Suite 300 San Jose, CA 95112
(408) 436-4909 ext. 429
(408) 436-482
2.2 Certification Requirements All laboratories participating in analytical services will be certified under the State of California Department of Toxic Substances Control’s (DTSC’s) Environmental Laboratory Accreditation Program (ELAP). The Laboratory Managers will be responsible for ensuring that all personnel have been properly trained and are qualified to perform their assigned tasks.

SFO\PGE_TOPOCK_QAPP_REV02_MAR-31-05.DOC 3-1
3.0 Sampling Design and Quality Control
3.1 Sampling Design Project specific sampling designs are presented in the following documents:
Groundwater Monitoring Project: Sampling and Analysis Plan, Groundwater and Surface Water Monitoring, PG&E Topock Compressor Station, Needles, California dated July 2004 (CH2M HILL 2004b). This document is currently being revised to incorporate modifications requested by DTSC in its January 25, 2005 letter.
Background Study: The Draft Work Plan for Assessing Background Metals Concentrations in Groundwater, PG&E Topock Compressor Station and Vicinity, Needles California dated June 30, 2004 (CH2M HILL 2004c).
Interim Measures (#1) Project: Phase 2 Monitoring Well Installation Work Plan, PG&E Topock Compressor Station, Needles, California dated January 31, 2005 (CH2M HILL 2005b).
Interim Measures (#2) Project: Draft Interim Measures Workplan, PG&E Topock Compressor Station, Needles, California, dated February 2004 (CH2M HILL 2004d); the Interim Measures Workplan Number 2, Topock Compressor Station, Needles, California and addendum thereto dated March 2004 (CH2M HILL 2004e); and the Batch Treatment Work Plan, Topock Compressor Station, Needles, California dated April 2004 (CH2M HILL 2004f).
The sampling design is a function of the medium sampled, information about the sampling site, the type of data to be collected, and how the data are to be used. The specific protocols for sampling, equipment decontamination, and handling of investigation-derived wastes are discussed in the main body of this Field Procedures Manual and corresponding SOPs in Appendix A.
3.2 Field Quality Control Samples QC samples will be collected to monitor accuracy, precision, and the presence of field con-tamination for analytical methods to be performed in the off-site laboratory. All field QC samples will be sent double-blind to the laboratory along with regular field samples. They will be labeled similar to regular field samples to disguise them. These frequencies may vary according to the project needs, as defined in the project-specific plan. The frequency of collection of the QC samples outlined below are recommended and should be reviewed and updated on a project specific basis tailored to the data quality objectives (DQOs) of the project.
3.2.1 Field Duplicate Samples A field duplicate is an independent sample collected as close as possible to the original sample from the same source under identical conditions, and is used to document sampling and analytical precision. Field duplicates will be collected at a minimum frequency of
TOPOCK FIELD PROCEDURES MANUAL APPENDIX D: QAPP, REVISION 02, 3/31/2005 3.0 SAMPLING DESIGN AND QUALITY CONTROL
SFO\PGE_TOPOCK_QAPP_REV02_MAR-31-05.DOC 3-2
10 percent or one per sampling event, whichever is more frequent, for each matrix and for each type of analysis. The sampling procedures described in Section 3.2 will be followed. The sampling locations for field duplicate samples will be recorded in the field logbook.
3.2.2 Equipment Blanks Equipment rinsate blanks will be collected to evaluate field sampling and decontamination procedures by pouring deionized water over the decontaminated equipment. When portable sampling equipment is used, an equipment rinsate blank will be collected at a frequency of one equipment blank sample per event for each equipment type that is decontaminated by each team. The equipment blanks will be analyzed in the off-site laboratory for the same parameters specified for the corresponding matrix.
3.2.3 Trip Blanks Trip blanks are used to monitor for contamination during sample shipping and handling, and for cross-contamination through VOC migration among the collected samples. They are prepared in the laboratory by pouring ASTM Type II or deionized water into a VOC sample container. They are then sealed, transported to the field, stay sealed while VOC samples are taken, and transported back to the laboratory in the same cooler as the VOC samples. One trip blank should accompany each VOC sample cooler.
3.2.4 Matrix Spike/Matrix Spike Duplicate A matrix spike and matrix spike duplicate (MS/MSD) consist of duplicate field sample aliquots spiked by the laboratory with analytes of concern to evaluate the effects of the matrix on the recoveries of these analytes. The laboratory or the Project Chemist may select the locations to collect MS/MSD samples. The duplicate aliquots for MS/MSD analyses should be collected simultaneously or may be part of the parent sample. MS/MSD samples will be treated in exactly the same manner as the parent sample during storage and shipment. The sampling locations for the MS/MSD will be documented in the field or laboratory logbook.
3.2.5 Split Samples A split sample is a sample that is split from a thoroughly homogenized original sample and is used to document analytical precision. Split samples will be collected for each matrix and for each analytical method, except those for volatiles when project objectives dictate the need. The sampling locations will be recorded in the field logbook. Split samples will be sent to a second certified laboratory, and its results will be compared with those from the primary laboratory.
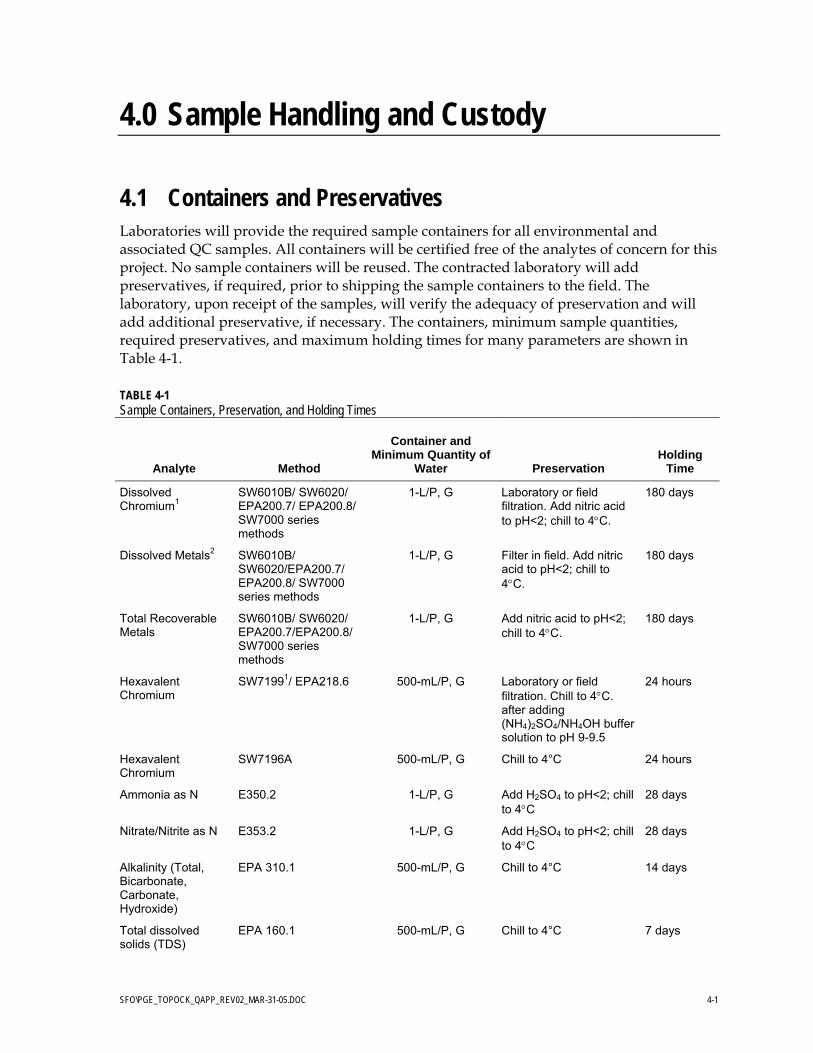
SFO\PGE_TOPOCK_QAPP_REV02_MAR-31-05.DOC 4-1
4.0 Sample Handling and Custody
4.1 Containers and Preservatives Laboratories will provide the required sample containers for all environmental and associated QC samples. All containers will be certified free of the analytes of concern for this project. No sample containers will be reused. The contracted laboratory will add preservatives, if required, prior to shipping the sample containers to the field. The laboratory, upon receipt of the samples, will verify the adequacy of preservation and will add additional preservative, if necessary. The containers, minimum sample quantities, required preservatives, and maximum holding times for many parameters are shown in Table 4-1.
TABLE 4-1 Sample Containers, Preservation, and Holding Times
Analyte Method
Container and Minimum Quantity of
Water Preservation Holding
Time
Dissolved Chromium1
SW6010B/ SW6020/ EPA200.7/ EPA200.8/ SW7000 series methods
1-L/P, G Laboratory or field filtration. Add nitric acid to pH<2; chill to 4°C.
180 days
Dissolved Metals2 SW6010B/ SW6020/EPA200.7/ EPA200.8/ SW7000 series methods
1-L/P, G Filter in field. Add nitric acid to pH<2; chill to 4°C.
180 days
Total Recoverable Metals
SW6010B/ SW6020/ EPA200.7/EPA200.8/ SW7000 series methods
1-L/P, G Add nitric acid to pH<2; chill to 4°C.
180 days
Hexavalent Chromium
SW71991/ EPA218.6 500-mL/P, G Laboratory or field filtration. Chill to 4°C. after adding (NH4)2SO4/NH4OH buffer solution to pH 9-9.5
24 hours
Hexavalent Chromium
SW7196A 500-mL/P, G Chill to 4°C 24 hours
Ammonia as N E350.2 1-L/P, G Add H2SO4 to pH<2; chill to 4°C
28 days
Nitrate/Nitrite as N E353.2 1-L/P, G Add H2SO4 to pH<2; chill to 4°C
28 days
Alkalinity (Total, Bicarbonate, Carbonate, Hydroxide)
EPA 310.1 500-mL/P, G Chill to 4°C 14 days
Total dissolved solids (TDS)
EPA 160.1 500-mL/P, G Chill to 4°C 7 days

TOPOCK FIELD PROCEDURES MANUAL APPENDIX D: QAPP, REVISION 02, 3/31/2005 4.0 SAMPLE HANDLING AND CUSTODY
SFO\PGE_TOPOCK_QAPP_REV02_MAR-31-05.DOC 4-2
TABLE 4-1 Sample Containers, Preservation, and Holding Times
Analyte Method
Container and Minimum Quantity of
Water Preservation Holding
Time
Total suspended solids (TSS)
EPA 160.2 500-mL/P, G Chill to 4°C 7 days
Turbidity (lab/field) EPA 180.1 500-mL/P, G Chill to 4°C 48 hrs
Specific Conductance (lab/field)
EPA 120.1/SW9050 500-mL/P, G Chill to 4°C 28 days
pH (lab/field) EPA 150.1/SW9040 500-mL/P, G Chill to 4°C ASAP
Dissolved organic carbon (DOC)
EPA 415.2 500-mL/P, G or 40-mL VOA
Laboratory or field filtration. Add H2SO4 to pH<2; chill to 4°C
28 days
Total organic carbon (TOC)
EPA 415.2 500-mL/P, G or 40-mL VOA
Add H2SO4 to pH<2; chill to 4°C
28 days
Perchlorate3 EPA 314.0 500-mL/P, G Chill to 4°C 28 days
Sulfide EPA 376.2 500-mL/P, G Add zinc acetate and NaOH to pH>9; chill to 4°C.
7 days
Total Kjeldahl Nitrogen (TKN)
EPA 351.4 500-mL/P, G Add H2SO4 to pH<2; chill to 4°C
28 days
Ferrous Iron (Fe+2) SM3500D 500-mL/P, G Chill to 4°C 24 hours
Dissolved Silica EPA 370.1/2 500-mL/P only Chill to 4°C 28 days 18O and deuterium Laboratory SOP
(continuous flow isotope ratio mass spectrometry [CF-IRMS])
100-mL/P or 40-mL VOA
Chill to 4°C None
Anions SW9056/ EPA300.0/EPA365.2
125-mL/P, G Chill to 4°C Bromide, Chloride, Fluoride, Sulfate, Iodide in 28 days
Nitrate as N and ortho-Phosphate in water 48 hours
Volatile Organic Compounds (VOCs)
SW8260B 3 x 40-mL VOA HCl to pH <2, chill to 4°C 14 days
Semi-Volatile Organic Compounds (SVOCs)
SW8270C 1-L A Chill to 4°C 40 days
Polychlorinated Biphenyls (PCBs)
SW8082 1-L A Chill to 4°C 40 days

TOPOCK FIELD PROCEDURES MANUAL APPENDIX D: QAPP, REVISION 02, 3/31/2005 4.0 SAMPLE HANDLING AND CUSTODY
SFO\PGE_TOPOCK_QAPP_REV02_MAR-31-05.DOC 4-3
TABLE 4-1 Sample Containers, Preservation, and Holding Times
Analyte Method
Container and Minimum Quantity of
Water Preservation Holding
Time
Notes: 1 The determination whether field filtration will be required will be made based upon a comparison study between the two filtration options in early 2005. The QAPP will be updated based upon this study. 2 If Boron is a target analyte, a polyethylene bottle must be used for sample collection. 3 See section 5.4.4 regarding confirmation of detected perchlorate results.
G = glass A = Amber P = polyethylene VOA = volatile organic analysis vial
4.1.1 Filtration and Preservation of Samples for Metals Analysis Hexavalent chromium and dissolved chromium samples are to be collected without field filtration and preservation until the results of the comparative study scheduled for spring of 2005 is performed, evaluated and understood (CH2M HILL 2005). The unfiltered and unpreserved samples will be delivered by courier to the laboratory the day sampled for filtration prior to preservation and analysis. The filtration and preservation must be performed immediately upon receipt at the laboratory on the day of collection. Samples for hexavalent chromium analyses will be adjusted to a pH of 9.0-9.5 for SW7199 analyses with the buffer solution identified in Table 4-1. Also, metals samples will be adjusted to a pH of less than 2 with nitric acid.
Samples collected for dissolved metals other than chromium will be filtered and preserved in the field at the time of collection. Additionally, samples collected for metals determinations from water supply wells will not be filtered, but preserved in the field according to Table 4-1 unless the project objectives require that the dissolved concentrations of metals be evaluated.
4.2 Chain of Custody Procedures must be taken to preserve and ensure the integrity of all samples from the time of collection through analysis. Sample custody records must be maintained both in the field and in the subcontractor laboratory. A sample is considered to be in someone’s custody if it is either in his or her physical possession or view, locked up, or kept in a secured and restricted area. Until the samples are shipped, their custody will be the responsibility of the field team leader.
COC records document sample collection and shipment to the laboratory. A COC form will be completed for each sampling event. The original copy will be provided to the laboratory with the sample-shipping cooler, and a copy will be retained in the field documentation files. The COC form will identify the contents of each shipment and maintain the custodial integrity of the samples. All COC forms will be signed and dated by the responsible sampling team personnel. The “relinquished by” box will be signed by the responsible
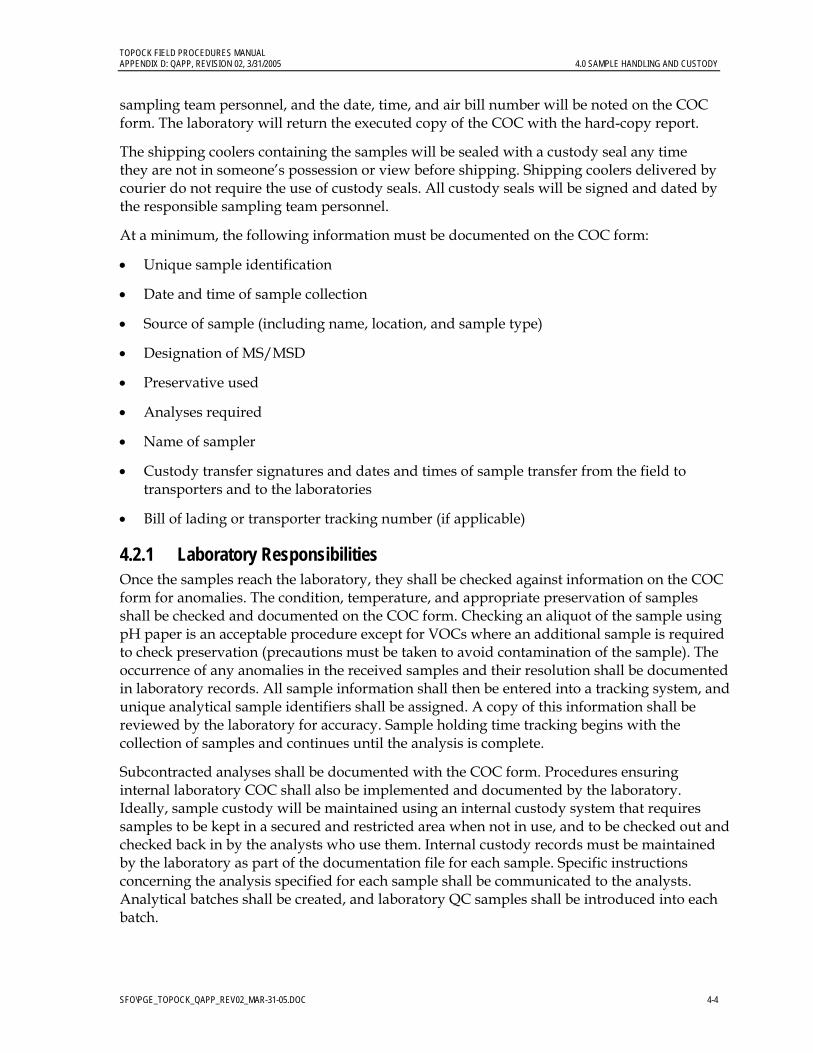
TOPOCK FIELD PROCEDURES MANUAL APPENDIX D: QAPP, REVISION 02, 3/31/2005 4.0 SAMPLE HANDLING AND CUSTODY
SFO\PGE_TOPOCK_QAPP_REV02_MAR-31-05.DOC 4-4
sampling team personnel, and the date, time, and air bill number will be noted on the COC form. The laboratory will return the executed copy of the COC with the hard-copy report.
The shipping coolers containing the samples will be sealed with a custody seal any time they are not in someone’s possession or view before shipping. Shipping coolers delivered by courier do not require the use of custody seals. All custody seals will be signed and dated by the responsible sampling team personnel.
At a minimum, the following information must be documented on the COC form:
• Unique sample identification
• Date and time of sample collection
• Source of sample (including name, location, and sample type)
• Designation of MS/MSD
• Preservative used
• Analyses required
• Name of sampler
• Custody transfer signatures and dates and times of sample transfer from the field to transporters and to the laboratories
• Bill of lading or transporter tracking number (if applicable)
4.2.1 Laboratory Responsibilities Once the samples reach the laboratory, they shall be checked against information on the COC form for anomalies. The condition, temperature, and appropriate preservation of samples shall be checked and documented on the COC form. Checking an aliquot of the sample using pH paper is an acceptable procedure except for VOCs where an additional sample is required to check preservation (precautions must be taken to avoid contamination of the sample). The occurrence of any anomalies in the received samples and their resolution shall be documented in laboratory records. All sample information shall then be entered into a tracking system, and unique analytical sample identifiers shall be assigned. A copy of this information shall be reviewed by the laboratory for accuracy. Sample holding time tracking begins with the collection of samples and continues until the analysis is complete.
Subcontracted analyses shall be documented with the COC form. Procedures ensuring internal laboratory COC shall also be implemented and documented by the laboratory. Ideally, sample custody will be maintained using an internal custody system that requires samples to be kept in a secured and restricted area when not in use, and to be checked out and checked back in by the analysts who use them. Internal custody records must be maintained by the laboratory as part of the documentation file for each sample. Specific instructions concerning the analysis specified for each sample shall be communicated to the analysts. Analytical batches shall be created, and laboratory QC samples shall be introduced into each batch.

TOPOCK FIELD PROCEDURES MANUAL APPENDIX D: QAPP, REVISION 02, 3/31/2005 4.0 SAMPLE HANDLING AND CUSTODY
SFO\PGE_TOPOCK_QAPP_REV02_MAR-31-05.DOC 4-5
While in the laboratory, samples shall be stored in limited-access, temperature-controlled areas. Refrigerators, coolers and freezers shall be monitored for temperature seven days a week. Acceptance criterion for the temperatures of the refrigerators and coolers is 4°C ± 2°C. Acceptance criterion for the temperatures of the freezers shall be less than 0°C. All of the cold storage areas shall be monitored by thermometers that have been calibrated with a National Institute of Standards and Technology (NIST)-traceable thermometer. As indicated by the findings of the calibration, correction factors shall be applied to each thermometer. Records that include acceptance criteria shall be maintained. Samples shall be stored after analysis until disposed of in accordance with applicable local, state, and federal regulations. Disposal records shall be maintained by the laboratory.
Along with sample receipt documentation, the following information will be documented on Sample Receipt Forms by the sample custodian:
• Date samples received • CH2M HILL sample identification number • Laboratory sample identification number • Analytical tests requested for the sample batch • Sample matrix • Number of samples in the batch • Container description and location in the laboratory • Verification of sample preservation
SOPs describing sample control and custody shall be maintained by the laboratory.
4.3 Sample Packaging and Transport The following sections contain guidelines for sample packaging and transport that may be superceded, amended or replaced in the project-specific plan.
4.3.1 Sample Container Preparation • The labels will be secured to each container with clear tape, if not previously done.
• Container lids will be checked for tightness, and if the container is not full, the outside of the container will be marked with indelible ink at the sample volume level.
• Sample bottles will be double-bagged in heavy-duty plastic. Glass containers will be covered with bubble wrap to prevent breakage.
4.3.2 Shipping Cooler Preparation • All previous labels used on the sample-shipping cooler will be removed.
• The drain plugs will be sealed with fiberglass tape (outside and inside) to prevent melting ice from leaking.
• A cushioning layer of packing material such as bubble wrap will be placed at the bottom of the cooler (about an inch thick) to prevent breakage during shipment.
• The cooler will be lined with a large plastic bag (same type used to contain samples).
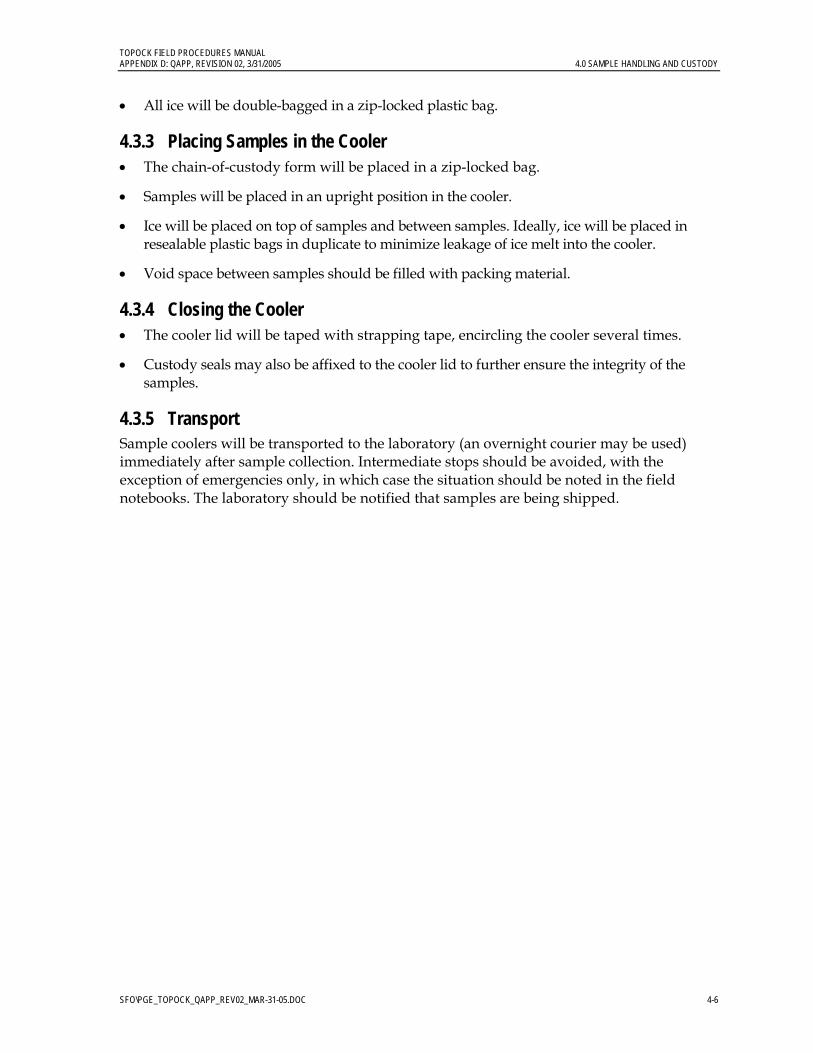
TOPOCK FIELD PROCEDURES MANUAL APPENDIX D: QAPP, REVISION 02, 3/31/2005 4.0 SAMPLE HANDLING AND CUSTODY
SFO\PGE_TOPOCK_QAPP_REV02_MAR-31-05.DOC 4-6
• All ice will be double-bagged in a zip-locked plastic bag.
4.3.3 Placing Samples in the Cooler • The chain-of-custody form will be placed in a zip-locked bag.
• Samples will be placed in an upright position in the cooler.
• Ice will be placed on top of samples and between samples. Ideally, ice will be placed in resealable plastic bags in duplicate to minimize leakage of ice melt into the cooler.
• Void space between samples should be filled with packing material.
4.3.4 Closing the Cooler • The cooler lid will be taped with strapping tape, encircling the cooler several times.
• Custody seals may also be affixed to the cooler lid to further ensure the integrity of the samples.
4.3.5 Transport Sample coolers will be transported to the laboratory (an overnight courier may be used) immediately after sample collection. Intermediate stops should be avoided, with the exception of emergencies only, in which case the situation should be noted in the field notebooks. The laboratory should be notified that samples are being shipped.
SFO\PGE_TOPOCK_QAPP_REV02_MAR-31-05.DOC 5-1
5.0 Data Quality Objectives and Quality Assurance Program
Within the Topock Program, project-specific DQOs are specified in the work plan and/or SAP. They are the basis for the design of the data collection plan, and as such, they specify the type, quality, and quantity of data to be collected, and how the data are to be used to make the appropriate decisions for the project. The final output of the process is a data collection design that meets the qualitative and quantitative needs of the project.
5.1 Precision, Accuracy, Representativeness, Completeness, and Comparability
Data quality will be evaluated based on their precision, accuracy, representativeness, completeness, and comparability.
5.1.1 Precision Precision is a measure of reproducibility of analytical results. It can be defined as the degree of mutual agreement among individual measurements obtained under similar conditions. Total precision is a function of the variability associated with both sampling and analysis. Precision will be evaluated as the relative percent difference (RPD) between field duplicate sample results and laboratory sample duplicates, or between the MS and MSD results. Field duplicates will comprise 10 percent of the sampling effort. MS/MSD samples will be field-designated at a 5 percent frequency.
5.1.2 Accuracy Accuracy is the degree of agreement between a measured value and the “true” or expected value. It represents an estimate of total error from a single measurement, including both systematic error, or bias, and random error that may reflect variability due to imprecision. Accuracy is evaluated in terms of percent recoveries determined from results of MS/MSD and laboratory control sample (LCS) analyses.
5.1.3 Representativeness Representativeness is the degree to which sample data accurately reflect the characteristics of a population of samples. It is achieved through a well-designed sampling program and by using standardized sampling strategies and techniques and analytical procedures. Factors that can affect representativeness include site homogeneity, sample homogeneity at a single point, and available information around which the sampling program is designed. Using multiple methods to measure an analyte can also result in non-representativeness of sample data.

TOPOCK FIELD PROCEDURES MANUAL APPENDIX D: QAPP, REVISION 02, 3/31/2005 5.0 DATA QUALITY OBJECTIVES AND QUALITY ASSURANCE PROGRAM
SFO\PGE_TOPOCK_QAPP_REV02_MAR-31-05.DOC 5-2
5.1.4 Completeness Completeness is the amount of valid measurements compared to the total amount generated. It will be determined for each method, matrix, and analyte combination. The completeness goals of each project are optimized to meet the DQOs. The goals for this program are 95 percent.
5.1.5 Comparability Comparability is the confidence with which one data set can be compared to another. It is achieved by maintaining standard techniques and procedures for collecting and analyzing samples and reporting the analytical results in standard units. Results of performance evaluation samples and systems audits will provide additional information for assessing comparability of data among participating subcontractor laboratories.
5.2 Method Detection Limits, Reporting Limits, and Instrument Calibration Requirements
5.2.1 Method Detection Limits The method detection limit (MDL) is the minimum concentration of a substance that can be measured and reported with 99 percent confidence that the analyte concentration is greater than zero. Each participating laboratory will determine the MDL for each method, matrix, and analyte for each instrument that will be used to analyze samples. The MDLs will be initially determined prior to analyzing samples, and will be redetermined at least once every 12 months.
(1) Estimate the MDL using one of the following:
a) the concentration value that corresponds to an instrument signal/noise ratio in the range of 2.5 to 5, or
b) the concentration equivalent of 3 times the standard deviation of replicate measurement of the analyte in reagent water, or
c) the region of the standard curve where there is a significant change in sensitivity (i.e., a break in the slope of the standard curve).
(2) Prepare (i.e., extract, digest) and analyze seven samples of a matrix spike (ASTM Type II/deionized water) containing the analyte of interest at a concentration three to five times the estimated MDL.
(3) Determine the variance (S2) for each analyte as follows:
S2 = ( )11
2
1nx xi
i
n
−−
⎡
⎣⎢
⎤
⎦⎥
=∑
where xi = the nth measurement of the variable x and x = the average value of x

TOPOCK FIELD PROCEDURES MANUAL APPENDIX D: QAPP, REVISION 02, 3/31/2005 5.0 DATA QUALITY OBJECTIVES AND QUALITY ASSURANCE PROGRAM
SFO\PGE_TOPOCK_QAPP_REV02_MAR-31-05.DOC 5-3
Xn
xii
n
==∑1
1
(4) Determine the standard deviation (s) for each analyte as follows:
s = (S2)1/2
(5) Determine the MDL for each analyte as follows:
MDL = 3.14(s)
(Note: 3.14 is the one-sided t-statistic at the 99 percent confidence level appropriate for determining the MDL using 7 samples)
(6) If the spike level used in step 2 is more than 10 times the calculated MDL, repeat the process using a smaller spiking level.
5.2.2 Reporting Limits Reporting limits (RLs) should be greater than two times the calculated method detection limit. Reporting limits used by the laboratory should not be greater than the detection limit objectives listed in Tables 5-1 through 5-5. If the detection limit objectives cannot be achieved the laboratory must document why a sample/method combination does not meet the RL requirements in the case narrative.
When calibrating instruments, a standard at a concentration equal to or less than the RL must be included. Analytes that are not detected at or above the RL will be reported as not detected at the RL, and flagged “U”. Reporting limits and sample results should be reported to 2 significant figures if less than 10 µg/L for metals analyses, 10 mg/L for general chemistry analyses, and to 3 significant figures otherwise.
5.2.3 Instrument Calibration Laboratory instruments shall be calibrated by qualified personnel prior to sample analysis according to the procedures specified in each method. Calibration shall be verified at method-specified intervals throughout the analysis sequence. The frequency and acceptance criteria for calibration are specified for each analytical method. When multi-point calibration is specified, the concentrations of the calibration standards should bracket those expected in the samples. Samples should be diluted, if necessary, to bring analyte responses within the calibration range. Data that exceed the calibration range cannot be reported by the laboratory. The initial calibration curve shall be verified as accurate with a standard purchased or prepared from an independent second source. The initial calibration verification involves the analysis of a standard containing all the target analytes, typically in the middle of the calibration range, each time the initial calibration is performed. Quantitation based on extrapolation is not desirable.
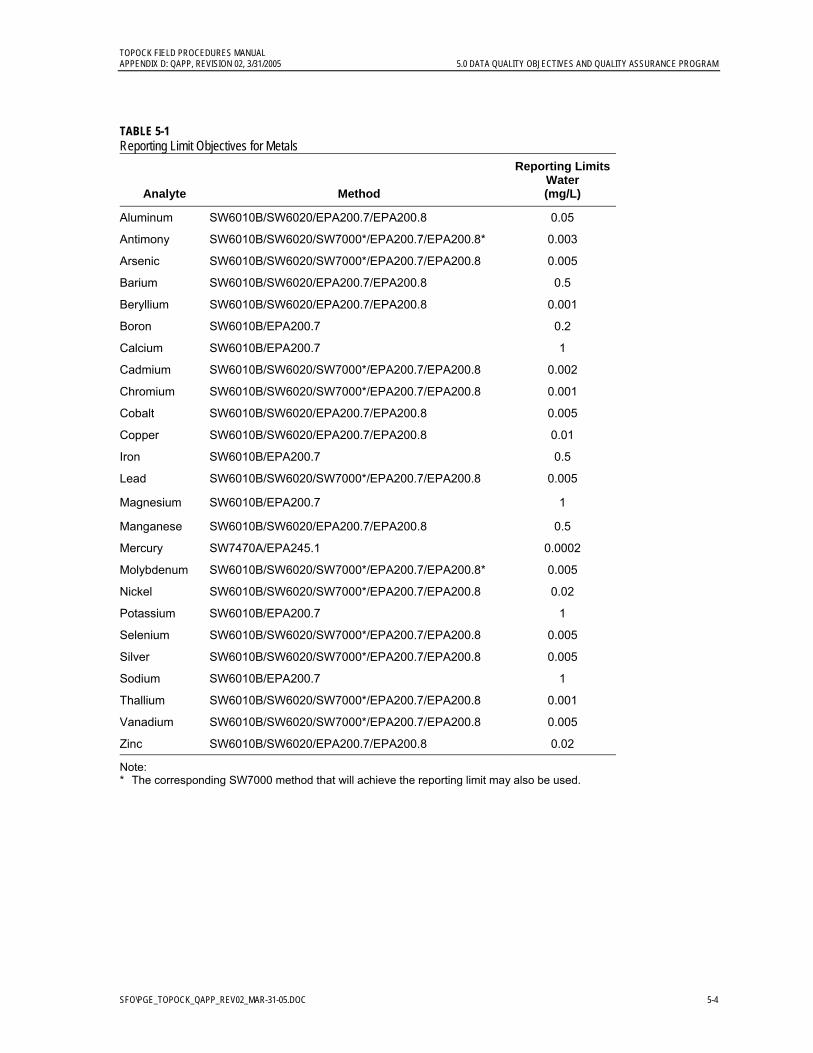
TOPOCK FIELD PROCEDURES MANUAL APPENDIX D: QAPP, REVISION 02, 3/31/2005 5.0 DATA QUALITY OBJECTIVES AND QUALITY ASSURANCE PROGRAM
SFO\PGE_TOPOCK_QAPP_REV02_MAR-31-05.DOC 5-4
TABLE 5-1 Reporting Limit Objectives for Metals
Analyte Method
Reporting Limits Water (mg/L)
Aluminum SW6010B/SW6020/EPA200.7/EPA200.8 0.05
Antimony SW6010B/SW6020/SW7000*/EPA200.7/EPA200.8* 0.003
Arsenic SW6010B/SW6020/SW7000*/EPA200.7/EPA200.8 0.005
Barium SW6010B/SW6020/EPA200.7/EPA200.8 0.5
Beryllium SW6010B/SW6020/EPA200.7/EPA200.8 0.001
Boron SW6010B/EPA200.7 0.2
Calcium SW6010B/EPA200.7 1
Cadmium SW6010B/SW6020/SW7000*/EPA200.7/EPA200.8 0.002
Chromium SW6010B/SW6020/SW7000*/EPA200.7/EPA200.8 0.001
Cobalt SW6010B/SW6020/EPA200.7/EPA200.8 0.005
Copper SW6010B/SW6020/EPA200.7/EPA200.8 0.01
Iron SW6010B/EPA200.7 0.5
Lead SW6010B/SW6020/SW7000*/EPA200.7/EPA200.8 0.005
Magnesium SW6010B/EPA200.7 1
Manganese SW6010B/SW6020/EPA200.7/EPA200.8 0.5
Mercury SW7470A/EPA245.1 0.0002
Molybdenum SW6010B/SW6020/SW7000*/EPA200.7/EPA200.8* 0.005
Nickel SW6010B/SW6020/SW7000*/EPA200.7/EPA200.8 0.02
Potassium SW6010B/EPA200.7 1
Selenium SW6010B/SW6020/SW7000*/EPA200.7/EPA200.8 0.005
Silver SW6010B/SW6020/SW7000*/EPA200.7/EPA200.8 0.005
Sodium SW6010B/EPA200.7 1
Thallium SW6010B/SW6020/SW7000*/EPA200.7/EPA200.8 0.001
Vanadium SW6010B/SW6020/SW7000*/EPA200.7/EPA200.8 0.005
Zinc SW6010B/SW6020/EPA200.7/EPA200.8 0.02
Note: * The corresponding SW7000 method that will achieve the reporting limit may also be used.

TOPOCK FIELD PROCEDURES MANUAL APPENDIX D: QAPP, REVISION 02, 3/31/2005 5.0 DATA QUALITY OBJECTIVES AND QUALITY ASSURANCE PROGRAM
SFO\PGE_TOPOCK_QAPP_REV02_MAR-31-05.DOC 5-5
TABLE 5-2 Reporting Limit Objectives for General Chemistry and Other Parameters
Analyte Method
Reporting Limits Water (mg/L)
Chloride EPA 300.0/SW9056 0.5
Fluoride EPA 300.0/SW9056 0.5
Sulfate EPA 300.0/SW9056 0.5
Bromide EPA 300.0/SW9056 0.5
Nitrate as N EPA 300.0/SW9056 0.5
Nitrate/Nitrite as N EPA353.2 0.01
Total Alkalinity EPA310.1 5
Bicarbonate Alkalinity EPA310.1 5
Specific Conductance EPA120.1/SW9050 2 µmhos/cm
pH EPA150.1/SW9040 0.1 pH units
Total Dissolved Solids (TDS) EPA160.1 10
Total Suspended Solids (TSS) EPA160.2 10
Turbidity EPA180.1 0.1 NTU
Carbonate Alkalinity EPA310.1 5
Hydroxide Alkalinity EPA310.1 5
Perchlorate EPA314.0 0.004
Ammonia as N EPA350.2 0.5
ortho-Phosphate EPA365.1 0.02
Sulfide EPA376.1/2 2
Ferrous Iron (Fe+2) SM3500D 0.2
Total Kjeldahl Nitrogen (TKN) EPA351.4 0.5
Dissolved Silica EPA370.1 0.04
Total Organic Carbon EPA415.2 0.5
Dissolved Organic Carbon EPA415.2 0.5
Chromium (hexavalent) SW7199/EPA218.6 0.0002
Chromium (hexavalent) SW7196A 0.01
Iodide EPA 300.0MOD 0.2 18O Laboratory SOP (CF-IRMS) NA
Deuterium Laboratory SOP (CF-IRMS) NA
Note: CF-IRMS = continuous flow isotope ratio mass spectrometry NA = not applicable

TOPOCK FIELD PROCEDURES MANUAL APPENDIX D: QAPP, REVISION 02, 3/31/2005 5.0 DATA QUALITY OBJECTIVES AND QUALITY ASSURANCE PROGRAM
SFO\PGE_TOPOCK_QAPP_REV02_MAR-31-05.DOC 5-6
TABLE 5-3 Reporting Limit Objectives for PCBs by SW8082
Analyte
Reporting Limits Water (µg/L) Analyte
Reporting Limits Water (µg/L)
Aroclor-1016 0.5 Aroclor-1248 0.5 Aroclor-1221 0.5 Aroclor-1254 0.5 Aroclor-1232 0.5 Aroclor-1260 0.5 Aroclor-1242 0.5
TABLE 5-4 Reporting Limit Objectives for Volatile Organic Compounds by SW8260B
Analyte
Reporting Limits Water (µg/L) Analyte
Reporting Limits Water (µg/L)
1,1,1,2-Tetrachloroethane 1 Carbon Disulfide 1 1,1,1-Trichloroethane 1 Carbon Tetrachloride 1 1,1,2,2-Tetrachloroethane 1 Chlorobenzene 1 1,1,2-Trichloroethane 1 Chloroethane 1 1,1,2-Trichlorotrifluoroethane 1 Chloroform 1 1,1-Dichloroethane 1 Chloromethane 1 1,1-Dichloroethene 1 Cis-1,2-Dichloroethene 1 1,2,3-Trichloropropane 1 Dibromochloromethane 1 1,2,4-Trichlorobenzene 1 Dichlorodifluoromethane 1 1,2,4-Trimethylbenzene 1 Ethylbenzene 1 1,2-Dibromo-3-chloropropane 2 Ethylene Dibromide 1 1,2-Dichlorobenzene 1 Isobutyl Alcohol 1 1,2-Dichloroethane 1 Isopropylbenzene 1 1,2-Dichloropropane 1 m,p-Xylene 1 1,3,5-Trimethylbenzene 1 Methyl tert-Butyl Ether 1 1,3-Dichlorobenzene 1 Methylene Chloride 5 1,4-Dichlorobenzene 1 n-Butylbenzene 1 1,4-Dioxane 100 n-Propylbenzene 1 2-Butanone 10 o-Xylene 1 2-Chlorotoluene 1 Sec-Butylbenzene 1 4-Methyl-2-Pentanone 10 Styrene 1 Acetone 10 tert-Butylbenzene 1 Acrolein 20 Tetrachloroethene 1 Acrylonitrile 20 Toluene 1 Benzene 1 Trans-1,2-Dichloroethene 1 Bromobenzene 1 Trichloroethene 1 Bromodichloromethane 1 Vinyl Chloride 1 Bromoform 1 Xylene (Total) 2 Bromomethane 1
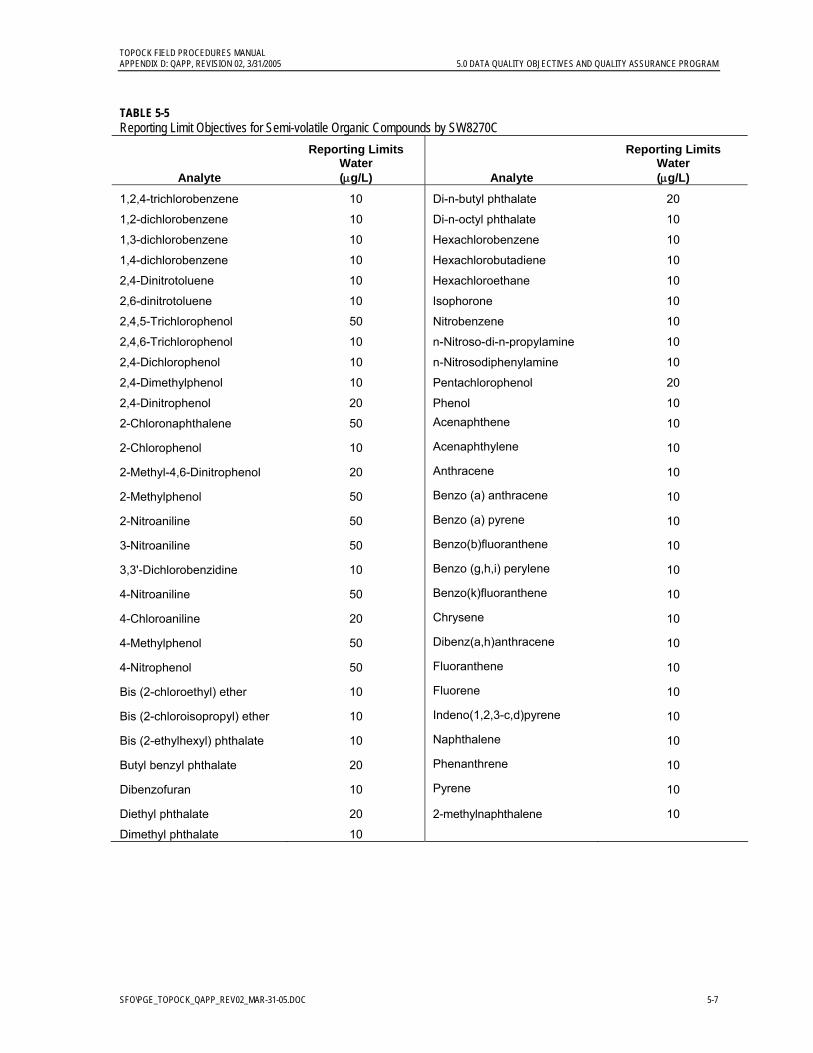
TOPOCK FIELD PROCEDURES MANUAL APPENDIX D: QAPP, REVISION 02, 3/31/2005 5.0 DATA QUALITY OBJECTIVES AND QUALITY ASSURANCE PROGRAM
SFO\PGE_TOPOCK_QAPP_REV02_MAR-31-05.DOC 5-7
TABLE 5-5 Reporting Limit Objectives for Semi-volatile Organic Compounds by SW8270C
Analyte
Reporting Limits Water (µg/L) Analyte
Reporting Limits Water (µg/L)
1,2,4-trichlorobenzene 10 Di-n-butyl phthalate 20
1,2-dichlorobenzene 10 Di-n-octyl phthalate 10
1,3-dichlorobenzene 10 Hexachlorobenzene 10
1,4-dichlorobenzene 10 Hexachlorobutadiene 10
2,4-Dinitrotoluene 10 Hexachloroethane 10
2,6-dinitrotoluene 10 Isophorone 10
2,4,5-Trichlorophenol 50 Nitrobenzene 10
2,4,6-Trichlorophenol 10 n-Nitroso-di-n-propylamine 10
2,4-Dichlorophenol 10 n-Nitrosodiphenylamine 10
2,4-Dimethylphenol 10 Pentachlorophenol 20
2,4-Dinitrophenol 20 Phenol 10
2-Chloronaphthalene 50 Acenaphthene 10
2-Chlorophenol 10 Acenaphthylene 10
2-Methyl-4,6-Dinitrophenol 20 Anthracene 10
2-Methylphenol 50 Benzo (a) anthracene 10
2-Nitroaniline 50 Benzo (a) pyrene 10
3-Nitroaniline 50 Benzo(b)fluoranthene 10
3,3'-Dichlorobenzidine 10 Benzo (g,h,i) perylene 10
4-Nitroaniline 50 Benzo(k)fluoranthene 10
4-Chloroaniline 20 Chrysene 10
4-Methylphenol 50 Dibenz(a,h)anthracene 10
4-Nitrophenol 50 Fluoranthene 10
Bis (2-chloroethyl) ether 10 Fluorene 10
Bis (2-chloroisopropyl) ether 10 Indeno(1,2,3-c,d)pyrene 10
Bis (2-ethylhexyl) phthalate 10 Naphthalene 10
Butyl benzyl phthalate 20 Phenanthrene 10
Dibenzofuran 10 Pyrene 10
Diethyl phthalate 20 2-methylnaphthalene 10
Dimethyl phthalate 10
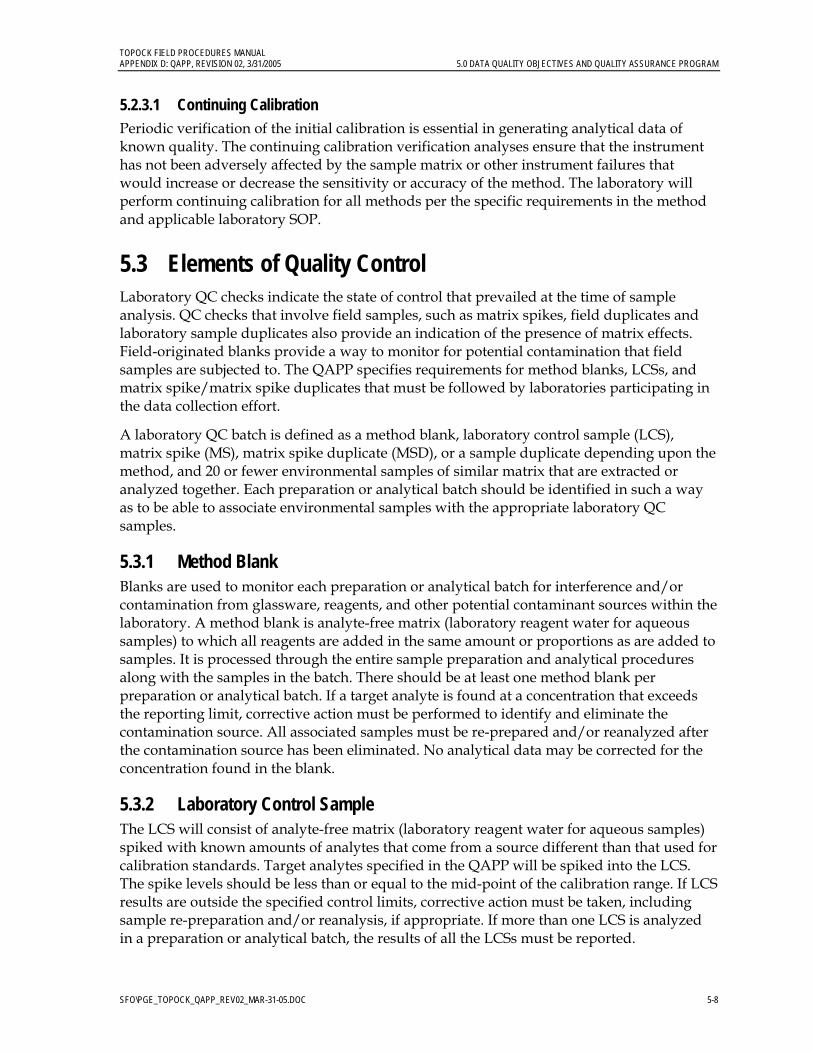
TOPOCK FIELD PROCEDURES MANUAL APPENDIX D: QAPP, REVISION 02, 3/31/2005 5.0 DATA QUALITY OBJECTIVES AND QUALITY ASSURANCE PROGRAM
SFO\PGE_TOPOCK_QAPP_REV02_MAR-31-05.DOC 5-8
5.2.3.1 Continuing Calibration Periodic verification of the initial calibration is essential in generating analytical data of known quality. The continuing calibration verification analyses ensure that the instrument has not been adversely affected by the sample matrix or other instrument failures that would increase or decrease the sensitivity or accuracy of the method. The laboratory will perform continuing calibration for all methods per the specific requirements in the method and applicable laboratory SOP.
5.3 Elements of Quality Control Laboratory QC checks indicate the state of control that prevailed at the time of sample analysis. QC checks that involve field samples, such as matrix spikes, field duplicates and laboratory sample duplicates also provide an indication of the presence of matrix effects. Field-originated blanks provide a way to monitor for potential contamination that field samples are subjected to. The QAPP specifies requirements for method blanks, LCSs, and matrix spike/ matrix spike duplicates that must be followed by laboratories participating in the data collection effort.
A laboratory QC batch is defined as a method blank, laboratory control sample (LCS), matrix spike (MS), matrix spike duplicate (MSD), or a sample duplicate depending upon the method, and 20 or fewer environmental samples of similar matrix that are extracted or analyzed together. Each preparation or analytical batch should be identified in such a way as to be able to associate environmental samples with the appropriate laboratory QC samples.
5.3.1 Method Blank Blanks are used to monitor each preparation or analytical batch for interference and/or contamination from glassware, reagents, and other potential contaminant sources within the laboratory. A method blank is analyte-free matrix (laboratory reagent water for aqueous samples) to which all reagents are added in the same amount or proportions as are added to samples. It is processed through the entire sample preparation and analytical procedures along with the samples in the batch. There should be at least one method blank per preparation or analytical batch. If a target analyte is found at a concentration that exceeds the reporting limit, corrective action must be performed to identify and eliminate the contamination source. All associated samples must be re-prepared and/or reanalyzed after the contamination source has been eliminated. No analytical data may be corrected for the concentration found in the blank.
5.3.2 Laboratory Control Sample The LCS will consist of analyte-free matrix (laboratory reagent water for aqueous samples) spiked with known amounts of analytes that come from a source different than that used for calibration standards. Target analytes specified in the QAPP will be spiked into the LCS. The spike levels should be less than or equal to the mid-point of the calibration range. If LCS results are outside the specified control limits, corrective action must be taken, including sample re-preparation and/or reanalysis, if appropriate. If more than one LCS is analyzed in a preparation or analytical batch, the results of all the LCSs must be reported.
TOPOCK FIELD PROCEDURES MANUAL APPENDIX D: QAPP, REVISION 02, 3/31/2005 5.0 DATA QUALITY OBJECTIVES AND QUALITY ASSURANCE PROGRAM
SFO\PGE_TOPOCK_QAPP_REV02_MAR-31-05.DOC 5-9
5.3.3 Matrix Spike/Matrix Spike Duplicate A sample matrix fortified with known quantities of specific compounds is called an MS. It is subjected to the same preparation and analytical procedures as the native sample. Target analytes specified in the QAPP are spiked into the sample. Matrix spike recoveries are used to evaluate the effect of the sample matrix on the recovery of the analytes of interest. An MSD is a second fortified sample matrix. The RPD between the results of the duplicate matrix spikes measures the precision of sample results. The spike levels will be less than or equal to the mid-point of the calibration range unless otherwise specified.
5.3.3.1 MS for Hexavalent Chromium Analyses Interference from the groundwater at some well locations is known to reduce the sensitivity of the SW7199 method and may result in underestimating the sample-specific reporting limit if the “MS Spike and Dilution Protocol” is not followed. The following locations are required to follow the protocol below until the Project Chemist determines that this protocol is no longer necessary: MW-21, MW-29, MW-30-30, MW-30-50, MW-32-20, MW-32-35, MW-33-40, MW-33-90, MW-34-55 and MW-34-80. All new wells will follow the “MS Spike and Dilution Protocol” at least once. Wells displaying matrix interference will continue to follow the protocol until determined otherwise by the Project Chemist. All other samples being analyzed by the SW7199 method for this program will follow the protocol below as determined by the Project Chemist. In all cases, the laboratory must document why a sample does not meet the RL requirements in the case narrative.
MS Spike and Dilution Protocol If a sample peak is suspected to be hexavalent chromium, but is not within the retention time window, the sample must be post-spiked with 1 µg/L of hexavalent chromium to establish identification. Also, samples that do not exhibit peaks in the chromatograms must be post-spiked with 1 µg/L of hexavalent chromium unless the Project Chemist has directed the laboratory to do otherwise. If the post-spike is not recovered or the peak is outside of the established retention time window, the laboratory will dilute two aliquots of the sample at 1:5 dilution factor. The first aliquot will be analyzed without the post-spike, and the second will be spiked with 1 µg/L of hexavalent chromium and the recovery and peak’s retention time evaluated. If the post-spike recovery is not within 85-115 percent and/or the peak is not within the laboratory retention time window, the laboratory will take two additional aliquots, further dilute by another 5x factor, and continue this procedure until the peak identified is within the RT window and the recovery is within the 85-115 percent criteria.
5.3.4 Laboratory Sample Duplicate A sample duplicate selected by the laboratory is called a laboratory sample duplicate. It is subjected to the same preparation and analytical procedures as the native sample. The RPD between the results of the native sample and laboratory sample duplicate measures the precision of sample results. The data collected may also yield information regarding whether the sample matrix is homogenous or heterogeneous.
5.3.5 Interference Check Samples The interference check samples are used in inductively coupled plasma analyses to verify background and inter-element correction factors. They consist of two solutions, A and AB.
TOPOCK FIELD PROCEDURES MANUAL APPENDIX D: QAPP, REVISION 02, 3/31/2005 5.0 DATA QUALITY OBJECTIVES AND QUALITY ASSURANCE PROGRAM
SFO\PGE_TOPOCK_QAPP_REV02_MAR-31-05.DOC 5-10
Solution A contains the interfering analytes, and Solution B contains both the analytes of interest and the interfering analytes. Both solutions are analyzed at the beginning and at the end of each analytical sequence. When the interference check samples results are outside the control limits, corrective action must be taken, including sample reanalysis, if appropriate.
5.3.6 Retention Time Windows Retention time windows must be established for each column and eluent batch. This may be done by running a mid-range standard repeatedly over a period of at least 72 hours. The width of the window will be plus or minus 3 times the standard deviation of the retention times. The average of the retention times of all the calibration verification standards analyzed with each analytical batch will be the center of the retention time window for that batch. In order for an analyte to be reported as positive, its elution time must be within the retention time window.
5.3.7 Equipment Blank Equipment blanks, also sometimes referred to as rinsate blanks, are used to assess the effectiveness of the sampling equipment decontamination procedure. They are obtained immediately following sampling equipment decontamination by rinsing the decontaminated sampling equipment with deionized or ASTM Type II water. The rinse water is collected in sample bottles, preserved, handled, and analyzed in the same manner as the samples. Equipment rinsate blanks will be collected at a frequency of one per day per sampling crew for each decontaminated equipment type.
5.3.8 Field Duplicates A field duplicate is an independent sample collected as close as possible to the original sample from the same source under identical conditions, and is used to evaluate sampling precision. The duplicates are collected simultaneously or in immediate succession, and are treated in exactly the same manner during storage, shipment, and analysis. Field duplicates will be collected at a minimum frequency of 10 percent or one per sampling event, whichever is more frequent, for each matrix and for each type of analysis. The sampling locations for field samples will be recorded in the field logbook.
The field duplicates will be identified in such a manner as to not enable the laboratory to recognize them as field duplicates.
5.4 Additional Quality Control Requirements 5.4.1 Holding Time The holding time requirements specified in this QAPP must be met. For methods requiring both sample preparation and analysis, the preparation holding time will be calculated from the time of sampling to the completion of preparation. The analysis holding time will be calculated from the time of completion of preparation to the time of completion of the analysis, including any required dilutions, confirmation analysis, and reanalysis. For methods requiring analysis only, the holding time is calculated from the time of sampling to

TOPOCK FIELD PROCEDURES MANUAL APPENDIX D: QAPP, REVISION 02, 3/31/2005 5.0 DATA QUALITY OBJECTIVES AND QUALITY ASSURANCE PROGRAM
SFO\PGE_TOPOCK_QAPP_REV02_MAR-31-05.DOC 5-11
completion of the analysis, including any required dilutions, confirmation analysis, and reanalysis.
5.4.2 Standard Materials and Other Supplies and Consumables Standard materials must be of known high purity and traceable to an approved source. Pure standards must not exceed the manufacturer’s expiration date or one year following receipt, whichever comes first. Solutions prepared by the laboratory from the pure standards must be used within the expiration date specified in the laboratory’s SOP.
All other supplies and consumables must be inspected prior to use to ensure that they meet the requirements specified in the appropriate SOP. The laboratory’s inventory and storage system should ensure their use within the manufacturer’s expiration date and storage under proper conditions.
5.4.3 Manual Integration The laboratory is required to provide all analysts performing methods that rely on interpretation of chromatographic data with training on appropriate software or manual integration practices. The laboratory also will make every effort to minimize the use of manual integration of data. If the need arises to use manual integration to correct a software auto-integration error, the manual integration will be clearly identified in the instrument data. Before and after enlargements of the region of the chromatogram where the manual integration was performed will be provided on an appropriate scale that allows an independent reviewer to evaluate the need and quality of the manual integration. The analyst will also document the reason for the manual integration on the chromatogram along with their date and initials. The laboratory manager or designee will approve the manual integration by dating and initialing the chromatogram.
5.4.4 Confirmation of Perchlorate Results If analysis by EPA 314.0 indicates the presence of perchlorate in a sample greater than 4 µg/L, the result should be confirmed using an alternate analytical technique, such as high pressure liquid chromatography/mass spectrometry/mass spectrometry (HPLC/MS/MS) or ion chromatography/mass spectrometry/mass spectrometry (IC/MS/MS). Ongoing confirmation at a location previously characterized by HPLC/MS/MS or IC/MS/MS that contains detectable levels of perchlorate will not be required unless the field conditions indicate that the EPA 314.0 cannot accurately characterize the sample.
5.4.5 Laboratory Quality Assurance Program The laboratory will maintain a Quality Assurance Manual (QAM) or equivalent document. The QAM will define the laboratory’s internal procedures for QA/QC as follows:
• QA policies, objectives and requirements • Organization and personnel • Document control • SOPs (analytical methodology and administrative) • Data generation • Software verification
TOPOCK FIELD PROCEDURES MANUAL APPENDIX D: QAPP, REVISION 02, 3/31/2005 5.0 DATA QUALITY OBJECTIVES AND QUALITY ASSURANCE PROGRAM
SFO\PGE_TOPOCK_QAPP_REV02_MAR-31-05.DOC 5-12
• QC • Nonconformance /Corrective action procedures • Data review
5.4.5.1 Laboratory Standard Operating Procedures The laboratory will maintain SOPs for all analytical methods and laboratory operations. The format for SOPs should conform with the following references:
• Test Methods for Evaluating Solid Waste, Physical and Chemical Methods, SW-846, 3rd Edition, Update III, Section 1 (EPA 1996)
• “Good Laboratory Practices” in Principles and Guidance to Regulations for Ensuring Data Integrity in Automated Laboratory Operations (EPA 1995)
All SOPs must have a unique identification number that is traceable to previous revisions of the same document.
5.4.5.2 Demonstration of Capability Laboratory QA department personnel will maintain records documenting the ability of each analyst to perform applicable method protocols. Documentation will include annual checks for each method and analyst. In addition, internal, blind performance evaluation (PE) samples for each method and matrix demonstrating overall laboratory performance must be submitted annually. The laboratory may receive blind PE samples.
5.5 Reporting Limits and Analytical Requirements As noted previously, Tables 5-1 through 5-5 contain lists of target analytes, the methods to be used, and the reporting limit objectives specific to this project. The reporting limits included herein reflect quantifiable levels that are attainable with a specified degree of confidence using the specified methods.
The accuracy and precision limits are listed in Table 5-6 through 5-11. Calibration and QC requirements are specified in Tables 5-12 through 5-19.
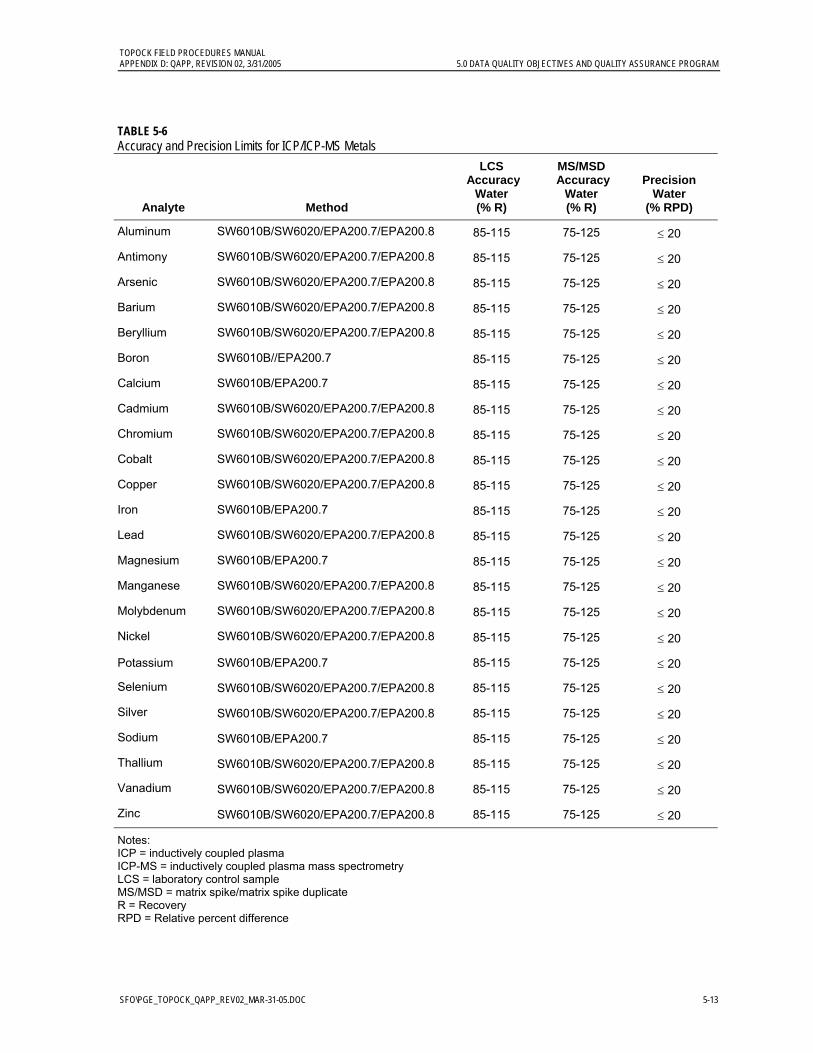
TOPOCK FIELD PROCEDURES MANUAL APPENDIX D: QAPP, REVISION 02, 3/31/2005 5.0 DATA QUALITY OBJECTIVES AND QUALITY ASSURANCE PROGRAM
SFO\PGE_TOPOCK_QAPP_REV02_MAR-31-05.DOC 5-13
TABLE 5-6 Accuracy and Precision Limits for ICP/ICP-MS Metals
Analyte Method
LCS Accuracy
Water (% R)
MS/MSD Accuracy
Water (% R)
Precision
Water (% RPD)
Aluminum SW6010B/SW6020/EPA200.7/EPA200.8 85-115 75-125 ≤ 20
Antimony SW6010B/SW6020/EPA200.7/EPA200.8 85-115 75-125 ≤ 20
Arsenic SW6010B/SW6020/EPA200.7/EPA200.8 85-115 75-125 ≤ 20
Barium SW6010B/SW6020/EPA200.7/EPA200.8 85-115 75-125 ≤ 20
Beryllium SW6010B/SW6020/EPA200.7/EPA200.8 85-115 75-125 ≤ 20
Boron SW6010B//EPA200.7 85-115 75-125 ≤ 20
Calcium SW6010B/EPA200.7 85-115 75-125 ≤ 20
Cadmium SW6010B/SW6020/EPA200.7/EPA200.8 85-115 75-125 ≤ 20
Chromium SW6010B/SW6020/EPA200.7/EPA200.8 85-115 75-125 ≤ 20
Cobalt SW6010B/SW6020/EPA200.7/EPA200.8 85-115 75-125 ≤ 20
Copper SW6010B/SW6020/EPA200.7/EPA200.8 85-115 75-125 ≤ 20
Iron SW6010B/EPA200.7 85-115 75-125 ≤ 20
Lead SW6010B/SW6020/EPA200.7/EPA200.8 85-115 75-125 ≤ 20
Magnesium SW6010B/EPA200.7 85-115 75-125 ≤ 20
Manganese SW6010B/SW6020/EPA200.7/EPA200.8 85-115 75-125 ≤ 20
Molybdenum SW6010B/SW6020/EPA200.7/EPA200.8 85-115 75-125 ≤ 20
Nickel SW6010B/SW6020/EPA200.7/EPA200.8 85-115 75-125 ≤ 20
Potassium SW6010B/EPA200.7 85-115 75-125 ≤ 20
Selenium SW6010B/SW6020/EPA200.7/EPA200.8 85-115 75-125 ≤ 20
Silver SW6010B/SW6020/EPA200.7/EPA200.8 85-115 75-125 ≤ 20
Sodium SW6010B/EPA200.7 85-115 75-125 ≤ 20
Thallium SW6010B/SW6020/EPA200.7/EPA200.8 85-115 75-125 ≤ 20
Vanadium SW6010B/SW6020/EPA200.7/EPA200.8 85-115 75-125 ≤ 20
Zinc SW6010B/SW6020/EPA200.7/EPA200.8 85-115 75-125 ≤ 20
Notes: ICP = inductively coupled plasma ICP-MS = inductively coupled plasma mass spectrometry LCS = laboratory control sample MS/MSD = matrix spike/matrix spike duplicate R = Recovery RPD = Relative percent difference
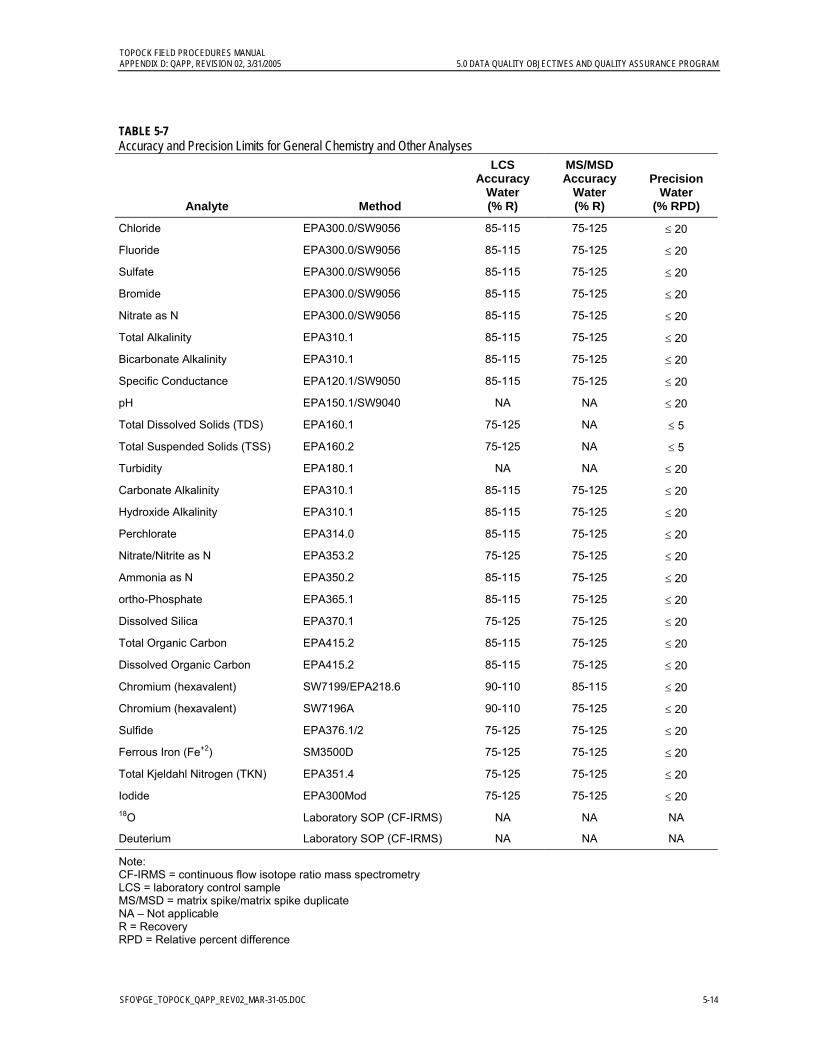
TOPOCK FIELD PROCEDURES MANUAL APPENDIX D: QAPP, REVISION 02, 3/31/2005 5.0 DATA QUALITY OBJECTIVES AND QUALITY ASSURANCE PROGRAM
SFO\PGE_TOPOCK_QAPP_REV02_MAR-31-05.DOC 5-14
TABLE 5-7 Accuracy and Precision Limits for General Chemistry and Other Analyses
Analyte Method
LCS Accuracy
Water (% R)
MS/MSD Accuracy
Water (% R)
Precision Water
(% RPD)
Chloride EPA300.0/SW9056 85-115 75-125 ≤ 20
Fluoride EPA300.0/SW9056 85-115 75-125 ≤ 20
Sulfate EPA300.0/SW9056 85-115 75-125 ≤ 20
Bromide EPA300.0/SW9056 85-115 75-125 ≤ 20
Nitrate as N EPA300.0/SW9056 85-115 75-125 ≤ 20
Total Alkalinity EPA310.1 85-115 75-125 ≤ 20
Bicarbonate Alkalinity EPA310.1 85-115 75-125 ≤ 20
Specific Conductance EPA120.1/SW9050 85-115 75-125 ≤ 20
pH EPA150.1/SW9040 NA NA ≤ 20
Total Dissolved Solids (TDS) EPA160.1 75-125 NA ≤ 5
Total Suspended Solids (TSS) EPA160.2 75-125 NA ≤ 5
Turbidity EPA180.1 NA NA ≤ 20
Carbonate Alkalinity EPA310.1 85-115 75-125 ≤ 20
Hydroxide Alkalinity EPA310.1 85-115 75-125 ≤ 20
Perchlorate EPA314.0 85-115 75-125 ≤ 20
Nitrate/Nitrite as N EPA353.2 75-125 75-125 ≤ 20
Ammonia as N EPA350.2 85-115 75-125 ≤ 20
ortho-Phosphate EPA365.1 85-115 75-125 ≤ 20
Dissolved Silica EPA370.1 75-125 75-125 ≤ 20
Total Organic Carbon EPA415.2 85-115 75-125 ≤ 20
Dissolved Organic Carbon EPA415.2 85-115 75-125 ≤ 20
Chromium (hexavalent) SW7199/EPA218.6 90-110 85-115 ≤ 20
Chromium (hexavalent) SW7196A 90-110 75-125 ≤ 20
Sulfide EPA376.1/2 75-125 75-125 ≤ 20
Ferrous Iron (Fe+2) SM3500D 75-125 75-125 ≤ 20
Total Kjeldahl Nitrogen (TKN) EPA351.4 75-125 75-125 ≤ 20
Iodide EPA300Mod 75-125 75-125 ≤ 20 18O Laboratory SOP (CF-IRMS) NA NA NA
Deuterium Laboratory SOP (CF-IRMS) NA NA NA
Note: CF-IRMS = continuous flow isotope ratio mass spectrometry LCS = laboratory control sample MS/MSD = matrix spike/matrix spike duplicate NA – Not applicable R = Recovery RPD = Relative percent difference
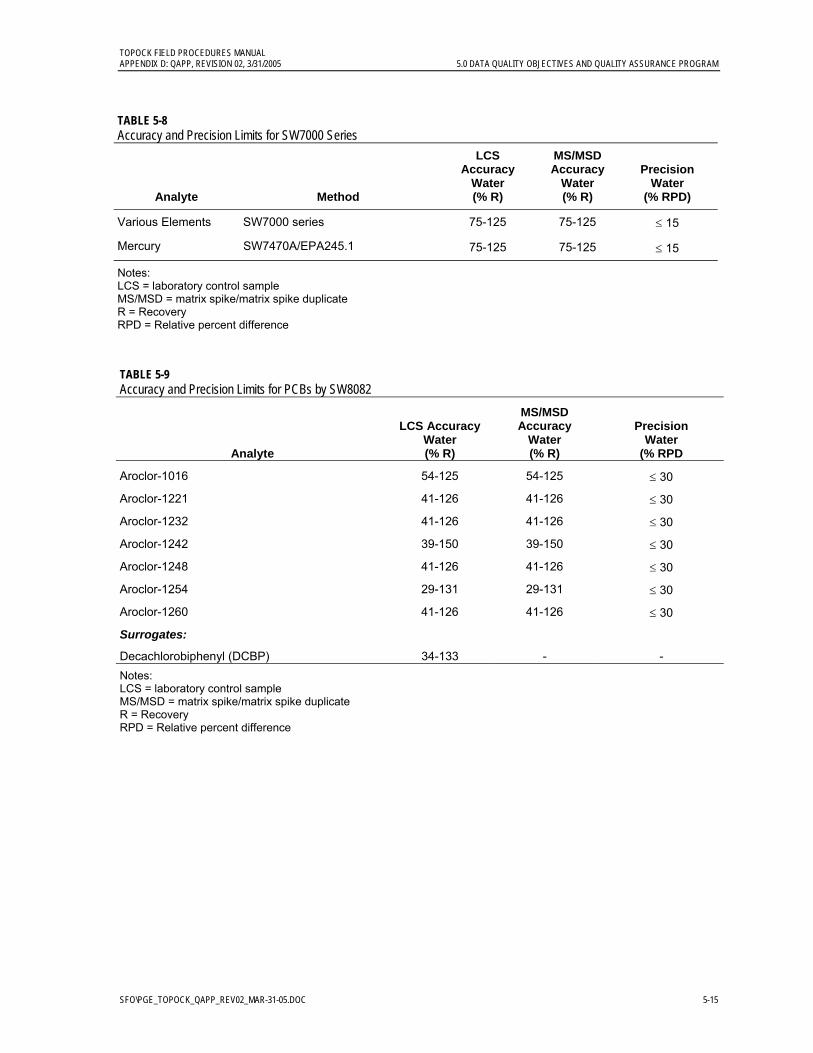
TOPOCK FIELD PROCEDURES MANUAL APPENDIX D: QAPP, REVISION 02, 3/31/2005 5.0 DATA QUALITY OBJECTIVES AND QUALITY ASSURANCE PROGRAM
SFO\PGE_TOPOCK_QAPP_REV02_MAR-31-05.DOC 5-15
TABLE 5-8 Accuracy and Precision Limits for SW7000 Series
Analyte Method
LCS Accuracy
Water (% R)
MS/MSD Accuracy
Water (% R)
Precision Water
(% RPD)
Various Elements SW7000 series 75-125 75-125 ≤ 15
Mercury SW7470A/EPA245.1 75-125 75-125 ≤ 15
Notes: LCS = laboratory control sample MS/MSD = matrix spike/matrix spike duplicate R = Recovery RPD = Relative percent difference TABLE 5-9 Accuracy and Precision Limits for PCBs by SW8082
Analyte
LCS AccuracyWater (% R)
MS/MSD Accuracy
Water (% R)
Precision Water
(% RPD
Aroclor-1016 54-125 54-125 ≤ 30
Aroclor-1221 41-126 41-126 ≤ 30
Aroclor-1232 41-126 41-126 ≤ 30
Aroclor-1242 39-150 39-150 ≤ 30
Aroclor-1248 41-126 41-126 ≤ 30
Aroclor-1254 29-131 29-131 ≤ 30
Aroclor-1260 41-126 41-126 ≤ 30
Surrogates:
Decachlorobiphenyl (DCBP) 34-133 - - Notes: LCS = laboratory control sample MS/MSD = matrix spike/matrix spike duplicate R = Recovery RPD = Relative percent difference

TOPOCK FIELD PROCEDURES MANUAL APPENDIX D: QAPP, REVISION 02, 3/31/2005 5.0 DATA QUALITY OBJECTIVES AND QUALITY ASSURANCE PROGRAM
SFO\PGE_TOPOCK_QAPP_REV02_MAR-31-05.DOC 5-16
TABLE 5-10 Accuracy and Precision Limits for Volatile Organic Compounds by SW8260B
Analyte
LCS Accuracy Water (%R)
MS/MSD Accuracy Water (%R)
Precision Water (%RPD)
1,1,1,2-Tetrachloroethane 75-125 ≤20 ≤20
1,1,1-Trichloroethane 67-132 ≤20 ≤20
1,1,2,2-Tetrachloroethane 74-125 ≤20 ≤20
1,1,2-Trichloroethane 75-127 ≤20 ≤20
1,1,2-Trichlorotrifluoroethane 75-125 ≤20 ≤20
1,1-Dichloroethane 69-133 ≤20 ≤20
1,1-Dichloroethene 75-125 ≤20 ≤20
1,2,3-Trichloropropane 73-124 ≤20 ≤20
1,2,4-Trichlorobenzene 66-134 ≤20 ≤20
1,2,4-Trimethylbenzene 74-132 ≤20 ≤20
1,2-Dibromo-3-Chloropropane 50-132 ≤20 ≤20
1,2-Dichlorobenzene 75-125 ≤20 ≤20
1,2-Dichloroethane 59-125 ≤20 ≤20
1,2-Dichloropropane 70-125 ≤20 ≤20
1,3,5-Trimethylbenzene 74-131 ≤20 ≤20
1,3-Dichlorobenzene 75-125 ≤20 ≤20
1,4-Dichlorobenzene 75-125 ≤20 ≤20
2-Butanone 49-136 ≤20 ≤20
2-Chlorotoluene 73-126 ≤20 ≤20
4-Methyl-2-Pentanone 58-134 ≤20 ≤20
Acetone 40-135 ≤20 ≤20
Acrolein 75-125 ≤20 ≤20
Acrylonitrile 75-125 ≤20 ≤20
Benzene 75-125 ≤20 ≤20
Bromobenzene 75-125 ≤20 ≤20
Bromodichloromethane 75-125 ≤20 ≤20
Bromoform 75-125 ≤20 ≤20
Bromomethane 72-125 ≤20 ≤20
Carbon Disulfide 75-125 ≤20 ≤20
Carbon Tetrachloride 62-125 ≤20 ≤20
Chlorobenzene 75-125 ≤20 ≤20
Chloroethane 58-133 ≤20 ≤20
Chloroform 69-128 ≤20 ≤20
Chloromethane 56-131 ≤20 ≤20

TOPOCK FIELD PROCEDURES MANUAL APPENDIX D: QAPP, REVISION 02, 3/31/2005 5.0 DATA QUALITY OBJECTIVES AND QUALITY ASSURANCE PROGRAM
SFO\PGE_TOPOCK_QAPP_REV02_MAR-31-05.DOC 5-17
TABLE 5-10 Accuracy and Precision Limits for Volatile Organic Compounds by SW8260B
Analyte
LCS Accuracy Water (%R)
MS/MSD Accuracy Water (%R)
Precision Water (%RPD)
Cis-1,2-Dichloroethene 75-125 75-125 ≤20
Dibromochloromethane 73-125 73-125 ≤20
Dichlorodifluoromethane 53-153 53-153 ≤20
Ethylbenzene 75-125 75-125 ≤20
Ethylene Dibromide 75-125 75-125 ≤20
Isopropylbenzene 75-125 75-125 ≤20
m,p-Xylene 75-125 75-125 ≤20
Methyl Tertiary Butyl Ether 65-123 65-123 ≤20
Methylene Chloride 75-125 75-125 ≤20
N-Butylbenzene 69-137 69-137 ≤20
N-Propylbenzene 72-129 72-129 ≤20
O-Xylene 75-125 75-125 ≤20
Sec-Butylbenzene 72-127 72-127 ≤20
Styrene 65-134 65-134 ≤20
Tert-Butylbenzene 70-129 70-129 ≤20
Tetrachloroethene 71-125 71-125 ≤20
Toluene 74-125 74-125 ≤20
Trans-1,2-Dichloroethene 75-125 75-125 ≤20
Trichloroethene 71-125 71-125 ≤20
Vinyl Chloride 46-134 46-134 ≤20
Xylene (Total) 75-125 75-125 ≤20
Surrogates (may choose 3 of 4)
Dibromofluoromethane 75-125 - -
4-Bromofluorobenzene 75-125 - -
Toluene-d8 81-120 - -
1,2-Dichloroethane-d4 62-139 - -
Internal Standards
Fluorobenzene - - -
1,4-dichlorobenzene-d4 - - -
Chlorobenzene-d5 - - - Notes: LCS = laboratory control sample MS/MSD = matrix spike/matrix spike duplicate R = Recovery RPD = Relative percent difference
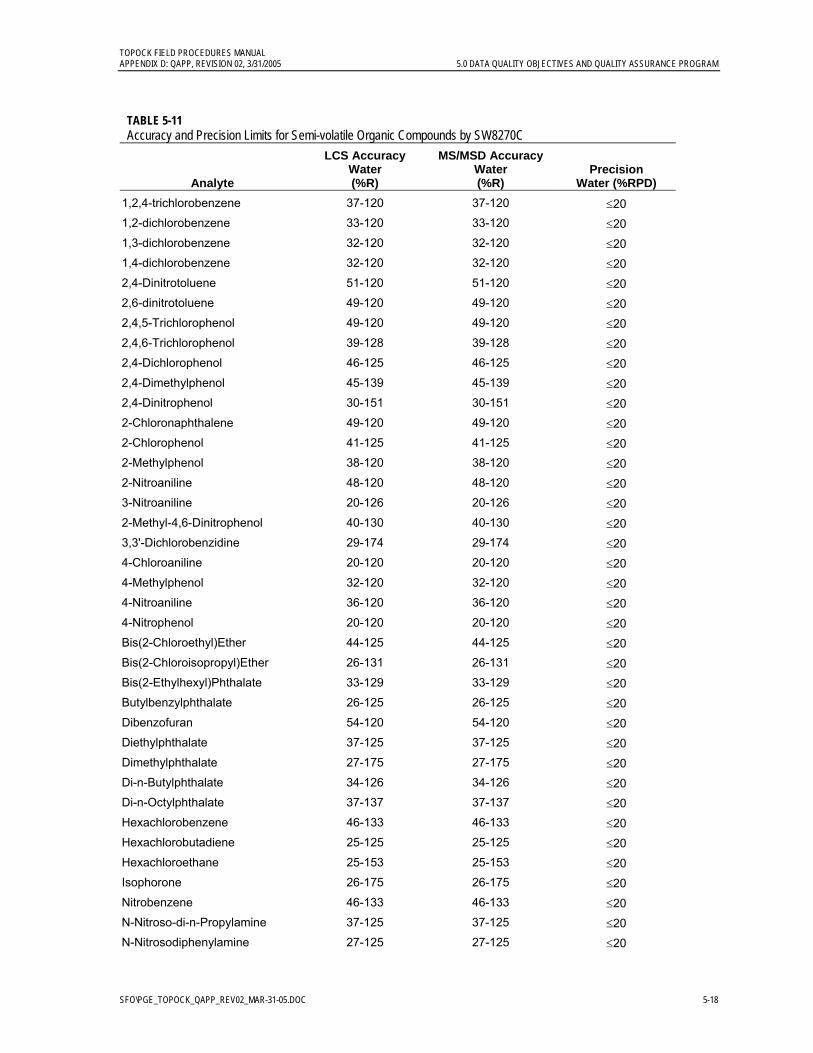
TOPOCK FIELD PROCEDURES MANUAL APPENDIX D: QAPP, REVISION 02, 3/31/2005 5.0 DATA QUALITY OBJECTIVES AND QUALITY ASSURANCE PROGRAM
SFO\PGE_TOPOCK_QAPP_REV02_MAR-31-05.DOC 5-18
TABLE 5-11 Accuracy and Precision Limits for Semi-volatile Organic Compounds by SW8270C
Analyte
LCS Accuracy Water (%R)
MS/MSD Accuracy Water (%R)
Precision Water (%RPD)
1,2,4-trichlorobenzene 37-120 37-120 ≤20 1,2-dichlorobenzene 33-120 33-120 ≤20 1,3-dichlorobenzene 32-120 32-120 ≤20 1,4-dichlorobenzene 32-120 32-120 ≤20 2,4-Dinitrotoluene 51-120 51-120 ≤20 2,6-dinitrotoluene 49-120 49-120 ≤20 2,4,5-Trichlorophenol 49-120 49-120 ≤20 2,4,6-Trichlorophenol 39-128 39-128 ≤20 2,4-Dichlorophenol 46-125 46-125 ≤20 2,4-Dimethylphenol 45-139 45-139 ≤20 2,4-Dinitrophenol 30-151 30-151 ≤20 2-Chloronaphthalene 49-120 49-120 ≤20 2-Chlorophenol 41-125 41-125 ≤20 2-Methylphenol 38-120 38-120 ≤20 2-Nitroaniline 48-120 48-120 ≤20 3-Nitroaniline 20-126 20-126 ≤20 2-Methyl-4,6-Dinitrophenol 40-130 40-130 ≤20 3,3'-Dichlorobenzidine 29-174 29-174 ≤20 4-Chloroaniline 20-120 20-120 ≤20 4-Methylphenol 32-120 32-120 ≤20 4-Nitroaniline 36-120 36-120 ≤20 4-Nitrophenol 20-120 20-120 ≤20 Bis(2-Chloroethyl)Ether 44-125 44-125 ≤20 Bis(2-Chloroisopropyl)Ether 26-131 26-131 ≤20 Bis(2-Ethylhexyl)Phthalate 33-129 33-129 ≤20 Butylbenzylphthalate 26-125 26-125 ≤20 Dibenzofuran 54-120 54-120 ≤20 Diethylphthalate 37-125 37-125 ≤20 Dimethylphthalate 27-175 27-175 ≤20 Di-n-Butylphthalate 34-126 34-126 ≤20 Di-n-Octylphthalate 37-137 37-137 ≤20 Hexachlorobenzene 46-133 46-133 ≤20 Hexachlorobutadiene 25-125 25-125 ≤20 Hexachloroethane 25-153 25-153 ≤20 Isophorone 26-175 26-175 ≤20 Nitrobenzene 46-133 46-133 ≤20 N-Nitroso-di-n-Propylamine 37-125 37-125 ≤20 N-Nitrosodiphenylamine 27-125 27-125 ≤20
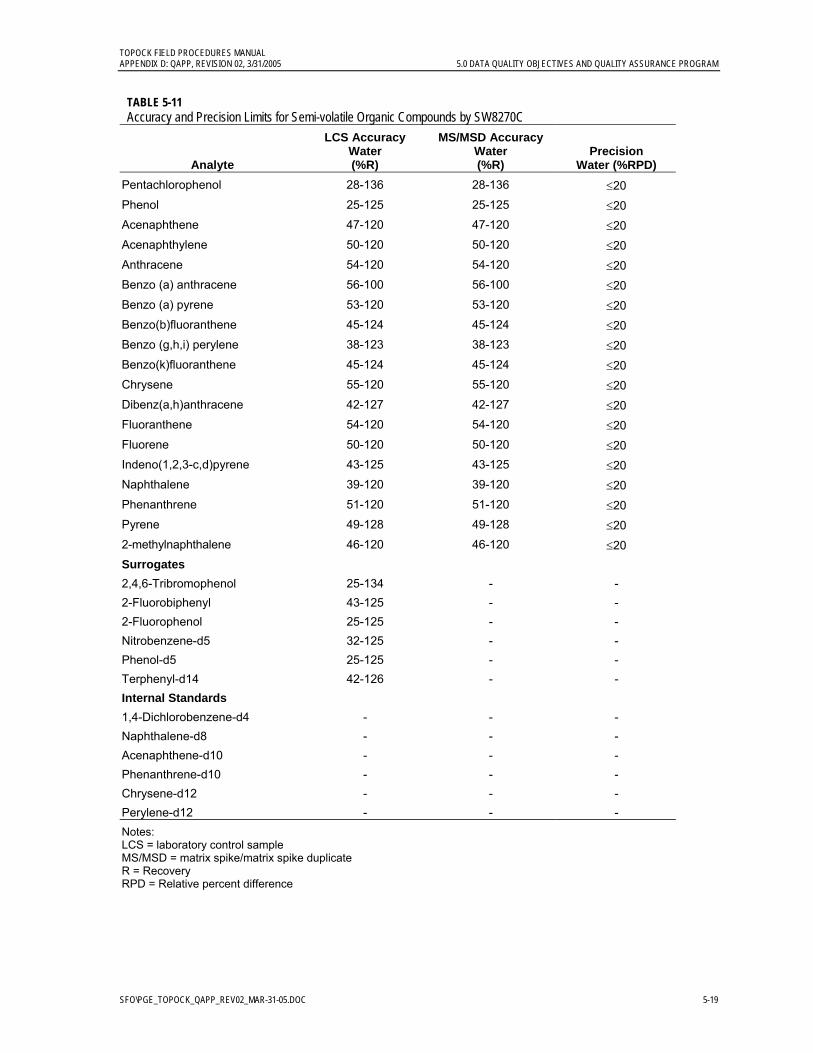
TOPOCK FIELD PROCEDURES MANUAL APPENDIX D: QAPP, REVISION 02, 3/31/2005 5.0 DATA QUALITY OBJECTIVES AND QUALITY ASSURANCE PROGRAM
SFO\PGE_TOPOCK_QAPP_REV02_MAR-31-05.DOC 5-19
TABLE 5-11 Accuracy and Precision Limits for Semi-volatile Organic Compounds by SW8270C
Analyte
LCS Accuracy Water (%R)
MS/MSD Accuracy Water (%R)
Precision Water (%RPD)
Pentachlorophenol 28-136 28-136 ≤20 Phenol 25-125 25-125 ≤20 Acenaphthene 47-120 47-120 ≤20 Acenaphthylene 50-120 50-120 ≤20 Anthracene 54-120 54-120 ≤20 Benzo (a) anthracene 56-100 56-100 ≤20 Benzo (a) pyrene 53-120 53-120 ≤20 Benzo(b)fluoranthene 45-124 45-124 ≤20 Benzo (g,h,i) perylene 38-123 38-123 ≤20 Benzo(k)fluoranthene 45-124 45-124 ≤20 Chrysene 55-120 55-120 ≤20 Dibenz(a,h)anthracene 42-127 42-127 ≤20 Fluoranthene 54-120 54-120 ≤20 Fluorene 50-120 50-120 ≤20 Indeno(1,2,3-c,d)pyrene 43-125 43-125 ≤20 Naphthalene 39-120 39-120 ≤20 Phenanthrene 51-120 51-120 ≤20 Pyrene 49-128 49-128 ≤20 2-methylnaphthalene 46-120 46-120 ≤20 Surrogates 2,4,6-Tribromophenol 25-134 - - 2-Fluorobiphenyl 43-125 - - 2-Fluorophenol 25-125 - - Nitrobenzene-d5 32-125 - - Phenol-d5 25-125 - - Terphenyl-d14 42-126 - - Internal Standards 1,4-Dichlorobenzene-d4 - - - Naphthalene-d8 - - - Acenaphthene-d10 - - - Phenanthrene-d10 - - - Chrysene-d12 - - - Perylene-d12 - - - Notes: LCS = laboratory control sample MS/MSD = matrix spike/matrix spike duplicate R = Recovery RPD = Relative percent difference

TOPOCK FIELD PROCEDURES MANUAL APPENDIX D: QAPP, REVISION 02, 3/31/2005 5.0 DATA QUALITY OBJECTIVES AND QUALITY ASSURANCE PROGRAM
SFO\PGE_TOPOCK_QAPP_REV02_MAR-31-05.DOC 5-20
TABLE 5-12 Calibration and QC Requirements for SW6020/EPA200.8
QC Check Frequency Criteria Corrective Action
Initial calibration (a blank and at least one standard)
Before initial sample analysis, every 24 hours, whenever modifications are made to the analytical system, or when continuing calibration verification fails
N/A N/A
Second-source calibration verification
Immediately following each initial calibration
All analytes within ±10% of expected value
Correct problem and repeat initial calibration.
Calibration blank After every Second-source or Continuing calibration verification analysis
No analytes detected at or above the reporting limit
Correct the problem, then reanalyze previous 10 samples.
Continuing calibration verification
After every 10 samples and at the end of the analysis sequence
All analytes within ±10% of expected value
Recalibrate and reanalyze all samples since the last acceptable continuing calibration verification
Method Blank At least one per analytical batch
No analytes detected at or above the reporting limit
Correct the problem and re-prep and reanalyze all associated samples
Interference check standard (ICS)
At the start and end of each analytical sequence or twice during an 8-hour period, whichever is more frequent
All analytes within ±20% of expected value
Correct the problem, recalibrate, reanalyze ICS and all affected samples.
MS/MSD One set per 20 project-specific samples. MSD is optional if a laboratory sample duplicate is performed.
All analytes within limits specified in Table 5-6
None
Laboratory sample duplicate
Once per analytical batch if MSD not performed
Concentration of reported analytes are > 5 times the reporting limit in either sample and RPD >20%.
One sample result < RL and a difference of ±2 times the reporting limit
None
Laboratory control sample (LCS)
At least one per analytical batch
All analytes within limits specified in Table 5-6
Correct the problem, and re-prep and reanalyze the LCS and all samples in the analytical batch.
Dilution test Each new sample matrix Result from 1:5 dilution must be within ±10% of the undiluted sample result (applies only if undiluted sample result is at least 25 times the reporting limit)
Perform post-digestion spike addition.
Post-digestion spike addition
When dilution test fails Recovery within 75-125% of expected value
None
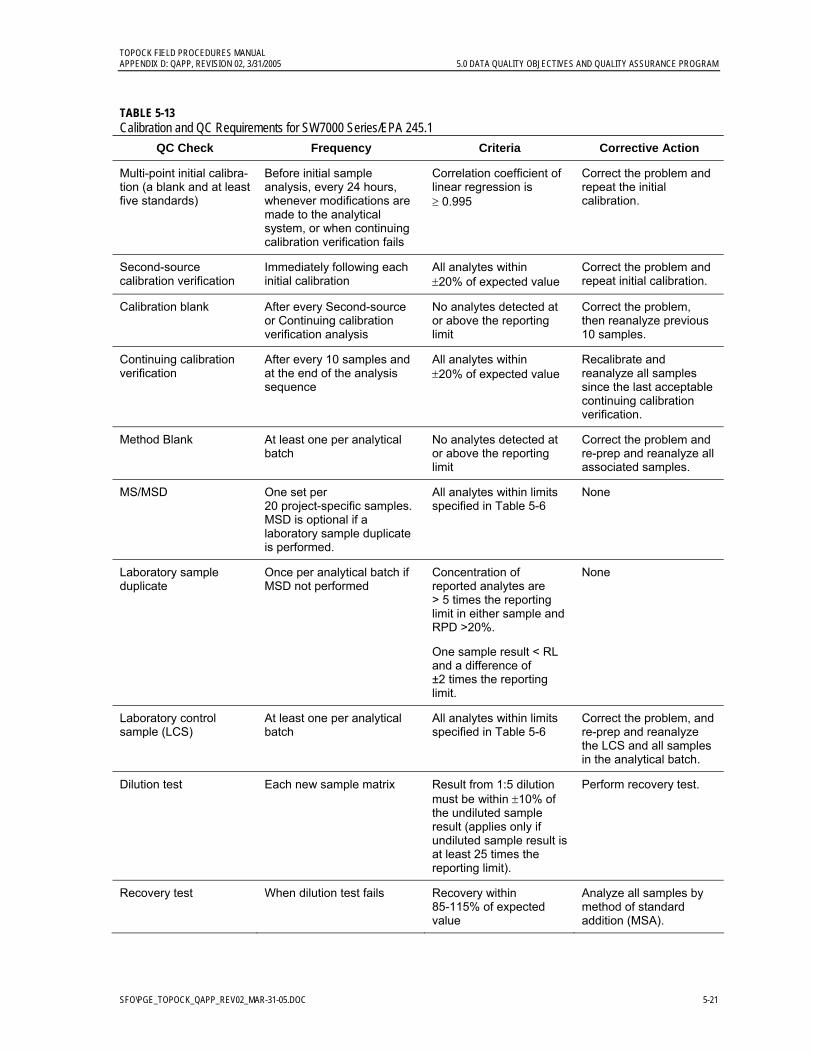
TOPOCK FIELD PROCEDURES MANUAL APPENDIX D: QAPP, REVISION 02, 3/31/2005 5.0 DATA QUALITY OBJECTIVES AND QUALITY ASSURANCE PROGRAM
SFO\PGE_TOPOCK_QAPP_REV02_MAR-31-05.DOC 5-21
TABLE 5-13 Calibration and QC Requirements for SW7000 Series/EPA 245.1
QC Check Frequency Criteria Corrective Action
Multi-point initial calibra-tion (a blank and at least five standards)
Before initial sample analysis, every 24 hours, whenever modifications are made to the analytical system, or when continuing calibration verification fails
Correlation coefficient of linear regression is ≥ 0.995
Correct the problem and repeat the initial calibration.
Second-source calibration verification
Immediately following each initial calibration
All analytes within ±20% of expected value
Correct the problem and repeat initial calibration.
Calibration blank After every Second-source or Continuing calibration verification analysis
No analytes detected at or above the reporting limit
Correct the problem, then reanalyze previous 10 samples.
Continuing calibration verification
After every 10 samples and at the end of the analysis sequence
All analytes within ±20% of expected value
Recalibrate and reanalyze all samples since the last acceptable continuing calibration verification.
Method Blank At least one per analytical batch
No analytes detected at or above the reporting limit
Correct the problem and re-prep and reanalyze all associated samples.
MS/MSD One set per 20 project-specific samples. MSD is optional if a laboratory sample duplicate is performed.
All analytes within limits specified in Table 5-6
None
Laboratory sample duplicate
Once per analytical batch if MSD not performed
Concentration of reported analytes are > 5 times the reporting limit in either sample and RPD >20%.
One sample result < RL and a difference of ±2 times the reporting limit.
None
Laboratory control sample (LCS)
At least one per analytical batch
All analytes within limits specified in Table 5-6
Correct the problem, and re-prep and reanalyze the LCS and all samples in the analytical batch.
Dilution test Each new sample matrix Result from 1:5 dilution must be within ±10% of the undiluted sample result (applies only if undiluted sample result is at least 25 times the reporting limit).
Perform recovery test.
Recovery test When dilution test fails Recovery within 85-115% of expected value
Analyze all samples by method of standard addition (MSA).
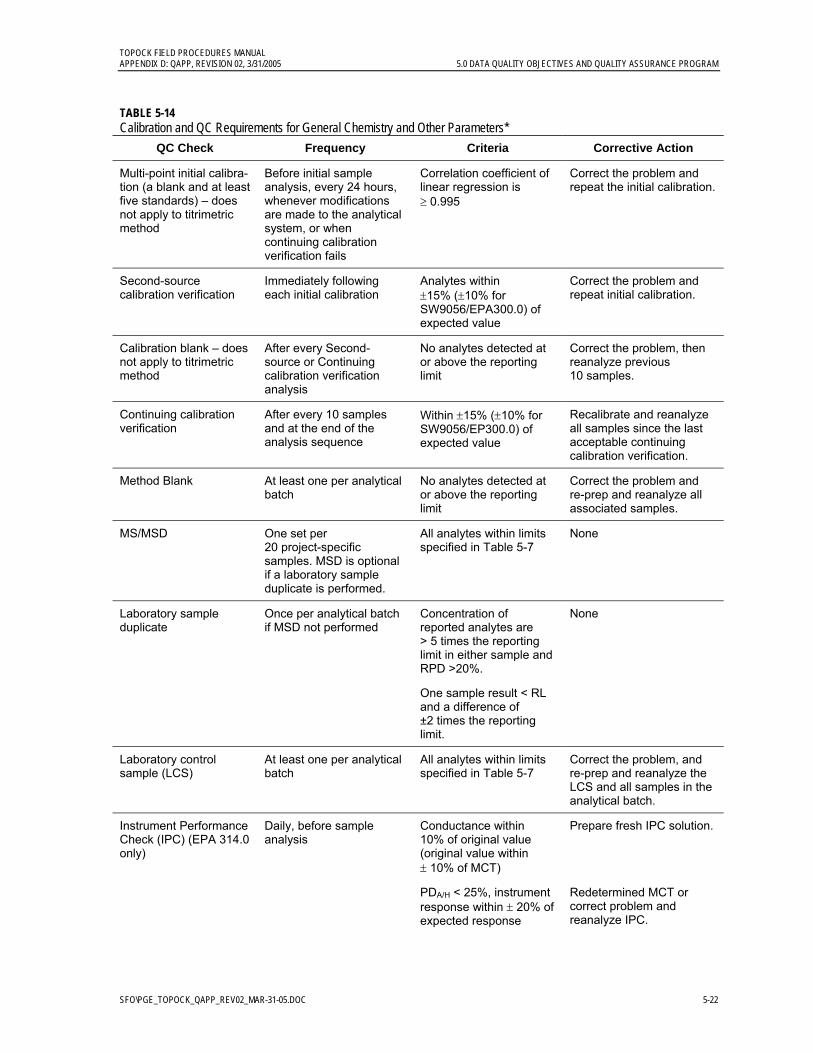
TOPOCK FIELD PROCEDURES MANUAL APPENDIX D: QAPP, REVISION 02, 3/31/2005 5.0 DATA QUALITY OBJECTIVES AND QUALITY ASSURANCE PROGRAM
SFO\PGE_TOPOCK_QAPP_REV02_MAR-31-05.DOC 5-22
TABLE 5-14 Calibration and QC Requirements for General Chemistry and Other Parameters*
QC Check Frequency Criteria Corrective Action
Multi-point initial calibra-tion (a blank and at least five standards) – does not apply to titrimetric method
Before initial sample analysis, every 24 hours, whenever modifications are made to the analytical system, or when continuing calibration verification fails
Correlation coefficient of linear regression is ≥ 0.995
Correct the problem and repeat the initial calibration.
Second-source calibration verification
Immediately following each initial calibration
Analytes within ±15% (±10% for SW9056/EPA300.0) of expected value
Correct the problem and repeat initial calibration.
Calibration blank – does not apply to titrimetric method
After every Second-source or Continuing calibration verification analysis
No analytes detected at or above the reporting limit
Correct the problem, then reanalyze previous 10 samples.
Continuing calibration verification
After every 10 samples and at the end of the analysis sequence
Within ±15% (±10% for SW9056/EP300.0) of expected value
Recalibrate and reanalyze all samples since the last acceptable continuing calibration verification.
Method Blank At least one per analytical batch
No analytes detected at or above the reporting limit
Correct the problem and re-prep and reanalyze all associated samples.
MS/MSD One set per 20 project-specific samples. MSD is optional if a laboratory sample duplicate is performed.
All analytes within limits specified in Table 5-7
None
Laboratory sample duplicate
Once per analytical batch if MSD not performed
Concentration of reported analytes are > 5 times the reporting limit in either sample and RPD >20%.
One sample result < RL and a difference of ±2 times the reporting limit.
None
Laboratory control sample (LCS)
At least one per analytical batch
All analytes within limits specified in Table 5-7
Correct the problem, and re-prep and reanalyze the LCS and all samples in the analytical batch.
Instrument Performance Check (IPC) (EPA 314.0 only)
Daily, before sample analysis
Conductance within 10% of original value (original value within ± 10% of MCT)
Prepare fresh IPC solution.
PDA/H < 25%, instrument response within ± 20% of expected response
Redetermined MCT or correct problem and reanalyze IPC.
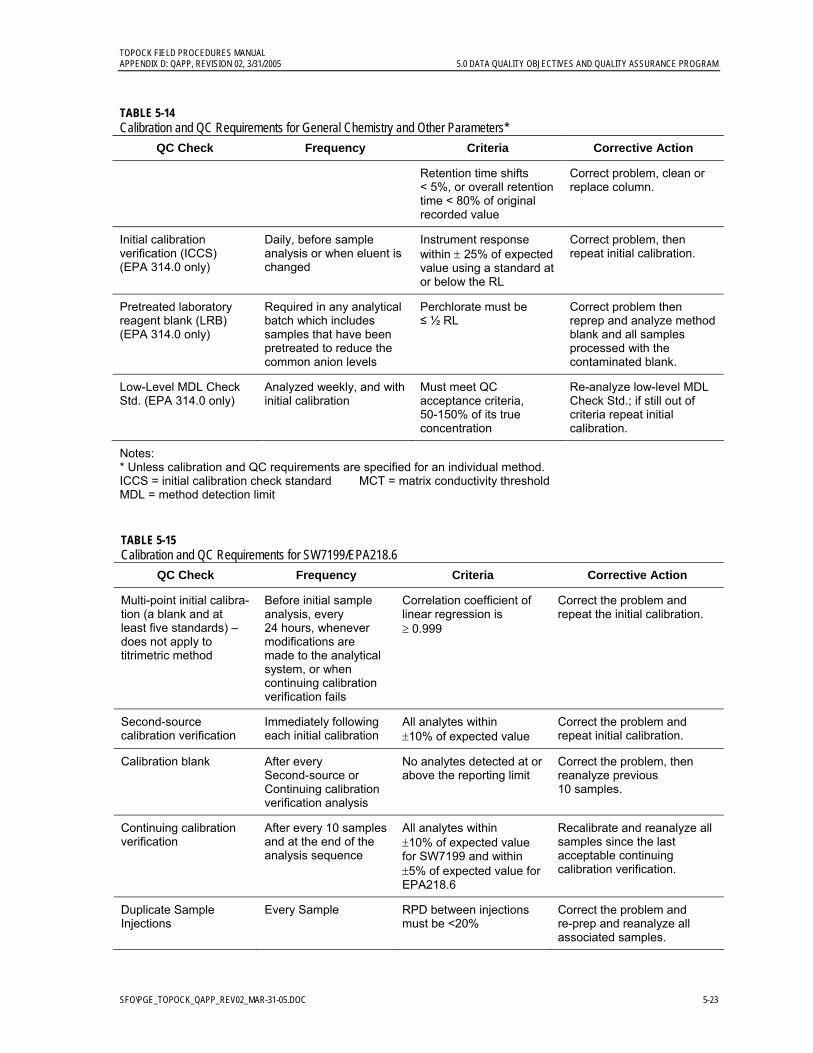
TOPOCK FIELD PROCEDURES MANUAL APPENDIX D: QAPP, REVISION 02, 3/31/2005 5.0 DATA QUALITY OBJECTIVES AND QUALITY ASSURANCE PROGRAM
SFO\PGE_TOPOCK_QAPP_REV02_MAR-31-05.DOC 5-23
TABLE 5-14 Calibration and QC Requirements for General Chemistry and Other Parameters*
QC Check Frequency Criteria Corrective Action
Retention time shifts < 5%, or overall retention time < 80% of original recorded value
Correct problem, clean or replace column.
Initial calibration verification (ICCS) (EPA 314.0 only)
Daily, before sample analysis or when eluent is changed
Instrument response within ± 25% of expected value using a standard at or below the RL
Correct problem, then repeat initial calibration.
Pretreated laboratory reagent blank (LRB) (EPA 314.0 only)
Required in any analytical batch which includes samples that have been pretreated to reduce the common anion levels
Perchlorate must be ≤ ½ RL
Correct problem then reprep and analyze method blank and all samples processed with the contaminated blank.
Low-Level MDL Check Std. (EPA 314.0 only)
Analyzed weekly, and with initial calibration
Must meet QC acceptance criteria, 50-150% of its true concentration
Re-analyze low-level MDL Check Std.; if still out of criteria repeat initial calibration.
Notes: * Unless calibration and QC requirements are specified for an individual method. ICCS = initial calibration check standard MCT = matrix conductivity threshold MDL = method detection limit
TABLE 5-15 Calibration and QC Requirements for SW7199/EPA218.6
QC Check Frequency Criteria Corrective Action
Multi-point initial calibra-tion (a blank and at least five standards) – does not apply to titrimetric method
Before initial sample analysis, every 24 hours, whenever modifications are made to the analytical system, or when continuing calibration verification fails
Correlation coefficient of linear regression is ≥ 0.999
Correct the problem and repeat the initial calibration.
Second-source calibration verification
Immediately following each initial calibration
All analytes within ±10% of expected value
Correct the problem and repeat initial calibration.
Calibration blank After every Second-source or Continuing calibration verification analysis
No analytes detected at or above the reporting limit
Correct the problem, then reanalyze previous 10 samples.
Continuing calibration verification
After every 10 samples and at the end of the analysis sequence
All analytes within ±10% of expected value for SW7199 and within ±5% of expected value for EPA218.6
Recalibrate and reanalyze all samples since the last acceptable continuing calibration verification.
Duplicate Sample Injections
Every Sample RPD between injections must be <20%
Correct the problem and re-prep and reanalyze all associated samples.
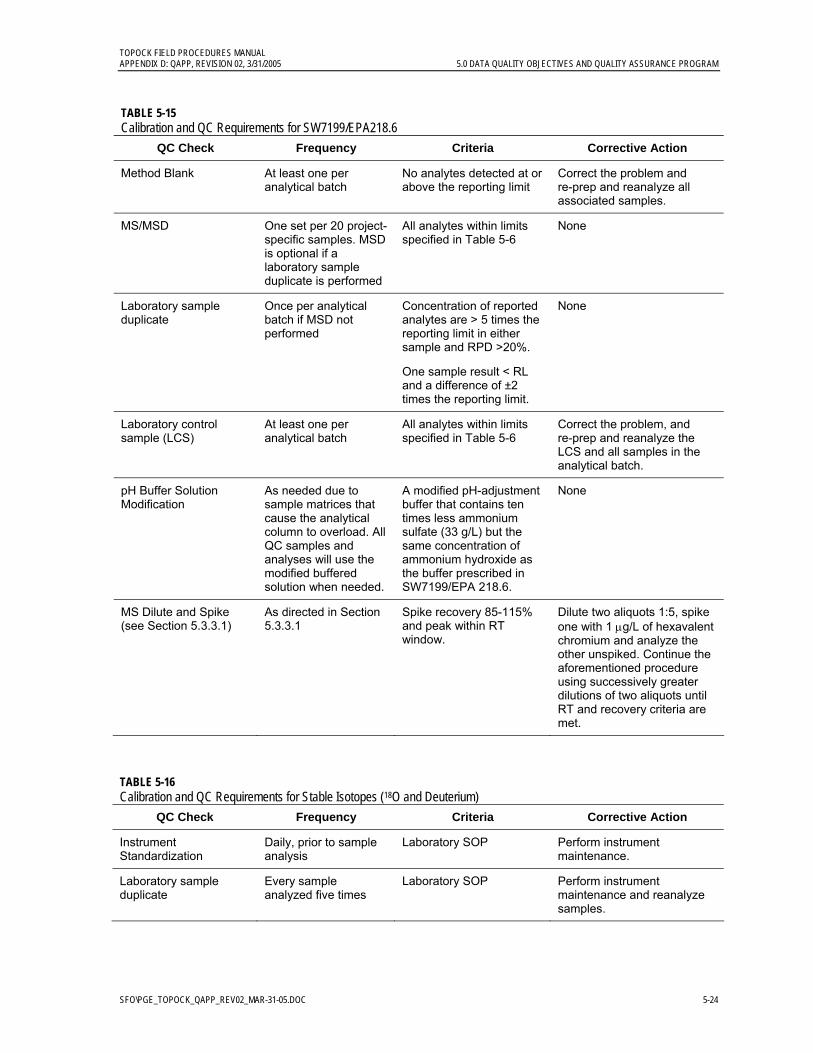
TOPOCK FIELD PROCEDURES MANUAL APPENDIX D: QAPP, REVISION 02, 3/31/2005 5.0 DATA QUALITY OBJECTIVES AND QUALITY ASSURANCE PROGRAM
SFO\PGE_TOPOCK_QAPP_REV02_MAR-31-05.DOC 5-24
TABLE 5-15 Calibration and QC Requirements for SW7199/EPA218.6
QC Check Frequency Criteria Corrective Action
Method Blank At least one per analytical batch
No analytes detected at or above the reporting limit
Correct the problem and re-prep and reanalyze all associated samples.
MS/MSD One set per 20 project-specific samples. MSD is optional if a laboratory sample duplicate is performed
All analytes within limits specified in Table 5-6
None
Laboratory sample duplicate
Once per analytical batch if MSD not performed
Concentration of reported analytes are > 5 times the reporting limit in either sample and RPD >20%.
One sample result < RL and a difference of ±2 times the reporting limit.
None
Laboratory control sample (LCS)
At least one per analytical batch
All analytes within limits specified in Table 5-6
Correct the problem, and re-prep and reanalyze the LCS and all samples in the analytical batch.
pH Buffer Solution Modification
As needed due to sample matrices that cause the analytical column to overload. All QC samples and analyses will use the modified buffered solution when needed.
A modified pH-adjustment buffer that contains ten times less ammonium sulfate (33 g/L) but the same concentration of ammonium hydroxide as the buffer prescribed in SW7199/EPA 218.6.
None
MS Dilute and Spike (see Section 5.3.3.1)
As directed in Section 5.3.3.1
Spike recovery 85-115% and peak within RT window.
Dilute two aliquots 1:5, spike one with 1 µg/L of hexavalent chromium and analyze the other unspiked. Continue the aforementioned procedure using successively greater dilutions of two aliquots until RT and recovery criteria are met.
TABLE 5-16 Calibration and QC Requirements for Stable Isotopes (18O and Deuterium)
QC Check Frequency Criteria Corrective Action
Instrument Standardization
Daily, prior to sample analysis
Laboratory SOP Perform instrument maintenance.
Laboratory sample duplicate
Every sample analyzed five times
Laboratory SOP Perform instrument maintenance and reanalyze samples.
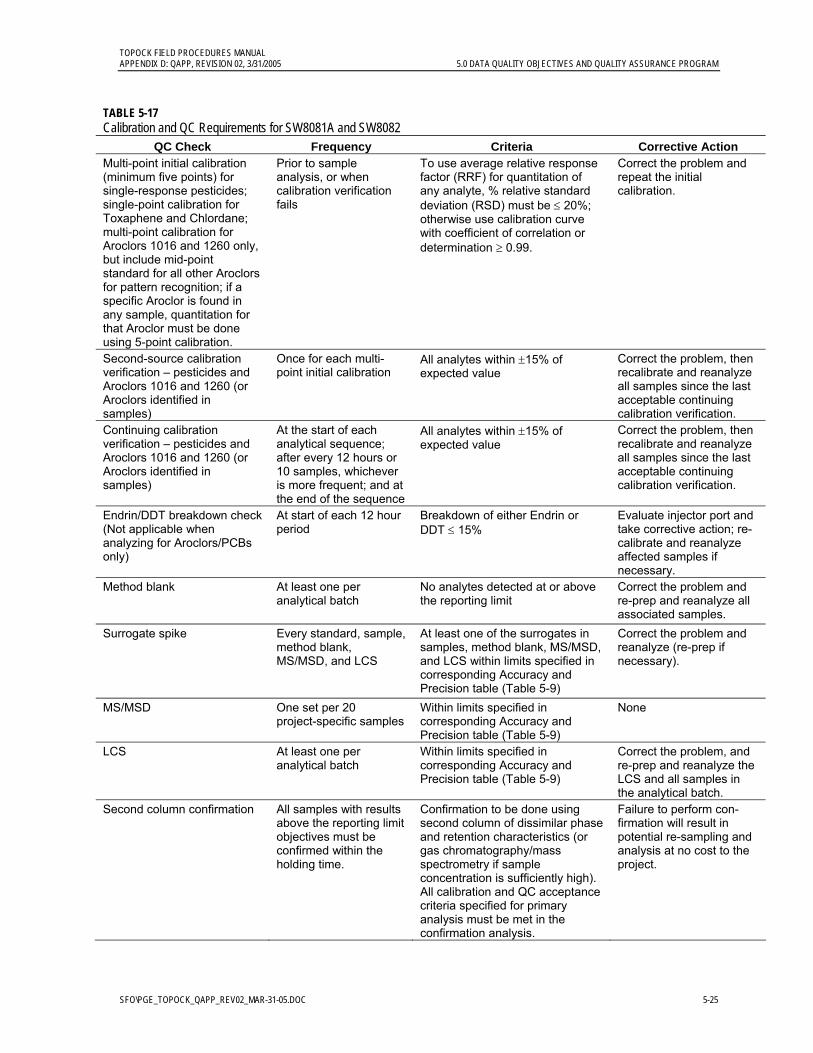
TOPOCK FIELD PROCEDURES MANUAL APPENDIX D: QAPP, REVISION 02, 3/31/2005 5.0 DATA QUALITY OBJECTIVES AND QUALITY ASSURANCE PROGRAM
SFO\PGE_TOPOCK_QAPP_REV02_MAR-31-05.DOC 5-25
TABLE 5-17 Calibration and QC Requirements for SW8081A and SW8082
QC Check Frequency Criteria Corrective Action Multi-point initial calibration (minimum five points) for single-response pesticides; single-point calibration for Toxaphene and Chlordane; multi-point calibration for Aroclors 1016 and 1260 only, but include mid-point standard for all other Aroclors for pattern recognition; if a specific Aroclor is found in any sample, quantitation for that Aroclor must be done using 5-point calibration.
Prior to sample analysis, or when calibration verification fails
To use average relative response factor (RRF) for quantitation of any analyte, % relative standard deviation (RSD) must be ≤ 20%; otherwise use calibration curve with coefficient of correlation or determination ≥ 0.99.
Correct the problem and repeat the initial calibration.
Second-source calibration verification – pesticides and Aroclors 1016 and 1260 (or Aroclors identified in samples)
Once for each multi-point initial calibration
All analytes within ±15% of expected value
Correct the problem, then recalibrate and reanalyze all samples since the last acceptable continuing calibration verification.
Continuing calibration verification – pesticides and Aroclors 1016 and 1260 (or Aroclors identified in samples)
At the start of each analytical sequence; after every 12 hours or 10 samples, whichever is more frequent; and at the end of the sequence
All analytes within ±15% of expected value
Correct the problem, then recalibrate and reanalyze all samples since the last acceptable continuing calibration verification.
Endrin/DDT breakdown check (Not applicable when analyzing for Aroclors/PCBs only)
At start of each 12 hour period
Breakdown of either Endrin or DDT ≤ 15%
Evaluate injector port and take corrective action; re-calibrate and reanalyze affected samples if necessary.
Method blank At least one per analytical batch
No analytes detected at or above the reporting limit
Correct the problem and re-prep and reanalyze all associated samples.
Surrogate spike Every standard, sample, method blank, MS/MSD, and LCS
At least one of the surrogates in samples, method blank, MS/MSD, and LCS within limits specified in corresponding Accuracy and Precision table (Table 5-9)
Correct the problem and reanalyze (re-prep if necessary).
MS/MSD One set per 20 project-specific samples
Within limits specified in corresponding Accuracy and Precision table (Table 5-9)
None
LCS At least one per analytical batch
Within limits specified in corresponding Accuracy and Precision table (Table 5-9)
Correct the problem, and re-prep and reanalyze the LCS and all samples in the analytical batch.
Second column confirmation All samples with results above the reporting limit objectives must be confirmed within the holding time.
Confirmation to be done using second column of dissimilar phase and retention characteristics (or gas chromatography/mass spectrometry if sample concentration is sufficiently high). All calibration and QC acceptance criteria specified for primary analysis must be met in the confirmation analysis.
Failure to perform con-firmation will result in potential re-sampling and analysis at no cost to the project.
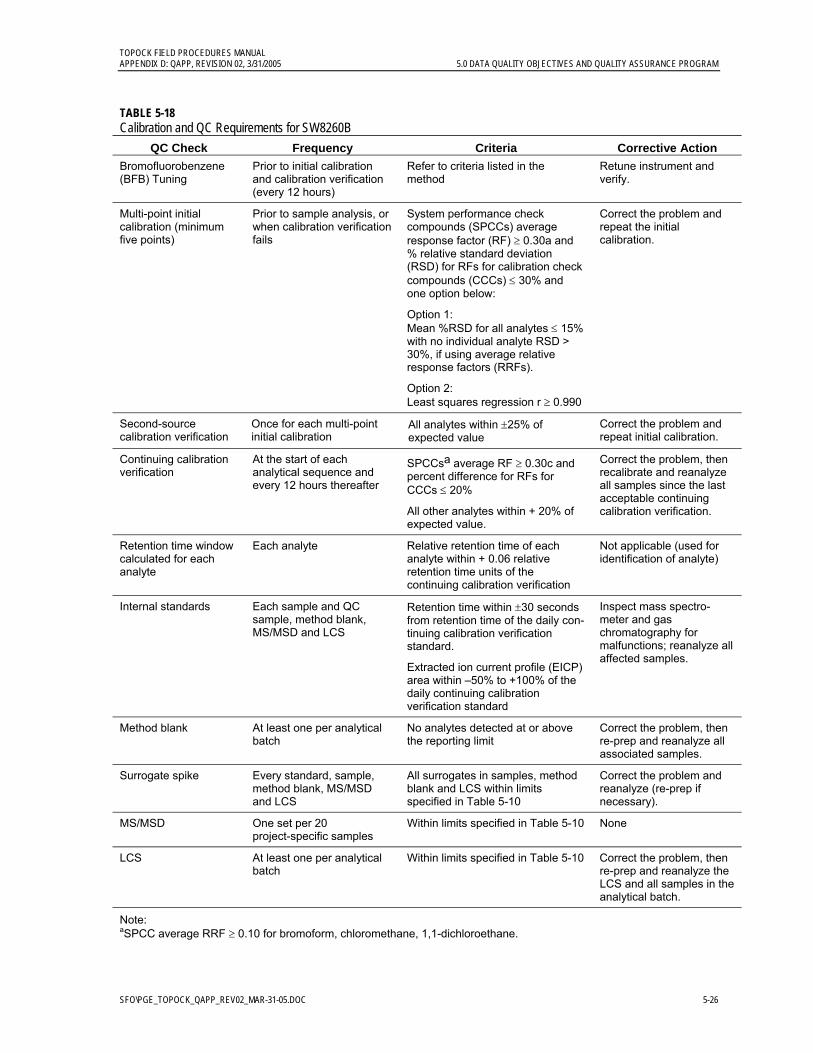
TOPOCK FIELD PROCEDURES MANUAL APPENDIX D: QAPP, REVISION 02, 3/31/2005 5.0 DATA QUALITY OBJECTIVES AND QUALITY ASSURANCE PROGRAM
SFO\PGE_TOPOCK_QAPP_REV02_MAR-31-05.DOC 5-26
TABLE 5-18 Calibration and QC Requirements for SW8260B
QC Check Frequency Criteria Corrective Action Bromofluorobenzene (BFB) Tuning
Prior to initial calibration and calibration verification (every 12 hours)
Refer to criteria listed in the method
Retune instrument and verify.
System performance check compounds (SPCCs) average response factor (RF) ≥ 0.30a and % relative standard deviation (RSD) for RFs for calibration check compounds (CCCs) ≤ 30% and one option below:
Option 1: Mean %RSD for all analytes ≤ 15% with no individual analyte RSD > 30%, if using average relative response factors (RRFs).
Multi-point initial calibration (minimum five points)
Prior to sample analysis, or when calibration verification fails
Option 2: Least squares regression r ≥ 0.990
Correct the problem and repeat the initial calibration.
Second-source calibration verification
Once for each multi-point initial calibration
All analytes within ±25% of expected value
Correct the problem and repeat initial calibration.
Continuing calibration verification
At the start of each analytical sequence and every 12 hours thereafter
SPCCsa average RF ≥ 0.30c and percent difference for RFs for CCCs ≤ 20%
All other analytes within + 20% of expected value.
Correct the problem, then recalibrate and reanalyze all samples since the last acceptable continuing calibration verification.
Retention time window calculated for each analyte
Each analyte Relative retention time of each analyte within + 0.06 relative retention time units of the continuing calibration verification
Not applicable (used for identification of analyte)
Internal standards Each sample and QC sample, method blank, MS/MSD and LCS
Retention time within ±30 seconds from retention time of the daily con-tinuing calibration verification standard.
Extracted ion current profile (EICP) area within –50% to +100% of the daily continuing calibration verification standard
Inspect mass spectro-meter and gas chromatography for malfunctions; reanalyze all affected samples.
Method blank At least one per analytical batch
No analytes detected at or above the reporting limit
Correct the problem, then re-prep and reanalyze all associated samples.
Surrogate spike Every standard, sample, method blank, MS/MSD and LCS
All surrogates in samples, method blank and LCS within limits specified in Table 5-10
Correct the problem and reanalyze (re-prep if necessary).
MS/MSD One set per 20 project-specific samples
Within limits specified in Table 5-10 None
LCS At least one per analytical batch
Within limits specified in Table 5-10 Correct the problem, then re-prep and reanalyze the LCS and all samples in the analytical batch.
Note: aSPCC average RRF ≥ 0.10 for bromoform, chloromethane, 1,1-dichloroethane.

TOPOCK FIELD PROCEDURES MANUAL APPENDIX D: QAPP, REVISION 02, 3/31/2005 5.0 DATA QUALITY OBJECTIVES AND QUALITY ASSURANCE PROGRAM
SFO\PGE_TOPOCK_QAPP_REV02_MAR-31-05.DOC 5-27
TABLE 5-19 Calibration and QC Requirements for SW8270C
QC Check Frequency Criteria Corrective Action
Decafluorotriphenyl-phosphine (DFTPP) Tuning
Prior to initial calibration and calibration verification (every 12 hours)
Refer to criteria listed in the method
Retune instrument and verify.
System performance check compounds (SPCCs) average response factor (RF) ≥ 0.050 and % relative standard deviation (RSD) for RFs for calibration check compounds (CCCs) ≤ 30% and one option below:
Option 1: Mean %RSD for all analytes ≤ 15% with no individual analyte RSD > 30%, if using average relative response factors (RRFs)
Multi-point initial calibration (minimum five points)
Prior to sample analysis, or when calibration verification fails
Option 2: Least squares regression r ≥ 0.990
Correct the problem and repeat the initial calibration.
Second-source calibration verification
Once for each multi-point initial calibration
All analytes within ±25% of expected value
Correct the problem and repeat initial calibration.
Continuing calibration verification
At the start of each analytical sequence and every 12 hours thereafter
SPCCs average RF ≥ 0.050 and percent difference for RFs for CCCs ≤ 20%.
All other analytes within + 20% of expected value.
Correct the problem, then recalibrate and reanalyze all samples since the last acceptable continuing calibration verification.
Retention time window calculated for each analyte
Each analyte Relative retention time of each analyte within + 0.06 relative retention time units of the continuing calibration verification
Not applicable (used for identification of analyte)
Internal standards Each sample and QC sample, method blank, MS/MSD and LCS
Retention time within ±30 seconds from retention time of the daily continuing calibration verification standard.
Extracted ion current profile (EICP) area within –50% to +100% of the daily continuing calibration verification standard.
Inspect mass spectrometer and gas chromatography for malfunctions; reanalyze all affected samples.
Method blank At least one per analytical batch
No analytes detected at or above the reporting limit
Correct the problem, then re-prep and reanalyze all associated samples.
Surrogate spike Every standard, sample, method blank, MS/MSD and LCS
At least two surrogates per fraction in samples, method blank and LCS within limits specified in Table 5-11
Correct the problem and reanalyze (re-prep if necessary).
MS/MSD One set per 20 project-specific samples
Within limits specified in Table 5-11 None
LCS At least one per analytical batch
Within limits specified in Table 5-11 Correct the problem, then re-prep and reanalyze the LCS and all samples in the analytical batch.
SFO\PGE_TOPOCK_QAPP_REV02_MAR-31-05.DOC 6-1
6.0 Calibration Procedures and Frequency
6.1 Field Calibration Procedures Section 4 of this Procedures Manual addresses the field calibration requirements specific to water quality sampling activities. Refer to SOP-A9 (Appendix A) for the specific field instrument calibration procedures.
6.2 Laboratory Calibration Procedures Qualified personnel will appropriately calibrate laboratory instruments prior to sample analysis. The requirements specified in each method will be followed. Only certified standards of known purity may be used for calibration. Calibration will be verified at specified intervals throughout the analysis. The frequency and acceptance criteria for calibration are specified for each analytical method in Tables 5-12 through 5-19. When multi-point calibration is specified, the concentrations of the calibration standards should bracket those expected in the samples. Samples must be diluted, if necessary, to bring analyte responses within the calibration range. The laboratory may only report those data that result from quantitation within the demonstrated working calibration range. Quantitation based on extrapolation is not acceptable. Section 5.3 addresses initial and continuing calibration requirements in greater detail.
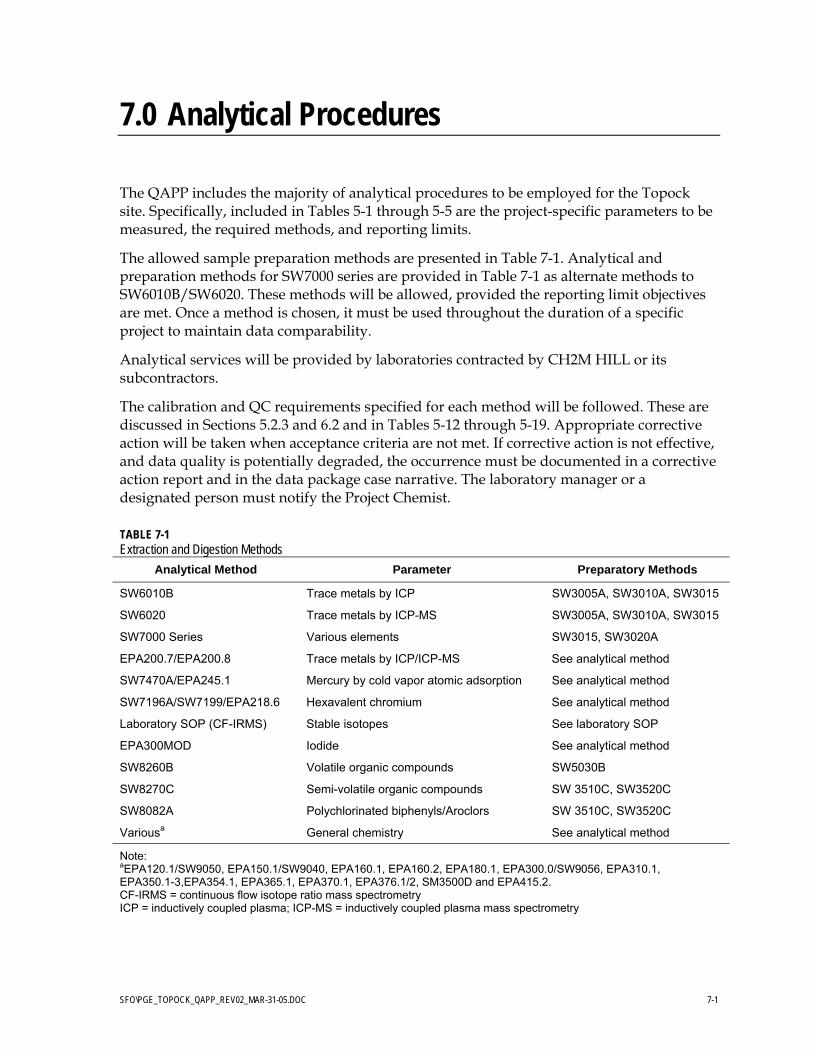
SFO\PGE_TOPOCK_QAPP_REV02_MAR-31-05.DOC 7-1
7.0 Analytical Procedures
The QAPP includes the majority of analytical procedures to be employed for the Topock site. Specifically, included in Tables 5-1 through 5-5 are the project-specific parameters to be measured, the required methods, and reporting limits.
The allowed sample preparation methods are presented in Table 7-1. Analytical and preparation methods for SW7000 series are provided in Table 7-1 as alternate methods to SW6010B/SW6020. These methods will be allowed, provided the reporting limit objectives are met. Once a method is chosen, it must be used throughout the duration of a specific project to maintain data comparability.
Analytical services will be provided by laboratories contracted by CH2M HILL or its subcontractors.
The calibration and QC requirements specified for each method will be followed. These are discussed in Sections 5.2.3 and 6.2 and in Tables 5-12 through 5-19. Appropriate corrective action will be taken when acceptance criteria are not met. If corrective action is not effective, and data quality is potentially degraded, the occurrence must be documented in a corrective action report and in the data package case narrative. The laboratory manager or a designated person must notify the Project Chemist.
TABLE 7-1 Extraction and Digestion Methods
Analytical Method Parameter Preparatory Methods
SW6010B Trace metals by ICP SW3005A, SW3010A, SW3015
SW6020 Trace metals by ICP-MS SW3005A, SW3010A, SW3015
SW7000 Series Various elements SW3015, SW3020A
EPA200.7/EPA200.8 Trace metals by ICP/ICP-MS See analytical method
SW7470A/EPA245.1 Mercury by cold vapor atomic adsorption See analytical method
SW7196A/SW7199/EPA218.6 Hexavalent chromium See analytical method
Laboratory SOP (CF-IRMS) Stable isotopes See laboratory SOP
EPA300MOD Iodide See analytical method
SW8260B Volatile organic compounds SW5030B
SW8270C Semi-volatile organic compounds SW 3510C, SW3520C
SW8082A Polychlorinated biphenyls/Aroclors SW 3510C, SW3520C
Variousa General chemistry See analytical method
Note: aEPA120.1/SW9050, EPA150.1/SW9040, EPA160.1, EPA160.2, EPA180.1, EPA300.0/SW9056, EPA310.1, EPA350.1-3,EPA354.1, EPA365.1, EPA370.1, EPA376.1/2, SM3500D and EPA415.2. CF-IRMS = continuous flow isotope ratio mass spectrometry ICP = inductively coupled plasma; ICP-MS = inductively coupled plasma mass spectrometry
SFO\PGE_TOPOCK_QAPP_REV02_MAR-31-05.DOC) 8-1
8.0 Data Reduction, Validation, and Reporting
8.1 Laboratory Data Management Data reduction will be done manually or by using appropriate application software. Quantitation procedures specified for each method must be followed. If data reduction is done manually, the documentation must include the formulas used. Any application software used for data reduction must have been previously verified by the laboratory for accuracy. Documentation of the software’s verification must be maintained on file in the laboratory. All documentation of data reduction must allow re-creation of the calculations.
All data will undergo a minimum of three levels of review at the laboratory prior to release. The analyst performing the tests shall initially review 100 percent of the data. After the analyst’s review has been completed, 100 percent of the data shall be reviewed independently by a senior analyst or by the section supervisor for accuracy, compliance with calibration, and QC requirements, holding time compliance, and for completeness. Analyte identification and quantitation must be verified. Calibration and QC results will be compared with the applicable control limits. Reporting limits should be reviewed to make sure they meet the project objectives. Results of multiple dilutions should be reviewed for consistency. Any discrepancies must be resolved and corrected. Laboratory qualifiers will be applied when there are non-conformances that could potentially affect data usability. These qualifiers must be properly defined as part of the deliverables. All issues that are relevant to the quality of the data must be addressed in a case narrative. The laboratory QC manager will review a minimum of 10 percent of data or deliverables generated for this program against the project-specific requirements. A final data review will be conducted by the Laboratory Manager or Client Services Representative to ensure that all required analyses were performed on all samples and that all documentation is complete.
The hard-copy and electronic laboratory reports for all samples and analyses will contain the information necessary to perform data evaluation.
The Topock project utilizes two types of reporting deliverables. The following is a brief synopsis of what when it is appropriate to use each deliverable:
Level 3: Appropriate for investigative, confirmatory, or closure results. Critical project decisions may be made using this data.
Level 4: Appropriate for investigative, confirmatory, or closure results. Critical decisions may be made using this data and should be used for projects that require a high degree of confidence in the accuracy of the data.
Hardcopy deliverables will be provided as described below and should be organized in a format that facilitates identification and retrieval of data..
At a minimum, the following information (when applicable) will be included in a Level 3 report:
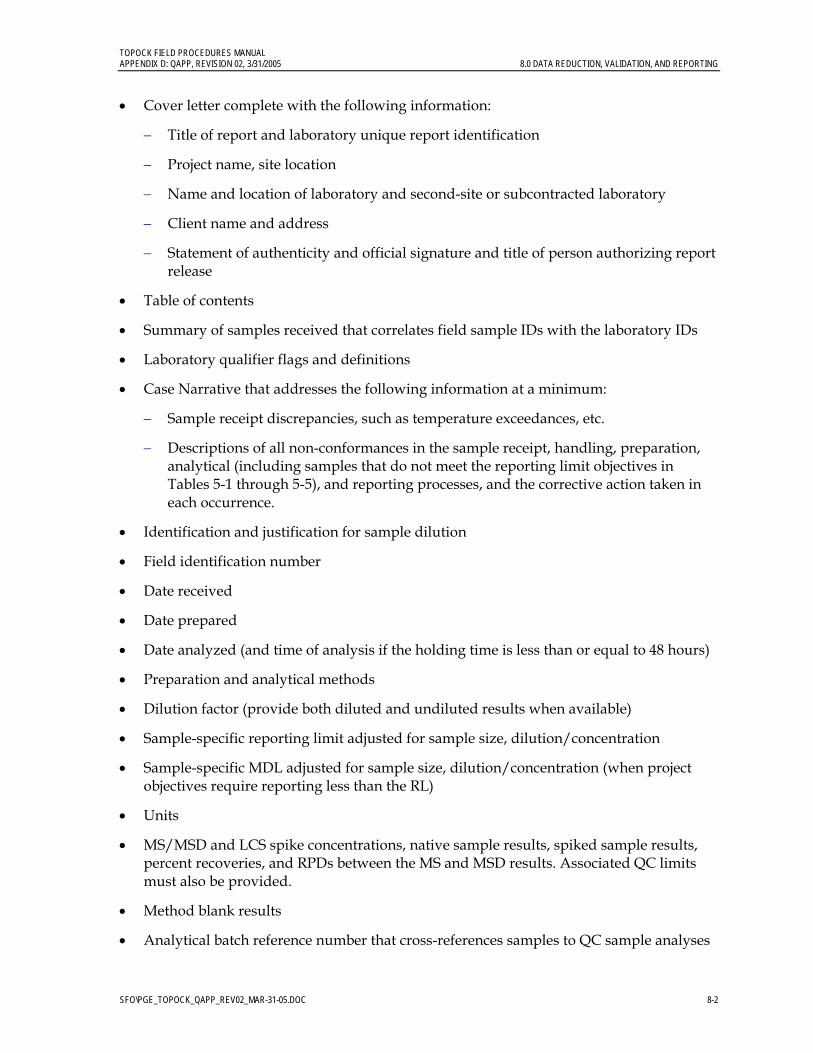
TOPOCK FIELD PROCEDURES MANUAL APPENDIX D: QAPP, REVISION 02, 3/31/2005 8.0 DATA REDUCTION, VALIDATION, AND REPORTING
SFO\PGE_TOPOCK_QAPP_REV02_MAR-31-05.DOC 8-2
• Cover letter complete with the following information:
− Title of report and laboratory unique report identification
− Project name, site location
− Name and location of laboratory and second-site or subcontracted laboratory
− Client name and address
− Statement of authenticity and official signature and title of person authorizing report release
• Table of contents
• Summary of samples received that correlates field sample IDs with the laboratory IDs
• Laboratory qualifier flags and definitions
• Case Narrative that addresses the following information at a minimum:
− Sample receipt discrepancies, such as temperature exceedances, etc.
− Descriptions of all non-conformances in the sample receipt, handling, preparation, analytical (including samples that do not meet the reporting limit objectives in Tables 5-1 through 5-5), and reporting processes, and the corrective action taken in each occurrence.
• Identification and justification for sample dilution
• Field identification number
• Date received
• Date prepared
• Date analyzed (and time of analysis if the holding time is less than or equal to 48 hours)
• Preparation and analytical methods
• Dilution factor (provide both diluted and undiluted results when available)
• Sample-specific reporting limit adjusted for sample size, dilution/concentration
• Sample-specific MDL adjusted for sample size, dilution/concentration (when project objectives require reporting less than the RL)
• Units
• MS/MSD and LCS spike concentrations, native sample results, spiked sample results, percent recoveries, and RPDs between the MS and MSD results. Associated QC limits must also be provided.
• Method blank results
• Analytical batch reference number that cross-references samples to QC sample analyses
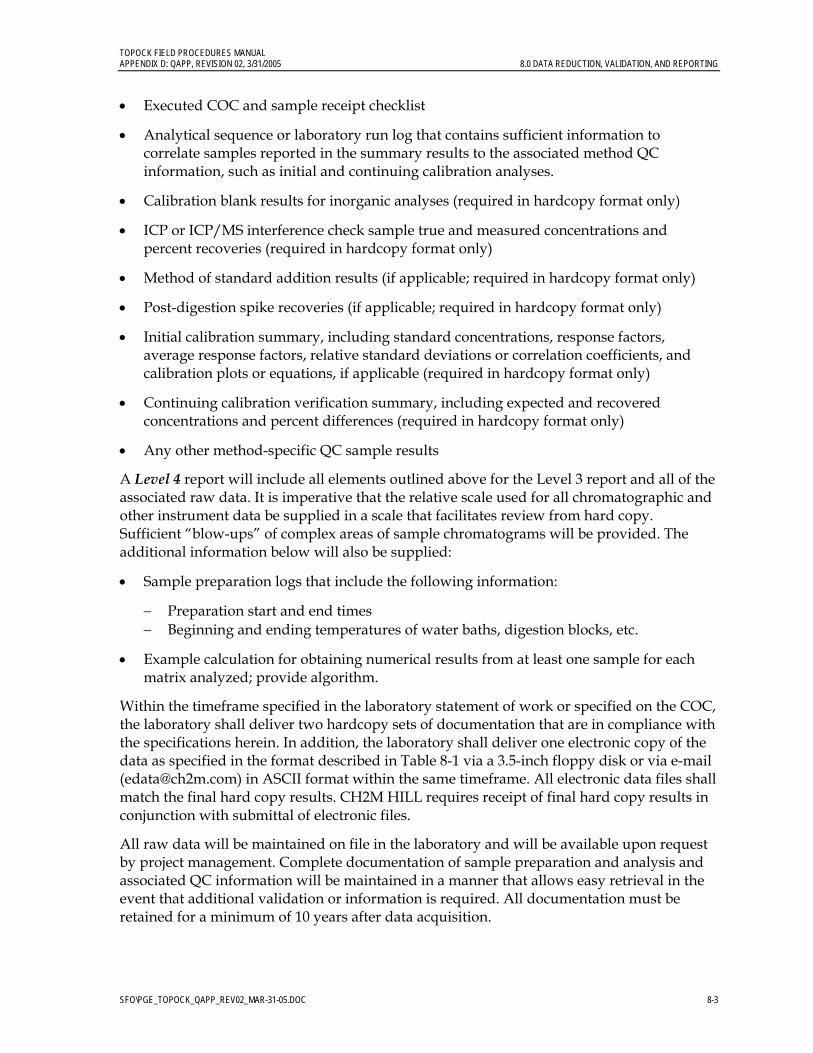
TOPOCK FIELD PROCEDURES MANUAL APPENDIX D: QAPP, REVISION 02, 3/31/2005 8.0 DATA REDUCTION, VALIDATION, AND REPORTING
SFO\PGE_TOPOCK_QAPP_REV02_MAR-31-05.DOC 8-3
• Executed COC and sample receipt checklist
• Analytical sequence or laboratory run log that contains sufficient information to correlate samples reported in the summary results to the associated method QC information, such as initial and continuing calibration analyses.
• Calibration blank results for inorganic analyses (required in hardcopy format only)
• ICP or ICP/MS interference check sample true and measured concentrations and percent recoveries (required in hardcopy format only)
• Method of standard addition results (if applicable; required in hardcopy format only)
• Post-digestion spike recoveries (if applicable; required in hardcopy format only)
• Initial calibration summary, including standard concentrations, response factors, average response factors, relative standard deviations or correlation coefficients, and calibration plots or equations, if applicable (required in hardcopy format only)
• Continuing calibration verification summary, including expected and recovered concentrations and percent differences (required in hardcopy format only)
• Any other method-specific QC sample results
A Level 4 report will include all elements outlined above for the Level 3 report and all of the associated raw data. It is imperative that the relative scale used for all chromatographic and other instrument data be supplied in a scale that facilitates review from hard copy. Sufficient “blow-ups” of complex areas of sample chromatograms will be provided. The additional information below will also be supplied:
• Sample preparation logs that include the following information:
− Preparation start and end times − Beginning and ending temperatures of water baths, digestion blocks, etc.
• Example calculation for obtaining numerical results from at least one sample for each matrix analyzed; provide algorithm.
Within the timeframe specified in the laboratory statement of work or specified on the COC, the laboratory shall deliver two hardcopy sets of documentation that are in compliance with the specifications herein. In addition, the laboratory shall deliver one electronic copy of the data as specified in the format described in Table 8-1 via a 3.5-inch floppy disk or via e-mail ([email protected]) in ASCII format within the same timeframe. All electronic data files shall match the final hard copy results. CH2M HILL requires receipt of final hard copy results in conjunction with submittal of electronic files.
All raw data will be maintained on file in the laboratory and will be available upon request by project management. Complete documentation of sample preparation and analysis and associated QC information will be maintained in a manner that allows easy retrieval in the event that additional validation or information is required. All documentation must be retained for a minimum of 10 years after data acquisition.
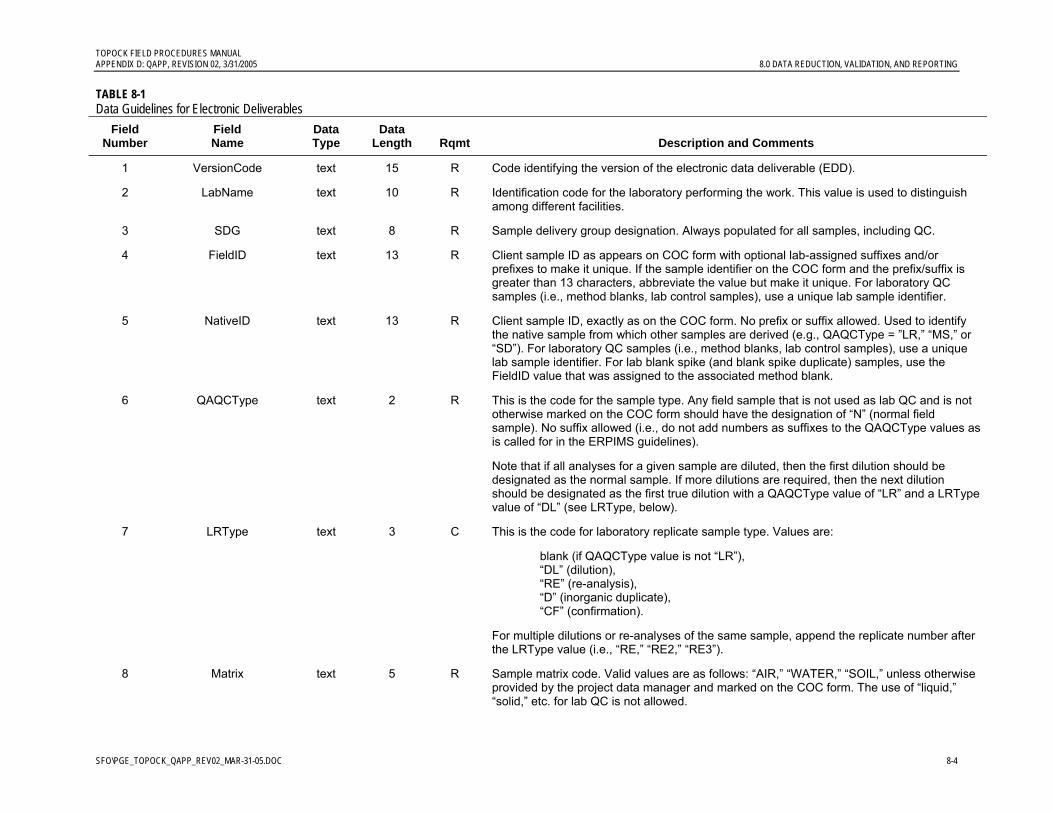
TOPOCK FIELD PROCEDURES MANUAL APPENDIX D: QAPP, REVISION 02, 3/31/2005 8.0 DATA REDUCTION, VALIDATION, AND REPORTING
SFO\PGE_TOPOCK_QAPP_REV02_MAR-31-05.DOC 8-4
TABLE 8-1 Data Guidelines for Electronic Deliverables
Field Number
Field Name
Data Type
Data Length Rqmt Description and Comments
1 VersionCode text 15 R Code identifying the version of the electronic data deliverable (EDD).
2 LabName text 10 R Identification code for the laboratory performing the work. This value is used to distinguish among different facilities.
3 SDG text 8 R Sample delivery group designation. Always populated for all samples, including QC.
4 FieldID text 13 R Client sample ID as appears on COC form with optional lab-assigned suffixes and/or prefixes to make it unique. If the sample identifier on the COC form and the prefix/suffix is greater than 13 characters, abbreviate the value but make it unique. For laboratory QC samples (i.e., method blanks, lab control samples), use a unique lab sample identifier.
5 NativeID text 13 R Client sample ID, exactly as on the COC form. No prefix or suffix allowed. Used to identify the native sample from which other samples are derived (e.g., QAQCType = ”LR,” “MS,” or “SD”). For laboratory QC samples (i.e., method blanks, lab control samples), use a unique lab sample identifier. For lab blank spike (and blank spike duplicate) samples, use the FieldID value that was assigned to the associated method blank.
6 QAQCType text 2 R This is the code for the sample type. Any field sample that is not used as lab QC and is not otherwise marked on the COC form should have the designation of “N” (normal field sample). No suffix allowed (i.e., do not add numbers as suffixes to the QAQCType values as is called for in the ERPIMS guidelines).
Note that if all analyses for a given sample are diluted, then the first dilution should be designated as the normal sample. If more dilutions are required, then the next dilution should be designated as the first true dilution with a QAQCType value of “LR” and a LRType value of “DL” (see LRType, below).
7 LRType text 3 C This is the code for laboratory replicate sample type. Values are:
blank (if QAQCType value is not “LR”), “DL” (dilution), “RE” (re-analysis), “D” (inorganic duplicate), “CF” (confirmation).
For multiple dilutions or re-analyses of the same sample, append the replicate number after the LRType value (i.e., “RE,” “RE2,” “RE3”).
8 Matrix text 5 R Sample matrix code. Valid values are as follows: “AIR,” “WATER,” “SOIL,” unless otherwise provided by the project data manager and marked on the COC form. The use of “liquid,” “solid,” etc. for lab QC is not allowed.
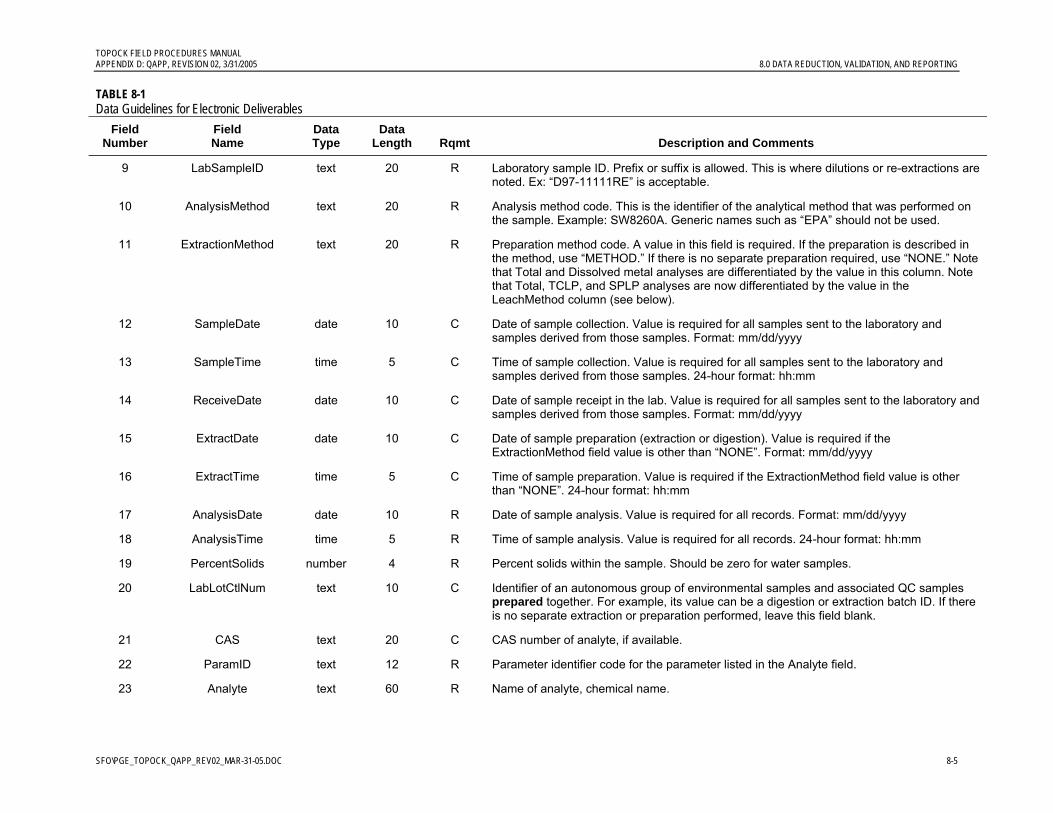
TOPOCK FIELD PROCEDURES MANUAL APPENDIX D: QAPP, REVISION 02, 3/31/2005 8.0 DATA REDUCTION, VALIDATION, AND REPORTING
SFO\PGE_TOPOCK_QAPP_REV02_MAR-31-05.DOC 8-5
TABLE 8-1 Data Guidelines for Electronic Deliverables
Field Number
Field Name
Data Type
Data Length Rqmt Description and Comments
9 LabSampleID text 20 R Laboratory sample ID. Prefix or suffix is allowed. This is where dilutions or re-extractions are noted. Ex: “D97-11111RE” is acceptable.
10 AnalysisMethod text 20 R Analysis method code. This is the identifier of the analytical method that was performed on the sample. Example: SW8260A. Generic names such as “EPA” should not be used.
11 ExtractionMethod text 20 R Preparation method code. A value in this field is required. If the preparation is described in the method, use “METHOD.” If there is no separate preparation required, use “NONE.” Note that Total and Dissolved metal analyses are differentiated by the value in this column. Note that Total, TCLP, and SPLP analyses are now differentiated by the value in the LeachMethod column (see below).
12 SampleDate date 10 C Date of sample collection. Value is required for all samples sent to the laboratory and samples derived from those samples. Format: mm/dd/yyyy
13 SampleTime time 5 C Time of sample collection. Value is required for all samples sent to the laboratory and samples derived from those samples. 24-hour format: hh:mm
14 ReceiveDate date 10 C Date of sample receipt in the lab. Value is required for all samples sent to the laboratory and samples derived from those samples. Format: mm/dd/yyyy
15 ExtractDate date 10 C Date of sample preparation (extraction or digestion). Value is required if the ExtractionMethod field value is other than “NONE”. Format: mm/dd/yyyy
16 ExtractTime time 5 C Time of sample preparation. Value is required if the ExtractionMethod field value is other than “NONE”. 24-hour format: hh:mm
17 AnalysisDate date 10 R Date of sample analysis. Value is required for all records. Format: mm/dd/yyyy
18 AnalysisTime time 5 R Time of sample analysis. Value is required for all records. 24-hour format: hh:mm
19 PercentSolids number 4 R Percent solids within the sample. Should be zero for water samples.
20 LabLotCtlNum text 10 C Identifier of an autonomous group of environmental samples and associated QC samples prepared together. For example, its value can be a digestion or extraction batch ID. If there is no separate extraction or preparation performed, leave this field blank.
21 CAS text 20 C CAS number of analyte, if available.
22 ParamID text 12 R Parameter identifier code for the parameter listed in the Analyte field.
23 Analyte text 60 R Name of analyte, chemical name.
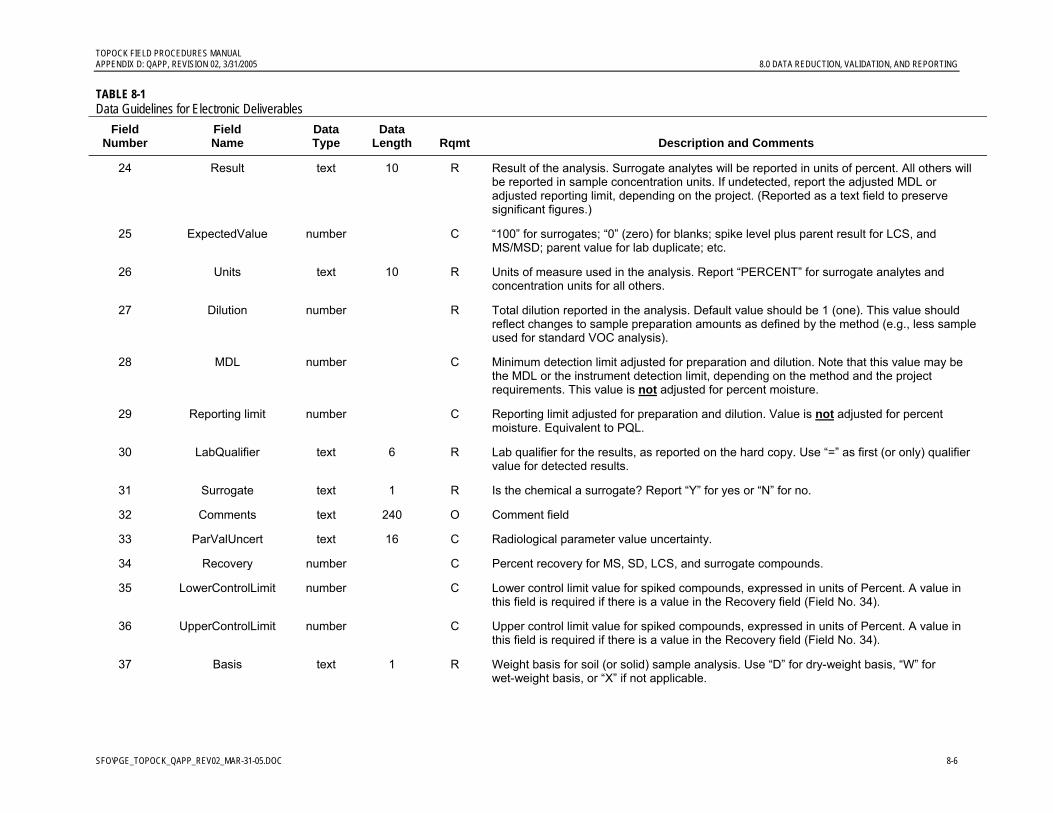
TOPOCK FIELD PROCEDURES MANUAL APPENDIX D: QAPP, REVISION 02, 3/31/2005 8.0 DATA REDUCTION, VALIDATION, AND REPORTING
SFO\PGE_TOPOCK_QAPP_REV02_MAR-31-05.DOC 8-6
TABLE 8-1 Data Guidelines for Electronic Deliverables
Field Number
Field Name
Data Type
Data Length Rqmt Description and Comments
24 Result text 10 R Result of the analysis. Surrogate analytes will be reported in units of percent. All others will be reported in sample concentration units. If undetected, report the adjusted MDL or adjusted reporting limit, depending on the project. (Reported as a text field to preserve significant figures.)
25 ExpectedValue number C “100” for surrogates; “0” (zero) for blanks; spike level plus parent result for LCS, and MS/MSD; parent value for lab duplicate; etc.
26 Units text 10 R Units of measure used in the analysis. Report “PERCENT” for surrogate analytes and concentration units for all others.
27 Dilution number R Total dilution reported in the analysis. Default value should be 1 (one). This value should reflect changes to sample preparation amounts as defined by the method (e.g., less sample used for standard VOC analysis).
28 MDL number C Minimum detection limit adjusted for preparation and dilution. Note that this value may be the MDL or the instrument detection limit, depending on the method and the project requirements. This value is not adjusted for percent moisture.
29 Reporting limit number C Reporting limit adjusted for preparation and dilution. Value is not adjusted for percent moisture. Equivalent to PQL.
30 LabQualifier text 6 R Lab qualifier for the results, as reported on the hard copy. Use “=” as first (or only) qualifier value for detected results.
31 Surrogate text 1 R Is the chemical a surrogate? Report “Y” for yes or “N” for no.
32 Comments text 240 O Comment field
33 ParValUncert text 16 C Radiological parameter value uncertainty.
34 Recovery number C Percent recovery for MS, SD, LCS, and surrogate compounds.
35 LowerControlLimit number C Lower control limit value for spiked compounds, expressed in units of Percent. A value in this field is required if there is a value in the Recovery field (Field No. 34).
36 UpperControlLimit number C Upper control limit value for spiked compounds, expressed in units of Percent. A value in this field is required if there is a value in the Recovery field (Field No. 34).
37 Basis text 1 R Weight basis for soil (or solid) sample analysis. Use “D” for dry-weight basis, “W” for wet-weight basis, or “X” if not applicable.
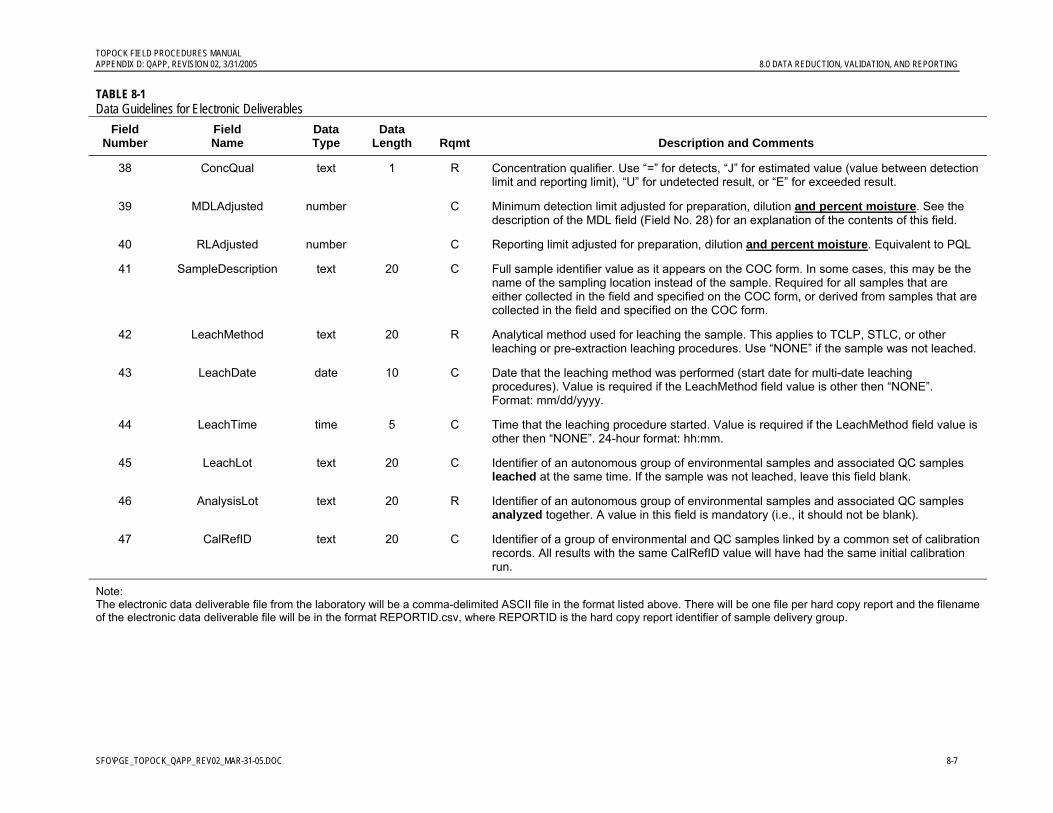
TOPOCK FIELD PROCEDURES MANUAL APPENDIX D: QAPP, REVISION 02, 3/31/2005 8.0 DATA REDUCTION, VALIDATION, AND REPORTING
SFO\PGE_TOPOCK_QAPP_REV02_MAR-31-05.DOC 8-7
TABLE 8-1 Data Guidelines for Electronic Deliverables
Field Number
Field Name
Data Type
Data Length Rqmt Description and Comments
38 ConcQual text 1 R Concentration qualifier. Use “=” for detects, “J” for estimated value (value between detection limit and reporting limit), “U” for undetected result, or “E” for exceeded result.
39 MDLAdjusted number C Minimum detection limit adjusted for preparation, dilution and percent moisture. See the description of the MDL field (Field No. 28) for an explanation of the contents of this field.
40 RLAdjusted number C Reporting limit adjusted for preparation, dilution and percent moisture. Equivalent to PQL
41 SampleDescription text 20 C Full sample identifier value as it appears on the COC form. In some cases, this may be the name of the sampling location instead of the sample. Required for all samples that are either collected in the field and specified on the COC form, or derived from samples that are collected in the field and specified on the COC form.
42 LeachMethod text 20 R Analytical method used for leaching the sample. This applies to TCLP, STLC, or other leaching or pre-extraction leaching procedures. Use “NONE” if the sample was not leached.
43 LeachDate date 10 C Date that the leaching method was performed (start date for multi-date leaching procedures). Value is required if the LeachMethod field value is other then “NONE”. Format: mm/dd/yyyy.
44 LeachTime time 5 C Time that the leaching procedure started. Value is required if the LeachMethod field value is other then “NONE”. 24-hour format: hh:mm.
45 LeachLot text 20 C Identifier of an autonomous group of environmental samples and associated QC samples leached at the same time. If the sample was not leached, leave this field blank.
46 AnalysisLot text 20 R Identifier of an autonomous group of environmental samples and associated QC samples analyzed together. A value in this field is mandatory (i.e., it should not be blank).
47 CalRefID text 20 C Identifier of a group of environmental and QC samples linked by a common set of calibration records. All results with the same CalRefID value will have had the same initial calibration run.
Note: The electronic data deliverable file from the laboratory will be a comma-delimited ASCII file in the format listed above. There will be one file per hard copy report and the filename of the electronic data deliverable file will be in the format REPORTID.csv, where REPORTID is the hard copy report identifier of sample delivery group.
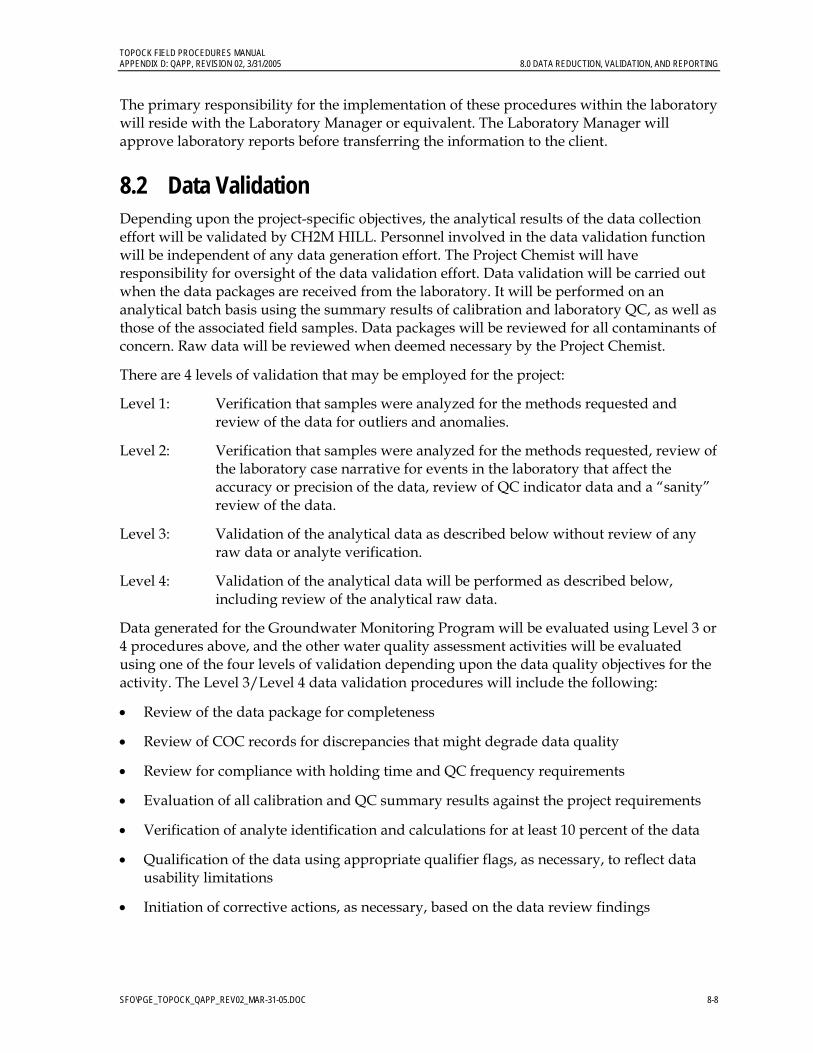
TOPOCK FIELD PROCEDURES MANUAL APPENDIX D: QAPP, REVISION 02, 3/31/2005 8.0 DATA REDUCTION, VALIDATION, AND REPORTING
SFO\PGE_TOPOCK_QAPP_REV02_MAR-31-05.DOC 8-8
The primary responsibility for the implementation of these procedures within the laboratory will reside with the Laboratory Manager or equivalent. The Laboratory Manager will approve laboratory reports before transferring the information to the client.
8.2 Data Validation Depending upon the project-specific objectives, the analytical results of the data collection effort will be validated by CH2M HILL. Personnel involved in the data validation function will be independent of any data generation effort. The Project Chemist will have responsibility for oversight of the data validation effort. Data validation will be carried out when the data packages are received from the laboratory. It will be performed on an analytical batch basis using the summary results of calibration and laboratory QC, as well as those of the associated field samples. Data packages will be reviewed for all contaminants of concern. Raw data will be reviewed when deemed necessary by the Project Chemist.
There are 4 levels of validation that may be employed for the project:
Level 1: Verification that samples were analyzed for the methods requested and review of the data for outliers and anomalies.
Level 2: Verification that samples were analyzed for the methods requested, review of the laboratory case narrative for events in the laboratory that affect the accuracy or precision of the data, review of QC indicator data and a “sanity” review of the data.
Level 3: Validation of the analytical data as described below without review of any raw data or analyte verification.
Level 4: Validation of the analytical data will be performed as described below, including review of the analytical raw data.
Data generated for the Groundwater Monitoring Program will be evaluated using Level 3 or 4 procedures above, and the other water quality assessment activities will be evaluated using one of the four levels of validation depending upon the data quality objectives for the activity. The Level 3/Level 4 data validation procedures will include the following:
• Review of the data package for completeness
• Review of COC records for discrepancies that might degrade data quality
• Review for compliance with holding time and QC frequency requirements
• Evaluation of all calibration and QC summary results against the project requirements
• Verification of analyte identification and calculations for at least 10 percent of the data
• Qualification of the data using appropriate qualifier flags, as necessary, to reflect data usability limitations
• Initiation of corrective actions, as necessary, based on the data review findings
TOPOCK FIELD PROCEDURES MANUAL APPENDIX D: QAPP, REVISION 02, 3/31/2005 8.0 DATA REDUCTION, VALIDATION, AND REPORTING
SFO\PGE_TOPOCK_QAPP_REV02_MAR-31-05.DOC 8-9
Data validation will be patterned after the Contract Laboratory Program National Functional Guidelines for Inorganic Data Review (EPA 2002) and Contract Laboratory National Functional Guidelines for Organic Data Review (EPA 1999), substituting the calibration and QC requirements specified in this QAPP for those specified in the Guidelines. The flagging criteria in Tables 8-2 and 8-3 will be used. The qualifier flags are defined in Table 8-4.
Qualifier flags, if required, will be applied to the electronic sample results. If multiple flags are required for a result, the most severe flag will be applied to the electronic result. The hierarchy of flags from the most severe to the least severe will be as follows: R, UJ, U, J.
A validation report will be generated for each method and sample delivery group. A copy of the validation report will be submitted to the project management, and a copy will be retained with the data package in the project file. Any significant data quality problems will be brought to the attention of the Project Chemist.

TOPOCK FIELD PROCEDURES MANUAL APPENDIX D: QAPP, REVISION 02, 3/31/2005 8.0 DATA REDUCTION, VALIDATION, AND REPORTING
SFO\PGE_TOPOCK_QAPP_REV02_MAR-31-05.DOC 8-10
TABLE 8-2 Flagging Conventions–Minimum Data Evaluation Criteria for Inorganic Methods
Quality Control Check Evaluation Flag Samples Affected Holding time exceeded for extraction, digestion, or analysis
J positive results; R non-detects for mercury; UJ non-detects for all other analytes
Holding time
Holding time for digestion or analysis exceeded by a factor of 2
J positive results; R non-detects
Sample
Sample preservation Sample preservation requirements not met (if sample preservation was not done in the field, but was performed at the laboratory upon sample receipt, no flagging is required)
J positive results; R non-detects Sample
Temperature > 6°C J positive results; UJ non-detects Samples in same cooler
Initial calibration (Multi-point only) Correlation coefficient ≤ 0.995 J positive; UJ non-detects All associated samples in analytical batch
%R > UT J positive results Calibration verification (initial calibration verification, continuing calibration verification) %R < LT J positive results, UJ non-detects
All associated samples in analytical batch
Interference check sample (SW6010B/SW6020 only)
%R > UT J positive results All associated samples in analytical batch
%R < LT J positive results; UJ non-detects
Laboratory control sample %R > UT J positive results All samples in preparation batch
%R < LT J positive results; UJ non-detects
Calibration blank (ICB, CCB)
Method blank
All samples in preparation batch or analytical batch, whichever one applies, associated with method blank or calibration blank
Equipment blank
Multiply the highest blank concentration by 5 U positive sample results < 5x highest blank concentration
All samples, same site, matrix and date
Matrix spikes %R > UT
%R < LT
J positive results
J positive results
UJ non-detects
All samples from same site as parent sample
RPD > UT J positive results

TOPOCK FIELD PROCEDURES MANUAL APPENDIX D: QAPP, REVISION 02, 3/31/2005 8.0 DATA REDUCTION, VALIDATION, AND REPORTING
SFO\PGE_TOPOCK_QAPP_REV02_MAR-31-05.DOC 8-11
TABLE 8-2 Flagging Conventions–Minimum Data Evaluation Criteria for Inorganic Methods
Quality Control Check Evaluation Flag Samples Affected MS Dilute and Spike (see Section 5.3.3.1)
Spike recovery 85-115% and peak within RT window. If criteria are not met, the laboratory is required to dilute two aliquots 1:5, spike one with 1 µg/L of hexavalent chromium and analyze the other unspiked. Continue the aforementioned procedure using successively greater dilutions of two aliquots until RT and recovery criteria are met.
Choose the dilution where the RT/recovery criteria are met.
If RT/recovery criteria are met at a 1:1 dilution, data qualification is not required for detected or non detected results.
If RT/recovery criteria are met at dilution greater than a 1:1, elevate the RL for non-detected results and qualify the data U at a level equal to the RL multiplied by the dilution factor of the acceptable analysis (apply ValAdj validation reason).
If RT/recovery criteria are not met:
a) Analysis performed only at a 1:1dilution:
J positive results (apply LabA&P validation reason)
UJ or R non-detects determined in conjunction with Project Chemist (apply LabA&P validation reason)
b) Analysis performed at subsequent dilutions and criteria are still not met:
J flag positive apply LabA&P validation reason)
Elevate RL -UJ or R non-detects, determined in conjunction with Project Chemist (apply LabA&P validation reason)
Sample
Dilution Test If concentration is >25 times the reporting limit and percent difference >UT
J positive results
UJ non-detects
All samples from same site as parent sample if analytical spike not performed
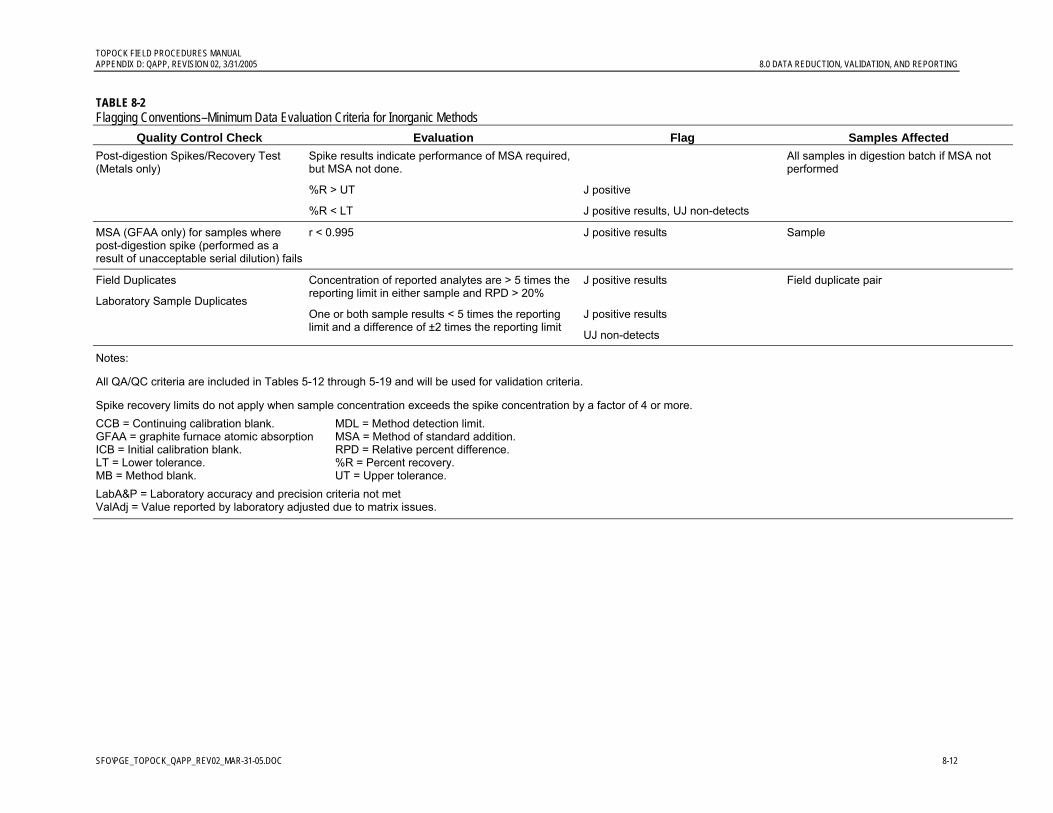
TOPOCK FIELD PROCEDURES MANUAL APPENDIX D: QAPP, REVISION 02, 3/31/2005 8.0 DATA REDUCTION, VALIDATION, AND REPORTING
SFO\PGE_TOPOCK_QAPP_REV02_MAR-31-05.DOC 8-12
TABLE 8-2 Flagging Conventions–Minimum Data Evaluation Criteria for Inorganic Methods
Quality Control Check Evaluation Flag Samples Affected Post-digestion Spikes/Recovery Test (Metals only)
Spike results indicate performance of MSA required, but MSA not done.
%R > UT J positive
%R < LT J positive results, UJ non-detects
All samples in digestion batch if MSA not performed
MSA (GFAA only) for samples where post-digestion spike (performed as a result of unacceptable serial dilution) fails
r < 0.995 J positive results
Sample
Concentration of reported analytes are > 5 times the reporting limit in either sample and RPD > 20%
J positive results Field duplicate pair Field Duplicates
Laboratory Sample Duplicates One or both sample results < 5 times the reporting limit and a difference of ±2 times the reporting limit
J positive results
UJ non-detects
Notes:
All QA/QC criteria are included in Tables 5-12 through 5-19 and will be used for validation criteria.
Spike recovery limits do not apply when sample concentration exceeds the spike concentration by a factor of 4 or more. CCB = Continuing calibration blank. MDL = Method detection limit. GFAA = graphite furnace atomic absorption MSA = Method of standard addition. ICB = Initial calibration blank. RPD = Relative percent difference. LT = Lower tolerance. %R = Percent recovery. MB = Method blank. UT = Upper tolerance. LabA&P = Laboratory accuracy and precision criteria not met ValAdj = Value reported by laboratory adjusted due to matrix issues.
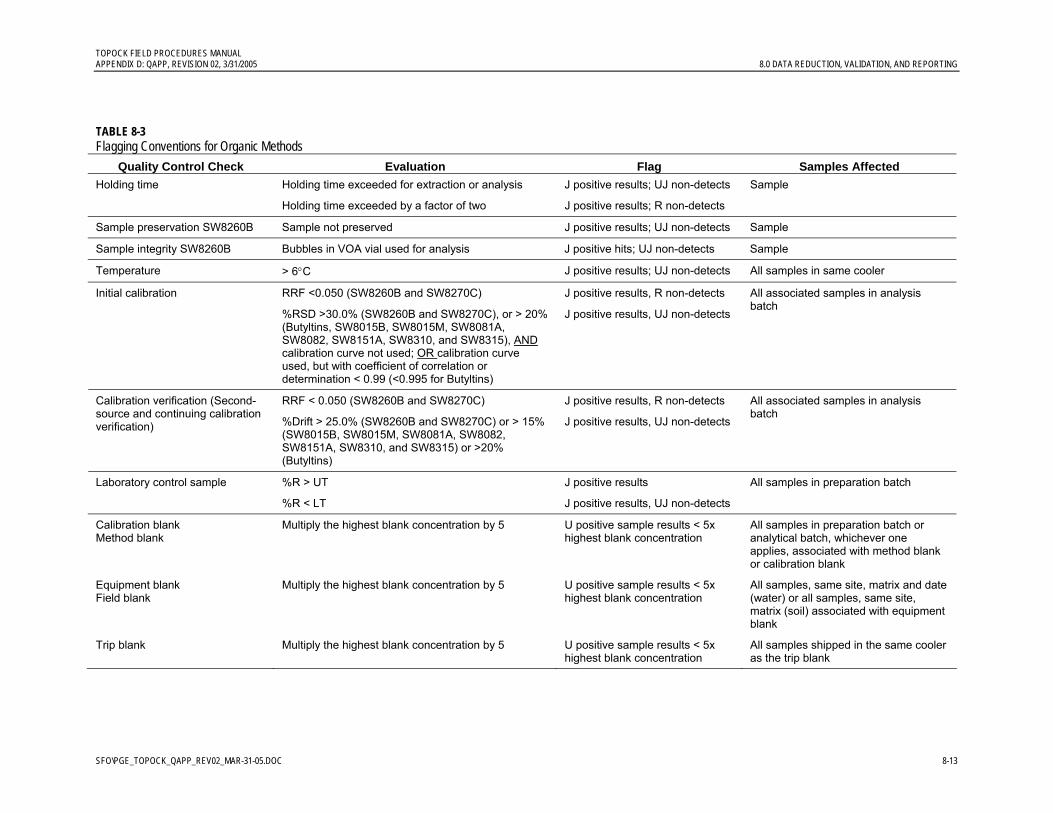
TOPOCK FIELD PROCEDURES MANUAL APPENDIX D: QAPP, REVISION 02, 3/31/2005 8.0 DATA REDUCTION, VALIDATION, AND REPORTING
SFO\PGE_TOPOCK_QAPP_REV02_MAR-31-05.DOC 8-13
TABLE 8-3 Flagging Conventions for Organic Methods
Quality Control Check Evaluation Flag Samples Affected Holding time exceeded for extraction or analysis J positive results; UJ non-detects Holding time
Holding time exceeded by a factor of two J positive results; R non-detects
Sample
Sample preservation SW8260B Sample not preserved J positive results; UJ non-detects Sample
Sample integrity SW8260B Bubbles in VOA vial used for analysis J positive hits; UJ non-detects Sample
Temperature > 6°C J positive results; UJ non-detects All samples in same cooler
RRF <0.050 (SW8260B and SW8270C) J positive results, R non-detects Initial calibration
%RSD >30.0% (SW8260B and SW8270C), or > 20% (Butyltins, SW8015B, SW8015M, SW8081A, SW8082, SW8151A, SW8310, and SW8315), AND calibration curve not used; OR calibration curve used, but with coefficient of correlation or determination < 0.99 (<0.995 for Butyltins)
J positive results, UJ non-detects
All associated samples in analysis batch
RRF < 0.050 (SW8260B and SW8270C) J positive results, R non-detects Calibration verification (Second-source and continuing calibration verification) %Drift > 25.0% (SW8260B and SW8270C) or > 15%
(SW8015B, SW8015M, SW8081A, SW8082, SW8151A, SW8310, and SW8315) or >20% (Butyltins)
J positive results, UJ non-detects
All associated samples in analysis batch
%R > UT J positive results Laboratory control sample
%R < LT J positive results, UJ non-detects
All samples in preparation batch
Calibration blank Method blank
Multiply the highest blank concentration by 5 U positive sample results < 5x highest blank concentration
All samples in preparation batch or analytical batch, whichever one applies, associated with method blank or calibration blank
Equipment blank Field blank
Multiply the highest blank concentration by 5 U positive sample results < 5x highest blank concentration
All samples, same site, matrix and date (water) or all samples, same site, matrix (soil) associated with equipment blank
Trip blank Multiply the highest blank concentration by 5 U positive sample results < 5x highest blank concentration
All samples shipped in the same cooler as the trip blank
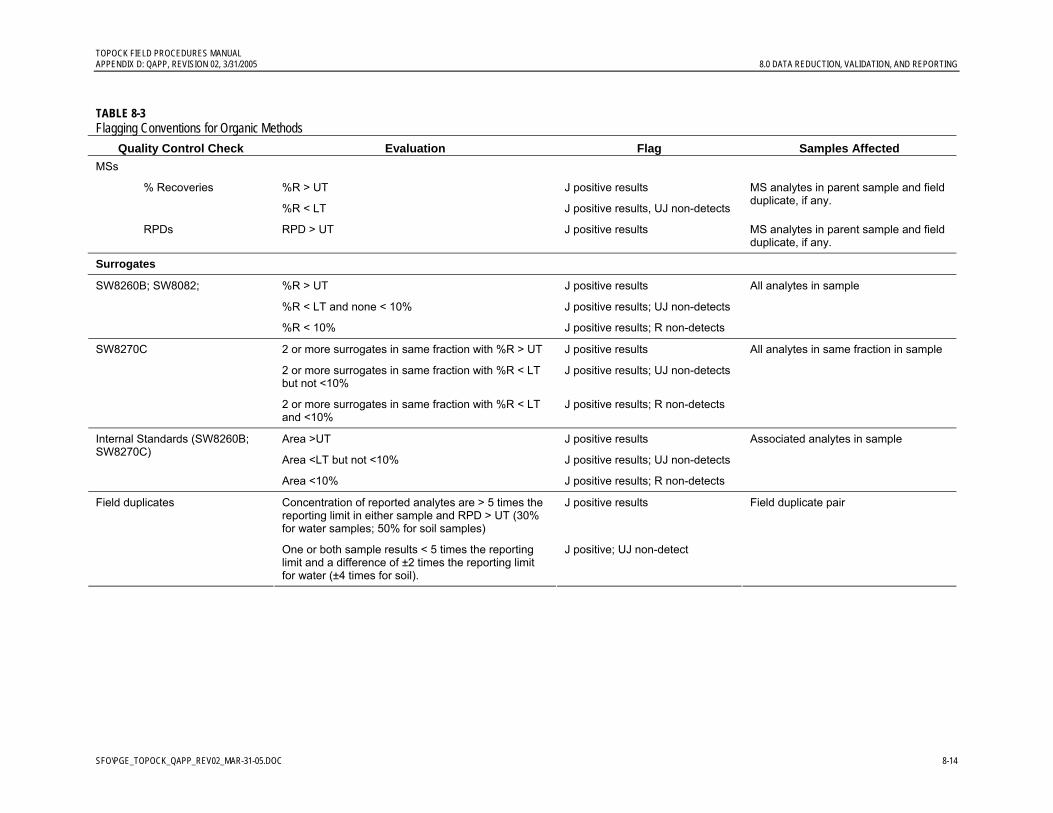
TOPOCK FIELD PROCEDURES MANUAL APPENDIX D: QAPP, REVISION 02, 3/31/2005 8.0 DATA REDUCTION, VALIDATION, AND REPORTING
SFO\PGE_TOPOCK_QAPP_REV02_MAR-31-05.DOC 8-14
TABLE 8-3 Flagging Conventions for Organic Methods
Quality Control Check Evaluation Flag Samples Affected MSs
%R > UT J positive results % Recoveries
%R < LT J positive results, UJ non-detects
MS analytes in parent sample and field duplicate, if any.
RPDs RPD > UT J positive results MS analytes in parent sample and field duplicate, if any.
Surrogates
%R > UT J positive results
%R < LT and none < 10% J positive results; UJ non-detects
SW8260B; SW8082;
%R < 10% J positive results; R non-detects
All analytes in sample
2 or more surrogates in same fraction with %R > UT J positive results
2 or more surrogates in same fraction with %R < LT but not <10%
J positive results; UJ non-detects
SW8270C
2 or more surrogates in same fraction with %R < LT and <10%
J positive results; R non-detects
All analytes in same fraction in sample
Area >UT J positive results
Area <LT but not <10% J positive results; UJ non-detects
Internal Standards (SW8260B; SW8270C)
Area <10% J positive results; R non-detects
Associated analytes in sample
Concentration of reported analytes are > 5 times the reporting limit in either sample and RPD > UT (30% for water samples; 50% for soil samples)
J positive results Field duplicates
One or both sample results < 5 times the reporting limit and a difference of ±2 times the reporting limit for water (±4 times for soil).
J positive; UJ non-detect
Field duplicate pair
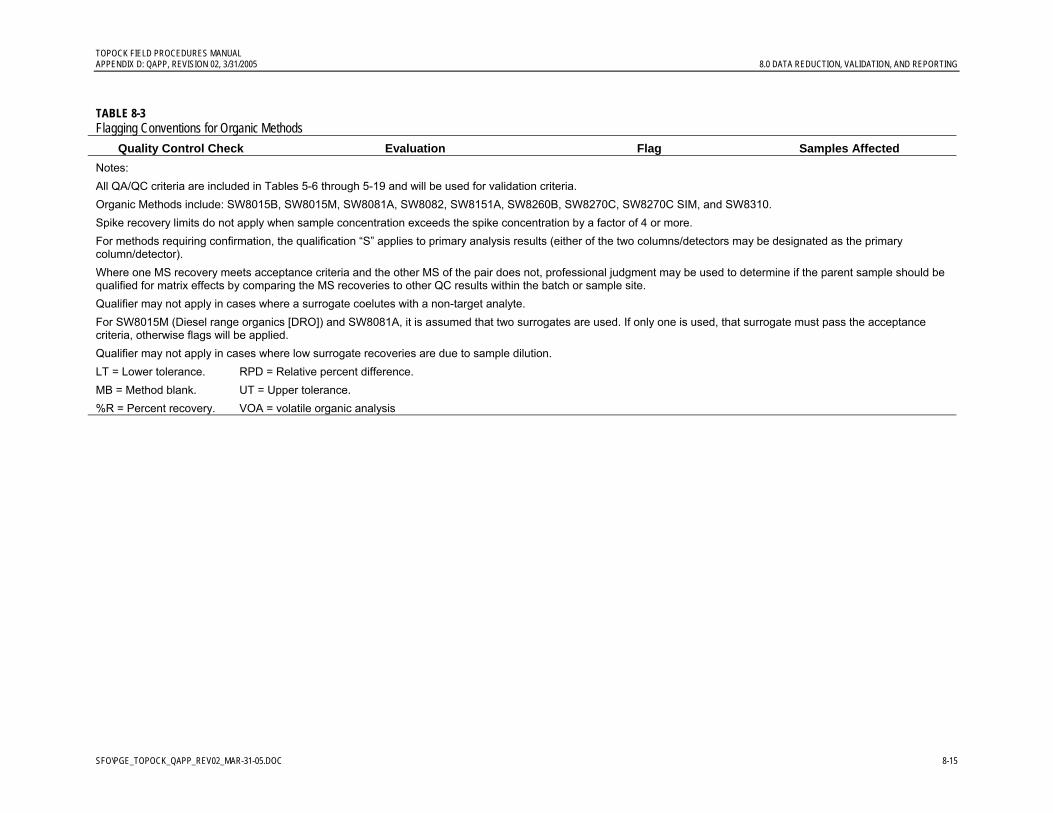
TOPOCK FIELD PROCEDURES MANUAL APPENDIX D: QAPP, REVISION 02, 3/31/2005 8.0 DATA REDUCTION, VALIDATION, AND REPORTING
SFO\PGE_TOPOCK_QAPP_REV02_MAR-31-05.DOC 8-15
TABLE 8-3 Flagging Conventions for Organic Methods
Quality Control Check Evaluation Flag Samples Affected Notes: All QA/QC criteria are included in Tables 5-6 through 5-19 and will be used for validation criteria. Organic Methods include: SW8015B, SW8015M, SW8081A, SW8082, SW8151A, SW8260B, SW8270C, SW8270C SIM, and SW8310. Spike recovery limits do not apply when sample concentration exceeds the spike concentration by a factor of 4 or more. For methods requiring confirmation, the qualification “S” applies to primary analysis results (either of the two columns/detectors may be designated as the primary column/detector). Where one MS recovery meets acceptance criteria and the other MS of the pair does not, professional judgment may be used to determine if the parent sample should be qualified for matrix effects by comparing the MS recoveries to other QC results within the batch or sample site. Qualifier may not apply in cases where a surrogate coelutes with a non-target analyte. For SW8015M (Diesel range organics [DRO]) and SW8081A, it is assumed that two surrogates are used. If only one is used, that surrogate must pass the acceptance criteria, otherwise flags will be applied. Qualifier may not apply in cases where low surrogate recoveries are due to sample dilution. LT = Lower tolerance. RPD = Relative percent difference. MB = Method blank. UT = Upper tolerance. %R = Percent recovery. VOA = volatile organic analysis
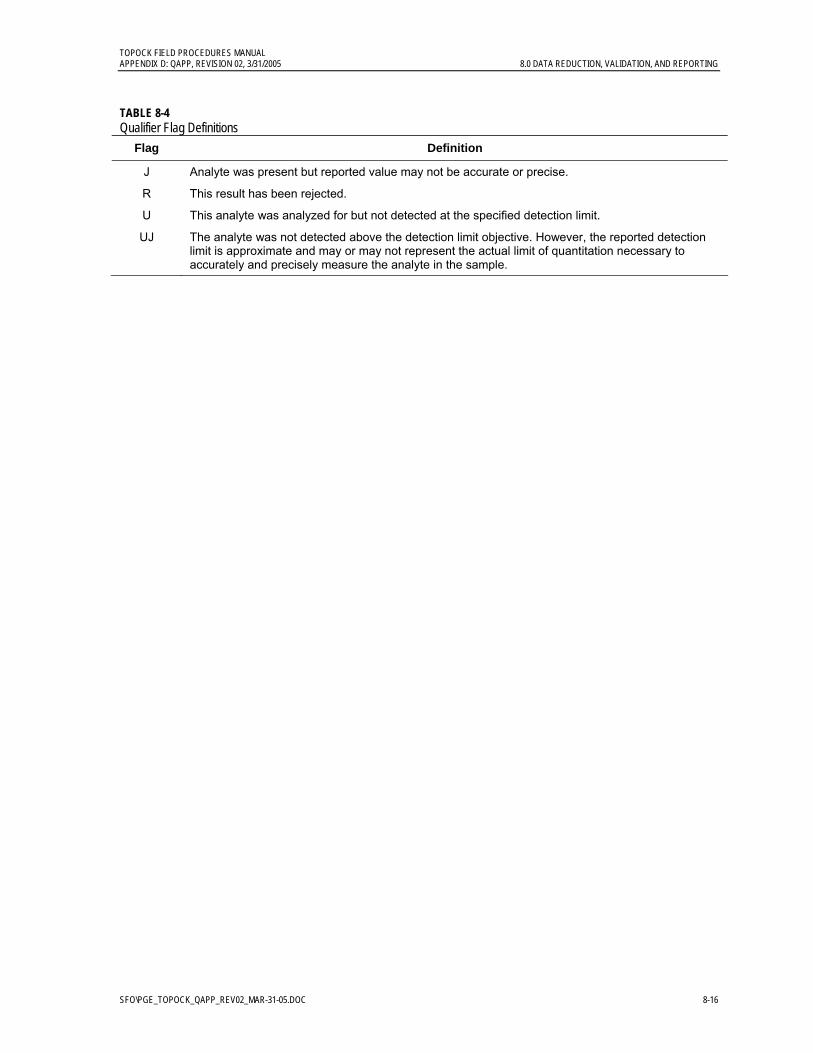
TOPOCK FIELD PROCEDURES MANUAL APPENDIX D: QAPP, REVISION 02, 3/31/2005 8.0 DATA REDUCTION, VALIDATION, AND REPORTING
SFO\PGE_TOPOCK_QAPP_REV02_MAR-31-05.DOC 8-16
TABLE 8-4 Qualifier Flag Definitions
Flag Definition
J Analyte was present but reported value may not be accurate or precise.
R This result has been rejected.
U This analyte was analyzed for but not detected at the specified detection limit.
UJ The analyte was not detected above the detection limit objective. However, the reported detection limit is approximate and may or may not represent the actual limit of quantitation necessary to accurately and precisely measure the analyte in the sample.
SFO\PGE_TOPOCK_QAPP_REV02_MAR-31-05.DOC 9-1
9.0 Performance Evaluations
This section specifies the requirements for assessing sample and data collection procedures and for conducting performance evaluations (PEs), which will consist of technical systems audits and performance audits. Technical systems audits include laboratory audits and field audits (project-specific field audit requirements are addressed in project-specific plans). Performance audits consist of laboratory performance evaluations, external laboratory audits, and internal laboratory audits.
9.1 Technical Systems Audits 9.1.1 Laboratory Audits The laboratories participating in the data collection effort will have been pre-qualified by the project management team. A surveillance audit program that requires technical systems audits to be performed on a routine basis will be instituted. Laboratory pre-qualification and the surveillance audits may also be undertaken by the regulatory agencies. Laboratory pre-qualification audits will be performed as either on site audits, desk audits, or a combination of both.
9.1.1.1 On Site Laboratory Pre-qualification Audit An on-site laboratory pre-qualification audit will start with a pre-audit meeting between the auditor and the laboratory staff during which the auditor will discuss the purpose of the audit, the schedule and areas to be audited, and the procedures that will be followed. The pre-audit meeting may include a brief tour of the laboratory. The audit will then be conducted. The auditor will assemble the findings at the conclusion of the audit and will discuss the findings with laboratory staff in a post-audit meeting.
Critical items that will be covered in a technical systems audit of the laboratory include:
• Calibration procedures and documentation • Treatment and handling of standards • Completeness of data forms, notebooks, and other reporting requirements • Data review and verification procedures • Data storage, filing, and recordkeeping procedures • Sample custody procedures • QC procedures, tolerances, and documentation • Operating conditions of facilities and equipment • Documentation of staff training and instrument maintenance activities • Systems and operations overview
A written audit report will then be sent to the laboratory within a specified time. A copy of the audit report will be sent to the project-specific Project Manager. A copy will be retained in the project files.
TOPOCK FIELD PROCEDURES MANUAL APPENDIX D: QAPP, REVISION 02, 3/31/2005 9.0 PERFORMANCE EVALUATIONS
SFO\PGE_TOPOCK_QAPP_REV02_MAR-31-05.DOC 9-2
The need for follow-up action will be determined based on the laboratory’s responses. If an audit identifies an unacceptable condition or unacceptable data, the auditor will be responsible for developing and initiating corrective action. The Project Manager will be notified if the non-conformance impacts the project and requires resources not normally available to the project team. In such cases, the Project Manager will decide whether resources to pursue corrective action will be made available. Disposition may include:
• Reanalysis of samples if holding time has not expired • Resampling and analysis • Amending analytical procedures • Acceptance of suspect data acknowledging the limits on usability
9.1.1.2 Desk Pre-qualification Audit In some cases, a pre-qualification audit will be performed by sending non-critical or split samples to the laboratory to ascertain the laboratory’s ability to generate quality data. In general, this process involves reviewing instrument output, analytical reports, and other documentation specific to a batch of samples. The data will be validated using the Level 4 protocol addressed in Section 8.2 as well as reviewing SOPs, laboratory policies, and the laboratory’s QAM. The corrective actions outlined above in Section 9.1.1.1 to findings from the desk audit may also apply.
9.1.2 Field Audits Field audits will be performed once a year to verify the execution of field procedures. The following will be evaluated during the audit:
• Sample containers and preservatives • Sample collection and identification procedures • Sample custody, handling, and shipping procedures • Equipment decontamination procedures • Calibration of field instruments and performance of field tests • Documentation of field activities, maintenance of field records, and document control
9.2 Performance Audits 9.2.1 Performance Evaluations Laboratories are required to participate in a PE program. Any method or analyte failure in a PE evaluation program that affects the certification status of the laboratory with the National Environmental Laboratory Accreditation Program or the State of California, must be immediately communicated to the Program Chemist.
9.2.2 External Audits Announced and unannounced audits of the field operations and of the laboratories may be conducted during any stage of the project.
TOPOCK FIELD PROCEDURES MANUAL APPENDIX D: QAPP, REVISION 02, 3/31/2005 9.0 PERFORMANCE EVALUATIONS
SFO\PGE_TOPOCK_QAPP_REV02_MAR-31-05.DOC 9-3
9.2.3 Internal Audits Annual audits of the laboratory shall be conducted by the laboratory’s Quality Assurance Officer (QAO). The audits shall verify, at a minimum, that written SOPs are being followed; standards are traceable to certified sources; documentation is complete; data review is being done effectively and is properly documented; and data reporting, including electronic and manual data transfer, is accurate and complete. All audit findings shall be documented in QA reports to management. Necessary corrective actions shall be taken within a reasonable time frame. The QAO shall verify that such actions are effective and complete and shall document their implementation in an audit closeout report to management.

SFO\PGE_TOPOCK_QAPP_REV02_MAR-31-05.DOC 10-1
10.0 Preventive Maintenance
The Program QAPP outlines the requirements for the preventive maintenance program required for the laboratory and field operations. The primary objective of a preventive maintenance program is to promote the timely and effective completion of a measurement effort. The maintenance program should be designed to minimize the downtime of crucial sampling and/or analytical equipment from expected or unexpected component failure. In implementing this program, efforts should be focused in three primary areas:
• Establishment of maintenance responsibilities
• Establishment of maintenance schedules for major and/or critical instrumentation and apparatus
• Establishment of an adequate inventory of critical spare parts and equipment
The primary objective of a preventive maintenance program is to promote the timely and effective completion of a measurement effort. The maintenance program should be designed to minimize the downtime of crucial sampling and/or analytical equipment from expected or unexpected component failure. In implementing this program, efforts should be focused in three primary areas:
• Establishment of maintenance responsibilities
• Establishment of maintenance schedules for major and/or critical instrumentation and apparatus
• Establishment of an adequate inventory of critical spare parts and equipment
10.1 Maintenance Responsibilities Laboratory instrument maintenance is the responsibility of the participating laboratory. Generally, the laboratory manager or supervisor is responsible for the instruments in his or her work area. This responsible person will establish maintenance procedures and schedules for each instrument.
Maintenance responsibilities for field equipment are assigned to the field team leader for specific sampling tasks. However, the field team using the equipment is responsible for checking the status of the equipment prior to use and reporting any problems encountered. The field team is also responsible for ensuring that critical spare parts are included as part of the field equipment checklist. Non-operational field equipment should be removed from service and a replacement obtained. All field instruments will be properly protected against inclement weather conditions during the field investigation.
TOPOCK FIELD PROCEDURES MANUAL APPENDIX D: QAPP, REVISION 02, 3/31/2005 10.0 PREVENTIVE MAINTENANCE
SFO\PGE_TOPOCK_QAPP_REV02_MAR-31-05.DOC) 10-2
10.2 Maintenance Schedules The effectiveness of any maintenance program depends, to a large extent, on adherence to specific maintenance schedules for each piece of equipment. Other maintenance activities are conducted as needed. Manufacturers’ recommendations should provide the primary basis for establishing maintenance schedules. Manufacturers’ service contracts may be used for implementing the scheduled maintenance.
Each analytical instrument should be assigned an instrument logbook. All maintenance activities will be documented in this logbook. The following information is to be entered in the logbook:
• Date of service • Person performing service • Type of service performed and reason for service • Replacement parts installed (if appropriate) • Date of next scheduled service • Any other useful information
10.3 Spare Parts In addition to a schedule for maintenance activities, an adequate inventory of spare parts is required to minimize equipment downtime. The inventory includes those parts and supplies that:
• Are subject to frequent failure • Have limited useful lifetimes • Cannot be obtained in a timely manner should failure occur
Field managers and the respective laboratory managers are responsible for maintaining an adequate inventory of spare parts. In addition to spare parts and supply inventories, an in-house source of backup equipment and instrumentation should be available.

SFO\PGE_TOPOCK_QAPP_REV02_MAR-31-05.DOC 11-1
11.0 Corrective Action
Corrective action may be required as a result of deviations from field or analytical procedures. Deficiencies identified in audits and data quality evaluations may also call for corrective action. All project personnel have the responsibility, as part of the normal work duties, to identify, report, and solicit approval of corrective actions for conditions adverse to data quality.
The QAPP has specified the corrective action to be taken when deviations from calibration and QC acceptance criteria occur. These are listed in Tables 5-12 through 5-19. Field and laboratory staff may encounter conditions that require immediate corrective action that are not addressed in the SAP or QAPP. These personnel will document conditions and the results of corrective actions in a field logbook or laboratory non-conformance report and will communicate their actions as soon as feasible to the field team leader, laboratory supervisor, and if necessary, the Project Chemist for immediate input. A mechanism must be in place to allow for supervisory review and/or client input for all deviations or deficiencies. A corrective action reporting system that requires immediate documentation of deviations or deficiencies and for supervisory review of the actions taken to correct them will be established. At a minimum, the corrective action report should include:
• The type of deviation or deficiency • The date of occurrence • The impact of the deviation or deficiency, such as samples affected • The corrective action taken • Documentation that the process has been returned to control
The only time that a corrective action report may be waived is when a deviation or deficiency is immediately corrected and its impact is precluded. An example would be an unacceptable initial calibration that is repeated before samples are analyzed.
Each corrective action report must be reviewed and approved by a person of authority, such as the field team leader or laboratory supervisor. The ultimate responsibility for the laboratory corrective action process is the laboratory’s Quality Assurance Officer, who must ensure that proper documentation, approval and close-out of all out-of-control or non-conformance events is performed. A non-conformance report will summarize each non-conformance condition. Corrective action reports that could potentially affect data quality must be brought to the attention of the Project Chemist. Report disposition will be the responsibility of the Project Chemist. The Project Manager may be notified about a particular report at the Project Chemist ‘s discretion. Copies of corrective action reports must be maintained in the laboratory or field project files.
SFO\PGE_TOPOCK_QAPP_REV02_MAR-31-05.DOC 12-1
12.0 Quality Assurance Reports
A QA report will be submitted by the Project Chemist to the Project Manager at the end of each sampling interval. The report will summarize the results of the data validation and the data assessment. Any significant quality problems and recommended solutions will be included in the report. Limitations on data usability that were identified during data validation should be highlighted. The results of data assessment should be reconciled with the project objectives.
SFO\PGE_TOPOCK_QAPP_REV02_MAR-31-05.DOC 13-1
13.0 References
CH2M HILL. 2004a. Draft Sampling and Analysis Plan, Groundwater and Surface Water Monitoring, PG&E Topock Compressor Station. June 15.
_________. 2004b. Sampling and Analysis Plan, Groundwater and Surface Water Monitoring, PG&E Topock Compressor Station. July 14.
_________. 2004c. The Draft Work Plan for Assessing Background Metals Concentrations in Groundwater, PG&E Topock Compressor Station and Vicinity, Needles California. June 30.
_________. 2004d. Draft Interim Measures Workplan, PG&E Topock Compressor Station, Needles, California. February.
_________. 2004e. Interim Measures Workplan Number 2, Topock Compressor Station, Needles, California. March.
_________. 2004f. Batch Treatment Work Plan, Topock Compressor Station, Needles, California. April.
_________. 2005. Draft Work Plan for Chromium Sample Filtration Comparison Test, PG&E Topock Groundwater Monitoring Program. February 7.
_________. 2005b. Phase 2 Monitoring Well Installation Work Plan, PG&E Topock Compressor Station, Needles, California. January 31.
U.S. Environmental Protection Agency (EPA). 1995. “Good Laboratory Practices” in Principles and Guidance to Regulations for Ensuring Data Integrity in Automated Laboratory Operations.
_________. 1996. Test Methods for Evaluating Solid Waste, Physical and Chemical Methods, SW-846, 3rd Edition, Update III, Section 1. December.
_________. 2001. Requirements for Quality Assurance Project Plans. EPA QA/R-5. March.
_________. 2002. Contract Laboratory Program National Functional Guidelines for Inorganic Data Review. July.
_________. 1999. Contract Laboratory Program National Functional Guidelines for Organic Data Review. October.


