Sampling Considerations at Mining Sites—expanded version Kathleen S. Smith, U.S. Geological Survey, Denver, CO [email protected]CLU-IN Webinar Series on Hardrock Mining Geochemistry and Hydrology Sampling, Monitoring, and Remediation at Mine Sites Workshop March 5, 2013 U.S. Department of the Interior U.S. Geological Survey
SEG Reviews in Economic Geology (The Environmental Geochemistry of Mineral Deposits)
Sampling is Important!
“Garbage in, garbage out” Sampling
Chemical Analysis
Data Interpretation
Success of a sampling program depends on
Clear definition of sampling objectives
Sample quality
Sample integrity
Sample representativeness
Russell CLU-IN presentation
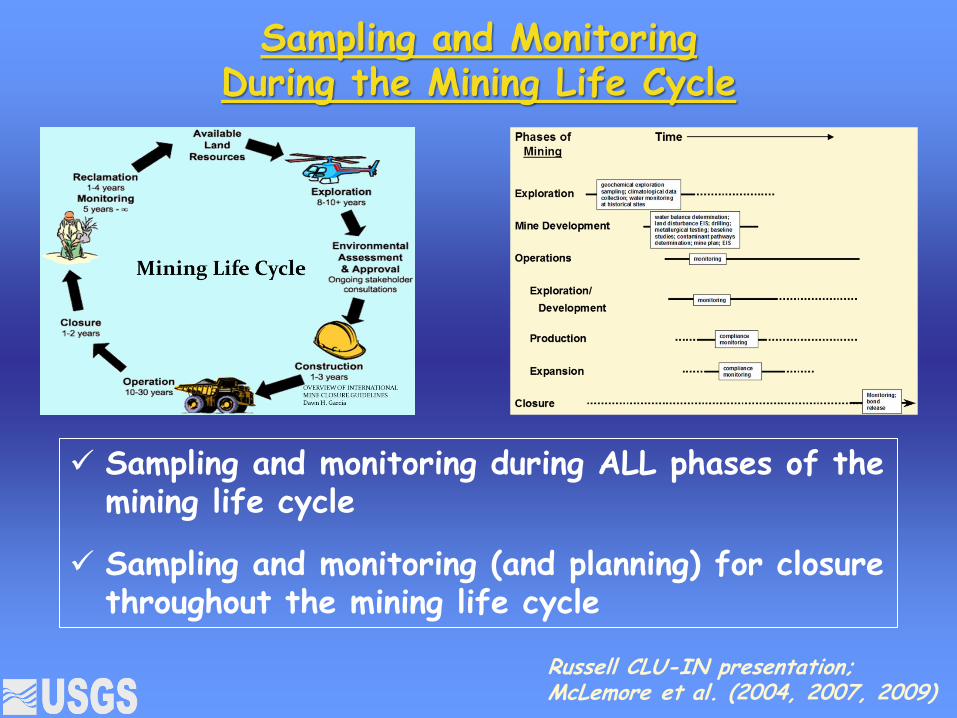
Sampling and Monitoring During the Mining Life Cycle
Sampling and monitoring during ALL phases of the mining life cycle
Sampling and monitoring (and planning) for closure throughout the mining life cycle
Russell CLU-IN presentation; McLemore et al. (2004, 2007, 2009)
Overview of this Presentation
Importance of understanding controlling processes when designing sampling plans
Geological, hydrological, geochemical, and biogeochemical controls on mine-drainage and natural-drainage water
Importance of scale when designing sampling plans
Characterizing source material
Sampling strategy for solids
Surface water sampling concerns
Mining Influenced Water (MIW)
Not limited to low pH
Allows for characteristics other than low pH
Elevated Fe and/or Al concentrations, elevated non-Fe/Al metal concentrations, elevated sulfate concentrations, elevated total suspended solids
Each requires a different approach to sampling, monitoring, and control
Characteristics are a function of geology/mineralogy, hydrology, mining technology used
Schmiermund and Drozd (1997); Plumlee et al. (1999); Maest CLU-IN presentation; Nordstrom CLU-IN presentation; Wireman CLU-IN presentation
Importance of Mineralogy
Role and importance of mineralogy and particle texture often is overlooked
Mineralogical characterization is necessary
mineralogy and texture are key factors that influence generation of acid rock drainage (ARD)
There is an overall lack of mineralogical characterization data and examples of interpretation
Kwong (1993); Jambor and Blowes (1998); Plumlee et al. (1999); Hammarstrom and Smith (2002); Diehl et al. (2006, 2008); Parbhakar et al. (2009); Shaw and Mills (Infomine); Smith et al. (2012, 2013); Yager et al. (2013)
Metal Speciation
Key to understanding metal mobility, bioavailability, and toxicity
Different chemical species of a given metal often have different mobility behavior and toxicological effects
Forms, transformations, and geochemical environment need to be considered when designing sampling plans
Appropriate analytical techniques need to be incorporated into planning
Some Processes and Geochemical Conditions that Can Redistribute Metals
Role of Metal Sorption
Sorption largely controls the fate of many trace elements in natural systems
Sorption of metals onto suspended Fe and Al-rich particulates is a predictable function of the metal itself, metal concentration, pH, amounts/types of suspended particulates, and temperature
Smith (1999); Nordstrom CLU-IN presentation; Butler CLU-IN presentation
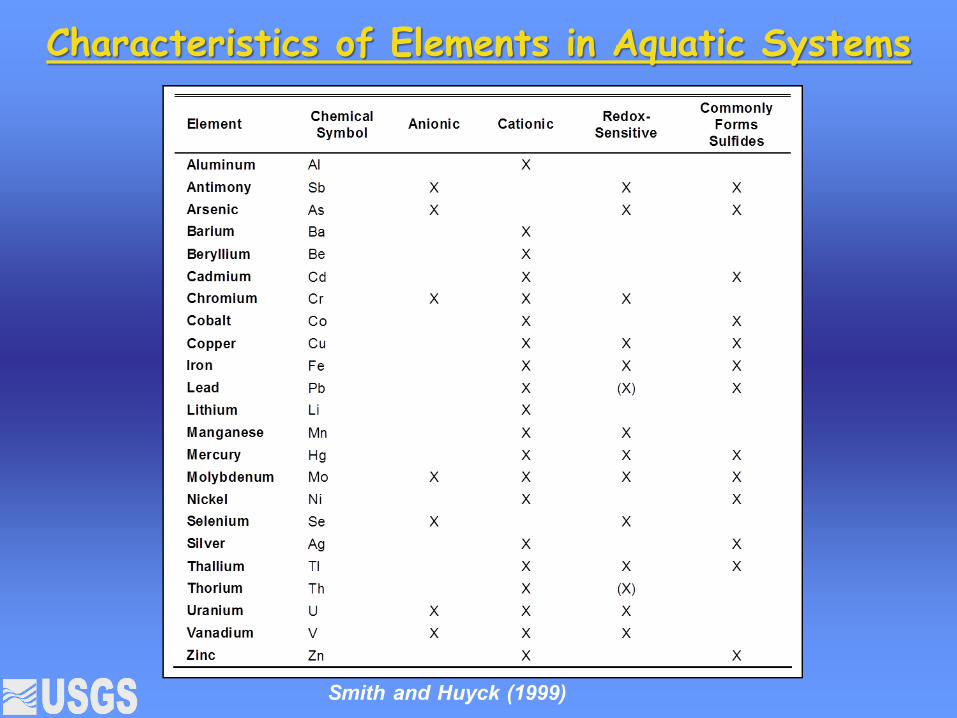
Characteristics of Elements in Aquatic Systems
Relative Mobility of Chemical Elements Under Different Environmental Conditions
from Smith (2007)
Spatial and Temporal Scales
from Smith (2007); Smith et al. (2000); modified from Wanty et al. (2001) and Langmuir and Mahoney (1984)
Differences in spatial scales of some factors that are influenced by geochemical processes
Differences in rates of some types of reactions that influence metal mobility many reactions involving
metals are kinetically controlled or biologically mediated
Define the Target Population
Target population - the set of all units or elements about which a sample is intended to draw conclusions
Must be identified prior to sampling
Defined by objectives of study
Not an easy decision
Need to know which media to sample to adequately determine pathways and receptors
Scale of observation matters
Must be understandable to users
USEPA (2002)
“Representativeness” of Sample
Target population must be available to be sampled such that every portion of the material being sampled has an equal chance of being included in the sample
Randomly collect samples without systematic bias
Use procedures and sampling devices that prevent segregation and minimize sample variation
Determining sample representativeness involves careful planning and formulating a proper sampling design
NOT determined by statistical analysis of the data after the fact
MUST document compromises during sampling
Pitard (1993); Ramsey and Hewitt (2005); USEPA (2002)
Common Sampling Concerns
Sampling error
Precision requirements field sampling methods and equipment sample preparation laboratory subsampling analyses
Sample containers
Sample preservation and storage
Sample holding times
Sampling logistics
Costs (but not at the expense of the integrity of the sampling program…)
Solid, Disaggregated Samples
Sampling Error
Improper collection
target population
sampling location
spatial or temporal changes
sampling media
sampling tools
sample containers
Contamination
Sample preservation and storage
Inadequate sample mass
Fundamental Sampling Error
The source of most sampling errors
Due to the fact that not all particles have the same composition
Cannot be eliminated, but can be estimated
Results in variability and a lack of precision
Particle size, sample mass, and degree of heterogeneity are important factors
See expanded slides in Additional Resources for more information; Pitard (1993); USEPA (2002); Smith et al. (2006)
Fundamental Sampling Error, cont.
Pitard (1993); USEPA (2002); Smith et al. (2006)
Fundamental Sampling Error, cont.
Pitard (1993)
Mineralogical composition factor (c) is the maximum heterogeneity generated by the constituent of
interest in the target population
Related to the density of the material containing the constituent of interest (g/cm3)
Related to the average concentration of the constituent of interest (as a decimal)
Can be estimated by dividing the approximate density of the material by the average concentration of the constituent of interest
Assumes complete liberation of the constituent of interest
Fundamental Sampling Error, cont.
Pitard (1993)
Liberation factor (l) depends upon whether the constituent of interest is present as separate particles or contained within larger particles
Fundamental Sampling Error, cont.
Pitard (1993)
Liberation factor (l) is a correction factor for
the mineralogical composition factor (c)
Dimensionless parameter
Never greater than 1
for no liberation, l = 0
for complete liberation, l = 1
for very heterogeneous material, l ~ 0.8
for heterogeneous material, l ~ 0.4
for average material, l ~ 0.2
for homogeneous material, l ~ 0.1
for very homogeneous material, l ~ 0.05
Fundamental Sampling Error, cont.
Pitard (1993)
Shape factor (f ) relates to the typical shape of particles in the target population
Dimensionless parameter
Determined by microscopic examination
for cubes, f = 1
for spheres, f ~ 0.5 (usual default value)
for flakes (e.g., mica), f ~ 0.1-0.2
for elongated particles (e.g., asbestiform), f > 1
(can be as large as 10)
Fundamental Sampling Error, cont.
Pitard (1993)
Granulometric factor (g) accounts for the different sizes of particles in the target population
Dimensionless parameter
Decreases with presence of fine particles
Never greater than 1
for same-size particles, g = 1
for noncalibrated material (e.g., jaw crusher), g ~ 0.25
for calibrated material, 0.5 < g < 1
for sieved material (e.g., bracketed consecutive sieve
sizes in a series), g ~ 0.55
for naturally calibrated material (e.g., rice), g ~ 0.75
Fundamental Sampling Error, cont.
Pitard (1993)
Maximum particle size (d)
Opening size of the square mesh retaining
no more than 5% oversize material
In units of centimeters
How to Determine Sample Mass
Calculate sample mass by defining values for parameters
Pitard (1993)
Grouping and Segregation Error
Due to the fact that not all particles are randomly distributed
size, shape, concentration
temporal differences
segregation
Can be reduced
random sampling
collection of multiple increments
Incremental Sampling – see next presentation by Crumbling
See expanded slides in Additional Resources for more information; Pitard (1993); USEPA (2002); Smith et al. (2006); CLU-IN ITRC Soil Sampling and Decision Making Using Incremental Sampling Methodology
Need to Collect more Sample Mass when
How Many Samples?
There is no “cookbook” approach
Consider an iterative approach
Need to take into account
Heterogeneity
o distributional
o compositional
o morphological
Degree of accuracy
Variability of constituents
Composite?
Pitard (1993); Runnells et al. (1997); USEPA (2002); Price (2009)
Pitard “rule of thumb” that a sample should be made up of at least 30 increments
How Many Samples?
Price (2009; p. Ch8-8): “The recommendation here and previously is that the final sampling frequency be determined site specifically based on the variability of critical parameters, prediction objectives and required accuracy.”
Runnells et al. (1997): “Briefly, the method is based on the use of a statistical approach to determine, illustrate, and defend the adequacy of the sampling. [We do] not believe that there is a “correct” number of samples for characterizing a facility. That is, there is no general rule that can (or should) be followed, such as a given number of samples per ton of tailings, per acre of impoundment, or per foot of drillcore. Each facility is different, and the adequacy of sampling must be tailored to the facility.”
Pitard (1993; p. 187): “As a rule of thumb based on numerous experiments, a sample should be made up of at least 30 increments.”
USEPA (2002): Guidance on Choosing a Sampling Design for Environmental Data Collection
Sampling Mine Piles
Morphological (size and shape)
Compositional
Distributional
Heterogeneity
USGS Sampling Strategy for Screening Mine Piles
Needs
Screening and prioritizing mine piles
Statistically based
Field friendly
Cost effective
Question Addressed
What are the potential metal contributions from mine piles at various mine sites?
o average properties = composite samples
Sampling Concerns
Heterogeneity
o compositional, spatial, particle size
Sampling errors
Smith et al. (2000, 2002, 2003, 2006, 2007)
Sampling Strategy for Screening Mine Piles, cont.
Target Population
Based on question to be addressed
Mine-waste pile
Surficial material (upper 15 cm)
<2 mm fraction (dry sieved)
General Sampling Plan
Obtain a composite sample of the target population
Subject sample to leaching procedures to evaluate potential metal release to adjacent stream and shallow groundwater
Smith et al. (2000, 2002, 2003, 2006, 2007)
Sampling Strategy for Screening Mine Piles, cont.
Minimize Grouping and Segregation Error:
Divide mine-waste dump into at least 30 cells of roughly equal surface area and randomly collect a surficial sample from each cell
Examine Average Properties and Minimize Cost:
Combine cell samples into a mine-dump composite sample
Define Fundamental Error:
Dry sieve the mine-dump composite sample to <2 mm (final composite sample should weigh at least 1,000 g (1 kg) after sieving)
Pitard (1993); Smith et al. (2000, 2002, 2003, 2006, 2007)
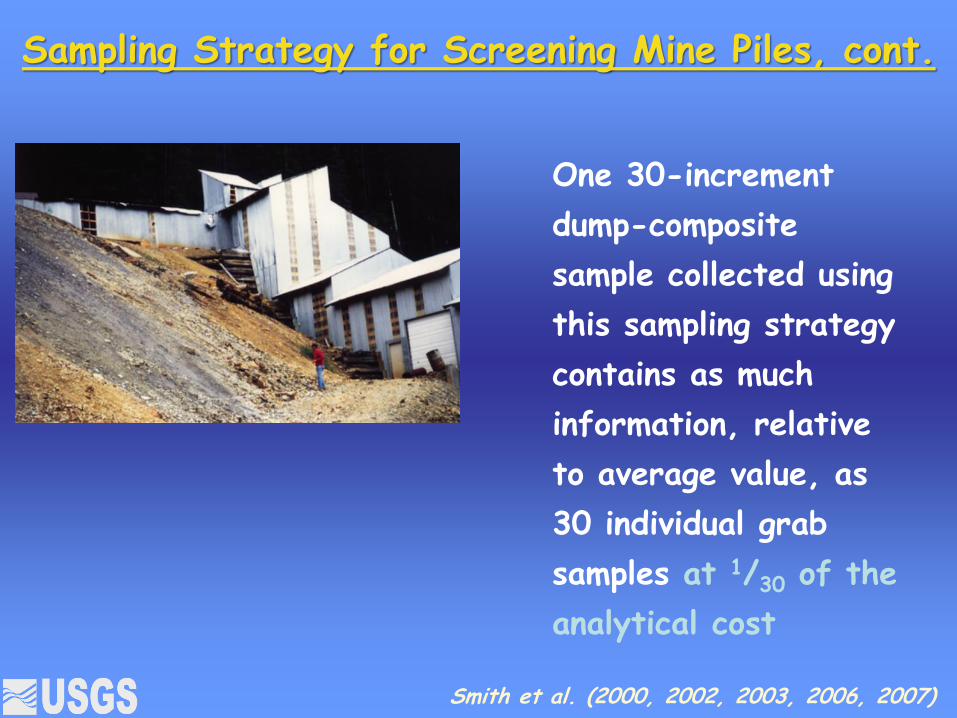
Sampling Strategy for Screening Mine Piles, cont.
One 30-increment
dump-composite
sample collected using
this sampling strategy
contains as much
information, relative
to average value, as
30 individual grab
samples at 1/30 of the
analytical cost
Smith et al. (2000, 2002, 2003, 2006, 2007)
Sampling Strategy for Screening Mine Piles, cont.
This sampling strategy could be adapted to the sampling of other target populations, such as
individual waste-dump lobes
pit bench
dump lift
geologic unit
other "operational" units
soils
vegetation
flood sediment from Hurricane Katrina
Russell CLU-IN presentation
Total Concentration vs Geoavailability
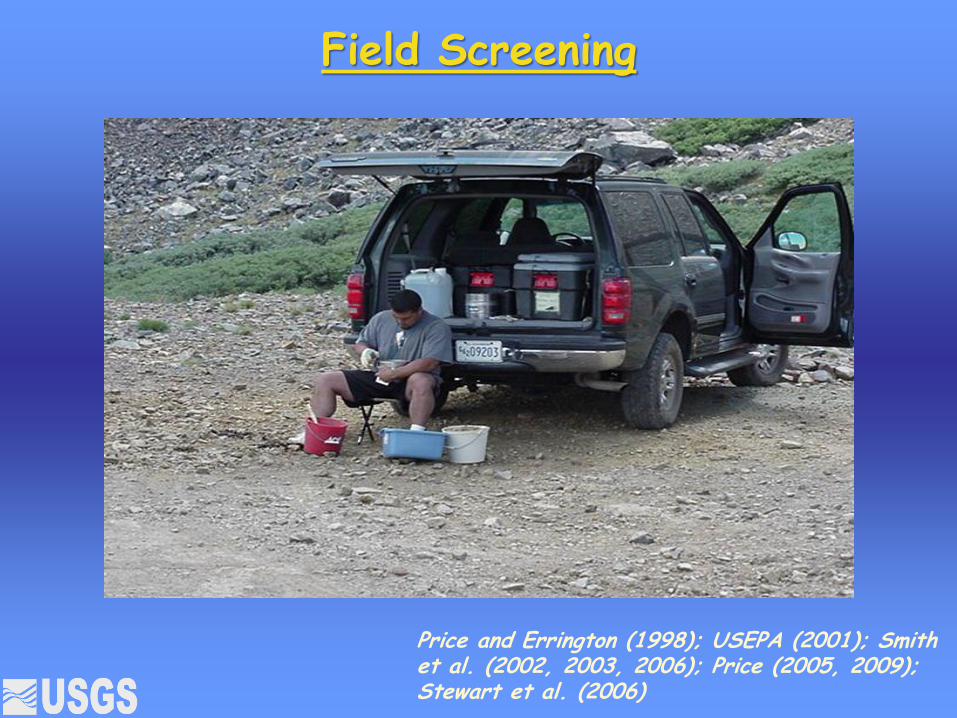
Field Screening
Price and Errington (1998); USEPA (2001); Smith et al. (2002, 2003, 2006); Price (2005, 2009); Stewart et al. (2006)
USGS Field Leach Test (FLT)
Extraction ratio 20:1 (same as USEPA methods 1311 and 1312)
most readily soluble constituents in the sample can be dissolved without exceeding saturation limits
provides sufficient sample to obtain desired measurements and elemental analyses
Add 1.0 L deionized water to 50.0 g of a <2 mm (-10 mesh) sample
Hand shake for 5 min, allow to settle for 10 min
Determine pH and specific conductance on the leachate
Filter leachate through a 0.45-µm syringe filter and preserve for analyses
Hageman and Briggs (2000); Smith et al. (2000); Al-Abed et al. (2006); Hageman (2007); Smith et al. (2007)
Field Leach Test, cont.
When used in conjunction with the sampling technique described earlier, it can be performed onsite with only sub-samples of preserved leachate returned to the lab for analyses
Has been used extensively for characterization of historical mine-waste piles throughout the continental United States and Alaska
Has also been used to leach a broad spectrum of other matrices
naturally mineralized soils, agricultural soils, mine-waste pile drill core intervals, mining influenced wetland sediments, World Trade Center dusts, volcanic dusts, atmospheric dusts, and forest fire burned soils
Hageman and Briggs (2000); Smith et al. (2000); Al-Abed et al. (2006); Hageman (2007); Smith et al. (2007)
Mining Waste Decision Tree
Both Criteria are Important Chemical rates availability of contaminants Physical rates ability to deliver contaminants
A simple screening procedure to determine potential toxicity to the aquatic environment
Sampling for Prediction Studies
Determine degree of variability
Different rock types, alteration
Mineralogical and microscopic examination
degree of liberation
solubility controls
grain size and texture
Need complete geochemical characterization
“Representative” samples
Maest CLU-IN presentation; Maest and Kuipers (2005)
Surface Water Sampling Considerations
Challenges in Collecting Surface-Water Samples at Mining Sites
Aqueous metal concentrations are highly variable in space in mineralized and mined areas
Location in catchment
Underlying lithology
Weathering of ore deposits or wastes
Climate
Geochemical processes
Aqueous metal concentrations are highly variable in time in mineralized and mined areas
Seasonal
Streamflow (storms)
Daily
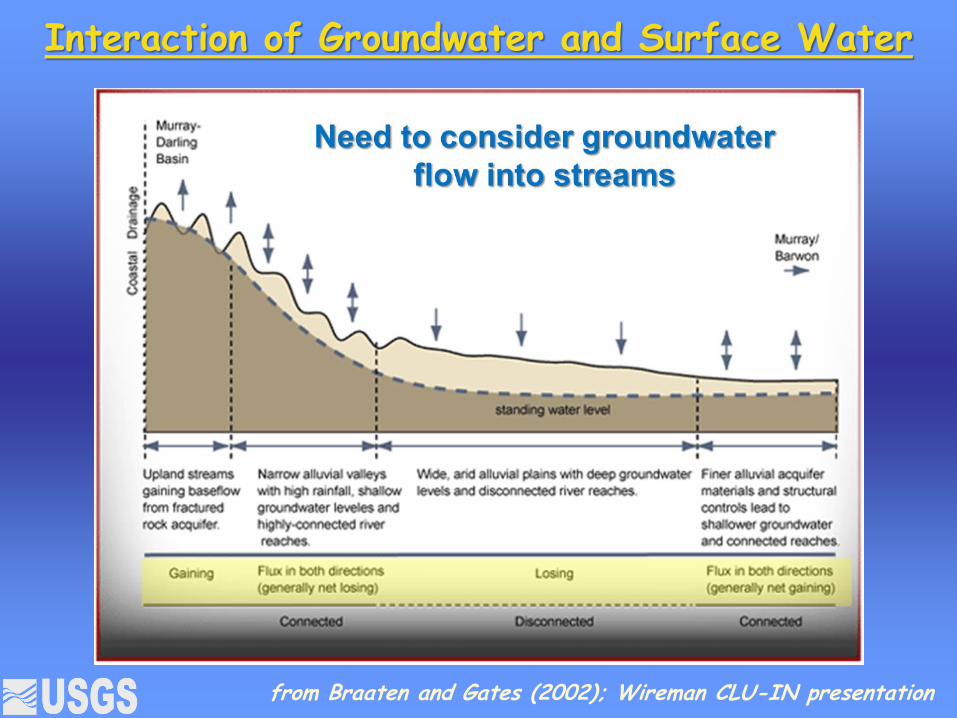
Interaction of Groundwater and Surface Water
from Braaten and Gates (2002); Wireman CLU-IN presentation
Hyporheic Flow
Winter et al. (1998); Bencala (2005)
Interactions at the surface-water/groundwater interface can play an important role in the concentration and load of constituents and can have significant environmental influences on biogeochemical processes (Bencala, 2005)
The hyporheic zone is a region beneath and lateral to a stream bed where there is mixing of shallow groundwater and surface water
Flow in
hyporheic
zone
Flow in
hyporheic
zone
What is a Diel Cycle?
Diel – involving a 24-hour period that usually involves the day and adjoining night
Processes:
Stream flow (evapotranspiration causes up to 20% change; snowmelt pulses)
Water temperature (influences rates of reactions; mineral and gas solubility)
Photosynthesis
Photochemical reactions
Diel Processes in Neutral and Alkaline Streams
Nimick et al. (2003)
Note: (1) the large fluctuation in metal concentrations during each 24-hour cycle (shaded=nighttime); (2) arsenic is in opposite phase with cations; (3) applies to near-neutral to alkaline streams (not so critical at lower pH)
Time of Sampling is Important
Nimick et al. (2011)
What is realistic?
Be aware of diel cycles
If a site is repeatedly sampled, it should be sampled at the same time of day each time it is visited
Record the time of day a sample is collected
Short-Term Variability
Different findings when sampled moving upstream vs moving downstream during the day
(moving downstream)
(moving upstream)
Gammons et al. (2007)
Short-Term Variability, cont.
Gammons et al. (2007)
The previous slide shows data from a one-day study in a mining
influenced stream where one sampler consecutively collected
samples going upstream, and another sampler consecutively
collected samples going downstream. The sampler who moved
downstream concluded that the zinc load steadily decreased
downstream, and the sampler moving upstream concluded that
the zinc load increased downstream (and that zinc sources
existed along the stream). In reality, the average zinc load
over the 24-hour period was relatively constant and the
differences observed by the samplers were due to diel (24-hour
cycle) variations (Gammons et al., 2007).
Magnitude of Diel Cycles for Dissolved Trace Elements
1. Near-neutral to alkaline streams unless otherwise noted
2. See Nimick et al. (2011) for references
For diel behavior in acidic- to neutral-pH streams, see Gammons et al. (2005) and Nimick et al. (2011)
Temporal Sampling Scales
Note that short-term variations are similar in magnitude to longer timescales
Monthly dominated by snowmelt and precipitation dynamics
Daily dominated by episodic events
Bi-hourly is diel changes
Nagorski et al. (2003)
Bi-hourly Monthly Daily Bi-hourly Monthly Daily
Bi-hourly Monthly Daily Bi-hourly Monthly Daily
Bi-hourly Monthly Daily Bi-hourly Monthly Daily
Geochemical Modeling Needs
Necessary to have complete dissolved water analyses Including major, minor, and trace elements (both anions and
cations), pH, temperature
Iron speciation (and other elements of concern)?
Additional important determinations Specific conductance, alkalinity, TDS, and redox conditions
Suspended sediment?
Consider definition of “dissolved”
Focusing sampling activities solely on regulated constituents often results in incomplete or incorrect characterization, which could lead to potentially costly problems later Limits utility of data
Unanticipated issues may be discovered later
Nordstrom CLU-IN presentation; Nordstrom (2004)
Toxicological Modeling Needs
Biotic Ligand Model (BLM)
Incorporated into USEPA updated aquatic life criteria for copper
Computational approach
Required input includes temperature, pH, dissolved organic carbon (DOC), percent DOC as humic acid, alkalinity, and dissolved concentrations for calcium, magnesium, sodium, potassium, sulfate, and chloride
USEPA (2007); Smith et al. (2009)
MiniSipper (segmented water sampler)
Chapin and Todd (2012)
High resolution in situ remote sampling 250 5-mL discrete or
integrated samples
12-month long deployments
Event triggers can change sampling
Bubble separation
10 µm filtration
Inline acidification
Concentration vs Load (Depends on the question…)
Concentration Regulatory criteria based on concentrations Toxicological data relate to concentrations
Load at Catchment Outlet Product of concentration and stream discharge TMDL (Total Maximum Daily Load; load capacity of the
receiving water) Fixed point monitoring Temporal trends Not adequate to identify sources
Mass-loading Approach Combines tracer-injection and synoptic-sampling methods
Provides spatial detail Can determine metal attenuation Can identify and compare sources within catchment Includes groundwater and hyporheic flow
Kimball et al. (2002, 2007); Walton-Day et al. (2012)
Tracer Injections
Determine how much metal enters a stream
mass loading (concentration x discharge)
Determine how much metal stays in a stream
Provide accurate discharge measurements
difficult to obtain in mountain streams
Differentiate between multiple sources
Monitor effectiveness of remediation efforts
Usually combined with instantaneous sampling
Collection of samples from many locations during a short period of time, typically within about 20 min, during minimum period on cation diel curves
Kimball (1997)
Surface Water Sampling Suggestions
Use experienced personnel to collect water samples
Be consistent in sampling procedures, locations, and time of day
Conduct stream-water discharge measurements
Ensure that stream water is well mixed at sampling locations
Account for natural variability by nesting short-term studies within long-term studies
Encompass variable climatic and hydrologic conditions
Short-term (daily) variations can be similar in magnitude to seasonal variations
Sample over the entire hydrograph
Smith (2011)
Surface Water Sampling Suggestions, cont.
For comparison between sites, collect samples simultaneously under similar hydrologic and diel cycle conditions
Sample high-flow and transient hydrologic events
Obtain an estimate of flushing of constituents from soils, mining wastes, hyporheic zones, etc. in a catchment
Need adequate water-quality information
Complete dissolved chemical analyses, including major, minor, and trace cations and anions, and dissolved organic carbon
Communicate with the laboratory to ensure that adequate sample volumes are collected and proper sample preservation is used
Smith (2011)
Surface Water Sampling Strategies (from Gammons and Nimick, 2010)
Chronic standards
Sample at equal time intervals to obtain a 4-day mean
Acute standards
Pick sample time to coincide with the daily maximum
Temporal or spatial analysis
Always sample at same time or collect 24-hour samples
Comparison of loads (temporally or spatially)
Collect samples and measure flows over at least 24 hours
Acknowledgements
Funding through the U.S. Geological Survey
Mineral Resources Program and the
Toxic Substances Hydrology Program
Any use of trade, product, or firm names in this presentation is for descriptive purposes only and does not imply