Landscape genomics Physalia courses , November 6-10, 2017, Berlin Sampling design Dr Stéphane Joost – Oliver Selmoni (Msc) Laboratory of Geographic Information Systems (LASIG) Ecole Polytechnique Fédérale de Lausanne (EPFL), Switzerland
Transcript
Landscape genomicsPhysalia courses , November 6-10, 2017, Berlin
Sampling design
Dr Stéphane Joost – Oliver Selmoni (Msc)
Laboratory of Geographic Information Systems (LASIG)
Ecole Polytechnique Fédérale de Lausanne (EPFL), Switzerland
Introduction
• Landscape genomics studies require a carefully designed strategy for data collection
• Spatial data possess two equally important features: the attributes (e.g. frequency of a given molecular marker) and the location (position in space: longitude and latitude)
• These two sets of information are tightly linked and both need to be recorded during the sampling phase (GPS)
• For a proper linkage of data, the methods, objectives, and the quality control of the collected information must be accurately documented, stored and made available for future needs
• To obtain a reliable spatial modeling, representative of a real phenomenon, a so-called statistical sampling has to be carried out
• The choice of the sampling strategy determines the confidence and power of the results of the subsequent analyses
Joost, S., Colli, L., Baret, P. V., Garcia, J. F., Boettcher, P. J., Tixier-Boichard, M., & Ajmone-Marsan, P. (2010). Integratinggeo-referenced multiscale and multidisciplinary data for the management of biodiversity in livestock genetic resources. Animal Genetics, 41, 47–63.
Sampling units
• Sampling units should be selected to represent the variability of the underlying population
• The physical size and geographical position of these sampling units play a major role in determining the performance of spatial modeling procedures
• They strongly affect the results • The basic sampling unit is the individual• Aggregation can be carried out subsequently (Pool-Seq only
on broad scales)• A statistically representative sampling of these individuals
should be designed considering – the environmental context – the ecological and behavioral characteristics of the species
Introduction aux systèmes d’information géographique
Types d’échantillonnage
Aléatoire Régulier
Transects
Grille
Réseau ou lignes de structure
Systématique: un schéma de prélèvement est établipréalablement
Introduction aux systèmes d’information géographique
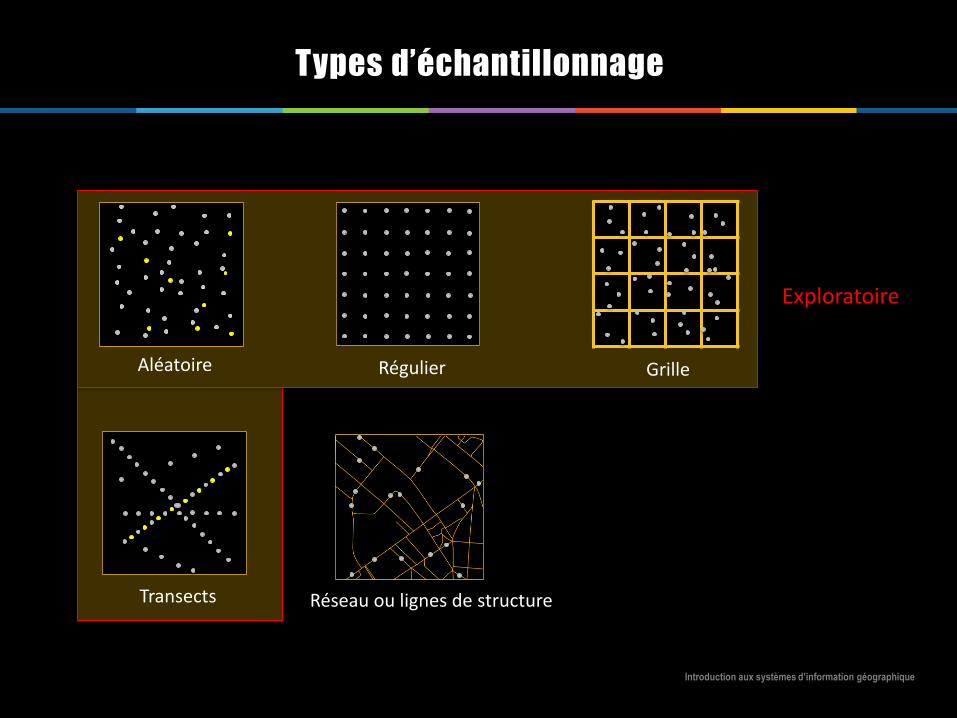
Types d’échantillonnage
Aléatoire Régulier
Transects
Grille
Exploratoire
Réseau ou lignes de structure
Introduction aux systèmes d’information géographique
Types d’échantillonnage
Aléatoire Régulier
Transects
Grille
Connaissance a priori du phénomène
Réseau ou lignes de structure
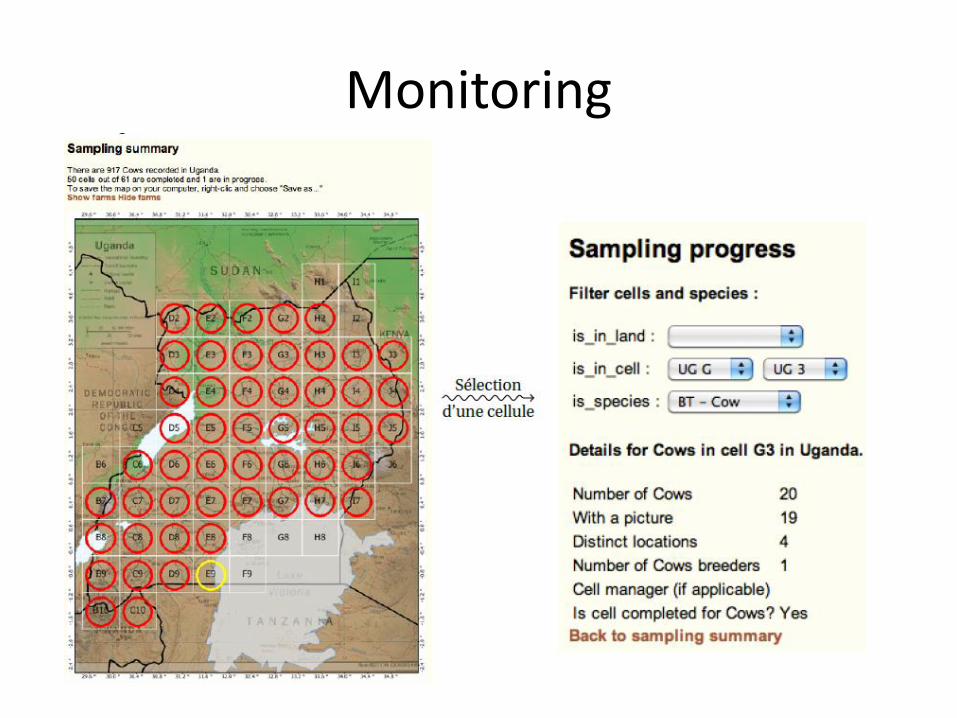
Regular grid
• A good strategy is to sample on the basis of a regular grid of cells with a given spatial resolution
• The extent of the area to survey depends on the species studied • The ranging behavior depends on animal’s size and motility (e.g.
cattle vs. chicken) – or dispersal with plants• The size of the basic cell of the regular grid will depend on
– the species (ranging behaviour, motility) – the geo-environmental representativeness + data availability
• Such a grid will assure a homogeneous spatial distribution • Facilitates the general planning (visualization) of the sampling• Helps to determine a significant number of individuals to be
• Manel et al. (2007) proposed a dynamic alternative to a fixed grid
• Their method does not group individuals a priori into perceived populations
• Adopts a spatial approach based on moving windows placed across points of a grid map to identify population boundaries
A priori knowledge required
• The sampling strategy adopted when analyzing the spatial distribution of genetic variability should return a set of statistically significant data for both genetic and geographic inferences
• Achieving this objective requires a priori knowledge of the molecular markers that are going to be applied– Their inheritance systems– the mechanisms underlying their evolution in time– their diffusion within and between populations
• They provide details about the influence of different sampling schemes on the possible outcomes of landscape genomics analyses
• The environmental parameters typically considered in landscape genomics are meaningful as independent data points
• Genetic information differs from such variables because it is most often represented by multi-locus genotypes, which are meaningful only when compared to other individuals or populations
Reduced sampling area
• Statistical sampling is a key component of a sound and scientifically defensible study
• If adequate sampling cannot be obtained from the entire study region (high cost), then a reduction in size of the sampling area has to be considered
• Having a set of single observations scattered throughout a large area, but without reaching the threshold of statistical significance in any single location = producing a poor spatial model
• Worse strategy than concentrating the samples in a smaller area but with a greater, statistically meaningful density of sampling points
• Then extending the inferred spatial model to the surrounding, non-sampled areas
Balance
• Sampling and corresponding data collection can be difficult and expensive. • An optimal strategy is to find an adequate balance between the statistical
significance of the samples and practical aspects in terms of sampling effort.
• This requires a step of a priori evaluation, during which at least three different elements need to be taken into account:
I. what is the goal that should be achievedII. what information is already available regarding the study areaIII. what is the amount of resources available to carry out the sampling
• De Gruijter & Ter Braak (1990) defined and discussed two different methods for data collection:
I. model-based sampling II. design-based sampling
• In the former case, every point in an area can be sampled with the same probability, while in the latter case the objective defines and determines the best sampling scheme
Statistical power
• Statistical power is the likelihood that a study will detect an effect when there is an effect there to be detected
• If statistical power is high, the probability of making a Type II error (false negative) - concluding there is no effect when there is one - goes down.
• Statistical power is affected chiefly by the size of the effect and the size of the sample used to detect it.
• Bigger effects are easier to detect than smaller effects, while large samples offer greater test sensitivity than small samples
Probability to detect an effect
• The power of any test of statistical significance will be affected by four main parameters:– the effect size (the probability we have to detect an
effect)– the sample size (N)– the alpha significance criterion (α)– statistical power = the chosen or implied beta (β)
(probability of making a Type II error )
• All four parameters are mathematically related. If you know any three of them you can figure out the fourth