Sampling for Lead in Drinking Water: Approaches and Applications Casey Formal ORAU Darren A. Lytle US EPA Water Supply and Water Resources Division National Risk Management Research Laboratory Office of Research and Development
Transcript
Sampling for Lead in Drinking Water: Approaches and Applications
Casey FormalORAU
Darren A. LytleUS EPA
Water Supply and Water Resources DivisionNational Risk Management Research Laboratory
Office of Research and Development
Lead Sampling of Drinking Water
Regulatory/compliance/treatment sampling Exposure assessment sampling Lead levels are difficult to predict because of
variability within premise plumbing There is no universally applicable sampling
approach for lead in drinking water Different sampling approaches answer
different questions about lead levels
Lead Sampling ConsiderationsSampling Considerations: Volume Number of samples Site choice Stagnation time Sampling frequency
Variables: Flow rate Temperature Particulate release Aerator removal
Lead Sample Types
Purpose ProtocolFirst Draw* -Regulatory (US)
-Treatment assessment
-6+ hour stagnation (16-18h in this study)-Collect first liter
Random Daytime* (RDT)
-Regulatory (UK)-Treatment assessment
-Random samplecollection (variable stagnation times)-Collect first liter
Composite Proportional
-Exposure assessment -Device required-Percentage of every draw from a tap for consumption is collected
Manual Composite*
-Exposure assessment -A fixed amount (60 mL) of water is collected every time tap is used for consumption
Lead Sample Types
Purpose Protocol
Lead Service Line* (LSL) -Lead release from service line
-16-18h stagnation-Sample collected directly from service line
Stagnation Profile*
-Observe rate of lead release from service line-Find equilibrium point
-Multiple stagnation times (15 min-18h)-Collected directly from LSL
Sequential Profile Sampling*
-Lead source assessment
-Defined stagnation time-Collect 10-20 samples of defined volume (125mL, 250mL, 1L etc.)
Lead Sample Types
Purpose Protocol
Fixed Stagnation Time (30MS)
- Regulatory (Ontario)- Treatment assessment
- 2-5 min flush- 30 min stagnation- Collect first two liters
Service Line Sampling (Second Draw)
- Regulatory (US)- Lead source assessment
-6+ hr stagnation-Flush volume between tap and LSL-Collect 1L
Particle Stimulation Sampling - Lead type assessment
- Exposure assessment
-5 min stagnation- Collect first liter and max flow rate, open and close tap 5 times, fill rest of bottle at normal flow rate- Collect third liter the same way as the first
Comparison of Different Sampling Results
Cumulative Volume (L)
0 2 4 6 8 10 12 14 16
Lea
d (µ
g/L
)
0
10
20
30
40
June 2016September 2016June 2017
Home Plumbing System Simulator
Flow Meter
Building Cold Water Supply
Lead
Ser
vice
Lin
e
Faucet 4 Faucet 3
Toilet
Faucet 2
Shower
Faucet 1Aci
d Fe
ed
Hot Water Heater: 48.9° C
401” 358” 635” 584”472”519” 612”644” 652”726”
Lead Soldered Joint80
”
*Not to scale
214”
RecirculationPump
Brass Check ValveBrass Ball Valve
Cold Water Line (½ inch Cu, Type M)Hot Water Line (½ inch Cu, Type M)
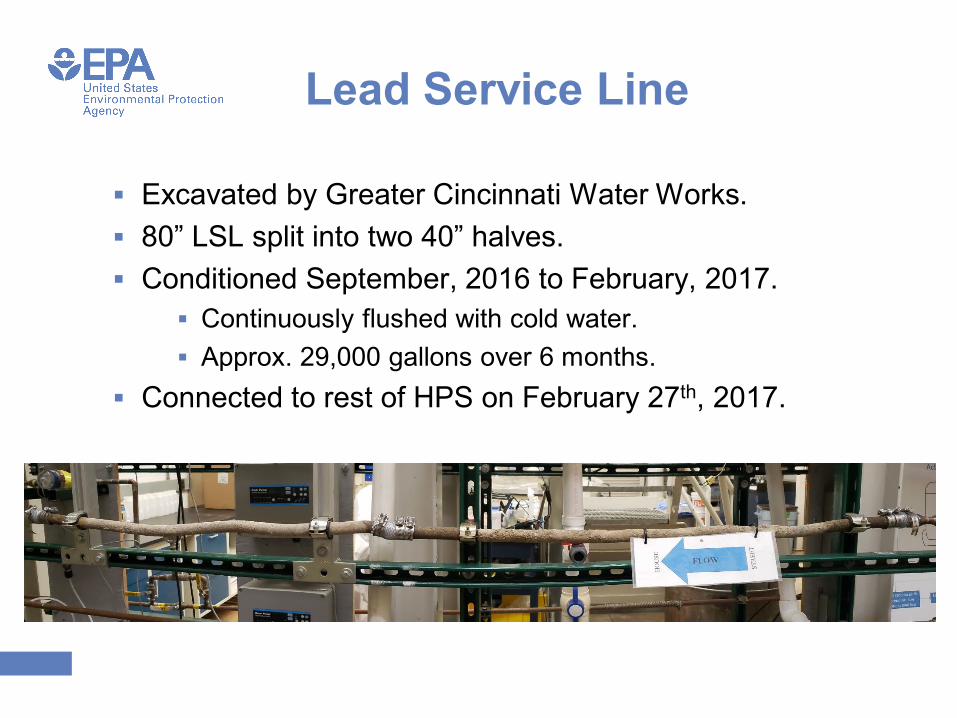
Lead Service Line
Excavated by Greater Cincinnati Water Works. 80” LSL split into two 40” halves. Conditioned September, 2016 to February, 2017.
Continuously flushed with cold water. Approx. 29,000 gallons over 6 months.
Connected to rest of HPS on February 27th, 2017.
Objectives
Compare the lead levels of samples collected with different approaches.
Use a home plumbing system simulator (HPS) with known lead components and water use to perform sampling comparisons.
Evaluate impacts of water usage on lead release from lead-tin solder, brass, and a lead service line.
Water Usage Patterns
“Normal Use” ≈ 120 gpdSimulated
ActivityHPS
LocationDaily Count
Volume of Water Used per Activity, mL
DurationHot, cold, or
mixComposite
Sample?
Glass of Water Faucet 3 4-6 4-6 200-400 mL NA cold Yes
Cooking Water Faucet 3 1-2 1-2 250-1500 mL NA variable Yes
Kitchen Tap Faucet 3 1-3 1-3 250 mL-35 L median 1L 5 s-10 min, median 20 s variable No
Bathroom Tap Faucet 2 2-6 2-6 250 mL-18 L median 1L 5 s-5 min, median 20 s variable No
2nd Bathroom Tap
Faucet 4 2-5 2-5 250 mL-18 L median 1 L 5 s-5 min, median 20 s variable No
Shower Shower 1-2 1-2 NA 6-10 min mix No
Toilet Toilet 3-6 3-6 5299.574 NA cold No
Washing Machine
Faucet 13-7 per
week136080 Exactly 28 min
cold tap fully open, hot open to marking
No
Dishwasher Faucet 11-3 per
week18927.05 Exactly 1 h
hot tap open to marking,
cold tap closed
No
10a-4p8a-10a
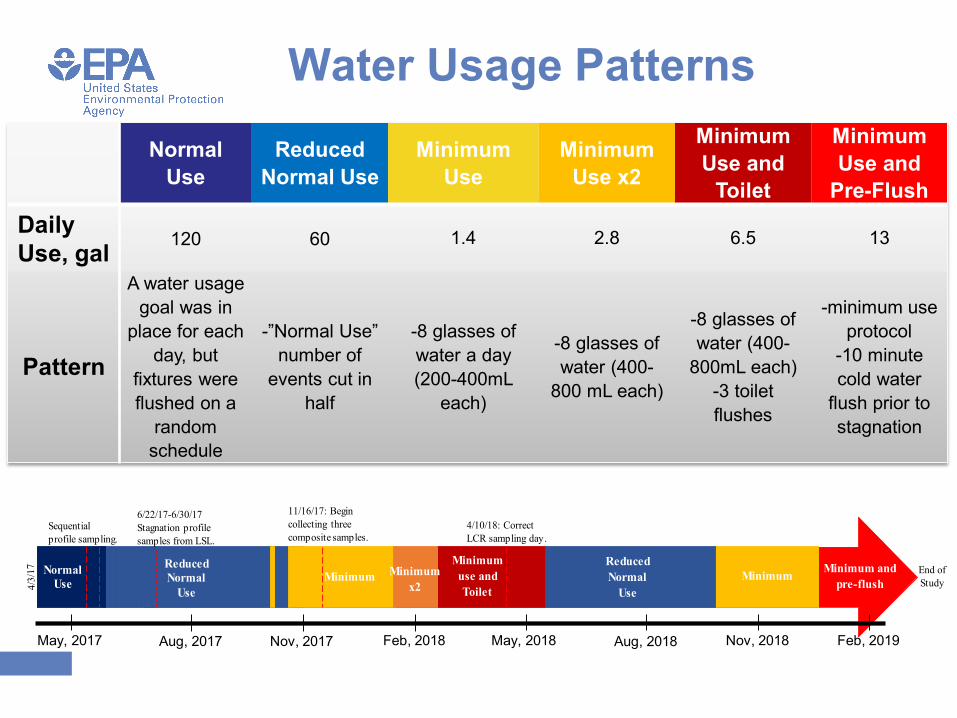
Water Usage PatternsNormal
UseReduced
Normal UseMinimum
UseMinimum
Use x2
Minimum Use and
Toilet
Minimum Use and
Pre-FlushDaily Use, gal 120 60 1.4 2.8 6.5 13
Pattern
A water usage goal was in
place for each day, but
fixtures were flushed on a
random schedule
-”Normal Use” number of
events cut in half
-8 glasses of water a day (200-400mL
each)
-8 glasses of water (400-
800 mL each)
-8 glasses of water (400-
800mL each)-3 toilet flushes
-minimum use protocol
-10 minute cold water
flush prior to stagnation
11/16/17: Begin collecting three composite samples.
Normal Use
Reduced Normal
Use
4/10/18: Correct LCR sampling day.
Minimum Minimum x2
Minimum use and Toilet
Minimum and pre-flush
Sequential profile sampling.
MinimumReduced Normal
Use
6/22/17-6/30/17 Stagnation profile samples from LSL.
End of Study
May, 2017 Aug, 2017 Nov, 2017 Feb, 2018 May, 2018 Aug, 2018 Nov, 2018 Feb, 2019